Article

Prediction of Early Childhood Caries Based on Single Nucleotide Polymorphisms Using Neural Networks

by
Katarzyna Zaorska
1,*,
Tomasz Szczapa
2,
Maria Borysewicz-Lewicka
3,
Michał Nowicki
1 and
Karolina Gerreth
3
1
Department of Histology and Embryology, Poznan University of Medical Sciences, 6 Swiecickiego Street, 60-781 Poznan, Poland
2
Department of Neonatology, Biophysical Monitoring and Cardiopulmonary Therapies Research Unit, Poznan University of Medical Sciences, 33 Polna Street, 60-535 Poznan, Poland
3
Department of Risk Group Dentistry, Chair of Pediatric Dentistry, Poznan University of Medical Sciences, 70 Bukowska Street, 60-812 Poznan, Poland
*
Author to whom correspondence should be addressed.
Submission received: 5 February 2021 / Revised: 11 March 2021 / Accepted: 21 March 2021 / Published: 24 March 2021
(This article belongs to the Special Issue Molecular Risk Factors of Complex Diseases)

Abstract

:
Background: Several genes and single nucleotide polymorphisms (SNPs) have been associated with early childhood caries. However, they are highly age- and population-dependent and the majority of existing caries prediction models are based on environmental and behavioral factors only and are scarce in infants. Methods: We examined 6 novel and previously analyzed 22 SNPs in the cohort of 95 Polish children (48 caries, 47 caries-free) aged 2–3 years. All polymorphisms were genotyped from DNA extracted from oral epithelium samples. We used Fisher’s exact test, receiver operator characteristic (ROC) curve and uni-/multi-variable logistic regression to test the association of SNPs with the disease, followed by the neural network (NN) analysis. Results: The logistic regression (LogReg) model showed 90% sensitivity and 96% specificity, overall accuracy of 93% (p < 0.0001), and the area under the curve (AUC) was 0.970 (95% CI: 0.912–0.994; p < 0.0001). We found 90.9–98.4% and 73.6–87.2% prediction accuracy in the test and validation predictions, respectively. The strongest predictors were: AMELX_rs17878486 and TUFT1_rs2337360 (in both LogReg and NN), MMP16_rs1042937 (in NN) and ENAM_rs12640848 (in LogReg). Conclusions: Neural network prediction model might be a substantial tool for screening/early preventive treatment of patients at high risk of caries development in the early childhood. The knowledge of potential risk status could allow early targeted training in oral hygiene and modifications of eating habits.

1. Introduction

Dental caries is a chronic, multifactorial and dynamic disease that affects up to 83% of the global population, irrespective of the age. Early childhood caries (ECC) is defined as the presence of one or more decayed, missing or filled primary teeth in a child up to 71 months of age [1,2]. In Poland, based on the epidemiological studies, 53.8% of 3-year-old children have on average 2.4 effected teeth and this prevalence is higher when compared to the data from Western Europe [3,4]. However, even 6-month-old infants have been found to develop caries lesions; therefore, it has been suggested that an early caries prevention should start in the 4th month mother’s pregnancy [5]. Additionally, some mothers have presented reluctance to visit clinics regularly [6] and 48% of 3-year-old Polish children have never been to the dentist so far, although the dental care is free [4].
Interestingly, despite the treatment programs and caries prevention for preschoolers, about 15% of young patients would still develop the disease, which suggests an intrinsic, genetic factor influencing the individual host’s susceptibility to caries [7]. In addition, patients exposed to the same level of environmental factors and with comparable behavioral factors, might present distinct susceptibility to caries lesions [8]. Indeed, biological factors show stronger association with caries than the lifestyle and socio-economic factors, the latter only being responsible for intermediate and distant effects [9]. Genetic and immunological factors have been considered to be more important in enamel defects than the eating habits or nutritional deficits and the overall health status and immunodeficiencies in children have been shown to significantly affect the enamel hypomineralization [1]. For the last decade, several genes and genetic polymorphisms have been identified and associated with dental caries lesions in patients of different ages and ethnicities [1,7,10,11,12,13]. However, the majority of the existing caries prediction models lack biological, especially genetic factors. Selected and validated single nucleotide polymorphisms (SNPs) might be genotyped easily and early in a child’s life, and represent a potentially valuable tool for the caries risk prediction. This could allow enhanced early targeted prevention for infants and toddlers at greatest risk. As most of the eating and oral health habits can be changed at any time, this might result in better health and quality of life.
Our previous research [14,15] showed significant association of genetic polymorphisms with caries in 2–3-year-old Polish children. The aim of this study was to present caries prediction model based on chosen polymorphisms from all three studies, as predictors, using the artificial neural network approach.

2. Materials and Methods

2.1. Ethical Issues

The study was reviewed and approved by the Bioethical Committee of the Poznan University of Medical Sciences (resolutions no. 590/13, 605/14, and 727/18).

2.2. Study Design

In total, 262 children from the four nurseries in the central-west Poland were enrolled. In the two previous studies [14,15], we analyzed the differences in the frequencies of alleles and genotypes of 18 single nucleotide polymorphisms (SNPs) in 7 genes in the reference of caries experience in the cohort of Polish children. Another six SNPs in 6 genes with a presumable role in caries pathogenesis were analyzed in this study [1,10,16,17,18]. In brief, we genotyped: rs4547741 in LTF, rs7217186 in ALOX15, rs10429371 in MMP16, rs7096206 in MBL2, rs1884302 in SMAD6 and rs1711437 in MMP20. Additional analyses (including additional statistics and machine learning techniques) were performed by combining SNP testing results with data from the previous studies to determine predictive capacity of studied variants for childhood caries. Two variants, i.e., rs2609428 and rs36064169 in ENAM had homozygous status in all individuals, therefore they were excluded from statistical analyses. The remaining 22 differentiated SNPs analyzed in this study are presented in Table 1.

2.3. Dental Examination

Dental examination was carried out by a trained and calibrated dentist (K.G.), specialist in pediatric dentistry, after calibration by an experienced specialist (M.B.-L.). The intra-examiner agreement was assessed by second dental examination in a group of 10 children after 2 weeks, with a κ of 1.00. Teeth evaluation was performed in the nursery school, with the use of a dental mirror and a probe, in an artificial light. The dentition was not additionally cleaned before examination. Assessment of the teeth concerned the occurrence of carious cavities as well as initial (incipient) caries lesions (non-cavitated lesions, white spot). All tooth surfaces accessible for examination were investigated. Dental examination concerned the occurrence of teeth with carious cavities (dt) and with initial (incipient) caries lesions (non-cavitated, white spot; di), i.e., the stage before cavitation during the process of dental caries development [19]. In accordance with the international standards, the white spot lesions were included in dental caries diagnosis [20,21] as they indicate the susceptibility of an individual to dental caries and are prevalent in primary dentition in children in the first years of life. White spot lesions were easily differentiated from developmental defects of enamel on the clinical ground based on the association between caries lesion and its location on the tooth and the areas of mature plaque [22]. However, when it was impossible or difficult to differentiate the white spot lesions from other changes in some individuals, they were excluded from examination and further analyses. Radiograph of the children’s dentition was not taken.
Detailed inclusion and exclusion criteria are presented in Table 2. Out of 262 individuals examined in the study, 48 children (18.3%) were diagnosed with caries and comprised a study group. Out of the rest 214 subjects we chose 48 sex- and age-matched individuals that comprised a control group. There were 23 males (48%) aged 20 to 42 months (mean 30.2 ± 6.2) and 25 females (52%) aged 20 to 40 months (mean 30.8 ± 5.7). One control sample had low DNA concentration and was fully utilized during two previous studies; therefore, it was not available for genotyping in this study and was excluded from statistical analyses. We intended to use the genotyping and distribution results, therefore the missing control sample was not replaced by another matching sample from the caries-free cohort in this study. Finally, the control group comprised 47 individuals, including 23 males (49%) aged 20 to 42 months (mean 31.2 ± 5.3) and 24 females (51%) aged 20 to 38 months (mean 28.3 ± 5.4).

2.4. Biological Samples and Genotyping

Biological material was obtained directly after dental examination. Samples were gathered using buccal swabs, which were provided for each child in sterile packs. The procedure included rubbing of the inside of the mouth, at least ten times, from each side of both cheeks in order to scrub epithelial cells with saliva. Subsequently, the swab was put inside the 1.5 mL Eppendorf tube, and the plastic stick was cut off. The tube was placed in a portable fridge at +4 °C until DNA extraction that was done the same day using EXTRACTME DNA Swab&Semen Kit (Blirt S.A., Gdansk, Poland) according to the manufacturer’s protocol and kept at −20 °C for further analyses. We used TaqMan probes (Applied Biosystems, ThermoFisher Scientific, Frederick, MD, USA) and 7900HT Fast Real-Time PCR System, according to the manufacturer’s instructions. Per each real-time PCR reaction, we used 10ng of genomic DNA that was previously extracted and stored at −20 °C. SDS v2.4 software was used to run the analysis and for allele calling.

2.5. Statistics

The continuous data were presented as mean ± standard deviation (SD) while the categorical data were counted and presented as numbers. The Kruskal–Wallis test was applied for comparison of the means of continuous data. We used chi square test for testing the Hardy–Weinberg Equilibrium and the Fisher’s exact test for estimating differences in allele and genotype frequencies between study subgroups and between study groups and CEU data (samples of Northern and Western European ancestry, from the International HapMap Project). The dominant (AA vs. Aa+aa), over-dominant (Aa vs. AA+aa), recessive (aa vs. AA+Aa) and allelic (A vs. a) models of genetic inheritance were applied [23]. Cochran–Armitage test for trend, the most common approach in case–control analyses, was used to test the additive model of inheritance [24]. The analyses were run using IBM SPSS Statistics software. Additionally, SHEsis software was applied for haplotype analysis.

2.6. Association and Prediction Analyses

For the modeling purposes, two approaches were assessed, namely logistic regression and artificial neural network. Firstly, we used univariable logistic regression to test the impact of individual variables, accompanied by the receiver operator characteristic (ROC) curve and area under the receiver operating characteristic (AUC) value to evaluate the sensitivity, specificity and the discriminatory ability of each factor. Statistical significance in univariable logistic regression, in ROC analysis, and/or in the Fisher’s exact test for single variables were applied as inclusion criteria for multivariable logistic regression and neural network analyses. Multivariable logistic regression was run using the enter method and the following characteristics were applied to describe the model: R2 Negelkerke and Cox and Snell R2 values to assess how well the model explains the data, the coefficient β and the exponentiated coefficient β (the odds ratio) values to indicate the relationship between each variable and the outcome, Hosmer and Lemeshow test to determine a goodness of fit of the data with the model, and, at last, the ROC curve to evaluate the predictive accuracy and the discrimination power of the model. IBM SPSS Statistics software v27.0.1.0 was used for logistic regression and ROC analyses and Statistica v13.3 were employed for neural network modeling.
Artificial neural network is a deep learning approach that, in the image of the human brain, self-learns from experience and adjusts to a situation. Briefly, neural network (NN) consists of multiple neurons, called nodes, and interconnections among them creating a complex structure, in which information passes imitating the system of real neurons. Each interconnection is given its weight, upon which the strength of the association is acquired. A typical network contains an input, hidden and output layers. The input layer receives the input signal to be processed, i.e., the data, while the hidden layer performs all the computational processes resulting in an outcome prediction in the output layer. The results are compared to the real observations and each time the process is repeated, until the smallest prediction error is reached. The great advantage of the NN approach is that it enables detecting complex nonlinear associations between variables and an outcome as well as all possible interactions between variables themselves, using multiple distinct learning algorithms, that are adjusted for the data type. We used the following parameters: a typical multilayer perceptron as a network type, 4 to 12 hidden layers (default), the Broyden–Fletcher–Goldfarb–Shanno (BFGS) algorithm as an iterative method, 4 types of activation functions, i.e., linear, logistic, exponential and tanh, and SOS (symbiotic organisms search) error rate type as a training method, that gives the best accuracy [25]. Out of the total data, 70%, 15% and 15% were used as training, testing and validation set, respectively. In total, 25 different models were created, out of which the 6 best, based on self-learning, were saved and analyzed in detail.

3. Results

3.1. Demographic Data

The caries rate in our cohort of preschool children was 18.3% (48/262) and the number of affected males was comparable with affected females (23 vs. 25). To minimize the potential demographic stratification, the control samples were adjusted to the caries samples in the reference to age and gender (p = 0.4163 and p = 0.9208, respectively). There was no difference between the number of erupted teeth or the type, i.e., incisors, canines, molars, between the groups (p = 0.3945, p = 0.3250, p = 0.7148, p = 0.1988, respectively). Additionally, the number of erupted teeth and its types did not differ between males and females, in caries or control group.

3.2. Genotyping

All markers genotyped in the present research were in Hardy–Weinberg equilibrium. The distribution of genotypes and alleles in six SNPs, in caries and control groups as well as in the study cohort and CEU data are presented in Table 3.
We spotted an almost 26-fold higher occurrence of rs10429371 recessive TT homozygote (p = 0.0262) and a 1.5-fold higher occurrence of the T allele (p = 0.1645) in caries patients in comparison with healthy controls, and the CT heterozygote was 2.5-fold more frequent (p = 0.0320) in the control group in comparison to caries group. In the case of another variant, rs7096206, the recessive GG homozygote and the G allele were 9.6-fold (p = 0.0363) and over 2-fold (p = 0.0180), respectively, more frequent in controls than in caries patients. The frequencies of alleles and genotypes for the rest of the genotyped SNPs did not differ between the groups or the results were statistically insignificant. When the subgroups were compared in reference to gender, none of the results were significant, although there was an almost 2-fold higher occurrence of rs10429371_T and TT variants in males, as well as over 2.5-fold higher occurrence of the wild CC homozygote in females, in caries patients, while no such observation was made for the controls. When our results were compared to the CEU data, we spotted significant differences for rs4547741, rs7217186 and rs10429371, and the latter SNP showed significance both for allele and genotype frequencies, showing the recessive T and TT variants to be, respectively, 8-fold and almost 18-fold more frequent in the CEU group than in our Polish cohort (p < 0.001 for both comparisons) (Table 3).
The differences in the frequency of the other 18 single nucleotide variants used for further statistical analyses in the present research were discussed in our previous studies, showing the association of recessive ENAM rs12640848_G, recessive AMELX rs17878486_T, wild TUFT1 rs2337360_A and two recessive KLK4 rs2235091_G and rs198969_G variants with caries outcome, and one recessive variant in AMBN, rs34538475_T, with the absence of the disease [14,15].
When the Cochran–Armitage test for trend was applied (see Table 4), out of eight significantly different distributed variants between the groups, six showed the positive significant additive model of inheritance and they were as follows: rs7096206, rs12640848, rs17878486, rs2337360, rs2235091 and rs198969. In turn, variants rs10429371 and rs34538475 showed stronger recessive modes of inheritance.

3.3. Haplotype Analysis

Although not each variant comprising the haplotype presented significance in single variant analysis, the overall haplotype analysis showed some association with the disease or disease-free trait. Briefly, AMBN TC and TT haplotypes (comprising rs34538475 and rs4694075, respectively) were significantly associated with healthy controls, while GC haplotype showed association with caries. Additionally, strong association with caries was observed for TUFT1 AAA, AAG and AGG haplotypes (comprising rs3790506, rs4970957, rs2337360, respectively) and the significances for the rest of TUFT1 haplotypes were most probably the result of quite low numbers of dominant and recessive homozygotes in both groups for rs3790506 and rs4970957, respectively, which was reflected by the absence of some haplotype variants in one group and their low frequency in the other. Likewise, significance was observed for rs2235091_rs198969 TC haplotype in MMP20, most probably due to its absence in of the study subgroups, and a low frequency in the other. Both SNPs in KLK4 were significant in single locus analysis, however, only rs2235091_rs198969 GG haplotype showed significant association with caries, demonstrating that both recessive alleles were essential for caries effect and, analogically, the AC haplotype was significantly associated with non-disease trait, showing that both dominant alleles were essential for protective effect. Two haplotypes in ENAM were significantly associated with caries and non-caries trait, most possibly due to the middle allele of rs12640848, i.e., the only significant SNP in ENAM in other statistical test conducted. Haplotype CAAGA was over twofold more frequent in caries patients, corroborating the A allele as a risk variant, while haplotype CAGGA was almost 2.5-fold times more frequent in controls, which confirmed the G allele as a protective variant. The other four SNPs of ENAM did not contribute into the haplotype significance. No significant results were found for TFIP11 haplotypes. The haplotype distributions are shown in details in Table 5.

3.4. Caries Association and Prediction

Table 6 includes the results of univariable logistic regression that depicted eight variables, that were all single nucleotide polymorphisms, i.e., rs10429371, rs7096206, rs12640848, rs17878486, rs12640848, rs2337360, rs2235091 and rs198969, to be significantly associated with caries outcome and those eight SNPs were then included in multivariable logistic regression analysis and neural network prediction. The overall multivariable logistic regression model characteristics are shown in Table 7 and information about single variables in the model are shown in Table 8.
Briefly, the strongest association with caries was assessed for rs17878486 in AMELX, rs2337360 in TUFT1 and rs12640848 in ENAM, that remained in the final model at p < 0.05 (p = 0.0008, p = 0.0040, p = 0.0401, respectively). The model evaluation gave 93% total number of correct calls with 90% sensitivity and 96% specificity and a strong level of significance p < 0.0001. The AUC value of the model (0.970 (95% CI:0.912–0.994; standard error = 0.014), p < 0.0001) was also high. The ROC curve was constructed by plotting the true caries rate against the false caries rate and the prediction was made using all eight SNPs that were significantly associated with the outcome in single locus analyses. The rest of parameters, e.g., the prediction accuracy and goodness of fit, reached the high level of the overall performance of the model (see Table 7 and Figure 1).
According to other mathematical algorithms used in neural network analysis, all eight variables that performed at p < 0.05 in univariable analyses were also introduced in the NN model, although only three of them hold the significance in multivariable logistic regression. The overall performance of six neural network prediction models is presented in Table 9.
All the models reached a high prediction accuracy, from 90.9% to 98.4% in the test analysis. The best model, namely NN1, which gave the highest prediction accuracy in the test analysis (98.4%), simultaneously gave the lowest rate in the validation analysis (73.6%). The other five models performed relatively high in the validation analysis, i.e., 85.3–87.2%. All four types of activation function algorithms were used in the final prediction models. Only one model, NN3, used the linear function in the hidden layer, while logistic, exponential and tanh functions turned out to be better fitted, as they were used interchangeably in the rest of the models. In fact, the latter two functions support the backpropagation process, and therefore speed up the model’s self-training process, which is one of the crucial steps in a multilayer neural network system [26,27]. When analyzing the prediction sensitivity of single markers, described as their usefulness, interestingly, all of the eight markers turned out to be crucial for the prediction models. Figure 2 shows the overall importance of eight markers in six caries prediction models. The sensitivity of prediction allows distinguishing variables that are important from those that do not contribute, or contribute little, to the overall performance of a model, and therefore, can be rejected. The greater the error after rejection of a variable to the original error, the more sensitive the network model is to the lack of this variable. In this study, the top three predictors in the reference to each single model as well as to the mean value of error rate were: AMELX_rs17878486, TUFT1_rs2337360 and MMP16_rs1042937, while the least important predictor was AMBN_rs34538475. Nevertheless, all eight markers gave an error value above “0”, which means that even the weaker one was still important for the caries prediction.

4. Discussion

We presented a complex analysis of 22 differentiated single nucleotide polymorphisms in prediction of dental caries in primary dentition of children. This study is an extended analysis utilizing additional data from our previous studies [14,15]. Deep learning neural network models for caries prediction were applied in a homogeneous cohort of 2–3-year-old children living in an urban environment under similar cultural conditions.
The previous caries experience, independent of an individual’s age, has previously been reported as the strongest and the most universal risk factor for future caries development [28]. However, it is challenging to assess the previous caries experience in infants and toddlers. Most of the previous studies and distinct caries prediction models apply to adults, school children or older preschoolers, while models for toddlers are scarce [29]. Another obstacle in assessing well-performing caries prediction model are discrepancies among the studies, i.e., imprecise definition of caries phenotype and caries lesions or inconsistency in the terms used by the researchers [9,23,30,31]. Furthermore, the majority of acquired caries prediction models are based on demographical and environmental factors and the only biological feature that has been considered is the cariogenic bacteria colonization of oral cavity.
The first linkage studies in caries were performed in 2008 [32] and the first genome-wide association studies for early childhood caries were published in 2011 [33]. Abbasoğlu et al. [10] were the first to correlate environmental and genetic factors in ECC in Turkish 2–5-year-olds, while Lewis et al. [34] considered several single nucleotide polymorphisms, however they were not included in the final caries prediction meta-analysis. Another technical obstacle in any caries prediction model implementation in practice is an almost total lack of replication and validation studies in independent populations [13,35]. Mejare et al. [28] depicted 17 studies on caries prediction in preschoolers, defined as children of age <1 to 6 years old. None of them used genetic variables as prediction factors, most gave moderate prediction accuracy results and only one study by Holgerson et al. [36] based on environmental factors and saliva sampling in 2-year-olds was validated. Persistent high dental caries rate in the general Polish population and nearly constant prevalence and severity index of the disease in children in the recent years [37] should encourage both researchers and clinicians to develop better and validated prediction approaches that might be implemented in practice.
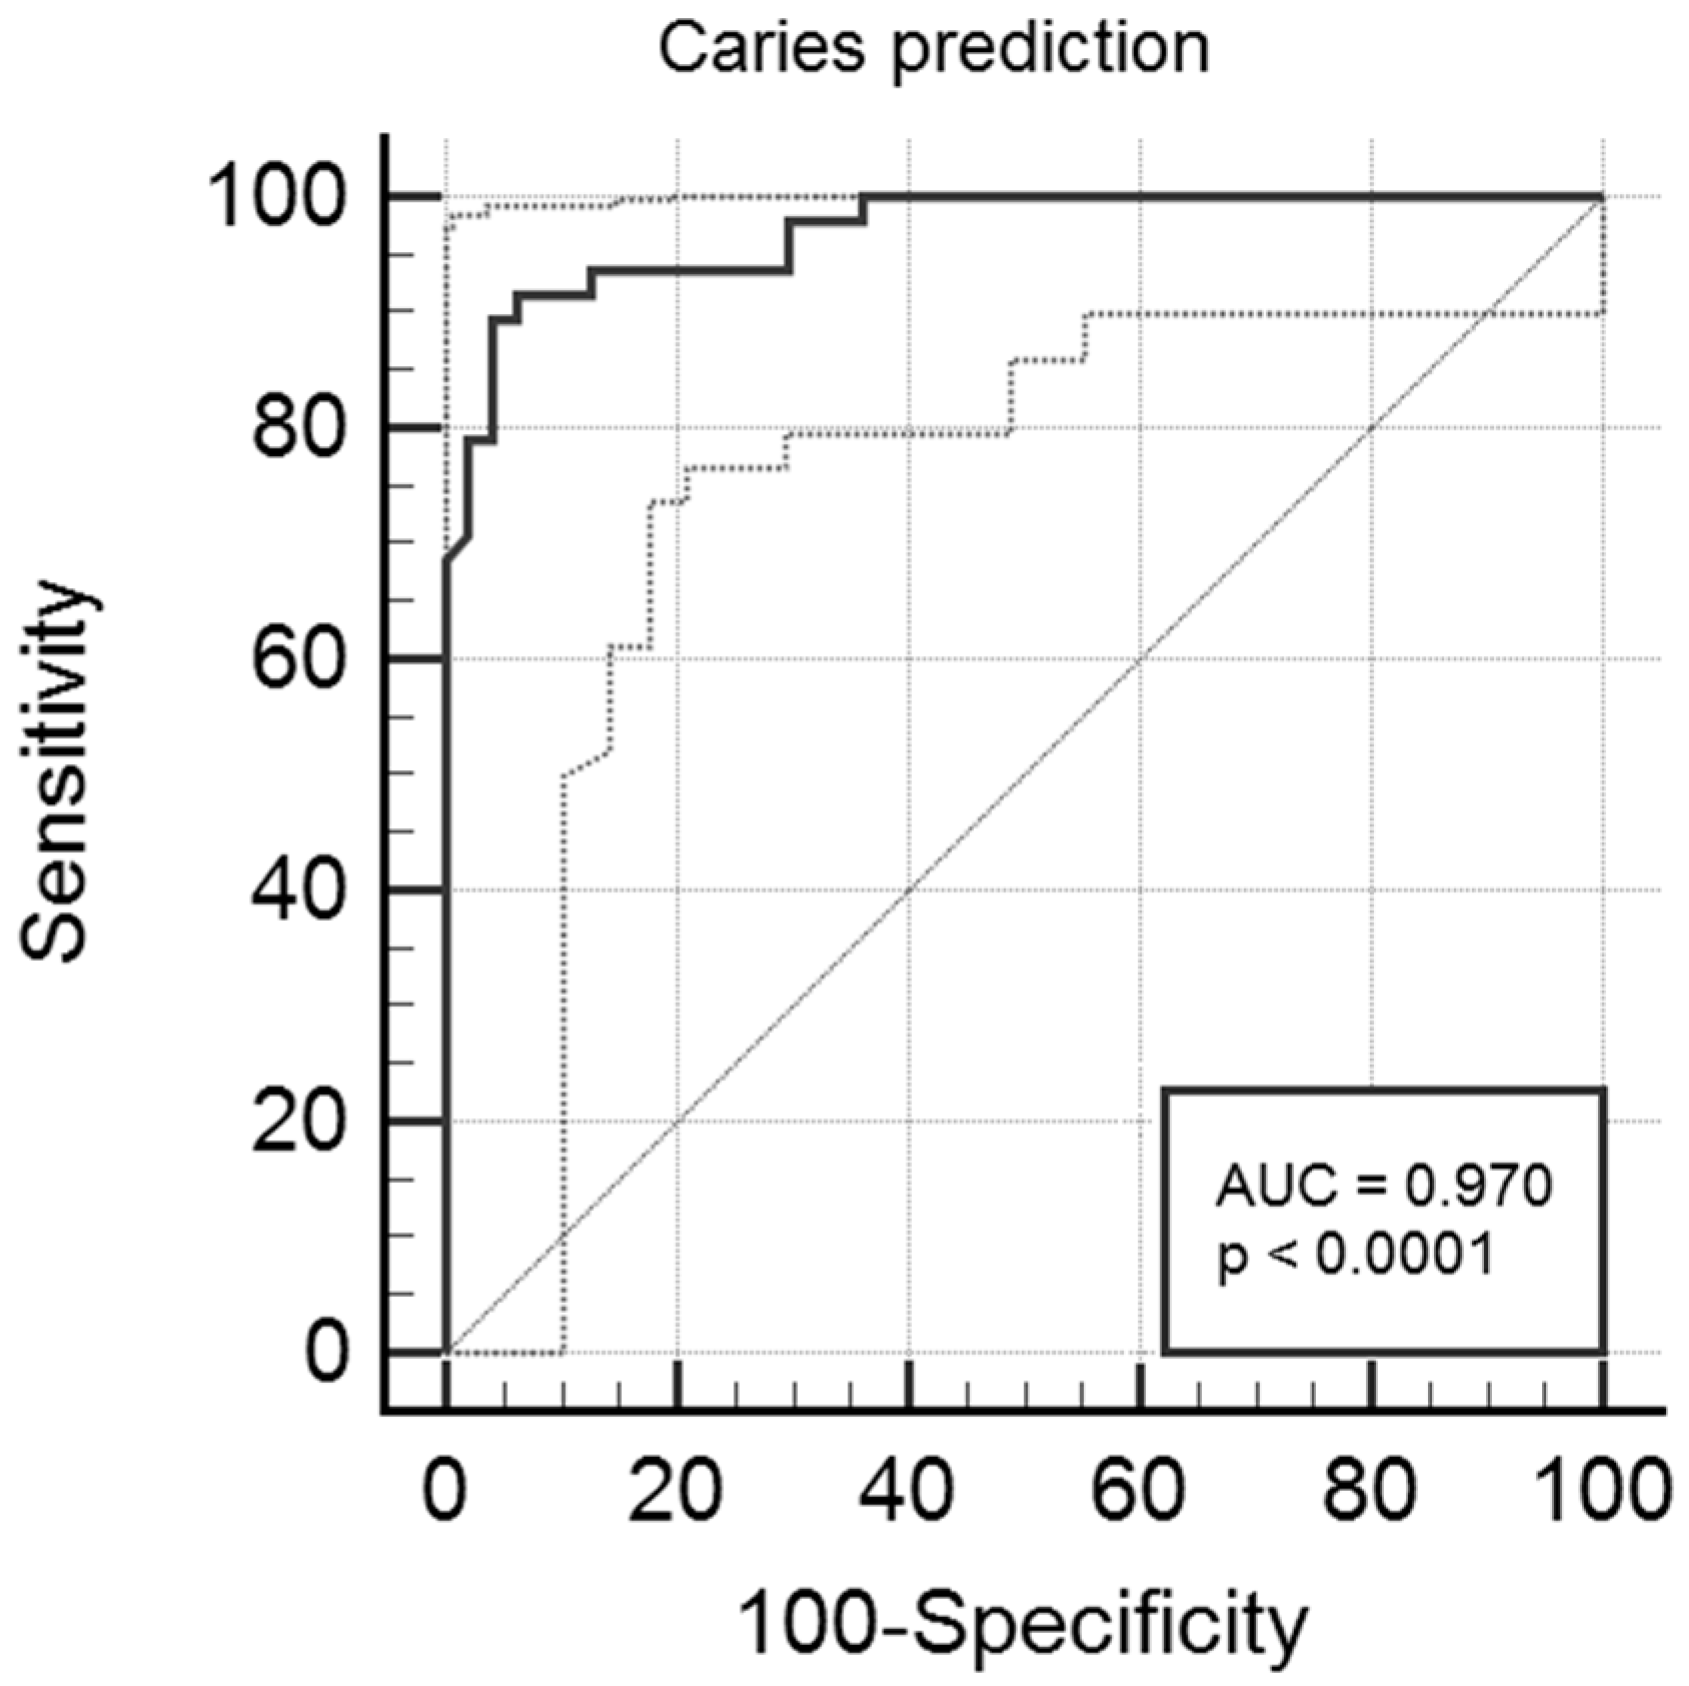
In this study, we obtained relatively high prediction accuracy ranging from 90.9% to 98.4%, depending on the prediction model, using a neural network approach. Additionally, multivariate logistic regression analysis showed accuracy of 93% with high sensitivity and specificity values, i.e., 89.6% and 95.7%, respectively. Results of both approaches were gender- and age-independent, as the two study subgroups were adjusted for both features. The most important predictors/indicators in both assays were AMELX rs17878486 and TUFT1 rs2337360 [15]. In brief, AMELX and TUFT1 are the genes that play a crucial role in the enamel formation process and the single nucleotide polymorphisms have previously been attributed to high caries susceptibility, in primary as well as permanent dentition, although the risk allele varied depending on population and age [12,30,38]. Another factor that was significantly associated with caries outcome in both uni- and multivariable logistic regression was ENAM rs12640848. ENAM encodes enamel-special protein enamelin that is a critical factor during enamel maturation. Our results were in agreement with other reports, supporting the presumable role of rs12640848_G as a protective factor in ECC [10,
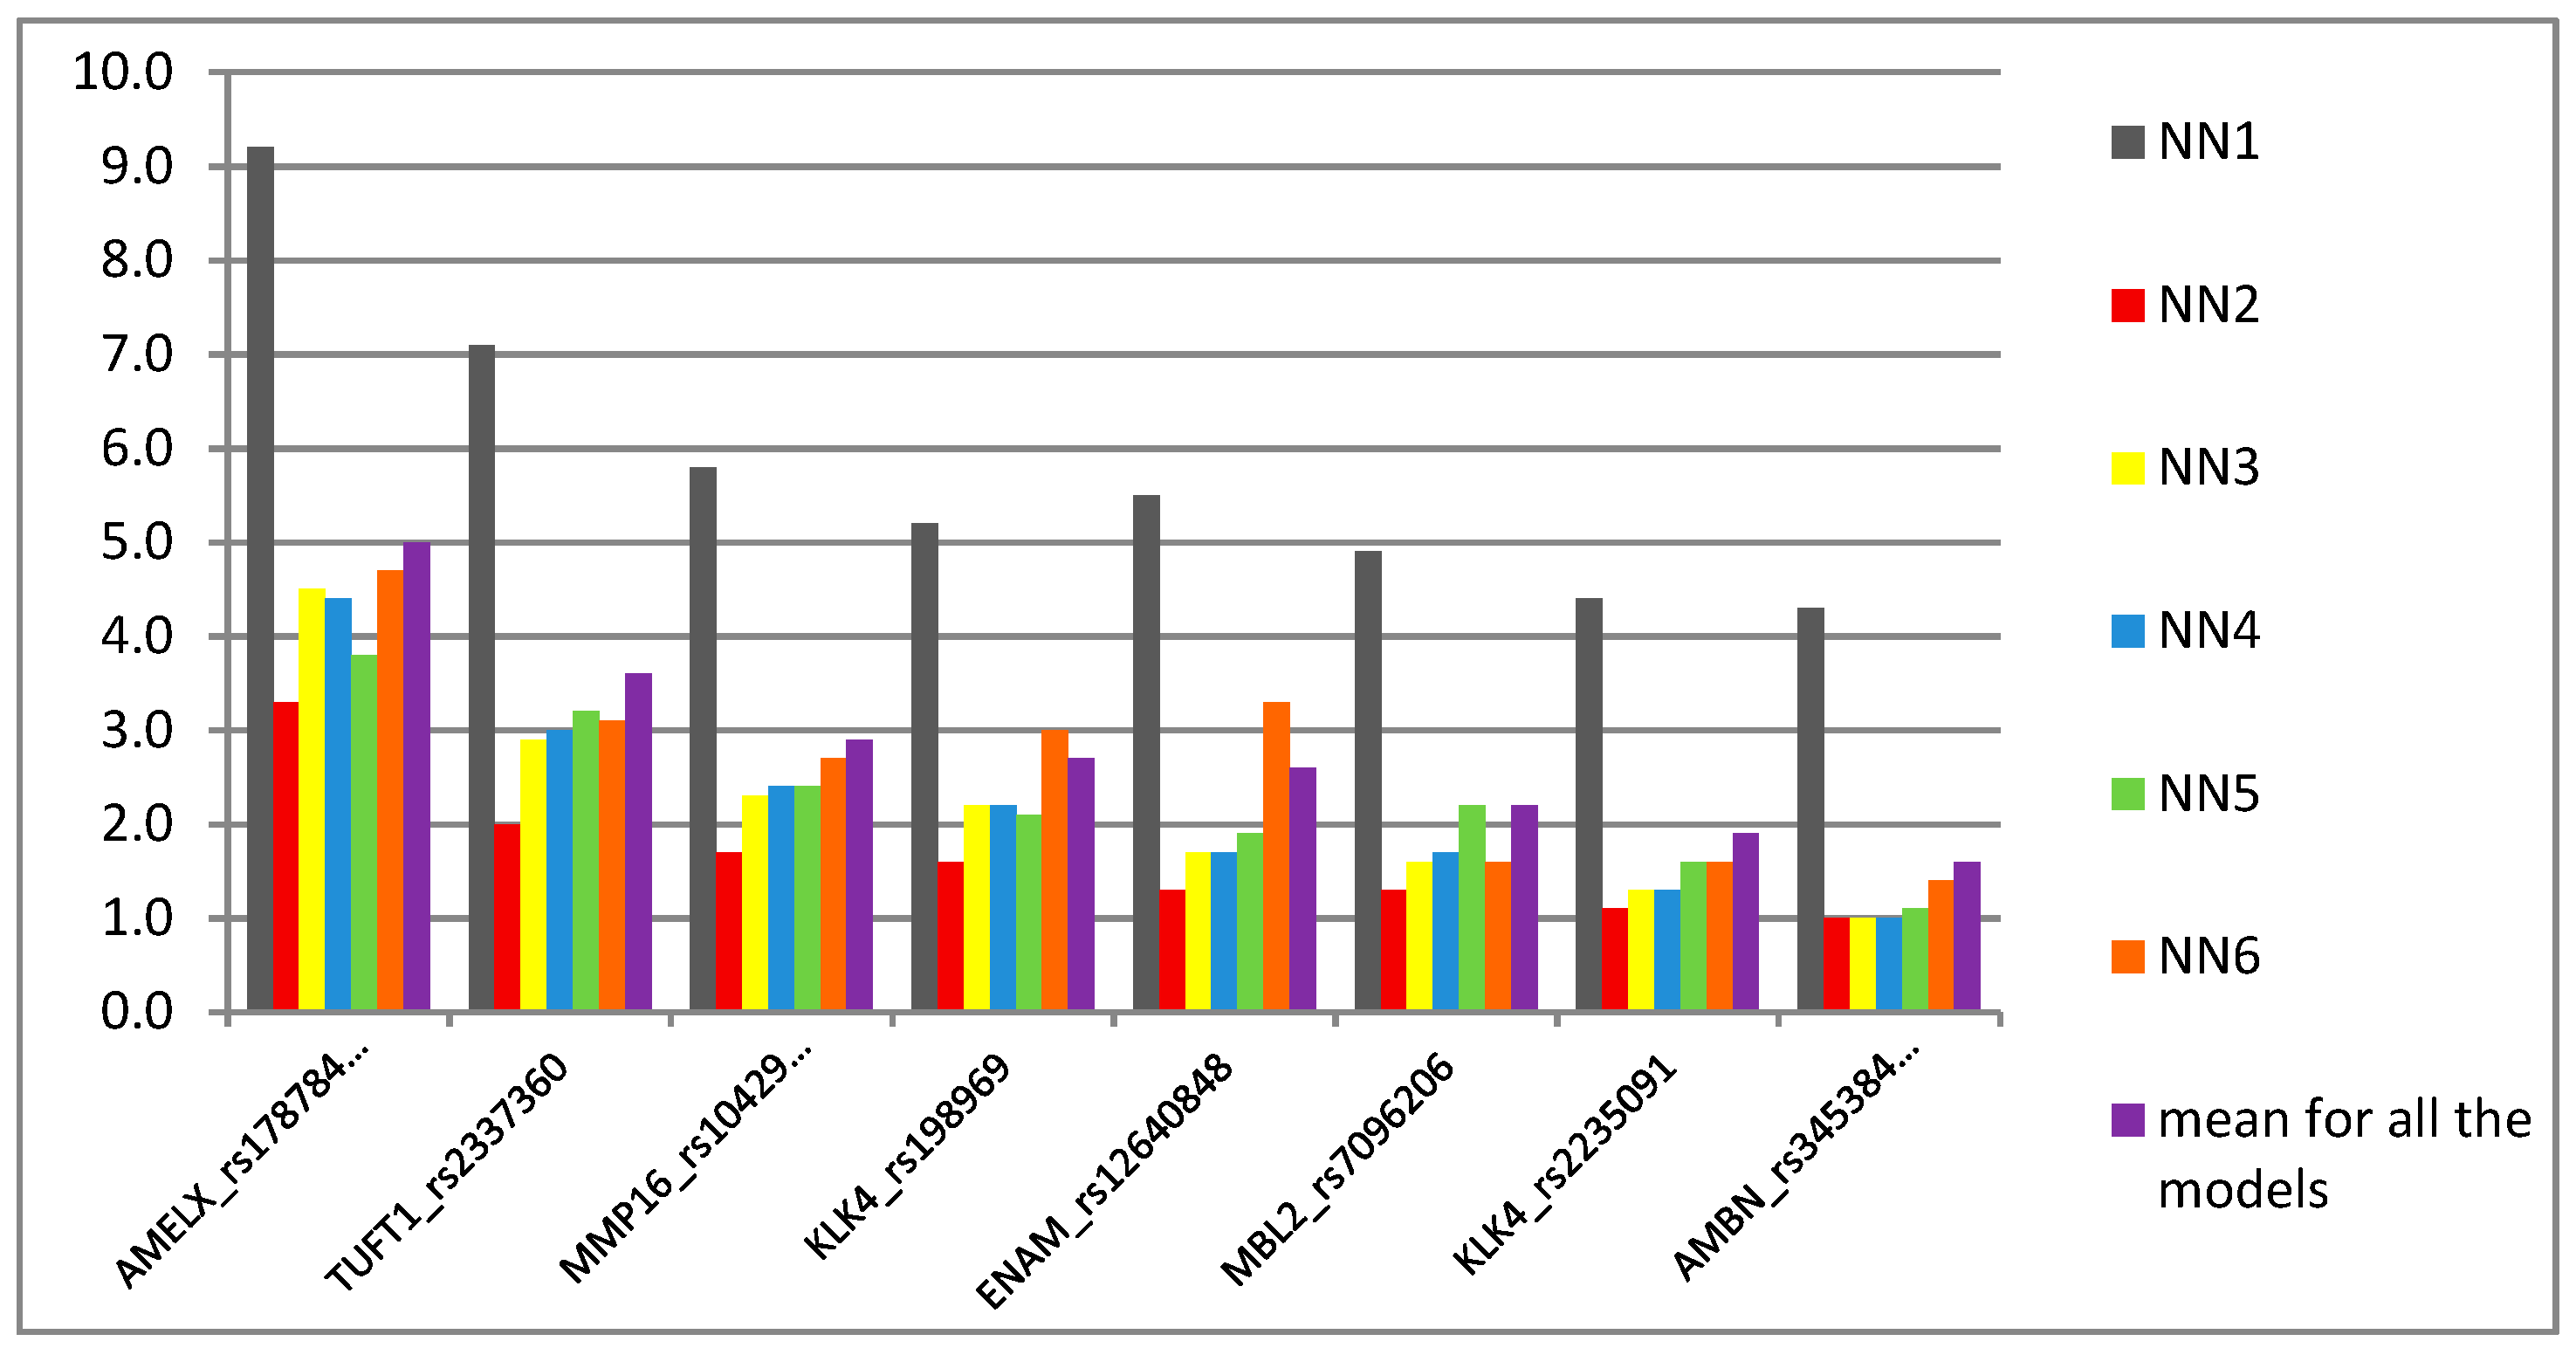
30]. Interestingly, when the SNP was used in this study as a predictor in neural network analysis, it turned out to be an intermediate marker in the scale of importance (Figure 2). This might be explained by the fact that both wild AA and rare GG genotypes were associated with the opposite outcomes, i.e., caries and caries-free phenotype, respectively. Conversely, another SNP, i.e., MMP16 rs10429371, was the third most important predictor in NN models, although it did not hold the significance as an indicator in multivariate analysis. This is an interesting finding, since rs10429371 explained over 20% of the trait in single locus analysis and the TT variant was nearly 26 times more frequent in caries individuals when compared to controls, showing a strong recessive pattern of inheritance and suggesting TT as a risk variant for dental caries development in the studied individuals. Additionally, it was one of the variants for which alleles and genotypes were differently distributed in the cohort in this study in comparison to the CEU individuals in favor of wild C and CC variants (Table 3). Matrix metalloproteinases (MMPs) play an important role in early tooth development by regulating ameloblast maturation and formation of enamel. Several types of MMPs have been described to be involved in dentin collagen degradation and dental caries lesion progression [12,34,39,40,41,42]. MMP16 rs10429371 was previously associated with caries in white adults [34]. Linhartova et al. [41] observed higher incidence of rare T allele in caries children aged 13–15 years, although it did not reach the statistical significance level.
The second variant that showed significant association with caries outcome and was genotyped in this study was rs7096206 in MBL2. Mannose binding protein (MBL2) is an acute phase protein that plays an important role in innate immunity. The study showed that MBL2 polymorphisms are involved in several infectious diseases and the top ranked rs7096206 has been annotated as deleterious to the protein’s function and described as one of the most functionally important variants in the gene [42]. Rs7096206_G was found to be a risk factor in Polish 5-year-olds in reference to higher vs. lower caries experience, while it had no effect in 12-year-olds [1]. Interestingly, the same rare variant was significantly associated with no caries experience in 2–3-year-olds in our study, showing an additive model of inheritance. On the other hand, in the former study [1], rs7096206_G was associated with higher caries experience in both age subgroups while in the haplotype with rs1800450_G, and the CG haplotype had the opposite effect. Alike, rs7096206 genotype distribution was insignificant, but in haplotype with rs7501477_T it correlated with caries experience in Saudi 5–13-year-old children [43]. It might suggest that other SNPs could be associated with a more complex pattern of the disease and/or that distinct genetic variants could be involved at different ages. Such differences, i.e., in primary vs. permanent dentition, were also acknowledged by Wang et al. [44]. Likewise, as the rs7096206_G variant is associated with lower MBL2 serum levels predisposing to infections [45], other SNPs could show strong linkage disequilibrium accounting for possible protective mechanisms in the toddlers in our study. Nevertheless, the SNP was not significant in multivariate analysis, despite the drastic OR value, i.e., 3.36 × 10⁻⁹.
We did not observe any association of other SNPs in MMP, i.e., MMP20 rs1711437 genotyped in this study and rs1784418 in the previous study [15], with caries or caries-free phenotype. MMP20 (enamelysin) is the early protease secreted during enamel development and is involved in both dentin and enamel decomposition [46]. Only Antunes et al. [47] found both variants to be associated with early childhood caries. Yet, the results of other studies of MMP20 SNPs were on the border of significance in 5-year-old Caucasian children with dental caries or have been associated more with poor oral hygiene and dietary habits than the disease itself in 5–14-year-old Caucasians [16,46]. Likewise, rs45447741 in LTF, rs7217186 in ALOX15 and rs1884302 in SMAD6 presented no association with caries experience in this study in any of the statistical tests used.
The rest of significantly different distributed variants in the previous study [15], i.e., AMBN rs34538475 and KLK4 rs2235091and rs198969, were not significant in multivariate analysis and their importance in caries prediction models were of a moderate (rs2235091and rs198969) to low (rs34538475) degree (Figure 2). KLK4 plays an important role in the late stages of enamel development, while AMBN, together with AMELX, is crucial for enamel matrix formation and mineralization. The roles of the abovementioned SNPs in both genes as risk factors in caries development in children were partially in agreement with other authors, depending on studied population and children’s age [10,12,46]. Additionally, the haplotype analysis showed that alleles of both variants in KLK4 were necessary for the risk (i.e., rs2235091G_rs198969G haplotype) and protective (i.e., rs2235091A_rs198969C haplotype) effect.
It must be emphasized that the differences in association of genetic variants with caries experience and severity in the studies occurs not only due to the differences between the populations but also in one population itself, even from one individual to another [34]. Single nucleotide polymorphisms are often highly variable between distinct ethnic cohorts and, at least partially, resemble divergence in human phenotypes, including different disease susceptibility or drug response. Dental caries is a highly complex trait, also in reference to environmental factors, i.e., socioeconomic and cultural factors, age, oral hygiene, eating habits, also the course of pregnancy and mother–child relations [3,6,46,48,49,50]. Age appears one of the key factors in caries analysis, as the disease experience is differentially defined in reference to the age of patients. Some authors emphasize that each age group should be characterized by other sets of temporal variables [50], with the most important risk factors as follows: in 2-year-olds—allergies and infections before first tooth eruption and intake of drugs during the first 12 months of life, in 3-year-olds—mother’s age at the time of pregnancy and smoking during pregnancy [29], consumption of sweetened food during first 12 months of life and nocturnal drinking of sweet drinks above 12th month [3], in 4-year-olds and older children—frequency of tooth brushing, fluoride treatment and mother’s education [51].
One of the hypotheses might be that distinct processes, and hence different genes and polymorphisms, play a significant role throughout the stages of a child’s growth and development. Since the genetic sequence does not change over the course of life, each stage might be sensitive to distinct variants, including those that shape susceptibility to caries development. Simultaneously, the sensitivity to the secondary environmental factors and the tertiary behavioral factors, responsible for the intermediate and distal effects, respectively, might also alter. Substantially, it can be explained by the order of teeth eruption, their type and number. Caries lesions appear first on incisors and molars, also maxillary teeth are more often affected than mandibular teeth. Caries formation predominantly affects teeth with deep and/or narrow pits and fissures on the occlusal surface, which is closely related to the morphology of primary dentition and molars [4,46,50]. The deeper and narrower the pit, the easier it is for the bacterial plaque to penetrate and adhere to a tooth surface. The higher the number of teeth with deep and narrow pits, together with inappropriate brushing, the more frequent the predisposition to higher caries rate, which is especially relevant in preschoolers [50,52,53]. The similar pattern of caries development has been observed in 3-year-old children in other studies [53,54,55]. In this study, we did not observe differences in the total number of erupted teeth and the number of the teeth types was similar between affected and caries-free children and between boys and girls in both subgroups (not shown). Although we did not conduct a follow-up study, some authors pointed that caries susceptibility varies depending on the tooth morphology and rises sharply after 2–3 years after the tooth eruption, when posteruptive enamel maturation takes place [4,5]. Therefore, dental caries seems to be a remarkably divergent trait constantly changing in time and with its occurrence increasing with age. The prevalence of caries experience in our study was 18.3% and was comparable to children of the corresponding age of other ethnicities, i.e., Western Europe, Eastern-Southern Asia and Sub-Saharan Africa [3,29,56]. Interestingly, it appeared to be much lower when compared to other studies concerning Polish children with active caries of distinct regions, i.e., 40.8% in the Podlasie region [57], 53.8% in Lower Silesian, Malopolskie and Lubelskie voivodships [4] or from 35% to 56.6% in the general 2–3-year-olds population [3,13,57]. However, according to Werneck et al. [13] caries rate can reach even 85% in preschoolers.
Another risk factor for caries lesions development, closely related to children’s age, is the presence and composition of bacterial plaque in the host. The level of colonization by cariogenic bacteria has been considered the strongest risk factor in 3-year-old Polish children [49], however, it should be emphasized that it might be influenced by other features. Firstly, the activity of Lactobacilli and Mutans Streptococci is higher in preschoolers and in primary dentition in comparison with older children and permanent teeth [10,50,58], therefore it might be a biological predisposition of the host. Secondly, the younger the child, the more attention and supervision over teeth brushing should be provided by the parents/guardians, therefore minimizing the bacterial film and setting a good hygiene habits. The mother not brushing a child’s teeth was found a major risk factor in Mutans Streptococci infections and ECC in Australian children aged 12–72 months but also in 9-month-old Thai children [6,59].
Both genetic and host factors fluctuate with age, and with a broad spectrum of environmental factors, they contribute to the development of caries lesion differently in every individual. Moreover, even children of the same ethnicity that are exposed to the same levels of risk factors might present distinct caries severity index and patterns of the disease [13], which strongly supports the existence of other, intrinsic, i.e., genetic components. Still, depending on the population and its habits, prediction models using the same risk factors might be characterized by distinct final prediction parameters, as well as comparable prediction features of different models might be determined by distinct input variables [8]. To mention a few, Kalhan et al. reached a high AUC value of 0.81–0.91 of caries prediction in 2-year-olds and 0.79 in 3-year-olds [29], while Fontana et al. [60] assessed AUC of 0.73 in 4-year-old children. Tamaki et al. [61] came across 33 studies on caries prediction, however, the majority of them used logistic regression analyses and only some authors used additional, advanced machine learning algorithms to compare the results, namely artificial neural network, decision analysis or classification and regression trees [27,50,61,62,63]. The benefit of logistic regression analysis is that it can be conducted using non-complicated software; however, the procedure is descriptive in its nature and should be applied to assess risk indicators, not predictors. On the other hand, advanced machine learning methods consider the unequal strength of potential markers, so that a weak factor is not hidden by the strong one and predictive power is more reliable [9,51]. In fact, we observed some differences in the importance level of studied variants between the two approaches, although it is not entirely adequate to compare the results of different algorithms, even describing the same features. Still, one of NN models—NN5, in which logistic function was applied as an activation algorithm in both hidden and output layers, gave the most outstanding importance values of all tested predictors, while in the remaining 5 models based on distinct algorithms were lower but comparable with each other within one model. The NN5 model presented the second-best prediction accuracy in this study; however, using logistic methods only might suggest over-fitting of the model, even in advanced machine learning approaches. Likewise, So and Sham [64] stated that ROC curve analysis is not directly correlated with the disease risk and even high significance, i.e., low p-values, is not equal to a good predictive power. Javed et al. [27] obtained 99% accuracy in caries prediction in 6–14-year-old Indian children using neural network modeling, and it was the method of choice in other studies with medical prediction [65,66,67,68].
Another issue worth mentioning is the nature of variables themselves. When studying some environmental, behavioral and biological factors, a collinearity might occur, e.g., the presence of dental plaque might be the result of a poor oral hygiene, which in turn might be correlated with a lack of guardians’ control over child’s brushing. [63]. While it is not a problem in advanced modeling approaches, it should be avoided in logistic regression analyses, since it tends to cause over-fitting of the data and spurious results [63,69]. The strength of this study is a homogeneous study group, that is sex- and age-adjusted, since both factors are found to be potential confounders in case–control studies [24]. Secondly, the assessment and comparison of the results and performance of two different statistical approaches, adjusted for the data and therefore more reliable, appears to be crucial when implementing the method into the clinics. The obvious limitation of this study and a necessary future direction is a larger study group and validation of the model.
The polymorphisms analyzed in this study and a high caries prediction rates indicate a strong genetic component in the course of the disease. Nevertheless, one has to remember about the multifactorial nature of caries and that even the best prediction model cannot fully describe the real life scenarios and neither solely genetic nor solely environmental factors can completely explain the disease cause. Hence, analyses exploring environmental and genetic predictors need to be conducted very carefully. Firstly, some genetic variants might influence behavioral habits, e.g., SNPs in taste genes [11] as well as non-genetic factors themselves might be correlated with one another, yielding spurious results. Secondly, compared to the environmental impact, if some genetic effect on a disease trait exists, it remains the main and unchangeable element in the disease incidence, especially early in life [70,71]. Even being under the influence of the environment, genetic factors combined with non-genetic findings have been replicated only partially and with the lack of statistical power [70]. Although many rare variants or the ones with smaller effect might be missed in purely genetic case–control studies, the subgroup analyses and high homogeneity of the study subgroups greatly improves the prediction [72,73]. Some authors [70,74] have studied and described interesting gene–environment association tests, that successively and carefully analyze both components in multiple testing approaches. McAllister et al. [75] have developed novel statistical approaches to detect genetic–non-genetic interactions with regard to different durations of exposure to environmental factors. Therefore, a fully developed caries prediction model undoubtedly requires a complex analysis of multiple factors as well as replication studies before implementation in practice. Still, the high prediction value of genetic polymorphisms presented in this study comprises valuable findings on early caries development that sets the direction of the future research.

5. Conclusions

In conclusion, our study demonstrates neural network models of high accuracy for dental caries prediction in early childhood, based solely on the genetic single nucleotide polymorphisms selected using more basic and less statistically advanced methods. An effective and early prediction of intrinsic risk factors might influence the change in eating habits, improve oral hygiene and other behavioral factors when an individual is at a high risk of developing caries lesions. Early implementation of preventive strategies and a customized early treatment might decrease the risk of caries while improving children’s health, the quality of life and self-esteem, as well as reducing the financial burden associated with medical care.

Author Contributions

Study concept and design: K.Z., K.G., M.N., T.S. Preparation of dental examination: K.G., M.B.-L. Carrying out dental examination: K.G. Molecular and statistical analyses: K.Z. Collection of literature data: K.Z. Analysis and interpretation of epidemiological data: K.Z, K.G. Drafting of the manuscript: K.Z., K.G. Critical revision of the manuscript for important intellectual content: M.B.-L., M.N., T.S., K.Z., K.G. Study supervision: M.B.-L., M.N. Funding acquisition: K.G., T.S., M.N. All authors have read and agreed to the published version of the manuscript.

Funding

The research was supported by grant from the Poznan University of Medical Sciences (502-01-02207319-08716).

Institutional Review Board Statement

The study was conducted according to the guidelines of the Declaration of Helsinki, and approved by the Ethics Committee of Poznan University of Medical Sciences (nr 590/13 in 2013, 605/14 in 2014, 72/18 in 2018).

Informed Consent Statement

Informed consent was obtained from all subjects involved in the study.

Acknowledgments

The authors thank the Director and staff of the day nurseries for consent and help in carrying out the individuals’ examinations, the patients who participated in the study for cooperation and their parents for the consent.

Conflicts of Interest

All authors have indicated they have no potential conflicts of interest to disclose.

References

  1. Olszowski, T.; Adler, G.; Janiszewska-Olszowska, J.; Safranow, K.; Kaczmarczyk, M. MBL2, MASP2, AMELX, and ENAM gene polymorphisms and dental caries in Polish children. Oral Dis. 2012, 18, 389–395. [Google Scholar] [CrossRef]
  2. Rathee, M.; Sapra, A. Dental Caries; StatPearls Publishing: Treasure Island, FL, USA, 2020. [Google Scholar]
  3. Olczak-Kowalczyk, D.; Gozdowski, D.; Kaczmarek, U. Factors associated with early childhood caries in Polish three-year-old children. Oral Health Prev. Dent. 2020, 18, 833–842. [Google Scholar] [CrossRef]
  4. Olczak-Kowalczyk, D.; Turska-Szybka, A.; Strużycka, I.; Gozdowski, D.; Bachanek, T.; Kaczmarek, U. Caries pattern in three-year old preschool children. Dent. Med. Probl. 2017, 54, 241–246. [Google Scholar] [CrossRef] [Green Version]
  5. Wójcicka, A.; Zalewska, M.; Czerech, E.; Jabłoński, R.; Grabowska, S.Z.; Maciorkowska, E. Dental caries of the developmen-tal age as a civilization disease. Przegl. Epidemiol. 2012, 66, 705–711. [Google Scholar] [PubMed]
  6. Plonka, K.; Pukallus, M.; Barnett, A.; Walsh, L.; Holcombe, T.; Seow, W. A Longitudinal Study Comparing Mutans Streptococci and Lactobacilli Colonisation in Dentate Children Aged 6 to 24 Months. Caries Res. 2012, 46, 385–393. [Google Scholar] [CrossRef] [PubMed]
  7. Chaussain, C.; Bouazza, N.; Gasse, B.; Laffont, A.G.; Vital, S.O.; Davit-Béal, T.; Chabadel, O.; Hennequin, M.; Courson, F.; Droz, D.; et al. Dental caries and enamelin haplotype. J. Dent. Res. 2014, 93, 360–365. [Google Scholar] [CrossRef]
  8. Stamm, J.; Stewart, P.; Bohannan, H.; Disney, J.; Graves, R.; Abernathy, J. Risk Assessment for Oral Diseases. Adv. Dent. Res. 1991, 5, 4–17. [Google Scholar] [CrossRef]
  9. Aleksejūnienė, J.; Holst, D.; Brukienė, V. Dental caries risk studies revisited: Casual approaches needed for future inquires. Int. J. Environ Res. Public. Health 2009, 6, 2992–3009. [Google Scholar] [CrossRef] [PubMed]
  10. Abbasoğlu, Z.; Tanboğa, I.; Küchler, E.C.; Deeley, K.; Weber, M.; Kaspar, C.; Korachi, M.; Vieira, A.R. Early Childhood Caries Is Associated with Genetic Variants in Enamel Formation and Immune Response Genes. Caries Res. 2015, 49, 70–77. [Google Scholar] [CrossRef] [Green Version]
  11. Wendell, S.; Wang, X.; Brown, M.; Cooper, M.; DeSensi, R.; Weyant, R.; Crout, R.; McNeil, D.; Marazita, M. Taste Genes Associated with Dental Caries. J. Dent. Res. 2010, 89, 1198–1202. [Google Scholar] [CrossRef]
  12. Patir, A.; Seymen, F.; Yildirim, M.; Deeley, K.; Cooper, M.; Marazita, M.; Vieira, A. Enamel Formation Genes Are Associated with High Caries Experience in Turkish Children. Caries Res. 2008, 42, 394–400. [Google Scholar] [CrossRef] [Green Version]
  13. Werneck, R.; Mira, M.; Trevilatto, P.; Werneck, R. A critical review: An overview of genetic influence on dental caries. Oral Dis. 2010, 16, 613–623. [Google Scholar] [CrossRef] [PubMed]
  14. Gerreth, K.; Zaorska, K.; Zabel, M.; Borysewicz-Lewicka, M.; Nowicki, M. Association of ENAM gene single nucleotide polymorphisms with dental caries in Polish children. Clin. Oral Investig. 2016, 20, 631–636. [Google Scholar] [CrossRef] [PubMed] [Green Version]
  15. Gerreth, K.; Zaorska, K.; Zabel, M.; Borysewicz-Lewicka, M.; Nowicki, M. Chosen single nucleotide polymorphisms (SNPs) of enamel formation genes and dental caries in a population of Polish children. Adv. Clin. Exp. Med. 2017, 26, 899–905. [Google Scholar] [CrossRef]
  16. Tannure, P.N.; Küchler, E.C.; Lips, A.; Costa, M.D.C.; Luiz, R.R.; Granjeiro, J.M.; Vieira, A.R. Genetic variation in MMP20 contributes to higher caries experience. J. Dent. 2012, 40, 381–386. [Google Scholar] [CrossRef] [Green Version]
  17. Kastovsky, J.; Linhartova, P.B.; Musilova, K.; Zackova, L.; Kukletova, M.; Kukla, L.; Holla, L.I. Lack of Association between BMP2/DLX3 Gene Polymorphisms and Dental Caries in Primary and Permanent Dentitions. Caries Res. 2017, 51, 590–595. [Google Scholar] [CrossRef]
  18. Neto, O.L.C.; Reis, M.F.; De Sabóia, T.M.; Tannure, P.N.; Antunes, L.S.; Antonio, A.G. Clinical and Genetic Analysis of a Nonsyndromic Oligodontia in a Child. Case Rep. Dent. 2014, 2014, 1–5. [Google Scholar] [CrossRef] [Green Version]
  19. Sadikoglu, I.S. White Spot Lesions: Recent Detection and Treatment Methods. Cyprus J. Med. Sci. 2020, 5, 260–266. [Google Scholar] [CrossRef]
  20. Azevedo, M.S.; Romano, A.R.; Correa, M.B.; Santos, I.D.S.D.; Cenci, M.S. Evaluation of a feasible educational intervention in preventing early childhood caries. Braz. Oral Res. 2015, 29, 1–8. [Google Scholar] [CrossRef] [PubMed] [Green Version]
  21. Feldens, C.A.; Giugliani, E.R.J.; Duncan, B.B.; Drachler, M.D.L.; Vítolo, M.R. Long-term effectiveness of a nutritional program in reducing early childhood caries: A randomized trial. Community Dent. Oral Epidemiol. 2010, 38, 324–332. [Google Scholar] [CrossRef]
  22. Gerreth, K.; Zaorska, K.; Zabel, M.; Nowicki, M.; Borysewicz-Lewicka, M. Significance of genetic variations in developmental enamel defects of primary dentition in Polish children. Clin. Oral Investig. 2017, 22, 321–329. [Google Scholar] [CrossRef] [PubMed] [Green Version]
  23. Bagos, P.G. Genetic model selection in genome-wide association studies: Robust methods and the use of meta-analysis. Stat. Appl. Genet. Mol. Biol. 2013, 12, 285–308. [Google Scholar] [CrossRef]
  24. Balding, D.J. A tutorial on statistical methods for population association studies. Nat. Rev. Genet. 2006, 7, 781–791. [Google Scholar] [CrossRef] [PubMed]
  25. Wu, H.; Zhou, Y.; Luo, Q.; Basset, M.A. Training Feedforward Neural Networks Using Symbiotic Organisms Search Algorithm. Comput. Intell. Neurosci. 2016, 2016, 1–14. [Google Scholar] [CrossRef]
  26. Goh, A. Back-propagation neural networks for modeling complex systems. Artif. Intell. Eng. 1995, 9, 143–151. [Google Scholar] [CrossRef]
  27. Javed, S.; Zakirulla, M.; Baig, R.U.; Asif, S.; Meer, A.B. Development of artificial neural network model for prediction of post-streptococcus mutans in dental caries. Comput. Methods Programs Biomed. 2020, 186, 105198. [Google Scholar] [CrossRef]
  28. Mejàre, I.; Axelsson, S.; Dahlén, G.; Espelid, I.; Norlund, A.; Tranæus, S.; Twetman, S. Caries risk assessment. A systematic review. Acta Odontol. Scand. 2014, 72, 81–91. [Google Scholar] [CrossRef]
  29. Kalhan, T.; Lam, C.U.; Karunakaran, B.; Chay, P.; Chng, C.; Nair, R.; Lee, Y.; Fong, M.; Chong, Y.; Kwek, K.; et al. Caries Risk Prediction Models in a Medical Health Care Setting. J. Dent. Res. 2020, 99, 787–796. [Google Scholar] [CrossRef]
  30. Shimizu, T.; Ho, B.; Deeley, K.; Briseño-Ruiz, J.; Faraco, I.M.; Schupack, B.I.; Brancher, J.A.; Pecharki, G.D.; Küchler, E.C.; Tannure, P.N.; et al. Enamel Formation Genes Influence Enamel Microhardness Before and After Cariogenic Challenge. PLoS ONE 2012, 7, e45022. [Google Scholar] [CrossRef] [Green Version]
  31. Divaris, K. Predicting Dental Caries Outcomes in Children. J. Dent. Res. 2016, 95, 248–254. [Google Scholar] [CrossRef]
  32. Vieira, A.; Marazita, M.; Goldstein-McHenry, T. Genome-wide Scan Finds Suggestive Caries Loci. J. Dent. Res. 2008, 87, 435–439. [Google Scholar] [CrossRef]
  33. Shaffer, J.; Wang, X.; Feingold, E.; Lee, M.; Begum, F.; Weeks, D.; Cuenco, K.; Barmada, M.; Wendell, S.; Crosslin, D.; et al. Genome-wide Association Scan for Childhood Caries Implicates Novel Genes. J. Dent. Res. 2011, 90, 1457–1462. [Google Scholar] [CrossRef] [Green Version]
  34. Lewis, D.D.; Shaffer, J.R.; Feingold, E.; Cooper, M.; Vanyukov, M.M.; Maher, B.S.; Slayton, R.L.; Willing, M.C.; Reis, S.E.; McNeil, D.W.; et al. Genetic Association ofMMP10, MMP14, andMMP16with Dental Caries. Int. J. Dent. 2017, 2017, 1–7. [Google Scholar] [CrossRef] [Green Version]
  35. Fontana, M.; Carrasco-Labra, A.; Spallek, H.; Eckert, G.; Katz, B. Improving Caries Risk Prediction Modeling: A Call for Action. J. Dent. Res. 2020, 99, 1215–1220. [Google Scholar] [CrossRef]
  36. Holgerson, P.L.; Twetman, S.; Stecksèn-Blicks, C. Validation of an age-modified caries risk assessment program (Cariogram) in preschool children. Acta Odontol. Scand. 2009, 67, 106–112. [Google Scholar] [CrossRef]
  37. Staszczyk, M.; Kępisty, M.; Kołodziej, I.; Kościelniak, D.; Gregorczyk-Maga, I.; Ciepły, J.; Jurczak, A. Dental caries status and trend in 5-,7-and 12-year-old children from the Małopolskie region in comparison to the Polish population. Nowa Stomatol. 2018, 23, 55–65. [Google Scholar] [CrossRef]
  38. Deeley, K.; Letra, A.; Rose, E.; Brandon, C.; Resick, J.; Marazita, M.; Vieira, A. Possible Association of Amelogenin to High Caries Experience in a Guatemalan-Mayan Population. Caries Res. 2007, 42, 8–13. [Google Scholar] [CrossRef] [PubMed] [Green Version]
  39. Tjäderhane, L.; Larjava, H.; Sorsa, T.; Uitto, V.-J.; Larmas, M.; Salo, T. The Activation and Function of Host Matrix Metalloproteinases in Dentin Matrix Breakdown in Caries Lesions. J. Dent. Res. 1998, 77, 1622–1629. [Google Scholar] [CrossRef]
  40. Liu, C.; Niu, Y.; Zhou, X.; Xu, X.; Yang, Y.; Zhang, Y.; Zheng, L. Cell cycle control, DNA damage repair, and apoptosis-related pathways control pre-ameloblasts differentiation during tooth development. BMC Genom. 2015, 16, 592. [Google Scholar] [CrossRef] [Green Version]
  41. Linhartova, P.B.; Deissova, T.; Kukletova, M.; Holla, L.I. Matrix metalloproteinases gene variants and dental caries in Czech children. BMC Oral Health 2020, 20, 1–8. [Google Scholar] [CrossRef] [PubMed]
  42. Kalia, N.; Sharma, A.; Kaur, M.; Kamboj, S.S.; Singh, J. A comprehensive in silico analysis of non-synonymous and regulatory SNPs of human MBL2 gene. SpringerPlus 2016, 5, 1–14. [Google Scholar] [CrossRef] [Green Version]
  43. Alyousef, Y.M.; Borgio, J.F.; AbdulAzeez, S.; Al-Masoud, N.; Al-Ali, A.A.; Al-Shwaimi, E.; Al-Ali, A.K. Association of MBL2 Gene Polymorphism with Dental Caries in Saudi Children. Caries Res. 2016, 51, 12–16. [Google Scholar] [CrossRef]
  44. Wang, X.; Shaffer, J.; Weyant, R.; Cuenco, K.; DeSensi, R.S.; Crout, R.; McNeil, D.; Marazita, M. Genes and Their Effects on Dental Caries May Differ between Primary and Permanent Dentitions. Caries Res. 2010, 44, 201–208. [Google Scholar] [CrossRef] [PubMed] [Green Version]
  45. Bouwman, L.H.; Roep, B.O.; Roos, A. Mannose-Binding Lectin: Clinical Implications for Infection, Transplantation, and Autoimmunity. Hum. Immunol. 2006, 67, 247–256. [Google Scholar] [CrossRef] [PubMed]
  46. Wang, X.; Willing, M.C.; Marazita, M.L.; Wendell, S.; Warren, J.J.; Broffitt, B.; Smith, B.; Busch, T.; Lidral, A.C.; Levy, S.M. Genetic and Environmental Factors Associated with Dental Caries in Children: The Iowa Fluoride Study. Caries Res. 2012, 46, 177–184. [Google Scholar] [CrossRef] [Green Version]
  47. Antunes, L.A.; Küchler, E.C.; Lopes, L.B.; Moura, A.; Bigonha, R.S.; Abreu, F.V.; Granjeiro, J.M.; Amorim, L.M.D.F.; Paixão, I.C.N.P. Analysis of the association between polymorphisms in MMP2, MMP3, MMP9, MMP20, TIMP1, and TIMP2 genes with white spot lesions and early childhood caries. Int. J. Paediatr. Dent. 2015, 26, 310–319. [Google Scholar] [CrossRef]
  48. Proc, P.; Filipińska-Skąpska, R.; Wochna-Sobańska, M. Dental caries in children up to the age of 5 from Lodz. III. Etiological factors of caries. Dent. Med. Probl. 2006, 43, 65–70. [Google Scholar]
  49. Szczepańska, J.; Szydłowska, B.; Lubowiedzka, B.; Pawłowska, E. Analysis of risk factors for caries in 3-year old children. Czas. Stomatol. 2007, LX, 162–170. [Google Scholar]
  50. Kim, H.-J. Caries prediction model according to influencing factors on dental caries. Int. J. Clin. Prev. Dent. 2009, 5, 177–196. [Google Scholar]
  51. Tagliaferro, E.P.D.S.; Ambrosano, G.M.B.; Meneghim, M.D.C.; Pereira, A.C. Risk indicators and risk predictors of dental caries in schoolchildren. J. Appl. Oral Sci. 2008, 16, 408–413. [Google Scholar] [CrossRef]
  52. Greenwell, A.L.; Johnsen, D.; Disantis, T.A.; Gerstenmaier, J.; Limbert, N. Longitudinal evaluation of caries patterns form the primary to the mixed dentition. Pediatr. Dent. 1990, 12, 278–282. [Google Scholar] [PubMed]
  53. Gizani, S.; Vinckier, F.; Declerck, D. Caries pattern and oral health habits in 2- to 6-year-old children exhibiting differing levels of caries. Clin. Oral Investig. 1999, 3, 35–40. [Google Scholar] [CrossRef] [PubMed]
  54. Du, M.; Bian, Z.; Guo, L.; Holt, R.; Champion, J.; Bedi, R. Caries patterns and their relationship to infant feeding and socio-economic status in 2–4-year-old Chinese children. Int. Dent. J. 2000, 50, 385–389. [Google Scholar] [CrossRef]
  55. Agarwal, D.; Reddy, C.; Machale, P. Early Childhood Caries Prevalence, Severity and Pattern in 3–6 Year Old Preschool Children of Mysore City, Karnataka. Pesqui. Bras. Odontopediatria Clínica Integr. 2012, 12, 561–565. [Google Scholar] [CrossRef]
  56. Masumo, R.; Bardsen, A.; Mashoto, K.; Astrom, A.N. Prevalence and socio-behavioral influence of early childhood caries, ECC, and feeding habits among 6–36 months old children in Uganda and Tanzania. BMC Oral Health 2012, 12, 24. [Google Scholar] [CrossRef] [Green Version]
  57. Bagińska, J.; Stokowska, W. Caries location in particular primary teeth in 36–48 months old children in Podlasie region. Nowa. Stomatol. 2004, 4, 147–152. [Google Scholar]
  58. Vieira, A.R.; Deeley, K.B.; Callahan, N.F.; Noel, J.B.; Anjomshoaa, I.; Carricato, W.M.; Schulhof, L.P.; DeSensi, R.S.; Gandhi, P.; Resick, J.M.; et al. Detection ofStreptococcus mutansGenomic DNA in Human DNA Samples Extracted from Saliva and Blood. ISRN Dent. 2011, 2011, 1–6. [Google Scholar] [CrossRef] [Green Version]
  59. Thitasomakul, S.; Piwat, S.; Thearmontree, A.; Chankanka, O.; Pithpornchaiyakul, W.; Madyusoh, S. Risks for Early Childhood Caries Analyzed by Negative Binomial Models. J. Dent. Res. 2009, 88, 137–141. [Google Scholar] [CrossRef]
  60. Fontana, M.; Eckert, G.; Keels, M.; Jackson, R.; Katz, B.; Kemper, A.; Levy, B.; Levy, S.; Yanca, E.; Kelly, S.; et al. Predicting Caries in Medical Settings: Risk Factors in Diverse Infant Groups. J. Dent. Res. 2019, 98, 68–76. [Google Scholar] [CrossRef]
  61. Tamaki, Y.; Nomura, Y.; Katsumura, S.; Okada, A.; Yamada, H.; Tsuge, S.; Kadoma, Y.; Hanada, N. Construction of a dental caries prediction model by data mining. J. Oral Sci. 2009, 51, 61–68. [Google Scholar] [CrossRef] [Green Version]
  62. Stewart, P.; Stamm, J. Classification Tree Prediction Models for Dental Caries from Clinical, Microbiological, and Interview Data. J. Dent. Res. 1991, 70, 1239–1251. [Google Scholar] [CrossRef] [PubMed]
  63. Liu, L.; Wu, W.; Zhang, S.-Y.; Zhang, K.-Q.; Li, J.; Liu, Y.; Yin, Z.-H. Dental Caries Prediction Based on a Survey of the Oral Health Epidemiology among the Geriatric Residents of Liaoning, China. BioMed Res. Int. 2020, 2020, 1–12. [Google Scholar] [CrossRef]
  64. So, H.-C.; Sham, P.C. A Unifying Framework for Evaluating the Predictive Power of Genetic Variants Based on the Level of Heritability Explained. PLoS Genet. 2010, 6, e1001230. [Google Scholar] [CrossRef] [PubMed] [Green Version]
  65. Gansky, S.A. Dental Data Mining: Potential Pitfalls and Practical Issues. Adv. Dent. Res. 2003, 17, 109–114. [Google Scholar] [CrossRef] [PubMed]
  66. Khan, M.T.; Kaushik, A.C.; Ji, L.; Malik, S.I.; Ali, S.; Wei, D.-Q. Artificial Neural Networks for Prediction of Tuberculosis Disease. Front. Microbiol. 2019, 10, 395. [Google Scholar] [CrossRef]
  67. Mantzaris, D.H.; Anastassopoulos, G.C.; Lymberopoulos, D.K. Medical disease prediction using Artificial Neural Networks. In Proceedings of the 2008 8th IEEE International Conference on BioInformatics and BioEngineering, Athens, Greece, 8–10 October 2008; pp. 1–6. [Google Scholar]
  68. Muhammad, W.; Hart, G.R.; Nartowt, B.; Farrell, J.J.; Johung, K.; Liang, Y.; Deng, J. Pancreatic Cancer Prediction Through an Artificial Neural Network. Front. Artif. Intell. 2019, 2, 2. [Google Scholar] [CrossRef] [Green Version]
  69. Midi, H.; Sarkar, S.; Rana, S. Collinearity diagnostics of binary logistic regression model. J. Interdiscip. Math. 2010, 13, 253–267. [Google Scholar] [CrossRef]
  70. Lin, W.-Y.; Huang, C.-C.; Liu, Y.-L.; Tsai, S.-J.; Kuo, P.-H. Genome-Wide Gene-Environment Interaction Analysis Using Set-Based Association Tests. Front. Genet. 2019, 9, 715. [Google Scholar] [CrossRef]
  71. Liu, C.-Y.; Maity, A.; Lin, X.; Wright, R.O.; Christiani, D.C. Design and analysis issues in gene and environment studies. Environ. Health 2012, 11, 93. [Google Scholar] [CrossRef] [Green Version]
  72. Traylor, M.; Markus, H.; Lewis, C.M. Homogeneous case subgroups increase power in genetic association studies. Eur. J. Hum. Genet. 2014, 23, 863–869. [Google Scholar] [CrossRef] [Green Version]
  73. Zeggini, E.; Morris, A. (Eds.) Analysis of Complex Disease Association Studies; A Practical Guide; Academic Press: Cambridge, MA, USA, 20 October 2010. [Google Scholar]
  74. Jiao, S.; Hsu, L.; Bézieau, S.; Brenner, H.; Chan, A.T.; Chang-Claude, J.; Le Marchand, L.; Lemire, M.; Newcomb, P.A.; Slattery, M.L.; et al. SBERIA: Set-Based Gene-Environment Interaction Test for Rare and Common Variants in Complex Diseases. Genet. Epidemiol. 2013, 37, 452–464. [Google Scholar] [CrossRef]
  75. McAllister, K.; Mechanic, L.E.; Amos, C.; Aschard, H.; Blair, I.A.; Chatterjee, N.; Conti, D.; Gauderman, W.J.; Hsu, L.; Hutter, C.M.; et al. Current Challenges and New Opportunities for Gene-Environment Interaction Studies of Complex Diseases. Am. J. Epidemiol. 2017, 186, 753–761. [Google Scholar] [CrossRef] [Green Version]
Figure 1. The receiver operator characteristic (ROC) curve analysis and area under the receiver operating characteristic (AUC) value. The solid black line indicates the ROC curve based on 8 variables, i.e., rs10429371, rs7096206, rs12640848, rs17878486, rs12640848, rs2337360, rs2235091 and rs198969, and the true positives (sensitivity) and false negatives (100-specificity) for caries prediction when compared to the actual data. The dashed lines indicate the ROC curves for 95% Confidence Interval.
Genes 12 00462 g001
Figure 2. Prediction sensitivity for 8 SNPs used as predictors in neural network modeling. The higher the error rate value, the more sensitive the model is to the lack of a variable. The arrangement of the predictors in the figure is shown on the basis of the mean error value for the 6 neural network models (from NN1to NN6).
Genes 12 00462 g002
Table 1. Twenty-two differentiated SNPs analyzed in the current study.
SNPs Analyzed in This Study
SNP IDGeneGene ID 1Chromosome: LocationType of VariantAMINO Acid Change
rs4547741LTF (Lactotransferrin)40573:46458968intron variantC>T
rs7217186ALOX15 (Arachidonate 15-Lipoxygenase)24617:4636097intron variantC>T
rs10429371MMP16 (Matrix Metallopeptidase 16)43258:88981259intron variantC>T
rs7096206MBL2 (Mannose Binding Lectin 2)415310:52771925 intron variantC>G
rs1884302SMAD 6 (SMAD Family Member 6)65020:7125642 intron variantC>T
rs1711437MMP20 (Matrix Metallopeptidase 20)931311:102594495intron variantC>T
rs1784418MMP20 (Matrix Metallopeptidase 20)931311:102613665 intron variantC>T
rs17878486AMELX (Amelogenin X-Linked)265X:11295828 intron variantC>T
rs34538475AMBN (Ameloblastin)2584:70605459 intron variantG>T
rs4694075AMBN (Ameloblastin)2584:70601197intron variantC>T
rs3790506TUFT1 (Tuftelin 1)72861:151565890 intron variantA>G
rs4970957TUFT1 (Tuftelin 1)72861:151544912 intron variantA>G
rs2337360TUFT1 (Tuftelin 1)72861:151542127 intron variantA>G
rs134136TFIP11 (Tuftelin Interacting Protein 11)2414422:26503508 intron variantC>T
rs5997096TFIP11 (Tuftelin Interacting Protein 11)2414422:26499991 intron variantC>T
rs2235091KLK4 (Kallikrein Related Peptidase 4)962219:50907215intron variantA>G
rs198969KLK4 (Kallikrein Related Peptidase 4)962219:50910072 intron variantC>G
rs7671281ENAM (Enamelin)101174:70643369 missense variant C>T, 2 NM_031889.3:c.1943T>C, 3 NP_114095.2:p.Ile648ThrC>T
rs3796704ENAM (Enamelin)101174:70643714 missense variant G>A, NM_031889.3:c.2288G>A, NP_114095.2:p.Arg763GlnA>G
rs12640848ENAM (Enamelin)101174:70640695intron variantA>G
rs144929717ENAM (Enamelin)101174:70632586 intron variantG>A
rs139228330ENAM (Enamelin)101174:70635957 intron variantA>G
Abbreviations: SNP—single nucleotide polymorphism; ID—identification; A—adenine; C—cytosine; G—guanine; T—thymine; Ile—isoleucine; Thr—threonine; Arg—arginine; Gln—glutamine; 1 Gene ID is an accession number from ncbi database (https://0-www-ncbi-nlm-nih-gov.brum.beds.ac.uk/, accessed on 17 January 2021); 2 NM_—prefix for nucleotide position in the reference sequence accessions for mRNA, c.—coding; 3 NP_—prefix for amino acid position in the reference sequence accessions for protein, p—protein.
Table 2. Inclusion and exclusion criteria.
Inclusion CriteriaExclusion Criteria
Study and control group
Age between 20 and 40 months Age under 20 and over 40 months old
Group with the same ethnic, regional, cultural, or demographic originOther ethnic, regional, cultural, or demographic origin
Parental written and informed consent for dental check-up and oral swab collectionNo parental written and informed consent for dental check-up and oral swab collection
Child’s cooperativenessChild’s uncooperativeness
Set of properly filled in child’s dental chart and sample for molecular analysisLack of set of properly filled in child’s dental chart and sample for molecular analysis
Individuals from four nursery schools situated in the city of Poznan (Wielkopolska Province, central-west Poland) that constitute one institution Individuals from other nursery schools than those selected to the research
Children present at nursery school on days of examinationChildren absent at nursery school on days of examination
From 11 to 20 erupted primary teeth present in the oral cavityLess than 11 primary teeth present in the oral cavity
Caucasian originOther than Caucasian origin
Study group
Dental caries present in child’s dentitionLack of dental caries in child’s dentition
Control group
Lack of dental caries in child’s dentitionDental caries present in child’s dentition
Table 3. Genotype and alleles distribution differences for 6 SNPs genotyped in this study between study subgroups (caries vs. caries-free) and between our cohort and CUE data.
GeneSNP IDGenotypesCariesControlTest/Model 1OR [95% CI]p-ValueCEU data
Allelesn (Freq)n (Freq)OR [95% CI]p-Value
LTFrs4547741CC35 (0.73)32 (0.68)CC vs. CT+TT1.3 [0.5–3.1]0.60590.5 [0.2–0.9]0.0288 *
CT12 (0.25)14 (0.3)CT vs. CC+TT0.8 [0.3–1.9]0.60122 [0.9–3.9]0.0605
TT1 (0.02)1 (0.02)TT vs. CC+CT1.0 [0.1–16.1]0.98805.3 [0.3–112.3]0.2826
C82 (0.85)78 (0.83)T vs. C0.8 [0.4–1.8]0.64522.1 [1.1–4.1]0.0209 *
T14 (0.15)16 (0.17)
ALOX15rs7217186CC13 (0.27)13 (0.28)CC vs. CT+TT1.0 [0.4–2.4]0.94982.1 [1–4.3]0.0395 *
CT23 (0.48)21 (0.44)CT vs. CC+TT1.1 [0.5–2.6]0.75190.7 [0.4–1.3]0.2523
TT12 (0.25)13 (0.28)TT vs. CC+CT0.9 [0.4–2.2]0.76860.8 [0.4–1.5]0.5382
C49 (0.51)47 (0.5)T vs. C1.0 [0.5–1.7]0.88580.7 [0.5–1.1]0.1101
T47 (0.49)47 (0.5)
MMP16rs10429371CC18 (0.37)17 (0.36)CC vs. CT+TT1.1 [0.5–2.4]0.893118.7 [5.5–63.4]<0.001 ***
CT20 (0.42)30 (0.64)CT vs. CC+TT0.4 [0.2–0.9]0.0320 *2.7 [1.5–4.8]0.0011 **
TT10 (0.21)0 (0.00)TT vs. CC+CT25.9 [1.5–456.4]0.0262 *0.1 [0.03–0.1]<0.001 ***
C56 (0.58)64 (0.68)T vs. C1.5 [0.8–2.8]0.16450.1 [0.1–0.2]<0.001 ***
T40 (0.42)30 (0.32)
MBL2rs7096206CC31 (0.65)23 (0.49)CC vs. CG+GG1.9 [0.8–4.3]0.12540.9 [0.5–1.7]0.8095
CG16 (0.33)16 (0.34)CG vs. CC+GG1.0 [0.4–2.3]0.94170.8 [0.5–1.5]0.4959
GG1 (0.02)8 (0.17)GG vs. CC+CG0.1 [0.01–0.9]0.0363 *3.5 [0.9–12.8]0.0768
C78 (0.81)62 (0.66)G vs. C 0.0180 *1.3 [0.8–2]0.3473
G18 (0.19)32 (0.34)
SMAD6rs1884302CC9 (0.19)6 (0.13)CC vs. CT+TT1.6 [0.5–4.8]0.42632.5 [1–6.4]0.0616
CT21 (0.44)21 (0.45)CT vs. CC+TT1.0 [0.4–2.2]0.92720.7 0.4–1.3]0.3091
TT18 (0.37)20 (0.42)TT vs. CC+CT0.8 [0.4–1.8]0.61540.9 [0.5–1.7]0.8412
C39 (0.41)33 (0.35)T vs. C0.8 [0.4–1.4]0.43340.8 [0.5–1.2]0.2969
T57 (0.59)61 (0.65)
MMP20rs1711437CC19 (0.4)20 (0.43)CC vs. CT+TT0.9 [0.4–2.0]0.76861.3 [0.7–2.3]0.4143
CT23 (0.48)23 (0.49)CT vs. CC+TT1.0 [0.4–2.1]0.92081 [0.6–1.8]0.9929
TT6 (0.12)4 (0.08)TT vs. CC+CT1.5 [0.4–5.8]0.52870.6 [0.3–1.4]0.2526
C61 (0.64)63 (0.67)T vs. C1.2 [0.6–2.1]0.61460.8 [0.5–1.2]0.2497
T35 (0.36)31 (0.33)
The total number of individuals with caries n = 48, and controls n = 47. Abbreviations: SNP—single nucleotide polymorphism; ID—identification; OR—odds ratio; 95% CI—the 95% Confidence Interval; CEU—Utah residents with Northern and Western European ancestry, from the International HapMap Project; LTF—Lactotransferrin; ALOX15—Arachidonate 15-Lipoxygenase; MMP16—Matrix Metallopeptidase 16; MBL2—Mannose Binding Lectin 2; SMAD6—SMAD Family Member 6; MMP20—Matrix Metallopeptidase 20; C—cytosine; G—guanine; T—thymine.1 The odds ratio (OR) values with corresponding p-values were assessed by the Fisher’s exact test for the inheritance models: dominant AA vs. AB+BB; over-dominant AB vs. AA+BB; recessive BB vs. AA+AB; allelic A vs. B. p-values: p < 0.05 *, p < 0.01 **, p < 0.001 ***; all significant results are shown in bold.
Table 4. Cochran–Armitage test for trend analysis for 22 differentiated single nucleotide polymorphisms analyzed in this study.
SNP IDCochran–Armitage Test for Trend
Chi2p-Value
rs45477410.2190.6400
rs72171860.0190.8898
rs104293712.2340.1350
rs70962065.0630.0244 *
rs18843020.5790.4469
rs17114370.2720.6019
rs1787848635.991<0.0001 ***
rs345384751.7790.1823
rs46940752.4940.1143
rs37905061.5100.2191
rs49709571.8850.1698
rs233736023.599<0.0001 ***
rs1341360.2300.6316
rs59970960.1300.7182
rs22350916.7820.0092 **
rs1989699.5860.0020 **
rs17844180.5840.4447
rs76712810.00130.9712
rs37967040.04920.8245
rs1264084811.3430.0008 ***
rs1449297170.04920.8245
rs1392283300.04920.8245
Abbreviations: SNP—single nucleotide polymorphism; ID—identification; significant p-value indicates additive model of inheritance, i.e., the possibility of heterozygote advantage. p-values: p < 0.05 *, p < 0.01 **, p < 0.001 ***; all significant results are shown in bold.
Table 5. Haplotypes distribution in caries and caries-free individuals in this study.
SNPs (Gene)HaplotypesFrequencyOR [95% CI]p-Value
CariesControls
rs34538475_rs4694075GC0.5030.1088.4 [3.9–18.0]<0.0001 *** (3.86 × 10⁻⁹)
(AMBN)GT0.2360.2001.2 [0.6–2.5]0.5501
TC0.0380.3170.1 [0.03–0.3]<0.0001 *** (4.65 × 10⁻⁷)
TT0.2220.3740.5 [0.3–0.9]0.0220 *
rs2337360_rs4970957_rs3790506A A A0.1290.2940.4 [0.2–0.8]0.0054 **
(TUFT1)A A G0.4120.2652.0 [1.1–3.6]0.0314 *
A G G0.2840.03710.21 [3.2–32.4]<0.0001 *** (4.01 × 10⁻⁶)
G A G0.0740.1970.3 [3.2–32.4]0.0131 *
G G A0.0000.015-0.2322
G G G0.0000.192-<0.0001 *** (6.36 × 10⁻⁶)
A G A0.0390.000-0.0547
G A A0.0610.000-0.0147 *
rs134136_rs5997096CC0.5730.6060.9 [0.5–1.0]0.6392
(TFIP11)TC0.3020.2871.1 [0.6–2.0]0.8225
TT0.1250.1061.2 [0.5–2.9]0.6884
rs2235091_rs198969AC0.4320.6700.4 [0.2–0.7]0.0007 ***
(KLK4)AG0.1810.1181.7 [0.7–3.8]0.2191
GC0.1080.0751.5 [0.6–4.1]0.4273
GG0.2880.1382.5 [1.2–5.8]0.0118 *
rs7671281_rs3796704_rs12640848_rs144929717_rs139228330CAAGA0.5000.3092.2 [1.2–4.1]0.0072 **
(ENAM)CAGGA0.4370.6490.4 [0.2–0.8]0.0035 **
TGAAG0.0410.0431.0 [0.2–4.0]0.9644
TGGAG0.0000.000--
CAAAG0.0110.000-0.3167
TGAGA0.0000.000--
TGGGA0.0100.000-0.3234
rs1711437_rs1784418CC0.6140.6171.0 [0.6–1.8]0.9614
(MMP20)CT0.0220.0530.4 [0.1–2.0]0.2540
TT0.3220.3301.0 [0.5–1.8]0.9081
TC 0.0430.000-0.0432 *
The total number of individuals with caries n=48, and controls n=47. Abbreviations: SNPs—single nucleotide polymorphisms; OR—odds ratio; 95% CI—the 95% Confidence Interval; AMBN—Ameloblastin; TUFT1—Tuftelin 1; TFIP11—Tuftelin Interacting Protein 11; KLK4—Kallikrein Related Peptidase 4; ENAM—enamelin; MMP20—Matrix Metallopeptidase 20; A—adenine, C—cytosine; G—guanine; T—thymine; p-values: p < 0.05 *, p < 0.01 **, p < 0.001 ***; all significant results are shown in bold.
Table 6. The performance of univariable logistic regression analysis.
PredictorCoefficient of Determination R2p-ValueAUC [95% CI] p-ValueSensitivity/Specificity/Total Number of Correct CallsStatistical Significant Genotypes Distribution 1
rs45477410.00390.87030.525 [0.420–0.628]0.61772.9%/31.9%/52.6%-
rs72171860.02010.69640.524 [0.419–0.627]0.89148%/55.3%/51.6%-
rs104293710.20540.0004 ***0.560 [0.544–0.744]0.26858.3%/63.8%/61.1%+
rs70962060.08520.0435 *0.599 [0.494–0.699]0.053164.6%/51.1%/57.9%+
rs18843020.00980.70510.539 [0.434–0.642]0.474262.5%/42.6%/52.6%-
rs17114370.00590.81150.525 [0.420–0.628]0.642612.5%/91.5%/51.6%-
rs178784860.4695<0.0001 ***0.830 [0.739–0.899]<0.0001 ***62.5%/93.6%/77.9%+
rs345384750.03270.12980.571 [0.465–0.672]0.125335.4%/78.7%/56.8%+
rs46940750.02990.14230.582 [0.476–0.682]0.140475%/38.3%/56.8%-
rs37905060.02120.21770.559 [0.453–0.660]0.266158.3%/51.1%/54.7%-
rs49709570.02640.16830.580 [0.475–0.681]0.123762.5%/55.3%/59%-
rs23373600.3813<0.0001 ***0.781 [0.685–0.860]<0.0001 ***75%/89%/77.9%+
rs1341360.00320.63140.527 [0.422–0.630]0.625168.8%/36.2%/52.6%-
rs59970960.00260.66690.519 [0.414–0.622]0.669925%/78.7%/51.6%-
rs22350910.13170.0072 **0.625 [0.520–0.723]0.0152 *20.8%/97.9%/59%+
rs1989690.16350.0020 **0.658 [0.554–0.752]0.0017 **70.8%/51.1%/61.1%+
rs17844180.00500.54980.535 0.430–0.638]0.516841.7%/66%/53.7%-
rs76712810.00140.75090.510 [0.405–0.614]0.7533100%/0%/50.5%-
rs37967040.00140.75090.510 [0.405–0.614]0.7533100%/0%/50.5%-
rs126408480.20160.0004 ***0.672 [0.568–0.765]<0.0001 ***93.8%/38.3%/66.3%+
rs1449297170.00140.75090.510 [0.405–0.614]0.7533100%/0%/50.5%-
rs1392283300.00140.75090.510 [0.405–0.614]0.7533100%/0%/50.5%-
Age0.00500.49760.548 [0.443–0.807]0.419539.6%/74.5%/56.8%-
Number of all teeth erupted0.01040.38820.563 [0.457–0.664]0.245464.6%/51.1%/57.9%-
Nr of incisors0.01920.24080.510 [0.406–0.614]0.31732.1%/100%/50.5%-
Nr of canines0.00190.71040.529 [0.424–0.632]0.280310.4%/95.7%/52.6%-
Nr of molars0.02350.19400.572 [0.467–0.673]0.170264.6%/51.7%/57.9%-
Abbreviations: AUC—area under the receiver operating characteristic; 95% CI—the 95% Confidence Interval; 1 the column depicts variables that were statistically significant (+) or insignificant (−) for the differences in genotype/allele distribution in caries vs. caries-free individuals in the previous studies [14,15] and/or in univariable logistic regression and/or ROC curve analysis in this study. p-values: p < 0.05 *, p < 0.01 **, p < 0.001 ***; all significant results are shown in bold.
Table 7. The overall performance of multivariable logistic regression analysis.
Test
Overall model evaluation
Null model-2 Log Likelihood131.69
Full model-2 Log Likelihood42.09
Chi289.59
df15
p-value<0.0001 ***
Cox and Snell R20.6106
Negelkerke R20.8141
Goodness-of-fit test
Hosmer and Lemeshow test:
Chi21.58
df7
p-value0.9793
Abbreviations: df—degrees of freedom; Cox and Snell R2 and Negelkerke R2—pseudo R2s that indicate how well the model explains the data; for both coefficients, the closer the value is to “1”, the better the model. Hosmer and Lemeshow test—explains how well the data fit the model; the closer the value is to “1”, the better the data are fitted. p-values: p < 0.001 ***.
Table 8. The multivariable logistic regression analysis.
Predictorβ CoefficientSEβWald’s Chi2dfp-Valueeβ (Odds Ratio)[95% CI]
Intercept0.0210.2050.01110.9181.021-
rs10429371_CC1.1011.041.1320.28823.01[0.39–22.94]
rs10429371_TT34.492813,615.646.42 × 10−610.9989.55 × 1014-
rs7096206_CG−0.67511.060.4110.5230.51[0.06–4.04]
rs7096206_GG−19.45248976.374.69 × 10−610.99833.56 × 10−9-
rs34538475_GT0.14131.090.0210.89691.15[0.14–9.77]
rs17878486_CT1.69451.092.4110.12075.44[0.64–46.28]
rs17878486_TT5.43551.6311.1510.0008 ***229.41[9.45–5576.54]
rs2337360_AA3.15151.18.2920.0040 **23.37[2.73–199.80]
rs2337360_GG19.713842,999.262.10 × 10−710.99963.64 × 108-
rs2235091_AG1.13511.011.2610.26233.11[0.43–22.64]
rs2235091_GG1.70721.661.0610.30255.51[0.22–141.52]
rs198969_CC−0.24731.030.0620.8110.78[0.10–5.93]
rs198969_GG1.04571.720.3710.5422.85[0.10–82.01]
rs12640848_AA0.21351.080.0420.84321.24[0.15–10.26]
rs12640848_GG−3.77761.844.2110.0401 *0.02[0.001–0.84]
Constatnt−3.91251.685.4410.0197 *--
Abbreviations: SNPs—single nucleotide polymorphisms; SE—standard error; df—degrees of freedom; 95% CI—the 95% Confidence Interval; A—adenine, C—cytosine, G—guanine, T—thymine. Intercept represents the regression constant in the model without predictors; p-values: p < 0.05 *, p < 0.01 **, p < 0.001 ***; all significant results are shown in bold.
Table 9. The overall performance for 6 neural network models for caries prediction.
Neural Network IDTrainTestValidationLearning Algorithm 1Error Rate Function 2Activation Function (Hidden Layers)Activation Function (Output Layer)
AccuracyErrorAccuracyErrorAccuracyError
NN10.9700.0070.9840.0040.7360.084BFGS 28SOSTanhTanh
NN20.8050.0440.9090.0210.8720.037BFGS 5SOSExponentialExponential
NN30.8400.0370.9440.0160.8540.038BFGS 4SOSLinearLogistic
NN40.8420.0360.9350.0170.8530.038BFGS 4SOSTanhLogistic
NN50.8240.0400.9620.0120.8590.041BFGS 7SOSLogisticLogistic
NN60.8670.0310.9120.0220.8620.038BFGS 10SOSTanhExponential
Abbreviations: ID—identification; NN—neural network; 1 The Broyden–Fletcher–Goldfarb–Shanno (BFGS) algorithm; 2 symbiotic organisms search (SOS) error rate.
Publisher’s Note: MDPI stays neutral with regard to jurisdictional claims in published maps and institutional affiliations.

