
Mitochondrial Processes during Early Development of Dictyostelium discoideum: From Bioenergetic to Proteomic Studies

 , and
, and
Abstract
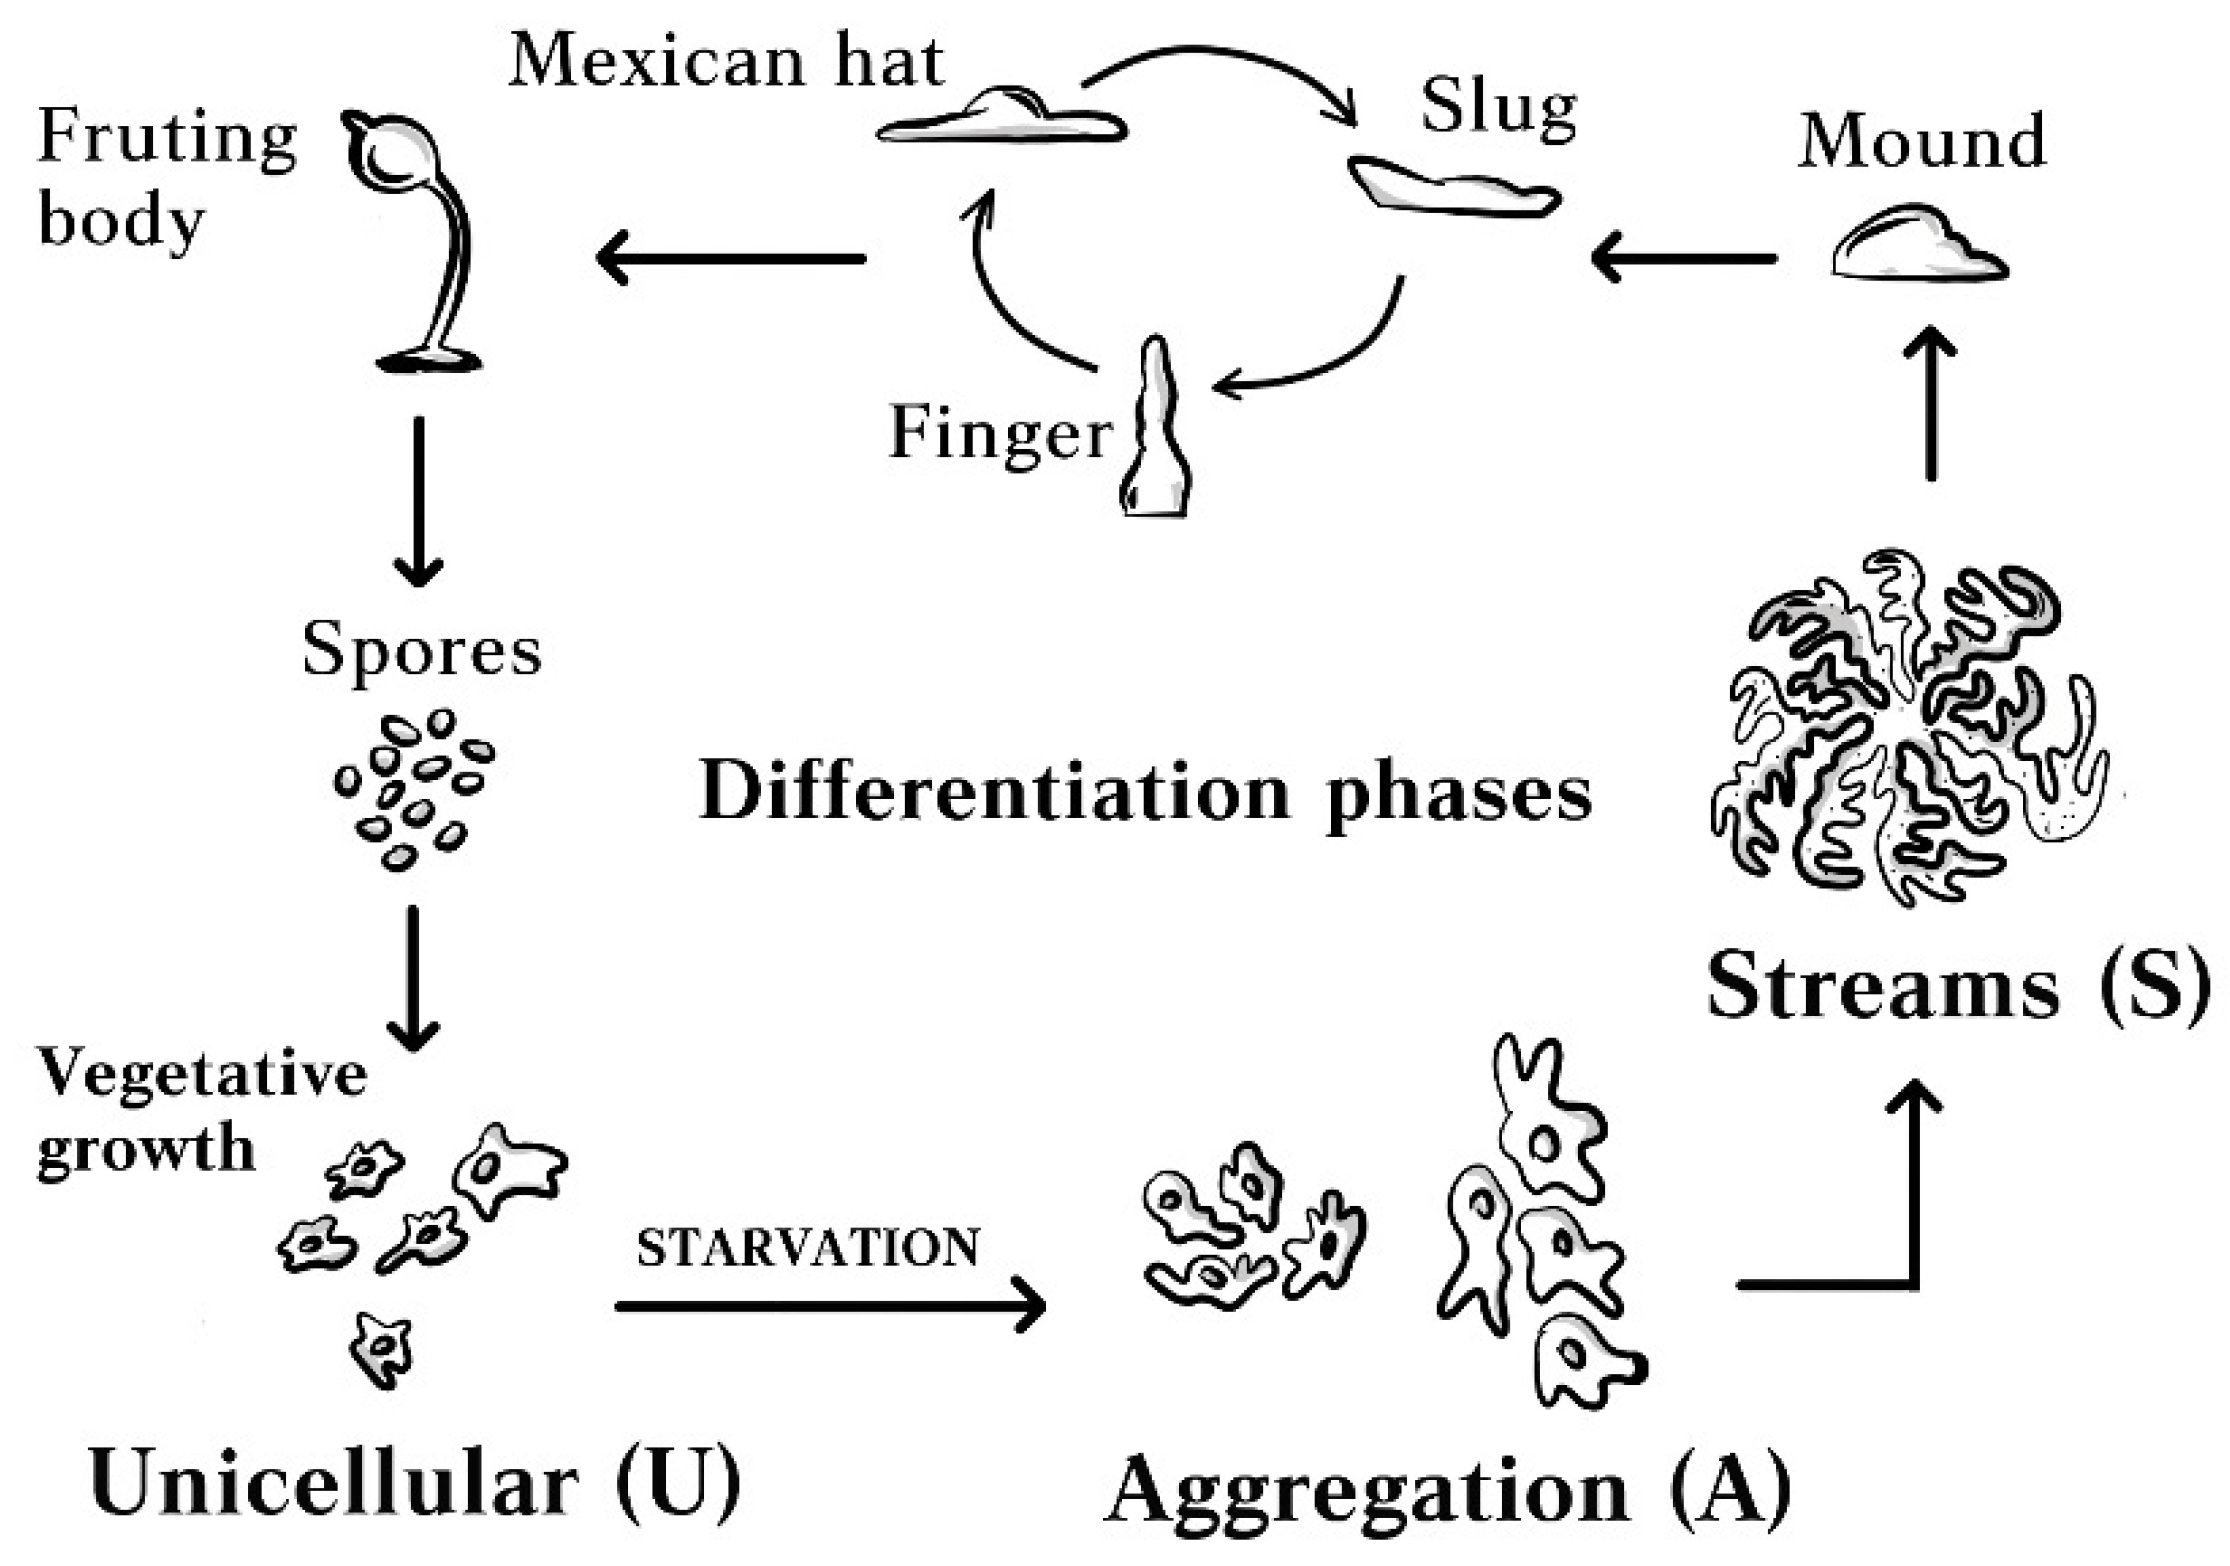
:1. Introduction
2. Methods
2.1. Cell Culture and Mitochondria Isolation
2.2. The Measurements of Cell Respiration and the Status of Mitochondrial Coupling in Intact D. discoideum Cells
2.3. Sample Preparation for Mass Spectrometry Analysis
2.4. Mass Spectrometry
2.5. Data Analysis
3. Results and Discussion
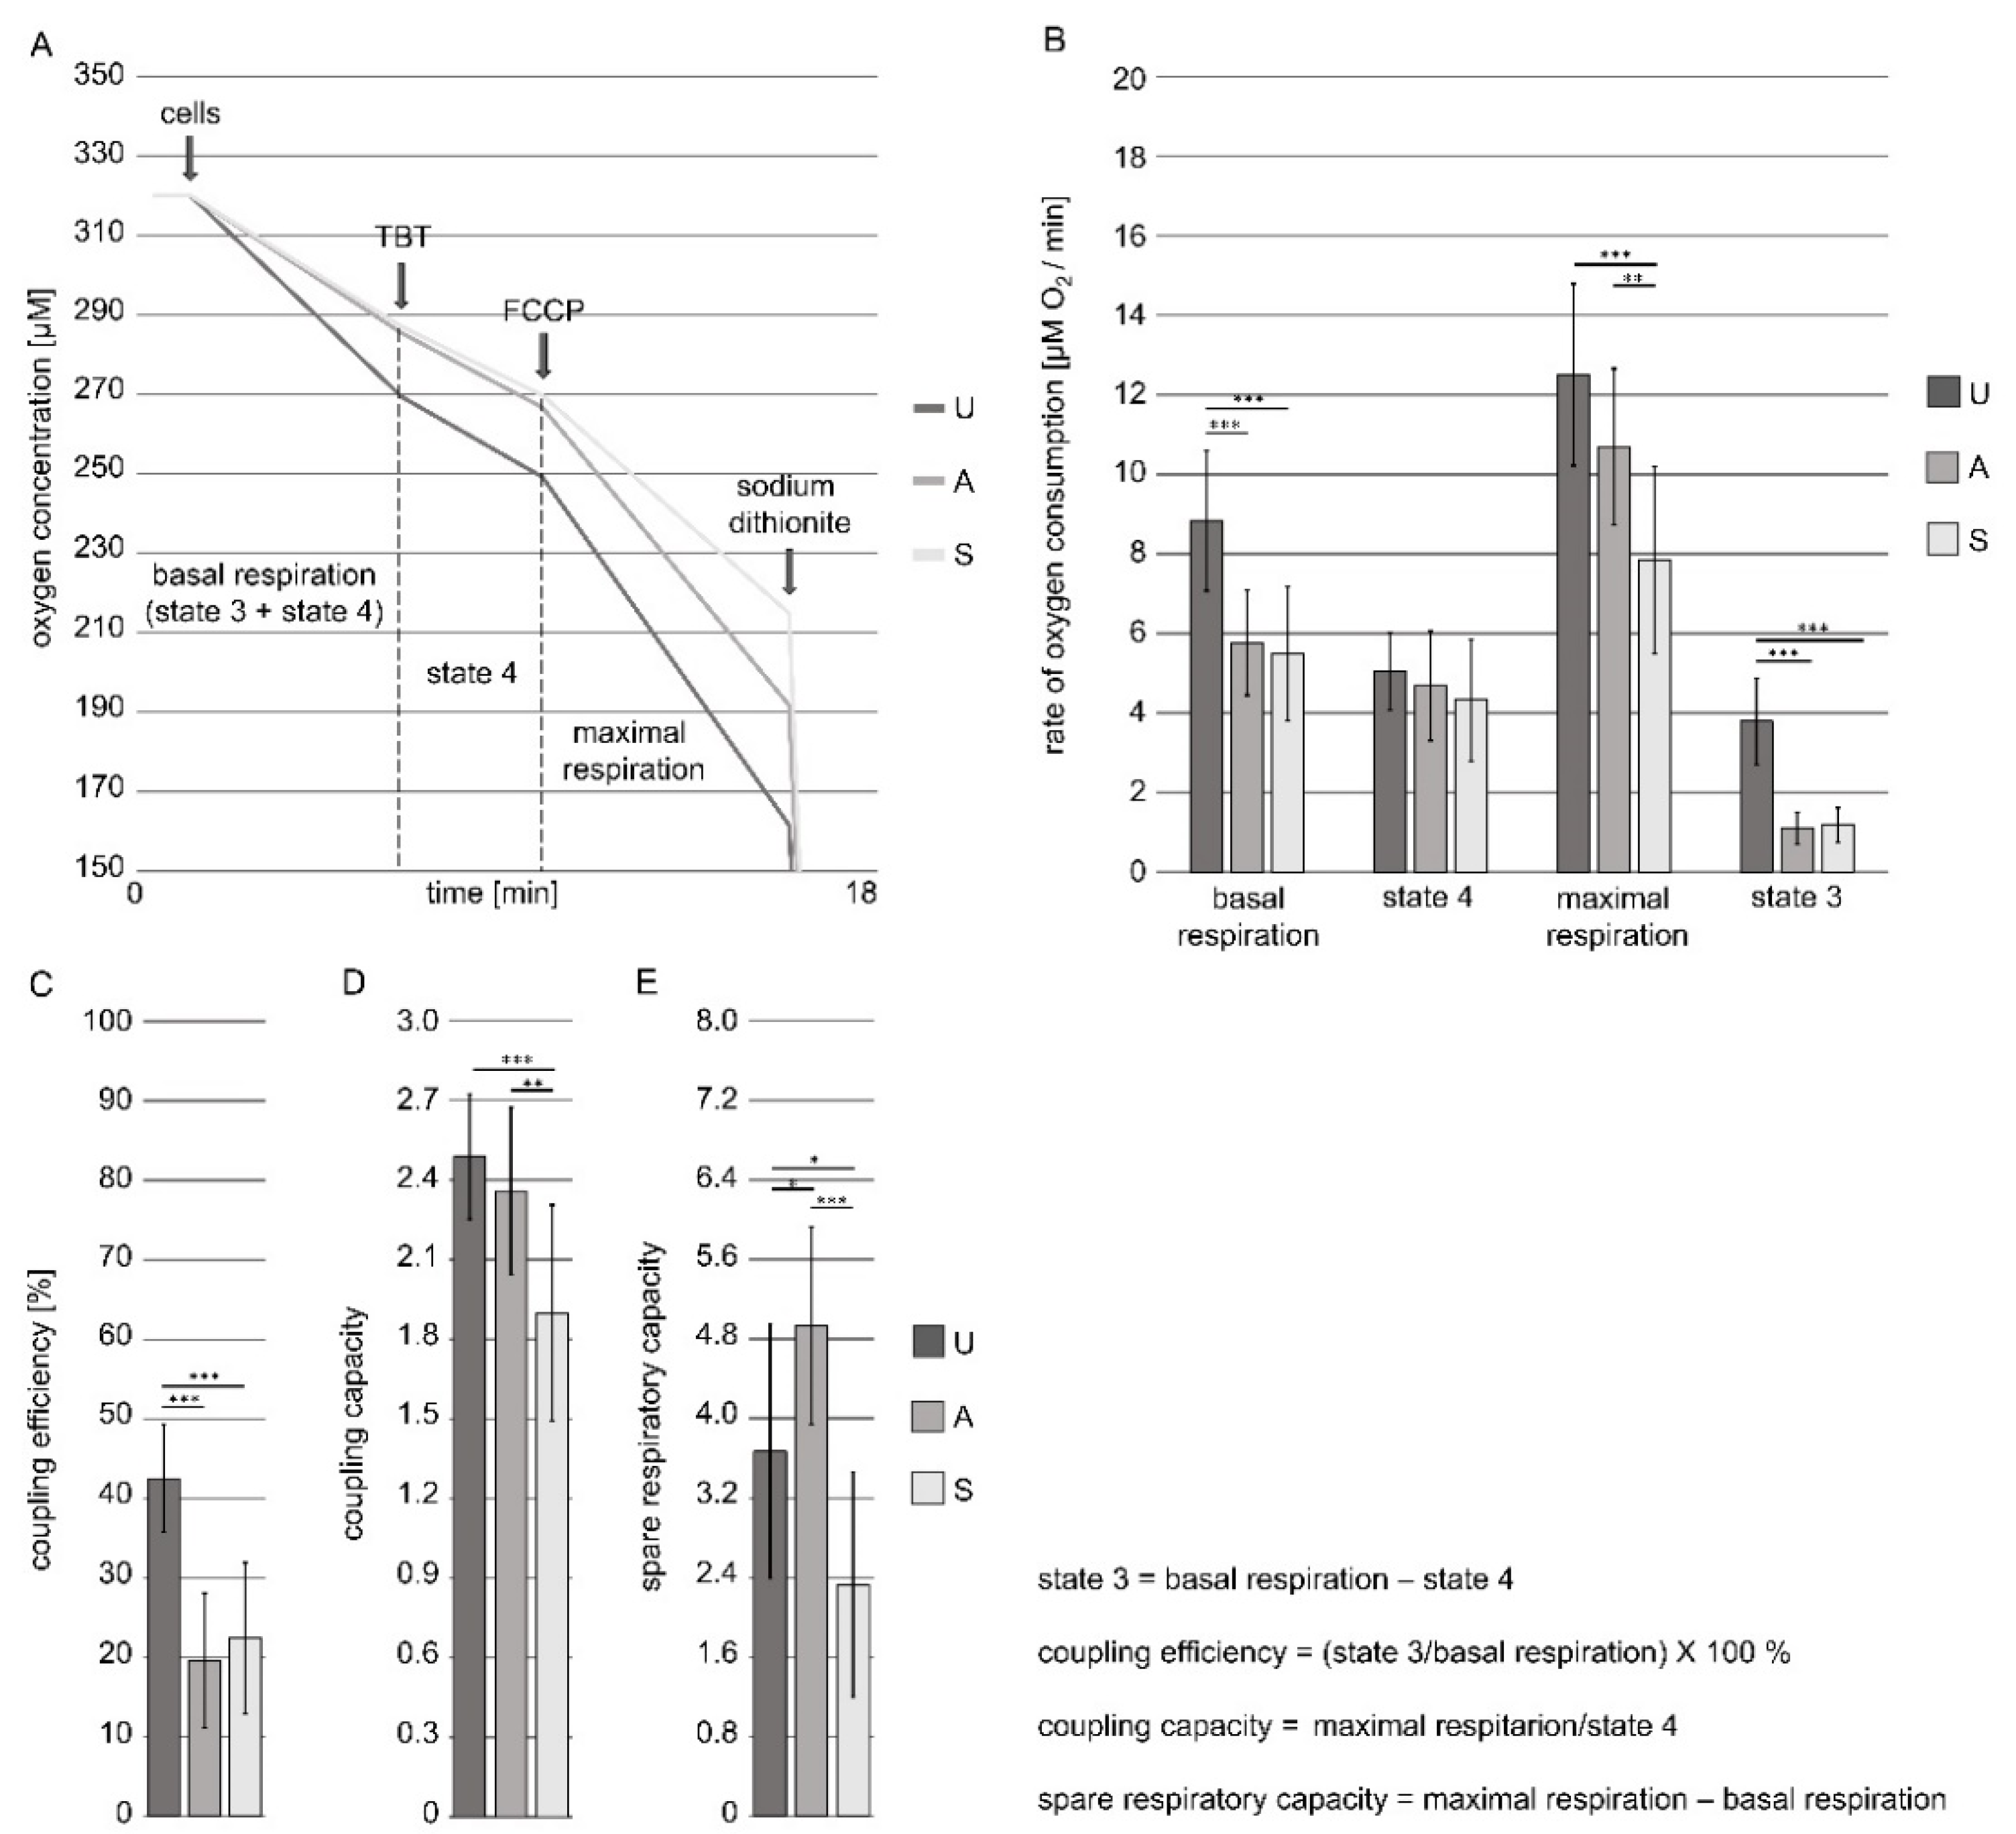
3.1. The Functional Status of Intact D. discoideum Cells’ Mitochondria at the Early Developmental Stages
3.2. Quantitative Comparative Analysis of the Mitochondrial Proteomes of the Early Developmental Stages
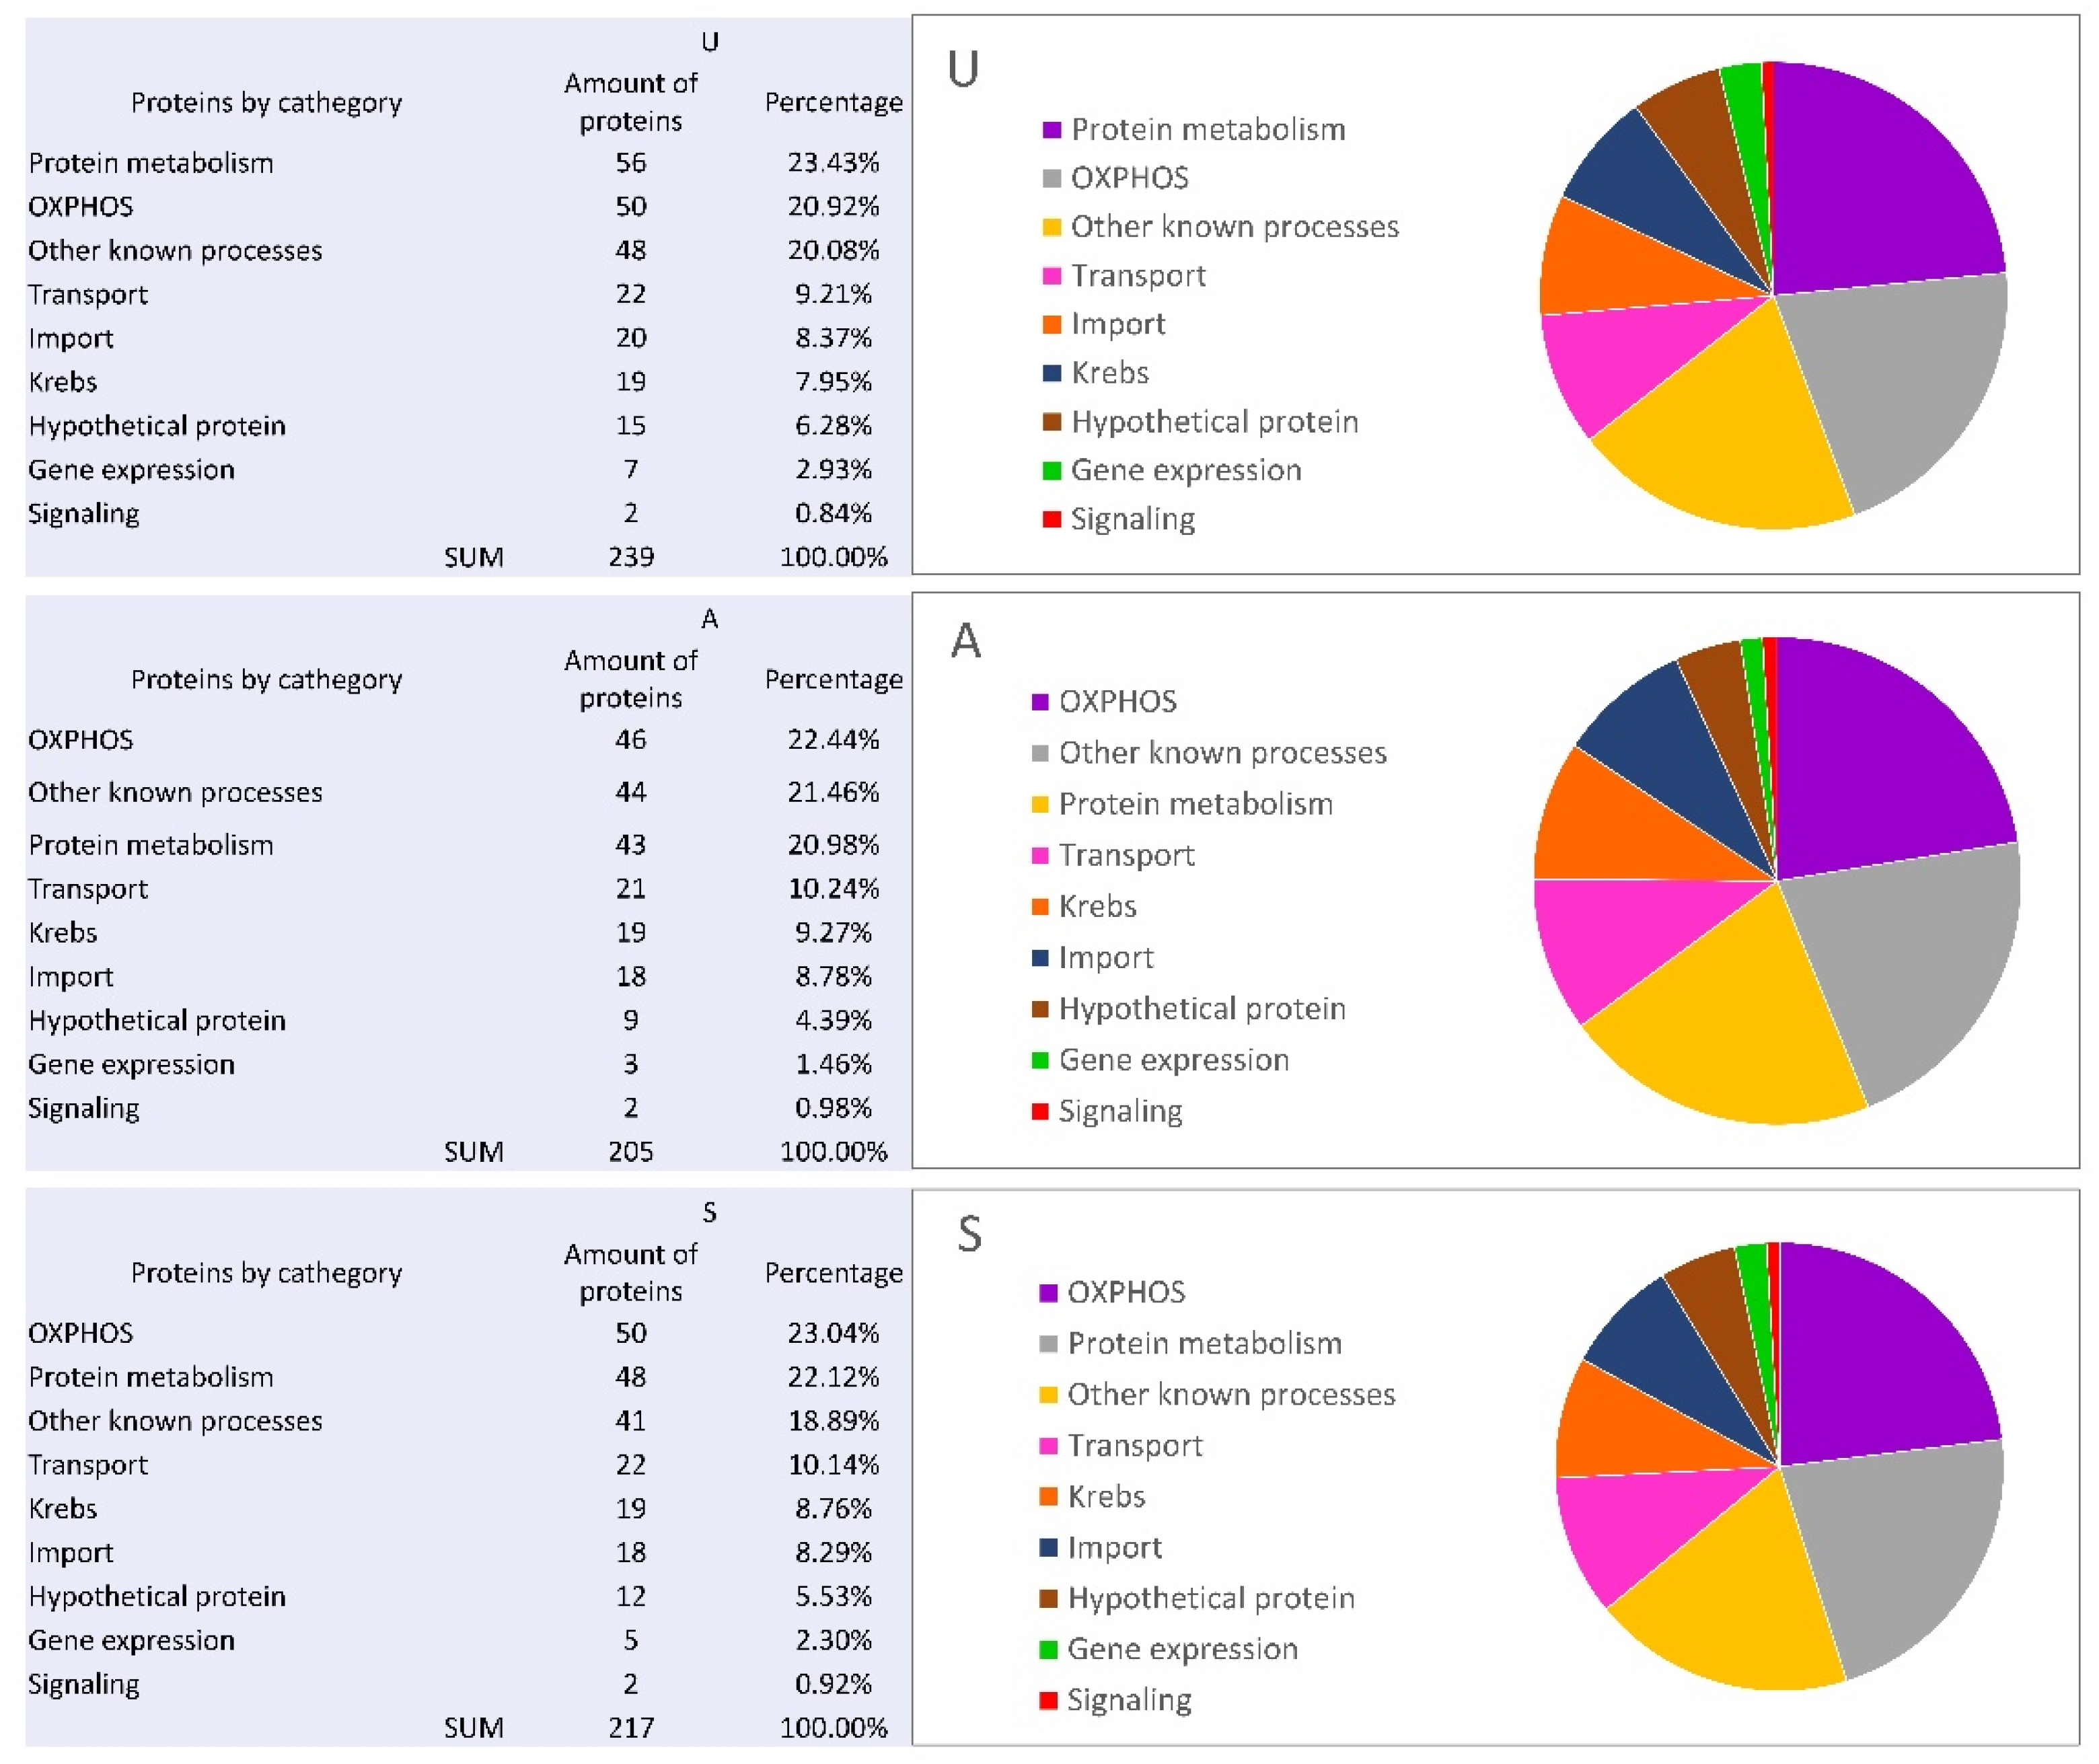
3.3. Qualitative Comparative Analysis of the Mitochondrial Proteomes of the Early Developmental Stages
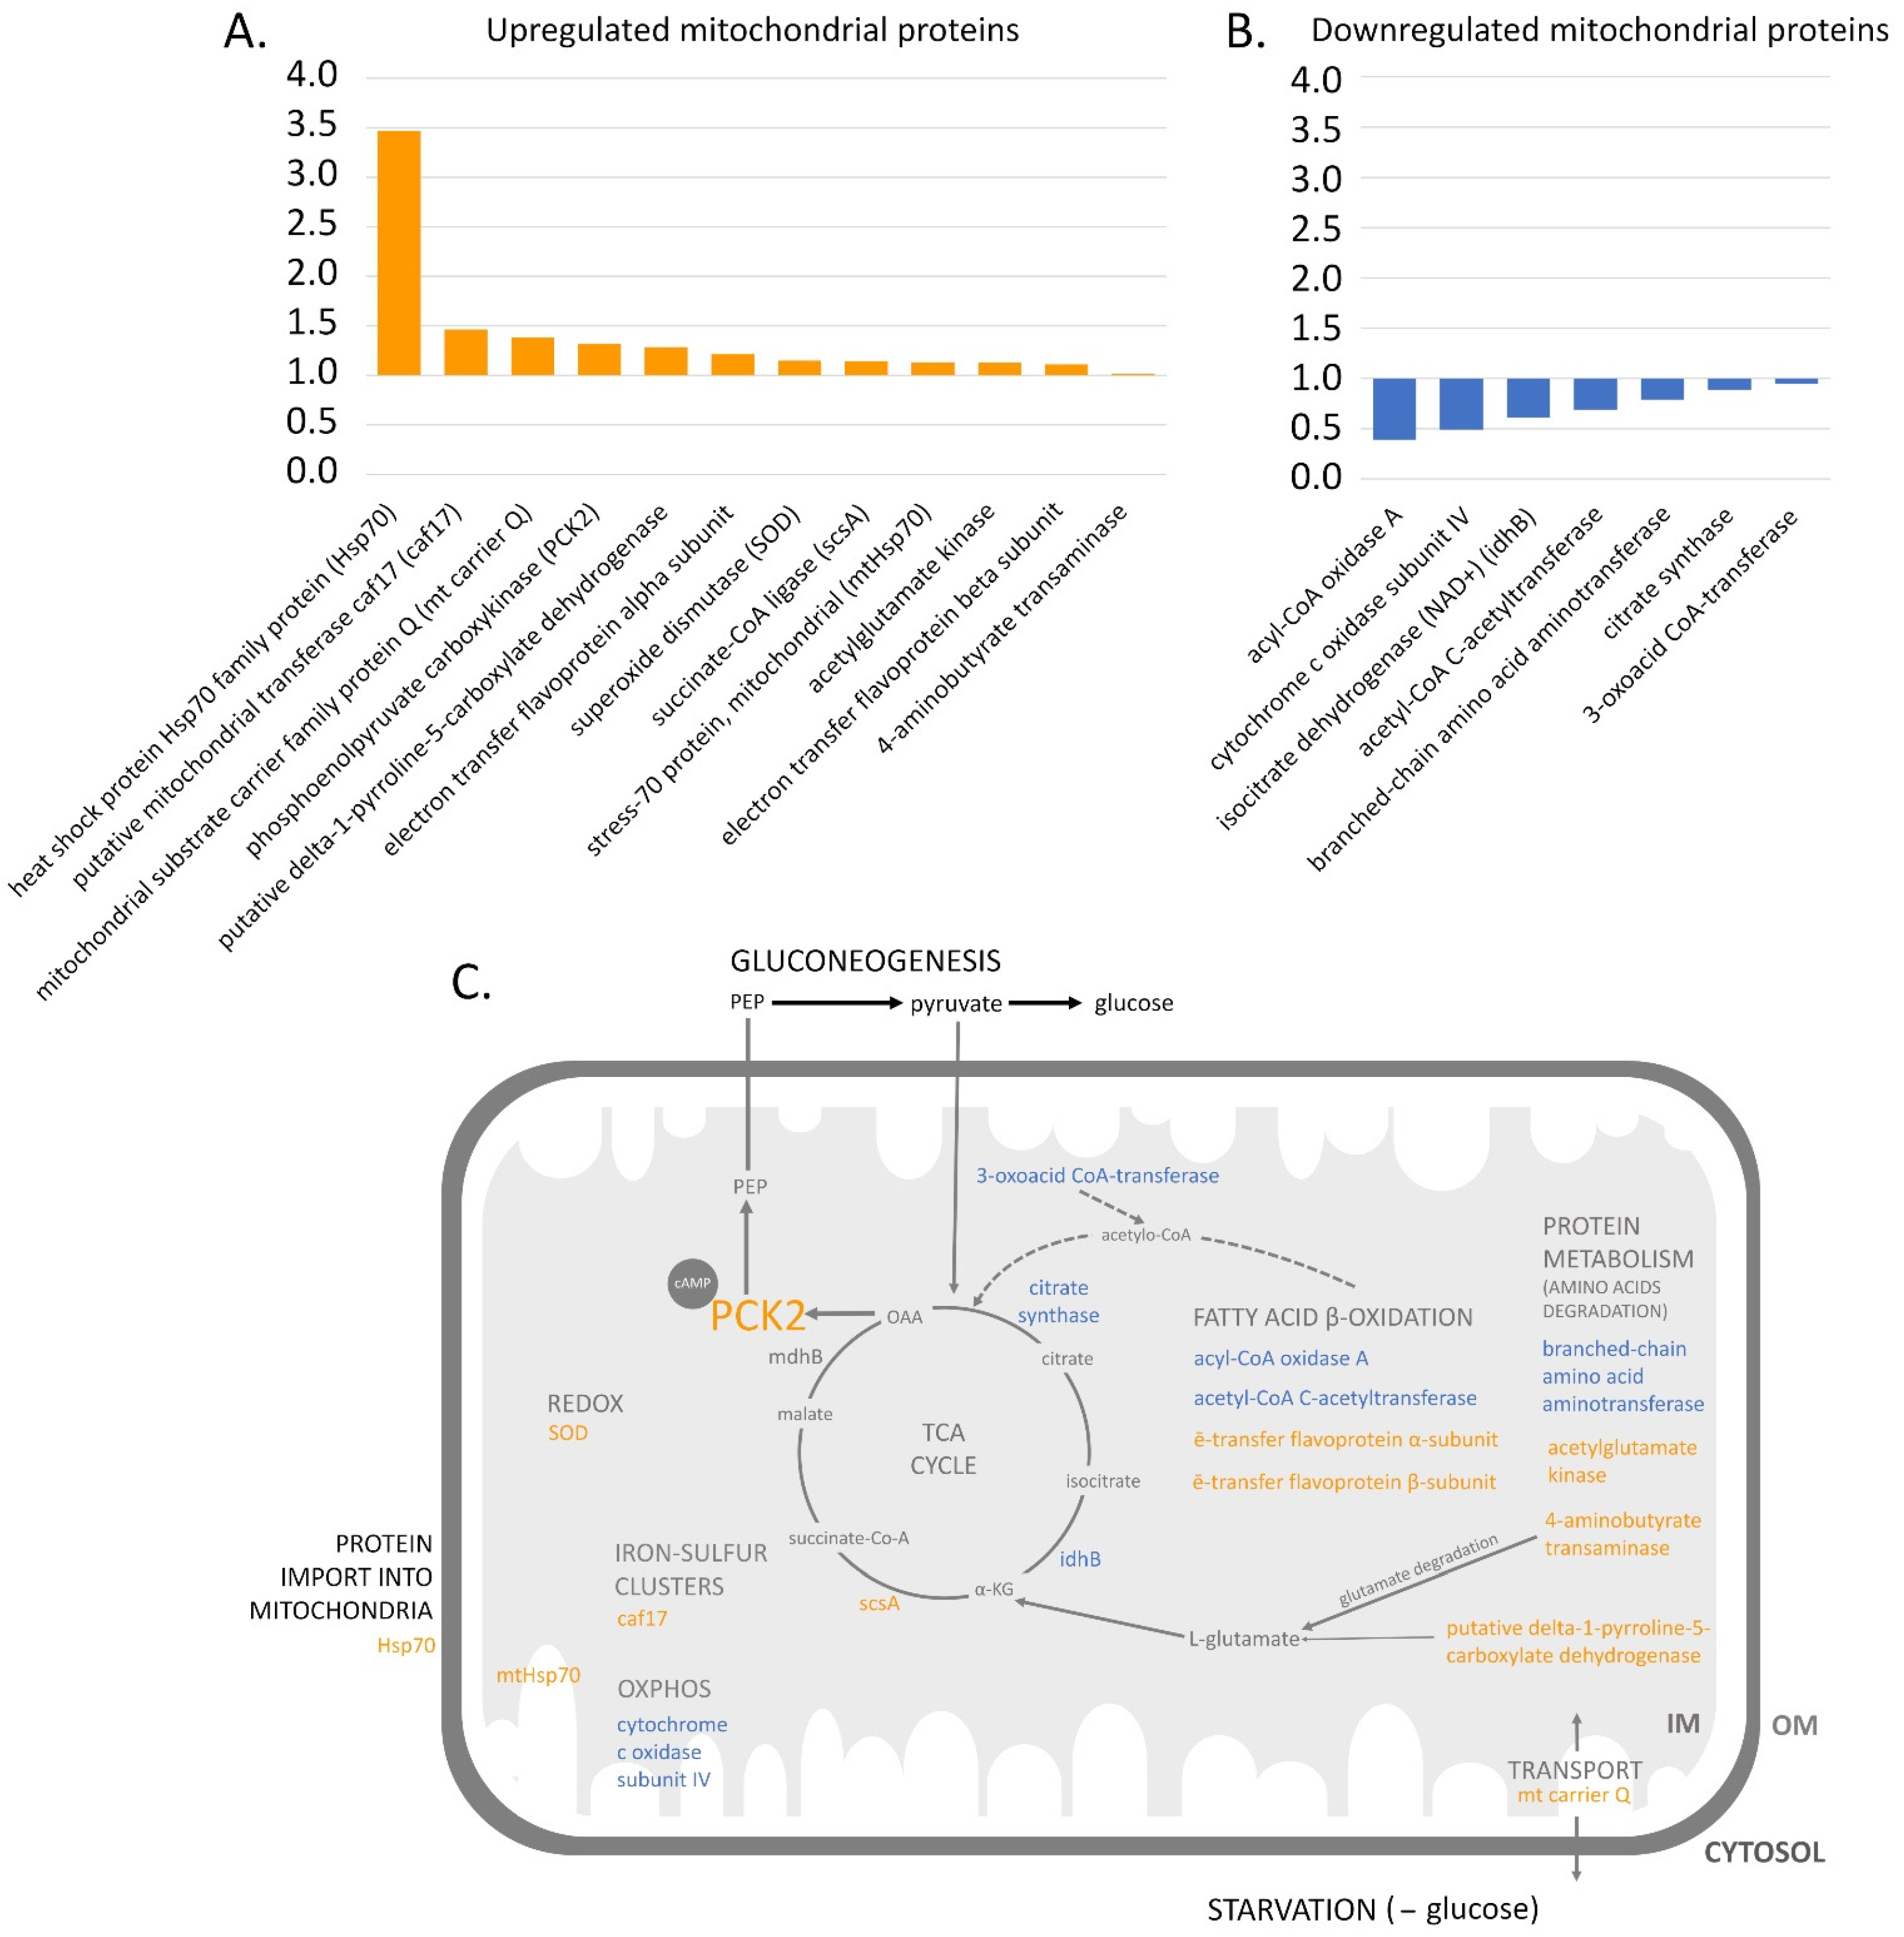
3.3.1. The Krebs Cycle and OXPHOS
3.3.2. Protein Metabolism
3.3.3. The Import of Proteins into Mitochondria and the Transport of Other Molecules
3.3.4. Other Known Processes
3.3.5. Uncharacterized Proteins
4. Conclusions
Supplementary Materials
Author Contributions
Funding
Institutional Review Board Statement
Informed Consent Statement
Data Availability Statement
Acknowledgments
Conflicts of Interest
References
- Schilde, C.; Schaap, P. The Amoebozoa. Methods Mol. Biol. 2013, 983, 1–15. [Google Scholar] [PubMed] [Green Version]
- Kawabe, Y.; Du, Q.; Schilde, C.; Schaap, P. Evolution of multicellularity in Dictyostelia. Int. J. Dev. Biol. 2019, 63, 359–369. [Google Scholar] [CrossRef] [PubMed] [Green Version]
- Du, Q.; Kawabe, Y.; Schilde, C.; Zhi-Hui, C.; Schaap, P. The evolution of aggregative multicellularity and cell-cell commu-nication in the Dictyostelia. J. Mol. Biol. 2015, 427, 3722–3733. [Google Scholar] [CrossRef] [PubMed] [Green Version]
- Maeda, Y. Cell-cycle checkpoint for transition from cell division to differentiation. Dev. Growth Differ. 2011, 53, 463–481. [Google Scholar] [CrossRef]
- Dormann, D.; Kim, J.Y.; Devreotes, P.N.; Weijer, C.J. cAMP receptor affinity controls wave dynamics, geometry and morphogenesis in Dictyostelium. J. Cell Sci. 2001, 114, 2513–2523. [Google Scholar]
- Hirose, S.; Chen, G.; Kuspa, A.; Shaulsky, G. The polymorphic proteins TgrB1 and TgrC1 function as a ligand-receptor pair in Dictyostelium allorecognition. J. Cell Sci. 2017, 130, 4002–4012. [Google Scholar] [CrossRef] [Green Version]
- González-Velasco, Ó.; De Las Rivas, J.; Lacal, J. Proteomic and transcriptomic profiling identifies early developmentally reg-ulated proteins in Dictyostelium discoideum. Cells 2019, 8, 1187. [Google Scholar] [CrossRef] [Green Version]
- Czarna, M.; Mathy, G.; Mac’Cord, A.; Dobson, R.; Jarmuszkiewicz, W.; Sluse-Goffart, C.M.; Leprince, P.; De Pauw, E.; Sluse, F.E. Dynamics of the Dictyostelium discoideum mitochondrial proteome during vegetative growth, starvation and early stages of development. Proteomics 2009, 10, 6–22. [Google Scholar] [CrossRef]
- Mathavarajah, S.; Flores, A.; Huber, R.J. Dictyostelium discoideum: A Model System for Cell and Developmental Biology. Curr. Protoc. Essent. Lab. Tech. 2017, 15, 14.1.1–14.1.19. [Google Scholar] [CrossRef]
- Pearce, X.G.; Annesley, S.J.; Fisher, P.R. The Dictyostelium model for mitochondrial biology and disease. Int. J. Dev. Biol. 2019, 63, 497–508. [Google Scholar] [CrossRef] [Green Version]
- Leach, C.K.; Ashworth, J.M.; Garrod, D.R. Cell sorting out during the differentiation of mixtures of metabolically distinct populations of Dictyostelium discoideum. J. Embryol. Exp. Morphol. 1973, 29, 647–661. [Google Scholar] [PubMed]
- Tasaka, M.; Takeuchi, I. Role of Cell Sorting in Pattern Formation in Dictyostelium discoideum. Differentiation 1981, 18, 191–196. [Google Scholar] [CrossRef]
- Thompson, C.R.; Kay, R.R. Cell-Fate Choice in Dictyostelium: Intrinsic Biases Modulate Sensitivity to DIF Signaling. Dev. Biol. 2000, 227, 56–64. [Google Scholar] [CrossRef]
- Mazur, M.; Wojtkowska, M.; Skalski, M.; Słocińska, M.; Kmita, H. The The TOB/SAM complex composition in mitochondria of Dictyostelium discoideum during progression from unicellularity to multicellularity. Acta Biochim. Pol. 2019, 66, 551–557. [Google Scholar] [CrossRef]
- Fey, P.; Kowal, A.S.; Gaudet, P.; Pilcher, K.E.; Chisholm, R.L. Protocols for growth and development of Dictyostelium dis-coideum. Nat. Protoc. 2007, 2, 1307–1316. [Google Scholar] [CrossRef]
- Michejda, J.; Guo, X.J.; Lauquin, G.J.-M. The respiration of cells and mitochondria of porin deficient yeast mutants is coupled. Biochem. Biophys. Res. Commun. 1990, 171, 354–361. [Google Scholar] [CrossRef]
- Karachitos, A.; Jordán, J.; Kmita, H. Cytoprotective activity of minocycline includes improvement of mitochondrial coupling: The importance of minocycline concentration and the presence of VDAC. J. Bioenerg. Biomembr. 2012, 44, 297–307. [Google Scholar] [CrossRef] [Green Version]
- Karachitos, A.; Grobys, D.; Antoniewicz, M.; Jedut, S.; Jordan, J.; Kmita, H. Human VDAC isoforms differ in their capability to interact with minocycline and to contribute to its cytoprotective activity. Mitochondrion 2016, 28, 38–48. [Google Scholar] [CrossRef]
- Brand, M.D.; Nicholls, D.G. Assessing mitochondrial dysfunction in cells. Biochem. J. 2011, 435, 297–312. [Google Scholar] [CrossRef] [Green Version]
- Hughes, C.S.; Foehr, S.; Garfield, D.A.; Furlong, E.E.; Steinmetz, L.M.; Krijgsveld, J. Ultrasensitive proteome analysis using paramagnetic bead technology. Mol. Syst. Biol. 2014, 10, 757. [Google Scholar] [CrossRef] [PubMed]
- Malinowska, A.; Kistowski, M.; Bakun, M.; Rubel, T.; Tkaczyk, M.; Mierzejewska, J.; Dadlez, M. Diffprot—Software for non-parametric statistical analysis of differential proteomics data. J. Proteom. 2012, 75, 4062–4073. [Google Scholar] [CrossRef]
- Elias, J.; Haas, W.; Faherty, B.; Gygi, S.P. Comparative evaluation of mass spectrometry platforms used in large scale prote-omics investigations. Nat. Methods 2005, 2, 667–675. [Google Scholar] [CrossRef] [PubMed]
- Bakun, M.; Karczmarski, J.; Poznanski, J.; Rubel, T.; Rozga, M.; Malinowska, A.; Sands, D.; Hennig, E.; Oledzki, J.; Ostrowski, J.; et al. An integrated LC-ESI-MS platform for quantitation of serum peptide ladders. Application for colon carcinoma study. Proteom. Clin. Appl. 2009, 3, 932–946. [Google Scholar] [CrossRef] [PubMed]
- Isono, T.; Chano, T.; Yonese, J.; Yuasa, T. Therapeutic inhibition of mitochondrial function induces cell death in starva-tion-resistant renal cell carcinomas. Sci. Rep. 2016, 9, 25669. [Google Scholar] [CrossRef] [Green Version]
- Keuper, M.; Jastroch, M.; Yi, C.; Fischer-Posovszky, P.; Wabitsch, M.; Tschöp, M.H.; Hofmann, S.M. Spare mitochondrial respiratory capacity permits human adipocytes to maintain ATP homeostasis under hypoglycemic conditions. FASEB J. 2014, 28, 761–770. [Google Scholar] [CrossRef]
- Zhou, Y.; Al-Saaidi, R.A.; Fernandez-Guerra, P.; Freude, K.K.; Olsen, R.K.J.; Jensen, U.B.; Gregersen, N.; Hyttel, P.; Bolund, L.; Aagaard, L.; et al. Mitochondrial Spare Respiratory Capacity Is Negatively Correlated with Nuclear Reprogramming Efficiency. Stem Cells Dev. 2017, 26, 166–176. [Google Scholar] [CrossRef] [PubMed]
- Pfleger, J.M.; He, M.; Abdellatif, M.M.M. Mitochondrial complex II is a source of the reserve respiratory capacity that is regulated by metabolic sensors and promotes cell survival. Cell Death Dis. 2015, 6, e1835. [Google Scholar] [CrossRef] [Green Version]
- Journet, A.; Klein, G.; Brugière, S.; Vandenbrouck, Y.; Chapel, A.; Kieffer, S.; Bruley, C.; Masselon, C.; Aubry, L. Investigating the macropinocytic proteome of Dictyostelium amoebae by high-resolution mass spectrometry. Proteomics 2012, 12, 241–245. [Google Scholar] [CrossRef]
- Matsuda, T.; Takahashi-Yanaga, F.; Yoshihara, T.; Maenaka, K.; Watanabe, Y.; Miwa, Y.; Morimoto, S.; Kubohara, Y.; Hirata, M.; Sasaguri, T. Dictyostelium differentiation-inducing factor-1 binds to mitochondrial malate dehydrogenase and inhibits its activity. J. Pharmacol. Sci. 2010, 112, 320–326. [Google Scholar] [CrossRef] [Green Version]
- Zhang, S.; Xie, C. The role of OXCT1 in the pathogenesis of cancer as a rate-limiting enzyme of ketone body metabolism. Life Sci. 2017, 183, 110–115. [Google Scholar] [CrossRef]
- Li, C.-L.F.; Santhanam, B.; Webb, A.N.; Zupan, B.; Shaulsky, G. Gene discovery by chemical mutagenesis and whole-genome sequencing in Dictyostelium. Genome Res. 2016, 26, 1268–1276. [Google Scholar] [CrossRef] [Green Version]
- Vincent, E.E.; Sergushichev, A.; Griss, T.; Gingras, M.-C.; Samborska, B.; Ntimbane, T.; Coelho, P.P.; Blagih, J.; Raissi, T.C.; Choinière, L.; et al. Mitochondrial Phosphoenolpyruvate Carboxykinase Regulates Metabolic Adaptation and Enables Glucose-Independent Tumor Growth. Mol. Cell 2015, 60, 195–207. [Google Scholar] [CrossRef] [Green Version]
- Wu, Y.; Janetopoulos, C. Systematic Analysis of γ-Aminobutyric Acid (GABA) Metabolism and Function in the Social Amoeba Dictyostelium discoideum. J. Biol. Chem. 2013, 288, 15280–15290. [Google Scholar] [CrossRef] [Green Version]
- Pavlova, N.N.; Thompson, C.B. The Emerging Hallmarks of Cancer Metabolism. Cell Metab. 2016, 23, 27–47. [Google Scholar] [CrossRef] [Green Version]
- Fernández-Fernández, M.R.; Valpuesta, J.M. Hsp70 chaperone: A master player in protein homeostasis. F1000Research 2018, 7, 1497. [Google Scholar] [CrossRef] [PubMed] [Green Version]
- Vardi-Oknin, D.; Arava, Y. Characterization of factors involved in localized translation near mitochondria by ribosome-proximity labeling. Front. Cell Dev. Biol. 2019, 7, 305. [Google Scholar] [CrossRef] [PubMed] [Green Version]
- Hansen, K.G.; Herrmann, J.M. Transport of Proteins into Mitochondria. Protein J. 2019, 38, 330–342. [Google Scholar] [CrossRef]
- Wojtkowska, M.; Buczek, D.; Suzuki, Y.; Shabardina, V.; Makałowski, W.; Kmita, H. The emerging picture of the mitochon-drial protein import complexes of Amoebozoa supergroup. BMC Genom. 2017, 18, 997. [Google Scholar]
- Shan, Y.; Cortopassi, G. Mitochondrial Hspa9/Mortalin regulates erythroid differentiation via iron-sulfur cluster assembly. Mitochondrion 2016, 26, 94–103. [Google Scholar] [CrossRef]
- Stehling, O.; Wilbrecht, C.; Lill, R. Mitochondrial iron–sulfur protein biogenesis and human disease. Biochimie 2014, 100, 61–77. [Google Scholar] [CrossRef]
- Embley, T.M.; Martin, W. Eukaryotic evolution, changes and challenges. Nat. Cell Biol. 2006, 440, 623–630. [Google Scholar] [CrossRef] [PubMed]
- Vacanti, N.M.; Divakaruni, A.S.; Green, C.R.; Parker, S.J.; Henry, R.R.; Ciaraldi, T.P.; Murphy, A.N.; Metallo, C.M. Regula-tion of substrate utilization by the mitochondrial pyruvate carrier. Mol. Cell 2014, 56, 425–435. [Google Scholar] [CrossRef] [PubMed] [Green Version]
- Satre, M.; Mattei, S.; Aubry, L.; Gaudet, P.; Pelosi, L.; Brandolin, G.; Klein, G. Mitochondrial carrier family: Repertoire and peculiarities of the cellular slime mould Dictyostelium discoideum. Biochimie 2007, 89, 1058–1069. [Google Scholar] [CrossRef] [PubMed]
- Bloomfield, G.; Pears, C. Superoxide signalling required for multicellular development of Dictyostelium. J. Cell Sci. 2003, 116, 3387–3397. [Google Scholar] [CrossRef] [Green Version]
- Roger, A.J.; Muñoz-Gómez, S.A.; Kamikawa, R. The Origin and Diversification of Mitochondria. Curr. Biol. 2017, 27, R1177–R1192. [Google Scholar] [CrossRef] [PubMed] [Green Version]


| RefSeq Database | Protein Name | Phase to Phase Ratio Quotient A/U | Phase to Phase Ratio Quotient S/U | Phase to Phase Ratio Quotient A/S | |||||||||
|---|---|---|---|---|---|---|---|---|---|---|---|---|---|
| q Value | Ratio | Fold Change | Peptides | q Value | Ratio | Fold Change | Peptides | q Value | Ratio | Fold Change | Peptides | ||
| Krebs | |||||||||||||
| XP_643860.1 | citrate synthase, mitochondrial | 0.00073 | 0.56 | 1.78 | 46 | 0.00023 | 0.63 | 1.6 | 45 | ||||
| XP_628920.1 | isocitrate dehydrogenase (NAD+) (IdhB) | 0.04842 | 0.66 | 1.52 | 25 | 0.01253 | 0.61 | 1.64 | 25 | ||||
| XP_636263.1 | succinate-CoA ligase (scsA) | 0.00858 | 0.48 | 2.1 | 16 | 0.00599 | 0.42 | 2.37 | 16 | ||||
| XP_629516.1 | malate dehydrogenase (mdhB) | 0.00027 | 0.58 | 1.71 | 45 | 0.00006 | 0.58 | 1.73 | 45 | ||||
| - | |||||||||||||
| XP_636911.1 | 3-oxoacid CoA-transferase | 0.00569 | 0.55 | 1.82 | 29 | 0.04059 | 0.58 | 1.73 | 29 | ||||
| XP_645396.1 | phosphoenolpyruvate carboxykinase (PCK2) | 0.04045 | 0.54 | 1.86 | 30 | 0.00055 | 0.41 | 2.43 | 32 | ||||
| OXPHOS | |||||||||||||
| XP_640649.1 | cytochrome c oxidase subunit IV | 0.03247 | 0.49 | 2.06 | 19 | ||||||||
| Protein biosynthesis | |||||||||||||
| XP_643155.1 | heat shock protein Hsp70 family protein | 0.00015 | 3.76 | 3.76 | 32 | 0.00007 | 3.47 | 3.47 | 33 | ||||
| XP_637813.1 | acetylglutamate kinase | 0.00886 | 0.61 | 1.65 | 37 | 0.00061 | 0.54 | 1.86 | 37 | ||||
| XP_638096.1 | branched-chain amino acid aminotransferase | 0.00015 | 0.45 | 2.21 | 22 | 0.01041 | 0.57 | 1.75 | 21 | ||||
| XP_647552.1 | 4-aminobutyrate transaminase | 0.00512 | 0.58 | 1.73 | 43 | 0.00368 | 0.57 | 1.74 | 43 | ||||
| Protein import | |||||||||||||
| XP_629204.1 | Stress-70 protein, mitochondrial (mtHsp70) | 0.0004 | 0.6 | 1.67 | 62 | 0.00006 | 0.53 | 1.88 | 62 | ||||
| XP_645160.1 | mitochondrial substrate carrier family protein Q | 0.00739 | 3.11 | 3.11 | 10 | 0.00191 | 2.25 | 2.25 | 10 | ||||
| Other known processes FA metabolism | |||||||||||||
| XP_645587.1 | acetyl-CoA C-acetyltransferase | 0.00015 | 0.42 | 2.41 | 37 | 0.00549 | 0.61 | 1.65 | 35 | ||||
| XP_643323.1 | acyl-CoA oxidase A | 0.01325 | 2.16 | 2.16 | 25 | 0.00006 | 5.54 | 5.54 | 25 | ||||
| XP_635485.1 | electron transfer flavoprotein alpha subunit | 0.01932 | 0.51 | 1.97 | 24 | 0.00615 | 0.42 | 2.36 | 23 | ||||
| XP_642058.1 | electron transfer flavoprotein beta subunit | 0.03524 | 0.6 | 1.65 | 21 | 0.022 | 0.54 | 1.86 | 21 | ||||
| XP_645815.1 | Redox superoxide dismutase/SOD | 0.01603 | 0.46 | 2.18 | 10 | 0.00404 | 0.4 | 2.52 | 12 | ||||
| XP_639996.1 | Uncharacterized proteins putative mitochondrial transferase caf17 | 0.00542 | 0.41 | 2.41 | 24 | 0.00006 | 0.28 | 3.59 | 24 | ||||
| XP_639145.1 | putative delta-1-pyrroline-5-carboxylate dehydrogenase | 0.04023 | 0.63 | 1.59 | 38 | 0.00006 | 0.49 | 2.04 | 37 | ||||
Publisher’s Note: MDPI stays neutral with regard to jurisdictional claims in published maps and institutional affiliations. |
© 2021 by the authors. Licensee MDPI, Basel, Switzerland. This article is an open access article distributed under the terms and conditions of the Creative Commons Attribution (CC BY) license (https://creativecommons.org/licenses/by/4.0/).
Share and Cite
Mazur, M.; Wojciechowska, D.; Sitkiewicz, E.; Malinowska, A.; Świderska, B.; Kmita, H.; Wojtkowska, M. Mitochondrial Processes during Early Development of Dictyostelium discoideum: From Bioenergetic to Proteomic Studies. Genes 2021, 12, 638. https://0-doi-org.brum.beds.ac.uk/10.3390/genes12050638
Mazur M, Wojciechowska D, Sitkiewicz E, Malinowska A, Świderska B, Kmita H, Wojtkowska M. Mitochondrial Processes during Early Development of Dictyostelium discoideum: From Bioenergetic to Proteomic Studies. Genes. 2021; 12(5):638. https://0-doi-org.brum.beds.ac.uk/10.3390/genes12050638
Chicago/Turabian StyleMazur, Monika, Daria Wojciechowska, Ewa Sitkiewicz, Agata Malinowska, Bianka Świderska, Hanna Kmita, and Małgorzata Wojtkowska. 2021. "Mitochondrial Processes during Early Development of Dictyostelium discoideum: From Bioenergetic to Proteomic Studies" Genes 12, no. 5: 638. https://0-doi-org.brum.beds.ac.uk/10.3390/genes12050638