
NGS Analysis of Liquid Biopsy (LB) and Formalin-Fixed Paraffin-Embedded (FFPE) Melanoma Samples Using Oncomine™ Pan-Cancer Cell-Free Assay

 , , and
Abstract
:1. Introduction
2. Materials and Methods
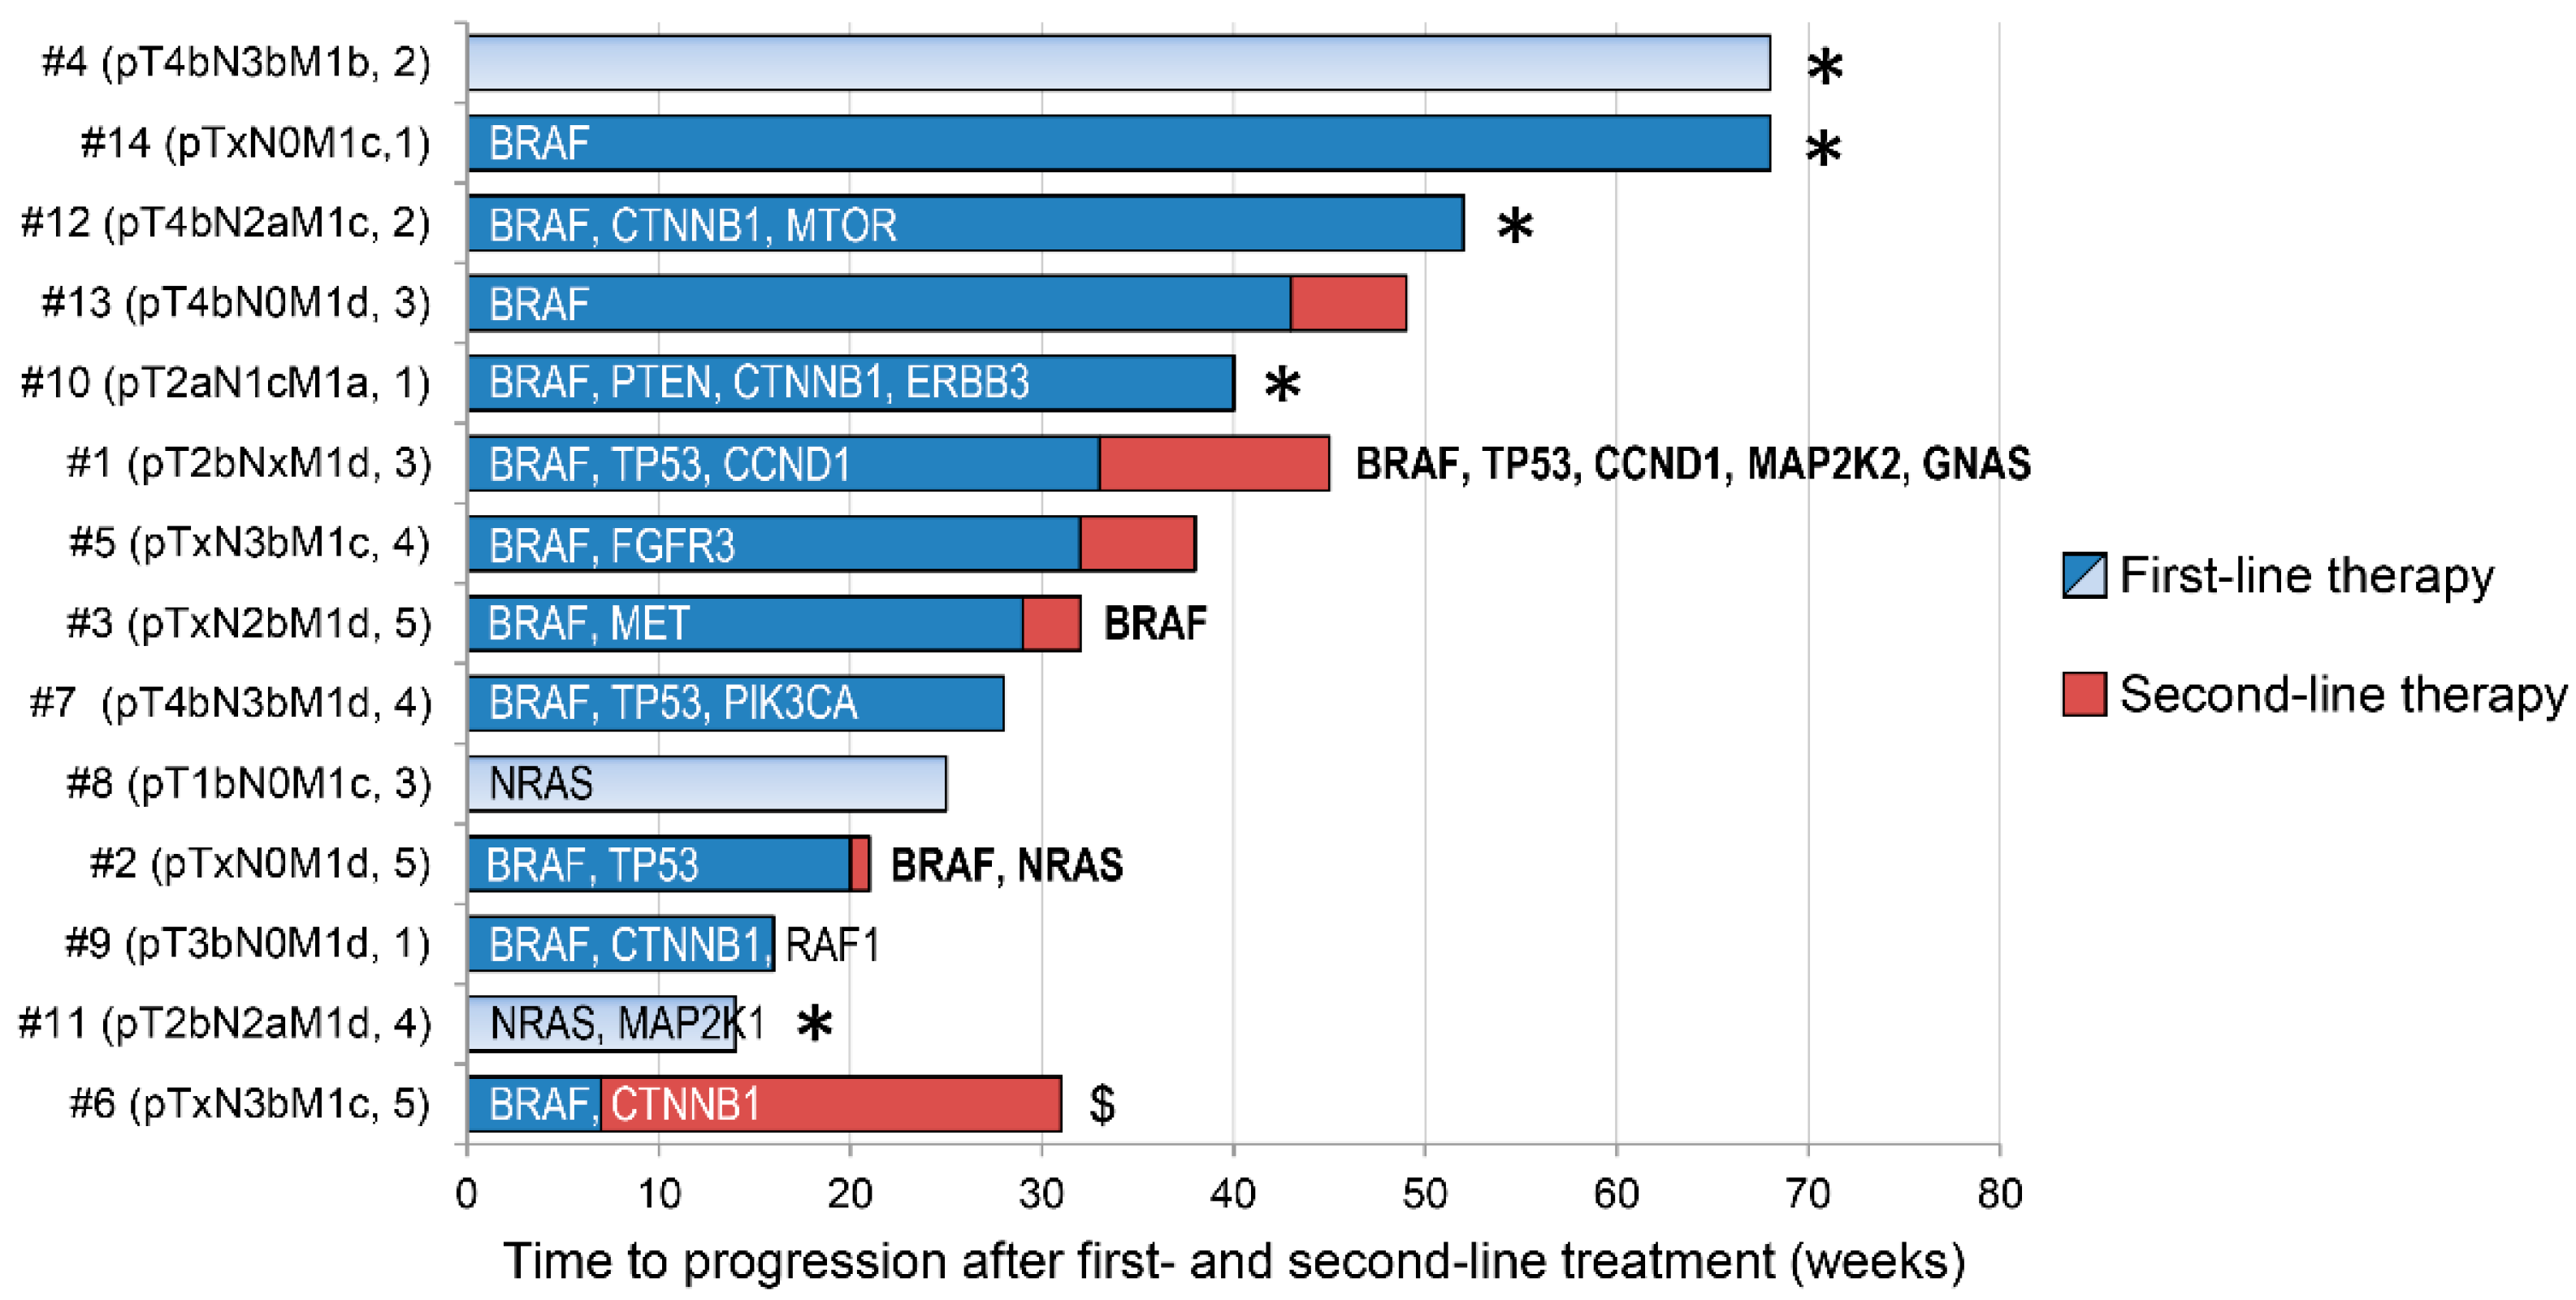
2.1. Patients and Treatments
2.2. Blood Sample Collection, DNA Isolation, and FFPE Samples
2.3. QPCR
2.4. Sequencing of Tumor and Cell-Free DNA
2.5. Data Analyses and Variant Selection
2.6. Statistical Analysis
3. Results
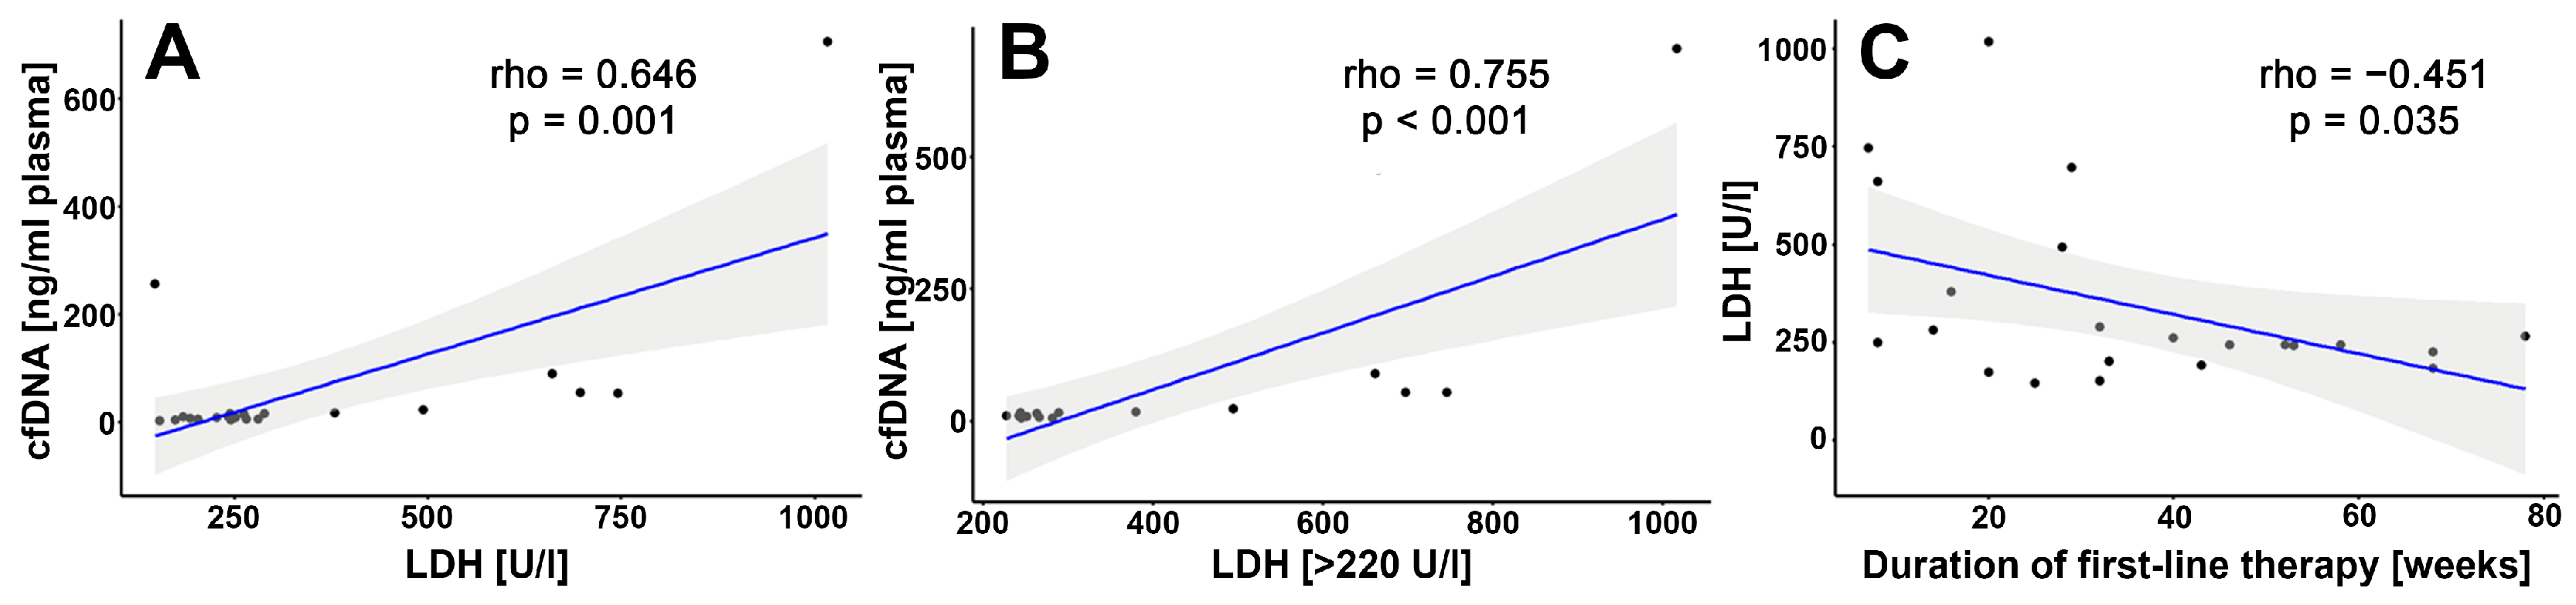
3.1. cfDNA—Correlation Analysis
3.2. NGS Analysis of Tumors and cfDNA
3.3. Selected Mutations and Patient Case
3.3.1. CTNNB1 (β-Catenin)
3.3.2. TP53
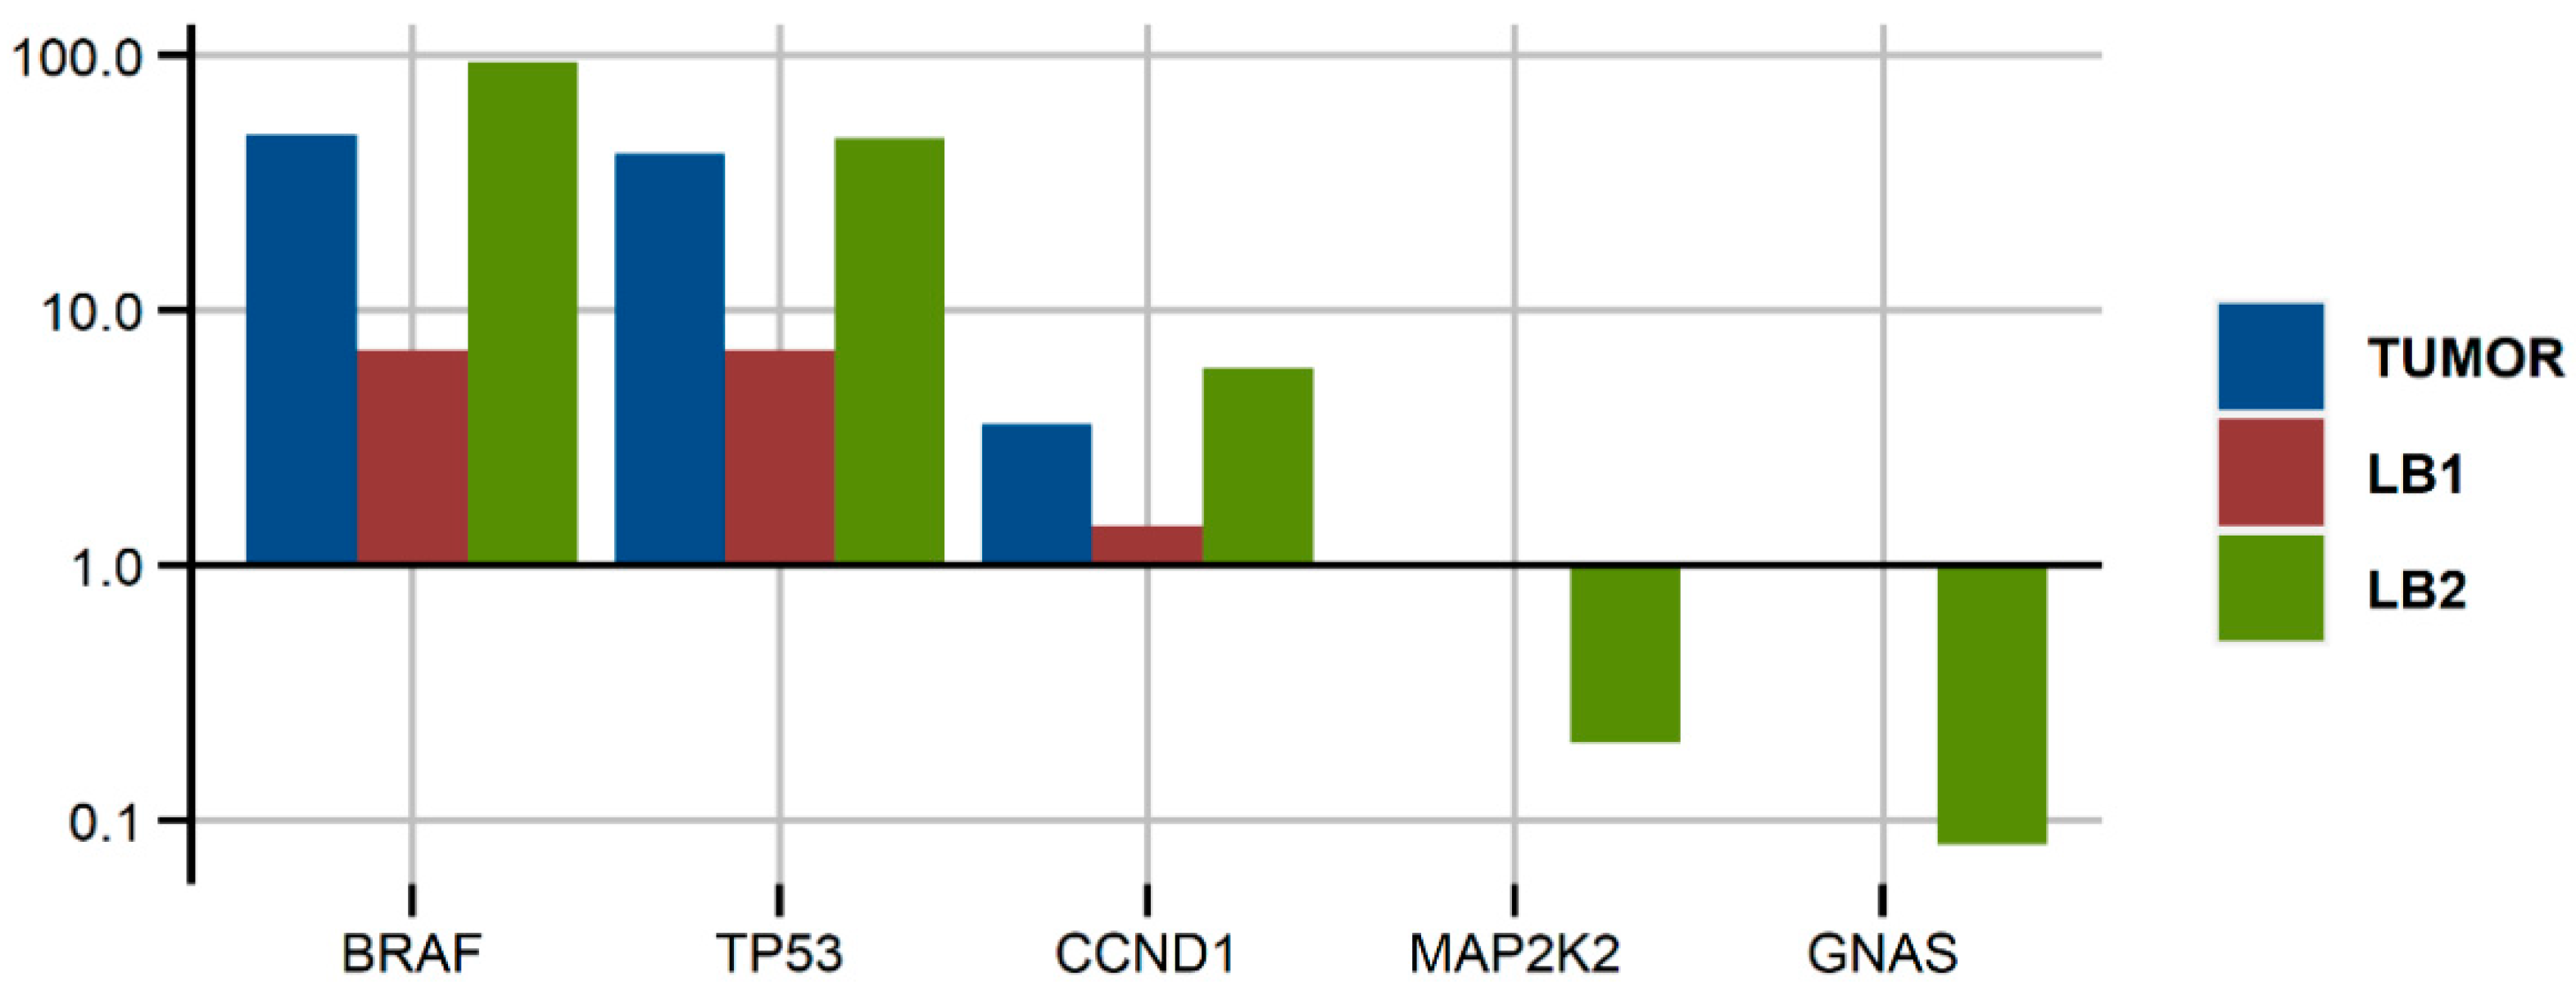
3.3.3. Patient #1
4. Discussion
5. Conclusions
Author Contributions
Funding
Institutional Review Board Statement
Informed Consent Statement
Data Availability Statement
Acknowledgments
Conflicts of Interest
References
- Sacco, A.; Forgione, L.; Carotenuto, M.; De Luca, A.; Ascierto, P.A.; Botti, G.; Normanno, N. Circulating Tumor DNA Testing Opens New Perspectives in Melanoma Management. Cancers 2020, 12, 2914. [Google Scholar] [CrossRef]
- Boyer, M.; Cayrefourcq, L.; Dereure, O.; Meunier, L.; Becquart, O.; Alix-Panabières, C. Clinical Relevance of Liquid Biopsy in Melanoma and Merkel Cell Carcinoma. Cancers 2020, 12, 960. [Google Scholar] [CrossRef] [Green Version]
- Fernández-Lázaro, D.; Hernández, J.L.G.; Garcia, J.; Del Castillo, A.C.; Hueso, M.V.; Cruz-Hernández, J.J. Clinical Perspective and Translational Oncology of Liquid Biopsy. Diagnostics 2020, 10, 443. [Google Scholar] [CrossRef]
- Hirotsu, Y.; Otake, S.; Ohyama, H.; Amemiya, K.; Higuchi, R.; Oyama, T.; Mochizuki, H.; Goto, T.; Omata, M. Dual-molecular barcode sequencing detects rare variants in tumor and cell free DNA in plasma. Sci. Rep. 2020, 10, 3391. [Google Scholar] [CrossRef]
- Wan, J.C.M.; Massie, C.; Garcia-Corbacho, J.; Mouliere, F.; Brenton, J.D.; Caldas, C.; Pacey, S.; Baird, R.; Rosenfeld, N. Liquid biopsies come of age: Towards implementation of circulating tumour DNA. Nat. Rev. Cancer 2017, 17, 223–238. [Google Scholar] [CrossRef] [PubMed]
- Luke, J.J.; Flaherty, K.T.; Ribas, A.; Long, G. Targeted agents and immunotherapies: Optimizing outcomes in melanoma. Nat. Rev. Clin. Oncol. 2017, 14, 463–482. [Google Scholar] [CrossRef] [Green Version]
- Lewis, K.D.; Larkin, J.; Ribas, A.; Flaherty, K.T.; McArthur, G.A.; Ascierto, P.A.; Dreno, B.; Yan, Y.; Wongchenko, M.; McKenna, E.; et al. Impact of depth of response on survival in patients treated with cobimetinib +/− vemurafenib: Pooled analysis of BRIM-2, BRIM-3, BRIM-7 and coBRIM. Br. J. Cancer 2019. [Google Scholar] [CrossRef] [Green Version]
- Olbryt, M. Molecular background of skin melanoma development and progression: Therapeutic implications. Adv. Dermatol. Allergol. 2019, 36, 129–138. [Google Scholar] [CrossRef]
- Lee, J.; Long, G.; Menzies, A.; Lo, S.N.; Guminski, A.; Whitbourne, K.; Peranec, M.; Scolyer, R.; Kefford, R.; Rizos, H.; et al. Association Between Circulating Tumor DNA and Pseudoprogression in Patients With Metastatic Melanoma Treated With Anti–Programmed Cell Death 1 Antibodies. JAMA Oncol. 2018, 4, 717–721. [Google Scholar] [CrossRef] [PubMed] [Green Version]
- Ou, S.-H.I.; Nagasaka, M.; Zhu, V.W. Liquid Biopsy to Identify Actionable Genomic Alterations. Am. Soc. Clin. Oncol. Educ. Book 2018, 38, 978–997. [Google Scholar] [CrossRef]
- Shah, M.; Takayasu, T.; Moghadamtousi, S.Z.; Arevalo, O.; Chen, M.; Lan, C.; Duose, D.; Hu, P.; Zhu, J.-J.; Roy-Chowdhuri, S.; et al. Evaluation of the Oncomine Pan-Cancer Cell-Free Assay for Analyzing Circulating Tumor DNA in the Cerebrospinal Fluid in Patients with Central Nervous System Malignancies. J. Mol. Diagn. 2021, 23, 171–180. [Google Scholar] [CrossRef] [PubMed]
- Macías, M.; Cañada-Higueras, E.; Alegre, E.; Bielsa, A.; Gracia, J.; Patiño-García, A.; Ferrer-Costa, R.; Sendino, T.; Andueza, M.P.; Mateos, B.; et al. Performance comparison of two next-generation sequencing panels to detect actionable mutations in cell-free DNA in cancer patients. Clin. Chem. Lab. Med. 2020, 58, 1341–1348. [Google Scholar] [CrossRef]
- Balaji, S.A.; Shanmugam, A.; Chougule, A.; Sridharan, S.; Prabhash, K.; Arya, A.; Chaubey, A.; Hariharan, A.; Kolekar, P.; Sen, M.; et al. Analysis of solid tumor mutation profiles in liquid biopsy. Cancer Med. 2018, 7, 5439–5447. [Google Scholar] [CrossRef]
- Sanmamed, M.F.; Fernández-Landázuri, S.; Rodríguez, C.; Zárate, R.; Lozano, M.D.; Zubiri, L.; Perez-Gracia, J.L.; Martín-Algarra, S.; González, A. Quantitative Cell-Free Circulating BRAFV600E Mutation Analysis by Use of Droplet Digital PCR in the Follow-up of Patients with Melanoma Being Treated with BRAF Inhibitors. Clin. Chem. 2015, 61, 297–304. [Google Scholar] [CrossRef] [PubMed] [Green Version]
- Jahangiri, L.; Hurst, T. Assessing the Concordance of Genomic Alterations between Circulating-Free DNA and Tumour Tissue in Cancer Patients. Cancers 2019, 11, 1938. [Google Scholar] [CrossRef] [PubMed] [Green Version]
- Diefenbach, R.J.; Lee, J.H.; Menzies, A.M.; Carlino, M.S.; Long, G.V.; Saw, R.P.M.; Howle, J.R.; Spillane, A.J.; Scolyer, R.A.; Kefford, R.F.; et al. Design and Testing of a Custom Melanoma Next Generation Sequencing Panel for Analysis of Circulating Tumor DNA. Cancers 2020, 12, 2228. [Google Scholar] [CrossRef]
- Wong, S.Q.; Li, J.; Tan, A.Y.-C.; Vedururu, R.; Pang, J.-M.B.; Do, H.; Ellul, J.; Doig, K.; Bell, A.; MacArthur, G.A.; et al. Sequence artefacts in a prospective series of formalin-fixed tumours tested for mutations in hotspot regions by massively parallel sequencing. BMC Med. Genom. 2014, 7, 23. [Google Scholar] [CrossRef] [Green Version]
- Alexandrov, L.B.; Nik-Zainal, S.; Wedge, D.C.; Aparicio, S.A.J.R.; Behjati, S.; Biankin, A.V.; Bignell, G.R.; Bolli, N.; Borg, A.; Borresen-Dale, A.L.; et al. Corrigendum: Signatures of mutational processes in human cancer. Nature 2013, 500, 415–421. [Google Scholar] [CrossRef] [Green Version]
- Berra, C.M.; Torrezan, G.T.; De Paula, C.A.; Hsieh, R.; Lourenço, S.V.; Carraro, D.M. Use of uracil-DNA glycosylase enzyme to reduce DNA-related artifacts from formalin-fixed and paraffin-embedded tissues in diagnostic routine. Appl. Cancer Res. 2019, 39, 7. [Google Scholar] [CrossRef]
- Gangadhar, T.C.; Savitch, S.; Yee, S.S.; Xu, W.; Huang, A.C.; Harmon, S.; Lieberman, D.B.; Soucier, D.; Fan, R.; Black, T.A.; et al. Feasibility of monitoring advanced melanoma patients using cell-free DNA from plasma. Pigment Cell Melanoma Res. 2018, 31, 73–81. [Google Scholar] [CrossRef] [Green Version]
- Kim, S.; Jeong, S. Mutation Hotspots in the β-Catenin Gene: Lessons from the Human Cancer Genome Databases. Mol. Cells 2019, 42, 8–16. [Google Scholar] [CrossRef]
- Hodis, E.; Watson, I.; Kryukov, G.; Arold, S.T.; Imielinski, M.; Theurillat, J.-P.; Nickerson, E.; Auclair, D.; Li, L.; Place, C.; et al. A Landscape of Driver Mutations in Melanoma. Cell 2012, 150, 251–263. [Google Scholar] [CrossRef] [Green Version]
- Louveau, B.; Jouenne, F.; Têtu, P.; Sadoux, A.; Gruber, A.; Lopes, E.; Delyon, J.; Serror, K.; Marco, O.; Da Meda, L.; et al. A Melanoma-Tailored Next-Generation Sequencing Panel Coupled with a Comprehensive Analysis to Improve Routine Melanoma Genotyping. Target. Oncol. 2020, 15, 759–771. [Google Scholar] [CrossRef] [PubMed]
- Cho, J.; Kim, S.Y.; Kim, Y.J.; Sim, M.H.; Kim, N.K.D.; Kim, K.; Park, W.-Y.; Kim, J.H.; Jang, K.-T.; Lee, J. Emergence of CTNNB1 mutation at acquired resistance to KIT inhibitor in metastatic melanoma. Clin. Transl. Oncol. 2017, 19, 1247–1252. [Google Scholar] [CrossRef] [PubMed]
- Trujillo, J.A.; Luke, J.J.; Zha, Y.; Segal, J.P.; Ritterhouse, L.L.; Spranger, S.; Matijevich, K.; Gajewski, T.F. Secondary resistance to immunotherapy associated with β-catenin pathway activation or PTEN loss in metastatic melanoma. J. Immunother. Cancer 2019, 7, 295. [Google Scholar] [CrossRef] [PubMed] [Green Version]
- Braggio, D.; Zewdu, A.; Londhe, P.; Yu, P.; Lopez, G.; Batte, K.; Koller, D.; De Faria, F.C.C.; Casadei, L.; Strohecker, A.M.; et al. β-catenin S45F mutation results in apoptotic resistance. Oncogene 2020, 39, 5589–5600. [Google Scholar] [CrossRef] [PubMed]
- Krayem, M.; Journe, F.; Wiedig, M.; Morandini, R.; Najem, A.; Salès, F.; van Kempen, L.; Sibille, C.; Awada, A.; Marine, J.-C.; et al. p53 Reactivation by PRIMA-1Met (APR-246) sensitises V600E/KBRAF melanoma to vemurafenib. Eur. J. Cancer 2016, 55, 98–110. [Google Scholar] [CrossRef] [PubMed]
- Hilke, F.J.; Sinnberg, T.; Gschwind, A.; Niessner, H.; Demidov, G.; Amaral, T.; Ossowski, S.; Bonzheim, I.; Röcken, M.; Riess, O.; et al. Distinct Mutation Patterns Reveal Melanoma Subtypes and Influence Immunotherapy Response in Advanced Melanoma Patients. Cancers 2020, 12, 2359. [Google Scholar] [CrossRef]


| Variable | Group | No. of Patients (n = 22) | % |
|---|---|---|---|
| Age, years | Median | 52 | |
| Sex | Female | 13 | 60 |
| Male | 9 | 40 | |
| Location of the primary tumor | Head and neck | 4 | 18 |
| Trunk | 10 | 45 | |
| Extremities | 5 | 23 | |
| Lack of data | 3 | 14 | |
| TNM Stage IV | M1a | 3 | 14 |
| M1b | 4 | 18 | |
| M1c | 8 | 36 | |
| M1d | 7 | 32 | |
| Therapy | Dabrafenib, trametinib | 15 | 68 |
| Immunotherapy | 7 | 32 | |
| Best response | CR | 0 | 0 |
| PR | 15 | 68 | |
| SD | 3 | 14 | |
| PD | 4 | 18 | |
| LDH at the start of therapy | Elevated | 16 | 73 |
| Normal | 6 | 27 | |
| Cell-free DNA (cfDNA) at the start of therapy (above or below median) | <10.3 ng/mL | 11 | 50 |
| >10.3 ng/ml | 11 | 50 |
| DNA Sample | No. of Samples Per Patient | No. of Patients (n = 14) |
|---|---|---|
| LB1 1 | 1 | 2 |
| LB1 and LB2 2 | 2 | 1 |
| LB1 and T 3 | 2 | 7 |
| LB1, LB2 and T | 3 | 4 |
| Patient No | Tumor | Liquid Biopsy 1 | Liquid Biopsy 2 | |||||
|---|---|---|---|---|---|---|---|---|
| P/M 1 | qPCR | NGS | VAF 2 % | NGS | VAF % | NGS | VAF % | |
| 1 | M | V600 | V600E | 48.6 | V600E | 7.0 | V600E | 93.0 |
| 2 | M | V600 | V600E | 18.7 | V600E | 25.0 | V600E | 35.0 |
| 3 | M | V600 | V600E | 37.5 | V600E | 2.5 | V600E | 5.2 |
| 4 | M | WT 3 | WT | 0.0 | WT | 0.0 | WT | 0.0 |
| 5 | M | V600 | NA 4 | - | V600E | 35.0 | WT | 0.0 |
| 6 | P | V600 | V600E | 43.9 | V600E | 43.2 | NA | |
| 7 | M | V600 | V600E | 31.4 | V600E | 0.7 | ||
| 8 | P | WT | WT | 0.0 | WT | 0.0 | ||
| 9 | P | V600 | WT * | 0.0 | V600E | 0.3 | ||
| 10 | P | V600 | V600E | 50.7 | V600E | 16.8 | ||
| 11 | P | WT | WT | 0.0 | WT | 0.0 | ||
| 12 | P | V600 | V600R | 33.0 | V600R | 0.2 | ||
| 13 | M | V600 | NA | - | V600E | 6.4 | ||
| 14 | P | V600 | NA | - | WT * | 0.0 | ||
| Patient No | Tumor | LB1 | LB2 | ||
|---|---|---|---|---|---|
| GENE | MUTATION | VAF % | VAF % | VAF % | |
| 1 | TP53 | Q104 * | 41.25 | 7.0 | 47.3 |
| CCND1 | GAIN | 3.58 | 1.43 | 5.9 | |
| MAP2K2 | Q60P | - | - | 0.22 | |
| GNAS | R201H | - | - | 0.08 | |
| 2 | TP53 | C176F | - | 0.08 | - |
| NRAS | Q61R | - | - | 0.7 | |
| NRAS | Q61K | - | - | 0.3 | |
| 3 | MET | GAIN | 1.3 | - | - |
| 4 | no variants | - | - | - | |
| 5 | FGFR3 | GAIN | NA | 1.26 | - |
| 6 | CTNNB1 | S45F | 32.2 | 23.5 | NA |
| 7 | TP53 | R273C | 35.8 | 1.1 | NA |
| PIK3CA | G1049R | - | 0.07 | NA | |
| 8 | NRAS | Q61K | 24.0 | - | NA |
| 9 | CTNNB1 | S45F | 2.1 | - | NA |
| RAF1 | S257L | 1.3 | - | NA | |
| 10 | PTEN | R173C | 3.7 | - | NA |
| ERBB3 | T355I | 0.5 | - | NA | |
| CTNNB1 | S45F | 0.4 | - | NA | |
| 11 | NRAS | Q61K | 40.0 | 8.0 | NA |
| MAP2K1 | P124S | 0.92 | - | NA | |
| 12 | CTNNB1 | S45F | 0.7 | - | NA NA |
| MTOR | A1459P | 0.56 | - | ||
| 13 | no variants | NA | - | NA | |
| 14 | no variants | NA | - | NA | |
Publisher’s Note: MDPI stays neutral with regard to jurisdictional claims in published maps and institutional affiliations. |
© 2021 by the authors. Licensee MDPI, Basel, Switzerland. This article is an open access article distributed under the terms and conditions of the Creative Commons Attribution (CC BY) license (https://creativecommons.org/licenses/by/4.0/).
Share and Cite
Olbryt, M.; Rajczykowski, M.; Bal, W.; Fiszer-Kierzkowska, A.; Cortez, A.J.; Mazur, M.; Suwiński, R.; Widłak, W. NGS Analysis of Liquid Biopsy (LB) and Formalin-Fixed Paraffin-Embedded (FFPE) Melanoma Samples Using Oncomine™ Pan-Cancer Cell-Free Assay. Genes 2021, 12, 1080. https://0-doi-org.brum.beds.ac.uk/10.3390/genes12071080
Olbryt M, Rajczykowski M, Bal W, Fiszer-Kierzkowska A, Cortez AJ, Mazur M, Suwiński R, Widłak W. NGS Analysis of Liquid Biopsy (LB) and Formalin-Fixed Paraffin-Embedded (FFPE) Melanoma Samples Using Oncomine™ Pan-Cancer Cell-Free Assay. Genes. 2021; 12(7):1080. https://0-doi-org.brum.beds.ac.uk/10.3390/genes12071080
Chicago/Turabian StyleOlbryt, Magdalena, Marcin Rajczykowski, Wiesław Bal, Anna Fiszer-Kierzkowska, Alexander Jorge Cortez, Magdalena Mazur, Rafał Suwiński, and Wiesława Widłak. 2021. "NGS Analysis of Liquid Biopsy (LB) and Formalin-Fixed Paraffin-Embedded (FFPE) Melanoma Samples Using Oncomine™ Pan-Cancer Cell-Free Assay" Genes 12, no. 7: 1080. https://0-doi-org.brum.beds.ac.uk/10.3390/genes12071080