
Current Practices for Reference Gene Selection in RT-qPCR of Aspergillus: Outlook and Recommendations for the Future


Biology Department, McMaster University, 1280 Main St. W, Hamilton, ON L8S 4K1, Canada
*
Author to whom correspondence should be addressed.
Genes 2021, 12(7), 960; https://0-doi-org.brum.beds.ac.uk/10.3390/genes12070960
Submission received: 25 May 2021
/
Revised: 20 June 2021
/
Accepted: 21 June 2021
/
Published: 24 June 2021
(This article belongs to the Section Microbial Genetics and Genomics)
Abstract
:Aspergillus is a genus of filamentous fungi with vast geographic and ecological distributions. Species within this genus are clinically, agriculturally and biotechnologically relevant, leading to increasing interest in elucidating gene expression dynamics of key metabolic and physiological processes. Reverse-transcription quantitative Polymerase Chain Reaction (RT-qPCR) is a sensitive and specific method of quantifying gene expression. A crucial step for comparing RT-qPCR results between strains and experimental conditions is normalisation to experimentally validated reference gene(s). In this review, we provide a critical analysis of current reference gene selection and validation practices for RT-qPCR gene expression analyses of Aspergillus. Of 90 primary research articles obtained through our PubMed query, 17 experimentally validated the reference gene(s) used. Twenty reference genes were used across the 90 studies, with beta-tubulin being the most used reference gene, followed by actin, 18S rRNA and glyceraldehyde 3-phosphate dehydrogenase. Sixteen of the 90 studies used multiple reference genes for normalisation. Failing to experimentally validate the stability of reference genes can lead to conflicting results, as was the case for four studies. Overall, our review highlights the need to experimentally validate reference genes in RT-qPCR studies of Aspergillus.
1. Introduction
The ascomycete genus Aspergillus is among the first described filamentous fungi, dating back to 1729, as recorded by Pier Antonio Micheli, an Italian biologist and priest. Under a microscope, the asexual spore-forming structure of these fungi looks like an aspergillum, a “holy water sprinkler”, and Micheli named these fungi in the genus Aspergillus [1,2]. Since then, over 300 species have been described and recognised in this genus [3]. These species differ in a diversity of morphological, physiological and phylogenetic characters. Aspergillus fungi are broadly distributed across the globe, and are found in diverse ecological niches such as soil, composts, water, buildings, air, and in or on plants [4]. Species in this genus have significant impacts on many fields, including biotechnology (e.g., antibiotics production) [5], fermented food production [6], food safety (e.g., mycotoxin production and food contamination) [7] and human health [2]. In addition, several Aspergillus species have been model organisms for understanding the fundamental biology, including physiology and genetics, of fungi and eukaryotes [8,9].
An emerging theme on the studies of these organisms is the regulations of gene expressions and metabolic pathways, and how the regulated expressions are related to their beneficial and detrimental effects to human welfares. For example, several Aspergillus species are employed frequently in the food and beverage industry as fermenters of soy, to make sake, miso and soy sauce [6]. Understanding how the genes are involved in producing these products could help develop strategies to control their expressions for optimal commercial productions. On the other hand, several other Aspergillus species are opportunistic human fungal pathogens (HFPs), including Aspergillus fumigatus, Aspergillus flavus, Aspergillus niger, Aspergillus terreus and Aspergillus nidulans [10,11]. Globally, each year there are approximately 4.8 million cases of allergic bronchopulmonary aspergillosis (including asthma), 3 million cases of chronic pulmonary aspergillosis and 250,000 cases of invasive aspergillosis [12]. The dominant cause of aspergillosis in humans is A. fumigatus [10]. Furthermore, A. flavus can not only cause human infections, but along with Aspergillus parasiticus, can also produce aflatoxins that contaminate foods and severely impact human health, with long-term exposure leading to infertility and endocrine disorders [7].
Among human hosts infected with pathogenic Aspergillus, effective treatment often requires antifungal drugs such as itraconazole, voriconazole and amphotericin B [13]. Currently, voriconazole is the recommended first-line of treatment and prophylactic agent against invasive aspergillosis [14]. However, drug-resistant strains are increasing in both environmental and clinical populations of A. fumigatus and other opportunistic species [2]. Infections by drug-resistant fungal pathogens are associated with elevated length of hospitalisation and higher mortality [15]. Understanding the mechanism(s) of drug resistance in Aspergillus pathogens, including A. fumigatus, could help monitor and improve treatment options. In addition, there is increasing evidence that secreted enzymes in A. fumigatus play an important role in pathogen colonisation and host tissue damage. Intriguingly, strain Z5 of A. fumigatus has multiple xylanases [16], which can break down xylan into its constituents of xylose, arabinose and glucuronic acid, all of which can then be used in the production of biofuels [17]. Better control of the specific pathways involved in producing these beneficial enzymes could generate significant economic benefits.
Over the years, several approaches and techniques have been developed to monitor and quantify gene expression. These techniques include Northern blotting, microarray hybridisation, high throughput transcriptome sequencing and reverse-transcription quantitative polymerase chain reaction (RT-qPCR). RT-qPCR quantifies the amount of mRNA in a biological sample, and takes this as a measurement of gene expression [18,19]. RT-qPCR possesses several advantages over other methods: it is quick, capable of high-throughput processing, and is highly sensitive and specific [18,19]. Additionally, RT-qPCR is useful for detecting low-abundance transcripts, as the high annealing temperature used during RT-qPCR allows for highly specific primer binding to the target gene [20]. Indeed, RT-qPCR is often used to confirm the results obtained using other approaches [21,22,23,24,25,26,27,28,29,30,31,32]. However, in order to accurately quantify gene expression using RT-qPCR, the normalisation of mRNA levels to validated reference genes is required [18]. Through normalisation using appropriate reference genes, the impact of differences in RNA yield (due to variation in extraction), cDNA yield (due to variation in reverse-transcription) and amplification efficiency on gene expression levels can be minimised [19]. Thus, by controlling for these differences, normalisation allows for the comparison of mRNA levels across different experimental treatments [19].
A good reference gene is one that is stably expressed under the experimental conditions being tested [19]. The Minimum Information for publication of Quantitative real-time PCR Experiments (MIQE) guidelines recommend using two or more validated reference genes to normalise gene expression data [19]. Using the geometric mean of multiple reference genes achieves high accuracy of normalisation, and is recommended over the arithmetic mean, as it better controls for differences in the amount of mRNA and outliers between genes [33]. When using multiple reference genes, it is also important to select genes that are not co-regulated, as co-regulated genes may lead to false positives as they lead to stable expression ratios [33]. Overall, inappropriate and/or insufficient reference genes can lead to the wrong interpretation of results, and reduce the reliability of experimental data [18,19]. Therefore, careful consideration should go into the selection of reference genes for RT-qPCR analysis.
In this review, we describe the reference genes that have been used for normalising gene expressions in RT-qPCR analyses for species in the genus Aspergillus. We review how the reference genes were selected in these studies, and whether they were validated under the specific experimental conditions. In addition, we briefly summarise how these reference genes were used in RT-qPCR to help understand the important biological processes in these fungi. Towards the end, we discuss the potential areas of improvements for selecting robust reference genes.
2. Reference Genes for Gene Expression Analyses of Aspergillus
To assess the state of reference genes in RT-qPCR studies of Aspergillus, in this review, we searched PubMed using the search query: “Aspergillus qPCR”. The loose search criteria were used to assure that we cast a wide net for any relevant studies available for our review. In total, this query returned 575 results which were manually curated to exclude those used to quantify fungal load, or those that did not specifically examine gene expression in Aspergillus, but that mentioned members of the genus in the abstract and with RT-qPCR studies in organisms other than Aspergillus. This allowed us to obtain information from 90 primary studies (Table 1, Table S1) [16,21,22,23,24,25,26,27,28,29,30,31,32,34,35,36,37,38,39,40,41,42,43,44,45,46,47,48,49,50,51,52,53,54,55,56,57,58,59,60,61,62,63,64,65,66,67,68,69,70,71,72,73,74,75,76,77,78,79,80,81,82,83,84,85,86,87,88,89,90,91,92,93,94,95,96,97,98,99,100,101,102,103,104,105,106,107,108,109,110] and one reference gene validation study [111], from 2001 to 2020. For each of these 90 studies, we manually extracted information on the species, genes, experimental conditions, purpose of the study and analytical methods used.
Overall, 15 species of Aspergillus were examined: A. aculeatus [34,35]; A. carbonarius [32,36,37]; A. cristatus [24]; A. fischeri [38]; A. flavus [28,39,40,41,42,43,44,45,46,47,48,49,50,51,52,53,54,55,56,57]; A. fumigatus [16,21,22,23,27,31,58,59,60,61,62,63,64,65,66,67,68,69,70,71,72,73,74]; A. luchuensis [26,75]; A. nidulans [30,76,77,78,79,80,81,82,83,84,85,86]; A. niger [87,88,89,90,91,92,93,94]; A. nomius [95]; A. oryzae [25,83,88,96,97,98,99,100,101]; A. parasiticus [29,48,50,55,102,103,104,105,106]; A. sojae [102]; A. terreus [67,68,107,108]; and A. westerdijkiae [109,110] (Table 1, Table S1). The most common reference gene used in these studies was beta-tubulin, which was used 31 times in the literature [38,41,42,46,47,48,49,50,51,52,53,54,55,56,62,63,64,65,66,67,68,69,70,76,80,81,82,83,98,106,109], followed by actin (30 times) [16,21,22,23,24,25,26,30,34,42,43,44,45,60,61,75,76,77,78,79,89,90,91,96,97,103,104,105,107,108], the 18S ribosomal RNA gene (18S rRNA; 12 times) [27,28,29,36,39,40,41,58,59,87,88,102] and glyceraldehyde-3-phosphate (GAPDH, gpdA and gpdh; 10 times) [30,31,35,52,54,60,71,90,92,110] (Table 1, Figure 1, Table S1). Reference genes that were used four or fewer times [16,27,34,37,38,41,53,57,60,70,72,73,74,82,84,85,86,93,94,95,99,100,101] are grouped under Section 2.5 of this review.
In Section 2.1, Section 2.2, Section 2.3, Section 2.4 and Section 2.5 below, we briefly describe the history of use for each reference gene, as well as the relevant research results of these gene expression studies in Aspergillus. We also provide an analysis of the consistency or inconsistencies of the studies regarding the validation of reference genes. Validation of specific reference genes for use under the specific experimental conditions tested was provided in only 17 of the 90 studies (Table 1, Table S1) [16,27,30,32,35,38,41,46,52,54,55,77,86,94,103,105,107]. Table 1 is organised alphabetically first by species and second by reference gene, followed by the date of publication, and includes the species examined, reference gene used, whether the reference gene was validated and the experimental conditions for each of the 90 papers returned by our PubMed search. A brief explanation of how the reference genes were validated, the associated gene symbol for each reference gene, strains used, type of sample taken, number of biological replicates and normalisation strategy are described in supplementary Table S1. Together, our review highlights the need for more frequent reference gene validation and standardising normalisation practices in RT-qPCR gene expression studies of Aspergillus.
2.1. Beta-Tubulin
Beta-tubulin is a subunit of a universal eukaryotic protein called tubulin, the basic structural unit of microtubule. Tubulin is a heterodimer, consisting of equal numbers of alpha-tubulin and beta-tubulin subunits [112]. Microtubules are part of the cytoskeleton, and provide structure and shape to eukaryotic cells. Because of the essential role microtubules play, both the alpha- and beta- tubulin encoding genes are highly conserved; as a result, they are commonly used for evolutionary studies. For example, the beta-tubulin gene is commonly used in phylogenetic [113] and taxonomic [114] studies of fungi. However, the copy number of beta-tubulin in Aspergillus genomes can vary [115]. For example, there are two copies of beta-tubulin in A. nidulans, while there is only one copy in A. niger [115]. In A. nidulans, each beta-tubulin performs a different function. The benA-encoded beta-tubulin is involved in nuclear movement and vegetative growth during mitosis [112,116], while the tubC-encoded beta-tubulin is involved in conidiation [112].
Beta-tubulin has been used as a reference gene in gene expression studies since 1988 [117], and in RT-qPCR studies as early as 2000 [118]. In this review, beta-tubulin was used as a reference gene 31 times in studies examining gene expressions in A. nidulans (5) [76,80,81,82,83], A. fumigatus (9) [62,63,64,65,66,67,68,69,70], A. flavus (13) [41,42,46,47,48,49,50,51,52,53,54,55,56], A. parasiticus (4) [48,50,55,106], A. oryzae (2) [83,98], A. terreus (2) [67,68], A. westerdijkiae (1) [109] and A. fischeri (1) [38] (Table 1, Table S1). Of these 31 studies, nine provided a rationale for choosing beta-tubulin as a reference gene [38,41,46,47,52,55,62,98,109], though only six provided proper validated justification [38,41,46,52,54,55]. Many of these studies examined the impact of abiotic factors, such as the wavelength of light [82], nutrient availability [64,76,106], water activity [47], temperature [67,106] and pH [76] on the expressions of metabolic and biosynthesis genes. A select few examined the effects of biotic factors, such as the impact of co-incubation with Streptomyces spp. [42,54], Eurotium cristatum [56], Debaryomyces hansenii CYC 1244 [109] and Listeria monocytogenes [41] on the expressions of genes associated with aflatoxin biosynthesis. Several studies examined the effects of antifungal treatment on the expressions of antifungal resistance-associated genes [62,68,80], while others explored alternative treatments for minimising aflatoxin production [42,50,52,54,55,56]. Targeted and spontaneous mutations were also heavily examined in the literature, characterising the function of putative genes [65] or the specific effects on metabolic [38,66,81,83] and antifungal resistance [69] pathways. The following two sections will discuss the experimental conditions and findings of the studies that validated beta-tubulin as a stable reference gene for use under the specific conditions of the study, and those that did not provide justification for its use, respectively. Studies that specifically aimed to validate reference genes under a specific set of conditions will be discussed below in Section 3.
2.1.1. Studies That Validated Beta-Tubulin Expression Stability under the Experimental Conditions Tested
Of the 31 studies that used beta-tubulin as a reference gene for RT-qPCR, only six validated the reference gene for use under the specific experimental conditions being studied [38,41,46,52,54,55]. Cacares et al. 2016 and Lappa et al. 2019 followed the “gold standard” for reference gene selection by using NormFinder [119] to evaluate the stability of multiple reference genes (of which beta-tubulin was one of them) in their studies examining the expression of genes related to aflatoxin biosynthesis [41,52]. In their analyses, beta-tubulin was demonstrated to be stably expressed during A. flavus growth under specific experimental conditions: at 27 °C on malt extract agar (MEA) supplemented with 0.5 mM eugenol [52]; and during growth in malt extract broth (MEB) at 25 °C and 30 °C in the presence or absence of L. monocytogenes [41]. In addition to validating stability, both research groups also used multiple reference genes for normalisation [41,52], thus applying the “gold standard” for RT-qPCR data normalisation [19].
Previous studies have identified that 30 genes are involved in aflatoxin biosynthesis in A. flavus [7]. These genes include the specific regulators aflR and aflS, and several early (aflA, aflB, and aflC or pksA) and later (aflD or nor-1, aflM or ver-1, aflN, aflO, aflP or omtA, and aflQ) pathway genes as well as those not shown to be directly associated with the pathway (aflT) [7]. Here we will use the naming conventions of the aflatoxin biosynthesis genes as recommended by Yu et al. [120]. Aside from these genes, several global regulatory genes were also identified to be associated with aflatoxin biosynthesis, including veA [121], mtfA [122] and msnA [123]. With this background information, here we briefly review the studies that investigated the potential influences of environmental factors on aflatoxin production through RT-qPCR.
In their 2016 study, Carces et al. found that 26 out of the 27 aflatoxin biosynthesis genes that they examined showed decreased expression following treatment with 0.5 mM eugenol, where the only gene that did not decrease in expression was aflT [52]. They also demonstrated that the genes involved in the later steps of the AFB1 biosynthesis pathway, such as aflQ, were more affected by eugenol treatment than early pathway genes, such as aflA and aflB [52]. Moreover, they found that global regulators veA, mtfA and msnA were upregulated [52].
In another study published by the same group two years later, Caceres et al. assessed the efficacy of S. roseolus as a biocontrol agent against AFB1 aflatoxin production in A. flavus [54]. The group used the same method of quantification for RT-qPCR as they did previously, and the same reference genes, including beta-tubulin [54]. They examined the expression of 27 genes in the aflatoxin biosynthesis pathway, as well as the impact of S. roseolus co-incubation on the expression of genes involved in fungal development, response to external stimuli and oxidative stress [54]. As was observed in their study investigating the effects of 0.5 mM eugenol treatment, twenty-six of the 27 genes in the AFB1 aflatoxin biosynthesis pathway showed significantly decreased expression after four days of co-incubation with S. roseolus, where again, only aflT expression was not significantly reduced [54]. Moreover, the expression of the two AFB1 transcriptional regulators, aflR and aflS, was significantly reduced 6-fold, and the genes involved in early aflatoxin biosynthesis were less affected than those involved in the intermediate and later stages [54]. This suggests that reduction in the expression of aflatoxin biosynthesis pathway genes may be mediated by a reduction in alfR and aflS, where the few AFlR-AFLS complexes translated were used up for the expression of the early pathway genes, leading to fewer complexes available for the expression of the late pathway genes, and consequently a greater reduction in their expression [52]. Since aflT does not possess the binding site for the AflR transcription factor, and is therefore not regulated by the AFLR-AFLS complex [124], this may explain why aflT expression is unaffected following either treatment with 0.5 mM eugenol [52], in their previous study, or by co-incubation with S. roseoulus [54]. Given that the results of the two studies are the same with regards to the expression pattern of the aflatoxin biosynthesis genes, the use of beta-tubulin (and GAPDH discussed below) is reasonable, despite the experimental conditions being different (treatment with 0.5 mM eugenol [52] versus co-incubation with S. roseoulus) [54]. Additionally, following co-incubation with S. roseoulus, several of the genes involved in fungal development increased in expression, with mtfA being the most affected global regulator, exhibiting a significant 3.5-fold increase in expression [54]. Of those involved in the fungal response to external stimuli, gprA was the most affected, with its expression significantly increasing 5.5-fold [54]. Of the ten oxidative stress genes investigated, the two most affected genes were atfB and cat2, which decreased 149.2-fold and increased 3.7-fold, respectively [54]. Altogether, co-incubation with S. roseoulus was effective at reducing AFB1 biosynthesis and protein concentration, making it an attractive alternative to phytopharmaceuticals used in agriculture [54].
Lappa et al. demonstrated that there was a temperature threshold for aflatoxin expression, and that L. monocytogenes decreased aflatoxin production at the protein level [41]. Mayer et al. also provided experimental evidence for stable beta-tubulin expression in their study monitoring aflD expression in A. flavus during growth on wheat in a petri dish for nine days [46]. They found that aflD mRNA levels were highest on the fourth day of incubation, and decreased after day six, the day at which AFB1 protein levels first became detectable [46]. These results demonstrated that there was a transient induction of aflD expression in A. flavus before translation of AFB1 begins [46]. Similarly, Devi and Sashidhar stated that the antimicrobial peptides (AMPs) used in their study did not affect the expression of the reference gene, beta-tubulin, although they found that each of the four AMPs tested (PPD1 (FRLHF); 66-10 (FRLKFH); 77-3 (FRLKFHF); and D4E1- 12 (FKLRAKIKVRLRAKIKL)) significantly reduced the expression of the aflatoxin biosynthesis genes aflR, alfC, aflD, aflM and aflP in A. flavus and A. parasiticus [55]. Moreover, of the four AMPs tested, two (77-3 and D4E1) were the most effective inhibitors of expression [55]. Together, these RT-qPCR studies using beta-tubulin as a reference gene helped reveal the general conditions associated with increases (e.g., two days of incubation with wheat), and decreases (e.g., eugenol and AMP treatments and co-incubation with L. monocytogenes) in aflatoxin production by A. flavus and A. parasiticus.
Aside from being used as a validated reference for monitoring the expression of genes involved in mycotoxin productions in A. flavus, beta-tubulin has also been used for studying the regulation of gene expression related to other phenotypes. Specifically, in their study examining the role of mannitol in conidia stress resistance and ascospore development, Wyatt and colleagues provided experimental evidence for the stability of beta-tubulin expression during A. fischeri growth on oatmeal agar for up to six days [38]. However, they found that the mRNA levels of beta-tubulin were low in 30-day ascospores, and thus chose to normalise beta-tubulin and target gene expression to an additional reference gene, experimentally validated histone 3 (his-H3), for 30-day culture data [38]. They measured the expression of mpdA, mtdA, mtdA and esdC in wildtype and in three mpdA deletion mutants [38]. mpdA was maximally expressed in 6-day ascospore-forming wildtype cultures, at which time mtdA and mtdB were also highly expressed, indicating that these genes may play a role in mannitol metabolism during early ascospore development [38].
2.1.2. Studies Missing Proper Beta-Tubulin Expression Stability Validation
Among the studies that used beta-tubulin as a reference gene, 25 did not provide experimental validation for its uses under the specific conditions tested [42,47,48,49,50,51,53,56,62,63,64,65,66,67,68,69,70,76,80,81,82,83,98,106,109]. These studies included those examining the expression of clinically relevant genes, such as those contributing to antifungal resistance [62,63,68,69,80], mycotoxin production [109], aflatoxin biosynthesis [42,47,48,49,50,53,56,106] and infection in steroid and chemotherapeutic mouse models [70]. They also included studies investigating changes in the expression genes associated with nutrient-sensing [76], calcium transport [66], iron acquisition [64], germination and conidiation [82], as well as those with potential industrial applications [83,98]. Other studies focussed on characterising proteins, such as the heat shock protein, Hsp60 [67] and sialidase enzyme [65]. One study also looked at how targeted mutations to the Spt-Ada-Gcn5-acetyltransferase components of A. nidulans affected the expression of an aldehyde dehydrogenase and three alcohol dehydrogenases [81].
When reference gene expression stability is not validated, it can be difficult to interpret conflicting RT-qPCR results. For example, Abdel-Hadi et al. reported that 90W water activity delayed the expression of the aflatoxin biosynthesis activator, aflR, and that the structural genes, aflD, aflM and aflP, were expressed prior to the detection of aflR mRNA [47]. Moreover, at 85W, only aflD and aflM were expressed [47]. This indicates that structural gene expression may be independent of aflR under these conditions [47], contrary to the findings of Degola et al., who found that expression of the structural genes aflD, aflO and aflQ, was not detectable until 48 h of incubation in yeast extract sucrose (YES) agar, indicating reliance on prior aflR expression [125]. Interestingly, both research groups used beta-tubulin as a reference gene [47,125], demonstrating that their experimental conditions might have had a profound effect on gene expression of similar target genes. However, of greater interest and concern is the apparent differences in beta-tubulin expression in Abdel-Hadi et al.’s paper, as indicated by the changes in band intensity in Figure 4 of their study [47]. It seems that the expression of the reference gene changed substantially from week 2 to 3 at 85W [47], further suggesting that beta-tubulin expression stability was not validated by the authors, and that its expression was not stable under their experimental conditions. In this study’s conditions, beta-tubulin was unlikely to be an appropriate reference gene.
Similarly, using beta-tubulin as a reference for normalisation, Fattahi et al. found that there was a significant increase in cyp51A expression in natural voriconazole-resistant A. flavus isolates, following growth in liquid media at 30 °C [51]. Their results were consistent with studies examining mutations in cyp51A, contributing to voriconazole resistance in A. fumigatus [126] and A. lentulus [127], as well as those examining laboratory-induced resistance in A. flavus [128]. However, Liu et al. found that cyp51A did not contribute to voriconazole resistance in A. flavus BMU29791, a strain isolated from a patient with invasive aspergillosis [129]. In their study, Liu et al. treated A. flavus with 0.25 μg/mL of voriconazole in minimal media, and used actin as a reference gene, though they also did not provide experimental evidence for validation of its stability [129]. Since the reference genes were not experimentally demonstrated to be stable under the tested conditions in either case [51,129], instead of different mutations causing the drug resistances among strains, alternative explanations such as differences in stability of reference genes in the experimental conditions cannot be ruled out. If the beta-tubulin and actin genes were validated under the experimental conditions used in these studies, it would be easier to determine whether the differences observed were caused by genetic differences among the strains and species.
2.2. Actin
Actin forms microfilaments and is among the most abundant proteins in eukaryotic cells [130]. Actin was first used as a reference gene in gene expression studies as early as 1985 [131], and similar to beta-tubulin, actin was first used as a reference gene in RT-qPCR studies as early as 2000 [132].
In our literature search, we found 17 reported usages of actin [16,21,23,25,26,34,42,43,60,75,77,78,79,89,91,96,108], 12 usages of beta-actin [22,24,44,45,61,76,90,97,103,104,105,107] and one reported usage of gamma actin [30] as reference genes. Unlike in the human genome, which contains about 20 copies of actin genes that make up six different isoforms of actin proteins [133], most fungi are known to contain only one actin gene [134,135]. Thus, we were curious as to how similar the actin and beta-actin genes were in Aspergillus fungi. We first checked the specificity of the primers used in these studies using Primer-Blast [136], and found that several of the primer sequences listed for beta-actin matched an actin gene instead, and one study matched both actin and beta-actin genes. We then conducted a BLASTn of the actin gene (Afu6g04740) of A. fumigatus Af293 in FungiDB. The sequence matched the gamma-actin gene (P168DRAFT_280232) in A. campestris with 87% identity, the actin gene (ACLA_095800) in A. clavatus with 94% identity and the actin gene (NFIA_051290) in A. fischeri with 99% identity. The sequence also matched the gamma actin gene, ANID_06542, for A. nidulans with 92% identity. The gamma actin gene in A. nidulans is the only actin gene in the fungus [135], and we will therefore include this reference gene with the counts for the actin reference gene in this review. We further ran a second BLASTn using the beta-actin sequence (accession number: AF276240) that was previously retrieved for A. terreus through Primer-Blast [136] (primers from Sorrentino and colleagues [107]), and compared the results to the BLASTn results for Afu6g04740. Similarly, the beta-actin sequence matched the gamma actin gene (P168DRAFT_280232) in A. campestris with 87% identity, the actin gene (ACLA_095800) in A. clavatus with 94% identity and the actin gene (NFIA_051290) in A. fischeri with 99% identity. Although the results from the FungiDB BLASTn did not contain an exhaustive list of all Aspergillus species, given that the two sequences BLASTed yield the same results in these three species, this demonstrates that actin and beta-actin are most likely the same gene. Here we follow the naming convention of A. fumigatus Af293, and call the gene actin. We have made this change in Table 1, reporting both actin- and beta-actin-encoding genes as actin (Table 1). We have kept the original gene symbols in Table S1 for the reader’s reference (Table S1).
Thus in total, actin was used in 30 studies examining gene expression in A. niger (3) [89,90,91], A. nidulans (4) [30,76,77,78,79], A. fumigatus (6) [16,21,22,23,60,61], A. flavus (4) [42,43,44,45], A. parasiticus (3) [103,104,105], A. cristatus (1) [24], A. oryzae (3) [25,96,97], A. luchuensis (2) [26,75], A. terreus (2) [107,108] and A. aculeatus (1) [34] (Table 1). Of these 30 studies, seven studies provided an explanation for using actin under the conditions tested [16,45,75,78,89,103,105], although only six of these studies provided experimental validation of its expression stability under the specific conditions [16,30,77,103,105,107] (Table 1, Table S1). Like those using beta-tubulin as a reference, many studies used RT-qPCR to investigate aflatoxin biosynthesis [42,44,45,103,104,105]. A few studies also focused on characterising putative biosynthesis pathway genes, such as those involved in trehalose synthesis [89], citric acid production [90] and galactofuranosylation [91], as well as the function of homologous genes in different species of Aspergillus [43,75]. Others looked to identify additional pathways contributing to antifungal resistance and potential antifungal drug targets [21,60,78,79], or tested the efficacy of natural antifungals [23,61]. Below in Section 2.2.1, we briefly describe the specific studies and experimental conditions that validated actin gene as an appropriate reference gene. Studies that did not provide validations are summarised in Section 2.2.2.
2.2.1. Studies Validating Actin Expression Stability under the Experimental Conditions Tested
Of the 30 studies using actin as a reference gene, only six studies verified its stability under the experimental conditions tested [16,30,77,103,105,107] (Table 1, Table S1). Miao et al. followed the “gold standard” for reference gene selection by verifying the expression stability of two reference genes, actin, and the histone-encoding gene of A. fumigatus Z5 under the experimental conditions used in their study [16]. They used geNorm [33] to validate the two reference genes [16]. As such, actin has been demonstrated to be stably expressed during A. fumigatus Z5 growth in Mandels’ salt solution, supplemented with 1% oat spelts xylan, as the xylanase inducer [16]. Using RT-qPCR, Miao and colleagues found that 11 of the 13 xylanase-encoding genes in A. fumigatus Z5 are expressed in response to xylan, in addition to eight xylan-induced secreted proteins [16]. They identified four endoxylanases, two xylosidases, one α-L-arabinofuranosidase and one acetyl xylan esterase as important xylan-degraders, and thus promising agents for future biofuel generation [16].
Gao et al. also followed the “gold standard” for reference gene selection by validating the stability of actin in A. nidulans during its growth in the two media conditions, yeast extract-agar-glucose (YAG) with and without 15% (w/v) polyethylene glycol (PEG), employed in their study [77]. RT-qPCR analysis revealed that the expression of four members of the calcium signalling pathway—midA, crzA, pkaA and pmrA—significantly increased under osmotic stress in the presence of 15% PEG in mobB/cotA mutants of A. nidulans [77].
The gold standard was also applied by Deloménie et al., who also validated the expression stability of two reference genes, actin and GAPDH [30], using GeNorm [33]. They then used these genes to normalise gene expression in their custom Agilent microarray for A. nidulans [30]. They used RT-qPCR to verify the accuracy of the microarray data, by checking the expression of five genes: two that were stably expressed according to microarray analysis, ANID_08764 and ANID_05831; and three that increased in expression, ANID_00858, v00296, and ANID_02343 [30]. RT-qPCR analysis confirmed that ANID_08764 and ANID_05831 were stably expressed, and that ANID_00858, v00296 and ANID_02343 increased in expression, although the fold change was greater for RT-qPCR results [30]. As articulated by the researchers [30], this increase in fold change can be explained by the compression effect often observed for microarrays, and more severely in Agilent microarrays, when comparing RT-qPCR data [137]. The compression effect is attributed to technical limitations of microarrays, such as the limited dynamic range of signal intensities and cross-hybridisation among paralogous sequences [137].
Similarly, Sorrentino and colleagues validated the use of actin as a reference gene under the conditions used in their work, examining the addition of linoleic acid to enhance lovastatin production in A. terreus [107]. A. terreus is the main producer of lovastatin, a drug used to lower cholesterol [138]. Using RT-qPCR, Sorrentino and colleagues found that addition of linoleic acid increased the expression of two lovastatin biosynthetic genes, lovB and lovF [139], when compared to control cultures, while noting that the expression of actin remained consistent [107]. However, the group did not provide the data demonstrating stable actin expression [107]. Thus, fatty acids such as linoleic acid enhance lovastatin production, and this knowledge can be applied to industrial fungal fermentation as a cost-effective method for increasing lovastatin yield [107].
Ghanbari et al. also validated the stability of actin expression in their study, examining the efficacy of Kluyveromyces lactis as a biocontrol agent against aflatoxin production and aflR expression in A. parasiticus [105]. Consequently, actin expression has been shown to be stable during co-incubation with 1.5 × 10⁵ CFU/mL of K. lactis at 30 °C for 48 h [105]. They found that there was a significant decrease in aflR expression in cells treated with K. lactis compared to untreated cells, and that this corresponded with a decrease in aflatoxin production [105]. This indicates that K. lactis may decrease aflatoxin production through the downregulation of aflR [105].
Finally, Kondo et al. used actin as a reference gene to examine the effects of aflastatin A on aflatoxin expression in A. parasiticus [103]. The authors cite their previous work with the same species during exposure to blasticidin and its derivatives as justification for using actin as a reference gene [140]. Since the structures of aflastatin A and blasticidin are similar [141], hypothesising that actin expression would exhibit the same stability when exposed to alfastatin A is reasonable, and therefore the authors provide good justification for its use in their study. The group found that the expression of the aflatoxin biosynthesis genes aflC, aflM, aflP and aflR was significantly diminished following treatment with aflastatin A [103]. Moreover, they found that aflastatin A also decreased the expression of aldA and facA [103], which encode aldehyde dehydrogenase [142] and acetyl-CoA synthetase [143], respectively.
2.2.2. Studies Missing Proper Actin Expression Stability Validation
Twenty-four of the 30 studies did not include proper expression stability validation of actin as a reference gene [21,22,23,24,25,26,34,42,43,44,45,60,61,75,76,78,79,89,90,91,96,97,104,108]. Trevisan et al. and Verheecke et al., who used RT-qPCR to examine the expression of genes involved in nutrient-sensing [76] and aflatoxin biosynthesis [42] (as discussed above), respectively, also used actin as an unvalidated reference gene. As with beta-tubulin, several studies investigated the expression of genes facilitating antifungal resistance [60,61,79] and aflatoxin biosynthesis [42,44,104]. Additionally, two studies used RT-qPCR to confirm RNA-sequencing (RNA-seq) data, including the expression of the growth phase-associated [21] and amylolytic enzyme [26] genes. Similarly, several studies used RT-qPCR to confirm microarray expression data, including the expression of members of the gliotoxin gene cluster [22], non-ribosomal peptide synthetases [23], sporulation-related genes [24] and highly expressed mating-type associated genes [25]. Others studied the expression of genes associated with Galf biosynthesis [78], nitrogen regulation and catabolism [43], citric acid production [75,90], spore color development [96] and conidiation [43,97], as well as putative trehalose synthesis genes [89] and one gene encoding alpha-glucan synthase [91]. Additionally, one study used RT-qPCR to verify increased transcription of genes associated with the industrially relevant product, taxol [108], while another study used RT-qPCR to characterise the acr biosynthetic cluster of a novel protein, Acurin A, in A. aculeatus [34].
As mentioned previously, failure to properly validate reference genes can have negative consequences on the interpretation of results. Bruns et al. used actin as a reference gene in their RT-qPCR experiment, aimed at verifying the expression of four gliotoxin cluster genes obtained using microarray [22]. However, the group did not experimentally validate the expression of actin prior to conducting RT-qPCR [22]. Bruns et al. noted that there was a discrepancy in the expression levels of gliN, gliP, gliG and gliT when comparing the data obtained using microarray to that obtained using RT-qPCR [22]. They noted that the limited dynamic range of detection for microarrays and differences in probe design might have contributed to the differences observed in gene expressions between methods [22]. However, as RT-qPCR was used by the research group to verify the results obtained using microarray [22], it would have been prudent for the researchers to ensure that the reference gene used for RT-qPCR exhibited stable expression under the conditions being tested.
Similarly, Perrin et al. used RT-qPCR to confirm the microarray expression data for seven non-ribosomal peptide synthetases and an additional four non-ribosomal peptide synthetases associated with siderophore biosynthesis [23]. They also used actin as a reference gene, but did not validate its expression stability under the conditions tested [23]. They report that the siderophore gene, sidE, reaches maximum expression during growth under low iron availability [23], conflicting with Reiber et al.’s finding that sideE is insensitive to changes in iron concentrations and is constitutively expressed, except under iron replete conditions (300 μM) at 24 h of growth [144]. Interestingly, Reiber et al. used calmodulin as the reference gene in their study, and demonstrated that calmodulin is constantly expressed in A. fumigatus under the conditions tested (mineral salt medium (pH 6.8), supplemented with 0, 20 and 300 μM) [144]. Curiously, Perrin et al. note that the differences in expression patterns observed between their study and Reiber’s group are likely due to subtle differences in the growth conditions, yet the media composition and iron concentrations used were the same in both studies. The only difference between the two studies was the shaking speed used, which was 230 rpm for Perrin et al. [23] and 280 rpm for Reiber et al. [144]. Therefore, the differences in observed sidE expression may be due to differences in reference gene expression, where actin expression differed under the experimental conditions used by Perrin et al. [23]. In fact, Perrin et al. note that actin expression decreased in the laeA mutant examined during growth under low iron availability, indicating that actin was likely not an appropriate reference gene for their study [23]. To ascertain the cause for the observed differential expression, the actin reference gene must be validated under the experimental conditions used by Perrin’s group. This case clearly illustrates the importance of reference gene validation in RT-qPCR analyses under the specific conditions being studied, and the consequences associated with improper reference gene use.
2.3. 18S rRNA
The 18S rRNA gene encodes the small ribosomal RNA subunit of the translation apparatus in all eukaryotes. The rDNA copy number of the 18S rRNA gene in A. fumigatus is strain-dependent, ranging from 38 copies in the Af293 strain to up to 91 copies in select strains [145]. Unlike single-copy genes, this variable nature in copy number among strains represents a potential drawback of using 18S rRNA as a reference in comparative analyses among strains. However, 18S rRNA is a highly conserved gene at the DNA sequence level, and has been used as a reference gene in gene expression analyses as early as 1990 [146]. Similar to the two previously discussed reference genes, beta-tubulin and actin, the 18S rRNA gene was first used in RT-qPCR analyses as early as 2000 [147]. Additionally, the product of the 18S rRNA gene is commonly used to confirm the overall integrity of the isolated RNA used in RT-qPCR [63,66].
In this review, we found that the 18S rRNA gene was used as a reference gene 12 times in studies examining gene expression in A. niger (2) [87,88], A. fumigatus (3) [27,58,59], A. flavus (4) [28,39,40,41], A. parasiticus (2) [29,102], A. sojae (1) [102], A. oryzae (1) [88] and A. carbonarius (1) [36] (Table 1, Table S1). Only two of the twelve studies validated the use of the 18S rRNA gene under the conditions being tested [27,41], with the remaining ten studies offering no explanation for its use as a reference gene [28,29,36,39,40,58,59,87,88,102] (Table 1, Table S1). As discussed above, several of these studies examined the efficacy of potential antifungals [27] and aflatoxin biosynthesis antagonists [40,41], as well as the influence of abiotic factors, such as temperature and water activity [28], on gene expression. Genetic alterations were also examined, including deletion mutants, to assess the importance of genes involved in aflatoxin biosynthesis [29], conidiation [29] and production of extracellular proteins [39], as well as overexpression strains, to assess the role of cofilin during oxidative stress and pathogenesis [59]. Two groups also examined the influence of carbon and nitrogen sources on the expression of genes in two relevant, yet different pathways: those involved in production of industrially useful xylanases [87]; and harmful allergen-encoding genes [58].
2.3.1. Studies Validating 18S rRNA Expression Stability under the Experimental Conditions Tested
The 18S rRNA gene was only validated in two of the 12 studies examined in this review [27,41]. As mentioned in Section 2.1.1, Lappa et al. employed the “gold standard” for reference gene selection by validating the use of the three reference genes (beta-tubulin, 18S rRNA and calmodulin) under the experimental conditions used in their study examining aflatoxin biosynthesis [41]. Gautam et al. also used the “gold standard” for reference gene selection, by testing the stability of three candidate reference genes (actin, GAPDH and 18S rRNA) in preliminary experiments for their study investigating the efficacy of the antimalarial drug artemisinin against A. fumigatus [27]. Of the three candidate reference genes tested, the 18S rRNA gene exhibited the greatest stability [27]. Using RT-qPCR, seven of 745 genes displaying an altered expression following exposure to 125 μg/mL artemisinin, including the oxidative phosphorylation pathway-specific 64 kDa mitochondrial NADH dehydrogenase, were confirmed to exhibit a similar change in expression [27]. Interestingly, while the 64 kDa mitochondrial NADH dehydrogenase was downregulated upon artemisinin exposure, other oxidative phosphorylation genes were upregulated [27]. One explanation for this is that the 64 kDa mitochondrial NADH dehydrogenase is a specific target of artemisinin, and due to its downregulation, A. fumigatus overexpresses additional oxidative phosphorylation genes to equilibrate the membrane potential of the fungus [27]. Additionally, co-incubation with artemisinin and itraconazole produced a synergistic effect, suggesting that artemisinin may be useful in combination infection treatments with other azole antifungals [27].
2.3.2. Studies Missing Proper 18S rRNA Expression Stability Validation
Ten of the twelve studies that used the 18S rRNA reference gene did not validate its stability under the experimental conditions of their study [28,29,36,39,40,58,59,87,88,102]. Like studies described above in Section 2.2, Chang et al. used RT-qPCR to confirm microarray expression data for genes associated with oxidative stress [29]. Similarly, the expression of aflatoxin biosynthesis genes was also examined in studies using the 18S rRNA gene as a reference [40,102]. These studies also included those investigating the expression of miRNA-like genes [28] and xylanases [87], as well as the expression of genes associated with allergies [58], oxidative stress and cell wall polysaccharide biosynthesis [59]. Other studies looked at the expression of differentially secreted proteins, such as alpha amylase, in response to the deletion of VeA [39] and putative ochratoxin A (OTA) biosynthesis genes [36]. In addition, one study evaluated the expression of single-guide RNA for use in CRISPR-Cas9 editing of A. niger [88].
2.4. GAPDH
Glyceraldehyde-3-phosphate dehydrogenase (GAPDH, also called gpdA and gpdh) plays a vital role in glycolysis by catalysing the conversion of glyceraldehyde-3-phosphate (G3P) to 1,3-biphosphoglycerate in the presence of NAD+ and inorganic phosphate [148]. The role of GAPDH extends to additional cellular processes, acting as a potential transcription factor (as demonstrated by binding to RNA polymerase II in Schizosaccharomyces pombe) [149], glucose availability sensor and corresponding regulator of cell growth [150], as well as apoptosis inducer [151].
GAPDH has been used in gene expression analyses as early as 1991 [152]. It was first used as a reference gene in RT-qPCR analyses as early as 1992 [153], making it the earliest reference gene used of four reference genes discussed in detail in this review. GAPDH was used as a reference gene in ten studies examining gene expression in A. niger (2) [90,92], A. nidulans (1) [30], A. fumigatus (3) [31,60,71], A. flavus (2) [52,54], A. westerdijkiae (1) [110] and A. aculeatus (1) [35] (Table 1, Table S1). These studies included those that investigated the function of proteins, including the type III polyketide synthase [92] and alternative oxidase [90] genes, using deletion and overexpression mutants. Several studies also used RT-qPCR to confirm the results from other gene expression analyses, including microarrays [30,31] and cDNA RDA [110]. Another study by Blosser and Cramer (also discussed above) examined the mechanism of triazole resistance in A. fumigatus mediated by SbrA [60]. Only four of the ten studies using GAPDH as a reference gene experimentally validated its stability [30,35,52,54] (Table 1, Table S1).
2.4.1. Studies That Validated GAPDH Expression Stability under the Experimental Conditions Tested
Of the ten studies that used GAPDH as a reference gene, four studies experimentally validated its expression stability under the conditions being tested [30,35,52,54]. As mentioned above, in Section 2.1.1, Caceres et al. employed the “gold standard” for selecting reference genes when selecting beta-tubulin and GAPDH in their 2016 study, examining the effects of 0.5 mM eugenol on expression of aflatoxin biosynthesis genes [52]. These same reference genes were also used in their latter study examining the impact of S. roseoulus on aflatoxin biosynthesis gene expression [54]. Similarly, Deloménie et al., also mentioned above in Section 2.1.1, employed the “gold standard” for reference gene selection by first validating the expression stability of actin and GAPDH [30].
Tani et al. also validated the expression stability of GAPDH as a reference gene using NormFinder [119], in their study investigating the role of the XlnR signalling pathway in A. aculeatus [35]. Through examining the expression of cellulase and hemicellulase genes (bgl1, cbhI, cmc1, cmc2, xynIa, and xynIb) in A. aculeatus wildtype and Δxlnr strains, during growth in the presence of various carbon sources (1% (w/v) polypeptone, 1% (w/v) glucose, 1% (w/v) avicel, 1% (w/v) xylose, or 1% (w/v) arabinose), the researchers demonstrated that there are two different pathways mediating cellulase and hemicellulase expression [35]. Specifically, there is one pathway that mediates the expression of cbhI, cmc2 and xynIa in minimal media containing 1% (w/v) avicel, which is independent of XlnR signalling [35]. Moreover, expression of cbhI, cmc2 and xynIa was induced by 30 mM cellobiose in the wildtype strain, whereas xynIb and cmc1 expression was not, suggesting that cellobiose is an exclusive inducer of the XlnR-independent pathway [35]. This study was the first to report diverging routes of gene induction via cellulose, to XlnR-dependent and -independent pathways, and makes a valuable contribution to our understanding of transcriptional inducers in filamentous fungi [35].
2.4.2. Studies Missing Proper GAPDH Expression Stability Validation
The remaining six studies using GAPDH as a reference gene did not validate its stability under the conditions tested [31,60,71,90,92,110]. Blosser and Cramer and Hou et al., who investigated the expression of genes involved in antifungal resistance [60] and citric acid production [90] using RT-qPCR and actin, as an unvalidated reference gene, respectively, also used GAPDH as a reference gene. Blosser and Cramer also used a third reference gene in their study, tefA, although this gene was not experimentally validated either [60]. As with the sections above, the expression of genes contributing to antifungal resistance [60,71] was examined. Again, RT-qPCR was used to verify the results of other methods of gene expression analysis, including the change in expression in eight genes in A. fumigatus conidia exposed to human airway epithelial cells [31] and three putative oxidoreductases in A. westerdijkiae [110]. Additionally, one study investigated the expression of the type III polyketide synthase, AnPKSIII [92].
Oosthuizen et al. investigated dual organism transcriptomics, looking at the transcriptome of A. fumigatus conidia and A. fumigatus-infected human airway epithelial cells (AECs) using microarrays [31]. They used RT-qPCR to examine a representative group of genes for both A. fumigatus conidia incubated with AECs or human bronchial epithelial cells (16HBE14o-) and a representative group of genes expressed in AECs and 16HBE14o-[31]. For analysis of A. fumigatus conidia, this representative group of eight genes included those involved in vacuolar acidification and those that possess metallopeptidase activity [31]. Three of the eight A. fumigatus genes—vacuolar ATPase 98 kDA subunit, MAP-1 and SkpA—were significantly upregulated following incubation with either AECs or 16HBE14o- [31]. In contrast, tubulin-specific chaperone C and β-glucosidase significantly increased in expression, but only when incubated with AECs [31]. Similarly, SidA and fdh significantly increased in expression when incubated with 16HBE14o- cells [31]. Overall, microarray and RT-qPCR analysis elucidated similar trends in expression [31]. Through looking at the expression of genes in human epithelial cells and A. fumigatus conidia simultaneously, the researchers provide a better representation of the changing expression dynamics as host and pathogen interact [31].
Hou et al. characterised the role of the mitochondrial alternative oxidase gene, aox1, in citric acid production in A. niger [90]. Interestingly, the researchers did not validate the expression stability of either of their two reference genes, actin and GAPDH, under the experimental conditions used [90]. They compared the expression of six metabolic genes—aox1, cox, cat, hk, pfk and cs—in an aox1 overexpression strain (102) and an Δaox1 strain (3–4), to each other, as well as the parental strain, CGMCC 10142 [90]. In strain 3–4, cox expression increased compared to the parental strain, with a coinciding increase in ATP concentration for all sampled time points, except for 36 h and 48 h [90]. In strain 102, the expression of cox decreased compared to the parental strain [90]. In the absence of aox1, cat expression was more constant and relatively higher during aerobic treatment, in relation to the parental strain [90]. Correspondingly, a negative correlation between aox1 and cat expression was observed in strain 102, compared to the parental strain [90]. The expression of hk, pfk and cs genes was higher in strain 102 compared to strain 3–4 [90]. Citric acid was also produced at higher quantities in strain 102 [90]. This work establishes the linkage between aox1 expression, genes involved in citric acid production, and the amount of citric acid produced, using methodology that can be applied to other industrially relevant biological mechanisms [90].
2.5. Others
Other reference genes that have been used over the last two decades to study gene expression in Aspergillus include those that encode: histones [16,34,38,82,93,94,99,100,101]; nicotinamide adenine dinucleotide phosphate+ hydrogenase [85]; translation elongation factors [84] and elongation factor subunits [60,70,73,74]; ribosomal proteins [86]; putative 1,3-beta-glucan synthase catalytic subunit [72]; calmodulin [37,41,53,95]; internal transcribed spacer regions [57]; and ubiquitin-conjugating enzyme [32] (Table 1, Table S1).
Of those using the above-mentioned reference genes, four studies used multiple reference genes to normalise their expression data [16,41,60,82]. Six different studies experimentally validated the expression stability of the reference genes used under the conditions tested [16,32,38,41,86,94]. Several of the studies have already been discussed above [16,38,41], and we will therefore focus here on three studies that validated the expression of the reference genes used in their work identifying and characterising the conserved WDR gene (FPWDR) in A. nidulans [86], validating RNA-seq data examining OTA biosynthesis in A. carbonarius [32] and modelling the expression dynamics of the XlnR regulon in A. niger [94].
Prior to assessing the impact of deleting FPWDR and the surrounding locus, on the expression of cell wall-associated genes in A. nidulans, Guerriero et al. used geNormPlus [33] to rank the expression stability of five candidate reference genes—rpl37, rpl3, actin, CRP2 and TEF1—during growth in standard minimal media [86]. As rpl37 and rpl3 were the most stable, they were both chosen as reference genes for normalisation [86]. Following genomic analysis of FPDWR, Guerriero et al. deleted FPWDR and the surrounding locus (including bf), generating a heterokaryon transformant (hkΔAN1556) [86]. Since hkΔAN1556 possessed deformities in cell wall morphology [86], the group decided to look at the effect of the deletion on the expression of cell wall-associated genes, including members of the chs family, csmA, csmB, celA, fksA, rhoA [154], pkcA [155], wscA, wscB [156], CPS1 and bf. Generally, the expression of cell wall-associated genes decreased in hkΔAN1556, with a significant reduction in chsED, csmA, csmB, CPS1, fksA and wscB expression [86]. Surprisingly, FPWDR and bf expression was similar in hkΔAN1556 compared to the control strain, which suggests that there are nuclei within hkΔAN1556 where FPWDR and the surrounding locus were not deleted, and thus their expression is retained [86]. Taken together with its proximity to the chsD gene and the presence of cell wall deformities, the alterations in gene expression observed for hkΔAN1556 indicate that FPWDR plays a role in the cell wall [86].
Gerin et al. used RT-qPCR to confirm their RNA-seq data, demonstrating differential expression of five polyketide synthases, four non-ribosomal peptide synthetases and one chloroperoxidase in A. carbonarius during OTA-inducing conditions [32]. To determine the best reference gene for normalisation, the group assessed the expression stability of beta-tubulin, calmodulin and ubiquitin-conjugating enzyme during A. carbonarius growth in minimal media at 25 °C in the dark without shaking, using BestKeeper [157]. Of the three candidate reference genes tested, the ubiquitin-conjugating enzyme was the most stable, and therefore was used to normalise their RT-qPCR data [32]. The RT-qPCR analysis demonstrated similar patterns of gene expression as observed for RNA-seq, after A. carbonarius growth in minimal media in the dark at 25 °C without shaking for four, six and eight days [32]. Overall, their results provide a comprehensive view of the different expression networks that may be connected to OTA production [32].
Omony et al. used the histone-encoding gene hist in their work building off their previous studies [158,159], and modelling the transcription dynamics of 23 genes in the XlnR regulon using time-course RT-qPCR expression data of A. niger [94]. The group previously experimentally validated the expression of the histone-encoding gene under the same experimental conditions, treatment with 1 mM or 50 mM D-xylose, and in the same strains used in their study, A. niger N400 (wildtype) and NW28 (a derepressed CreA mutant) [158]. As in their study four years earlier [158], Omony et al. found that the expression of XlnR regulon was higher for the 1 mM D-xylose treatment in both the wildtype and mutant strains [94]. They also found that the induction of hemicellulose genes was higher for the 1 mM D-xylose condition, and that xlnR expression was constant, regardless of functional CreA or D-xylose concentration [94]. The group also presents an updated kinetic differential equation model for the transcription of the XlnR regulon [94]. As the general results of their two studies were consistent, this is excellent support for the use of the histone-encoding gene for examining XlnR regulon transcription in A. niger, using 1 mM and 50 mM D-xylose for transcriptional induction [94,158].
3. Validation of Candidate Reference Genes in Aspergillus
The studies highlighted above use RT-qPCR to answer a diversity of research questions about gene expression in various species of Aspergillus under specific experimental conditions. In this section, we will highlight the need for studies validating the expression stability of candidate reference genes under standard laboratory conditions by discussing two large-scale validation studies in A. flavus and A. niger. We will also summarise all reference genes experimentally validated to date with their associated species and experimental conditions, and highlight the traditional reference genes that were shown to be less stably expressed than the selected reference gene under the specific tested experimental conditions.
3.1. Validation of hisH4 and cox5 for Studying Aflatoxin Biosynthesis in A. flavus
From our PubMed search, only one study was returned that assessed the expression of multiple candidate reference genes under a specific set of conditions [111]. To find reference genes suitable for RT-qPCR analysis of aflatoxin biosynthesis genes in A. flavus, Suleman and Somai tested the expression stability of four reference genes (actA (actin), sarA (secretion associated binding protein), hisH4 (histone H4) and cox5 (cytochrome C oxidase subunit V)) under aflatoxin-inducing, growth in sucrose low salts (SLS) or sucrose low salts supplemented with 117 mM ammonium sulphate (SLS + NH4), as well as non-inducing growth in lactose low salts (LLS), conditions at acidic (pH = 4.0) or alkaline (pH = 8.5) pH [111]. They chose actin, sarA and cox5 for testing, as their expression stability was previously demonstrated in A. niger [160], and hisH4, as it had been previously used to normalise expression in A. oryzae [161].
Prior to assessing the stability of the candidate reference genes, Suleman and Somai assessed the primer pairs for each gene [111]. An ideal primer pair should: (1) produce an amplification efficiency of ~100% (indicating a doubling of product per cycle); (2) produce a standard curve with a slope of −3.32, y-intercept less than 40 and correlation coefficient of >0.990; and (3) amplify one product (as indicated by a single peak in melt-curve analysis) [19,162]. The amplification efficiencies of cox5 and hisH4 were ~100%, while the amplification efficiencies of sarA and actin were less than 80%, despite attempts to redesign and optimise the primers [111]. Therefore, only cox5 and hisH4 were assessed further [111]. As the standard deviations of the Cq values was less than one for both cox5 and hisH4 when comparing different treatment conditions, BestKeeper and REST2009 analyses demonstrated that there was no significant change in expression for either gene [111].
As mentioned in the introduction above, using multiple, validated reference genes is the MIQE recommended practice for normalising gene expression data [19]. Thus, to assess whether normalisation with one reference gene (cox5 or hisH4) or both reference genes together yielded more robust results, the researchers normalised the expression of a “dummy” reference gene, with a set Cq value of 15, to the experimentally obtained Cq values of each reference gene, as well as to the sum of their Cq values, using REST2009 [111]. Using this method, the “dummy” gene should not exhibit a change in expression (expression ratio of ~1.0 with a p-value > 0.055) [163]. When comparing normalisation with hisH4 or cox5 alone, to normalisation with both cox5 and hisH4 together, a better overall expression ratio was observed when using both reference genes for normalising the data from acidic and alkaline conditions [111]. When assessing the expression data under specific conditions, they found that normalisation with both reference genes also produced the best expression ratio for SLS + NH4 [111]. However, under three sets of conditions (when normalising expression data following growth on SLS under acidic and alkaline conditions; when comparing expression during growth on SLS + NH4 to SLS under acidic and alkaline conditions; and when comparing expression during growth on LLS to SLS under acidic conditions), normalisation with hisH4 yielded the best expression ratio [111]. Normalisation with cox5 only yielded a better expression ratio for data obtained following growth on LLS, as well as when comparing expression during growth on LLS to SLS under alkaline conditions [111]. Collectively, these results show that the use of multiple reference genes is not always optimal for the conditions being tested [111]. Thus, this study highlights the need to validate the stability and the utility of reference genes under the specific conditions of each experiment.
3.2. Validation of actA, sarA and cox5 for Studying glaA Expression in A. niger
Bohle et al. experimentally validated the expression stability of ten candidate reference genes (actA, sarA, cox5, apsC (aminopeptidase C), gpd (GAPDH), glkA (glucokinase), g6pdh (glucose-6-phosphate dehydrogenase), icdA (isocitrate dehydrogenase precursor), pfkA (phosphofructokinase) and pgiA (phosphoglucose isomerase) in A. niger during growth in batch and continuous cultures, with glaA-inducing and -non-inducing conditions [160]. They first examined the expression stability of each gene in fedbatch cultures of A. niger, with glucose as the carbon source and continuous glucoamylase (glaA)-induction, for nine time points using geNorm [160]. Interestingly, one of the most used reference genes, GAPDH (used in ten studies highlighted in this review [30,31,35,52,54,60,71,90,92,110], two of which examined expression in A. niger [90,92] specifically) was the least stable under these conditions [160]. This further illustrates the importance of experimentally validating commonly used reference genes for use in study-specific conditions.
Since the researchers were interested in examining expression stability for a diverse range of experimental conditions, they decided to examine the six most stably expressed genes, act/sarA, g6pdh, cox5, apsC and pgiA (most to least stable), under glaA-inducing (glucose as the carbon source) and -non-inducing (xylose or maltose as the carbon source) conditions in modified Vogel-Medium with stir speeds, and pH varying from 400–1000 per min and 3.0 to 5.5, respectively [160]. They found actA and sarA to be the most stably expressed, followed by cox5 [160]. Since their dataset contained more samples for glaA-inducing conditions, they repeated their analysis with an equally represented dataset to ensure that the same three genes were consistently the most stable, irrespective of induction [160]. They found that the order of stability differed following the second analysis, where act and cox5 exhibited the greatest stability, followed by sarA again, demonstrating the influence of experimental conditions on reference gene stability [160].
To further investigate the potential advantage of normalisation using three validated reference genes, they compared the correlation coefficients computed following regression with the normalisation factor for act, sarA and cox5 (Nact,sarA,cox5), the unvalidated reference gene, GAPDH (NGAPDH) and total RNA [160]. Nact,sarA,cox5 resulted in the highest correlation coefficient, demonstrating that the combination of the three validated reference genes was the best approach under the experimental conditions [160].
An important consideration noted by the authors is that these genes are all from different functional classes, and thus co-regulation of these genes is highly unlikely [160]. The absence of co-regulation is critical when using geNorm, as co-regulated genes can lead to high stability ranking and the inclusion of false positives [33]. Therefore, this work presents three experimentally validated reference genes that are suitable for studying glaA expression, while continuing to highlight the crucial first step of experimentally validating reference genes.
3.3. Reference Genes Currently Validated for Use in Aspergillus
Based on our review of the literature in Section 2, Section 3.1 and Section 3.2 above, the genes shown in Table 2 are recommended as reference genes for the specified experimental conditions. In this table, we also provide the species that these genes have been validated for, as well as the primers for each species and each recommended reference gene (Table 2). Table 2 is organised alphabetically by species first and reference gene second, followed by date. The information in Table 2 was extracted from 21 publications [16,27,30,32,35,38,41,46,52,54,55,77,86,94,103,105,107,111,141,144,160].
While the reference genes described above are validated for use under the specific conditions described in Table 2 below, three papers that tested the expression stability of multiple candidate reference genes demonstrated that several traditionally used reference genes were less stably expressed under the experimental conditions tested than the reference genes that they chose [27,32,86]. In their preliminary experiments, Gautam et al. found that actin and GAPDH were less optimal reference genes than the 18S rRNA gene for RT-qPCR gene expression analysis of A. fumigatus during exposure to 125 μg/mL artemisinin or solvent control for 3 h at 37 °C [27]. Similarly, Gerin et al. found that beta-tubulin and calmodulin were less suitable reference genes than the ubiquitin-conjugating enzyme for RT-qPCR gene expression analysis of A. carbonarius during growth in minimal media under OTA-inducing conditions for four, six and eight days in the dark at 25 °C [32]. Guerriero et al. also demonstrated that actin was less optimal for assessing gene expression in A. nidulans during growth in liquid minimal media under standard conditions, than two putative ribosomal proteins, L37 and L3 [86]. These two putative ribosomal genes were also found to be more suitable reference genes than CRP2 and TEF1 under these experimental conditions [86].
Additionally, as highlighted in the candidate reference gene validation study by Bohle et al. and discussed in Section 3.2 above, a traditionally used reference gene, GAPDH, was found to be the least stable candidate reference gene in feed-batch cultures of A. niger, with glucose and continuous glaA-induction [160]. Additionally, the candidate reference genes, icdA, glkA and pfkA (most to least stable), demonstrated low stability, and are therefore not the most suitable reference genes for use under these conditions [160]. Under glA-inducing and non-inducing conditions in modified Vogel-Medium with a pH range of 3.0–5.5 and stir speed of 400–1000 per minute, the candidate reference genes pgiA, apsC and g6pdh (most to least stable) were demonstrated to be less stable than actin, sarA and cox5 [160].
4. Reference Gene-Specific Google Scholar Queries
In this study, we focused our analyses on PubMed search results. However, though PubMed is a major database for the biomedical literature, there are other databases. As a broader search for RT-qPCR studies of Aspergillus fungi, we conducted an additional set of queries using Google Scholar, with the following structure: “Aspergillus “reference gene” qPCR”, where “reference gene” corresponds to the gene symbol associated with the reference gene of interest. We added quotation marks around the reference gene symbol to specifically search for the reference gene symbol as an entire string, and ensure that the substrings comprising the reference gene symbol would not be searched separately. For example, the 18S rRNA gene was queried as “Aspergillus “18S rRNA” qPCR” and not “Aspergillus 18S rRNA qPCR”. The dates of the returned results of the queries ranged from 1983 to 2021. Figure 2 summarised the search results for all reference genes reviewed in our initial PubMed searches. The Google Scholar query that returned the most results corresponded to the 18S rRNA gene, returning 3290 results total (Figure 2). This was followed by the query for GAPDH with 3209 results, ITS1 with 3170 results and ITS4 with 1630 results (Figure 2).
It is important to note that the search queries described in this section have several limitations. One limiation is that because qPCR is also used as a diagnostic tool for the detection and quantification of Aspergillus species [164], the results of each query likely contain these studies, as well as relevant gene expression studies. Additionally, any papers that contain “Aspergillus”in the body of their report, such as the introduction, but do not specifically examine gene expression in Aspergillus, may also be returned by the queries. Therefore, while the total results returned by each query may be used as a proxy for reference gene use frequency in qPCR gene expression analysis, the Google Scholar search results require manual curation as was done during the original PubMed search described in Section 2 above, in order to determine the relevance of the Google Scholar search results literature to our current study.
5. Concluding Remarks and Recommendations
In a recent 2018 review of reference gene validation practices for RT-qPCR of insects, Shakeel and colleagues discuss the validation of reference genes thus far for select insect species, while emphasising the need for a comprehensive group of studies to be conducted under diverse experimental conditions for all species of insects [165]. They note that several studies of classical housekeeping genes show varying expression under different experimental conditions, and indicate ribosomal genes as a promising new set of genes for further stability analysis in insect-specific studies [165].
In the literature reviewed above, we discussed several methods employed by those who validated the reference genes for normalisation in their studies, including GeNorm [33], BestKeeper [157] and NormFinder [119]. Shakeel and colleagues discussed the benefits of these and other methods, RefFinder and ΔCt, for assessing reference gene stability, and noted how each method may lead to slight differences in reference gene stability rankings [165]. As stated by the group, both GeNorm and Normfinder are excellent programs for the initial assessment of candidate reference gene stability, each with their own advantage, with GeNorm capable of determining the number of reference genes to use [33], and NormFinder computing the stability of each reference gene separately to avoid the consequences associated with co-regulation [119]. Given that different programs for determining reference gene stability may yield different stability rankings, we recommend that researchers use more than one program to validate the stability of the reference genes used under the experimental conditions being tested. In agreement with Shakeel and colleagues, because the results of some programs, such as GeNorm, may be biased due to co-regulation, care should be taken to select candidate reference genes that are not co-regulated.
Interestingly, Shakeel and colleagues noted nearly the same four reference genes as those most used in RT-qPCR studies in general across organisms: beta-actin, GAPDH, beta-tubulin and 18S rRNA, citing papers as early as 2004 [165]. Our examination of 90 RT-qPCR studies, spanning 2001 to 2020, further demonstrates this to be the case for Aspergillus. The authors note that as of 2000, beta-actin and GAPDH were used 90% of the time without proper validation [165]. Out of the 30 usages of actin and 10 usages of GAPDH across the 90 studies we examined, actin was used without validation approximately 83% of the time, and GAPDH 60%. Similarly, of the 31 usages of beta-tubulin and 12 usages of 18S rRNA across the 90 studies we examined, beta-tubulin was used without validation approximately 81% of the time, and 18S rRNA, approximately 83%.
Since its publication in 2018, this article by Shakeel and colleagues on insects has been cited 22 times by articles in PubMed. Fourteen of these citing articles are those evaluating candidate reference genes [166,167,168,169,170,171,172,173,174,175,176,177,178,179]. We hope that our critical review will similarly stimulate future research on experimentally validating reference genes for gene expression studies in Aspergillus (and in fungi in general) using RT-qPCR. Without experimental validation of reference genes, it can be difficult to interpret the potential contributors to expression differences among strains, genes and treatments. Figure 3 below summarises our recommended practice for reference gene selection.
Supplementary Materials
The following are available online at https://0-www-mdpi-com.brum.beds.ac.uk/article/10.3390/genes12070960/s1, Table S1: Summary of experimental information for 90 RT-qPCR studies of Aspergillus.
Author Contributions
Conceptualisation, M.A. and J.X.; Writing—original draft preparation, M.A. and J.X.; Writing—review and editing, M.A. and J.X.; Visualisation, M.A. and J.X.; Supervision, J.X.; Project administration, J.X.; and Funding acquisition, J.X. Both authors have read and agreed to the published version of the manuscript.
Funding
This research was supported by grants from the Natural Sciences and Engineering Research Council of Canada (Grant No. CRDPJ 474638-14), and by the Institute of Infectious Diseases Research (IIDR) Antibiotic Resistance Initiative and the Faculty of Science’s Global Science Initiative of McMaster University. M.A. is funded by an Ontario Graduate Fellowship.
Institutional Review Board Statement
Not applicable.
Informed Consent Statement
Not applicable.
Acknowledgments
We thank members of the Xu lab for their support.
Conflicts of Interest
The authors declare no conflict of interest.
References
- Anonymous. Etymologia: Aspergillus. Emerg. Infect. Dis. 2006, 12, 1. [Google Scholar] [CrossRef]
- Ashu, E.E.; Xu, J. Strengthening the One Health Agenda: The Role of Molecular Epidemiology in Aspergillus Threat Management. Genes 2018, 9, 359. [Google Scholar] [CrossRef] [Green Version]
- Bennett, J.W. An Overview of the Genus Aspergillus. In Aspergillus: Molecular Biology and Genomics; Caister Academic Press: Poole, UK, 2010; p. 17. [Google Scholar]
- Warris, A.; Verweij, P.E. Clinical implications of environmental sources for Aspergillus. Med. Mycol. 2005, 43 (Suppl. 1), S59–S65. [Google Scholar] [CrossRef] [Green Version]
- Demain, A.L.; Martens, E. Production of valuable compounds by molds and yeasts. J. Antibiot. 2017, 70, 347–360. [Google Scholar] [CrossRef] [Green Version]
- Ashu, E.; Forsythe, A.; Vogan, A.A.; Xu, J. Filamentous Fungi in Fermented Foods. In Fermented Foods: Biochemistry and Biotechnology; CRC Press: Boca Raton, FL, USA, 2015. [Google Scholar] [CrossRef]
- Caceres, I.; Khoury, A.A.; Khoury, R.E.; Lorber, S.; Oswald, I.P.; Khoury, A.E.; Atoui, A.; Puel, O.; Bailly, J.D. Aflatoxin Biosynthesis and Genetic Regulation: A Review. Toxins 2020, 12, 150. [Google Scholar] [CrossRef] [PubMed] [Green Version]
- Martinelli, S.D. Aspergillus nidulans as an experimental organism. Prog. Ind. Microbiol. 1994, 29, 33–58. [Google Scholar] [PubMed]
- Hong, J.S.; Ryu, K.H.; Kwon, S.J.; Kim, J.W.; Kim, K.S.; Park, K.C. Phylogenetics and Gene Structure Dynamics of Polygalacturonase Genes in Aspergillus and Neurospora crassa. Plant Pathol. J. 2013, 29, 234–241. [Google Scholar] [CrossRef] [PubMed] [Green Version]
- Sugui, J.A.; Kwon-Chung, K.J.; Juvvadi, P.R.; Latge, J.P.; Steinbach, W.J. Aspergillus fumigatus and related species. Cold Spring Harb. Perspect. Med. 2014, 5, a019786. [Google Scholar] [CrossRef] [Green Version]
- Guarro, J.; Xavier, M.O.; Severo, L.C. Differences and similarities amongst pathogenic Aspergillus species. In Aspergillosis: From Diagnosis to Prevention; Alessandro, C.P., Ed.; Springer: Dordrecht, The Netherlands, 2009; p. 25. [Google Scholar]
- Bongomin, F.; Gago, S.; Oladele, R.O.; Denning, D.W. Global and Multi-National Prevalence of Fungal Diseases-Estimate Precision. J. Fungi 2017, 3, 57. [Google Scholar] [CrossRef]
- Vahedi-Shahandashti, R.; Lass-Florl, C. Novel Antifungal Agents and Their Activity against Aspergillus Species. J. Fungi 2020, 6, 213. [Google Scholar] [CrossRef]
- Misch, E.A.; Safdar, N. Updated guidelines for the diagnosis and management of aspergillosis. J. Thorac. Dis. 2016, 8, E1771–E1776. [Google Scholar] [CrossRef]
- Lestrade, P.P.; Bentvelsen, R.G.; Schauwvlieghe, A.; Schalekamp, S.; van der Velden, W.; Kuiper, E.J.; van Paassen, J.; van der Hoven, B.; van der Lee, H.A.; Melchers, W.J.G.; et al. Voriconazole Resistance and Mortality in Invasive Aspergillosis: A Multicenter Retrospective Cohort Study. Clin. Infect. Dis. 2019, 68, 1463–1471. [Google Scholar] [CrossRef] [PubMed] [Green Version]
- Miao, Y.; Li, J.; Xiao, Z.; Shen, Q.; Zhang, R. Characterization and identification of the xylanolytic enzymes from Aspergillus fumigatus Z5. BMC Microbiol. 2015, 15, 126. [Google Scholar] [CrossRef] [PubMed] [Green Version]
- Dodd, D.; Cann, I.K. Enzymatic deconstruction of xylan for biofuel production. Glob. Chang. Biol. Bioenergy 2009, 1, 2–17. [Google Scholar] [CrossRef] [PubMed] [Green Version]
- Huggett, J.; Dheda, K.; Bustin, S.; Zumla, A. Real-Time RT-PCR normalisation; strategies and considerations. Genes Immun. 2005, 6, 279–284. [Google Scholar] [CrossRef] [PubMed] [Green Version]
- Bustin, S.A.; Benes, V.; Garson, J.A.; Hellemans, J.; Huggett, J.; Kubista, M.; Mueller, R.; Nolan, T.; Pfaffl, M.W.; Shipley, G.L.; et al. The MIQE guidelines: Minimum information for publication of quantitative real-time PCR experiments. Clin. Chem. 2009, 55, 611–622. [Google Scholar] [CrossRef] [Green Version]
- Guenin, S.; Mauriat, M.; Pelloux, J.; van Wuytswinkel, O.; Bellini, C.; Gutierrez, L. Normalization of qRT-PCR data: The necessity of adopting a systematic, experimental conditions-specific, validation of references. J. Exp. Bot. 2009, 60, 487–493. [Google Scholar] [CrossRef] [Green Version]
- Baltussen, T.J.H.; Coolen, J.P.M.; Zoll, J.; Verweij, P.E.; Melchers, W.J.G. Gene co-expression analysis identifies gene clusters associated with isotropic and polarized growth in Aspergillus fumigatus conidia. Fungal Genet. Biol. 2018, 116, 62–72. [Google Scholar] [CrossRef]
- Bruns, S.; Seidler, M.; Albrecht, D.; Salvenmoser, S.; Remme, N.; Hertweck, C.; Brakhage, A.A.; Kniemeyer, O.; Muller, F.M. Functional genomic profiling of Aspergillus fumigatus biofilm reveals enhanced production of the mycotoxin gliotoxin. Proteomics 2010, 10, 3097–3107. [Google Scholar] [CrossRef]
- Perrin, R.M.; Fedorova, N.D.; Bok, J.W.; Cramer, R.A.; Wortman, J.R.; Kim, H.S.; Nierman, W.C.; Keller, N.P. Transcriptional regulation of chemical diversity in Aspergillus fumigatus by LaeA. PLoS Pathog. 2007, 3, e030050. [Google Scholar] [CrossRef] [Green Version]
- Ge, Y.; Yu, F.; Tan, Y.; Zhang, X.; Liu, Z. Comparative Transcriptome Sequence Analysis of Sporulation-Related Genes of Aspergillus cristatus in Response to Low and High Osmolarity. Curr. Microbiol. 2017, 74, 806–814. [Google Scholar] [CrossRef]
- Wada, R.; Maruyama, J.; Yamaguchi, H.; Yamamoto, N.; Wagu, Y.; Paoletti, M.; Archer, D.B.; Dyer, P.S.; Kitamoto, K. Presence and functionality of mating type genes in the supposedly asexual filamentous fungus Aspergillus oryzae. Appl. Environ. Microbiol. 2012, 78, 2819–2829. [Google Scholar] [CrossRef] [PubMed] [Green Version]
- Kojo, T.; Kadooka, C.; Komohara, M.; Onitsuka, S.; Tanimura, M.; Muroi, Y.; Kurazono, S.; Shiraishi, Y.; Oda, K.; Iwashita, K.; et al. Characterization of amylolytic enzyme overproducing mutant of Aspergillus luchuensis obtained by ion beam mutagenesis. J. Gen. Appl. Microbiol. 2018, 63, 339–346. [Google Scholar] [CrossRef] [Green Version]
- Gautam, P.; Upadhyay, S.K.; Hassan, W.; Madan, T.; Sirdeshmukh, R.; Sundaram, C.S.; Gade, W.N.; Basir, S.F.; Singh, Y.; Sarma, P.U. Transcriptomic and proteomic profile of Aspergillus fumigatus on exposure to artemisinin. Mycopathologia 2011, 172, 331–346. [Google Scholar] [CrossRef] [PubMed]
- Bai, Y.; Lan, F.; Yang, W.; Zhang, F.; Yang, K.; Li, Z.; Gao, P.; Wang, S. sRNA profiling in Aspergillus flavus reveals differentially expressed miRNA-like RNAs response to water activity and temperature. Fungal Genet. Biol. 2015, 81, 113–119. [Google Scholar] [CrossRef] [PubMed]
- Chang, P.K.; Scharfenstein, L.L.; Luo, M.; Mahoney, N.; Molyneux, R.J.; Yu, J.; Brown, R.L.; Campbell, B.C. Loss of msnA, a putative stress regulatory gene, in Aspergillus parasiticus and Aspergillus flavus increased production of conidia, aflatoxins and kojic acid. Toxins 2011, 3, 82–104. [Google Scholar] [CrossRef] [Green Version]
- Delomenie, C.; Grentzmann, G.; Oestreicher, N.; Mesnage, R.; Velot, C. Development and validation of a custom microarray for global transcriptome profiling of the fungus Aspergillus nidulans. Curr. Genet. 2016, 62, 897–910. [Google Scholar] [CrossRef] [Green Version]
- Oosthuizen, J.L.; Gomez, P.; Ruan, J.; Hackett, T.L.; Moore, M.M.; Knight, D.A.; Tebbutt, S.J. Dual organism transcriptomics of airway epithelial cells interacting with conidia of Aspergillus fumigatus. PLoS ONE 2011, 6, e020527. [Google Scholar] [CrossRef] [Green Version]
- Gerin, D.; de Miccolis Angelini, R.M.; Pollastro, S.; Faretra, F. RNA-Seq Reveals OTA-Related Gene Transcriptional Changes in Aspergillus carbonarius. PLoS ONE 2016, 11, e0147089. [Google Scholar] [CrossRef]
- Vandesompele, J.; de Preter, K.; Pattyn, F.; Poppe, B.; van Roy, N.; de Paepe, A.; Speleman, F. Accurate normalization of real-time quantitative RT-PCR data by geometric averaging of multiple internal control genes. Genome Biol. 2002, 3. [Google Scholar] [CrossRef] [Green Version]
- Wolff, P.B.; Nielsen, M.L.; Slot, J.C.; Andersen, L.N.; Petersen, L.M.; Isbrandt, T.; Holm, D.K.; Mortensen, U.H.; Nodvig, C.S.; Larsen, T.O.; et al. Acurin A, a novel hybrid compound, biosynthesized by individually translated PKS- and NRPS-encoding genes in Aspergillus aculeatus. Fungal Genet. Biol. 2020, 139, 103378. [Google Scholar] [CrossRef]
- Tani, S.; Kanamasa, S.; Sumitani, J.; Arai, M.; Kawaguchi, T. XlnR-independent signaling pathway regulates both cellulase and xylanase genes in response to cellobiose in Aspergillus aculeatus. Curr. Genet. 2012, 58, 93–104. [Google Scholar] [CrossRef]
- Crespo-Sempere, A.; Gil, J.V.; Martinez-Culebras, P.V. Proteome analysis of the fungus Aspergillus carbonarius under ochratoxin A producing conditions. Int. J. Food Microbiol. 2011, 147, 162–169. [Google Scholar] [CrossRef]
- El Khoury, R.; Choque, E.; El Khoury, A.; Snini, S.P.; Cairns, R.; Andriantsiferana, C.; Mathieu, F. OTA Prevention and Detoxification by Actinobacterial Strains and Activated Carbon Fibers: Preliminary Results. Toxins 2018, 10, 137. [Google Scholar] [CrossRef] [Green Version]
- Wyatt, T.T.; van Leeuwen, M.R.; Wosten, H.A.; Dijksterhuis, J. Mannitol is essential for the development of stress-resistant ascospores in Neosartorya fischeri (Aspergillus fischeri). Fungal Genet. Biol. 2014, 64, 11–24. [Google Scholar] [CrossRef] [Green Version]
- Duran, R.M.; Gregersen, S.; Smith, T.D.; Bhetariya, P.J.; Cary, J.W.; Harris-Coward, P.Y.; Mattison, C.P.; Grimm, C.; Calvo, A.M. The role of Aspergillus flavus veA in the production of extracellular proteins during growth on starch substrates. Appl. Microbiol. Biotechnol. 2014, 98, 5081–5094. [Google Scholar] [CrossRef]
- Liang, D.; Xing, F.; Selvaraj, J.N.; Liu, X.; Wang, L.; Hua, H.; Zhou, L.; Zhao, Y.; Wang, Y.; Liu, Y. Inhibitory Effect of Cinnamaldehyde, Citral, and Eugenol on Aflatoxin Biosynthetic Gene Expression and Aflatoxin B1 Biosynthesis in Aspergillus flavus. J. Food Sci. 2015, 80, M2917–M2924. [Google Scholar] [CrossRef]
- Lappa, I.K.; Dionysopoulou, A.M.; Paramithiotis, S.; Georgiadou, M.; Drosinos, E.H. Dual Transcriptional Profile of Aspergillus flavus during Co-Culture with Listeria monocytogenes and Aflatoxin B1 Production: A Pathogen-Pathogen Interaction. Pathogens 2019, 8, 198. [Google Scholar] [CrossRef] [PubMed] [Green Version]
- Verheecke, C.; Liboz, T.; Anson, P.; Zhu, Y.; Mathieu, F. Streptomyces-Aspergillus flavus interactions: Impact on aflatoxin B accumulation. Food Addit. Contam. Part A Chem. Anal. Control. Expo. Risk Assess. 2015, 32, 572–576. [Google Scholar] [CrossRef] [PubMed]
- Han, X.; Qiu, M.; Wang, B.; Yin, W.B.; Nie, X.; Qin, Q.; Ren, S.; Yang, K.; Zhang, F.; Zhuang, Z.; et al. Functional Analysis of the Nitrogen Metabolite Repression Regulator Gene nmrA in Aspergillus flavus. Front. Microbiol. 2016, 7, 1794. [Google Scholar] [CrossRef] [PubMed] [Green Version]
- Deabes, M.M.; Khalil, W.K.B.; Attallah, A.G.; El-Desouky, T.A.; Naguib, K.M. Impact of Silver Nanoparticles on Gene Expression in Aspergillus Flavus Producer Aflatoxin B1. Open Access Maced. J. Med. Sci. 2018, 6, 600–605. [Google Scholar] [CrossRef] [Green Version]
- Yuan, J.; Chen, Z.; Guo, Z.; Li, D.; Zhang, F.; Shen, J.; Zhang, Y.; Wang, S.; Zhuang, Z. PbsB Regulates Morphogenesis, Aflatoxin B1 Biosynthesis, and Pathogenicity of Aspergillus flavus. Front. Cell Infect. Microbiol. 2018, 8, 162. [Google Scholar] [CrossRef] [PubMed] [Green Version]
- Mayer, Z.; Farber, P.; Geisen, R. Monitoring the production of aflatoxin B1 in wheat by measuring the concentration of nor-1 mRNA. Appl. Environ. Microbiol. 2003, 69, 1154–1158. [Google Scholar] [CrossRef] [PubMed] [Green Version]
- Abdel-Hadi, A.; Carter, D.; Magan, N. Temporal monitoring of the nor-1 (aflD) gene of Aspergillus flavus in relation to aflatoxin B (1) production during storage of peanuts under different water activity levels. J. Appl. Microbiol. 2010, 109, 1914–1922. [Google Scholar] [CrossRef] [PubMed] [Green Version]
- Jamali, M.; Karimipour, M.; Shams-Ghahfarokhi, M.; Amani, A.; Razzaghi-Abyaneh, M. Expression of aflatoxin genes aflO (omtB) and aflQ (ordA) differentiates levels of aflatoxin production by Aspergillus flavus strains from soils of pistachio orchards. Res. Microbiol. 2013, 164, 293–299. [Google Scholar] [CrossRef]
- Mahmoud, M.A. Detection of Aspergillus flavus in stored peanuts using real-time PCR and the expression of aflatoxin genes in toxigenic and atoxigenic A. flavus isolates. Foodborne Pathog. Dis. 2015, 12, 289–296. [Google Scholar] [CrossRef]
- Yin, H.B.; Chen, C.H.; Kollanoor-Johny, A.; Darre, M.J.; Venkitanarayanan, K. Controlling Aspergillus flavus and Aspergillus parasiticus growth and aflatoxin production in poultry feed using carvacrol and trans-cinnamaldehyde. Poult. Sci. 2015, 94, 2183–2190. [Google Scholar] [CrossRef] [PubMed]
- Fattahi, A.; Zaini, F.; Kordbacheh, P.; Rezaie, S.; Safara, M.; Fateh, R.; Farahyar, S.; Kanani, A.; Heidari, M. Evaluation of mRNA Expression Levels of cyp51A and mdr1, Candidate Genes for Voriconazole Resistance in Aspergillus flavus. Jundishapur J. Microbiol. 2015, 8, e26990. [Google Scholar] [CrossRef] [PubMed] [Green Version]
- Caceres, I.; El Khoury, R.; Medina, A.; Lippi, Y.; Naylies, C.; Atoui, A.; El Khoury, A.; Oswald, I.P.; Bailly, J.D.; Puel, O. Deciphering the Anti-Aflatoxinogenic Properties of Eugenol Using a Large-Scale q-PCR Approach. Toxins 2016, 8, 123. [Google Scholar] [CrossRef] [Green Version]
- Baquiao, A.C.; Rodriges, A.G.; Lopes, E.L.; Tralamazza, S.M.; Zorzete, P.; Correa, B. Expression of Genes by Aflatoxigenic and Nonaflatoxigenic Strains of Aspergillus flavus Isolated from Brazil Nuts. Foodborne Pathog. Dis. 2016, 13, 434–440. [Google Scholar] [CrossRef] [PubMed]
- Caceres, I.; Snini, S.P.; Puel, O.; Mathieu, F. Streptomyces roseolus, A Promising Biocontrol Agent Against Aspergillus flavus, the Main Aflatoxin B (1) Producer. Toxins 2018, 10, 442. [Google Scholar] [CrossRef] [Green Version]
- Devi, M.S.; Sashidhar, R.B. Antiaflatoxigenic effects of selected antifungal peptides. Peptides 2019, 115, 15–26. [Google Scholar] [CrossRef]
- Zhao, Q.; Qiu, Y.; Wang, X.; Gu, Y.; Zhao, Y.; Wang, Y.; Yue, T.; Yuan, Y. Inhibitory Effects of Eurotium cristatum on Growth and Aflatoxin B1 Biosynthesis in Aspergillus flavus. Front. Microbiol. 2020, 11, 921. [Google Scholar] [CrossRef]
- Passone, M.A.; Rosso, L.C.; Etcheverry, M. Influence of sub-lethal antioxidant doses, water potential and temperature on growth, sclerotia, aflatoxins and aflD (=nor-1) expression by Aspergillus flavus RCP08108. Microbiol. Res. 2012, 167, 470–477. [Google Scholar] [CrossRef] [PubMed]
- Lang-Yona, N.; Levin, Y.; Dannemiller, K.C.; Yarden, O.; Peccia, J.; Rudich, Y. Changes in atmospheric CO2 influence the allergenicity of Aspergillus fumigatus. Glob. Chang. Biol. 2013, 19, 2381–2388. [Google Scholar] [CrossRef] [PubMed]
- Jia, X.; Zhang, X.; Hu, Y.; Hu, M.; Tian, S.; Han, X.; Sun, Y.; Han, L. Role of actin depolymerizing factor cofilin in Aspergillus fumigatus oxidative stress response and pathogenesis. Curr. Genet. 2018, 64, 619–634. [Google Scholar] [CrossRef]
- Blosser, S.J.; Cramer, R.A. SREBP-dependent triazole susceptibility in Aspergillus fumigatus is mediated through direct transcriptional regulation of erg11A (cyp51A). Antimicrob. Agents Chemother. 2012, 56, 248–257. [Google Scholar] [CrossRef] [PubMed] [Green Version]
- Nazemi, L.; Hashemi, S.J.; Daie Ghazvini, R.; Saeedi, M.; Khodavaisy, S.; Barac, A.; Modiri, M.; Akbari Dana, M.; Zare Shahrabadi, Z.; Rezaie, S. Investigation of cgrA and cyp51A gene alternations in Aspergillus fumigatus strains exposed to kombucha fermented tea. Curr. Med. Mycol. 2019, 5, 36–42. [Google Scholar] [CrossRef]
- Nascimento, A.M.; Goldman, G.H.; Park, S.; Marras, S.A.; Delmas, G.; Oza, U.; Lolans, K.; Dudley, M.N.; Mann, P.A.; Perlin, D.S. Multiple resistance mechanisms among Aspergillus fumigatus mutants with high-level resistance to itraconazole. Antimicrob. Agents Chemother. 2003, 47, 1719–1726. [Google Scholar] [CrossRef] [Green Version]
- Da Silva Ferreira, M.E.; Malavazi, I.; Savoldi, M.; Brakhage, A.A.; Goldman, M.H.; Kim, H.S.; Nierman, W.C.; Goldman, G.H. Transcriptome analysis of Aspergillus fumigatus exposed to voriconazole. Curr. Genet. 2006, 50, 32–44. [Google Scholar] [CrossRef]
- Power, T.; Ortoneda, M.; Morrissey, J.P.; Dobson, A.D. Differential expression of genes involved in iron metabolism in Aspergillus fumigatus. Int. Microbiol. 2006, 9, 281–287. [Google Scholar]
- Warwas, M.L.; Yeung, J.H.; Indurugalla, D.; Mooers, A.O.; Bennet, A.J.; Moore, M.M. Cloning and characterization of a sialidase from the filamentous fungus, Aspergillus fumigatus. Glycoconj. J. 2010, 27, 533–548. [Google Scholar] [CrossRef]
- Dinamarco, T.M.; Freitas, F.Z.; Almeida, R.S.; Brown, N.A.; dos Reis, T.F.; Ramalho, L.N.; Savoldi, M.; Goldman, M.H.; Bertolini, M.C.; Goldman, G.H. Functional characterization of an Aspergillus fumigatus calcium transporter (PmcA) that is essential for fungal infection. PLoS ONE 2012, 7, e37591. [Google Scholar] [CrossRef] [Green Version]
- Raggam, R.B.; Salzer, H.J.; Marth, E.; Heiling, B.; Paulitsch, A.H.; Buzina, W. Molecular detection and characterisation of fungal heat shock protein 60. Mycoses 2011, 54, e394–e399. [Google Scholar] [CrossRef] [PubMed]
- Blum, G.; Kainzner, B.; Grif, K.; Dietrich, H.; Zeiger, B.; Sonnweber, T.; Lass-Florl, C. In vitro and in vivo role of heat shock protein 90 in Amphotericin B resistance of Aspergillus terreus. Clin. Microbiol. Infect. 2013, 19, 50–55. [Google Scholar] [CrossRef] [PubMed] [Green Version]
- Fraczek, M.G.; Bromley, M.; Buied, A.; Moore, C.B.; Rajendran, R.; Rautemaa, R.; Ramage, G.; Denning, D.W.; Bowyer, P. The cdr1B efflux transporter is associated with non-cyp51a-mediated itraconazole resistance in Aspergillus fumigatus. J. Antimicrob. Chemother. 2013, 68, 1486–1496. [Google Scholar] [CrossRef] [PubMed]
- Kale, S.D.; Ayubi, T.; Chung, D.; Tubau-Juni, N.; Leber, A.; Dang, H.X.; Karyala, S.; Hontecillas, R.; Lawrence, C.B.; Cramer, R.A.; et al. Modulation of Immune Signaling and Metabolism Highlights Host and Fungal Transcriptional Responses in Mouse Models of Invasive Pulmonary Aspergillosis. Sci. Rep. 2017, 7, 17096. [Google Scholar] [CrossRef] [PubMed]
- Da Silva Ferreira, M.E.; Capellaro, J.L.; dos Reis Marques, E.; Malavazi, I.; Perlin, D.; Park, S.; Anderson, J.B.; Colombo, A.L.; Arthington-Skaggs, B.A.; Goldman, M.H.; et al. In vitro evolution of itraconazole resistance in Aspergillus fumigatus involves multiple mechanisms of resistance. Antimicrob. Agents Chemother. 2004, 48, 4405–4413. [Google Scholar] [CrossRef] [Green Version]
- Kurucz, V.; Kruger, T.; Antal, K.; Dietl, A.M.; Haas, H.; Pocsi, I.; Kniemeyer, O.; Emri, T. Additional oxidative stress reroutes the global response of Aspergillus fumigatus to iron depletion. BMC Genom. 2018, 19, 357. [Google Scholar] [CrossRef] [PubMed]
- Gravelat, F.N.; Doedt, T.; Chiang, L.Y.; Liu, H.; Filler, S.G.; Patterson, T.F.; Sheppard, D.C. In vivo analysis of Aspergillus fumigatus developmental gene expression determined by real-time reverse transcription-PCR. Infect. Immun. 2008, 76, 3632–3639. [Google Scholar] [CrossRef] [PubMed] [Green Version]
- Jimenez-Ortigosa, C.; Aimanianda, V.; Muszkieta, L.; Mouyna, I.; Alsteens, D.; Pire, S.; Beau, R.; Krappmann, S.; Beauvais, A.; Dufrene, Y.F.; et al. Chitin synthases with a myosin motor-like domain control the resistance of Aspergillus fumigatus to echinocandins. Antimicrob. Agents Chemother. 2012, 56, 6121–6131. [Google Scholar] [CrossRef] [PubMed] [Green Version]
- Kadooka, C.; Nakamura, E.; Mori, K.; Okutsu, K.; Yoshizaki, Y.; Takamine, K.; Goto, M.; Tamaki, H.; Futagami, T. LaeA Controls Citric Acid Production through Regulation of the Citrate Exporter-Encoding cexA Gene in Aspergillus luchuensis mut. kawachii. Appl. Environ. Microbiol. 2020, 86. [Google Scholar] [CrossRef] [PubMed]
- Trevisan, G.L.; Oliveira, E.H.; Peres, N.T.; Cruz, A.H.; Martinez-Rossi, N.M.; Rossi, A. Transcription of Aspergillus nidulans pacC is modulated by alternative RNA splicing of palB. FEBS Lett. 2011, 585, 3442–3445. [Google Scholar] [CrossRef] [PubMed] [Green Version]
- Gao, L.; Song, Y.; Cao, J.; Wang, S.; Wei, H.; Jiang, H.; Lu, L. Osmotic stabilizer-coupled suppression of NDR defects is dependent on the calcium-calcineurin signaling cascade in Aspergillus nidulans. Cell. Signal. 2011, 23, 1750–1757. [Google Scholar] [CrossRef]
- Alam, M.K.; El-Ganiny, A.M.; Afroz, S.; Sanders, D.A.; Liu, J.; Kaminskyj, S.G. Aspergillus nidulans galactofuranose biosynthesis affects antifungal drug sensitivity. Fungal Genet. Biol. 2012, 49, 1033–1043. [Google Scholar] [CrossRef]
- Liu, F.F.; Pu, L.; Zheng, Q.Q.; Zhang, Y.W.; Gao, R.S.; Xu, X.S.; Zhang, S.Z.; Lu, L. Calcium signaling mediates antifungal activity of triazole drugs in the Aspergilli. Fungal Genet. Biol. 2015, 81, 182–190. [Google Scholar] [CrossRef]
- Semighini, C.P.; Marins, M.; Goldman, M.H.; Goldman, G.H. Quantitative analysis of the relative transcript levels of ABC transporter Atr genes in Aspergillus nidulans by real-time reverse transcription-PCR assay. Appl. Environ. Microbiol. 2002, 68, 1351–1357. [Google Scholar] [CrossRef] [Green Version]
- Georgakopoulos, P.; Lockington, R.A.; Kelly, J.M. SAGA complex components and acetate repression in Aspergillus nidulans. G3 2012, 2, 1357–1367. [Google Scholar] [CrossRef] [Green Version]
- Rohrig, J.; Kastner, C.; Fischer, R. Light inhibits spore germination through phytochrome in Aspergillus nidulans. Curr. Genet. 2013, 59, 55–62. [Google Scholar] [CrossRef]
- Hunter, A.J.; Morris, T.A.; Jin, B.; Saint, C.P.; Kelly, J.M. Deletion of creB in Aspergillus oryzae increases secreted hydrolytic enzyme activity. Appl. Environ. Microbiol. 2013, 79, 5480–5487. [Google Scholar] [CrossRef] [Green Version]
- Szilagyi, M.; Miskei, M.; Karanyi, Z.; Lenkey, B.; Pocsi, I.; Emri, T. Transcriptome changes initiated by carbon starvation in Aspergillus nidulans. Microbiology 2013, 159, 176–190. [Google Scholar] [CrossRef] [Green Version]
- Xiao, L.; Sun, Q.; Lian, B. A Global View of Gene Expression of Aspergillus nidulans on Responding to the Deficiency in Soluble Potassium. Curr. Microbiol. 2016, 72, 410–419. [Google Scholar] [CrossRef]
- Guerriero, G.; Silvestrini, L.; Obersriebnig, M.; Hausman, J.F.; Strauss, J.; Ezcurra, I. A WDR Gene Is a Conserved Member of a Chitin Synthase Gene Cluster and Influences the Cell Wall in Aspergillus nidulans. Int. J. Mol. Sci. 2016, 17, 1031. [Google Scholar] [CrossRef] [Green Version]
- Cui, S.; Wang, T.; Hu, H.; Liu, L.; Song, A.; Chen, H. Investigating the expression of F10 and G11 xylanases in Aspergillus niger A09 with qPCR. Can. J. Microbiol. 2016, 62, 744–752. [Google Scholar] [CrossRef] [PubMed]
- Chutrakul, C.; Panchanawaporn, S.; Jeennor, S.; Anantayanon, J.; Vorapreeda, T.; Vichai, V.; Laoteng, K. Functional Characterization of Novel U6 RNA Polymerase III Promoters: Their Implication for CRISPR-Cas9-Mediated Gene Editing in Aspergillus oryzae. Curr. Microbiol. 2019, 76, 1443–1451. [Google Scholar] [CrossRef]
- Svanstrom, A.; van Leeuwen, M.R.; Dijksterhuis, J.; Melin, P. Trehalose synthesis in Aspergillus niger: Characterization of six homologous genes, all with conserved orthologs in related species. BMC Microbiol. 2014, 14, 90. [Google Scholar] [CrossRef] [PubMed] [Green Version]
- Hou, L.; Liu, L.; Zhang, H.; Zhang, L.; Zhang, L.; Zhang, J.; Gao, Q.; Wang, D. Functional analysis of the mitochondrial alternative oxidase gene (aox1) from Aspergillus niger CGMCC 10142 and its effects on citric acid production. Appl. Microbiol. Biotechnol. 2018, 102, 7981–7995. [Google Scholar] [CrossRef]
- Arentshorst, M.; de Lange, D.; Park, J.; Lagendijk, E.L.; Alazi, E.; van den Hondel, C.; Ram, A.F.J. Functional analysis of three putative galactofuranosyltransferases with redundant functions in galactofuranosylation in Aspergillus niger. Arch. Microbiol. 2020, 202, 197–203. [Google Scholar] [CrossRef] [PubMed] [Green Version]
- Lv, Y.; Xiao, J.; Pan, L. Type III polyketide synthase is involved in the biosynthesis of protocatechuic acid in Aspergillus niger. Biotechnol. Lett. 2014, 36, 2303–2310. [Google Scholar] [CrossRef]
- Khosravi, C.; Kun, R.S.; Visser, J.; Aguilar-Pontes, M.V.; de Vries, R.P.; Battaglia, E. In vivo functional analysis of L-rhamnose metabolic pathway in Aspergillus niger: A tool to identify the potential inducer of RhaR. BMC Microbiol. 2017, 17, 214. [Google Scholar] [CrossRef] [Green Version]
- Omony, J.; Mach-Aigner, A.R.; van Straten, G.; van Boxtel, A.J. Quantitative modeling and analytic assessment of the transcription dynamics of the XlnR regulon in Aspergillus niger. BMC Syst. Biol. 2016, 10, 13. [Google Scholar] [CrossRef] [Green Version]
- Yunes, N.B.S.; Oliveira, R.C.; Reis, T.A.; Baquiao, A.C.; Rocha, L.O.; Correa, B. Effect of temperature on growth, gene expression, and aflatoxin production by Aspergillus nomius isolated from Brazil nuts. Mycotoxin Res. 2019. [Google Scholar] [CrossRef] [PubMed]
- Fernandez, E.Q.; Moyer, D.L.; Maiyuran, S.; Labaro, A.; Brody, H. Vector-Initiated transitive RNA interference in the filamentous fungus Aspergillus oryzae. Fungal Genet. Biol. 2012, 49, 294–301. [Google Scholar] [CrossRef]
- Tsujii, M.; Okuda, S.; Ishi, K.; Madokoro, K.; Takeuchi, M.; Yamagata, Y. A long natural-antisense RNA is accumulated in the conidia of Aspergillus oryzae. Biosci. Biotechnol. Biochem. 2016, 80, 386–398. [Google Scholar] [CrossRef] [PubMed]
- Tamano, K.; Bruno, K.S.; Karagiosis, S.A.; Culley, D.E.; Deng, S.; Collett, J.R.; Umemura, M.; Koike, H.; Baker, S.E.; Machida, M. Increased production of fatty acids and triglycerides in Aspergillus oryzae by enhancing expressions of fatty acid synthesis-related genes. Appl. Microbiol. Biotechnol. 2013, 97, 269–281. [Google Scholar] [CrossRef] [PubMed]
- Kobayashi, A.; Sano, M.; Oda, K.; Hisada, H.; Hata, Y.; Ohashi, S. The glucoamylase-encoding gene (glaB) is expressed in solid-state culture with a low water content. Biosci. Biotechnol. Biochem. 2007, 71, 1797–1799. [Google Scholar] [CrossRef] [PubMed] [Green Version]
- Oda, K.; Kobayashi, A.; Ohashi, S.; Sano, M. Aspergillus oryzae laeA regulates kojic acid synthesis genes. Biosci. Biotechnol. Biochem. 2011, 75, 1832–1834. [Google Scholar] [CrossRef] [Green Version]
- Jin, F.J.; Han, P.; Zhuang, M.; Zhang, Z.M.; Jin, L.; Koyama, Y. Comparative proteomic analysis: SclR is importantly involved in carbohydrate metabolism in Aspergillus oryzae. Appl. Microbiol. Biotechnol. 2018, 102, 319–332. [Google Scholar] [CrossRef] [PubMed]
- Chang, P.K. Lack of interaction between AFLR and AFLJ contributes to nonaflatoxigenicity of Aspergillus sojae. J. Biotechnol. 2004, 107, 245–253. [Google Scholar] [CrossRef]
- Kondo, T.; Sakurada, M.; Okamoto, S.; Ono, M.; Tsukigi, H.; Suzuki, A.; Nagasawa, H.; Sakuda, S. Effects of aflastatin A, an inhibitor of aflatoxin production, on aflatoxin biosynthetic pathway and glucose metabolism in Aspergillus parasiticus. J. Antibiot. 2001, 54, 650–657. [Google Scholar] [CrossRef] [Green Version]
- Akbari Dana, M.; Kordbacheh, P.; Daei Ghazvini, R.; Moazeni, M.; Nazemi, L.; Rezaie, S. Inhibitory effect of vitamin C on Aspergillus parasiticus growth and aflatoxin gene expression. Curr. Med. Mycol. 2018, 4, 10–14. [Google Scholar] [CrossRef]
- Ghanbari, R.; Rezaie, S.; Noorbakhsh, F.; Khaniki, G.J.; Soleimani, M.; Aghaee, E.M. Biocontrol effect of Kluyveromyces lactis on aflatoxin expression and production in Aspergillus parasiticus. FEMS Microbiol. Lett. 2019, 366. [Google Scholar] [CrossRef]
- Lozano-Ojalvo, D.; Rodriguez, A.; Bernaldez, V.; Cordoba, J.J.; Rodriguez, M. Influence of temperature and substrate conditions on the omt-1 gene expression of Aspergillus parasiticus in relation to its aflatoxin production. Int. J. Food Microbiol. 2013, 166, 263–269. [Google Scholar] [CrossRef] [PubMed]
- Sorrentino, F.; Roy, I.; Keshavarz, T. Impact of linoleic acid supplementation on lovastatin production in Aspergillus terreus cultures. Appl. Microbiol. Biotechnol. 2010, 88, 65–73. [Google Scholar] [CrossRef] [PubMed]
- El-Sayed, A.S.A.; Mohamed, N.Z.; Safan, S.; Yassin, M.A.; Shaban, L.; Shindia, A.A.; Shad Ali, G.; Sitohy, M.Z. Restoring the Taxol biosynthetic machinery of Aspergillus terreus by Podocarpus gracilior Pilger microbiome, with retrieving the ribosome biogenesis proteins of WD40 superfamily. Sci. Rep. 2019, 9, 11534. [Google Scholar] [CrossRef] [Green Version]
- Gil-Serna, J.; Patino, B.; Cortes, L.; Gonzalez-Jaen, M.T.; Vazquez, C. Mechanisms involved in reduction of ochratoxin A produced by Aspergillus westerdijkiae using Debaryomyces hansenii CYC 1244. Int. J. Food Microbiol. 2011, 151, 113–118. [Google Scholar] [CrossRef]
- Sartori, D.; Massi, F.P.; Ferranti, L.S.; Fungaro, M.H. Identification of Genes Differentially Expressed Between Ochratoxin-Producing and Non-Producing Strains of Aspergillus westerdijkiae. Indian J. Microbiol. 2014, 54, 41–45. [Google Scholar] [CrossRef] [Green Version]
- Suleman, E.; Somai, B.M. Validation of hisH4 and cox5 reference genes for RT-qPCR analysis of gene expression in Aspergillus flavus under aflatoxin conducive and non-conducive conditions. Microbiol. Res. 2012, 167, 487–492. [Google Scholar] [CrossRef] [PubMed]
- Oakley, B.R. Tubulins in Aspergillus nidulans. Fungal Genet. Biol. 2004, 41, 420–427. [Google Scholar] [CrossRef]
- Begerow, D.; John, B.; Oberwinkler, F. Evolutionary relationships among beta-tubulin gene sequences of basidiomycetous fungi. Mycol. Res. 2004, 108, 1257–1263. [Google Scholar] [CrossRef]
- Msiska, Z.; Morton, J.B. Isolation and sequence analysis of a beta-tubulin gene from arbuscular mycorrhizal fungi. Mycorrhiza 2009, 19, 501–513. [Google Scholar] [CrossRef]
- Zhao, Z.; Liu, H.; Luo, Y.; Zhou, S.; An, L.; Wang, C.; Jin, Q.; Zhou, M.; Xu, J.R. Molecular evolution and functional divergence of tubulin superfamily in the fungal tree of life. Sci. Rep. 2014, 4, 6746. [Google Scholar] [CrossRef] [PubMed] [Green Version]
- Oakley, B.R.; Morris, N.R. A beta-tubulin mutation in Aspergillus nidulans that blocks microtubule function without blocking assembly. Cell 1981, 24, 837–845. [Google Scholar] [CrossRef]
- Lopez de Haro, M.S.; Alvarez, L.; Nieto, A. Testosterone induces the expression of the uteroglobin gene in rabbit epididymis. Biochem. J. 1988, 250, 647–651. [Google Scholar] [CrossRef] [PubMed] [Green Version]
- Shigemasa, K.; Tanimoto, H.; Sakata, K.; Nagai, N.; Parmley, T.H.; Ohama, K.; O’Brien, T.J. Induction of matrix metalloprotease-7 is common in mucinous ovarian tumors including early stage disease. Med. Oncol. 2000, 17, 52–58. [Google Scholar] [CrossRef] [PubMed]
- Andersen, C.L.; Jensen, J.L.; Orntoft, T.F. Normalization of real-time quantitative reverse transcription-PCR data: A model-based variance estimation approach to identify genes suited for normalization, applied to bladder and colon cancer data sets. Cancer Res. 2004, 64, 5245–5250. [Google Scholar] [CrossRef] [Green Version]
- Yu, J.; Chang, P.K.; Ehrlich, K.C.; Cary, J.W.; Bhatnagar, D.; Cleveland, T.E.; Payne, G.A.; Linz, J.E.; Woloshuk, C.P.; Bennett, J.W. Clustered pathway genes in aflatoxin biosynthesis. Appl. Environ. Microbiol. 2004, 70, 1253–1262. [Google Scholar] [CrossRef] [Green Version]
- Duran, R.M.; Cary, J.W.; Calvo, A.M. Production of cyclopiazonic acid, aflatrem, and aflatoxin by Aspergillus flavus is regulated by veA, a gene necessary for sclerotial formation. Appl. Microbiol. Biotechnol. 2007, 73, 1158–1168. [Google Scholar] [CrossRef]
- Zhuang, Z.; Lohmar, J.M.; Satterlee, T.; Cary, J.W.; Calvo, A.M. The Master Transcription Factor mtfA Governs Aflatoxin Production, Morphological Development and Pathogenicity in the Fungus Aspergillus flavus. Toxins 2016, 8, 29. [Google Scholar] [CrossRef] [PubMed]
- Baidya, S.; Duran, R.M.; Lohmar, J.M.; Harris-Coward, P.Y.; Cary, J.W.; Hong, S.Y.; Roze, L.V.; Linz, J.E.; Calvo, A.M. VeA is associated with the response to oxidative stress in the aflatoxin producer Aspergillus flavus. Eukaryot. Cell 2014, 13, 1095–1103. [Google Scholar] [CrossRef] [PubMed] [Green Version]
- Chang, P.K.; Yu, J.; Yu, J.H. AflT, a MFS transporter-encoding gene located in the aflatoxin gene cluster, does not have a significant role in aflatoxin secretion. Fungal Genet. Biol. 2004, 41, 911–920. [Google Scholar] [CrossRef]
- Degola, F.; Berni, E.; Dall’Asta, C.; Spotti, E.; Marchelli, R.; Ferrero, I.; Restivo, F.M. A multiplex RT-PCR approach to detect aflatoxigenic strains of Aspergillus flavus. J. Appl. Microbiol. 2007, 103, 409–417. [Google Scholar] [CrossRef]
- Howard, S.J.; Pasqualotto, A.C.; Denning, D.W. Azole resistance in allergic bronchopulmonary aspergillosis and Aspergillus bronchitis. Clin. Microbiol. Infect. 2010, 16, 683–688. [Google Scholar] [CrossRef] [PubMed]
- Mellado, E.; Alcazar-Fuoli, L.; Cuenca-Estrella, M.; Rodriguez-Tudela, J.L. Role of Aspergillus lentulus 14-alpha sterol demethylase (Cyp51A) in azole drug susceptibility. Antimicrob. Agents Chemother. 2011, 55, 5459–5468. [Google Scholar] [CrossRef] [PubMed] [Green Version]
- Krishnan-Natesan, S.; Chandrasekar, P.H.; Alangaden, G.J.; Manavathu, E.K. Molecular characterisation of cyp51A and cyp51B genes coding for P450 14alpha-lanosterol demethylases A (CYP51Ap) and B (CYP51Bp) from voriconazole-resistant laboratory isolates of Aspergillus flavus. Int. J. Antimicrob. Agents 2008, 32, 519–524. [Google Scholar] [CrossRef] [PubMed]
- Liu, W.; Sun, Y.; Chen, W.; Liu, W.; Wan, Z.; Bu, D.; Li, R. The T788G mutation in the cyp51C gene confers voriconazole resistance in Aspergillus flavus causing aspergillosis. Antimicrob. Agents Chemother. 2012, 56, 2598–2603. [Google Scholar] [CrossRef] [PubMed] [Green Version]
- Dominguez, R.; Holmes, K.C. Actin structure and function. Annu. Rev. Biophys. 2011, 40, 169–186. [Google Scholar] [CrossRef] [PubMed] [Green Version]
- Levi, A.; Eldridge, J.D.; Paterson, B.M. Molecular cloning of a gene sequence regulated by nerve growth factor. Science 1985, 229, 393–395. [Google Scholar] [CrossRef] [Green Version]
- Shang, E.S.; Champion, C.I.; Wu, X.Y.; Skare, J.T.; Blanco, D.R.; Miller, J.N.; Lovett, M.A. Comparison of protection in rabbits against host-adapted and cultivated Borrelia burgdorferi following infection-derived immunity or immunization with outer membrane vesicles or outer surface protein A. Infect. Immun. 2000, 68, 4189–4199. [Google Scholar] [CrossRef] [PubMed] [Green Version]
- Humphries, S.E.; Whittall, R.; Minty, A.; Buckingham, M.; Williamson, R. There are approximately 20 actin gene in the human genome. Nucleic Acids Res. 1981, 9, 4895–4908. [Google Scholar] [CrossRef]
- Cox, G.M.; Rude, T.H.; Dykstra, C.C.; Perfect, J.R. The actin gene from Cryptococcus neoformans: Structure and phylogenetic analysis. J. Med. Vet. Mycol. 1995, 33, 261–266. [Google Scholar] [CrossRef] [PubMed]
- Fidel, S.; Doonan, J.H.; Morris, N.R. Aspergillus nidulans contains a single actin gene which has unique intron locations and encodes a gamma-actin. Gene 1988, 70, 283–293. [Google Scholar] [CrossRef]
- Ye, J.; Coulouris, G.; Zaretskaya, I.; Cutcutache, I.; Rozen, S.; Madden, T.L. Primer-BLAST: A tool to design target-specific primers for polymerase chain reaction. BMC Bioinform. 2012, 13, 134. [Google Scholar] [CrossRef] [PubMed] [Green Version]
- Wang, Y.; Barbacioru, C.; Hyland, F.; Xiao, W.; Hunkapiller, K.L.; Blake, J.; Chan, F.; Gonzalez, C.; Zhang, L.; Samaha, R.R. Large scale real-time PCR validation on gene expression measurements from two commercial long-oligonucleotide microarrays. BMC Genom. 2006, 7, 59. [Google Scholar] [CrossRef] [Green Version]
- Barrios-Gonzalez, J.; Miranda, R.U. Biotechnological production and applications of statins. Appl. Microbiol. Biotechnol. 2010, 85, 869–883. [Google Scholar] [CrossRef]
- Kennedy, J.; Auclair, K.; Kendrew, S.G.; Park, C.; Vederas, J.C.; Hutchinson, C.R. Modulation of polyketide synthase activity by accessory proteins during lovastatin biosynthesis. Science 1999, 284, 1368–1372. [Google Scholar] [CrossRef]
- Sakuda, S.; Ikeda, H.; Nakamura, T.; Kawachi, R.; Kondo, T.; Ono, M.; Sakurada, M.; Inagaki, H.; Ito, R.; Nagasawa, H. Blasticidin A derivatives with highly specific inhibitory activity toward aflatoxin production in Aspergillus parasiticus. J. Antibiot. 2000, 53, 1378–1384. [Google Scholar] [CrossRef] [Green Version]
- Ono, M.; Sakuda, S.; Suzuki, A.; Isogai, A. Aflastatin A, a novel inhibitor of aflatoxin production by aflatoxigenic fungi. J. Antibiot. 1997, 50, 111–118. [Google Scholar] [CrossRef] [Green Version]
- Lockington, R.A.; Sealy-Lewis, H.M.; Scazzocchio, C.; Davies, R.W. Cloning and characterization of the ethanol utilization regulon in Aspergillus nidulans. Gene 1985, 33, 137–149. [Google Scholar] [CrossRef]
- Sandeman, R.A.; Hynes, M.J. Isolation of the facA (acetyl-coenzyme A synthetase) and acuE (malate synthase) genes of Aspergillus nidulans. Mol. Gen. Genet. 1989, 218, 87–92. [Google Scholar] [CrossRef]
- Reiber, K.; Reeves, E.P.; Neville, C.M.; Winkler, R.; Gebhardt, P.; Kavanagh, K.; Doyle, S. The expression of selected non-ribosomal peptide synthetases in Aspergillus fumigatus is controlled by the availability of free iron. FEMS Microbiol. Lett. 2005, 248, 83–91. [Google Scholar] [CrossRef] [Green Version]
- Herrera, M.L.; Vallor, A.C.; Gelfond, J.A.; Patterson, T.F.; Wickes, B.L. Strain-Dependent variation in 18S ribosomal DNA Copy numbers in Aspergillus fumigatus. J. Clin. Microbiol. 2009, 47, 1325–1332. [Google Scholar] [CrossRef] [Green Version]
- Guoth, M.; Murgia, A.; Smith, R.M.; Prystowsky, M.B.; Cooke, N.E.; Haddad, J.G. Cell surface vitamin D-binding protein (GC-globulin) is acquired from plasma. Endocrinology 1990, 127, 2313–2321. [Google Scholar] [CrossRef]
- Gerard, C.J.; Andrejka, L.M.; Macina, R.A. Mitochondrial ATP synthase 6 as an endogenous control in the quantitative RT-PCR analysis of clinical cancer samples. Mol. Diagn. 2000, 5, 39–46. [Google Scholar] [CrossRef] [PubMed]
- Nicholls, C.; Li, H.; Liu, J.P. GAPDH: A common enzyme with uncommon functions. Clin. Exp. Pharmacol. Physiol. 2012, 39, 674–679. [Google Scholar] [CrossRef] [PubMed]
- Mitsuzawa, H.; Kimura, M.; Kanda, E.; Ishihama, A. Glyceraldehyde-3-phosphate dehydrogenase and actin associate with RNA polymerase II and interact with its Rpb7 subunit. FEBS Lett. 2005, 579, 48–52. [Google Scholar] [CrossRef] [Green Version]
- Lee, M.N.; Ha, S.H.; Kim, J.; Koh, A.; Lee, C.S.; Kim, J.H.; Jeon, H.; Kim, D.H.; Suh, P.G.; Ryu, S.H. Glycolytic flux signals to mTOR through glyceraldehyde-3-phosphate dehydrogenase-mediated regulation of Rheb. Mol. Cell. Biol. 2009, 29, 3991–4001. [Google Scholar] [CrossRef] [Green Version]
- Tajima, H.; Tsuchiya, K.; Yamada, M.; Kondo, K.; Katsube, N.; Ishitani, R. Over-Expression of GAPDH induces apoptosis in COS-7 cells transfected with cloned GAPDH cDNAs. Neuroreport 1999, 10, 2029–2033. [Google Scholar] [CrossRef]
- Oikarinen, A.; Makela, J.; Vuorio, T.; Vuorio, E. Comparison on collagen gene expression in the developing chick embryo tendon and heart. Tissue and development time-dependent action of dexamethasone. Biochim. Biophys. Acta 1991, 1089, 40–46. [Google Scholar] [CrossRef]
- Robbins, M.; McKinney, M. Transcriptional regulation of neuromodulin (GAP-43) in mouse neuroblastoma clone N1E-115 as evaluated by the RT/PCR method. Brain Res. Mol. Brain Res. 1992, 13, 83–92. [Google Scholar] [CrossRef]
- De Groot, P.W.; Brandt, B.W.; Horiuchi, H.; Ram, A.F.; de Koster, C.G.; Klis, F.M. Comprehensive genomic analysis of cell wall genes in Aspergillus nidulans. Fungal Genet. Biol. 2009, 46 (Suppl. 1), S72–S81. [Google Scholar] [CrossRef] [Green Version]
- Teepe, A.G.; Loprete, D.M.; He, Z.; Hoggard, T.A.; Hill, T.W. The protein kinase C orthologue PkcA plays a role in cell wall integrity and polarized growth in Aspergillus nidulans. Fungal Genet. Biol. 2007, 44, 554–562. [Google Scholar] [CrossRef] [PubMed]
- Futagami, T.; Nakao, S.; Kido, Y.; Oka, T.; Kajiwara, Y.; Takashita, H.; Omori, T.; Furukawa, K.; Goto, M. Putative stress sensors WscA and WscB are involved in hypo-osmotic and acidic pH stress tolerance in Aspergillus nidulans. Eukaryot. Cell 2011, 10, 1504–1515. [Google Scholar] [CrossRef] [Green Version]
- Pfaffl, M.W.; Tichopad, A.; Prgomet, C.; Neuvians, T.P. Determination of stable housekeeping genes, differentially regulated target genes and sample integrity: BestKeeper—Excel-Based tool using pair-wise correlations. Biotechnol. Lett. 2004, 26, 509–515. [Google Scholar] [CrossRef]
- Mach-Aigner, A.R.; Omony, J.; Jovanovic, B.; van Boxtel, A.J.; de Graaff, L.H. d-Xylose concentration-dependent hydrolase expression profiles and the function of CreA and XlnR in Aspergillus niger. Appl. Environ. Microbiol. 2012, 78, 3145–3155. [Google Scholar] [CrossRef] [Green Version]
- Omony, J.; de Graaff, L.H.; van Straten, G.; van Boxtel, A.J. Modeling and analysis of the dynamic behavior of the XlnR regulon in Aspergillus niger. BMC Syst. Biol. 2011, 5 (Suppl. 1), S14. [Google Scholar] [CrossRef] [Green Version]
- Bohle, K.; Jungebloud, A.; Gocke, Y.; Dalpiaz, A.; Cordes, C.; Horn, H.; Hempel, D.C. Selection of reference genes for normalisation of specific gene quantification data of Aspergillus niger. J. Biotechnol. 2007, 132, 353–358. [Google Scholar] [CrossRef] [PubMed]
- Ogasawara, H.; Obata, H.; Hata, Y.; Takahashi, S.; Gomi, K. Crawler, a novel Tc1/mariner-type transposable element in Aspergillus oryzae transposes under stress conditions. Fungal Genet. Biol. 2009, 46, 441–449. [Google Scholar] [CrossRef]
- Taylor, S.; Wakem, M.; Dijkman, G.; Alsarraj, M.; Nguyen, M. A practical approach to RT-qPCR-Publishing data that conform to the MIQE guidelines. Methods 2010, 50, S1–S5. [Google Scholar] [CrossRef] [PubMed]
- Setiawan, A.N.; Lokman, P.M. The use of reference gene selection programs to study the silvering transformation in a freshwater eel Anguilla australis: A cautionary tale. BMC Mol. Biol. 2010, 11, 75. [Google Scholar] [CrossRef] [PubMed] [Green Version]
- Das, P.; Pandey, P.; Harishankar, A.; Chandy, M.; Bhattacharya, S.; Chakrabarti, A. Standardization of a two-step real-time polymerase chain reaction based method for species-specific detection of medically important Aspergillus species. Indian J. Med. Microbiol. 2017, 35, 381–388. [Google Scholar] [CrossRef]
- Shakeel, M.; Rodriguez, A.; Tahir, U.B.; Jin, F. Gene expression studies of reference genes for quantitative real-time PCR: An overview in insects. Biotechnol. Lett. 2018, 40, 227–236. [Google Scholar] [CrossRef] [PubMed]
- Xie, M.; Zhong, Y.; Lin, L.; Zhang, G.; Su, W.; Ni, W.; Qu, M.; Chen, H. Evaluation of reference genes for quantitative real-time PCR normalization in the scarab beetle Holotrichia oblita. PLoS ONE 2020, 15, e0240972. [Google Scholar] [CrossRef] [PubMed]
- Deng, Y.; Zhao, H.; Yang, S.; Zhang, L.; Zhang, L.; Hou, C. Screening and Validation of Reference Genes for RT-qPCR Under Different Honey Bee Viral Infections and dsRNA Treatment. Front. Microbiol. 2020, 11, 1715. [Google Scholar] [CrossRef]
- Wang, Z.; Meng, Q.; Zhu, X.; Sun, S.; Liu, A.; Gao, S.; Gou, Y. Identification and Evaluation of Reference Genes for Normalization of Gene Expression in Developmental Stages, Sexes, and Tissues of Diaphania caesalis (Lepidoptera, Pyralidae). J. Insect Sci. 2020, 20. [Google Scholar] [CrossRef] [PubMed]
- Wang, X.; Kong, X.; Liu, S.; Huang, H.; Chen, Z.; Xu, Y. Selection of Reference Genes for Quantitative Real-Time PCR in Chrysoperla nipponensis (Neuroptera: Chrysopidae) Under Tissues in Reproduction and Diapause. J. Insect Sci. 2020, 20. [Google Scholar] [CrossRef]
- Zhang, Y.; Chen, J.; Chen, G.; Ma, C.; Chen, H.; Gao, X.; Tian, Z.; Cui, S.; Tian, Z.; Guo, J.; et al. Identification and Validation of Reference Genes for Quantitative Gene Expression Analysis in Ophraella communa. Front. Physiol. 2020, 11, 355. [Google Scholar] [CrossRef] [PubMed]
- Xu, W.; Dong, Y.; Yu, Y.; Xing, Y.; Li, X.; Zhang, X.; Hou, X.; Sun, X. Identification and evaluation of reliable reference genes for quantitative real-time PCR analysis in tea plants under differential biotic stresses. Sci. Rep. 2020, 10, 2429. [Google Scholar] [CrossRef] [PubMed] [Green Version]
- Gao, P.; Wang, J.; Wen, J. Selection of reference genes for tissue/organ samples of adults of Eucryptorrhynchus scrobiculatus. PLoS ONE 2020, 15, e0228308. [Google Scholar] [CrossRef] [Green Version]
- Wang, G.; Tian, C.; Wang, Y.; Wan, F.; Hu, L.; Xiong, A.; Tian, J. Selection of reliable reference genes for quantitative RT-PCR in garlic under salt stress. Peer J. 2019, 7, e7319. [Google Scholar] [CrossRef] [PubMed]
- Basu, S.; Pereira, A.E.; Pinheiro, D.H.; Wang, H.; Valencia-Jimenez, A.; Siegfried, B.D.; Louis, J.; Zhou, X.; Velez, A.M. Evaluation of reference genes for real-time quantitative PCR analysis in southern corn rootworm, Diabrotica undecimpunctata howardi (Barber). Sci. Rep. 2019, 9, 10703. [Google Scholar] [CrossRef] [PubMed]
- Jin, Y.; Liu, F.; Huang, W.; Sun, Q.; Huang, X. Identification of reliable reference genes for qRT-PCR in the ephemeral plant Arabidopsis pumila based on full-length transcriptome data. Sci. Rep. 2019, 9, 8408. [Google Scholar] [CrossRef]
- Zhao, Z.; Wang, L.; Yue, D.; Ye, B.; Li, P.; Zhang, B.; Fan, Q. Evaluation of Reference Genes for Normalization of RT-qPCR Gene Expression Data for Trichoplusia ni Cells During Antheraea pernyi (Lepidoptera: Saturniidae) Multicapsid Nucleopolyhedrovirus (AnpeNPV) Infection. J. Insect Sci. 2019, 19. [Google Scholar] [CrossRef] [PubMed] [Green Version]
- Ju, W.; Smith, A.O.; Sun, T.; Zhao, P.; Jiang, Y.; Liu, L.; Zhang, T.; Qi, K.; Qiao, J.; Xu, K.; et al. Validation of Housekeeping Genes as Reference for Reverse-Transcription-qPCR Analysis in Busulfan-Injured Microvascular Endothelial Cells. Biomed. Res. Int. 2018, 2018, 4953806. [Google Scholar] [CrossRef]
- Garcia-Reina, A.; Rodriguez-Garcia, M.J.; Galian, J. Validation of reference genes for quantitative real-time PCR in tiger beetles across sexes, body parts, sexual maturity and immune challenge. Sci. Rep. 2018, 8, 10743. [Google Scholar] [CrossRef]
- Ariizumi, T.; Murata, S.; Fujisawa, S.; Isezaki, M.; Maekawa, N.; Okagawa, T.; Sato, T.; Oishi, E.; Taneno, A.; Konnai, S.; et al. Selection of reference genes for quantitative PCR analysis in poultry red mite (Dermanyssus gallinae). J. Vet. Med. Sci. 2021, 83, 558–565. [Google Scholar] [CrossRef] [PubMed]
Figure 1.
Distribution of reference gene usage across 90 RT-qPCR studies of Aspergillus. Note that in the 90 studies examined, reference genes were used a total of 108 times, as some studies used multiple reference genes. Therefore, 108 was used as the denominator when computing the frequency of reference gene usage. The group “other” is comprised of reference genes that were used fewer than four times. Beta-tubulin was the most frequently used reference genes, at 31 times in the literature.

Figure 2.
Number of search results for each reference gene based on their corresponding Google Scholar query. The 18S rRNA reference gene returned the most results, with 3290 results returned.
Figure 2.
Number of search results for each reference gene based on their corresponding Google Scholar query. The 18S rRNA reference gene returned the most results, with 3290 results returned.

Figure 3.
Recommended checkpoints to use when selecting reference genes.


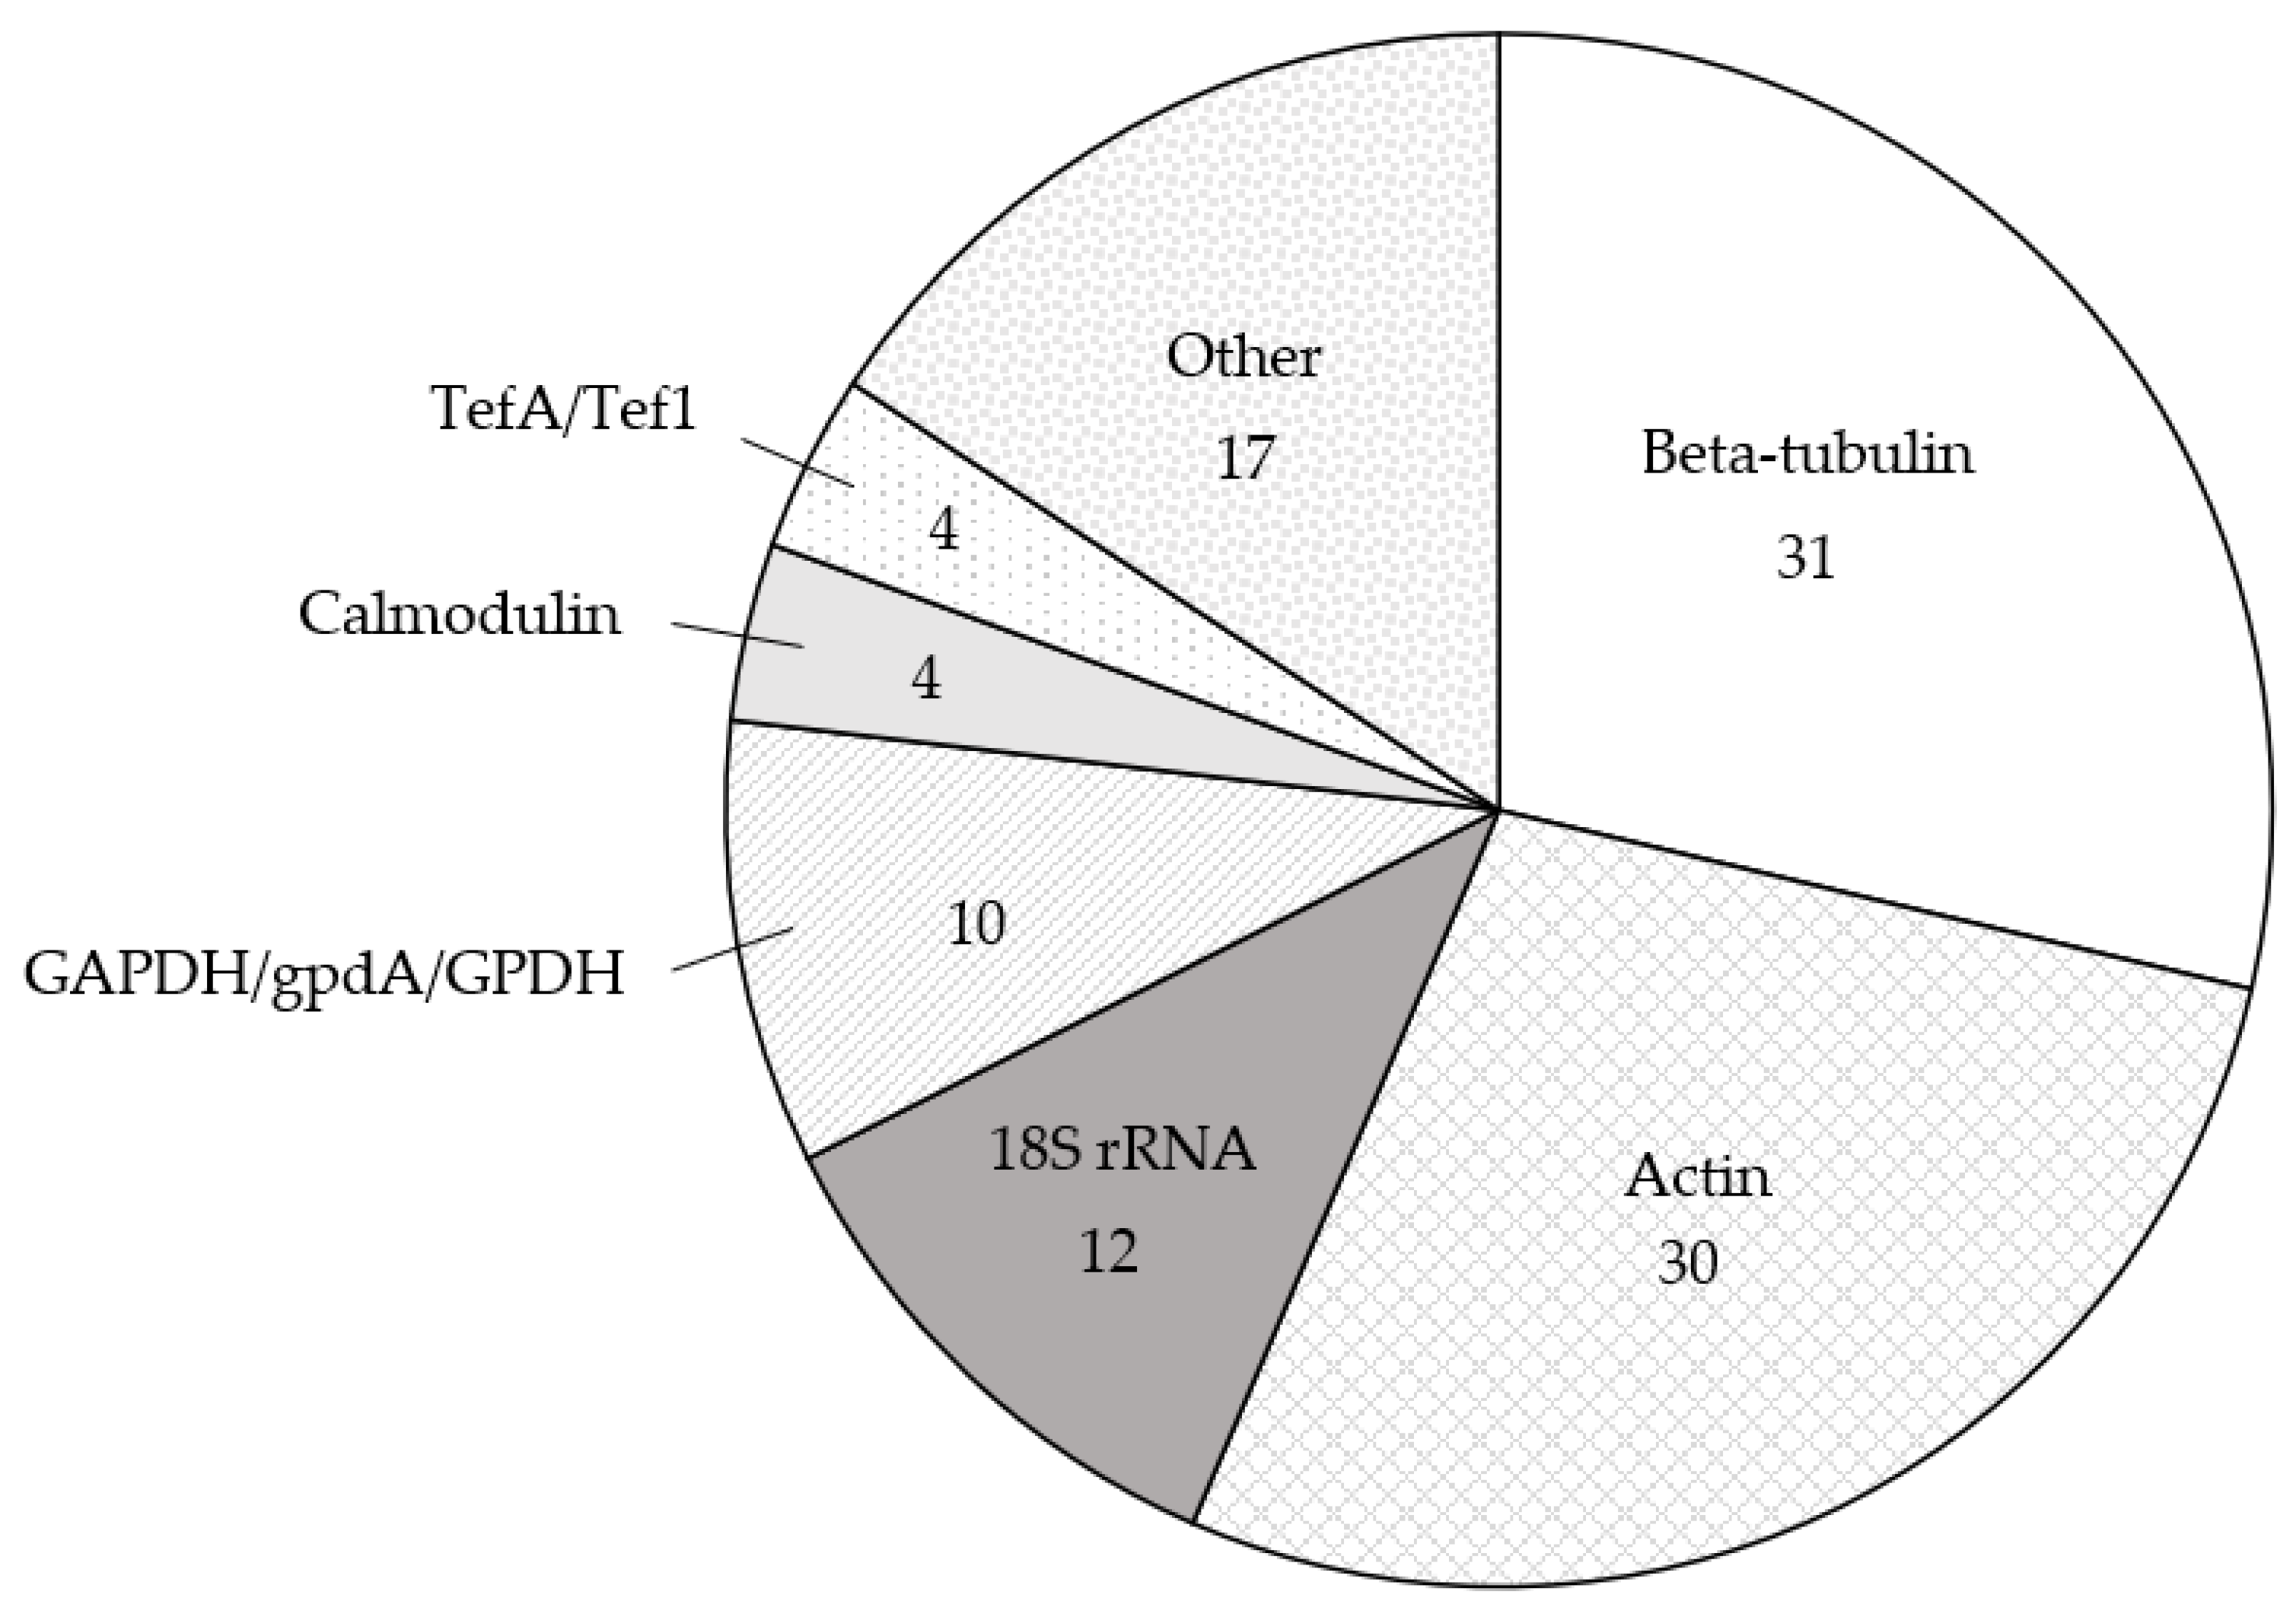
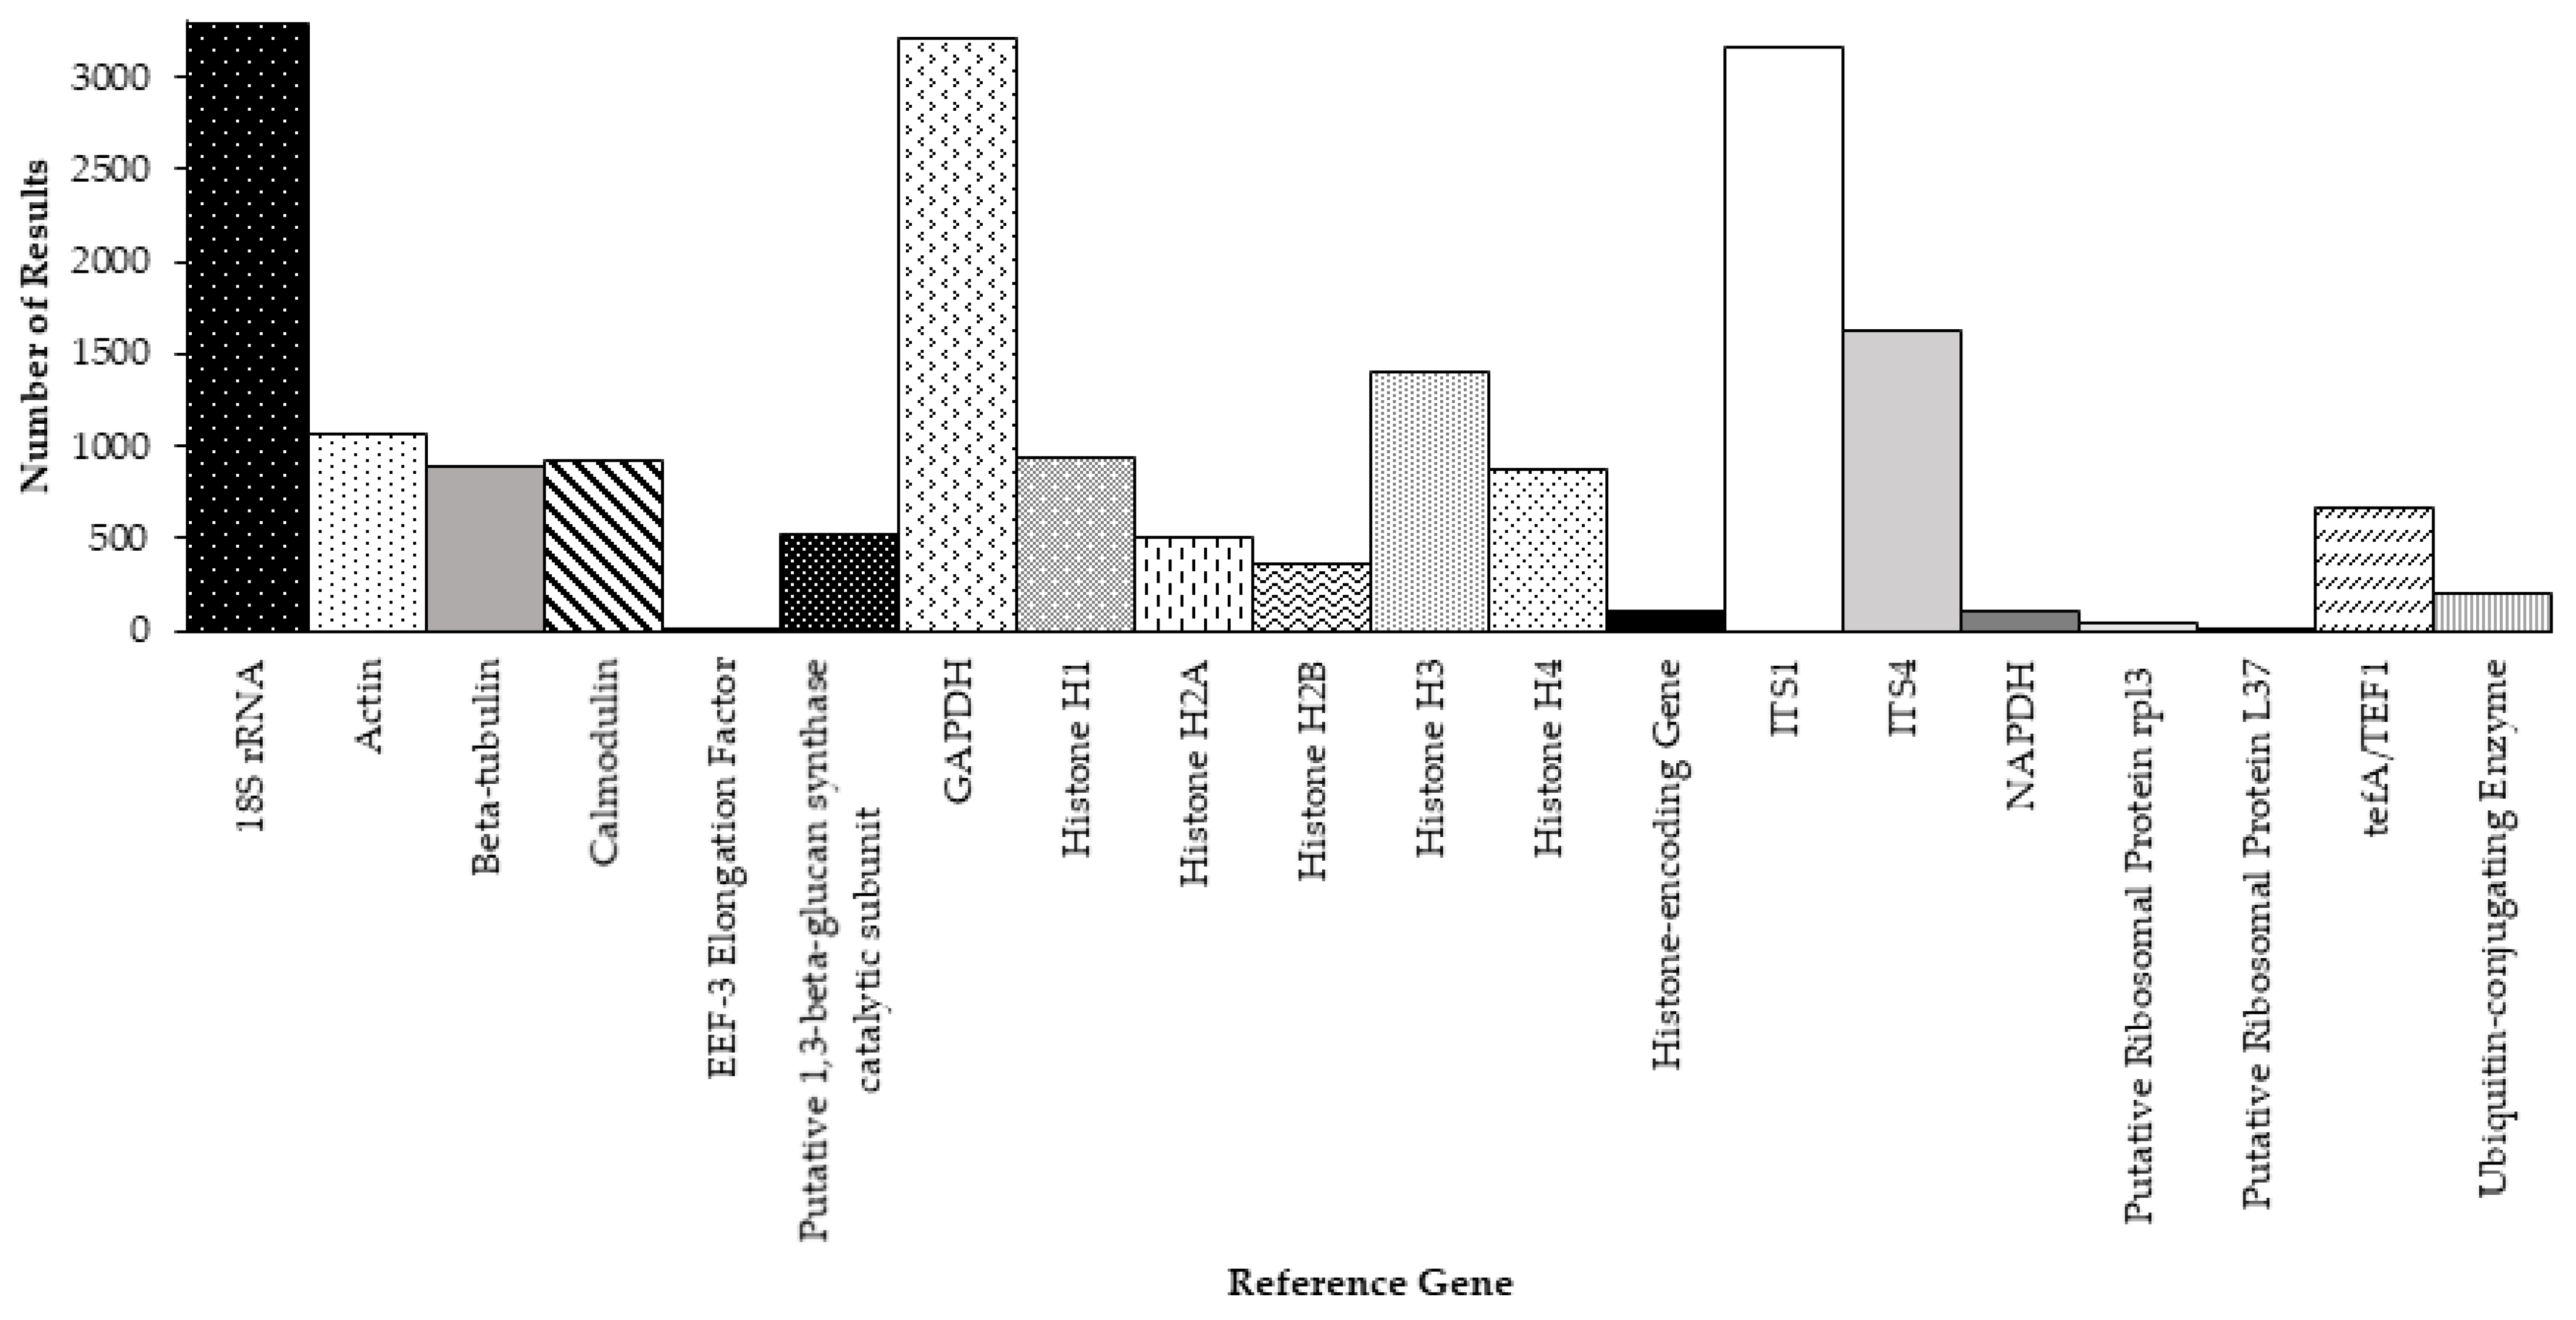
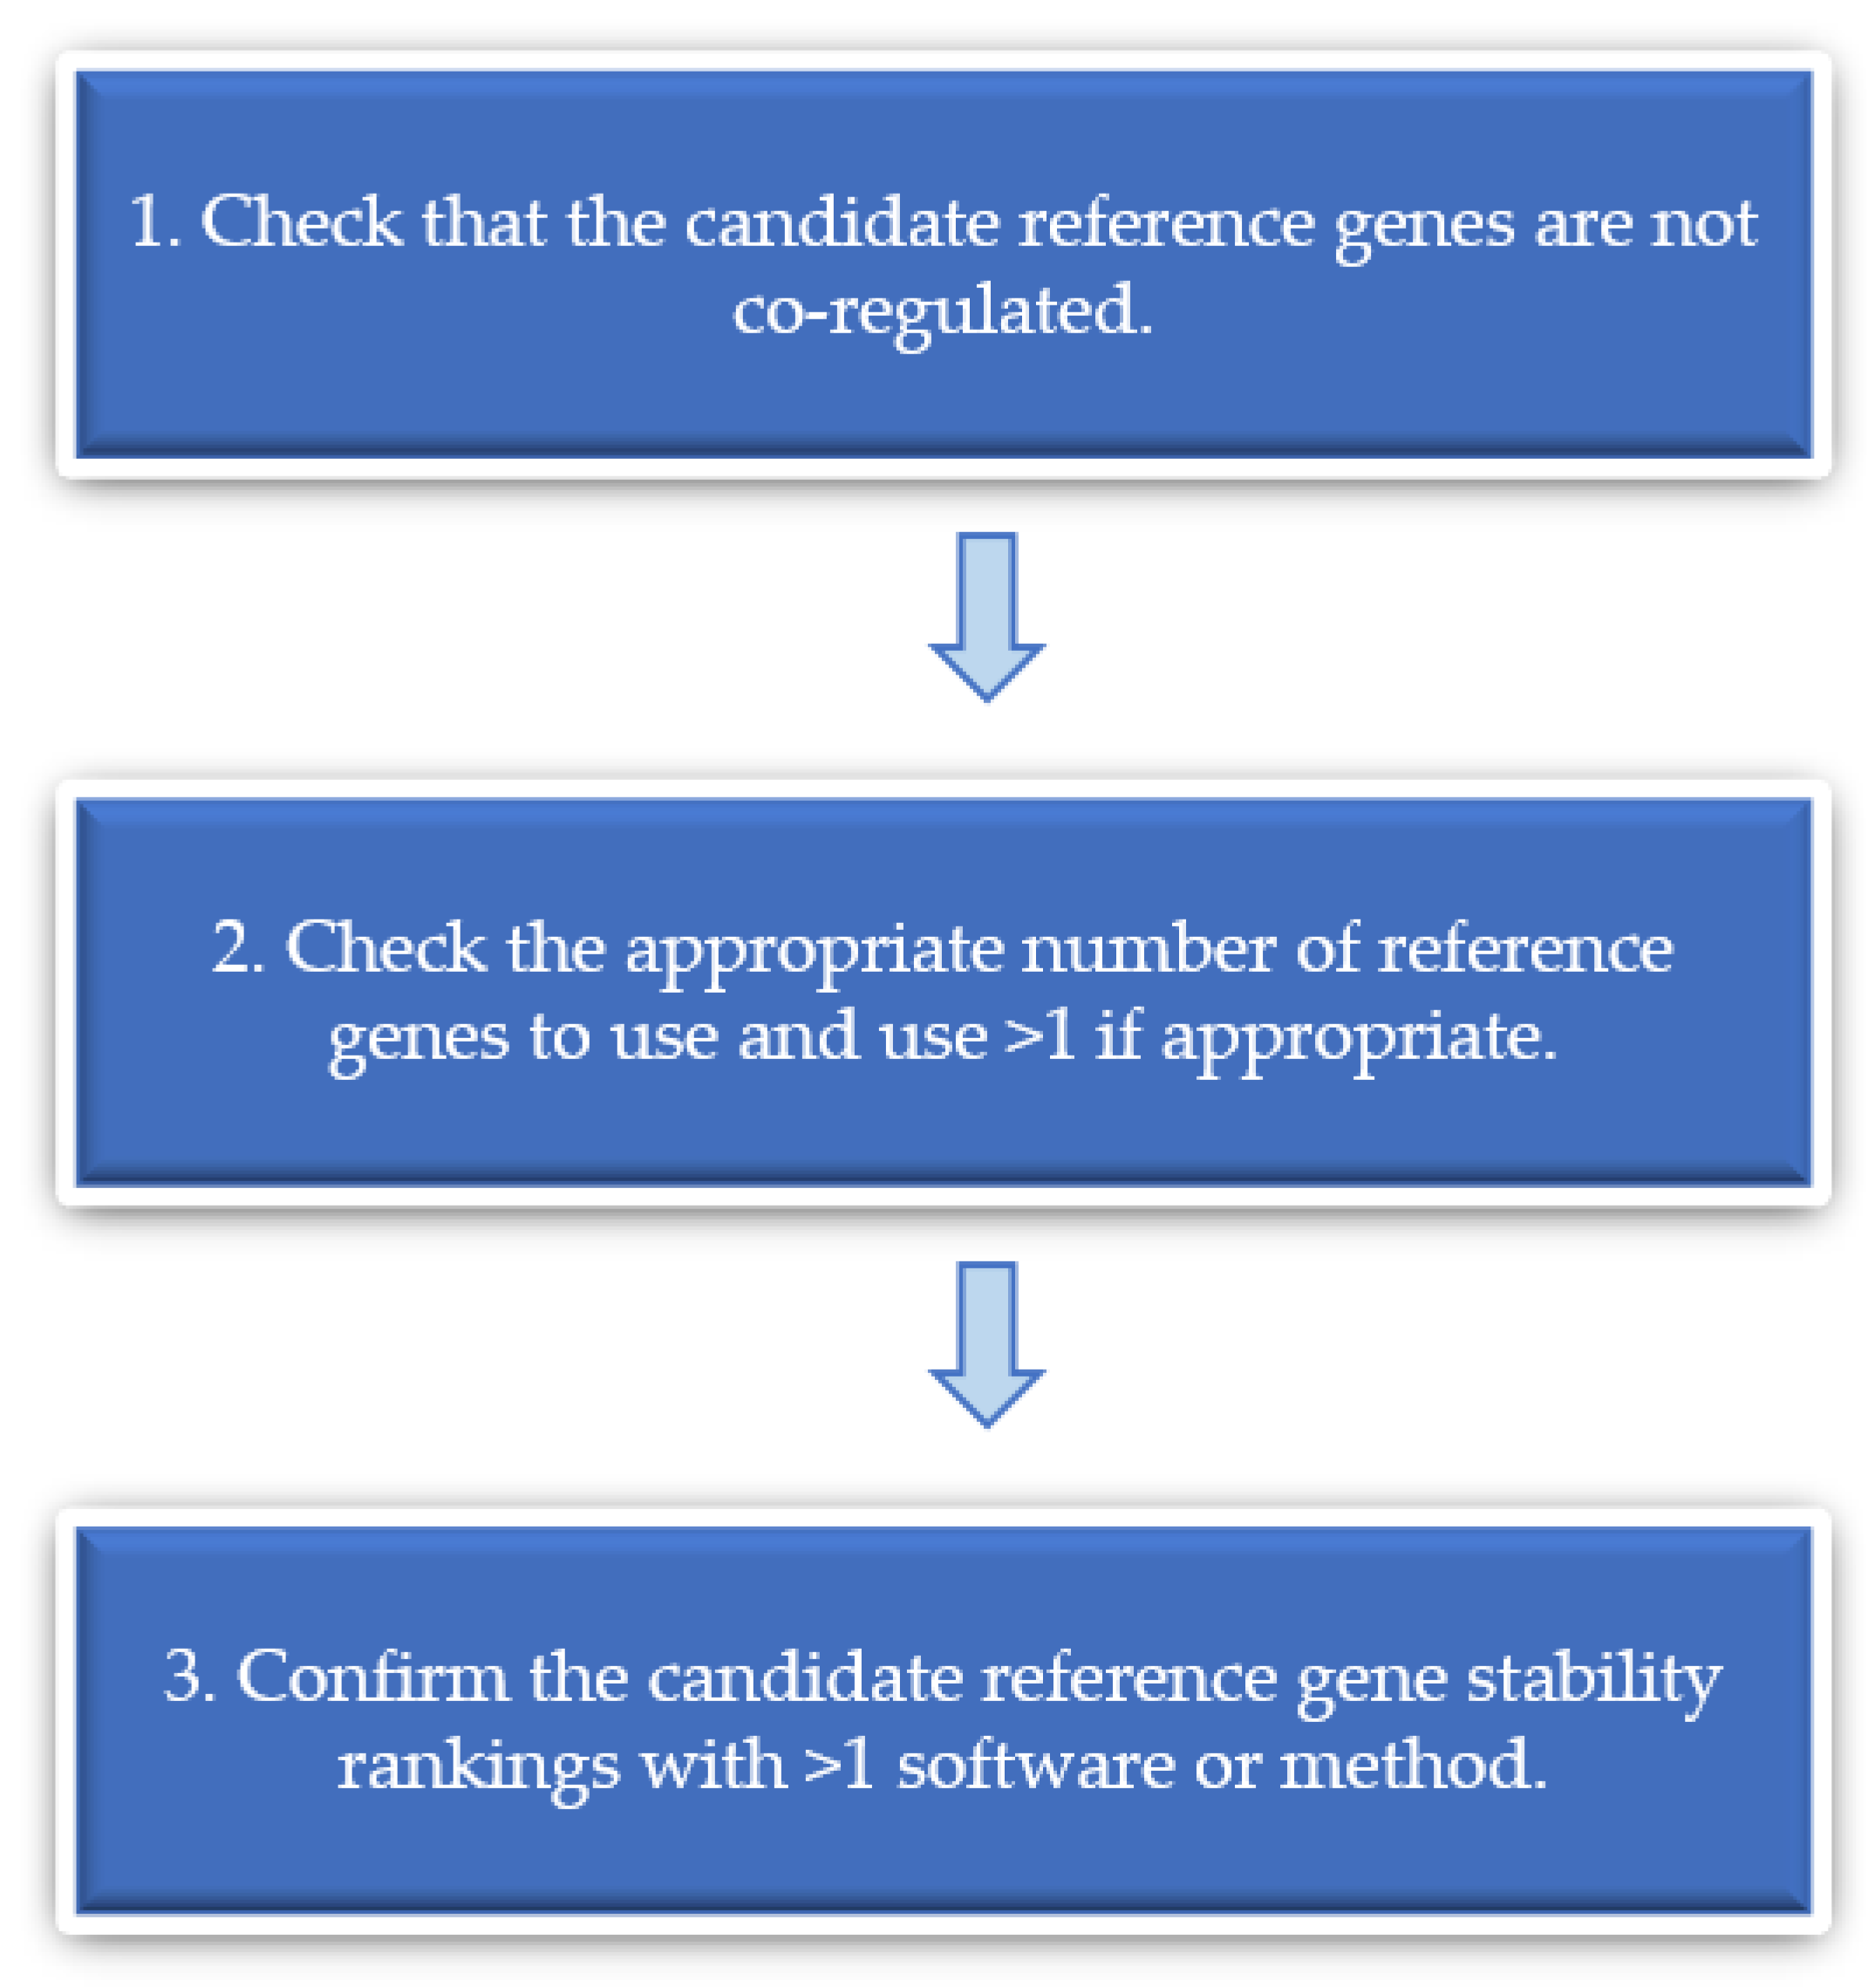
Table 1.
Species, reference gene(s) and experimental conditions used in 90 RT-qPCR studies of Aspergillus.
Table 1.
Species, reference gene(s) and experimental conditions used in 90 RT-qPCR studies of Aspergillus.
| Species | Reference Gene | Validation (Y/N) | Experimental Conditions | Ref. |
|---|---|---|---|---|
| A. aculeatus | Actin | N | Minimal media (MM) for 3, 5 and 7 days | [34] |
| Histone 3 | ||||
| GAPDH | Y | MM with 1% (w/v) polypeptone, 1% (w/v) glucose, 1% (w/v) avicel, 1% (w/v) xylose, or 1% (w/v) arabinose for 3 h or 6 h | [35] | |
| A. carbonarius | 18S rRNA | N | Czapek-Dox Modified Yeast Agar (CYA) medium in the dark at 30 °C for 2 days | [36] |
| Calmodulin | N | Co-culture with the actinobacterial strain, SN7, on International Streptomyces Project-2 (ISP2) media at 28 °C for 4 days | [37] | |
| Ubiquitin-conjugating Enzyme | Y | MM at 25 °C, without shaking (ochratoxin A (OTA)-inducing conditions) for 4, 6 and 8 days in the dark | [32] | |
| A. cristatus | Actin | N | Cellulose membrane on malt yeast agar (MYA) and on 17% NaCl MYA media for 5 days at 28 °C in the dark, after which mycelia were fixed (extraction from 7-day mycelia) | [24] |
| A. fischeri | Beta-tubulin | Y | Growth on a hydrophobic polyvinylidene fluoride (PVDF) membrane on top of oatmeal agar for 3, 6 or 30 days (wildtype only) | [38] |
| Histone 3 | ||||
| A. flavus | 18S rRNA | N | Glucose minimal media (GMM) containing 1% starch or 24 g/400 mL ground corn seed at 30 °C for 24, 48 and 72 h with shaking at 250 rpm | [39] |
| 18S rRNA | N | Yeast extract sucrose (YES) medium at 37 °C for 1.5 days and at 28 °C for 3 days, in the dark | [28] | |
| 18S rRNA | N | YES media supplemented with 0.40 mmol/L of cinnamaldehyde, 0.56 mmol/L of citral, and 0.80 mmol/L of eugenol for 7 days | [40] | |
| 18S rRNA | Y | Co-culture with Listeria monocytogenes in malt extract broth (MEB) at 25 °C and 30 °C for 7 days | [41] | |
| Beta-tubulin | ||||
| Calmodulin | ||||
| Actin | N | Co-incubation with soil isolates of Streptomyces on ISP2 medium at 28 °C | [42] | |
| Beta-tubulin | ||||
| Actin | N | (1) Potato dextrose agar (PDA) or GMM supplemented with NH4+ for 48 h (2) GMM supplemented with 50 mM ammonium or NaNO2 for 30 h | [43] | |
| Actin | N | YES media containing 1.5 mg/100 mL silver nanoparticles at 28 °C for 14 days | [44] | |
| Beta-tubulin | ||||
| Actin | N | YES or yeast peptone dextrose (YPD) media for 5 and 7 days, respectively, at 37 °C in the dark | [45] | |
| Beta-tubulin | Y | Inoculated onto 25 g of wheat and grown at 30 °C in open petri dishes with wetted filter paper for 9 days | [46] | |
| Beta-tubulin | N | Peanut samples for 6 weeks at 25 °C in polyethylene sandwich boxes containing glycerol/water solutions to maintain the equilibrium relative humidity conditions | [47] | |
| Beta-tubulin * | N | YES or yeast extract peptone (YEP) media at 28 °C for 4 days | [48] | |
| Beta-tubulin | N | Sucrose magnesium sulphate potassium nitrate yeast (SMKY) liquid media 25 °C for 7 days | [49] | |
| Beta-tubulin * | N | Treatment or no treatment with the subinhibitory concentrations of carvacrol or trans-cinnamaldehyde in potato dextrose broth (PDB) at 25 °C for 5 days | [50] | |
| Beta-tubulin | N | Liquid media at 30 °C with constant shaking at 120 rpm for 20 to 24 h | [51] | |
| Beta-tubulin | Y | Malt extract agar (MEA) media supplemented with 0.5 mM eugenol for 4 days at 27 °C in the dark | [52] | |
| GAPDH | ||||
| Beta-tubulin | N | Coconut agar at 25 °C for 2 or 7 days | [53] | |
| Calmodulin | ||||
| Beta-tubulin | Y | Co-incubation with Streptomyces roseolus on ISP2 medium at 30 °C for 4 days at a relative humidity of 80% in a Vötsch chamber | [54] | |
| GAPDH | ||||
| Beta-tubulin * | Y | YES medium containing one of four antifungal peptides: PPD1, 66-10, 77-3, or D4E1 | [55] | |
| Beta-tubulin | N | PDB containing 30% (v/v) of Eurotium cristatum culture filtrate for 3 days in the dark at 28 ± 2 °C with shaking at 120 r/min | [56] | |
| ITS1 | N | Cultures of differing water potential were supplemented with different antioxidant concentrations at 20 °C and 28 °C for 72 h | [57] | |
| ITS4 | ||||
| A. fumigatus | 18S rRNA | Y | Treatment with 125 μg/mL artemisinin or solvent for 3 h in Roswell Park Memorial Institute (RPMI) 1640 medium at 37 °C | [27] |
| 18S rRNA | N | PDA with different carbon dioxide concentrations and on Czapek media with different C: N ratios for 48 h and 5 days | [58] | |
| 18S rRNA | N | Liquid Aspergillus minimal media (AMM) at 37 °C for 18 h with shaking at 200 rpm | [59] | |
| Actin | N | (1) GMM at 25 °C for 60 days with shaking at 280 rpm (2) High iron liquid media or low iron liquid media at 37 °C for 24 h with shaking at 280 rpm | [23] | |
| Actin | N | Biofilm growth at 37 °C in minimal essential medium (MEM) supplemented with 5% v/v fetal calf serum (FCS) or 5% v/v phosphate-buffered saline (PBS) for 24 h and 48 h | [22] | |
| Actin | N | (1) CBS 144.89 and ΔsrbA: Treatment with MIC50 of fluconazole or voriconazole in liquid GMM at 37 °C with shaking at 300 rpm CBS 144.89, ΔsrbA and pniiA-erg11A-ΔsrbA: Liquid GMM plus 20 mM NO3 for 12 h and liquid GMM plus 20 mM NH4 at 37 °C with shaking at 300 rpm | [60] | |
| GAPDH | ||||
| tefA | ||||
| Actin | Y | Mandels’ salt solution with 1% oat spelts xylan for 0, 2, 4, 6 and 17 h | [16] | |
| Histone H4 | ||||
| Actin | N | RPMI medium at 37 °C for 0, 2, 4, 6, and 8 h | [21] | |
| Actin | N | Treatment with 24,700, 12,300 and 6170 µg/mL kombucha during growth in RPMI medium at 35 °C for 48 h | [61] | |
| Beta-tubulin | N | Yeast extract-peptone-dextrose (YEPD) media with 10 μg/mL (H11-20) or 100 μg/mL of itraconazole for 8 h at 37 °C | [62] | |
| Beta-tubulin | N | Treatment with 0.5 μg of voriconazole or without voriconazole in yeast glucose (YG) medium for 30, 60, 120, and 240 min | [63] | |
| Beta-tubulin | N | AMM containing 0, 1, 10, 100, 1000 μM of FeSO4 at 37 °C for 24 h with 150 rpm shaking | [64] | |
| Beta-tubulin | N | MEM supplemented with 10% (v/v) human serum (male) and 50 μM FeCl3 at 37 °C for 6 h | [65] | |
| Beta-tubulin | N | Growth in mouse lung alveoli for 4 h or 14 h | [66] | |
| Beta-tubulin * | N | Four formed fungi balls or 2 mL of fungal suspension in NaCl incubated for 3 h at 25, 30, 35 and 40 °C | [67] | |
| Beta-tubulin * | N | Treatment with sub-lethal and lethal amphotericin B (AmB) concentrations in Sabouraud medium for 24 h at 37 °C with shaking | [68] | |
| Beta-tubulin | N | Treatment with 4 mg/L itraconazole or dimethyl sulfoxide in Vogel’s medium at 37 °C with shaking at 250 rpm for 14 to 16 h | [69] | |
| Beta-tubulin | N | Growth in mouse lungs subcutaneously injected with 40 mg/kg Kenalog 1 day, or intraperitoneally with 175 mg/kg of cyclophosphamide 2 days prior to inoculation | [70] | |
| tefA | ||||
| GAPDH | N | Exposure of A. fumigatus to human airway epithelial cells or human bronchial epithelial cells | [31] | |
| GAPDH | N | Treatment with 10 ng/mL of itraconazole (CEA17) or 5 μg/mL of itraconazole (mutant strains) in YG medium supplemented with 1.2 g/L of uracil and uridine for 24 h at 37 °C | [71] | |
| Putative 1,3-beta-glucan synthase catalytic subunit | N | Barrat’s minimal nitrate medium in the presence or absence of oxidative stress and/or iron-limitation for 33 h and 50 h | [72] | |
| TEF1 | N | in vitro: (1) YPD media for 4 h, 8 h and 1 to 7 days at 37 °C, (2) YPD media for 24 h at 37 °C (3) YPD or RPMI medium for 24 h and 72 h at 37 °C, (4) YPD medium for 5 to 8 days at 37 °C in vivo: (1) Mouse lung incubation for 4 h, 8 h, and 1 to 7 days, (2) mouse lung incubation for 24 h and 72 h, (3) mouse lung incubation for 5 to 8 days | [73] | |
| TEF1 | N | Growth in a glucose (3%)-yeast extract (YE; 1%) liquid medium at 37 °C for 16 h | [74] | |
| A. luchuensis | Actin | N | Growth on rice as rice koji and sampling at the stages in the process of shimaishigoto (40 °C, 30 h) and dekoji (40 h) | [26] |
| Actin | N | Citric acid production (CAP) medium at 30 °C for 0 h or 12 h with shaking at 163 rpm | [75] | |
| A. nidulans | Actin | N | Low or high inorganic phosphate yeast extract medium (YEM) and MM at 37 °C for 17 h with shaking at 200 rpm | [76] |
| Beta-tubulin | ||||
| Actin | Y | Yeast extract-agar-glucose (YAG) supplemented with 15% polyethylene glycol (PEG) (w/v) compared to YAG without supplementation for 2 days | [77] | |
| Actin | N | Complete medium (CM) or MM with inducing or non-inducing supplements at 28 °C for 16 h with 250 rpm shaking | [78] | |
| Actin | N | YAG supplemented with 5 mM uridine and 10 mM uracil (YUU) at 37 °C for 24 h | [79] | |
| Actin | Y | MM supplemented with 0.1% fructose and 5 mM urea at 30 °C for 15 h with shaking at 150 rpm | [30] | |
| GAPDH | ||||
| Beta-tubulin | N | YG medium in the presence or absence of drugs (camptothecin, imazalil, itraconazole, hygromycin, and 4-nitroquinoline oxide) for 8 h | [80] | |
| Beta-tubulin | N | 3% lactose MM for 18 h, after which a source of induction and/or repression was added, and cultures incubated for 4 h | [81] | |
| Beta-tubulin | N | MM with exposure to light or darkness at 23 °C for 24 h (spores) or 30 °C for 40 h in distilled water (conidia) | [82] | |
| Histone 2B | ||||
| Beta-tubulin * | N | MM supplemented with 50 mM ethyl methyl ketone or 1% glucose at 37 °C for 16 h to 18 h with shaking at 150 rpm | [83] | |
| EEF-3 Elongation Factor | N | Glucose-free minimal nitrate medium or minimal nitrate medium at 37 °C for 4 h or 24 h | [84] | |
| NAPDH | N | Modified MMPKRUU medium under K sufficient or deficient conditions at 37 °C for 24 h with shaking at 220 rpm | [85] | |
| Putative ribosomal protein L37 | Y | Liquid MM under standard conditions | [86] | |
| Putative ribosomal protein L3 | ||||
| A. niger | 18S rRNA | N | PDA supplemented with different carbon and nitrogen sources | [87] |
| 18S rRNA * | N | Subculturing of transformants in the presence of 1.25 mg/mL of 5-fluoroorotic acid with uridine and uracil | [88] | |
| Actin | N | Liquid AMM for 0, 3, 6, 12 and 72 h and on AMM plates for 5 days | [89] | |
| Actin | N | Liquefied corn starch medium at 35 °C for 72 h with shaking at 330 rpm | [90] | |
| GAPDH | ||||
| Actin | N | CM for 25 h | [91] | |
| GAPDH | N | Glucose maltose polypeptone yeast extract (GMPY) media at 30 °C and 250 rpm for 2 days | [92] | |
| Histone H2B | N | MM supplemented with L-rhamnose or L-rhamnonate at 30 °C with shaking at 250 rpm | [93] | |
| Histone-encoding Gene | Y | Growth in bioreactors on sorbitol as the carbon source with 1 mM D-xylose or 50 mM D-xylose | [94] | |
| A. nomius | Calmodulin | N | Coconut agar at 25, 30 and 35 °C for 7 days | [95] |
| A. oryzae | 18S rRNA * | N | Subculturing of transformants in the presence of 1.25 mg/mL of 5-fluoroorotic acid with uridine and uracil | [88] |
| Actin | N | MM whole culture broth grown on a cellulose nitrate filter for 42 to 48 h until pigmented conidiospores present | [96] | |
| Actin | N | DPY agar medium for 48 h | [25] | |
| Actin | N | PDA medium at 30 °C for 7 days | [97] | |
| Beta-tubulin | N | Modified Czapek–Dox (CD) minimal agar at 30 °C for 48 h with 200 rpm shaking | [98] | |
| Beta-tubulin * | N | (1) α-amylase transcripts: Inducing (1% sorbitol plus 1% starch), non-inducing (1% sorbitol), and repressing (1% sorbitol plus 1% starch plus 2% sucrose) conditions for 48 h (2) glucoamylase A transcripts: Inducing conditions (in 1% starch) or repressing conditions (in 2% sucrose) at 30 °C for 24 h | [83] | |
| Histone H1 | N | Growth on 5 g of wheat bran containing 2, 3, 4, 6 or 8 mL of water at 30 °C for 48 h | [99] | |
| Histone H1 | N | MM at 30 °C for 5 days | [100] | |
| Histone H2A | N | DPY liquid medium at 30 °C for 2 days | [101] | |
| A. parasiticus | 18S rRNA * | N | Adye and Mateles (1964) medium for 48 h and 72 h | [102] |
| 18S rRNA | N | Stationary phase culture growth in PDB 30 °C for 4 days in the dark | [29] | |
| Actin | Y | Treatment with 0, 0.25, 0.5 or l.0 μg/mL aflastatin A for 1.5 to 3.5 days in PDB at 27 °C | [103] | |
| Actin | N | RPMI medium containing 25 or 50 mg/mL of vitamin C for 3 days at 28 °C | [104] | |
| Actin | Y | Co-incubation with Kluyveromyces lactis at 30 °C for 48 h | [105] | |
| Beta-tubulin * | N | YES or YEP media at 28 °C for 4 days | [48] | |
| Beta-tubulin | N | Yeast extract sucrose peptone (YESP) medium modified with 1% sodium nitrate (YESP-N) or 1% tryptophan (YESP-T) at 10, 15, 25, 30 and 37 °C for 96 h with shaking at 100 rpm | [106] | |
| Beta-tubulin * | N | Treatment or no treatment with the subinhibitory concentrations of carvacrol or trans-cinnamaldehyde in PDB at 25 °C for 5 days | [50] | |
| Beta-tubulin * | Y | YES medium containing one of four antifungal peptides: PPD1, 66-10, 77-3, or D4E1 | [55] | |
| A. sojae | 18S rRNA * | N | Adye and Mateles (1964) medium for 48 h and 72 h | [102] |
| A. terreus | Actin | Y | Lovastatin production media at 27 °C for 10 days with shaking at 220 rpm | [107] |
| Actin | N | MID medium for 10 days after which 0.5, 1.0, 3.0 and 5.0% (w/v) of surface sterilised Podocarpus. gracilior leaves were added and incubated together for 20 days | [108] | |
| Beta-tubulin * | N | Four formed fungi balls or 2 mL of fungal suspension in NaCl incubated for 3 h at 25, 30, 35 and 40 °C | [67] | |
| Beta-tubulin * | N | Treatment with sublethal and lethal concentrations of AmB in Sabouraud media at 37 °C for 24 h with slight shaking | [68] | |
| A. westerdijkiae | Beta-tubulin | N | CYA in the presence or absence of Debaryomyces hansenii at 28 °C for 3 and 7 days | [109] |
| GAPDH | N | YES medium at 25 °C for 96 h | [110] |
Y, validation was provided; *, analysed more than one species of Aspergillus and appear twice in the table.
Table 2.
Recommended reference genes for specific species and experimental conditions based on experimental validation.
Table 2.
Recommended reference genes for specific species and experimental conditions based on experimental validation.
| Species | Reference Gene | Forward Primer (5′-3′) | Reverse Primer (5′-3′) | Experimental Conditions | Ref. |
|---|---|---|---|---|---|
| A. aculeatus | GAPDH | TACCGCTGCCCAGAACATCA | GGAGTGGCTGTCACCGTTCA | Minimal media (MM) with 1% (w/v) polypeptone, 1% (w/v) glucose, 1% (w/v) avicel, 1% (w/v) xylose, or 1% (w/v) arabinose for 3 h or 6 h | [35] |
| A. carbonarius | Ubiquitin-conjugating Enzyme | CCGAAGGTCAACTTCACCAC | GGCATATTTGCGAGTCCATT | MM at 25 °C, without shaking (ochratoxin A (OTA)-inducing) conditions, for 4, 6 and 8 days in the dark | [32] |
| A. fischeri | Beta-tubulin | GCTCTTCCGTCCCGATAACTT | CCTTGGCCCAGTTGTTACCA | Growth on a hydrophobic polyvinylidene fluoride (PVDF) membrane on top of oatmeal agar for 3, 6 or 30 days (wildtype only) | [38] |
| Histone 3 | CAAGAAGCCTCACCGCTACAAG | GACTTCTGGTAGCGACGGATTT | |||
| A. flavus | 18S rRNA | GCAAATTACCCAATCCCGACAC | GAATTACCGCGGCTGCTG | Co-culture with Listeria monocytogenes in malt extract broth (MEB) at 25 °C and 30 °C for 7 days | [41] |
| Beta-tubulin | CGCATGAACGTCTACTTCAACGAG | AGTTGTTACCAGCAGCGGACT | |||
| Calmodulin | CTTCCCCGAATTCCTTACC | TCACGGATCATCTCATCGAC | |||
| Beta-tubulin | CTTGTTGACCAGGTTGTCGAT * | GTCGCAGCCCTCAGCCT* | Inoculated onto 25 g of wheat and grown at 30 °C in open petri dishes with wetted filter paper for 9 days | [46] | |
| Beta-tubulin | AACGTCTACTTCAACGAGGCCA | GTACCAGGCTCAAGATCAACGAG | Malt extract agar (MEA) media supplemented with 0.5 mM eugenol for 4 days at 27 °C in the dark | [52] | |
| GAPDH | CGTGTTGTTGACCTCATTGCCT | GGTGACCTGATAATCCGGGAAC | |||
| Beta-tubulin | AACGTCTACTTCAACGAGGCCA | GTACCAGGCTCAAGATCAACGAG | Co-incubation with Streptomyces roseolus on International Streptomyces Project-2 (ISP2) medium at 30 °C for 4 days at a relative humidity of 80% in a Vötsch chamber | [54] | |
| GAPDH | CGTGTTGTTGACCTCATTGCCT | GGTGACCTGATAATCCGGGAAC | |||
| Beta-tubulin | TCTCCAAGATCCGTGAGGAG | TTCAGGTCACCGTAAGAGGG | Yeast extract sucrose (YES) medium containing one of four antifungal peptides: PPD1, 66-10, 77-3, or D4E1 | [55] | |
| Cytochrome C oxidase Subunit V | CGTCATTCACTTGTTCGCTAAG | CCTTGGCATACTCGTTGGAAG | Sucrose low salts (SLS), SLS supplemented with 117 mM ammonium sulphate, and lactose low salts, at acidic or alkaline pH | [111] | |
| Histone H4 | TCGTCGTGGTGGTGTCAAG | TTGGCGTGCTCAGTGTAGG | |||
| A. fumigatus | 18S rRNA | TCTTGTTAAACCCTGTCGTGCTGG | GTGTACAAAGGGCAGGGACGTAAT | Treatment with 125 μg/mL artemisinin or solvent for 3 h in Roswell Park Memorial Institute (RPMI) 1640 medium at 37 °C | [27] |
| Actin | TGCCCTTGCTCCCTCGTCTA | ACCGCTCTCGTCGTACTCCT | Mandels’ salt solution with 1% oat spelts xylan for 0, 2, 4, 6 and 17 h | [16] | |
| Histone H4 | GCTCGTCGTGGTGGTGTCAA | TGGCGTGCTCAGTGTAGGTG | |||
| A. nidulans | Actin | TCAATCCCAAGTCCAACC (Tm 57 °C) | TACGACCGGAAGCATACA (Tm 57 °C) | Yeast extract-agar-glucose (YAG) supplemented with 15% polyethylene glycol (PEG) (w/v) compared to YAG without supplementation for 2 days | [77] |
| AATGGTTCGGGTATGTGC (Tm 60 °C) | ACGCTTGGACTGTGCCTC (Tm 60 °C) | ||||
| Actin-like protein | GTACGATGAGAGCGGTCCTT | CAGAAAATACGCGACAACGA | MM supplemented with 0.1% fructose and 5 mM urea at 30 °C for 15 h with shaking at 150 rpm | [30] | |
| GAPDH | CGACAACGAGTGGGGTTACT | GGCATCAACCTTGGAGATGT | |||
| Calmodulin | CCGAGTACAAGGAAGCTTTCTC | GAATCATCTCGTCGACTTCGTCGTCAGT | WB/MM supplemented with high, low or no iron for 24, 48 and 72 h | [144] | |
| Putative ribosomal protein L3 | TTCCTCGCAAGACTCACAAG | TTGTGGTTGCAAGAGGTACG | Liquid MM under standard conditions | [86] | |
| Putative ribosomal protein L37 | CGCCACAACAAAACTCACAC | TCTCGCTCCAGTTGTACTTGC | |||
| A. niger | Actin | GGTCTGGAGAGCGGTGGTAT | cactgcGAAGAAGGAGCAAGAGCAGtG | glaA-inducing and -non-inducing conditions in modified Vogel-Medium with stir speeds and pH from 400–1000 per min and 3.0 to 5.5, respectively | [160] |
| Cytochrome C oxidase Subunit V | GACCAAGGAGTGGCAGGAG | gaactgGGTGGGAGGCAGCAGtTC | |||
| Secretion Associated Binding Protein | gaacctACGGGTAAGGGCAAGGtTC | TCGCAACAATAAAGTCAACAGC | |||
| Histone-encoding Gene | ATCTTGCGTGACAACATCCA | CACCCTCAAGGAAGGTCTTG | Growth in bioreactors on sorbitol as the carbon source with 1 mM D-xylose or 50 mM D-xylose | [94] | |
| A. parasiticus | Actin | CTTGACTTCGAGCAGGAGAT | TCTGGATACGGTCGGAGATA | Treatment with or without 1.0 μM of blasticidin A in potato dextrose broth (PDB) at 27 °C for 2 days | [140] |
| Actin | CGCGGATACACCTTCTCCACTA * | ACGTAGCAGAGCTTCTCCTTGA * | Treatment with 0, 0.25, 0.5 or l.0 μg/mL aflastatin A for 1.5 to 3.5 days in PDB at 27 °C | [103] | |
| Actin | NA | NA | Co-incubation with Kluyveromyces lactis at 30 °C for 48 h | [105] | |
| Beta-tubulin | TCTCCAAGATCCGTGAGGAG | TTCAGGTCACCGTAAGAGGG | YES medium containing one of four antifungal peptides: PPD1, 66-10, 77-3, or D4E1 | [55] | |
| A. terreus | Actin | TCGTGACTTGACCGACTACC | TGATGTCACGGACGATTTCA | Lovastatin production media at 27 °C for 10 days with shaking at 220 rpm | [107] |
*, used TaqMan system and therefore these primers have an associated probe, NA, not available.
Publisher’s Note: MDPI stays neutral with regard to jurisdictional claims in published maps and institutional affiliations. |
© 2021 by the authors. Licensee MDPI, Basel, Switzerland. This article is an open access article distributed under the terms and conditions of the Creative Commons Attribution (CC BY) license (https://creativecommons.org/licenses/by/4.0/).
Share and Cite
MDPI and ACS Style
Archer, M.; Xu, J. Current Practices for Reference Gene Selection in RT-qPCR of Aspergillus: Outlook and Recommendations for the Future. Genes 2021, 12, 960. https://0-doi-org.brum.beds.ac.uk/10.3390/genes12070960
AMA Style
Archer M, Xu J. Current Practices for Reference Gene Selection in RT-qPCR of Aspergillus: Outlook and Recommendations for the Future. Genes. 2021; 12(7):960. https://0-doi-org.brum.beds.ac.uk/10.3390/genes12070960
Chicago/Turabian StyleArcher, Meagan, and Jianping Xu. 2021. "Current Practices for Reference Gene Selection in RT-qPCR of Aspergillus: Outlook and Recommendations for the Future" Genes 12, no. 7: 960. https://0-doi-org.brum.beds.ac.uk/10.3390/genes12070960
Note that from the first issue of 2016, this journal uses article numbers instead of page numbers. See further details here.