Article

Metagenomic Analyses of Plant Growth-Promoting and Carbon-Cycling Genes in Maize Rhizosphere Soils with Distinct Land-Use and Management Histories

by
Chinenyenwa Fortune Chukwuneme
,
Ayansina Segun Ayangbenro
and
Olubukola Oluranti Babalola
*
Food Security and Safety Niche Area, Faculty of Natural and Agricultural Sciences, North-West University, Private Bag, X2046, Mmabatho 2735, South Africa
*
Author to whom correspondence should be addressed.
Submission received: 11 August 2021 / Revised: 4 September 2021 / Accepted: 13 September 2021 / Published: 17 September 2021
(This article belongs to the Special Issue Regulation of Microbial Biosynthetic Genes and Biodegradation Genes)

Abstract

:
Many studies have shown that the maize rhizosphere comprises several plant growth-promoting microbes, but there is little or no study on the effects of land-use and management histories on microbial functional gene diversity in the maize rhizosphere soils in Africa. Analyzing microbial genes in the rhizosphere of plants, especially those associated with plant growth promotion and carbon cycling, is important for improving soil fertility and crop productivity. Here, we provide a comparative analysis of microbial genes present in the rhizosphere samples of two maize fields with different agricultural histories using shotgun metagenomics. Genes involved in the nutrient mobilization, including nifA, fixJ, norB, pstA, kefA and B, and ktrB were significantly more abundant (α = 0.05) in former grassland (F1) rhizosphere soils. Among the carbon-cycling genes, the abundance of 12 genes, including all those involved in the degradation of methane were more significant (α = 0.05) in the F1 soils, whereas only five genes were significantly more abundant in the F2 soils. α-diversity indices were different across the samples and significant differences were observed in the β diversity of plant growth-promoting and carbon-cycling genes between the fields (ANOSIM, p = 0.01 and R = 0.52). Nitrate-nitrogen (N-NO3) was the most influential physicochemical parameter (p = 0.05 and contribution = 31.3%) that affected the distribution of the functional genes across the samples. The results indicate that land-use and management histories impact the composition and diversity of plant growth-promoting and carbon-cycling genes in the plant rhizosphere. The study widens our understanding of the effects of anthropogenic activities on plant health and major biogeochemical processes in soils.

1. Introduction

The plant rhizomicrobiome, comprising different microbial communities, plays immense roles in many processes of ecosystem functioning, such as nutrient recycling, suppressing disease pathogens, secreting plant growth-promoting enzymes, and mineralization of organic matter, which ultimately lead to increased soil fertility and crop productivity [1,2]. The rich nutrients provided by plants attract several microbes around the roots, which are recruited from the surrounding soils [3,4] by the metabolic compatibility and signaling events of exudates secreted by the plant roots into the rhizosphere environment, the host-plant immune system, and interactions among different microbes within the plant rhizosphere [5,6].
Soil ecosystem functioning is mostly determined by the activity and complexity of the inhabiting microbes. These microbes are influenced by several biological, chemical, and physical properties of the soil environment [1,7]. The microbial community composition in soils can be altered by different land-use and management practices, which consequently affect certain ecosystem functioning in soils [8,9]. Agricultural management practices impact microbial community structure and functions, thereby complexing the contributions of microbial communities towards important ecosystem functions such as nutrient and carbon cycling [10,11]. Most studies on the effects of land-use practices on the soil ecosystem functions focused mainly on the composition and structure of soil microbial communities [12,13]. Microbial community composition in different ecosystems and its effects on ecosystem functioning has been studied [14,15]. The literature has shown that the information obtained from the taxonomic composition and abundance of soil microbial communities alone is insufficient to predict their functional potentials [16,17]. Therefore, quantifying the knowledge of the functional capabilities of microbial communities in soils will help identify their roles in the ecosystems, how they are impacted by land-use and management practices, and their influence on soil ecosystem functions. such as organic matter mineralization, nutrient cycling, degradation of organic pollutants, and plant–microbe interactions [9,18,19].
Recent studies have suggested that the functions of soil microbial communities can be better predicted by studying their functional genes [20,21,22,23]. Knowledge of microbial functional gene composition and diversity in the rhizosphere of agricultural soils, instead of mere taxonomic insight, is important for understanding the dynamics of vital processes, such as nutrient and carbon cycling, and how they are influenced by agricultural management practices [23]. The whole metagenomic sequencing of rhizosphere soil samples has been tested to provide information on the diversity of microbial functional genes in the plant rhizosphere [24,25]. Metagenomics provides information on a wide variety of functional genes present in a sample, which may assist in the acquisition of information on the functional potentials of microbial communities in soils. Through this method, information on functional genes that play important roles in the rhizosphere soil ecosystem is obtained [26]. These functional genes may include specific ones, such as the phloroglucinol (phl) synthesis and nitrogen fixation (nif) genes that can directly confer beneficial traits to plants, and the pyrroloquinoline quinone (pqq) biosynthesis genes, which contribute to many indirect functions in plant cells. Together, these genes enhance plant growth and health [27].
Studies have reported the influence of land-use practices on the diversity of functional genes in agricultural soils [1,28]. However, studies on microbial functional gene diversity in the rhizosphere of plants in African soils as influenced by their land-use and management histories are rare. Moreover, the specific functional genes responsible for performing various important functions, such as the biogeochemical cycling of nutrients and plant-growth promotion in the maize rhizosphere, are understudied. This study provides a principal report on the effects of land-use history (conversion from grassland to cultivated land) and management practices (tillage and no tillage) on the diversity of plant growth-promoting and carbon-cycling genes in maize rhizospheric soils.
To gain deeper knowledge on the diversity of genes concerned with plant growth promotion and carbon cycling, we analyzed the metagenomes of rhizospheric soil samples from former grassland soil and intensively cultivated agricultural land using shotgun metagenomic sequencing. We compared the composition and diversity of functional genes involved in plant growth promotion and carbon cycling in the rhizospheric soils of the former grassland with those from the intensively cultivated land. Furthermore, we compared the taxonomic profiles of one field with the other. Based on our previous study, we formulated two hypotheses. First, we assumed that although the maize rhizosphere harbored important beneficial microbes, this environment must also be characterized by diverse microbial functional genes that contribute to important functions in the soil ecosystem. Second, we expected the diversity of the genes that contribute to plant growth and carbon cycling in the two fields to differ significantly from one another due to their land-use and management histories.

2. Materials and Methods

2.1. Soil Sampling and Sites Description

Soil samples were collected in March 2019 from two maize plantations in Ventersdorp (F1) and Mafikeng (F2), South Africa (located in the semi-arid regions of the North West province). The choice of our sample collection was influenced by the agricultural histories of the two plantations. The field at Ventersdorp (approximately 130 hectares) has existed since 1962, initially as grassland for animal grazing, and subsequently converted to cultivable land in 2015, with no tilling system and fertilizer application (N = 90, P = 60, and K = 60 kg ha−1). On the other hand, the Mafikeng field has existed since 1989 as a continuously cultivated land, with a mechanized tilling system and fertilizer applied at the rates of N = 140, P = 80, and K = 80 kg ha−1. The average winter and summer temperatures at Ventersdorp are 10.6 and 22.9 °C, respectively, with an annual average rainfall of 585 mm, an average precipitation of 4 mm (in winter) and 105 mm (in summer), an altitude of 1339 m, and average humidity of 47% (in winter) and 45% (in summer). On the other hand, the mean temperatures in Mafikeng are 11 and 23.1 °C in winter and summer, respectively, with an annual rainfall of 571 mm, average precipitation of 3 mm in winter and 96 mm in summer, an altitude of 1290 m, and mean humidity of 46% and 44% in winter and summer, respectively. Soil samples were collected from the following locations: 26°19′38″ S and 26°53′18″ E for F1, and 25°48′00″ S and 25°38′21″ E for F2. Rhizosphere soils were collected by deliberately uprooting maize plants and agitating the uprooted plant to remove loosely attached soils; meanwhile, soils attached to the root crowns, where rooting was so dense, were collected together with the roots in sterile plastic bags. Before sample collection, each field was split into four parts (representing north, south, east, and west), and each part was called a site. In each site, rhizospheric soil samples were collected from six different maize plants, later pooled to form a composite sample. Therefore, for F1, rhizospheric soil samples were collected from sites GZ1, GZ2, GZ3, and GZ4, and for F2, we collected samples from sites AG1, AG2, AG3, and AG4. A total of 8 composite soil samples were collected from the rhizosphere of maize plants in the two fields (4 from each field). Samples were collected at the flowering stage, and soils from both fields were typical of loamy sand. These samples were stored in a cooler containing ice and transported to the laboratory. At the laboratory, each sample was divided into two, one for physicochemical analysis and the other for whole DNA extraction. Samples were kept at −20 °C until they were needed for analyses.

2.2. Physicochemical Analyses of Soil Samples

The chemical properties of soil samples were determined using 20 g of dried and sieved soils that were kept specifically for this purpose. The pH of samples was determined using a pH meter at a soil-to-water ratio of 1:2.5. The Kjeldahl method was used to determine the amount of nitrogen in the samples [29], while the procedure of Bray and Kurtz [30] was employed to determine the extractable phosphorus content of the samples. Organic carbon (OC) content was measured using the method of Walkley and Black [31] and Shi et al. [32]. Exchangeable potassium, N-NO3, and N-NH4 content, and the available sulfur in samples were determined after extraction with 1 M ammonium acetate, 2 M potassium chloride (KCl), and 0.1 M hydrochloric acid (HCl), respectively, while the amount of organic matter was estimated by the loss-on-ignition (LOI) method [33].

2.3. Metagenomic DNA Extraction and Sequencing

A DNeasy PowerMax Soil Kit (Qiagen, Germantown, MD, USA) was used to extract whole microbial DNA from 5 g of soil samples according to the manufacturer’s guidelines. The initial DNA concentration of the samples was confirmed using Qubit® dsDNA HS Assay Kit (Life Technologies, Carlsbad, CA, USA), and samples were subjected to further cleaning using the DNEasy PowerClean Pro Cleanup Kit (Qiagen, Germantown, MD, USA). Whole metagenome sequencing of samples through the shotgun approach, which generated the complete datasets for the study, was performed at the Molecular Research Laboratories (MR DNA, Shallowater, TX, USA). Adhering to user instructions step-by-step, metagenomic DNA libraries were developed with 20–25 ng of DNA using a Nextera DNA Flex library preparation kit (Illumina, San Diego, CA, USA). After sample cleanup, the quality of the DNA in samples was again checked using the Qubit® dsDNA HS Assay Kit (Life Technologies, Carlsbad, CA, USA). The quality DNA samples were made to undergo simultaneous fragmentation with the subsequent addition of adapter sequences. A limited-cycle PCR was run on the samples and unique indices were added. The Qubit® dsDNA HS Assay Kit (Life Technologies, Carlsbad, CA, USA) was reused to check the final library concentration, while the Agilent 2100 Bioanalyzer (Agilent Technologies, Santa Clara, CA, USA) was used to deduce the average size of the developed libraries. The libraries were pooled and diluted to 0.6 nM. Afterward, 300-cycle pair-end sequencing was performed on the libraries using the NovaSeq system on Illumina.

2.4. Metagenome Sequence Processing and Analysis of Data

The raw sequences of each metagenome were uploaded to the metagenomics rapid annotation pipeline (MG-RAST) version 4.0.3 server [34], and quality control was performed on the sequences. The preprocessing steps (quality control and trimming) involved the elimination of artificial sequences, which were products of sequence artifacts, the removal of sequences with over 5 ambiguous base pairs (bp) and a 15 phred cutoff score, removal of host species-specific sequences, and the removal of sequences whose mean lengths were more significant than 2 standard deviations from the mean. Afterward, sequences were annotated using the BLAST-like alignment (BLAT) algorithm [35] on the M5NR database, which provides a nonredundant combination of different databases [36]. Taxonomic groupings were performed using the Ribosomal Database Project (RDP), while the assignment of protein-coding genes (at the level of functions) were performed on the SEED subsystems database. The SEED subsystems database on the MG-RAST server is a continuously updated genome database, application programming interface (API), web front end, and server scripts consisting of integrated genomic data and collections of functionally related protein families that are used to predict gene functions and new pathways [37]. BlastX was used to detect hits that have maximum lengths of 15 bp, an E-value cutoff of 1 × 10⁻⁵, and a 60% minimum identity. Sequences with failed annotation did not receive any further analysis. We were interested in the entire microbiome comprising archaea, bacteria, and fungi. However, data from protists and other micro-eukaryotes were excluded from the analysis. The effect of experimental noise or error was minimized by applying the “normalized data” option on the MG-RAST server. We manually selected and arranged the genes imparting plant-beneficial functions from the data we obtained for the microbial functions in the SEED subsystems database. The 8 sequences of this study were individually evaluated on the MG-RAST server, and data analyses were performed on all the metagenome samples (GZ1–GZ4 and AG1–AG4). The metagenomic sequences of the study samples are available in the NCBI SRA dataset, with the BioProject accession number PRJNA649682.
Shannon, Evenness, and Simpsons were used as parameters to determine the α diversity indices of all the samples. These indices were used to compare habitats using the Kruskal–Wallis test. Significantly abundant microbial genes were identified as biomarkers of the microbial communities, and the samples were determined using the linear discriminant analysis (LDA) effect size (LEfSe) version 1.0. Here, the logarithmic LDA cutoff score was set to 2.0, and the α parameter significance threshold for the Kruskal–Wallis test performed among classes was set to 0.05. To determine the β diversity of the plant growth-promoting and carbon-cycling genes, we used the principal coordinate analysis (PCoA) centered on the Euclidean distance matrix. To identify significantly different metagenomes among the samples, we used the one-way analysis of similarities (ANOSIM) through 9999 permutations. The percentage (%) contribution of each functional gene to the dissimilarities in gene abundance between and within the sample groups was assessed using the similarity percentage (SIMPER) analysis. The canonical correspondence analysis (CCA), through the forward selection option, was used to determine the physicochemical parameters that best described the functional genes, while the Monte Carlo permutation test with 9999 random permutations was used to measure the significance. All the physicochemical parameters of the soils were incorporated into the CCA analysis as descriptive variables.
The rarefaction curve was obtained after the normalization of the datasets using the analysis tools in MG-RAST v. 4.0.3 [34] (Figure 1). Heatmaps showing the abundances of microbial families, plant growth-promoting and carbon-cycling genes, and an extended error bar plot used to identify the significant microbial communities in the samples, were obtained using the statistical analysis of taxonomic and functional profiles (STAMP), version 2.1.3 [38]. The α diversity, ANOSIM, and SIMPER analyses were performed using the PAST version 3.20 software, developed by Hammer et al. [39], while the PCoA and CCA were performed in CANOCO 5 (Microcomputer Power, Ithaca, 148 NY, USA). The Galaxy software on https://huttenhower.sph.harvard.edu/galaxy/ (accessed December 2020) was used to plot the bar chart showing the statistically differential and biologically consistent differences in the abundance of functional genes involved in plant growth promotion and carbon cycling in the samples [40].

3. Results

3.1. Soil Chemical Analysis

The results of the soil chemical analyses of this study have been previously described in Chukwuneme et al. [41]. Briefly, the pH of the GZ samples was between 6.45 and 7.04 (neutral), while that of the AG samples ranged between 4.84 and 5.49 (acidic). The sulfur content of both soils was low and observed only in the GZ1, GZ3, and AG2 samples, while the phosphorus contents of the GZ and AG samples ranged from 19.75 (GZ2) to 40.39 (GZ3) mg/kg and from 16.25 (AG4) to 56.88 (AG2) mg/kg, respectively. Moreover, total C, organic C, organic matter, and nitrate-nitrogen (NO3-N) contents were higher in the GZ samples compared to the ammonium (N-NH4) content, which was higher in the AG samples (Table S1).

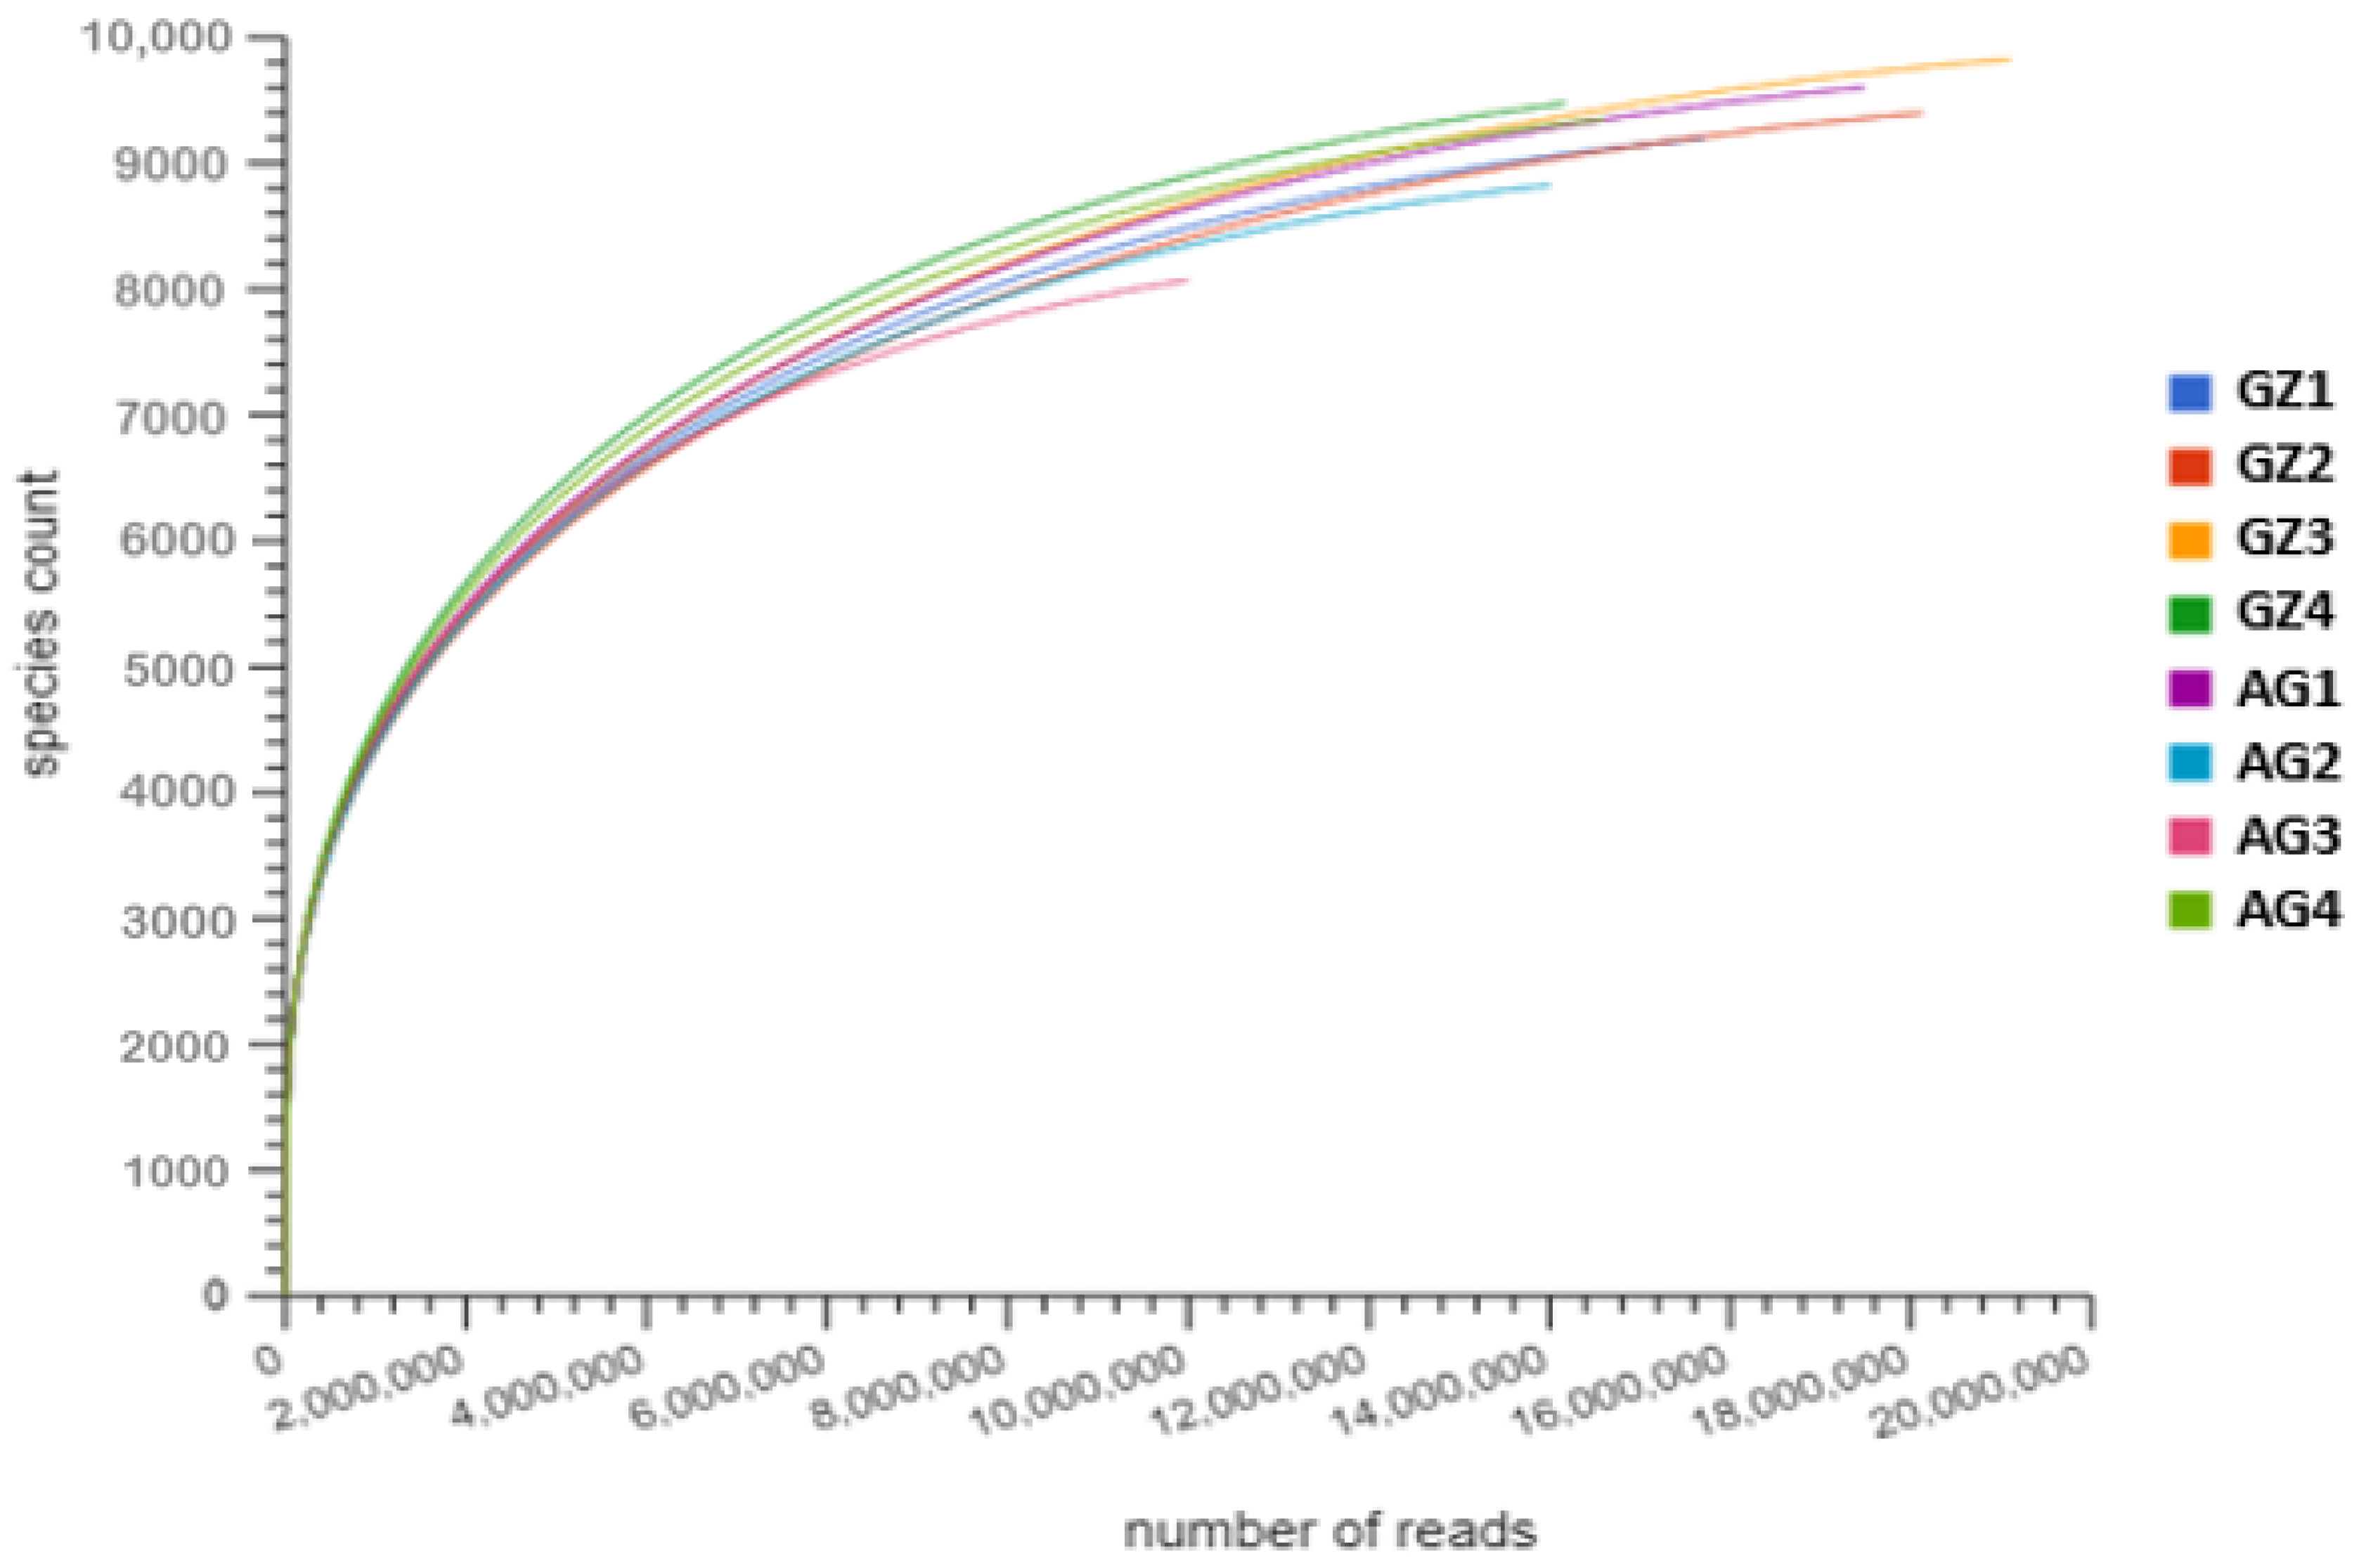
3.2. Assembly and Analysis of Shotgun Metagenomic Sequence Data

From the rarefaction curve in Figure 1, most of the sample reads reached saturation points, thereby indicating a full coverage of the sampling efforts. After quality control on the MG-RAST server, the output file obtained contained sequences in the range of 5,255,550–9,039,015 and 2,627,486–8,287,108 for the GZ1–GZ4 and the AG1–AG4 rhizosphere samples, respectively. Out of the quality sequences obtained, 39.63–40.98% of the sequences in the GZ samples contained proteins whose functions are known, while for the AG samples, the proteins with known functions ranged from 41.39 to 43.42%. Furthermore, the quality sequences obtained contained 2,732,830–4,759,994 and 1,306,964–4,262,335 proteins for the GZ (GZ1–GZ4) and AG (AG1–AG4) samples, respectively, with unknown functions.

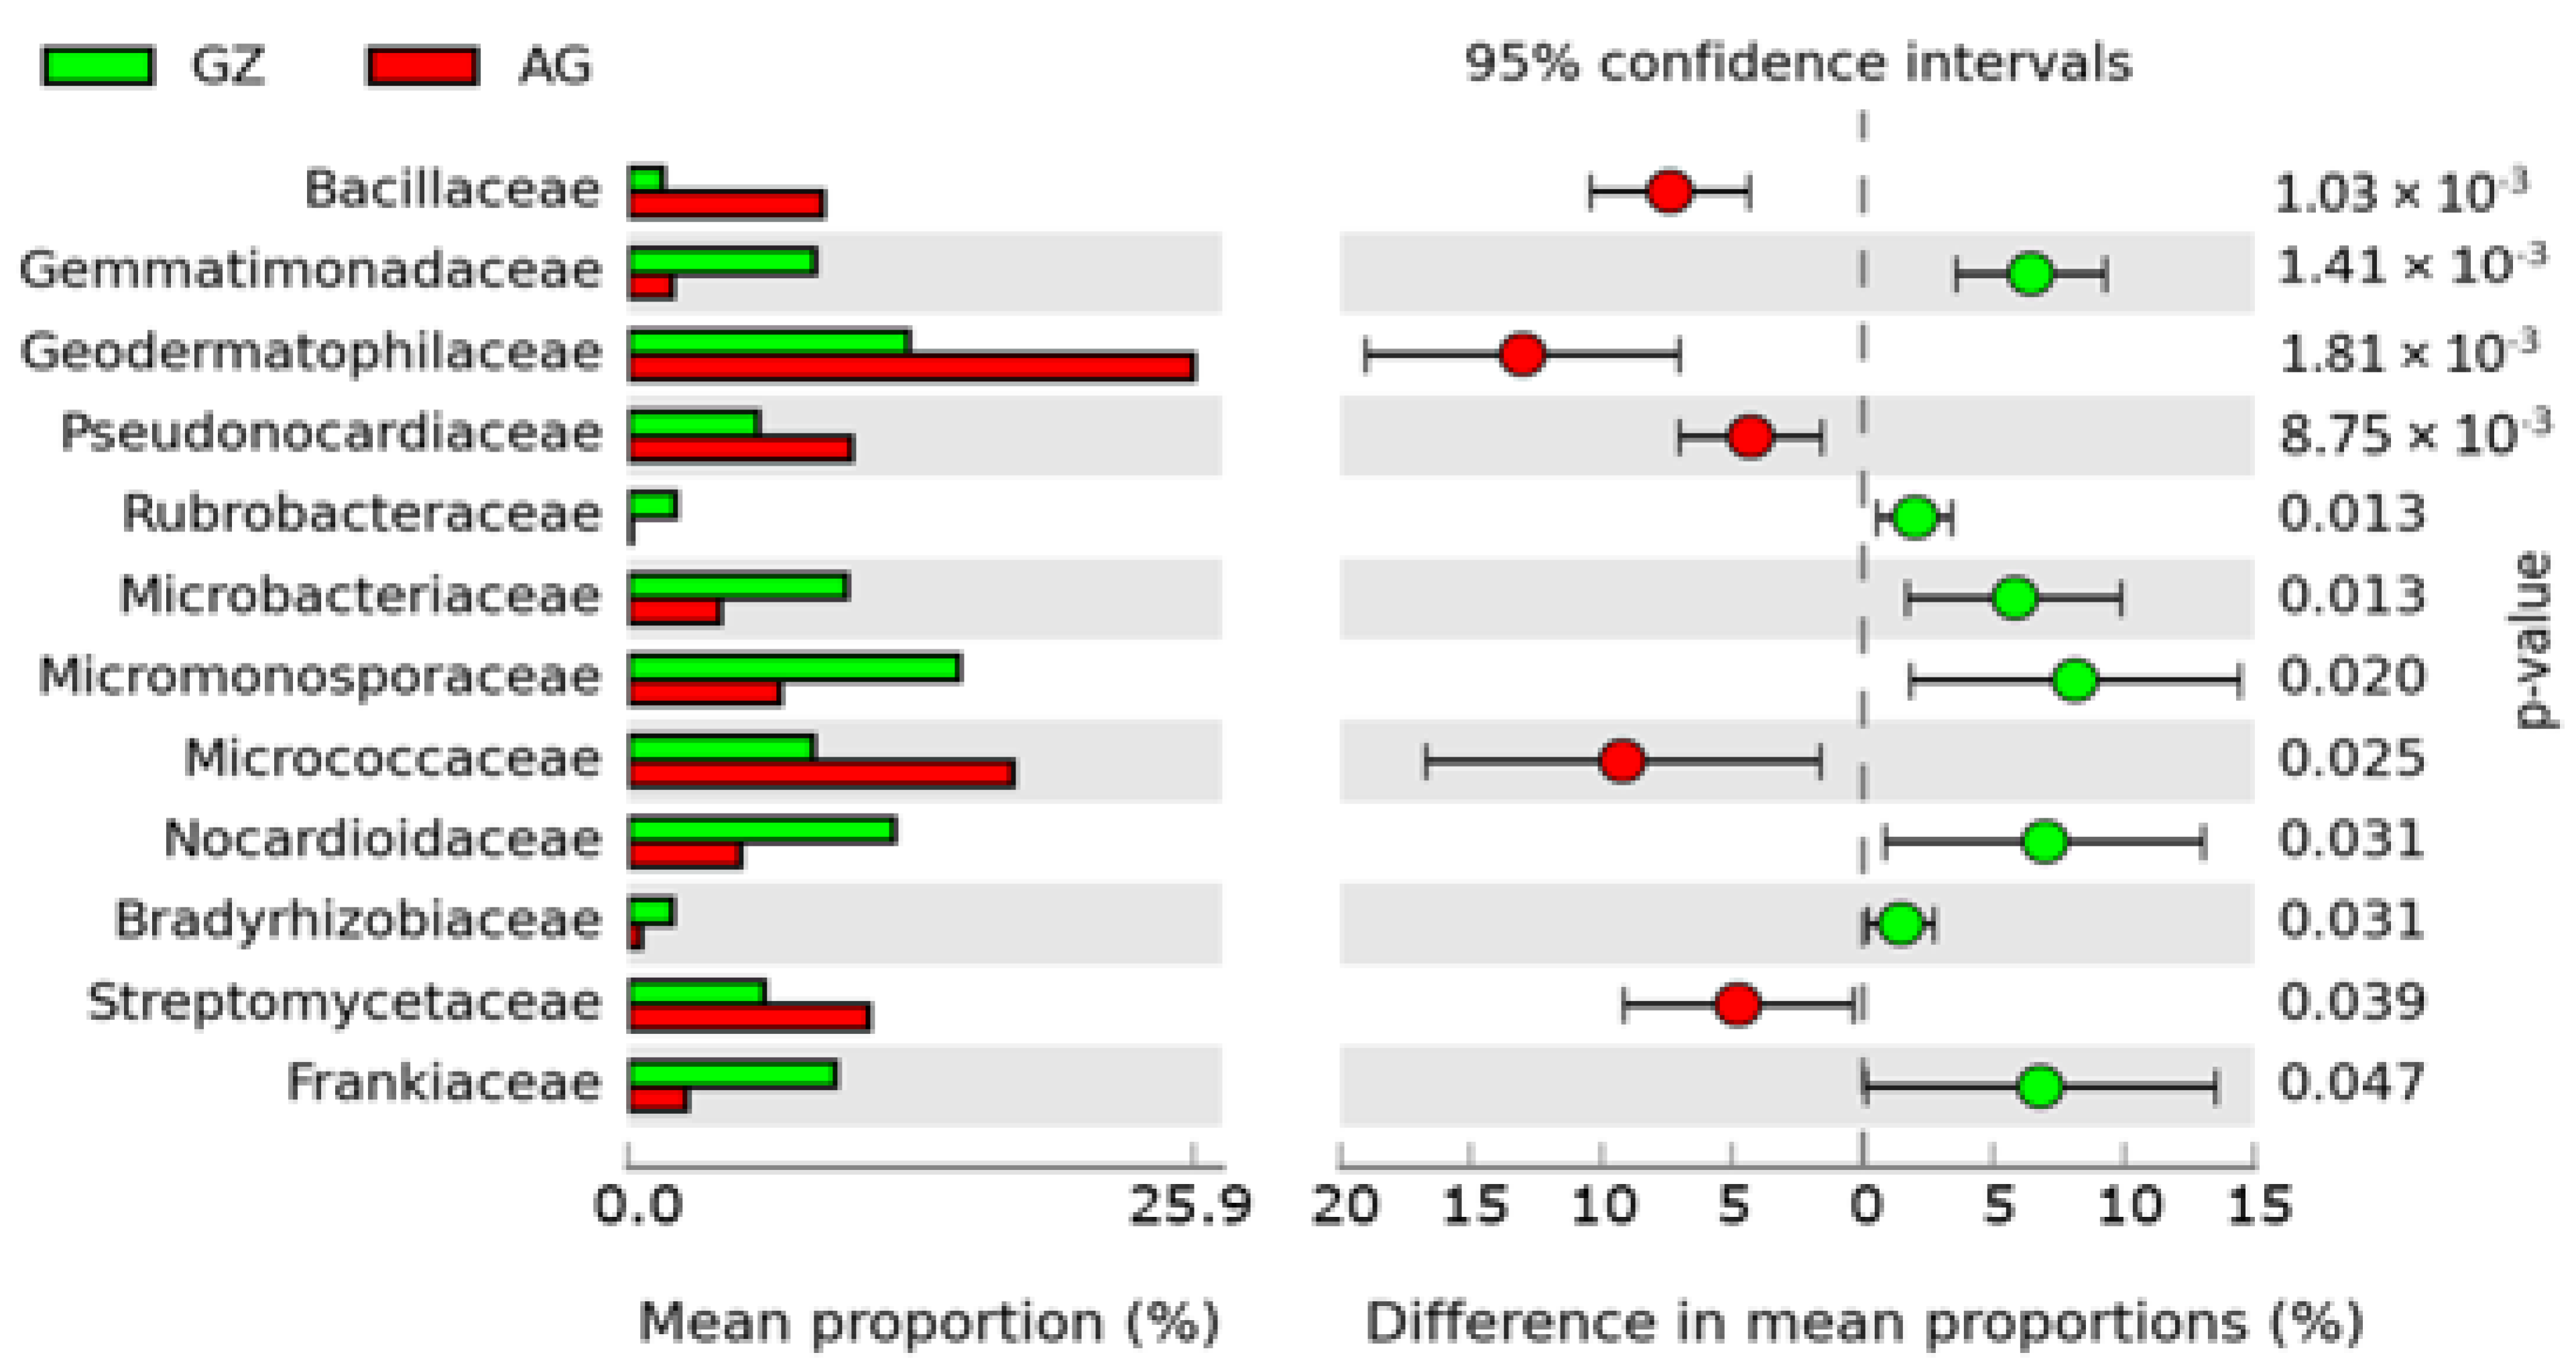
3.3. The Distribution of Microbes across the Maize Rhizosphere Soils

Metagenomic analysis using the RDP database revealed the dominance of 14 bacterial families as the most abundant microbial families observed in the former grassland and the intensively cultivated soils (Figure S1). Among these families, the abundance of eight bacterial families, including Micromonosporaceae (GZ1), Nocardioidaceae (GZ4), Gemmatimonadaceae (GZ1), Microbacteriaceae (GZ3), Frankiaceae (GZ3), and others were highest in the F1 soils, while the abundance of six bacterial families, including Geodermatophilaceae (AG3), Pseudonocardiaceae (AG4), Micrococcaceae (AG2), and others was predominant in the F2 soils (Figure S1). Among the archaeal families, Methanobacteriaceae was found in GZ3, AG1, and AG2, Methanomicrobiaceae in GZ2 and GZ4, and Thermofilaceae in the AG2 samples, whereas Ustilaginaceae (the only fungi found) was observed in all samples except AG2 and AG3. We used the STAMP software to identify significantly abundant microbial communities in the samples, represented by the extended error bar plot (Figure 2). The analysis showed that out of 18 microbial families, seven of them were significantly more abundant (p < 0.05) in the F1 samples, whereas five others were significantly more abundant (p < 0.05) in the F2 rhizosphere (Figure 2). However, no significant difference (Kruskal–Wallis, p = 0.98) was observed in the α diversity of the microbial communities between the F1 and the F2 soils.

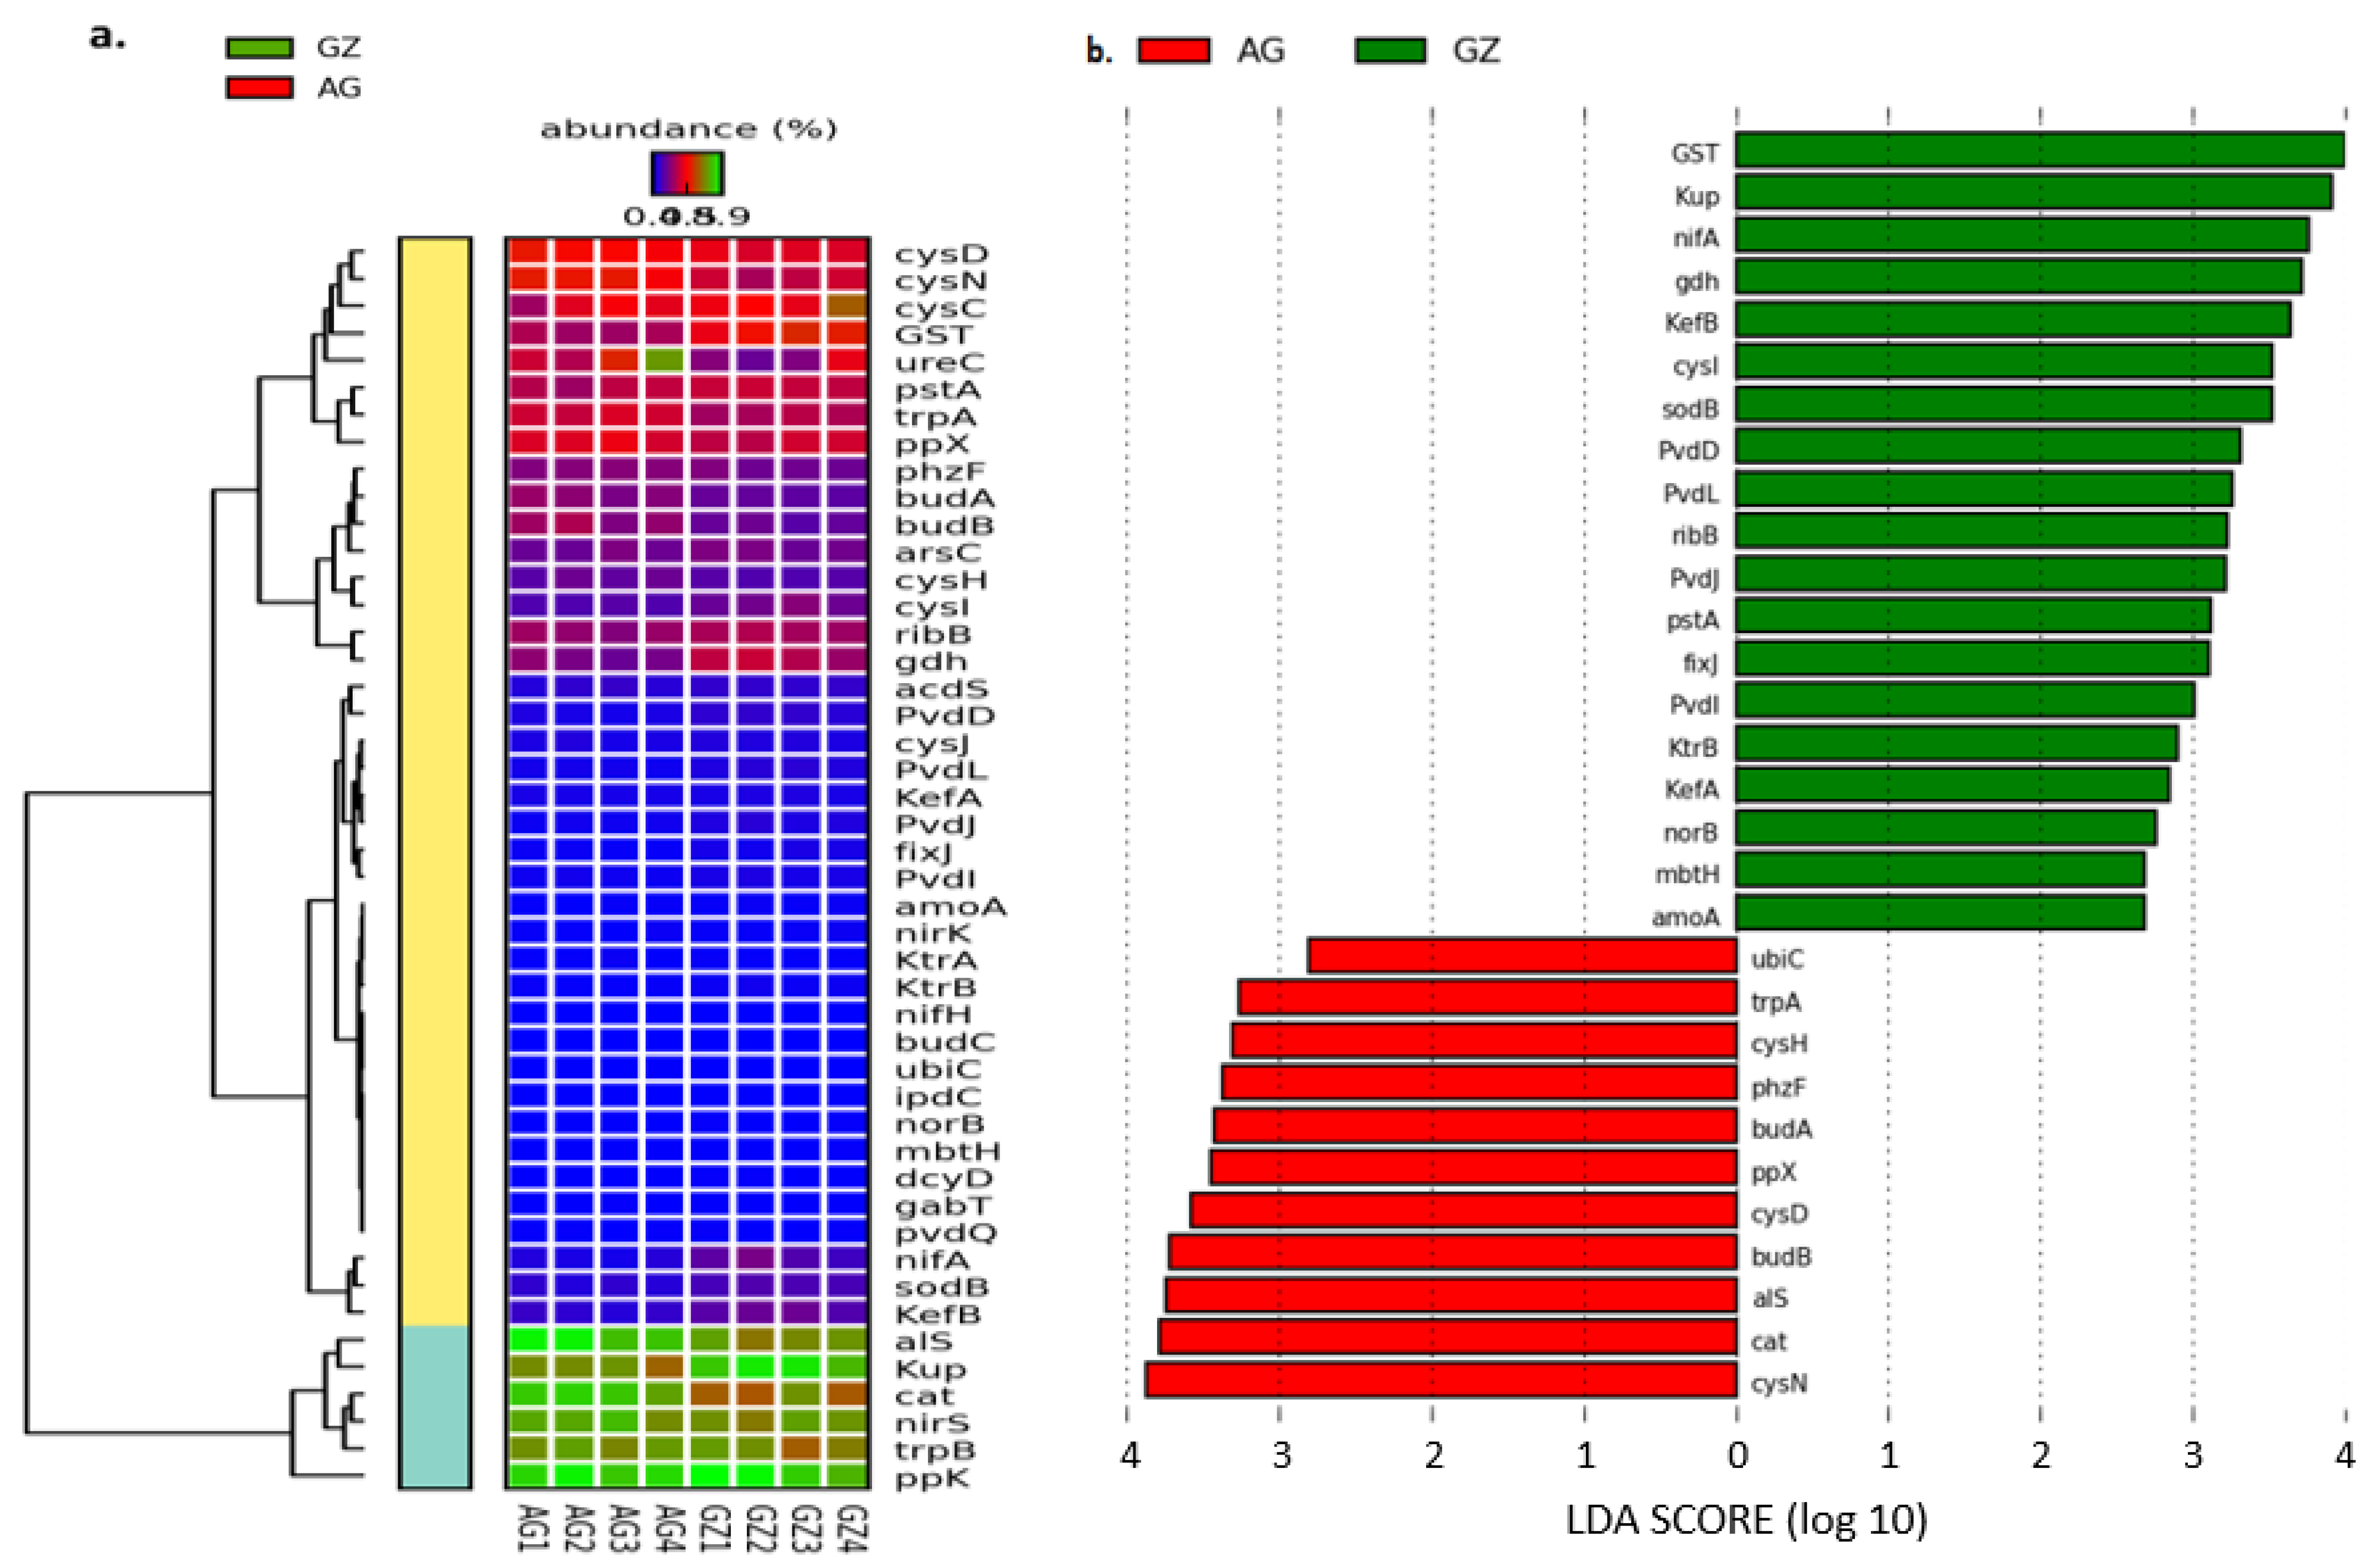
3.4. Microbial Genes That Enhance Plant Growth and Fitness Observed in the Maize Fields

The SEED subsystem database used in the functional classification of the metagenomic dataset revealed the abundance of several genes involved in plant growth promotion and carbon cycling in the agricultural soils (Tables S2 and S3).

3.4.1. Genes That Facilitate Nutrient Mobilization and Plant Growth

The metagenomic analysis of microbial functional genes in our samples using the SEED subsystems revealed a total of 8091 functional genes, of which several involved in the cycling of major nutrients (nitrogen, phosphorus, and potassium) that promote soil fertility were identified (Table S2). The plant growth-promoting genes assessed in our study were those involved in nitrogen fixation (nifA, nifH, and fixJ), nitrification (amoA), denitrification (nirK, nirS, and norB), phosphorus cycling (gdh, ppX, ppK, and pstA,), potassium cycling (kefA, kefB, kup, ktrA, and ktrB), ACC deaminase activity (acdS and dcyD), IAA biosynthesis (ipdC), tryptophan biosynthesis (trpA and trpB), sulfur metabolism (cysC, cysD, cysH, cysI, cysJ, and cysN), pyoverdine siderophore biosynthesis (pvdD, pvdI, pvdJ, pvdL, pvdQ, and mbtH), acetoin and 2,3-butanediol biosynthesis (alS, budA, budB, and budC), phenazine biosynthesis (phzF), oxidative stress (GST, sodB, and cat), quorum sensing (ribB), arsenate and atrazine degradation (arsC, gabT, and ureC), and 4-hydroxybenzoate biosynthesis (ubiC) (Table S2). The highest abundances of the genes involved in nitrogen cycling—nifA, fixJ, amoA, nirK, nirS, and norB—were observed in the F1 rhizosphere (GZ2, GZ3, GZ2, GZ3, GZ3, and GZ3, respectively) (Figure 3a and Table S2). Notably, the highest abundances of the genes concerned with phosphorus cycling, including glucose dehydrogenase (gdh), polyphosphate kinase (ppk), exopolyphosphatase (PPX), and the phosphate transport system (pstA) were observed in GZ3. Among the genes involved in potassium cycling, we observed the highest abundances of the potassium efflux (kefA and B) and the potassium uptake (kup) genes in GZ3, while the highest abundance of the potassium transport (ktrA) gene was observed in AG1 (Figure 3a and Table S2).
The analysis also revealed the abundance of various genes involved in both the direct and indirect enhancement of plant growth and health. The abundances of the ipdC, trpA, trpB, budA, budB, and alS genes were highest in AG1 compared to dcyD, budC, phzF, arsC, sodB, and GST, whose highest abundances were observed in GZ3 (Figure 3a and Table S2). Further analysis of genes involved in plant growth promotion using the linear discriminant analysis (LDA) effect size (LEfSe) on the galaxy server revealed the differences in the composition of these genes between the fields by describing their effect sizes. While performing the analysis, we used the strict (all classes differential) version, which identified 19 of the 46 plant growth-promoting genes, showing statistically differential and biologically consistent differences (α = 0.05) in the GZ samples (Figure 3b). In the AG samples, 11 plant growth-promoting genes with statistically differential abundance were observed (Figure 3b). The results revealed that the genes GST and kup (with an LDA score nearly 4 orders of magnitude) were the most differentially abundant (α = 0.05) plant growth-promoting genes observed in the GZ samples, whereas the cysN and cat (with an LDA score over 3.5 orders of magnitude) were the most differentially abundant (α = 0.05) in the AG samples (Figure 3b). The differences observed in the abundance of these genes among the samples reached a threshold of 2.75 for the GZ samples and 2.85 for the AG samples (Figure 3b).
To evaluate the α diversity of plant growth-promoting genes in the samples, we used the Simpson, Shannon, and Evenness indices. The α diversity analysis indicated that there was no significant difference (Kruskal–Wallis, p = 0.94) in the diversity of genes involved in plant growth promotion between the samples. From the α diversity analyses, the Simpson index was the same (0.95) in all samples. However, the Shannon and Evenness indices were higher in the GZ than in the AG samples (Figure S2). The β diversity (the diversity between the GZ and AG samples), which was determined using the analysis of similarity (ANOSIM), revealed that there was a significant difference (p = 0.01 and R = 0.52) in the diversity of these genes among the samples, thereby confirming the result obtained from the principal coordinate analysis (PCoA), which displayed a distinct separation between the GZ and AG samples and a close clustering of the GZ samples (Figure 4). The similarity percentage (SIMPER) analysis showed an overall average dissimilarity of 28 in the plant growth-promoting genes between all GZ and AG samples, with the kup gene contributing the most (8.70%) to the dissimilarity (Table 1). On the other hand, within the GZ samples (GZ1–GZ4), we observed the highest overall average dissimilarity of 24.20 between the GZ3 and GZ4 samples, whereas among the AG samples (AG1–AG4), the highest overall average dissimilarity of 48.0 was observed between the sample pair AG1 and AG3 (Table 1).

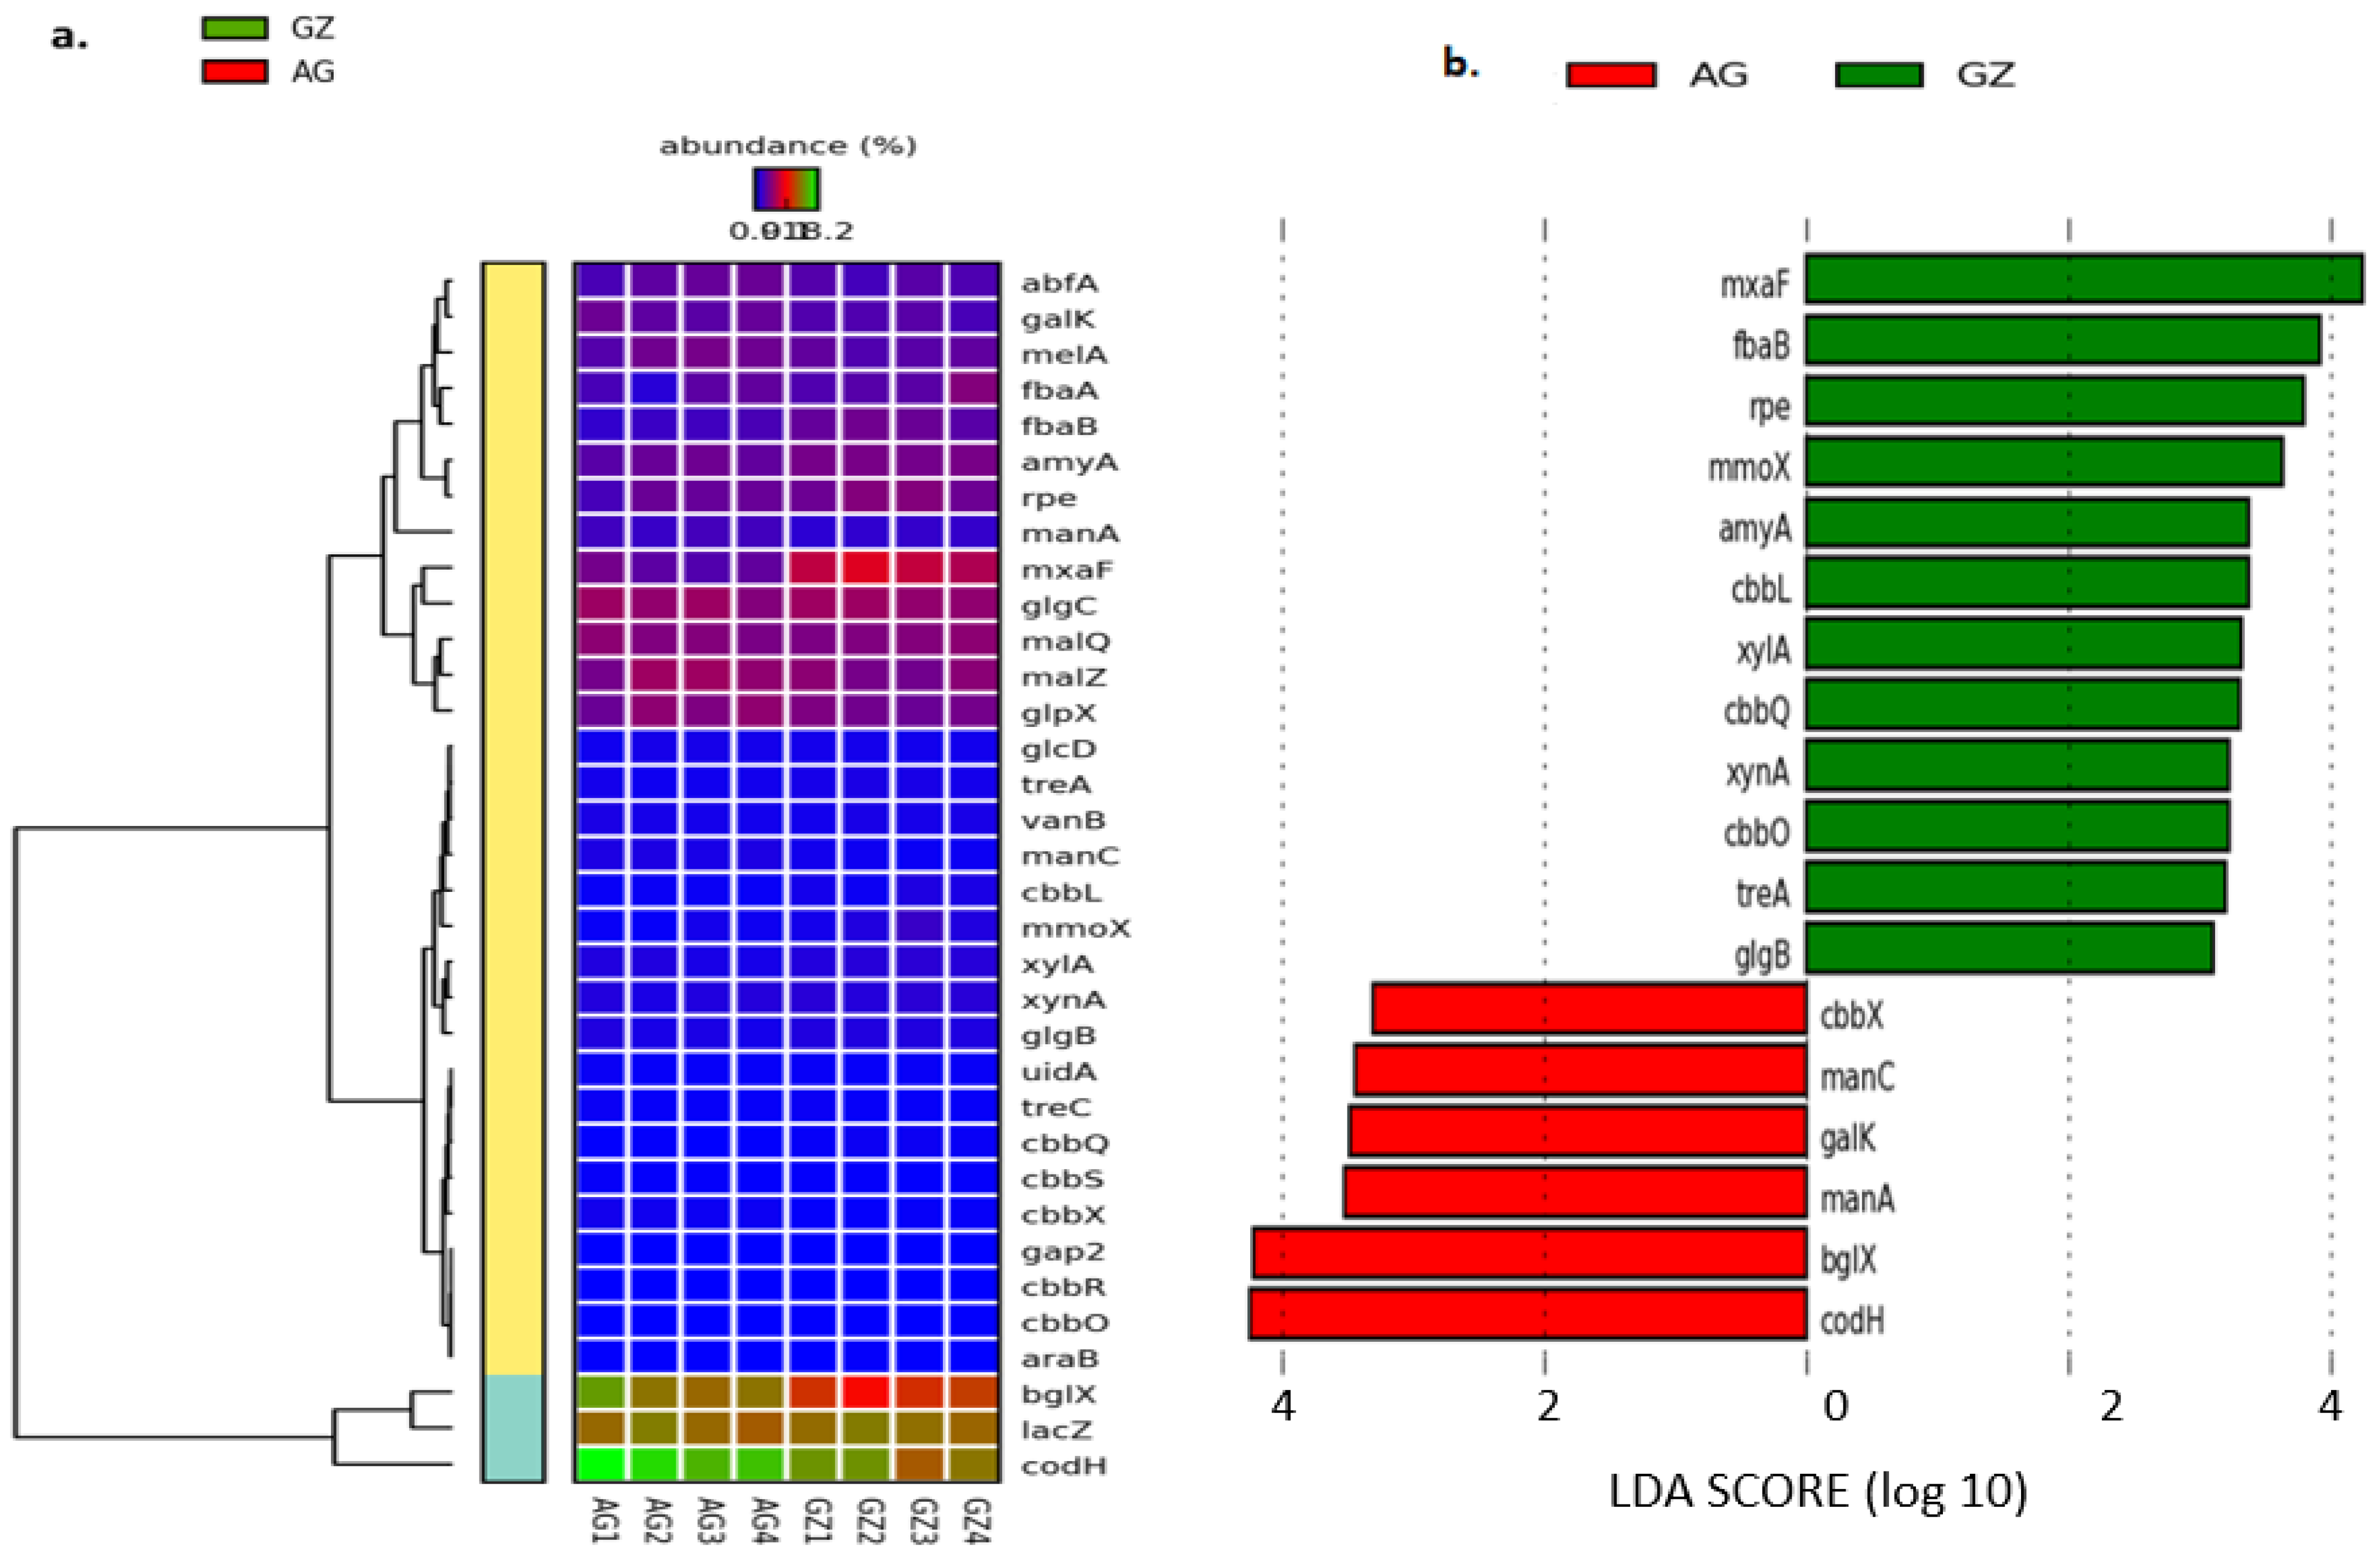
3.4.2. Microbial Genes Involved in Carbon Cycling

Genes that were considered to be associated with carbon cycling were identified using the functional category of the SEED subsystems (Table S3). From our analysis of the metagenomes in the maize rhizosphere soils, we found 34 important genes that were linked with carbon cycling in all samples. These genes include those concerned with the metabolism of carbohydrate (galK, glcD, manA, manC, melA, and lacZ), the fixing of carbon (codH, cbbL, cbbR, cbbO, cbbQ, cbbX, cbbS, gap2, and rpe), and the degrading of starch (amyA, glgB, glgC, bglX, malZ, malQ, abfA, treA, and treC), methane (glpX, fbaA, fbaB, mxaF, and mmoX), hemicellulose (araB, xylA, and xynA), and xenobiotics (vanB and uidA). With respect to carbon fixation, the abundance of the cbbR, cbbS, cbbX, and codH genes were highest in the AG rhizosphere compared to the gap2, rpe, cbbL, cbbO, and cbbQ genes whose abundances were observed to be highest in the GZ rhizosphere. Interestingly, all the methane-degrading genes (mxaF, mmoX, fbaA, fbaB, and glpX) were more abundant in the GZ than in the AG rhizosphere (Figure 5a and Table S3). The abundance of several genes involved in starch degradation, including amyA, glgB, glgC, malZ, malQ, abfA, and treA, was highest in the GZ samples. Furthermore, the highest abundances of several genes involved in hemicellulose degradation (araB, xylA, and xynA), carbohydrate metabolism (lacZ, melA, and glcD), and xenobiotics degradation (vanB) were observed in the GZ samples (Figure 5a and Table S3). By employing the strict (all classes differential) version of the linear discriminant analysis (LDA) effect size (LEfSe), we determined the effect sizes of differences in the abundance and distribution of carbon-cycling genes between the fields (GZ = GZ1–GZ4 and AG = AG1–AG4). The output revealed 12 and 6 carbon-cycling genes (out of the 34 genes), showing statistically differential and biologically consistent differences in the GZ and AG samples (Figure 5b). From the analysis, the most differentially abundant (α = 0.05) carbon-cycling genes in GZ were those concerned with methane degradation (mxaF, fbaB, rpe, and mmoX), with high LDA scores (over 3 orders of magnitude), reaching a threshold of 4.3 (Figure 5b). On the other hand, the most differentially abundant (α = 0.05) carbon-cycling genes observed in the AG samples were the codH and bglX genes, involved in carbon fixation and starch degradation, with high LDA scores of 4.3 (Figure 5b).
To determine the α diversity of carbon-cycling genes in the rhizosphere samples, we used the Simpson, Shannon, and Evenness indices. The values obtained from these indices were higher in the GZ samples than in the AG samples (Figure S3). However, no significant difference (Kruskal–Wallis, p = 0.93) was observed in the α diversity of the carbon-cycling genes between the fields. On the other hand, ANOSIM, which was used to determine the β diversity, indicated that there was a significant difference (p = 0.01 and R = 0.52) in the β diversity of the carbon-cycling genes between the samples from the former grassland and the intensively cultivated land. This analysis is a confirmation of the principal coordinate analysis (PCoA), which showed a distinct separation of the samples from the former grassland and the intensively cultivated land (Figure 6). From the SIMPER analysis, an overall pairwise dissimilarity of 26 was observed in the diversity of carbon-cycling genes between the GZ and the AG samples (Table 1). The diversity of carbon-cycling genes within the GZ samples showed that the highest pairwise dissimilarity of 24.15 was observed between the GZ3 and GZ4 samples compared to 45.58 (between AG1 and AG3) obtained as the highest pairwise dissimilarity observed in the AG samples. The top shared carbon-cycling genes that contributed the most to the observed differences in the sample groups and their percentage contributions are presented in Table 1.

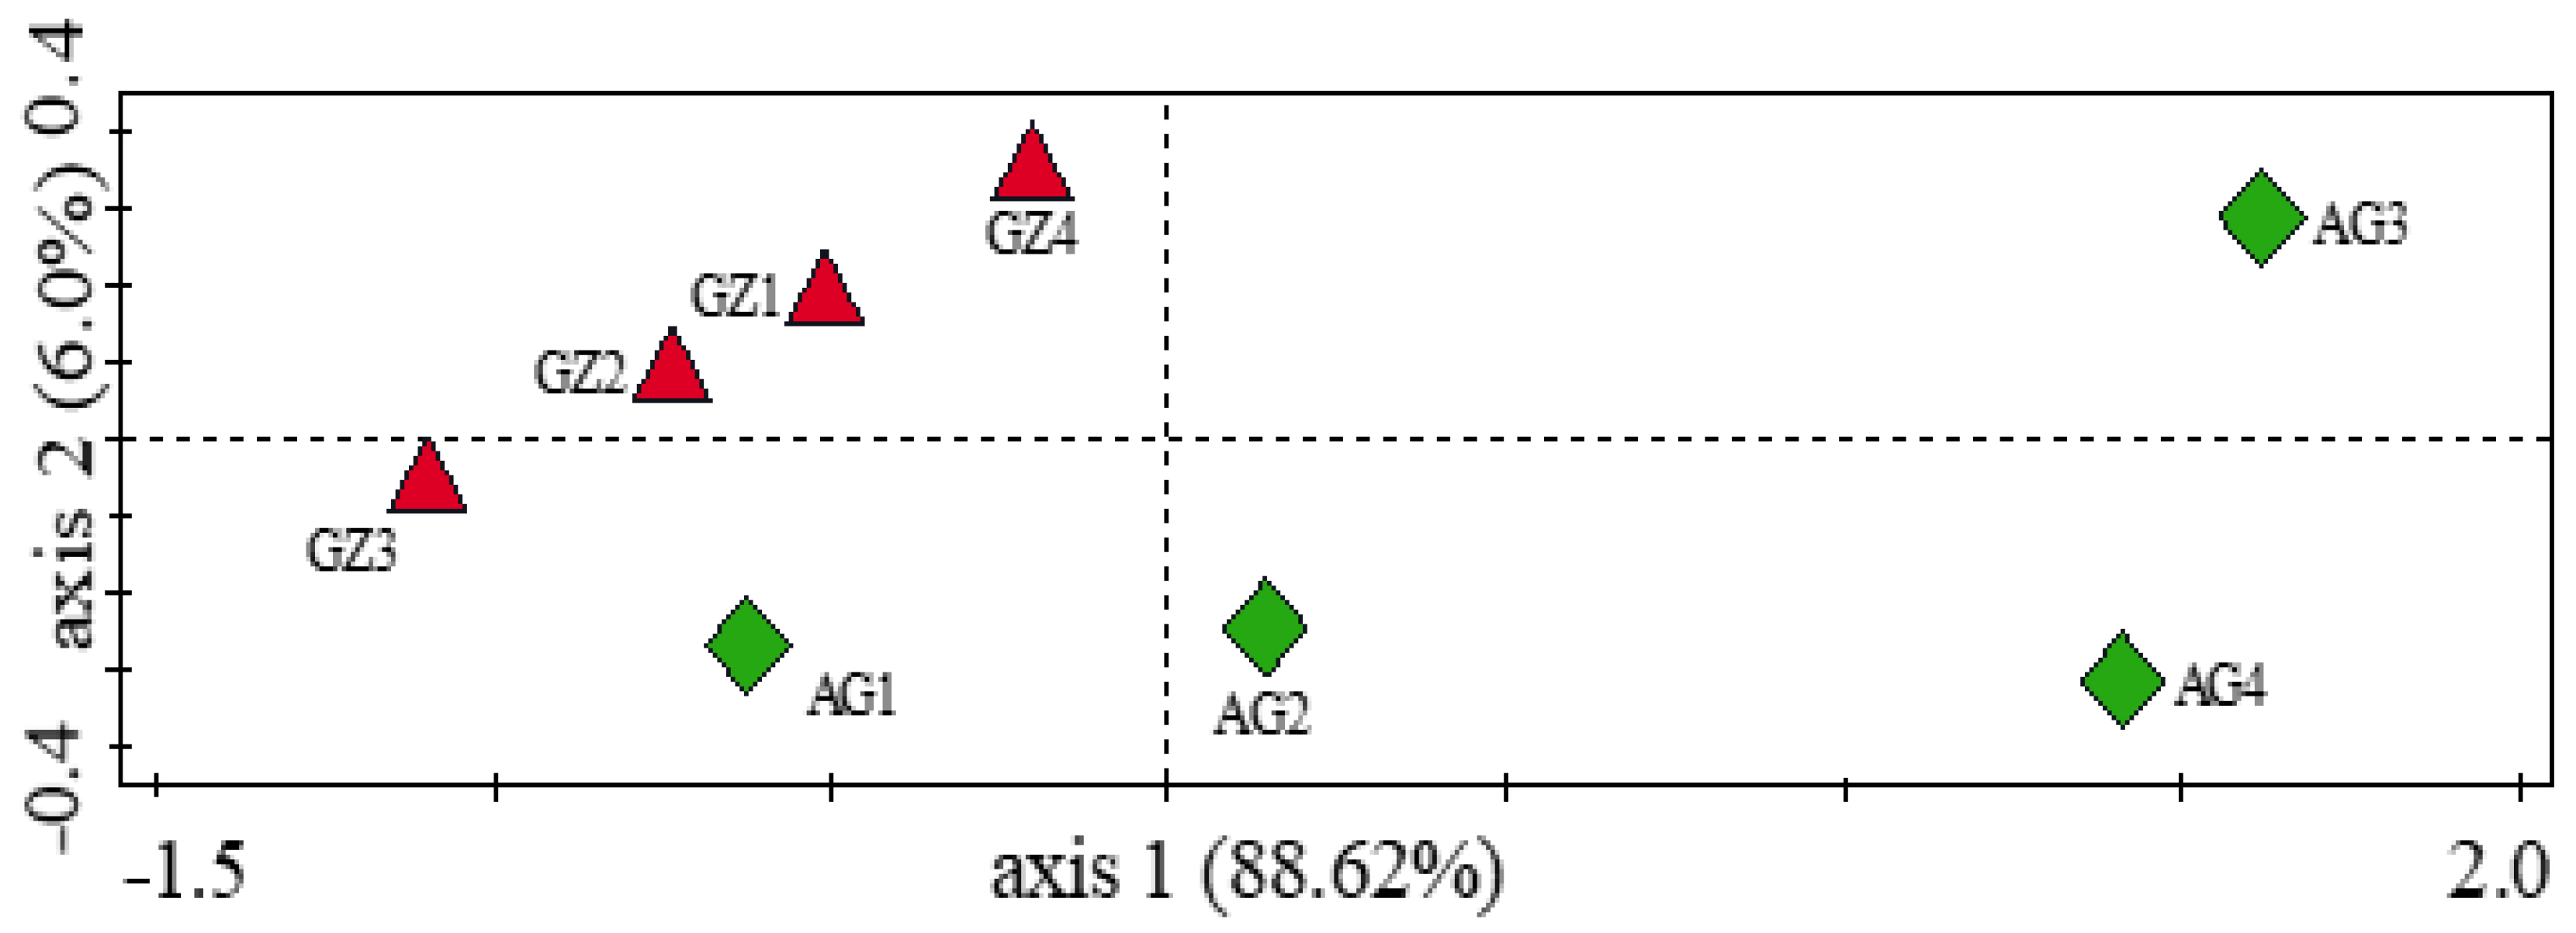
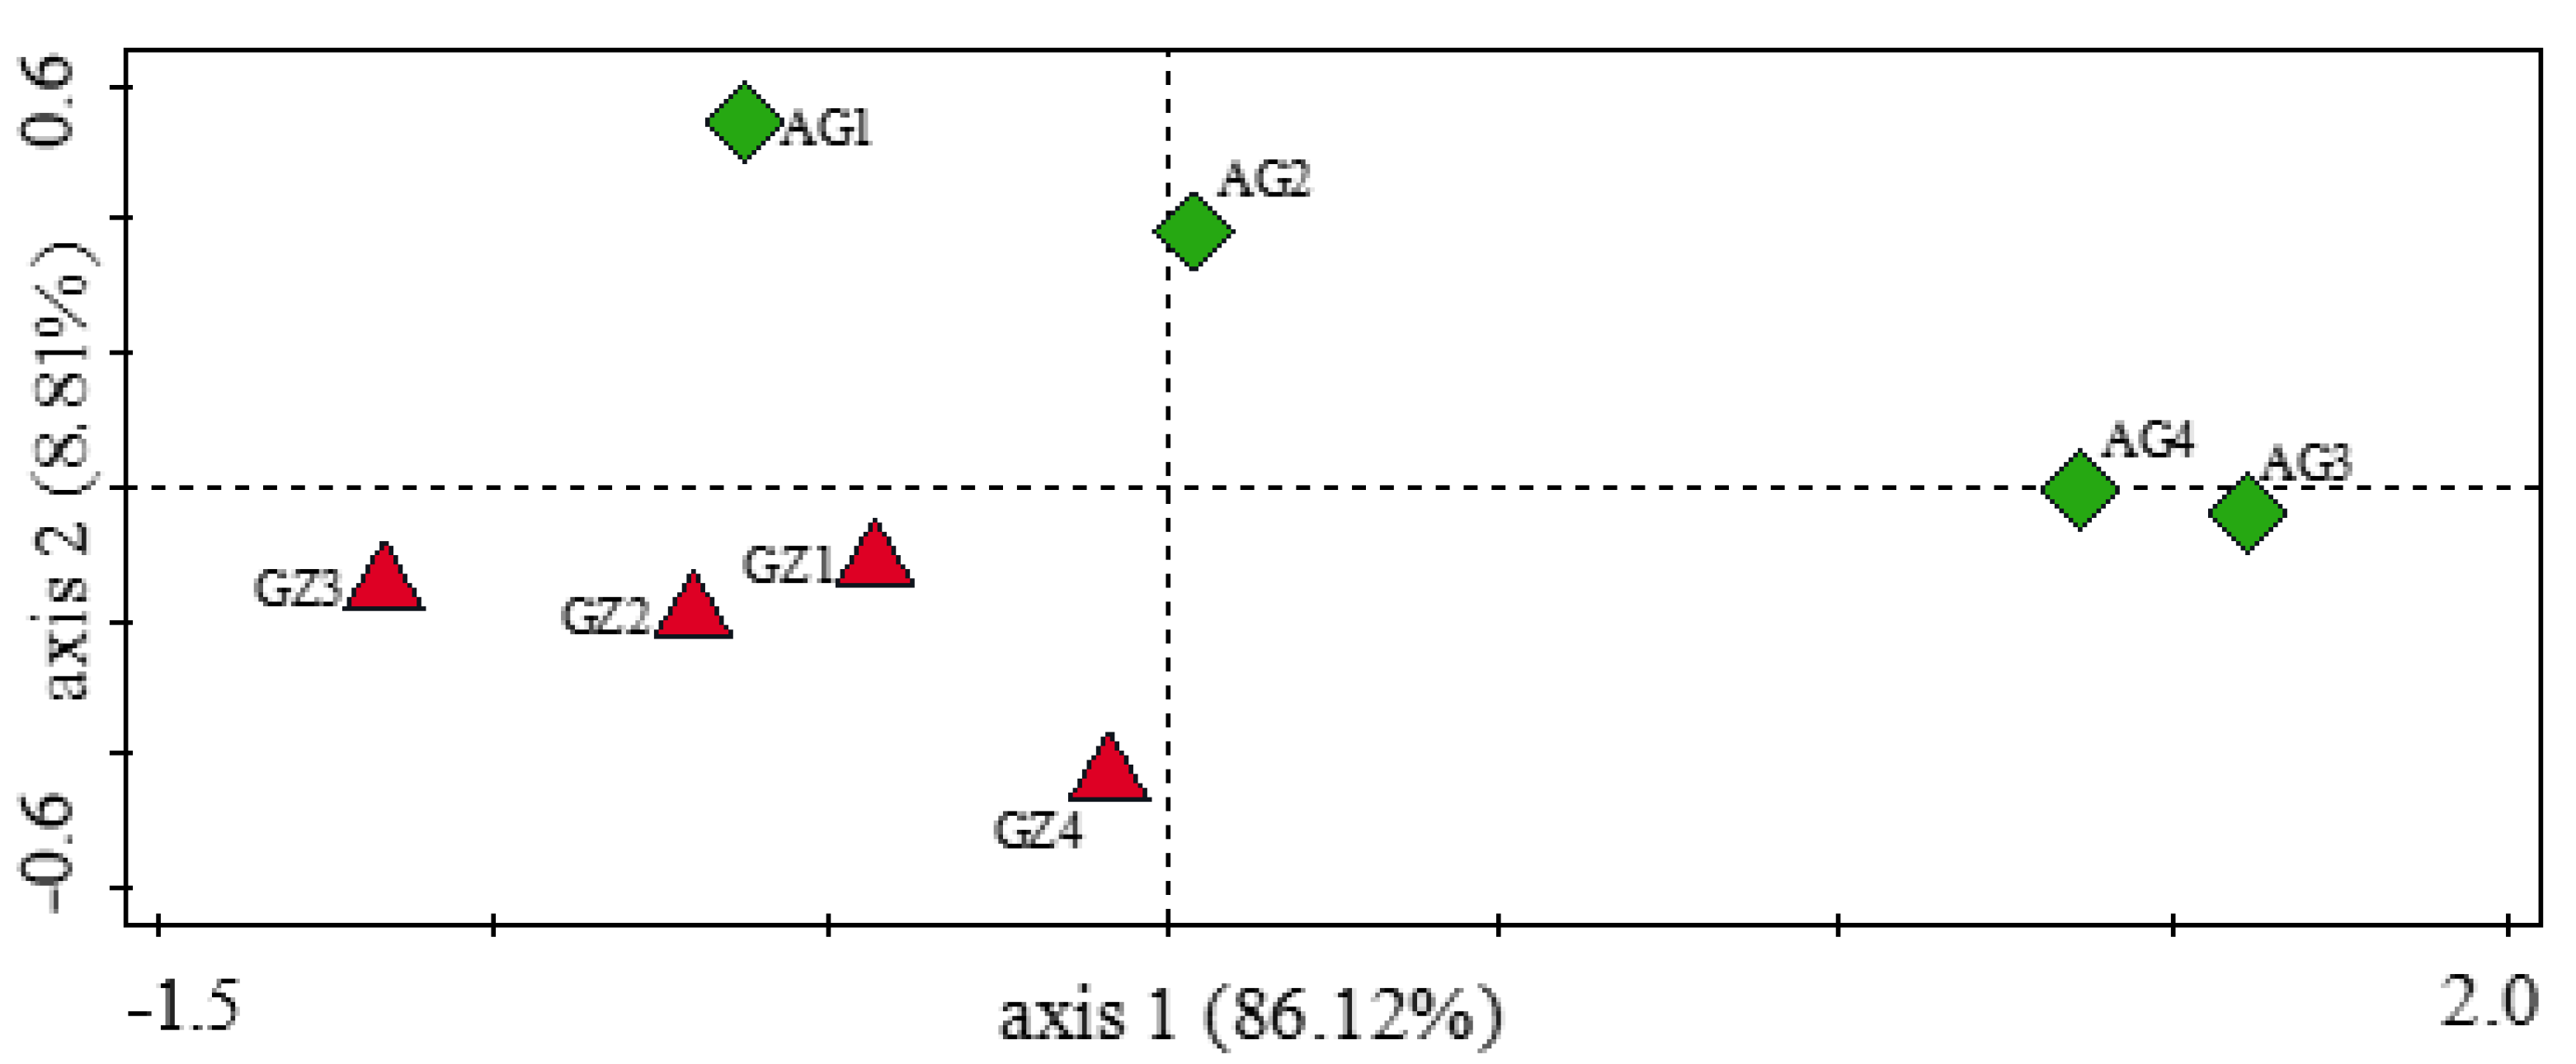
3.5. Influence of Soil Physicochemical Properties on the Diversity of Carbon-Cycling and Plant Growth-Promoting Genes

In this study, we employed the canonical correspondence analysis (CCA) to assess the correlation between the microbial functional genes in the study and the soils’ physicochemical parameters. We computed the CCA plot with all the environmental variables, as presented in Figure 7, and observed a CCA permutation test of 0.015, indicating that the composition of the carbon-cycling and plant growth-promoting genes were affected by the physicochemical properties of the soils (Figure 7). A correlation analysis showed that cysC, cysJ, dcyD, ipdC, pvdQ, pvdL, cbbL, cbbQ, rpe, treC, gap2, mxaF, mmoX, and uidA negatively correlated with N-NH4 and positively correlated with N-NO3, N-NH4, pH, OC, and OM. On the other hand, cbbX, ureC, and manC positively correlated with N-NH4 and negatively correlated with N-NO3, N-NH4, pH, OC, and OM. However, abfA, cbbR, and cbbS positively correlated with all the tested variables (N-NO3, N-NH4, pH, OC, and OM). The forward selection option through the Monte Carlo permutation test, with 9999 random permutations, was used to study which soil chemical parameter was the most influential in the differences observed in the microbial functional genes across the samples (Table S4). From the analysis, we found that N-NO3 contributed the most (31.3%) to the variation, with a p-value of 0.05 (Table S4).

4. Discussion

The practice of land-use conversion has become common over the years, with studies reporting its impacts on soil microbial communities and the environment; however, the effects of land-use history on microbial functional gene potential in the rhizosphere of plants remain understudied. Using shotgun metagenomic sequencing, this study revealed the differences in microbial functional genes, particularly those involved in nutrient mobilization, plant growth promotion, and carbon cycling of land previously used as pasture (with a lower N fertilizer application rate and a no-tillage system), and of land that had been under intensive cultivation (with a higher N fertilizer application rate and a conventional tillage system) for several years. We showed that the abundance and diversity of the genes involved in plant growth-promotion and carbon cycling within these fields are distinct from one another, thereby representing the land-use and management histories of the fields. The soils also differed in their physicochemical properties, which also contributed to the differences in the diversity of the genes. This study highlighted the effects of land-use and management histories as well as soil chemical properties on the functioning and maintenance of the soil ecosystem, especially in nitrogen and carbon cycling, in order to present the long-term effects of cultivation on these functional genes in the plants’ rhizosphere. Understanding the long-term effects of land-use and management practices on the diversity of microbial functional genes helps to explain how the soil ecosystem copes with current and future agricultural management practices.
Although the rhizosphere metagenomes contained sequences that originate from the archaeal and fungal groups, sequences from the bacterial families were more predominant as they represented more than 99% of the sequences. The analysis of microbial families in the study revealed that some bacterial communities were more predominant in one field than the other, thereby indicating the possible effects of land use on microbial community composition and diversity. Moreover, our analysis revealed that the fields were dominated by important microbial communities known to improve plant growth and degrade complex polysaccharides, including chitin, lignin, cellulose, and hemicellulose, and plant residues in soils [42]. Micromonosporaceae, Microbacteriaceae, Nocardioidaceae, and Bradyrhizobiaceae (significantly more abundant in the F1 rhizosphere samples) are important plant colonizers and have been implicated in plant growth promotion in various agricultural soils [43]. Their contributions toward plant growth and development include the production, regulation, and degradation of phytohormones, the production of siderophores, mineralization and mobilization of soil nutrients, production of vitamins for plant growth, antagonism against various phytopathogens, among other important functions in the soil [43,44,45]. The abundance of these communities in the fields indicate their relevance in maintaining soil fertility and plant health in the soils. We also suggested that the differentially abundant microbial families (Figure 2) might likely be important, particularly in the functioning of the host plants, and contribute immensely towards the plants’ health and fitness as proposed by Hartman et al. [46] and Pérez-Jaramillo et al. [47].
The composition of microbial functional genes involved in plant growth promotion in the rhizosphere soils was significantly affected by the soils’ management regimes. The composition of genes involved in plant growth promotion in the former grassland (GZ) soils differed from those of the intensively cultivated land (AG). From the analyses, the higher abundance of genes involved in nitrogen cycling in the GZ (F1 rhizosphere) samples indicates that management practices impact the abundance of these genes in the plant rhizosphere. The differences observed in the abundance of genes concerned with nitrogen fixation (nifA and fixJ) in the soils further suggest that reduced fertilizer application rates might increase biological nitrogen fixation in agricultural soils. Yu et al. [48] also reported a higher abundance of the nitrogen fixation gene, nifH, in a reduced fertilizer-treated soil. Our results on the abundance of nitrogen fixation genes is also evidenced by the higher abundance of the nitrogen-fixing microbial communities—the Micromonosporaceae, Frankiaceae, and Bradyrhizobiaceae families [49,50]—observed in GZ soils (Figure 2 and Figure S1). The data concurs with previous studies that suggest that the amount of biological nitrogen fixation in lower N-fertilized soils is higher compared to higher N-fertilized soils [48,51]. Moreover, land tilling also affects the abundance of genes involved in several stages of nitrogen fixation [52]. Under low N fertilization (67 kg ha−1), Hu et al. [53] reported that the relative abundance of the nifH transcript was higher in no-till soils than in conventionally tilled soils. Furthermore, the influence of soil management was also observed in the abundance of genes involved in nitrification (amoA) and denitrification (norB, nirK, and nirS) in the soils. Hu, Jin, Konkel, Schaeffer, Schneider and DeBruyn [53] studied the effects of agricultural management on the abundance of genes involved in nitrogen cycling. They observed that under N fertilizer treatment (67 kg ha−1), both the relative abundance and transcript of the amoA gene was increased in no-till soils. However, for the denitrification genes, the relative abundance of nirK increased in no-till plots, whereas the nirS gene was higher in conventionally tilled plots. These results confirm that N fertilization promotes denitrification and nitrification in agricultural soils, and that reduced fertilization management enhances these processes [54]. Therefore, our results suggest that management practices altered the environmental conditions of the soils, which subsequently impacted the abundance of nutrient-cycling genes in the soils.
Many soil microbes act as biocontrol agents by producing and secreting bioactive substances (secondary metabolites) known as siderophores [55]. The production and secretion of siderophores are one of the various modes of biocontrol activity used by microbes to acquire the nutrient element, iron [56]. The analysis of microbial functional genes involved in plant growth promotion revealed higher abundances of the pvdD, pvdJ, pvdI, and mbtH genes that are linked with the production and utilization of pyoverdine siderophore in the former grassland rhizosphere samples, thereby indicating that microbial communities in these soils might have high disease-suppressive capabilities. Our results revealed distinct dissimilarities in the diversity (ANOSIM, p = 0.01 and R = 0.52) of microbial functional genes responsible for plant growth promotion, as observed in the principal coordinate analysis (PCoA) (Figure 4) and the similarity percentage (SIMPER) analysis (Table 1). We attribute these dissimilarities to the different management practices involved in the fields, which have subsequently impacted the functional attributes of the soils. Although the α diversity for these genes was not significant between both fields, we observed higher α diversity indices in the F1 soils than in the F2 soils. Likewise, the PCoA plot displayed a close clustering of samples from the same field, with samples from a distinct field widely separated, pointing toward land-use and management differences (Figure 4). These results, in collaboration with the similarity percentage analysis (SIMPER) of the plant growth-promoting genes observed in the samples, are in agreement with our hypothesis that the diversity of microbial functional genes in F1 will differ from those of F2 due to land-use and management histories.
Microbial communities in soils contribute significantly towards soil organic carbon cycling and fixation, while changes and the pattern of changes in the soil organic carbon pool are regulated by the soil microbial community structure [57,58]. The impact of land-use and management histories on the distribution of carbon-cycling functional genes as assessed by our study revealed that specific gene families concerned with carbon cycling were preferentially associated with a particular soil. For example, the carbon fixation genes, cbbL (Ribulose bisphosphate carboxylase large chain), cbbQ (RuBisCo activation protein), cbbO (RuBisCo activation protein), and rpe (Ribulose-phosphate 3-epimerase), were statistically differentially abundant (α = 0.05) in the F1 rhizosphere (GZ) soils compared to codH (carbon monoxide dehydrogenase large chain) and cbbX (probable RuBisCo-expression protein) that were statistically differentially abundant (α = 0.05) in the F2 rhizosphere (AG) soils (Figure 5b). Ribulose bisphosphate carboxylase (RuBisCo) is the principal enzyme in the Calvin–Benson cycle, which initiates the process of carbon fixation [28]. These results indicate that the agricultural management history of each field (grassland with no tilling and lower N fertilization, and continuous cultivation with tilling and higher N fertilization) might have provided similar conditions that favored broad colonization by microbial communities with the same functional groups in each field. Furthermore, the genes associated with methane degradation, mxaF, fbaB, and mmoX, were significantly more abundant in the F1 rhizosphere soils than in the F2 rhizosphere soils. We suggest that higher and prolonged fertilizer use in the intensively cultivated soils (F2) may have influenced the lower abundance of the genes involved in methane degradation in these soils. Manoharan, Kushwaha, Ahrén, and Hedlund [1] also reported a higher abundance of genes in grassland soils than in cultivated soils. They further indicated that the continuous application of fertilizers in agricultural soils can inhibit methane breakdown in these soils. In our study, the higher abundance of genes involved in the degradation of methane in F1 soils is a confirmation of the results observed in the physicochemical components of the soils, which revealed higher OC, TC, and OM contents in the former grassland soils. These results, along with those of the microbial composition of the soils, confirm that the F1 soil environment is colonized by active methanotrophic microbial communities that metabolize and use methane as sources of energy and carbon, thereby helping to regulate methane flux in the environment.
The similarity percentage analysis (SIMPER) further revealed the extent of dissimilarity in the diversity of carbon-cycling genes between the GZ and AG soils, whereas the PCoA plot demonstrated that there were obvious differences in the abundance and distribution of carbon-cycling genes across the fields. Taken together, these results confirmed our second assumption in which we hypothesized that land-use and management histories would impact the diversity of the genes observed in the rhizosphere of the former grassland and the intensively cultivated land. Gaining insights into how the composition and diversity of microbial carbon-cycling genes in the rhizosphere are impacted by land use may further increase our knowledge of the effects of anthropogenic activities on carbon flux in the agricultural soil environment.
In our study, differences were observed in the chemical properties of both fields. The amounts of N-NO3, K, OM, TC, and OC were higher in the F1 soils than in the F2 soils, while N-NH4 content was higher in the F2 than in the F1 rhizosphere samples (Table S1). Land disturbances arising from long-term agricultural practices may impact the physicochemical properties of soils and alter the composition and properties of the soils’ biogeochemical interfaces [59]. Moreover, the soil microbial community structure and function may be impacted by land-use practices, resulting in an alteration of the soils’ chemical properties [8,60]. Long-term continuous agricultural practices, such as fertilization and tillage reduce soil quality and cause land degradation [61]. Based on our study, we suggest that the lower levels of OM, TC, OC, and N-NO3 observed in the F2 soils were due to intensive cultivation practices in the field, as continuous cultivation degrades the physicochemical properties of soils. These results coincide with those of Fujisao et al. [62], who indicated that continuous cultivation under conventional tilling reduces the contents of TC, TN, and exchangeable K in maize soils. The lower OC in F2 soils may also explain the reason for the lower OM in the soils. Long-term cultivation reduces OC, which contains about 58% of OM [63]. Therefore, land cultivation with heavy pieces of machinery and the persistent application of fertilizers over a long period increases the mineralization and degradation of OM and OC in soils [64]. Additionally, lower levels of soil organic matter (SOM) due to intensive cropping reduces soil fertility over time by depleting the stocks of important soil elements, such as N, P, and S [65]. This may be the case in our study, with the lowest levels of S observed in AG2 and completely absent in other F2 (AG1, AG3, and AG4) samples. Furthermore, conventional agricultural practices cause the acidification of soils. The literature has indicated that the extremely long use and heavy application of N fertilizer reduce soil pH [66,67]. As observed in our study, lower pH values were detected in F2 soils, indicating the influence of long-term intensive agriculture on the soils’ pH. This result is also consistent with the amounts of N-NO3 and N-NH4 found in the soils, as N in the form of nitrate (NO3) increases the pH in the rhizosphere, while N in ammonium (NH4) results in the acidification of the rhizosphere [68]. On the other hand, Sengupta et al. [69] reported lower pH in plow-till soils and higher pH in no-till soils, in line with the results of this study. Furthermore, the canonical correspondence analysis (CCA) showed that N-NO3, with a significance level of 0.05, contributed the most (31%) to the differences observed in the diversity and abundance of carbon-cycling and plant growth-promoting genes in the samples (Figure 7 and Table S4). Apart from N-NO3, our results also showed that other soil properties, including N-NH4, pH, OC, and OM, also contributed to the observed differences, as shown in the length of their vector arrows in Figure 7. These results agree with Li et al. [70], who reported that NO3, pH, NH4, and OC were influential factors that determined the abundance and distribution of functional genes in heavy metal-contaminated soils. The results of this study indicate that soil physicochemical properties also impact microbial functional gene composition and diversity in soils.

5. Conclusions

Shotgun metagenomic sequencing was applied on maize rhizosphere soils to elucidate the effects of land-use and management histories on the diversity and composition of microbial functional genes involved in plant growth promotion and carbon cycling. The differences in the abundance of functional genes involved in carbohydrate metabolism, carbon fixation, methane degradation, plant growth promotion, and nutrient mobilization are evidence that land-use and management histories impact microbial functions in agricultural soils. Moreover, among the soil properties, N-NO3 was the most influential in determining the composition and diversity of these genes across the samples; this indicates that soil chemical properties, which are also highly influenced by anthropogenic activities [59], are strong factors that affect microbial functions in soils. The taxonomic diversity revealed the abundance of microorganisms linked with important functions in the plant rhizosphere, with a majority more abundant in the former grassland rhizosphere; in addition, it reflected the effects of agricultural practices on the rhizosphere microbiota. The study increased our understanding of the relationship between plant health, biogeochemical nutrient cycling, the rhizosphere microbiome, and anthropogenic activities, all of which have direct or indirect effects on food production as the increasing human population exerts more pressure on crop yield. Future studies that target the genes expressed in these soils may help divulge the different microbial functional genes truly active in the rhizosphere soils and enhance our understanding of the functioning of microbial communities in the plant rhizosphere. In conclusion, this study confirmed that land-use history and management practices could impact the environmental conditions of soils, which may subsequently influence the ecosystem services (functions) of the microbial communities in the rhizosphere of agricultural soils.

Supplementary Materials

The following are available online at https://0-www-mdpi-com.brum.beds.ac.uk/article/10.3390/genes12091431/s1. Figure S1: Relative abundance of major microbial families found in the maize rhizospheric soils; Figure S2: Alpha diversity of genes involved in plant growth promotion in maize rhizospheric samples; Figure S3: Alpha diversity of genes involved in carbon cycling in maize rhizospheric samples; Table S1: Physicochemical parameters of soil samples; Table S2: Data of plant growth-promoting genes found in maize rhizospheric samples; Table S3: Data on of carbon-cycling genes found in maize rhizospheric samples; Table S4: The forward selection of physicochemical parameters that explains the most significant difference in the composition of the functional genes among the samples

Author Contributions

C.F.C. and O.O.B. contributed to the study conception and design. Material preparation, literature search, data collection, data analysis, and writing of the first draft of the manuscript were performed by C.F.C., A.S.A. reviewed and critiqued the various drafts and assisted with data analysis. O.O.B., as the principal investigator, thoroughly critiqued the different versions of the manuscript, provided academic input, proofread, and funded the entire project. All authors have read and agreed to the published version of the manuscript.

Funding

OOB is thankful to the National Research Foundation (NRF), South Africa, for supporting research in her lab (Grants: UID123634 and UID132595).

Institutional Review Board Statement

Not applicable.

Informed Consent Statement

Not applicable.

Data Availability Statement

The data files (reads in FASTQ format) were deposited at the NCBI SRA database under the BioProject accession No.PRJNA649682.

Conflicts of Interest

The authors declare that this research was performed without any form of financial or non-financial obligations to any organization or entity.

References

  1. Manoharan, L.; Kushwaha, S.K.; Ahrén, D.; Hedlund, K. Agricultural land use determines functional genetic diversity of soil microbial communities. Soil Biol. Biochem. 2017, 115, 423–432. [Google Scholar] [CrossRef]
  2. Palansooriya, K.N.; Wong, J.T.F.; Hashimoto, Y.; Huang, L.; Rinklebe, J.; Chang, S.X.; Bolan, N.; Wang, H.; Ok, Y.S. Response of microbial communities to biochar-amended soils: A critical review. Biochar 2019, 1, 3–22. [Google Scholar] [CrossRef] [Green Version]
  3. Bai, Y.; Müller, D.B.; Srinivas, G.; Garrido-Oter, R.; Potthoff, E.; Rott, M.; Dombrowski, N.; Münch, P.C.; Spaepen, S.; Remus-Emsermann, M. Functional overlap of the Arabidopsis leaf and root microbiota. Nature 2015, 528, 364–369. [Google Scholar] [CrossRef] [PubMed]
  4. Cole, B.J.; Feltcher, M.E.; Waters, R.J.; Wetmore, K.M.; Mucyn, T.S.; Ryan, E.M.; Wang, G.; Ul-Hasan, S.; McDonald, M.; Yoshikuni, Y. Genome-wide identification of bacterial plant colonization genes. PLoS Biol. 2017, 15, e2002860. [Google Scholar] [CrossRef] [PubMed]
  5. Lebeis, S.L.; Paredes, S.H.; Lundberg, D.S.; Breakfield, N.; Gehring, J.; McDonald, M.; Malfatti, S.; Del Rio, T.G.; Jones, C.D.; Tringe, S.G. Salicylic acid modulates colonization of the root microbiome by specific bacterial taxa. Science 2015, 349, 860–864. [Google Scholar] [CrossRef] [Green Version]
  6. Sloan, S.S.; Lebeis, S.L. Exercising influence: Distinct biotic interactions shape root microbiomes. Curr. Opin. Plant Biol. 2015, 26, 32–36. [Google Scholar] [CrossRef]
  7. König, S.; Vogel, H.-J.; Harms, H.; Worrich, A. Physical, chemical and biological effects on soil bacterial dynamics in microscale models. Front. Ecol. Evol. 2020, 8, 53. [Google Scholar] [CrossRef] [Green Version]
  8. Sui, X.; Zhang, R.; Frey, B.; Yang, L.; Li, M.-H.; Ni, H. Land use change effects on diversity of soil bacterial, Acidobacterial and fungal communities in wetlands of the Sanjiang Plain, northeastern China. Sci. Rep. 2019, 9, 1–14. [Google Scholar] [CrossRef] [PubMed]
  9. Berkelmann, D.; Schneider, D.; Meryandini, A.; Daniel, R. Unravelling the effects of tropical land use conversion on the soil microbiome. Environ. Microbiome 2020, 15, 5. [Google Scholar] [CrossRef] [PubMed] [Green Version]
  10. Trivedi, P.; Delgado-Baquerizo, M.; Jeffries, T.C.; Trivedi, C.; Anderson, I.C.; Lai, K.; McNee, M.; Flower, K.; Pal Singh, B.; Minkey, D. Soil aggregation and associated microbial communities modify the impact of agricultural management on carbon content. Environ. Microbiol. 2017, 19, 3070–3086. [Google Scholar] [CrossRef]
  11. Wagg, C.; Schlaeppi, K.; Banerjee, S.; Kuramae, E.E.; van der Heijden, M.G. Fungal-bacterial diversity and microbiome complexity predict ecosystem functioning. Nat. Commun. 2019, 10, 1–10. [Google Scholar] [CrossRef] [PubMed]
  12. Garcia-Franco, N.; Martínez-Mena, M.; Goberna, M.; Albaladejo, J. Changes in soil aggregation and microbial community structure control carbon sequestration after afforestation of semiarid shrublands. Soil Biol. Biochem. 2015, 87, 110–121. [Google Scholar] [CrossRef]
  13. Wang, H.; Marshall, C.W.; Cheng, M.; Xu, H.; Li, H.; Yang, X.; Zheng, T. Changes in land use driven by urbanization impact nitrogen cycling and the microbial community composition in soils. Sci. Rep. 2017, 7, 1–12. [Google Scholar]
  14. Strickland, M.S.; Callaham Jr, M.A.; Gardiner, E.S.; Stanturf, J.A.; Leff, J.W.; Fierer, N.; Bradford, M.A. Response of soil microbial community composition and function to a bottomland forest restoration intensity gradient. Appl. Soil Ecol. 2017, 119, 317–326. [Google Scholar] [CrossRef] [Green Version]
  15. Dang, C.; Morrissey, E.M.; Neubauer, S.C.; Franklin, R.B. Novel microbial community composition and carbon biogeochemistry emerge over time following saltwater intrusion in wetlands. Glob. Chang. Biol. 2019, 25, 549–561. [Google Scholar] [CrossRef] [PubMed]
  16. Barberán, A.; FERNÁNDEZ-GUERRA, A.; Bohannan, B.J.; Casamayor, E.O. Exploration of community traits as ecological markers in microbial metagenomes. Mol. Ecol. 2012, 21, 1909–1917. [Google Scholar] [CrossRef]
  17. Alami, M.M.; Xue, J.; Ma, Y.; Zhu, D.; Gong, Z.; Shu, S.; Wang, X. Structure, diversity, and composition of bacterial communities in rhizospheric soil of coptis chinensis franch under continuously cropped fields. Diversity 2020, 12, 57. [Google Scholar] [CrossRef] [Green Version]
  18. Fierer, N.; Barberán, A.; Laughlin, D.C. Seeing the forest for the genes: Using metagenomics to infer the aggregated traits of microbial communities. Front. Microbiol. 2014, 5, 614. [Google Scholar] [CrossRef]
  19. Schmidt, J.E.; Kent, A.D.; Brisson, V.L.; Gaudin, A.C. Agricultural management and plant selection interactively affect rhizosphere microbial community structure and nitrogen cycling. Microbiome 2019, 7, 1–18. [Google Scholar] [CrossRef] [Green Version]
  20. Guo, Y.; Chen, X.; Wu, Y.; Zhang, L.; Cheng, J.; Wei, G.; Lin, Y. Natural revegetation of a semiarid habitat alters taxonomic and functional diversity of soil microbial communities. Sci. Total Environ. 2018, 635, 598–606. [Google Scholar] [CrossRef] [PubMed]
  21. Raphael, J.P.; Calonego, J.C.; Milori, D.M.B.; Rosolem, C.A. Soil organic matter in crop rotations under no-till. Soil Tillage Res. 2016, 155, 45–53. [Google Scholar] [CrossRef] [Green Version]
  22. Ali, A.; Imran Ghani, M.; Li, Y.; Ding, H.; Meng, H.; Cheng, Z. Hiseq Base Molecular Characterization of Soil Microbial Community, Diversity Structure, and Predictive Functional Profiling in Continuous Cucumber Planted Soil Affected by Diverse Cropping Systems in an Intensive Greenhouse Region of Northern China. Int. J. Mol. Sci. 2019, 20, 2619. [Google Scholar] [CrossRef] [Green Version]
  23. Yang, Y.; Gao, Y.; Wang, S.; Xu, D.; Yu, H.; Wu, L.; Lin, Q.; Hu, Y.; Li, X.; He, Z. The microbial gene diversity along an elevation gradient of the Tibetan grassland. ISME J. 2014, 8, 430–440. [Google Scholar] [CrossRef] [Green Version]
  24. Xu, J.; Zhang, Y.; Zhang, P.; Trivedi, P.; Riera, N.; Wang, Y.; Liu, X.; Fan, G.; Tang, J.; Coletta-Filho, H.D. The structure and function of the global citrus rhizosphere microbiome. Nat. Commun. 2018, 9, 1–10. [Google Scholar] [CrossRef] [Green Version]
  25. Akinola, S.A.; Ayangbenro, A.S.; Babalola, O.O. The diverse functional genes of maize rhizosphere microbiota assessed using shotgun metagenomics. J. Sci. Food Agric. 2020. [Google Scholar]
  26. Enebe, M.C.; Babalola, O.O. Metagenomics Assessment of Soil Fertilization on the Chemotaxis and Disease Suppressive Genes Abundance in the Maize Rhizosphere. Genes 2021, 12, 535. [Google Scholar] [CrossRef] [PubMed]
  27. Ke, X.; Feng, S.; Wang, J.; Lu, W.; Zhang, W.; Chen, M.; Lin, M. Effect of inoculation with nitrogen-fixing bacterium Pseudomonas stutzeri A1501 on maize plant growth and the microbiome indigenous to the rhizosphere. Syst. Appl. Microbiol. 2019, 42, 248–260. [Google Scholar] [CrossRef]
  28. Paula, F.S.; Rodrigues, J.L.; Zhou, J.; Wu, L.; Mueller, R.C.; Mirza, B.S.; Bohannan, B.J.; Nüsslein, K.; Deng, Y.; Tiedje, J.M. Land use change alters functional gene diversity, composition and abundance in Amazon forest soil microbial communities. Mol. Ecol. 2014, 23, 2988–2999. [Google Scholar] [CrossRef] [PubMed]
  29. Muwawa, E.M.; Makonde, H.M.; Budambula, N.; Osiemo, Z.L. Chemical properties associated with guts, soil and nest materials of Odontotermes and Macrotermes species from Kenya. J. Biol. Environ. Sci. 2010, 4, 253–263. [Google Scholar]
  30. Bray, R.H.; Kurtz, L. Determination of total, organic, and available forms of phosphorus in soils. Soil Sci. 1945, 59, 39–46. [Google Scholar] [CrossRef]
  31. Walkley, A.; Black, I.A. An examination of the Degtjareff method for determining soil organic matter, and a proposed modification of the chromic acid titration method. Soil Sci. 1934, 37, 29–38. [Google Scholar] [CrossRef]
  32. Shi, J.-Y.; Yuan, X.-F.; Lin, H.-R.; Yang, Y.-Q.; Li, Z.-Y. Differences in soil properties and bacterial communities between the rhizosphere and bulk soil and among different production areas of the medicinal plant Fritillaria thunbergii. Int. J. Mol. Sci. 2011, 12, 3770–3785. [Google Scholar] [CrossRef]
  33. Nelson, D.W.; Sommers, L.E. Total carbon, organic carbon, and organic matter. Methods Soil Anal. Part 3 Chem. Methods 1996, 5, 961–1010. [Google Scholar]
  34. Meyer, F.; Paarmann, D.; D’Souza, M.; Olson, R.; Glass, E.M.; Kubal, M.; Paczian, T.; Rodriguez, A.; Stevens, R.; Wilke, A. The metagenomics RAST server–a public resource for the automatic phylogenetic and functional analysis of metagenomes. BMC Bioinform. 2008, 9, 1–8. [Google Scholar] [CrossRef] [PubMed] [Green Version]
  35. Kent, W.J. BLAT—the BLAST-like alignment tool. Genome Res. 2002, 12, 656–664. [Google Scholar] [CrossRef] [Green Version]
  36. Wilke, A.; Harrison, T.; Wilkening, J.; Field, D.; Glass, E.M.; Kyrpides, N.; Mavrommatis, K.; Meyer, F. The M5nr: A novel non-redundant database containing protein sequences and annotations from multiple sources and associated tools. BMC Bioinform. 2012, 13, 141. [Google Scholar] [CrossRef] [Green Version]
  37. Overbeek, R.; Olson, R.; Pusch, G.D.; Olsen, G.J.; Davis, J.J.; Disz, T.; Edwards, R.A.; Gerdes, S.; Parrello, B.; Shukla, M. The SEED and the Rapid Annotation of microbial genomes using Subsystems Technology (RAST). Nucleic Acids Res. 2014, 42, D206–D214. [Google Scholar] [CrossRef] [PubMed]
  38. Parks, D.H.; Tyson, G.W.; Hugenholtz, P.; Beiko, R.G. STAMP: Statistical analysis of taxonomic and functional profiles. Bioinformatics 2014, 30, 3123–3124. [Google Scholar] [CrossRef] [Green Version]
  39. Hammer, Ø.; Harper, D.A.; Ryan, P.D. PAST: Paleontological statistics software package for education and data analysis. Palaeontol. Electron. 2001, 4, 9. [Google Scholar]
  40. Segata, N.; Izard, J.; Waldron, L.; Gevers, D.; Miropolsky, L.; Garrett, W.S.; Huttenhower, C. Metagenomic biomarker discovery and explanation. Genome Biol. 2011, 12, 1–18. [Google Scholar] [CrossRef] [PubMed] [Green Version]
  41. Chukwuneme, C.F.; Ayangbenro, A.S.; Babalola, O.O.; Kutu, F.R. Functional diversity of microbial communities in two contrasting maize rhizosphere soils. Rhizosphere 2021, 17, 100282. [Google Scholar] [CrossRef]
  42. Yeager, C.M.; Dunbar, J.; Hesse, C.N.; Daligault, H.; Kuske, C.R. Polysaccharide degradation capability of Actinomycetales soil isolates from a semiarid grassland of the Colorado Plateau. Appl. Environ. Microbiol. 2017, 83, e03020-16. [Google Scholar] [CrossRef] [PubMed] [Green Version]
  43. Hamedi, J.; Mohammadipanah, F. Biotechnological application and taxonomical distribution of plant growth promoting actinobacteria. J. Ind. Microbiol. Biotechnol. 2015, 42, 157–171. [Google Scholar] [CrossRef] [PubMed]
  44. Tsegaye, Z.; Assefa, F.; Beyene, D. Properties and application of plant growth promoting rhizobacteria. Int. J. Curr. Trends Pharm. Med Sci. 2017, 2, 30–43. [Google Scholar]
  45. Chukwuneme, C.F.; Babalola, O.O.; Kutu, F.R.; Ojuederie, O.B. Characterization of actinomycetes isolates for plant growth promoting traits and their effects on drought tolerance in maize. J. Plant Interact. 2020, 15, 93–105. [Google Scholar] [CrossRef]
  46. Hartman, K.; van der Heijden, M.G.; Wittwer, R.A.; Banerjee, S.; Walser, J.-C.; Schlaeppi, K. Cropping practices manipulate abundance patterns of root and soil microbiome members paving the way to smart farming. Microbiome 2018, 6, 1–14. [Google Scholar]
  47. Pérez-Jaramillo, J.E.; de Hollander, M.; Ramírez, C.A.; Mendes, R.; Raaijmakers, J.M.; Carrión, V.J. Deciphering rhizosphere microbiome assembly of wild and modern common bean (Phaseolus vulgaris) in native and agricultural soils from Colombia. Microbiome 2019, 7, 1–16. [Google Scholar] [CrossRef] [PubMed] [Green Version]
  48. Yu, L.; Tang, Y.; Wang, Z.; Gou, Y.; Wang, J. Nitrogen-cycling genes and rhizosphere microbial community with reduced nitrogen application in maize/soybean strip intercropping. Nutr. Cycl. Agroecosystems 2019, 113, 35–49. [Google Scholar] [CrossRef]
  49. Valdés, M.; Pérez, N.-O.; Estrada-de Los Santos, P.; Caballero-Mellado, J.; Pena-Cabriales, J.J.; Normand, P.; Hirsch, A.M. Non-Frankia actinomycetes isolated from surface-sterilized roots of Casuarina equisetifolia fix nitrogen. Appl. Environ. Microbiol. 2005, 71, 460–466. [Google Scholar] [CrossRef] [PubMed] [Green Version]
  50. El-Tarabily, K.A.; Nassar, A.H.; Sivasithamparam, K. Promotion of growth of bean (Phaseolus vulgaris L.) in a calcareous soil by a phosphate-solubilizing, rhizosphere-competent isolate of Micromonospora endolithica. Appl. Soil Ecol. 2008, 39, 161–171. [Google Scholar] [CrossRef]
  51. Corre-Hellou, G.; Brisson, N.; Launay, M.; Fustec, J.; Crozat, Y. Effect of root depth penetration on soil nitrogen competitive interactions and dry matter production in pea–barley intercrops given different soil nitrogen supplies. Field Crop. Res. 2007, 103, 76–85. [Google Scholar] [CrossRef]
  52. Smith, C.R.; Blair, P.L.; Boyd, C.; Cody, B.; Hazel, A.; Hedrick, A.; Kathuria, H.; Khurana, P.; Kramer, B.; Muterspaw, K. Microbial community responses to soil tillage and crop rotation in a corn/soybean agroecosystem. Ecol. Evol. 2016, 6, 8075–8084. [Google Scholar] [CrossRef]
  53. Hu, J.; Jin, V.L.; Konkel, J.Y.; Schaeffer, S.M.; Schneider, L.G.; DeBruyn, J.M. Soil Health Management Enhances Microbial Nitrogen Cycling Capacity and Activity. Msphere 2021, 6, e01237-20. [Google Scholar] [CrossRef]
  54. Coskun, D.; Britto, D.T.; Shi, W.; Kronzucker, H.J. Nitrogen transformations in modern agriculture and the role of biological nitrification inhibition. Nat. Plants 2017, 3, 1–10. [Google Scholar] [CrossRef]
  55. Chowdhury, F.T.; Zaman, N.R.; Islam, M.R.; Khan, H. Anti-fungal secondary metabolites and hydrolytic enzymes from rhizospheric bacteria in crop protection: A review. J. Bangladesh Acad. Sci. 2020, 44, 69–84. [Google Scholar] [CrossRef]
  56. Igiehon, N.O.; Babalola, O.O. Rhizosphere microbiome modulators: Contributions of nitrogen fixing bacteria towards sustainable agriculture. Int. J. Environ. Res. Public Health 2018, 15, 574. [Google Scholar] [CrossRef] [PubMed] [Green Version]
  57. Liang, C.; Balser, T.C. Warming and nitrogen deposition lessen microbial residue contribution to soil carbon pool. Nat. Commun. 2012, 3, 1–4. [Google Scholar] [CrossRef] [PubMed] [Green Version]
  58. Enebe, M.C.; Babalola, O.O. Soil fertilization affects the abundance and distribution of carbon and nitrogen cycling genes in the maize rhizosphere. AMB Express 2021, 11, 1–10. [Google Scholar] [CrossRef] [PubMed]
  59. Mhete, M.; Eze, P.N.; Rahube, T.O.; Akinyemi, F.O. Soil properties influence bacterial abundance and diversity under different land-use regimes in semi-arid environments. Sci. Afr. 2020, 7, e00246. [Google Scholar] [CrossRef]
  60. Zhang, Q.; Wu, J.; Yang, F.; Lei, Y.; Zhang, Q.; Cheng, X. Alterations in soil microbial community composition and biomass following agricultural land use change. Sci. Rep. 2016, 6, 1–10. [Google Scholar] [CrossRef] [Green Version]
  61. Moebius-Clune, B.; Van Es, H.; Idowu, O.; Schindelbeck, R.; Kimetu, J.; Ngoze, S.; Lehmann, J.; Kinyangi, J. Long-term soil quality degradation along a cultivation chronosequence in western Kenya. Agric. Ecosyst. Environ. 2011, 141, 86–99. [Google Scholar] [CrossRef]
  62. Fujisao, K.; Khanthavong, P.; Oudthachit, S.; Matsumoto, N.; Homma, K.; Asai, H.; Shiraiwa, T. Impacts of the continuous maize cultivation on soil properties in Sainyabuli province, Laos. Sci. Rep. 2020, 10, 1–9. [Google Scholar] [CrossRef] [PubMed]
  63. Kopittke, P.M.; Menzies, N.W.; Wang, P.; McKenna, B.A.; Lombi, E. Soil and the intensification of agriculture for global food security. Environ. Int. 2019, 132, 105078. [Google Scholar] [CrossRef] [PubMed]
  64. Barančíková, G.; Makovníková, J.; Halas, J. Effect of land use change on soil organic carbon. Agriculture (Pol’nohospodárstvo) 2016, 62, 10–18. [Google Scholar] [CrossRef]
  65. Kopittke, P.M.; Dalal, R.C.; Finn, D.; Menzies, N.W. Global changes in soil stocks of carbon, nitrogen, phosphorus, and sulphur as influenced by long-term agricultural production. Glob. Chang. Biol. 2017, 23, 2509–2519. [Google Scholar] [CrossRef] [PubMed]
  66. Singh, B.; Ryan, J. 2015, 1. [CrossRef]
  67. Li, J.; Wan, X.; Liu, X.; Chen, Y.; Slaughter, L.C.; Weindorf, D.C.; Dong, Y. Changes in soil physical and chemical characteristics in intensively cultivated greenhouse vegetable fields in North China. Soil Tillage Res. 2019, 195, 104366. [Google Scholar] [CrossRef]
  68. Wang, X.; Tang, C. The role of rhizosphere pH in regulating the rhizosphere priming effect and implications for the availability of soil-derived nitrogen to plants. Ann. Bot. 2018, 121, 143–151. [Google Scholar] [CrossRef] [PubMed]
  69. Sengupta, A.; Hariharan, J.; Grewal, P.S.; Dick, W.A. Bacterial community dissimilarity in soils is driven by long-term land-use practices. Agrosystemsgeosciences Environ. 2020, 3, e20031. [Google Scholar] [CrossRef] [Green Version]
  70. Li, M.; Ren, L.; Zhang, J.; Luo, L.; Qin, P.; Zhou, Y.; Huang, C.; Tang, J.; Huang, H.; Chen, A. Population characteristics and influential factors of nitrogen cycling functional genes in heavy metal contaminated soil remediated by biochar and compost. Sci. Total Environ. 2019, 651, 2166–2174. [Google Scholar] [CrossRef] [PubMed]
Figure 1. Rarefaction curve depicting sample richness and the sample sites from which rhizospheric samples were collected.
Genes 12 01431 g001
Figure 2. An extended error bar plot showing the significantly abundant microbial families in the former grassland (GZ) and the intensively cultivated (AG) soils.
Genes 12 01431 g002
Figure 3. (a) Heatmap representing the composition of plant growth-promoting genes in maize rhizosphere samples and (b) a bar plot of linear discriminant analysis (LDA) scores showing the differentially abundant plant growth-promoting genes in the rhizosphere samples. The vertical axis (Figure 3b) represents the plant growth-promoting genes whose differences between the sample groups were significant, while the horizontal axis depicts the LDA, showing the LDA score (log 10) of the corresponding plant growth-promoting genes. GZ and AG stand for rhizosphere samples from the former grassland and the intensively cultivated soils, respectively.
Genes 12 01431 g003
Figure 4. Principal coordinate analysis (PCoA) of genes involved in plant growth promotion found in maize rhizosphere samples.
Genes 12 01431 g004
Figure 5. (a) Heatmap representing the composition of carbon-cycling genes in maize rhizosphere samples and (b) a bar plot of linear discriminant analysis (LDA) scores showing the differentially abundant carbon-cycling genes in the rhizosphere samples. The vertical axis (Figure 5b) represents the carbon-cycling genes whose differences between the sample groups were significant, while the horizontal axis depicts the LDA, showing the LDA score (log 10) of the corresponding carbon cycling gene. GZ and AG stand for rhizosphere samples from the former grassland and the intensively cultivated soils, respectively.
Genes 12 01431 g005
Figure 6. Principal coordinate analysis (PCoA) of genes involved in carbon cycling found in the maize rhizosphere samples.
Genes 12 01431 g006
Figure 7. Canonical correspondence analysis (CCA) showing the effect of the soil physicochemical analysis on the diversity and composition of the genes involved in carbon cycling and plant growth promotion across the samples. Legend: N-NO3 represents nitrate-nitrogen, N-NH4 represents ammonium nitrogen, OC = organic carbon, and OM = organic carbon. Plant growth-promoting genes: budC—acetoin (diacetyl) reductase (EC 1.1.1.5), cysC—adenylylsulfate kinase, cysD—sulfate adenylyltransferase subunit 2, cysH—phosphoadenylyl-sulfate reductase (thioredoxin), cysJ—sulfite reductase (NADPH) flavoprotein α-component, dcyD—D-cysteine desulfhydrase, gabT- GABA aminotransferase, ipdC—indole-3-pyruvate decarboxylase, ktrA—potassium uptake protein A, KtrB—potassium uptake protein B, mbtH—hypothetical MbtH-like protein, nifH—nitrogenase (molybdenum-iron) reductase and maturation, norB—nitric oxide reductase subunit B, pvdL—pyoverdine chromophore precursor synthetase, pvdQ—acyl-homoserine lactone acylase, ubiC—chorismate-pyruvate lyase, and ureC—urease subunit α. Carbon-cycling genes: abfA—α-N-arabinofuranosidase, bglX—β-glucosidase, cbbL—RuBisCo large chain, cbbO—RuBisCo activation protein, cbbQ—RuBisCo activation protein, cbbR—RuBisCo operon transcriptional regulator, cbbS—ribulose bisphosphate carboxylase small chain, cbbX—probable RuBisCo-expression protein, codH—carbon monoxide dehydrogenase large chain, fbaA—fructose-bisphosphate aldolase class I, gap2—NAD(P)-dependent glyceraldehyde 3-phosphate, manC—mannose-1-phosphate guanylyltransferase, mmoX—methane monooxygenase component A α chain, mxaF—methanol dehydrogenase large subunit protein, rpe—ribulose-phosphate 3-epimerase, treC—trehalose-6-phosphate hydrolase, and uidA—β-glucuronidase.
Genes 12 01431 g007
Table 1. Overall dissimilarities and the top shared plant growth-promoting and carbon-cycling genes with the most contribution to the dissimilarities between the samples.
Sample PairOv. Avg. DissimilarityContribution % of Plant Growth Promoting GenesOv. Avg. DissimilarityContribution % of Carbon-Cycling Genes
kupppktrpB codHlacZmxaF
GZ and AG28.008.707.675.762612.4311.9310.4
GZ1 and GZ2 6.5511.906.944.576.9010.1813.9014.01
GZ1 and GZ3 18.089.876.053.6015.966.7213.357.40
GZ1 and GZ4 9.116.7612.857.5210.2716.8211.858.04
GZ2 and GZ3 12.818.245.202.9110.833.9611.292.85
GZ2 and GZ4 13.7810.1611.466.9714.6016.3715.0012.50
GZ3 and GZ4 24.209.808.675.1224.1510.7013.648.08
AG1 and AG2 19.036.917.066.2715.8421.310.856.44
AG1 and AG3 48.06.838.297.0245.5819.8212.864.93
AG1 and AG4 44.327.338.116.8140.1319.8413.244.67
AG2 and AG3 31.936.749.477.7432.7118.1814.053.65
AG2 and AG4 28.876.749.487.7427.0317.6414.732.91
AG3 and AG4 6.001.729.008.537.1218.408.217.16
Note: Ov. avg. stands for overall average; GZ represents all sites in field 1 (F1), including GZ1–GZ4; AG represents all sites in field 2 (F2), including AG1–AG4; GZ1–GZ4 represent each sample site in F1; AG1–AG4 represent each sample site in F2.
Publisher’s Note: MDPI stays neutral with regard to jurisdictional claims in published maps and institutional affiliations.

