
Genetic Variation in PADI6-PADI4 on 1p36.13 Is Associated with Common Forms of Human Generalized Epilepsy

 ,
,
Abstract
:1. Introduction
2. Materials and Methods
2.1. Study Subjects
2.2. Ethical Approval Code
2.3. Overview: Genome-Wide Association Meta-Analysis
2.4. Meta-Analysis: METAL and MANTRA
2.5. Genotyping
2.6. Ancestry Determination
2.7. Imputation
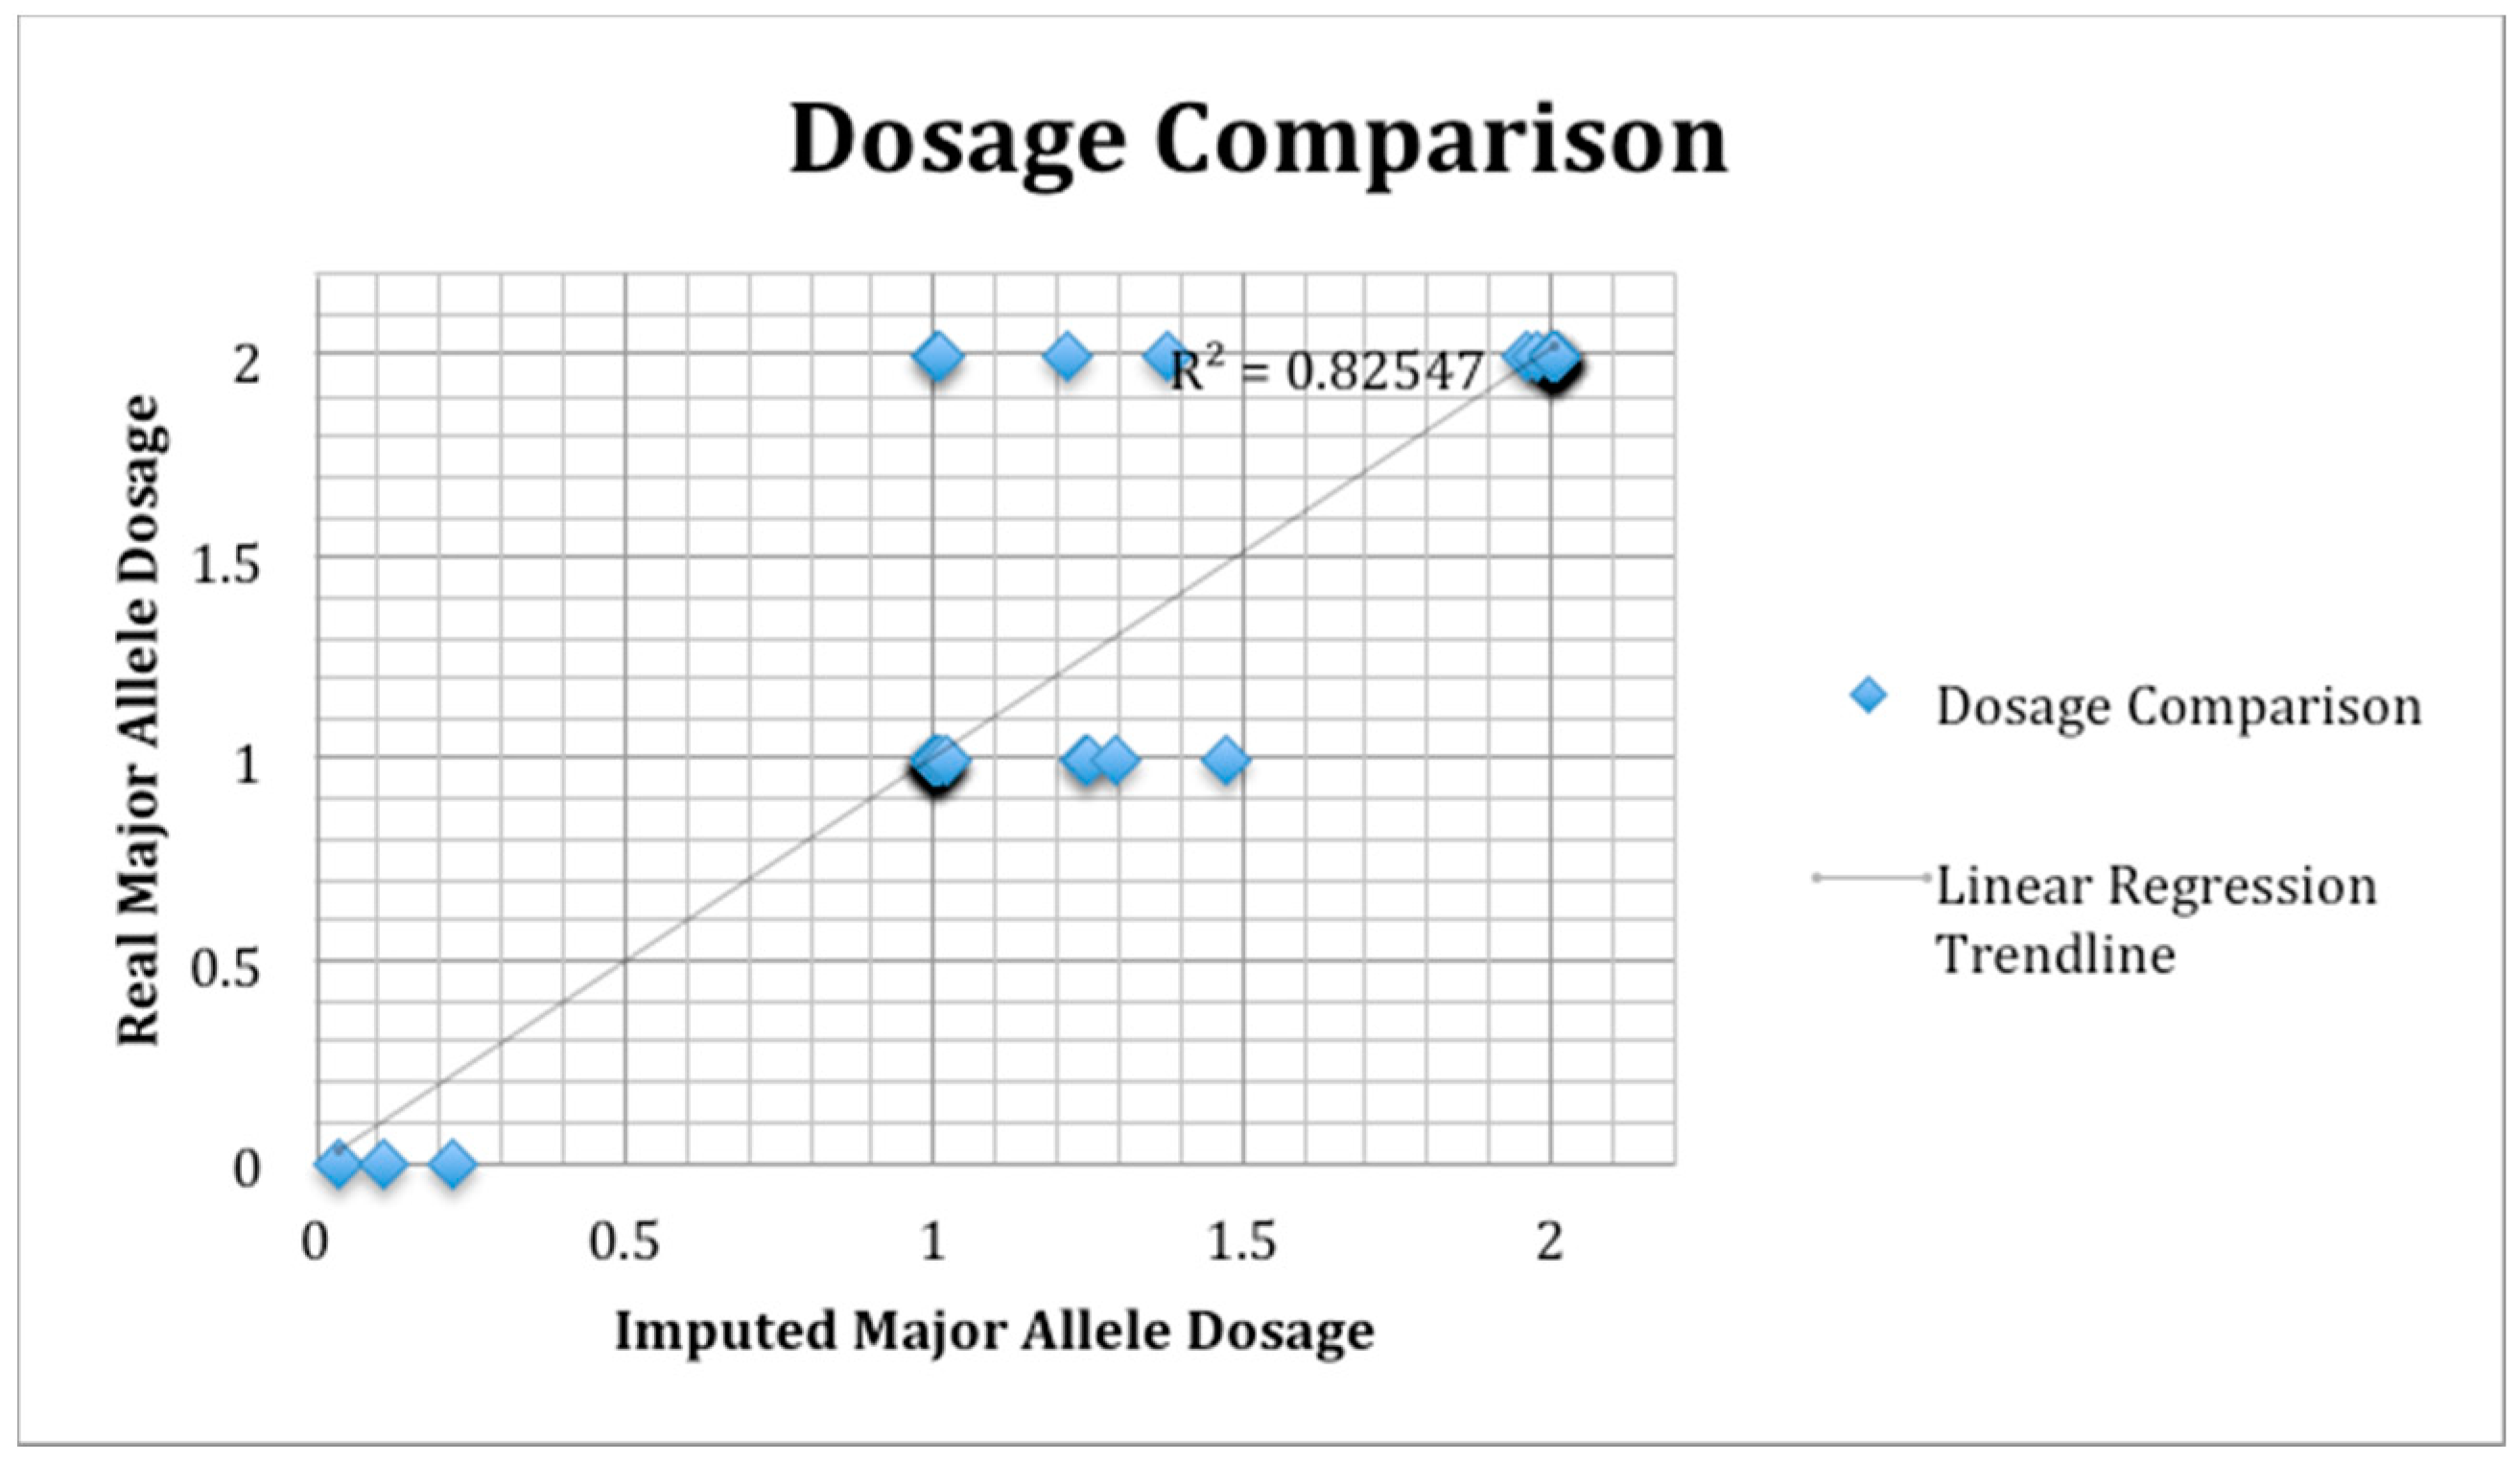
2.8. SNP Validation
2.9. Genome-Wide Association
2.10. Meta-Analysis
3. Results
3.1. METAL and MANTRA for All Epilepsy Patients vs. All Controls
3.2. METAL for Patients of European Ancestry with GE
3.3. METAL for GE in Patients of African Ancestry
3.4. MANTRA for GE Trans-Ethnic Analysis
3.5. METAL for FE Patients of European Ancestry
3.6. METAL for Patients of African Ancestry with FE
3.7. MANTRA for FE Trans-Ethnic Analysis
3.8. SNP Validation
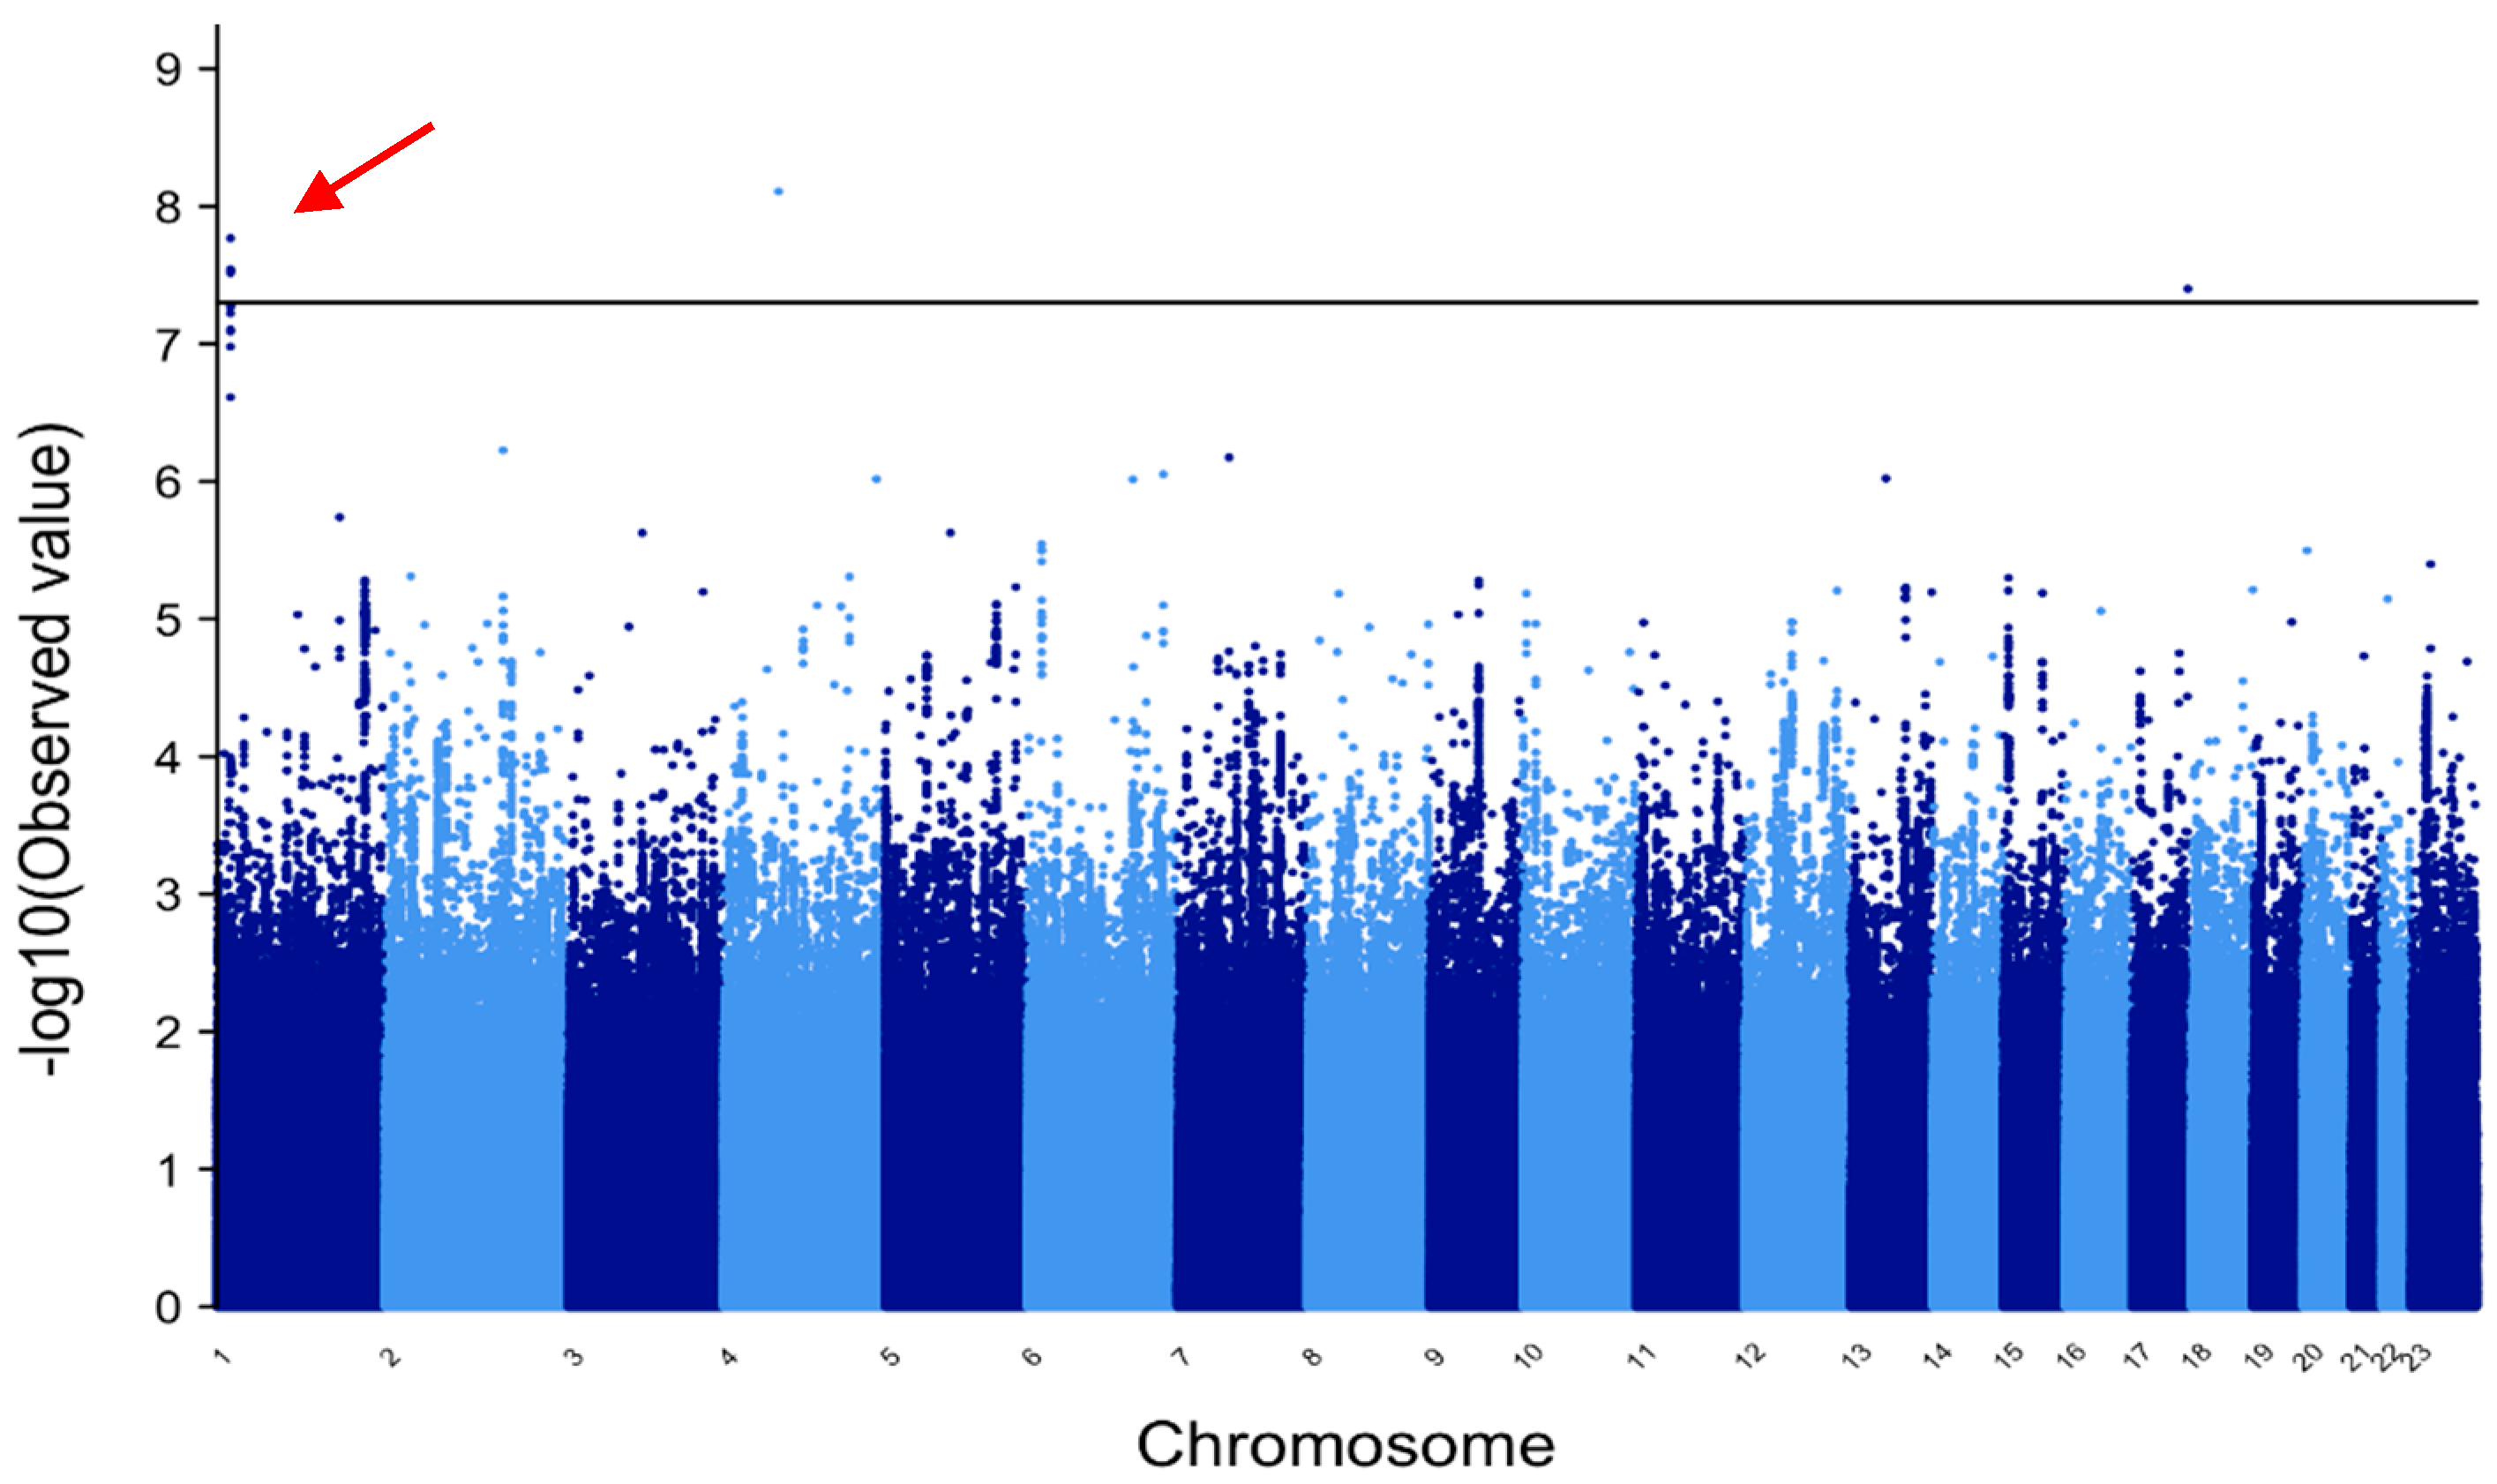
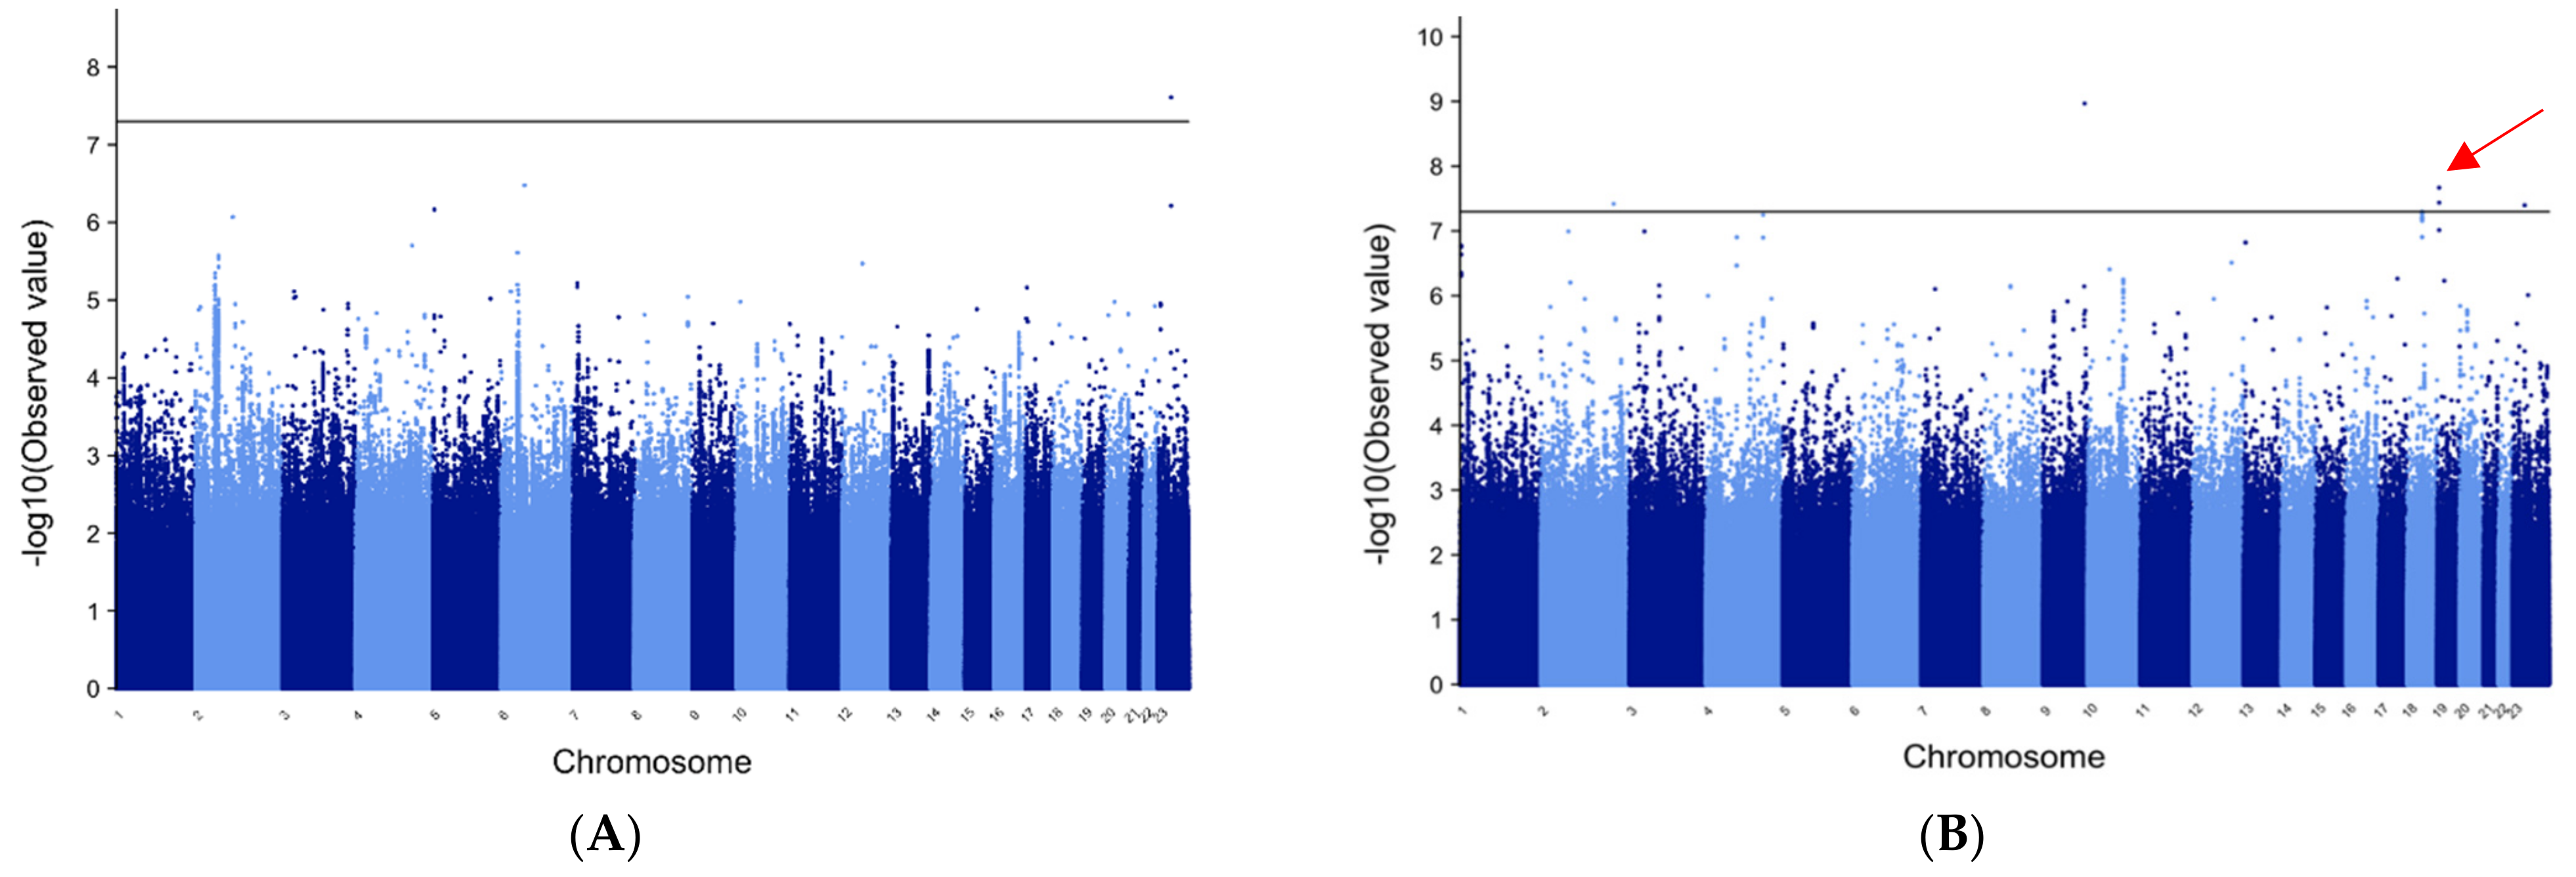
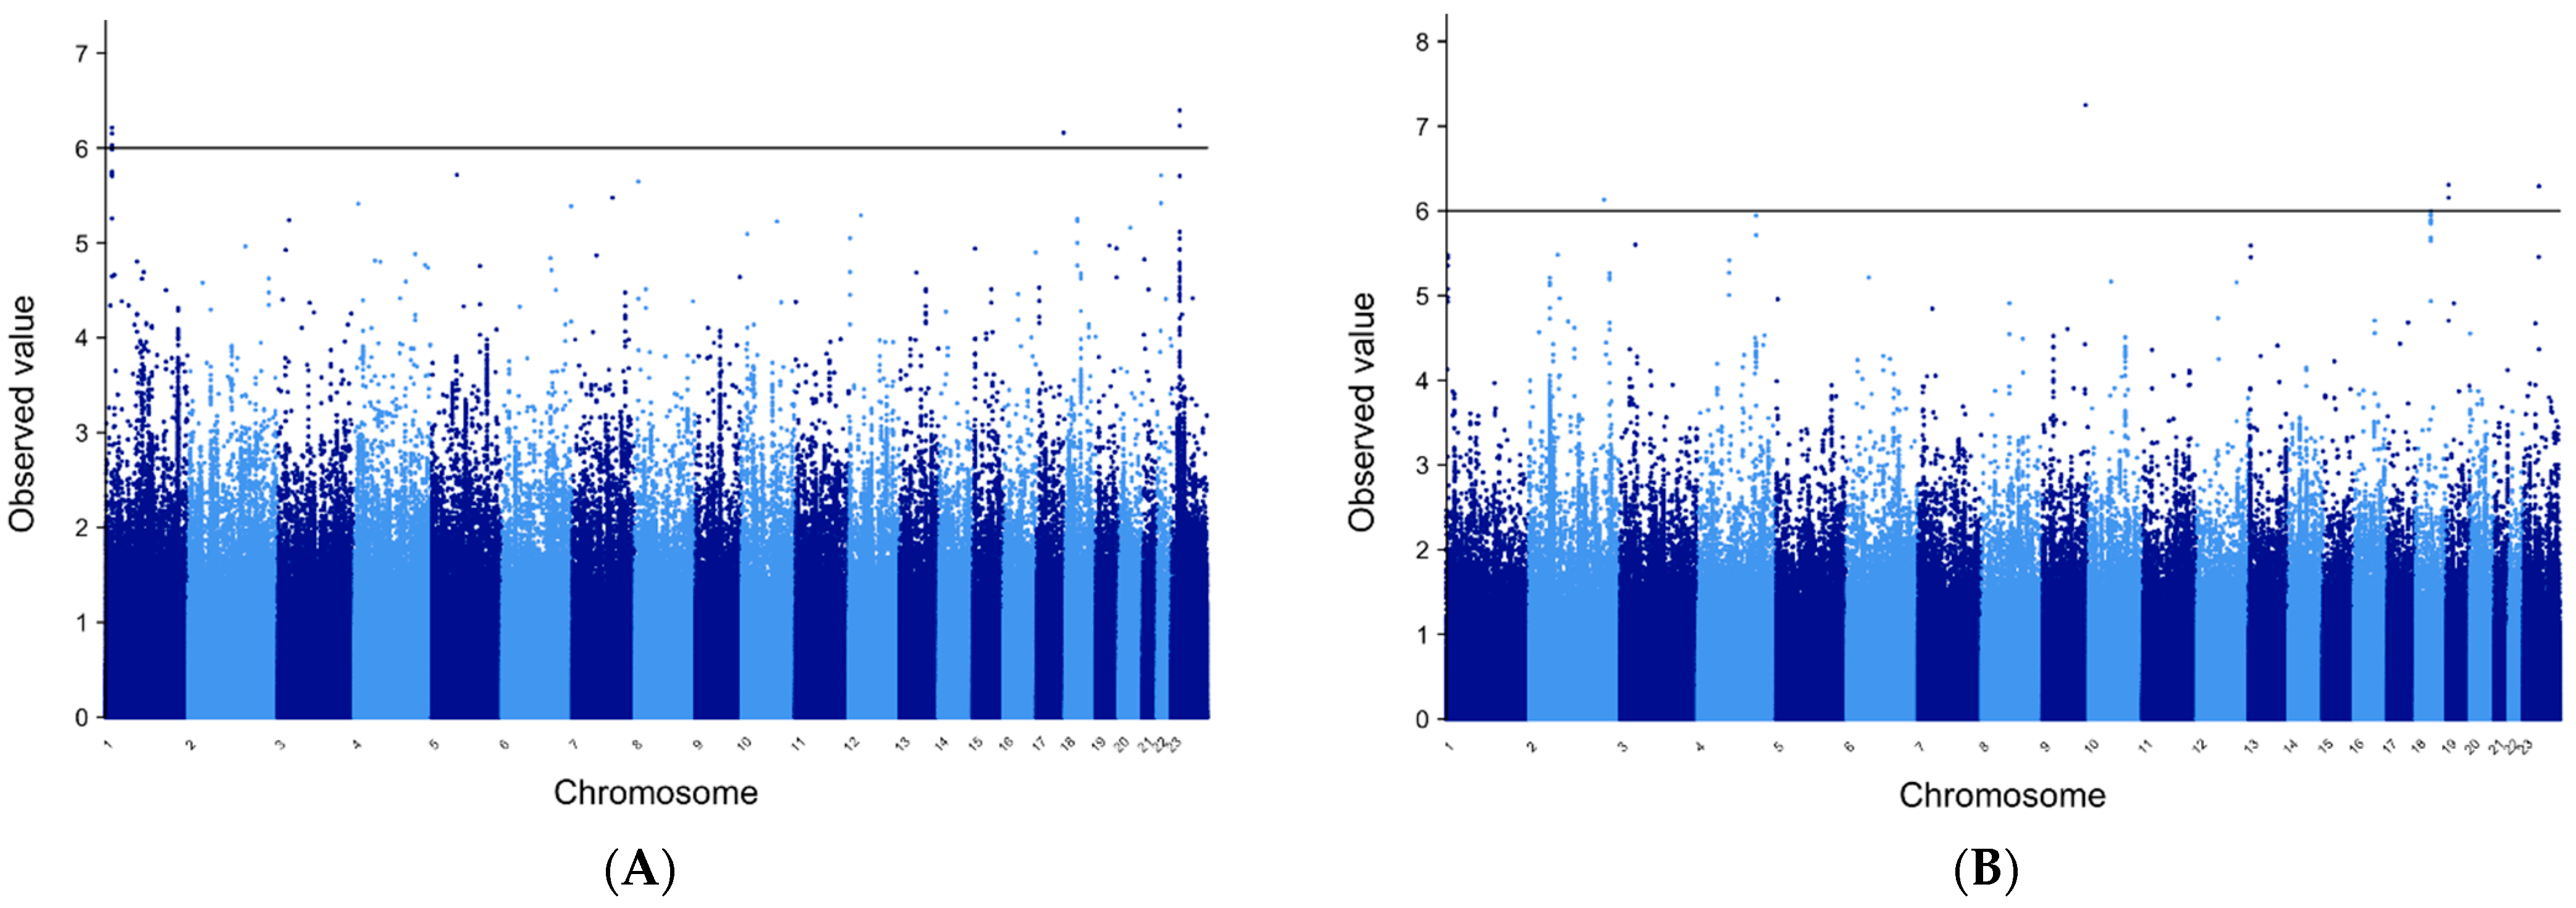
3.9. Manhattan Plots
4. Discussion
5. Conclusions
Author Contributions
Funding
Institutional Review Board Statement
Informed Consent Statement
Data Availability Statement
Acknowledgments
Conflicts of Interest
References
- Banerjee, P.N.; Filippi, D.; Hauser, W.A. The descriptive epidemiology of epilepsy—A review. Epilepsy Res. 2009, 85, 31–45. [Google Scholar] [CrossRef] [Green Version]
- Beghi, E.; Hesdorffer, D. Prevalence of epilepsy-An unknown quantity. Epilepsia 2014, 55, 963–967. [Google Scholar] [CrossRef] [Green Version]
- Ferraro, T. The relationship between genes affecting the development of epilepsy and approaches to epilepsy therapy. Expert Rev. Neurother. 2014, 14, 329–352. [Google Scholar] [CrossRef]
- Buono, R.J. Genome wide association studies (GWAS) and common forms of human epilepsy. Epilepsy Behav. 2013, 28, S63–S65. [Google Scholar] [CrossRef] [Green Version]
- Kasperaviciūte, D.; Catarino, C.B.; Heinzen, E.L.; Depondt, C.; Cavalleri, G.L.; Caboclo, L.O.; Tate, S.K.; Jamnadas-Khoda, J.; Chinthapalli, K.; Clayton, L.M.S.; et al. Common genetic variation and susceptibility to partial epilepsies: A genome-wide association study. Brain 2010, 133 Pt 7, 2136–2147. [Google Scholar] [CrossRef]
- Guo, Y.; Baum, L.W.; Sham, P.C.; Wong, V.; Ng, P.W.; Lui, C.H.T.; Sin, N.C.; Tsoi, T.H.; Tang, C.S.N.; Kwan, J.S.H.; et al. Two-stage genome-wide association study identifies variants in CAMSAP1L1 as susceptibility loci for epilepsy in Chinese. Hum. Mol. Genet. 2012, 21, 1184–1189. [Google Scholar] [CrossRef] [PubMed] [Green Version]
- Steffens, M.; Leu, C.; Ruppert, A.-K.; Zara, F.; Striano, P.; Robbiano, A.; Capovilla, G.; Tinuper, P.; EPICURE Consortium; EMINet Consortium; et al. Genome-wide association analysis of genetic generalized epilepsies implicates susceptibility loci at 1q43, 2p16.1, 2q22.3 and 17q21.32. Hum. Mol. Genet. 2012, 21, 5359–5372. [Google Scholar] [PubMed]
- International League against Epilepsy Consortium on Complex Epilepsies. Genetic determinants of common epilepsies: A meta-analysis of genome-wide association studies. Lancet Neurol. 2014, 13, 893–903. [Google Scholar] [CrossRef] [Green Version]
- International League against Epilepsy Consortium on Complex Epilepsies Genome-wide mega-analysis identifies 16 loci and highlights diverse biological mechanisms in the common epilepsies. Nat. Commun. 2018, 9, 5269. [CrossRef] [PubMed]
- Buono, R.J.; Lohoff, F.W.; Sander, T.; Sperling, M.R.; O’Connor, M.J.; Dlugos, D.J.; Ryan, S.G.; Golden, G.T.; Zhao, H.; Scattergood, T.M.; et al. Association between variation in the human KCNJ10 potassium ion channel gene and seizure susceptibility. Epilepsy Res. 2004, 58, 175–178. [Google Scholar] [CrossRef]
- Willer, C.J.; Li, Y.; Abecasis, G.R. METAL: Fast and efficient meta-analysis of genome wide association scans. Bioinformatics 2010, 26, 2190–2191. [Google Scholar] [CrossRef]
- Morris, A.P. Transethnic meta-analysis of genomewide association studies. Genet. Epidemiol. 2011, 35, 809–822. [Google Scholar] [CrossRef] [Green Version]
- Yang, J.; Lee, S.H.; Goddard, M.E.; Visscher, P.M. GCTA: A Tool for Genome-wide Complex Trait Analysis. Am. J. Hum. Genet. 2011, 88, 76–82. [Google Scholar] [CrossRef] [PubMed] [Green Version]
- Purcell, S.; Neale, B.; Todd-Brown, K.; Thomas, L.; Ferreira, M.A.R.; Bender, D.; Maller, J.; Sklar, P.; de Bakker, P.I.W.; Daly, W.J.; et al. PLINK: A tool set for whole-genome association and population-based linkage analyses. Am. J. Hum. Genet. 2007, 81, 559–575. [Google Scholar] [CrossRef] [PubMed] [Green Version]
- Howie, B.N.; Donnelly, P.; Marchini, J. A Flexible and Accurate Genotype Imputation Method for the Next Generation of Genome-Wide Association Studies. PLoS Genet. 2009, 5, e1000529. [Google Scholar] [CrossRef] [PubMed] [Green Version]
- Greco, M.; Ferrara, P.; Farello, G.; Striano, P.; Verrotti, A. Electroclinical features of epilepsy associated with 1p36 deletion syndrome: A review. Epilepsy Res. 2018, 139, 92–101. [Google Scholar] [CrossRef] [PubMed]
- Scott, D.; Jordan, V.; Zaveri, H. 1p36 deletion syndrome: An update. Appl. Clin. Genet. 2015, 8, 189–200. [Google Scholar] [CrossRef] [PubMed] [Green Version]
- Yamamoto, K.; Yamada, R. Genome-wide single nucleotide polymorphism analyses of rheumatoid arthritis. J. Autoimmun. 2005, 25, 12–15. [Google Scholar] [CrossRef] [Green Version]
- van Venrooij, W.J.; Pruijn, G.J. Citrullination: A small change for a protein with great consequences for rheumatoid arthritis. Arthritis Res. 2000, 2, 249–251. [Google Scholar] [CrossRef] [PubMed] [Green Version]
- Musse, A.A.; Li, Z.; Ackerley, C.A.; Bienzle, D.; Lei, H.; Poma, R.; Harauz, G.; Moscarello, M.A.; Mastronardi, F.G. Peptidylarginine deiminase 2 (PAD2) over-expression in transgenic mice leads to myelin loss in the central nervous system. Dis. Model. Mech. 2008, 1, 229–240. [Google Scholar] [CrossRef]
- Carrillo-Vico, A.; Leech, M.D.; Anderton, S.M. Contribution of myelin autoantigen citrullination to T cell autoaggression in the central nervous system. J. Immunol. 2010, 184, 2839–2846. [Google Scholar] [CrossRef] [Green Version]
- Acharya, N.K.; Nagele, E.P.; Han, M.; Coretti, N.J.; DeMarshall, C.; Kosciuk, M.C.; Boulos, P.A.; Nagele, R.G. Neuronal PAD4 expression and protein citrullination: Possible role in production of autoantibodies associated with neurodegenerative disease. J. Autoimmun. 2012, 38, 369–380. [Google Scholar] [CrossRef]
- Bien, C.G.; Bauer, J. Autoimmune Epilepsies. Neurotherapeutics 2014, 11, 311–318. [Google Scholar] [CrossRef] [PubMed] [Green Version]
- Wang, Y.; Wysocka, J.; Sayegh, J.; Lee, Y.-H.; Perlin, J.R.; Leonelli, L.; Sonbuchner, L.S.; McDonald, C.H.; Cook, R.G.; Dou, Y.; et al. Human PAD4 Regulates Histone Arginine Methylation Levels via Demethylimination. Science 2004, 306, 279–283. [Google Scholar] [CrossRef]
- Christophorou, M.A.; Castelo-Branco, G.; Halley-Stott, R.; Oliveira, C.S.; Loos, R.; Radzisheuskaya, A.; Mowen, K.A.; Bertone, P.; Silva, J.C.R.; Zernicka-Goetz, M.; et al. Citrullination regulates pluripotency and histone H1 binding to chromatin. Nat. Cell Biol. 2014, 507, 104–108. [Google Scholar] [CrossRef] [PubMed] [Green Version]
- Munson, M.J.; Ganley, I.G. MTOR, PIK3C3, and autophagy: Signaling the beginning from the end. Autophagy 2015, 11, 2375–2376. [Google Scholar] [CrossRef] [PubMed]
- Carrard, A.; Salzmann, A.; Perroud, N.; Gafner, J.; Malafosse, A.; Karege, F. Genetic association of the Phosphoinositide-3 kinase in schizophrenia and bipolar disorder and interaction with a BDNF gene polymorphism. Brain Behav. 2011, 1, 119–124. [Google Scholar] [CrossRef]
- Inaguma, Y.; Matsumoto, A.; Noda, M.; Tabata, H.; Maeda, A.; Goto, M.; Usui, D.; Jimbo, E.F.; Kikkawa, K.; Ohtsuki, M.; et al. Role of Class III phosphoinositide 3-kinase in the brain development: Possible involvement in specific learning disorders. J. Neurochem. 2016, 139, 245–255. [Google Scholar] [CrossRef] [PubMed]


| Cohort 1 | Cohort 2 | Cohort 3 | Cohort 4 | Cohort 5 | Cohort 6 | |
|---|---|---|---|---|---|---|
| Phenotyping | Physician verified | Physician verified | Physician verified | Physician verified | Electronic Medical Record | Electronic Medical Record |
| Genotyping Platform | 550v1, 550v3, 610 | 550v1, 550v3, 610 | OmniExpress | OmniExpress | 550v1, 550v3, 610 | 550v1, 550v3, 610 |
| Race | European American | African American | European American | African American | European American | African American |
| Patient categories/numbers analyzed | ||||||
| All Epilepsy | 819 | 159 | 483 | 106 | 432 | 221 |
| Focal Epilepsy | 378 | 92 | 287 | 61 | 91 | 55 |
| Generalized Epilepsy | 440 | 67 | 190 | 44 | 54 | 32 |
| Controls | 5736 | 2746 | 682 | 97 | 3443 | 1784 |
| METAL | |||||||
|---|---|---|---|---|---|---|---|
| AFRICAN | EUROPEAN | MANTRA | |||||
| SNP | CHR | p-Value | β | p-Value | β | Bayes Factor | Gene |
| rs5928634 | 23 | 0.000005 | 0.75 | 0.00005 | 0.22 | 6.39 * | near TMEM47 |
| rs5927306 | 23 | 0.000005 | −0.75 | 0.00005 | −0.22 | 6.23 * | near TMEM47 |
| rs71644049 | 1 | NA | NA | 2.93 × 10⁻⁸ * | −1.49 | 6.21 * | PADI6 intron |
| 17-77865302 | 17 | NA | NA | 3.98 × 10⁻⁸ * | 1.36 | 6.16 * | none |
| rs71644048 | 1 | NA | NA | 3.05 × 10⁻⁸ * | −1.31 | 6.15 * | PADI6 intron |
| rs36067110 | 1 | NA | NA | 2.86 × 10⁻⁸ * | 1.39 | 6.02 * | PADI6 intron |
| rs34199675 | 1 | NA | NA | 5.31 × 10⁻⁸ | −1.33 | 5.99 | PADI4 intron |
| rs34871124 | 1 | NA | NA | 5.41 × 10⁻⁸ | −1.33 | 5.98 | PADI4 intron |
| rs79100767 | 1 | NA | NA | 8.12 × 10⁻⁸ | 1.27 | 5.75 | PADI4 intron |
| rs71644042 | 1 | NA | NA | 5.99 × 10⁻⁸ | 1.31 | 5.73 | PADI4 intron |
| rs34018214 | 1 | NA | NA | 1.70 × 10⁻⁸ * | 1.42 | 5.72 | PADI4 intron |
| rs113755744 | 5 | 6.22 × 10⁻⁸ | −2.55 | NA | NA | 5.72 | none |
| rs79351721 | 22 | 8.30 × 10⁻⁸ | −1.76 | NA | NA | 5.71 | HPS4 |
| rs4609339 | 23 | 0.00004 | 0.65 | 0.00005 | 0.22 | 5.71 | near TMEM47 |
| rs35240185 | 1 | NA | NA | 7.88 × 10⁻⁸ | 1.27 | 5.70 | PADI4 syn |
| 4-64069300 | 4 | 0.9 | 0.02 | 7.8 × 10⁻⁹ | −1.97 | 4.80 | near TECRL |
| METAL | |||||||
|---|---|---|---|---|---|---|---|
| AFRICAN | EUROPEAN | MANTRA | |||||
| SNP | CHR | p-Value | β | p-Value | β | Bayes Factor | Gene |
| rs12554609 | 9 | 1.08 × 10⁻⁹ * | −2.06 | NA | NA | 7.25 * | ASS1 intron |
| 19-5961503 | 19 | 2.15 × 10⁻⁸ * | 2.25 | NA | NA | 6.30 * | RANBP3 |
| X-73537149 | 23 | NA | NA | 2.45 × 10⁻⁸ * | 1.04 | 6.29 * | MAP2K4P1 |
| rs114591251 | 19 | 3.66 × 10⁻⁸ * | −2.08 | NA | NA | 6.15 * | RANBP3 |
| rs58069848 | 2 | 3.83 × 10⁻⁸ * | 2.02 | NA | NA | 6.13 * | none |
| 18-41994464 | 18 | 5.19 × 10⁻⁸ | 1.68 | NA | NA | 5.99 | PIKC3 |
| 18-42005131 | 18 | 6.14 × 10⁻⁸ | −1.67 | NA | NA | 5.95 | PIKC3 |
| rs116831532 | 18 | 5.11 × 10⁻⁸ | 1.68 | NA | NA | 0.95 | PIKC3 |
| 18-42008808 | 18 | 6.97 × 10⁻⁸ | 1.66 | NA | NA | 5.95 | PIKC3 |
| rs12499431 | 4 | 5.68 × 10⁻⁸ | 2.30 | NA | NA | 5.94 | SMARCA5 |
| rs117507875 | 18 | 6.33 × 10⁻⁸ | −1.67 | NA | NA | 5.89 | PIKC3 |
| rs114818774 | 18 | 6.93 × 10⁻⁸ | −1.66 | NA | NA | 5.89 | PIKC3 |
| 18-41998414 | 18 | 5.48 × 10⁻⁸ | −1.68 | NA | NA | 5.88 | PIKC3 |
| 18-42005556 | 18 | 6.20 × 10⁻⁸ | −1.68 | NA | NA | 5.87 | PIKC3 |
| 18-42004210 | 18 | 5.07 × 10⁻⁸ | −1.68 | NA | NA | 5.87 | PIKC3 |
| rs114184892 | 18 | 6.55 × 10⁻⁸ | −1.66 | NA | NA | 5.85 | PIKC3 |
| rs113055513 | 4 | 1.27 × 10⁻⁷ | 2.28 | NA | NA | 5.71 | SMARCA5 |
| 18-41991735 | 18 | 5.09 × 10⁻⁸ | 1.68 | NA | NA | 5.68 | PIKC3 |
| 18-42008321 | 18 | 1.24 × 10⁻⁷ | 1.62 | NA | NA | 5.65 | PIKC3 |
| X-51313775 | X | 4.03 × 10⁻⁸ | 1.05 | NA | NA | 4.67 | near NUDT10 |
Publisher’s Note: MDPI stays neutral with regard to jurisdictional claims in published maps and institutional affiliations. |
© 2021 by the authors. Licensee MDPI, Basel, Switzerland. This article is an open access article distributed under the terms and conditions of the Creative Commons Attribution (CC BY) license (https://creativecommons.org/licenses/by/4.0/).
Share and Cite
Buono, R.J.; Bradfield, J.P.; Wei, Z.; Sperling, M.R.; Dlugos, D.J.; Privitera, M.D.; French, J.A.; Lo, W.; Cossette, P.; Schachter, S.C.; et al. Genetic Variation in PADI6-PADI4 on 1p36.13 Is Associated with Common Forms of Human Generalized Epilepsy. Genes 2021, 12, 1441. https://0-doi-org.brum.beds.ac.uk/10.3390/genes12091441
Buono RJ, Bradfield JP, Wei Z, Sperling MR, Dlugos DJ, Privitera MD, French JA, Lo W, Cossette P, Schachter SC, et al. Genetic Variation in PADI6-PADI4 on 1p36.13 Is Associated with Common Forms of Human Generalized Epilepsy. Genes. 2021; 12(9):1441. https://0-doi-org.brum.beds.ac.uk/10.3390/genes12091441
Chicago/Turabian StyleBuono, Russell J., Jonathan P. Bradfield, Zhi Wei, Michael R. Sperling, Dennis J. Dlugos, Michael D. Privitera, Jacqueline A. French, Warren Lo, Patrick Cossette, Steven C. Schachter, and et al. 2021. "Genetic Variation in PADI6-PADI4 on 1p36.13 Is Associated with Common Forms of Human Generalized Epilepsy" Genes 12, no. 9: 1441. https://0-doi-org.brum.beds.ac.uk/10.3390/genes12091441