Article

De Novo Transcriptome Analysis Reveals Putative Genes Involved in Anthraquinone Biosynthesis in Rubia yunnanensis

1
Department of TCMs Pharmaceuticals, School of Traditional Chinese Pharmacy, China Pharmaceutical University, Nanjing 211198, China
2
Department of Biological and Pharmaceutical Engineering, West Anhui University, Lu’an 237012, China
*
Authors to whom correspondence should be addressed.
Submission received: 23 January 2022 / Revised: 18 February 2022 / Accepted: 18 February 2022 / Published: 16 March 2022

Abstract

:
Rubia yunnanensis Diels (R. yunnanensis), a Chinese perennial plant, is well-known for its medicinal values such as rheumatism, contusion, and anemia. It is rich in bioactive anthraquinones, but the biosynthetic pathways of anthraquinones in R. yunnanensis remain unknown. To investigate genes involved in anthraquinone biosynthesis in R. yunnanensis, we generated a de novo transcriptome of R. yunnanensis using the Illumina HiSeq 2500 sequencing platform. A total of 636,198 transcripts were obtained, in which 140,078 transcripts were successfully annotated. A differential gene expression analysis identified 15 putative genes involved in anthraquinone biosynthesis. Additionally, the hairy roots of R. yunnanensis were treated with 200 µM Methyl Jasmonate (MeJA). The contents of six bioactive anthraquinones and gene expression levels of 15 putative genes were measured using ultra performance liquid chromatography coupled with mass spectrometry (UPLC-MS/MS) and real-time quantitative polymerase chain reaction (RT-qPCR), respectively. The results showed that the expressions levels for 11 of the 15 genes and the contents of two of six anthraquinones significantly increased by MeJA treatment. Pearson’s correlation analyses indicated that the expressions of 4 of the 15 putative genes were positively correlated with the contents of rubiquinone (Q3) and rubiquinone-3-O-β-d-xylopranosyl-(1→6)-β-d-glucopyranoside (Q20). This study reported the first de novo transcriptome of R. yunnanensis and shed light on the anthraquinone biosynthesis and genetic information for R. yunnanensis.

1. Introduction

Rubia yunnanensis Diels, a perennial herb in the family of Rubiaceae, distributes at 1700–2500 m altitude in Yunnan and Sichuan provinces, Southwest China [1]. Its roots and rhizomes, known as “XiaoHongShen”, have been used as one of Chinese traditional medicines (TCMs) for treating rheumatism, contusion, menoxenia, tuberculosis, and anemia [2]. This species is used as a local alternative of the TCMs Rubia cordifolia [3]. Recent studies showed that R. yunnanensis has a wide range of bioactivities, such as antihyperlipidemic [4], antitumor [5], antiplatelet aggregation [6], antibacterial, and antifungal [7] properties. These properties could be attributed to these active quinones including anthraquinones and naphthoquinones derivatives, i.e., rubiquinone (Q3), 3-hydroxy-2-hydroxymethyl-9,10-anthraquinone (Q4), rubiquinone-3-O-(4′-O-acetyl)-α-l-rhamnopyranosyl-(1→2)-β-d-glucopyranoside (Q19), rubiquinone-3-O-β-d-xylopranosyl-(1→6)-β-d-glucopyranoside (Q20), mollugin (Q17), and 1′-methoxy-2′-hydroxy-9,10-dihydromullugin (Q18) (Supplementary Figure S1) [8,9]. Due to its medicinal values, the demand for R. yunnanensis keeps increasing. However, knowledge about the genetics of R. yunnanensis is limited, which has hindered the investigation of metabolites synthesis.
Anthraquinones, constituting a class of the parent structure 9,10-dioxoanthracene, are synthesized by bacteria [10], fungi [11], insects [12], and plants [13]. Natural anthraquinones not only possess medicinal benefits but also possess values in pigments, foods, and cosmetics [14,15]. For instance, the roots and rhizomes of Rubia, which are generally rich in anthraquinones, are used as natural dyestuffs for clothes and foods in industry. Two main biosynthesis pathways for the skeleton of anthraquinones have been reported: (1) the polyketide pathway in Leguminosae, Rhamnaceae, and Caesalpiniaceae and (2) a combination of the shikimate, mevalonic acid (MVA), and 2-methyl-erythritol 4-phosphate (MEP) pathways in Rubiaceae [16,17]. The latter pathways comprise three benzene rings, A, B, and C. The rings A and B are derived from 1,4-dihydroxy-2-naphthoic acid via the shikimate pathway [18], and the ring C is derived from isopentenyl diphosphate (IPP)/3, 3-dimethylallyl diphosphate (DMAPP) via the MVA/MEP pathway [19]. Although we identified four glycosyltransferase genes involved in the biosynthesis of anthraquinone glycosides in R. yunnanensis [20], no other enzymes in anthraquinone biosynthesis have been fully identified. Moreover, the biosynthesis pathway of anthraquinones in R. yunnanensis remains unknown.
With advances in sequencing technologies, the Illumina HiSeq as a cost-efficient RNA-sequencing (RNA-seq) has become an effective tool to obtain candidate genes involved in the biosynthesis of active substances in non-model plants [21], such as tanshinones and salvianolic acids (Salvia miltiorrhiza) [22], C19-diterpenoid alkaloids (Aconitum carmichaelii) [23], anthraquinones (Aloe vera) [24], and flavonoids (Gentiana straminea) [25]. The MeJA induction has been established as an ideal model in plants for studying biosynthetic pathways of various classes of active secondary metabolites [26], such as ginsenoside [27], tanshinone [28], abietane diterpenes [29], and so on. After MeJA treatment, candidate genes that are essential for the secondary metabolite synthetic pathways can be easily captured by sequencing technologies and metabolic analysis. Combined with MeJA treatment, the RNA-seq technology can be used to study the molecular mechanism of anthraquinone biosynthesis in R. yunnanensis [30].
To investigate the genes involved in anthraquinones synthesis, we here generated a de novo transcriptome of R. yunnanensis using the Illumina HiSeq platform. The assembled transcripts were functionally annotated, and the genes related to anthraquinone biosynthesis were analyzed by differential gene expression analyses. The hairy root culture of R. yunnanensis with high production of quinones [31] was treated with MeJA for correlation analysis between the expressions of the putative genes and anthraquinone contents.

2. Materials and Methods

2.1. Sample Preparation

The seeds of R.yunnanensis were collected from Kunming, Yunnan Province, China in October 2016. Seeds were grown in 25 × 20 cm pots in a greenhouse with a condition of 25 °C, light for 16 h (intensity of illumination at a constant 30,000 Lu×), and dark for 8 h. The roots and a mixture of stems and leaves of one-year-old R. yunnanensis were collected and immediately frozen at −80 °C.
Hairy roots of R. yunnanensis established by our previous work [31] were cultured in 250 mL of 1/2MS liquid medium at pH 5.8, 25 °C, and in dark. After 30 days of cultivation, 200 μM MeJA dissolved in ethanol was added as the elicitation. The hairy roots were harvested at 0, 1, 6, 12, and 24 h after treatment. For the control groups, the elicitation was replaced by ethanol at the same volume. All the treatments were performed with three biological replicates.

2.2. RNA Isolation and cDNA Library Preparation for Illumina Sequencing

Total RNA was separately isolated from R. yunnanensis roots and a mixture of stems and leaves using EASY spin Plus Complex Plant RNA kit (RN53, Aidlab Biotechnologies Co., Ltd., Beijing, China) according to the manufacturer’s instructions. Each sample has three replicates. RNA quality was evaluated using a Nanodrop 2000 and Agilent 2100 (Supplementary Table S1). After treating with RNase-free DNase I (Katara, Dalian, China) for 30 min at 37 °C to remove the residual DNA, mRNA was enriched using mRNA Capture Beads. The fragmentation buffer was added to interrupt the mRNA to short fragments. SMARTTM cDNA Synthesis Kit (Clontech, Mountain View, CA, USA) was used to synthesize the single-stranded cDNA with the short fragments as templates. Subsequently, double-stranded cDNA was synthesized using the Advantage II Polymerase Kit (Clontech, Mountain View, CA, USA) including RNase H, dNTPs, and DNA polymerase I. The products were purified with EasyPure PCR Purification Kit (TransGen Biotech, Beijing, China), followed by adding poly(A). Finally, the library was sequenced using Illumina HiSeq™2500 with a paired-end (PE) sequencing strategy.

2.3. De Novo Assembly and Sequence Analysis

Raw reads were filtered by SOAPnuke (https://github.com/BGI-flexlab/SOAPnuke/, accessed on 10 February 2018) [32]. De novo assembly was carried out using Trinity v2.40. Assembled transcripts were then clustered to remove redundancies using the CDHIT (http://weizhongli-lab.org/cd-hit/, accessed on 10 February 2018) [33].

2.4. Functional Annotation of Transcripts

To obtain annotation, transcripts were compared with public databases using NCBI BLASTX [34]. The public databases included NCBI nucleotide sequences (NT) (http://0-www-ncbi-nlm-nih-gov.brum.beds.ac.uk/, accessed on 10 February 2018), NCBI non-redundant protein sequences (NR) (http://www.ncbi.nlm.nih.gov, accessed on 10 February 2018), Swiss-Prot (http://www.ebi.ac.uk/uniprot/, accessed on 10 February 2018), Protein family (Pfam) (http://0-www-ncbi-nlm-nih-gov.brum.beds.ac.uk/, accessed on 10 February 2018), euKaryotic Ortholog Groups (KOG) (http://0-www-ncbi-nlm-nih-gov.brum.beds.ac.uk/, accessed on 10 February 2018), Kyoto Encyclopedia of Genes and Genomes (KEGG) (http://www.genome.jp/kegg/, accessed on 10 February 2018), and Gene Ontology (GO) (http://www.genome.jp/kegg, accessed on 10 February 2018) databases.

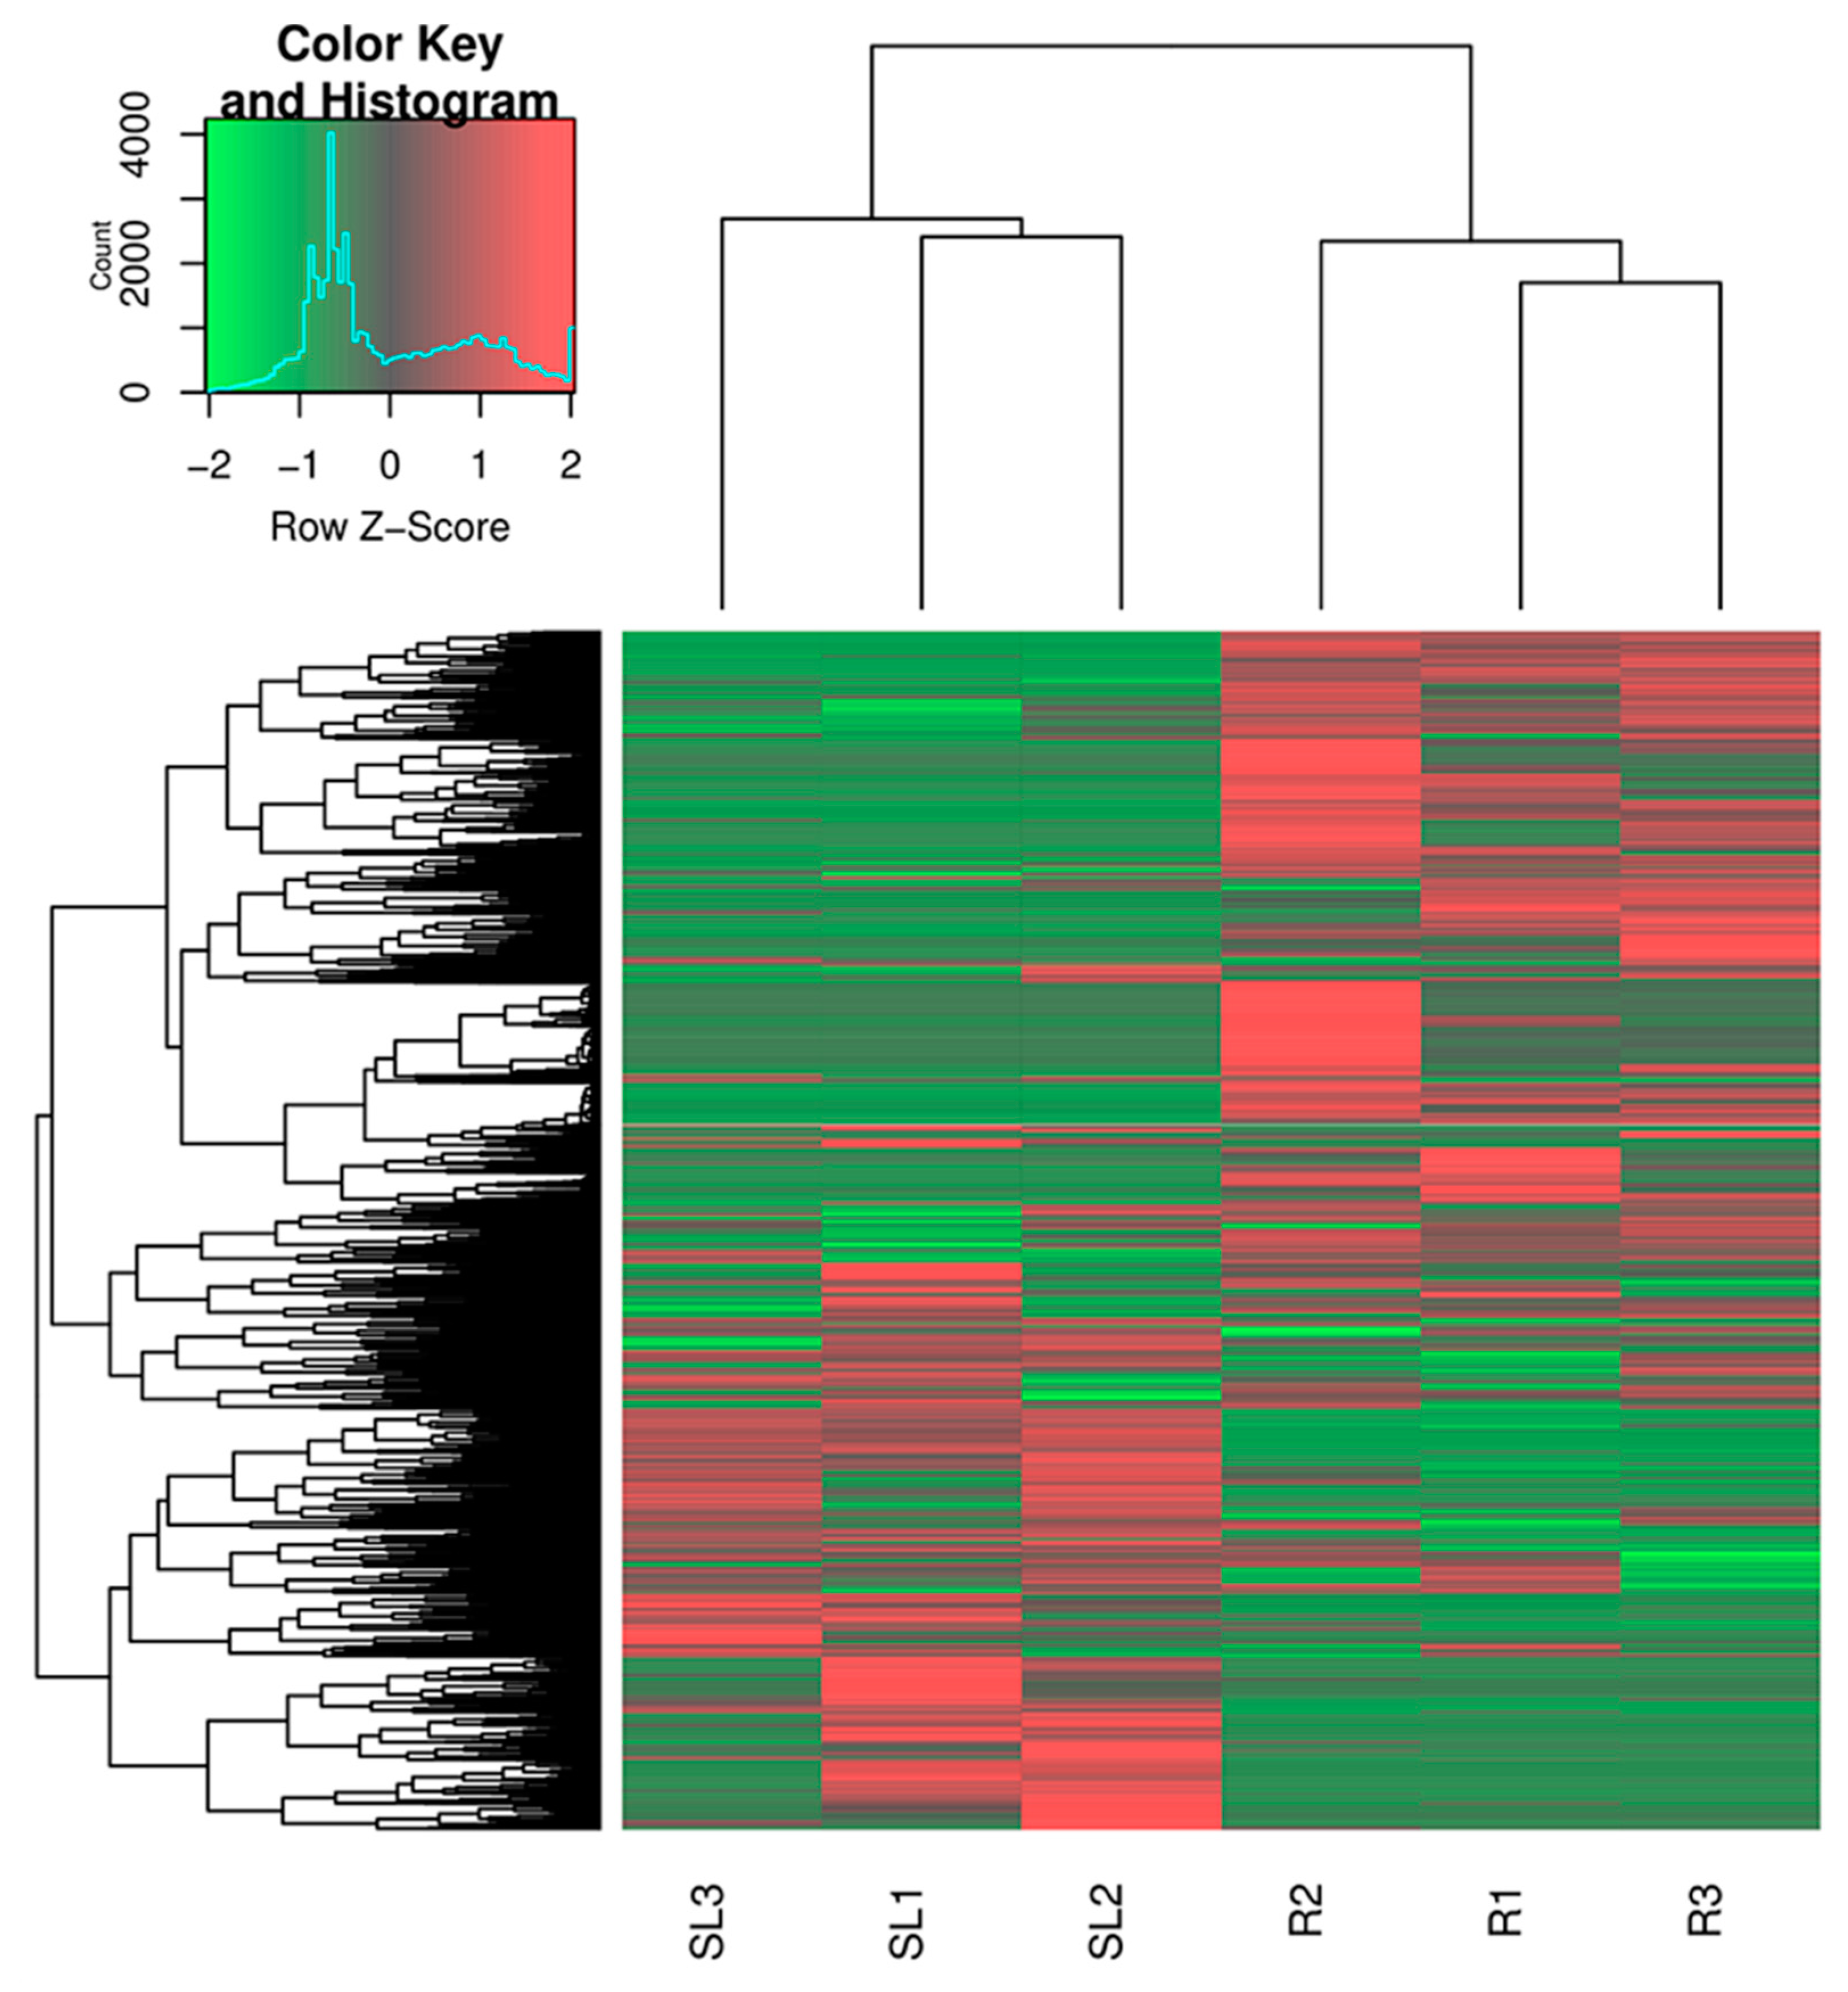
2.5. Identification of Differentially Expressed Genes (DEGs)

Clean reads of each sample were mapped to the assembled transcripts with Bowtie2 [35]. Then, the FPKM (fragments per kilobase of per million mapped reads) for each transcript was calculated using RSEM software [36]. The FPKM quantified the expression abundance of transcripts in each sample. Last, edgeR software [37] was used to perform differential gene expression analyses based on the FPKM. When false discovery rate (FDR) ≤0.05 and an absolute value of the log2 ratio > 1.5, the transcripts were treated as DEGs.

2.6. Analysis of Putative Genes Involved in Anthraquinone Biosynthesis in the R. yunnanensis Transcriptome

The DEGs found in the R. yunnanensis transcriptome were proceeded for GO and KEGG annotation analyses. In combination with the biosynthetic pathways of higher plant anthraquinones reported in the literatures [16,17,18,19,38], we identified 15 putative genes involved in anthraquinone biosynthesis.

2.7. RT-qPCR Validation of the Gene Expression Level Quantified Using Illumina Sequencing

To validate the gene expression level quantified using RNA-seq, we selected six of the 15 putative genes, viz., the gene of acetyl-CoA acetyltransferase (AACT), the gene of o-succinylbenzoate-CoA ligase (OSBL), the gene of 3-hydroxy-3-methylglutaryl-coenzyme A reductase (HMGR), the gene of 1-deoxy-D-xylulose-5-phosphate synthase (DXS), the gene of isochorismate synthase (ICS), and the gene of isopentenyl-diphosphate delta-isomerase (IPPI), to analyze the expression levels at different tissues using RT-qPCR.
All RT-qPCR reactions were carried out on StepOnePlus Real-Time PCR System using AceQ® qPCR SYBR® Green Master (Vazme, Nanjing, China). Each reaction contained 10 μL 2 × AceQ qPCR SYBR Green Master Mix, 0.4 μL of each primer (10 μM), 2 μL of cDNA, and 7.2 μL of ddH2O. The RT-qPCR was performed according to the following conditions: denaturation at 95 °C for 5 min, 40 cycles at 95 °C for 10 s, and 60 °C for 30 s. To confirm the specificity of the primers, the melting curve was generated by heating the amplicon from 60 to 95 °C. The products of all reactions were separated via electrophoresis in 1.5% agarose gels. Each PCR reaction was repeated in three biological and technical replicates. The relative quantification of gene expression was computed using the 2−ΔΔCt method [39] and normalized to the expression of hnRNP and TBP, the two most stable genes in R. yunnanensis at the different treatments [40].

2.8. RT-qPCR Analysis for 15 Genes Involved in Anthraquinone Biosynthesis

Total RNA was isolated from hairy roots of R. yunnanensis using the RNAiso Plus reagent (Takara, Tokyo, Japan), following the manufacturer’s instructions. RNA quality was tested by measuring the A260/280 ratios, and the integrity was accessed by electrophoresis on 1.5% (w/v) agarose gels. Only RNA samples with an A260/A280 ratio of 1.9–2.2 were considered as high quality for further analysis. Total RNA samples were reversely transcribed into cDNA with HiScript® II Reverse Transcriptase (Vazyme, Nanjing, China). The cDNA was stored at −80 °C until PCR-based analyses. All RT-qPCR reactions were the same as 2.7. The relative quantification of gene expression was normalized to the expression of hnRNP. The sequences of the primers for 15 genes involved in anthraquinone biosynthesis were shown in Supplementary Table S2.

2.9. Quantitative Analysis of Six Anthraquinones and Two Naphthoquinones in the Hairy Roots of R. yunnanensis

The quantification of Q3, Q4, Q11, Q12, Q17, Q18, Q19, and Q20 was carried out using UPLC-MS/MS. The analyses were performed using a Waters ACQUITY®UPLC H Class system (Waters, Milford, MA, USA) fitted with a Waters XEVO®TQD system (Milford, MA, USA) equipped with electrospray ionization (ESI). The conditions for UPLC and MS analyses were performed according to our previous method [8]. The eight compounds in the samples were identified by comparing their retention time and mass spectra with the standards, which were isolated from Rubia species in our laboratory. The quantitative data were calculated based on the calibration curves of the individual standards through plotting the MS peak areas versus the corresponding concentrations of each representative standard.

2.10. Statistical Analysis

The data in the Tables and Figures were represented as the means ± standard deviations. Statistical analysis was performed through a one-way analysis of variance (ANOVA). Pearson’s correlation coefficients were computed between quantitative variables using SPSS software (version 23.0). Heatmaps were produced in Heatmapper (http://www.heatmapper.ca/expression/, accessed on 25 May 2021).

3. Results

3.1. Illumina Sequencing and De Novo Sequence Assembly

Total RNA was extracted from roots (R) and a mixture of stems and leaves (SL) (each three replicates), respectively. Sequencing was separately carried out for six samples using the Illumina HiSeq-2500 platform. A total of 34,612,412–41,363,450 clean reads for each sample were obtained from 36,888,628–43,747,160 raw reads by filtering and removing adapters, low quality reads, and unknown nucleotides (N > 10%) (Supplementary Table S3). All these data were characterized by Raw Q30 ≥86.46% and Raw GC contents ≥48.18%, respectively. The de novo transcriptome was assembled using Trinity [41] with all the six samples, which generated 636,198 transcripts belonging to 554,646 genes (Supplementary Table S4). These transcripts have a mean length of 300.64 bp and an N50 value of 390 bp. The size distribution of transcripts was shown in Supplementary Figure S2.

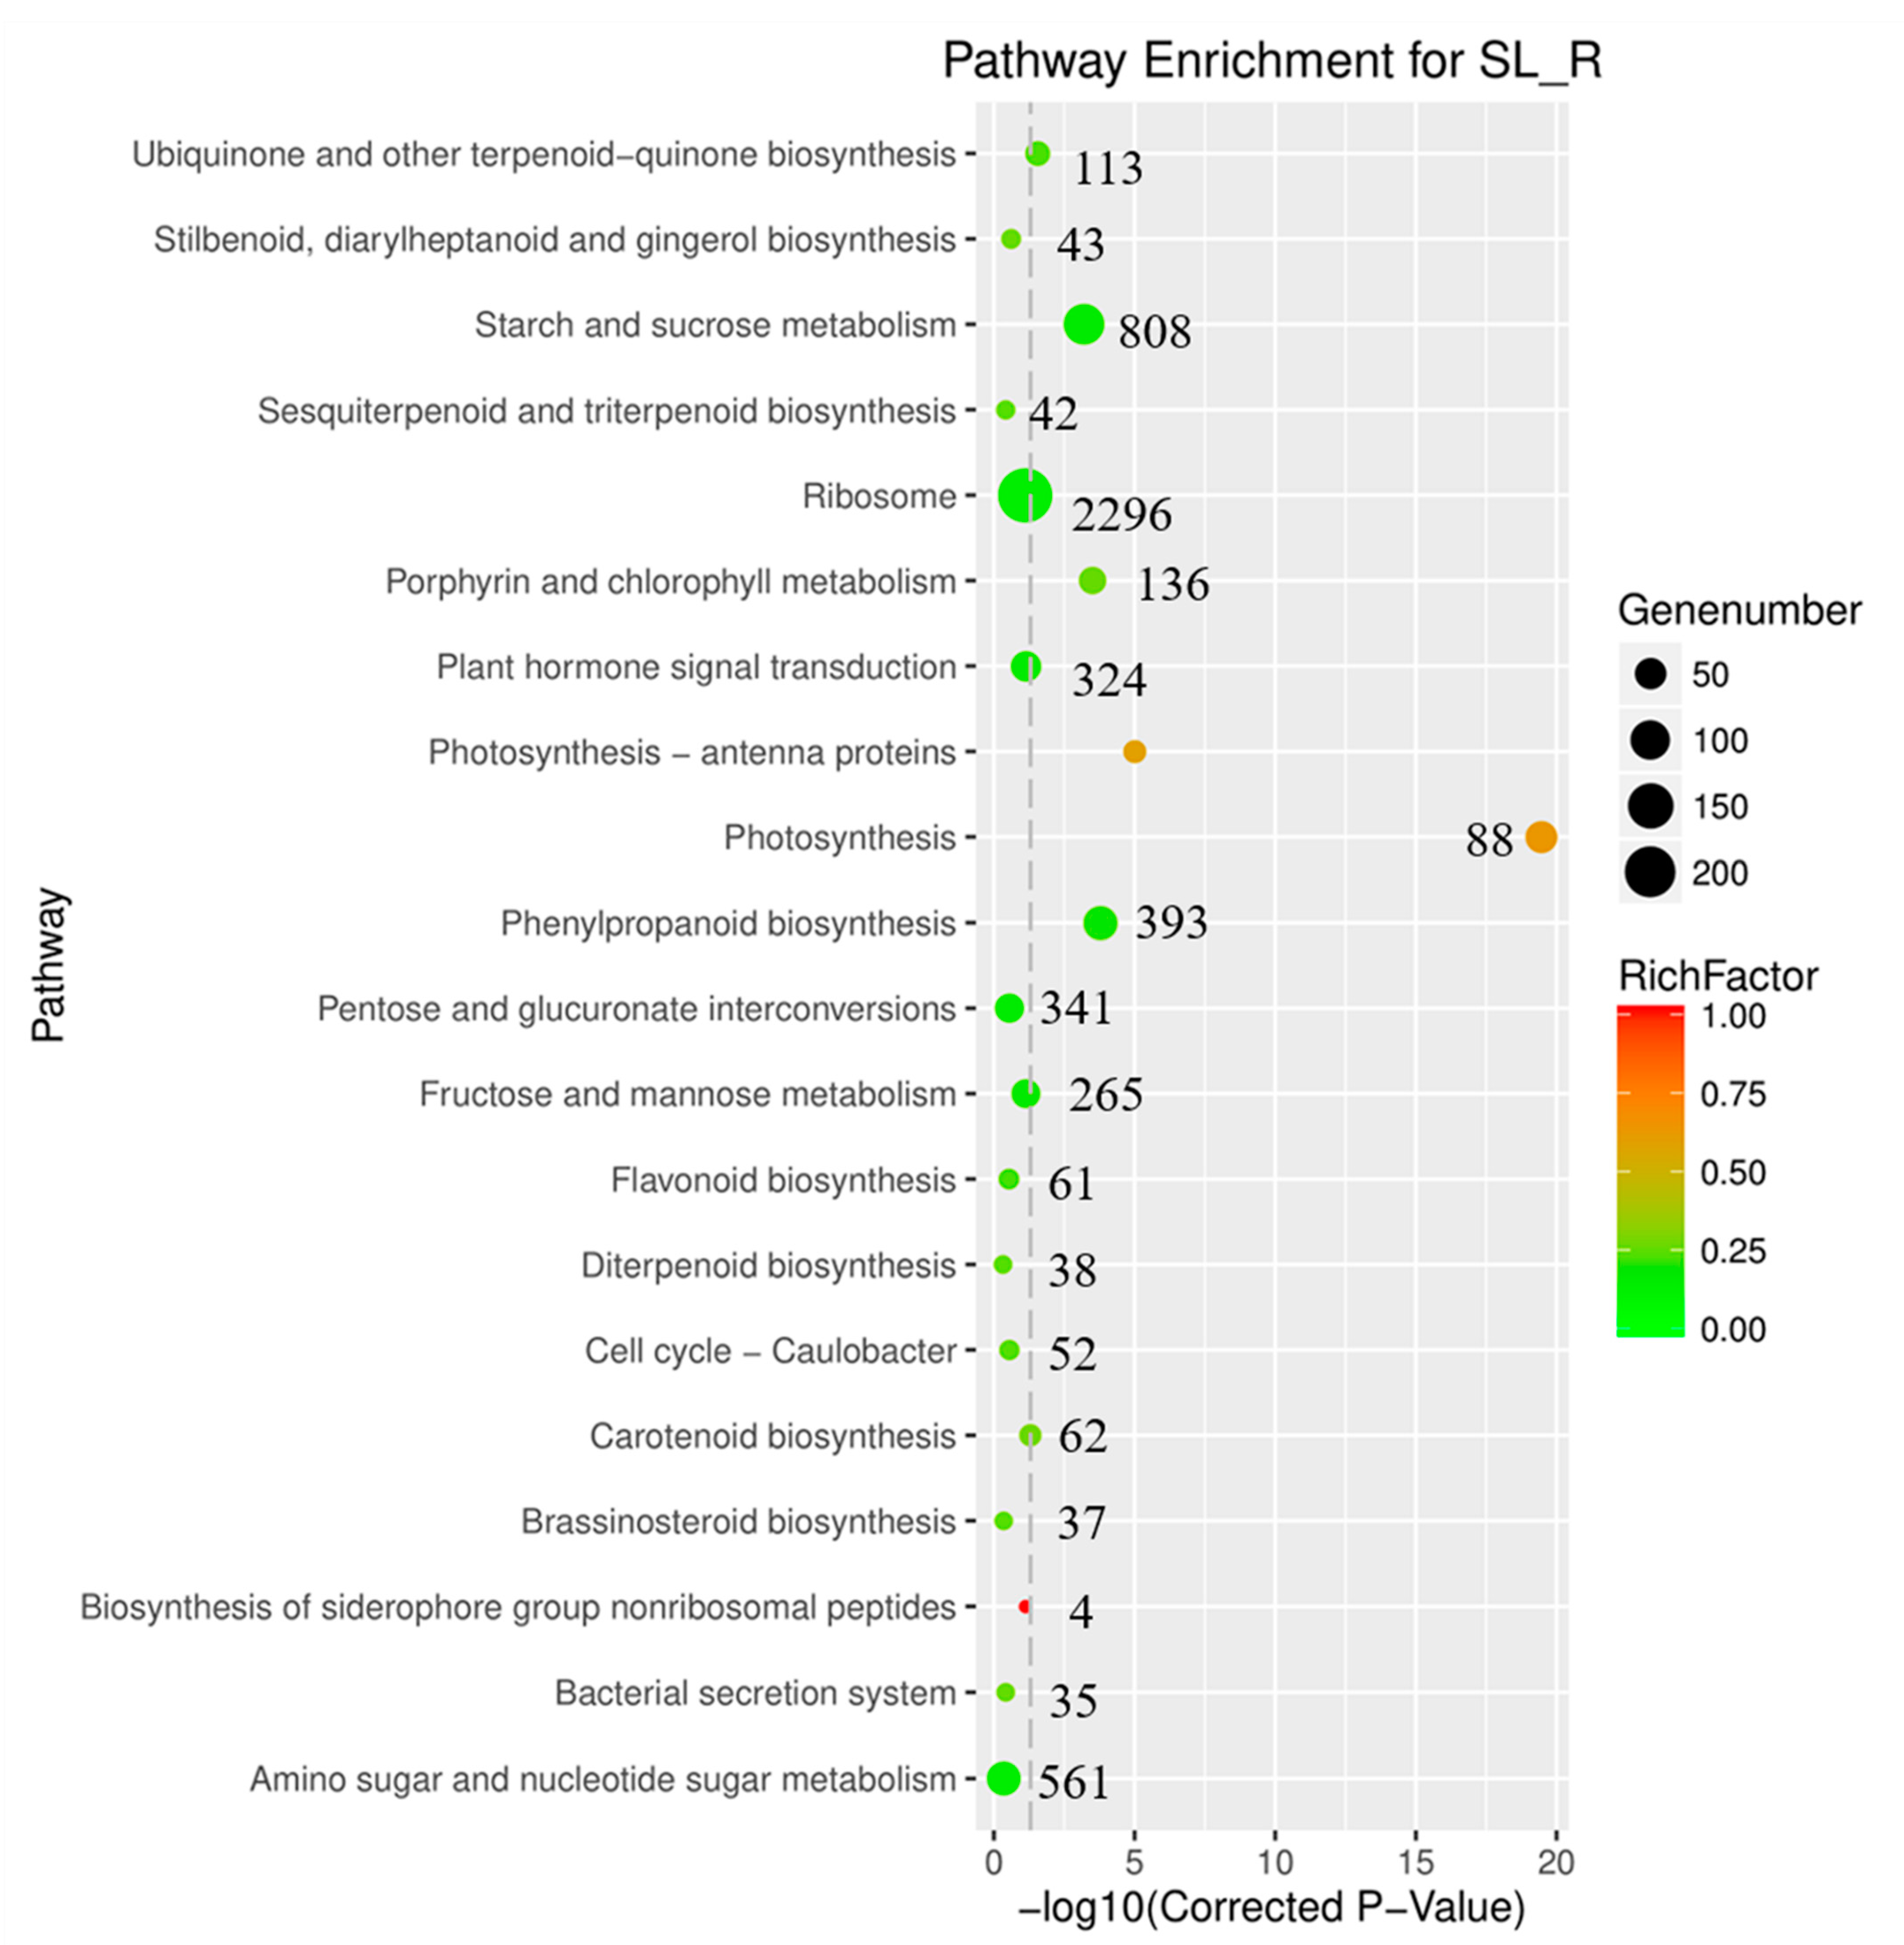
3.2. Function Annotation Analysis

With the BLASTX, 17.09%, 15.45%, 16.27%, 13.71%, 6.11%, and 11.41% of the 636,198 transcripts were annotated using NR, SwissProt, KEGG, KOG, Pfam, and GO databases, respectively (Table 1). In total, 22.02 percent of transcripts were annotated. The high proportion of annotated transcripts could be attributed to lacking a reference genome of R. yunnanensis and strict parameters used in BLASTX. NR annotation revealed that Coffea canephora, Zea mays, Hordeum vulgare subsp. vulgare, and Sesamum indicum are the top species, which accounted for 28.0%, 6.34%, 3.64%, and 2.72% of the matched transcripts, respectively. We assigned the annotated transcripts to GO categories. GOs were divided into three classes, viz. biological process, cellular component, and molecular function. Within the biological process, metabolic processes were the most highly represented groups (Supplementary Figure S3). According to the KEGG annotation, the three most abundant pathways are signal transduction (7984), carbohydrate metabolism (6549), and global and overview maps (5025) (Supplementary Figure S4).

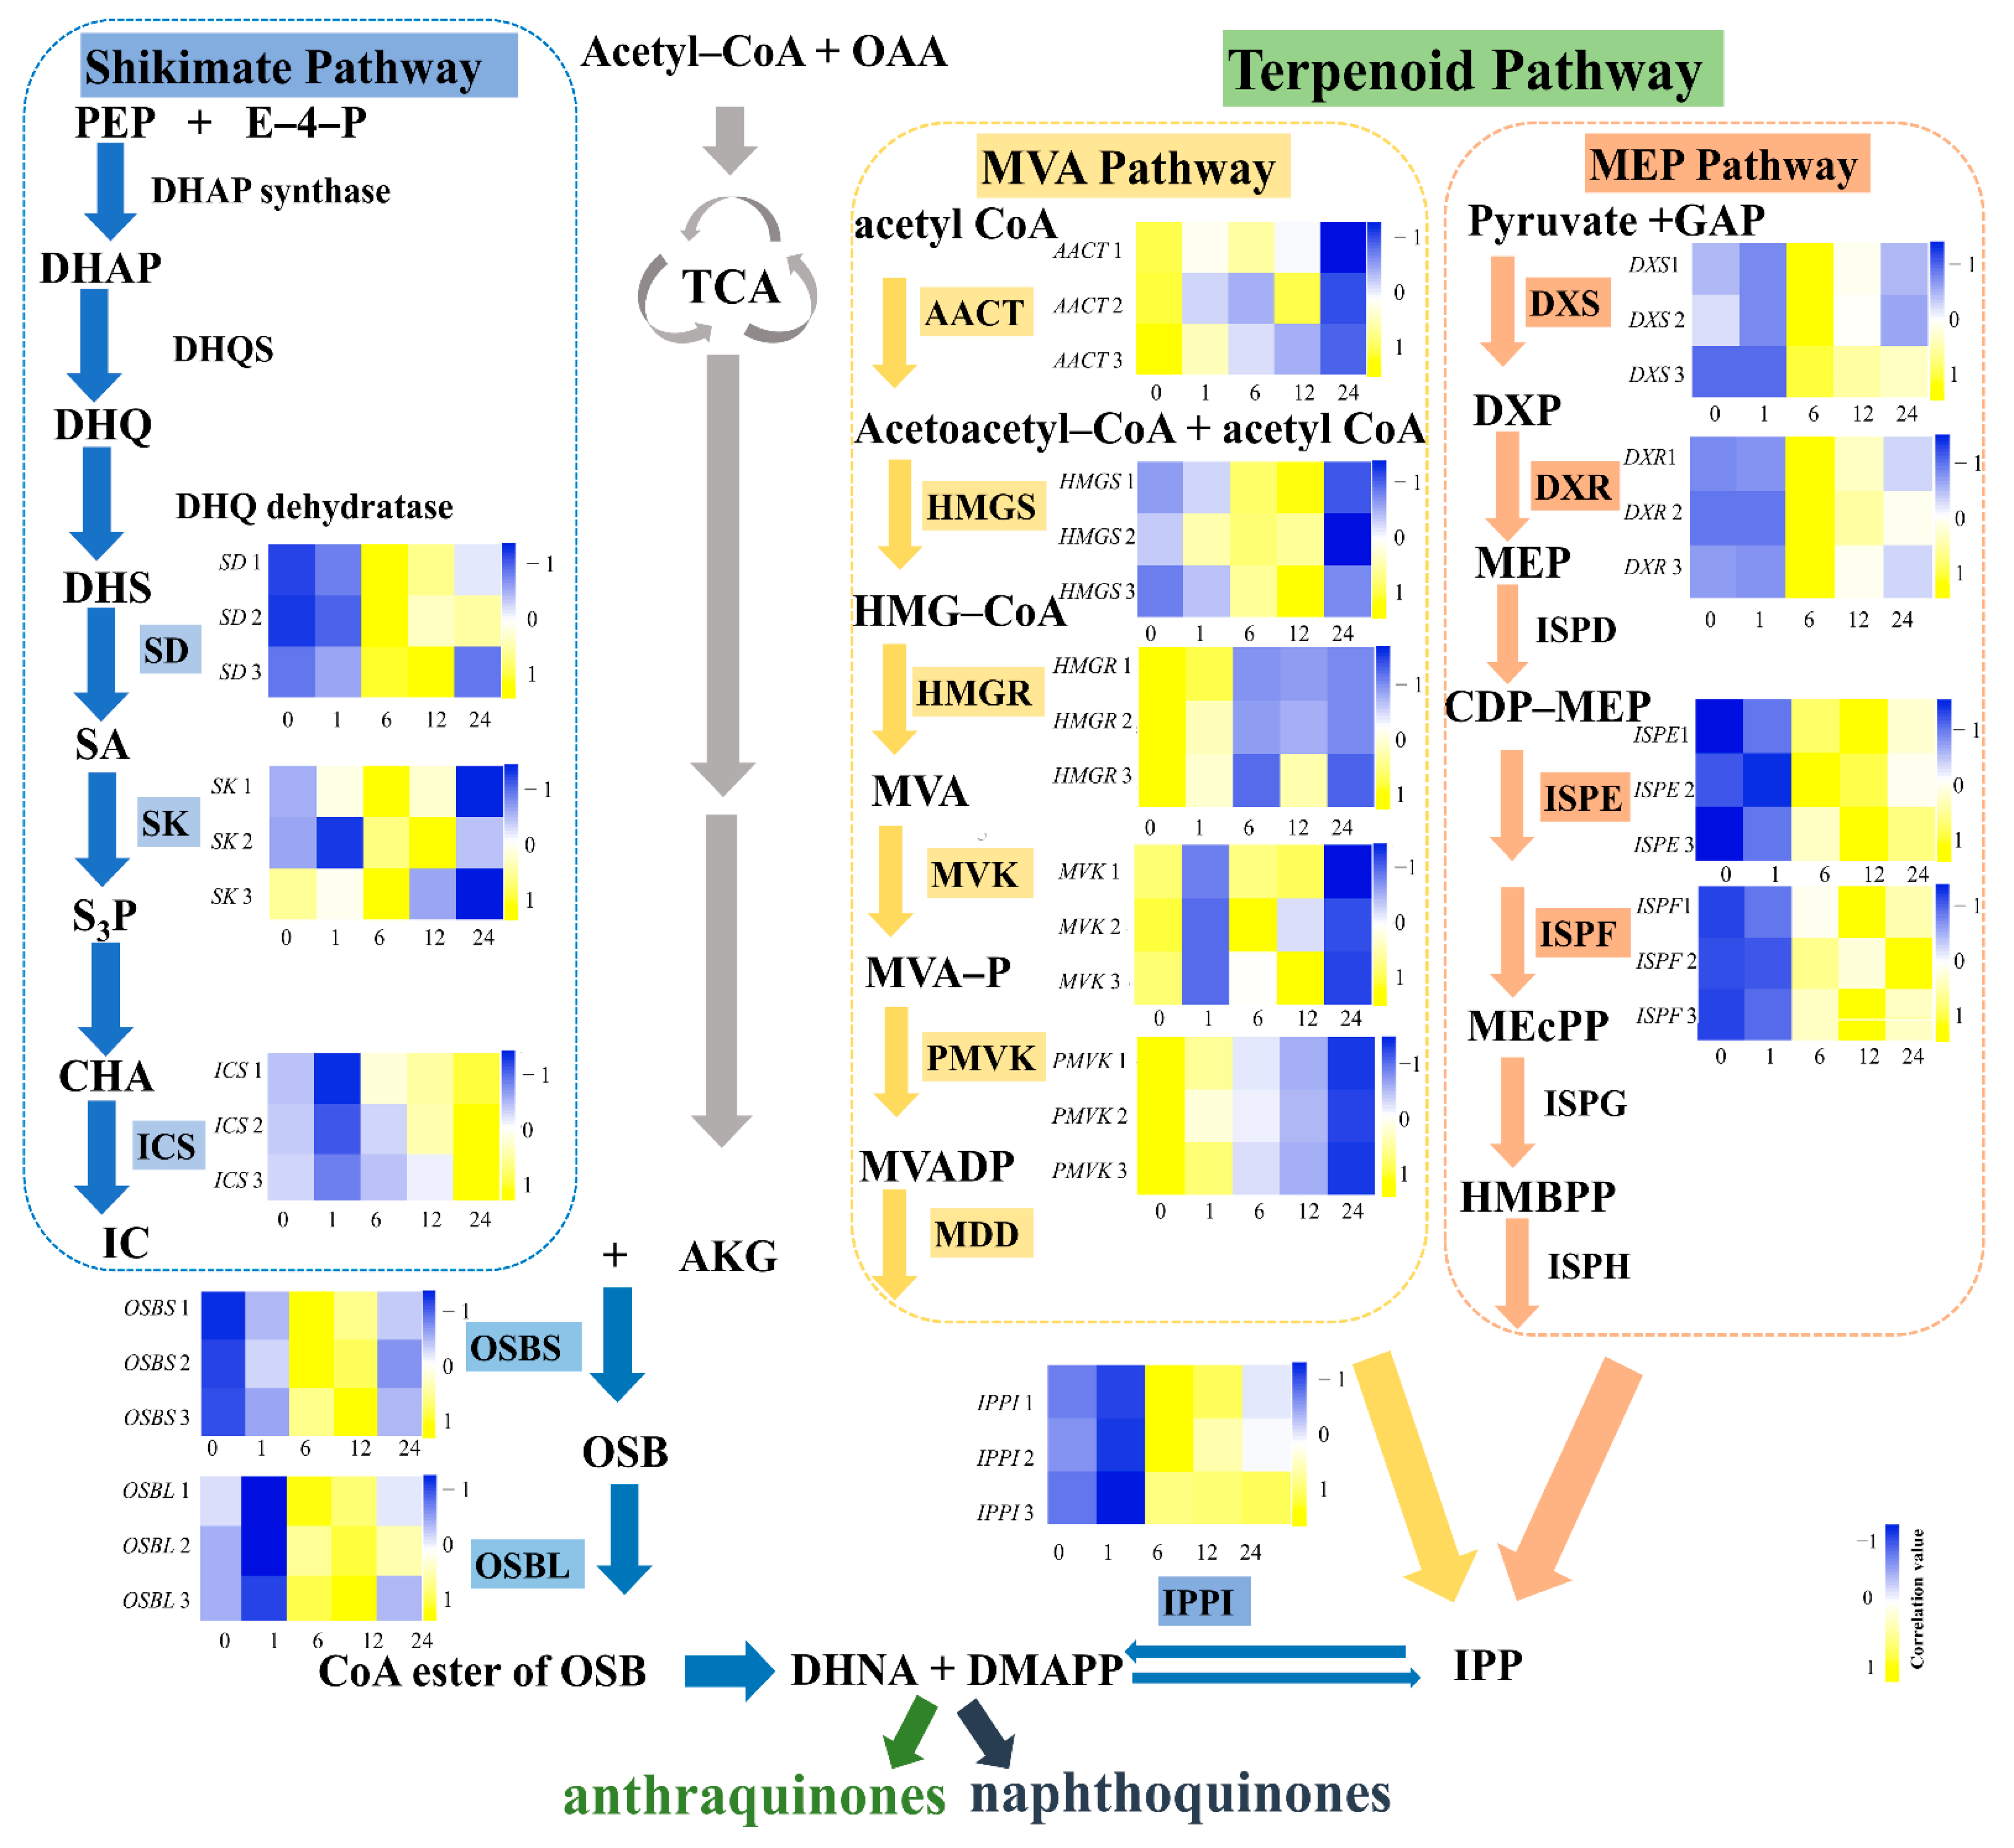
3.3. Identification of Genes Involved in Anthraquinone Biosynthesis

According to our previous work, R. yunnanensis roots (R) have higher contents of anthraquinones than that of a mixture of stems and leaves (SL) [8]. A heatmap was constructed using a clustering analysis based on the FPKM values, which showed the different gene expression patterns in R and SL samples (Figure 1). We also conducted a differential gene expression analysis between roots and a mixture of stems and leaves using edgeR with FPKM values [37]. A total of 8811 DEGs were identified based on the criteria of FDR < 0.05 and |log2Fold change| > 1.5 (Supplementary Figure S5). Among the 8811 genes, 5372 were significantly up-regulated and 3439 were down-regulated in roots. The KEGG enrichment analysis showed that 113 DEGs were involved in the ubiquinone and other terpenoid-quinone pathways (Figure 2). According to the NR annotation and literatures [16,17,18,19,38], 15 of 113 DEGs encoded anthraquinone biosynthetic enzymes, viz., isochorismate synthase (ICS), acetyl-CoA acetyltransferase (AACT), shikimate kinase (SK), 3-hydroxy-3-methylglutaryl coenzyme A synthase (HMGS), o-succinylbenzoate synthase (OSBS), o-succinylbenzoate-CoA ligase (OSBL), isopentenyl-diphosphate delta-isomerase (IPPI), 1-deoxy-D-xylulose-5-phosphate synthase (DXS), 1-deoxy-D-xylulose 5-phosphate reductoisomerase (DXR), 3-hydroxy-3-methylglutaryl-coenzyme A reductase (HMGR), mevalonate kinase (MVK), shikimate dehydrogenase (SD), phosphomevalonate kinase (PMVK), 4-diphosphocytidyl-2C-methyl-D-erythritol kinase (ISPE), and 2-C-methyl-D-erythritol 2,4-cyclodiphosphate synthase (ISPF) (Figure 3 and Supplementary Table S5). Among the 15 genes, the expression of IPPI, ICS, SD, OSBL, HMGR, DXR, DXS, PMVK, OSBS, and AACT was higher in roots, while the expression of SK, MVK, ISPF, ISPE, and HMGS was the opposite.

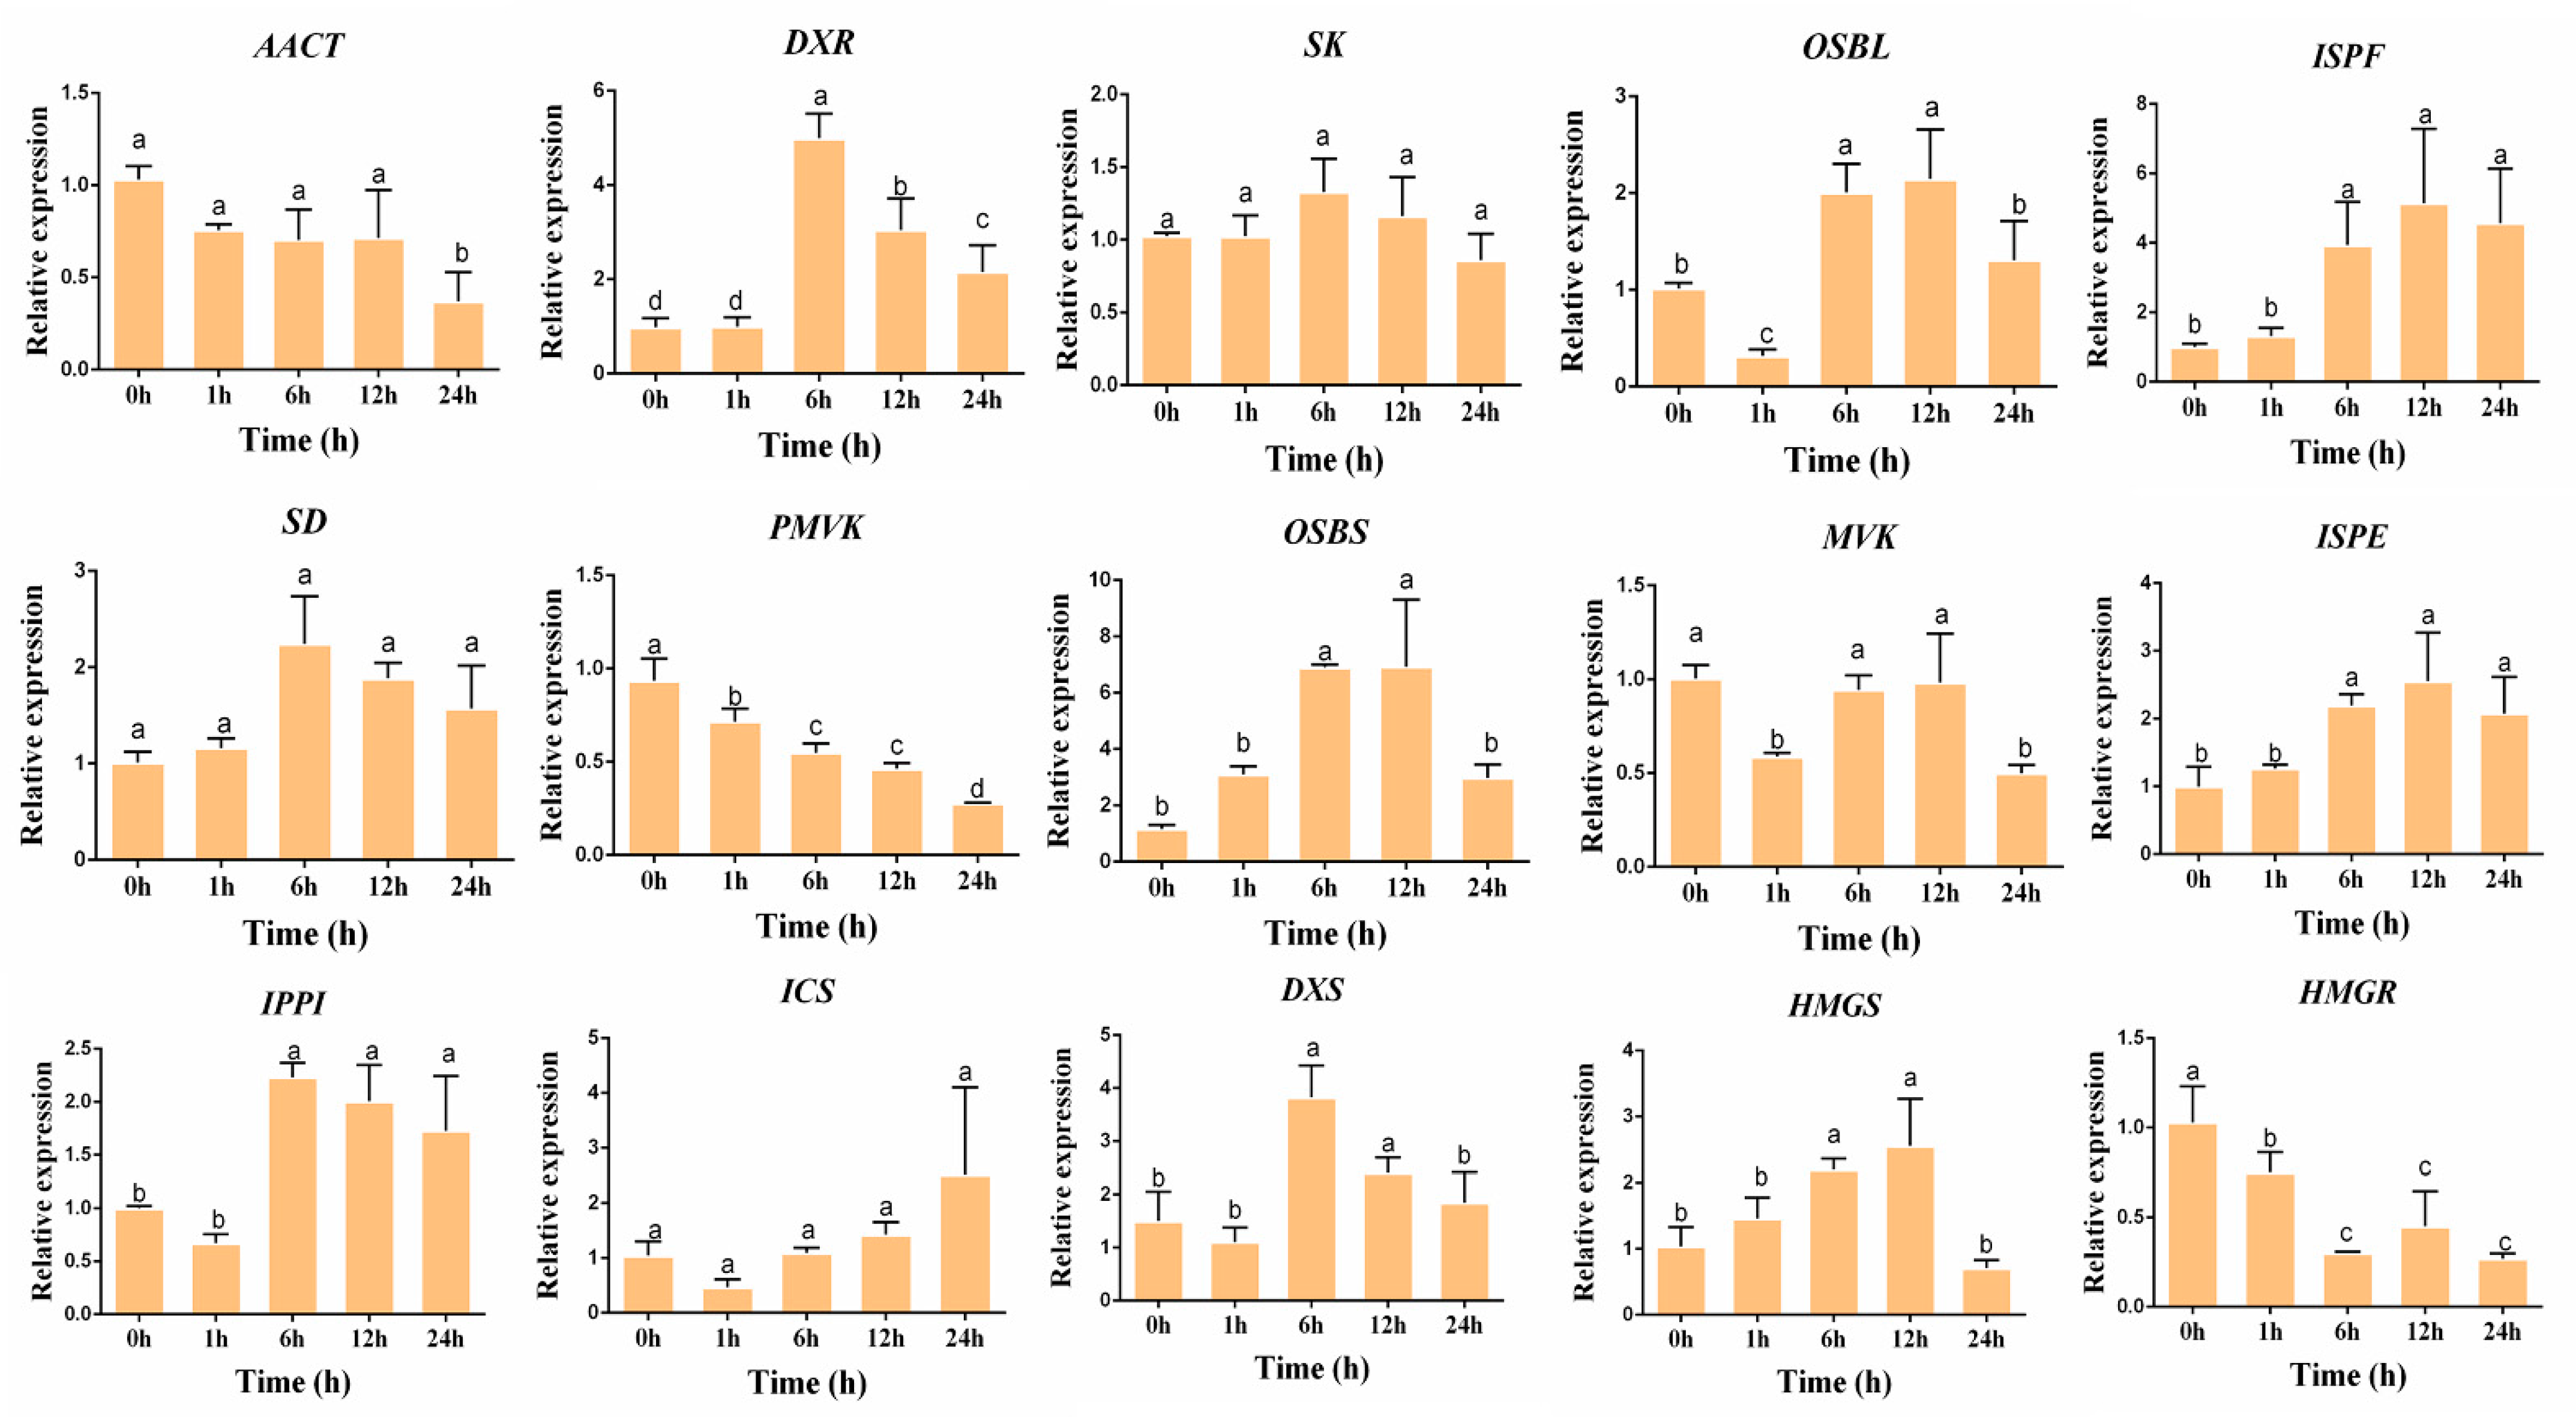
3.4. Validation of the Gene Expression Level

To validate the gene expression level quantified by RNA-seq, the expressions of ICS, AACT, DXS, IPPI, OSBL, and HMGR were quantified using RT-qPCR. The results indicated that the expression level quantified using RT-qPCR was consistent with RNA-seq (Supplementary Figure S6). Both of them showed that the expression levels of the six genes in the roots (R) were higher than that in a mixture of stems and leaves (SL).

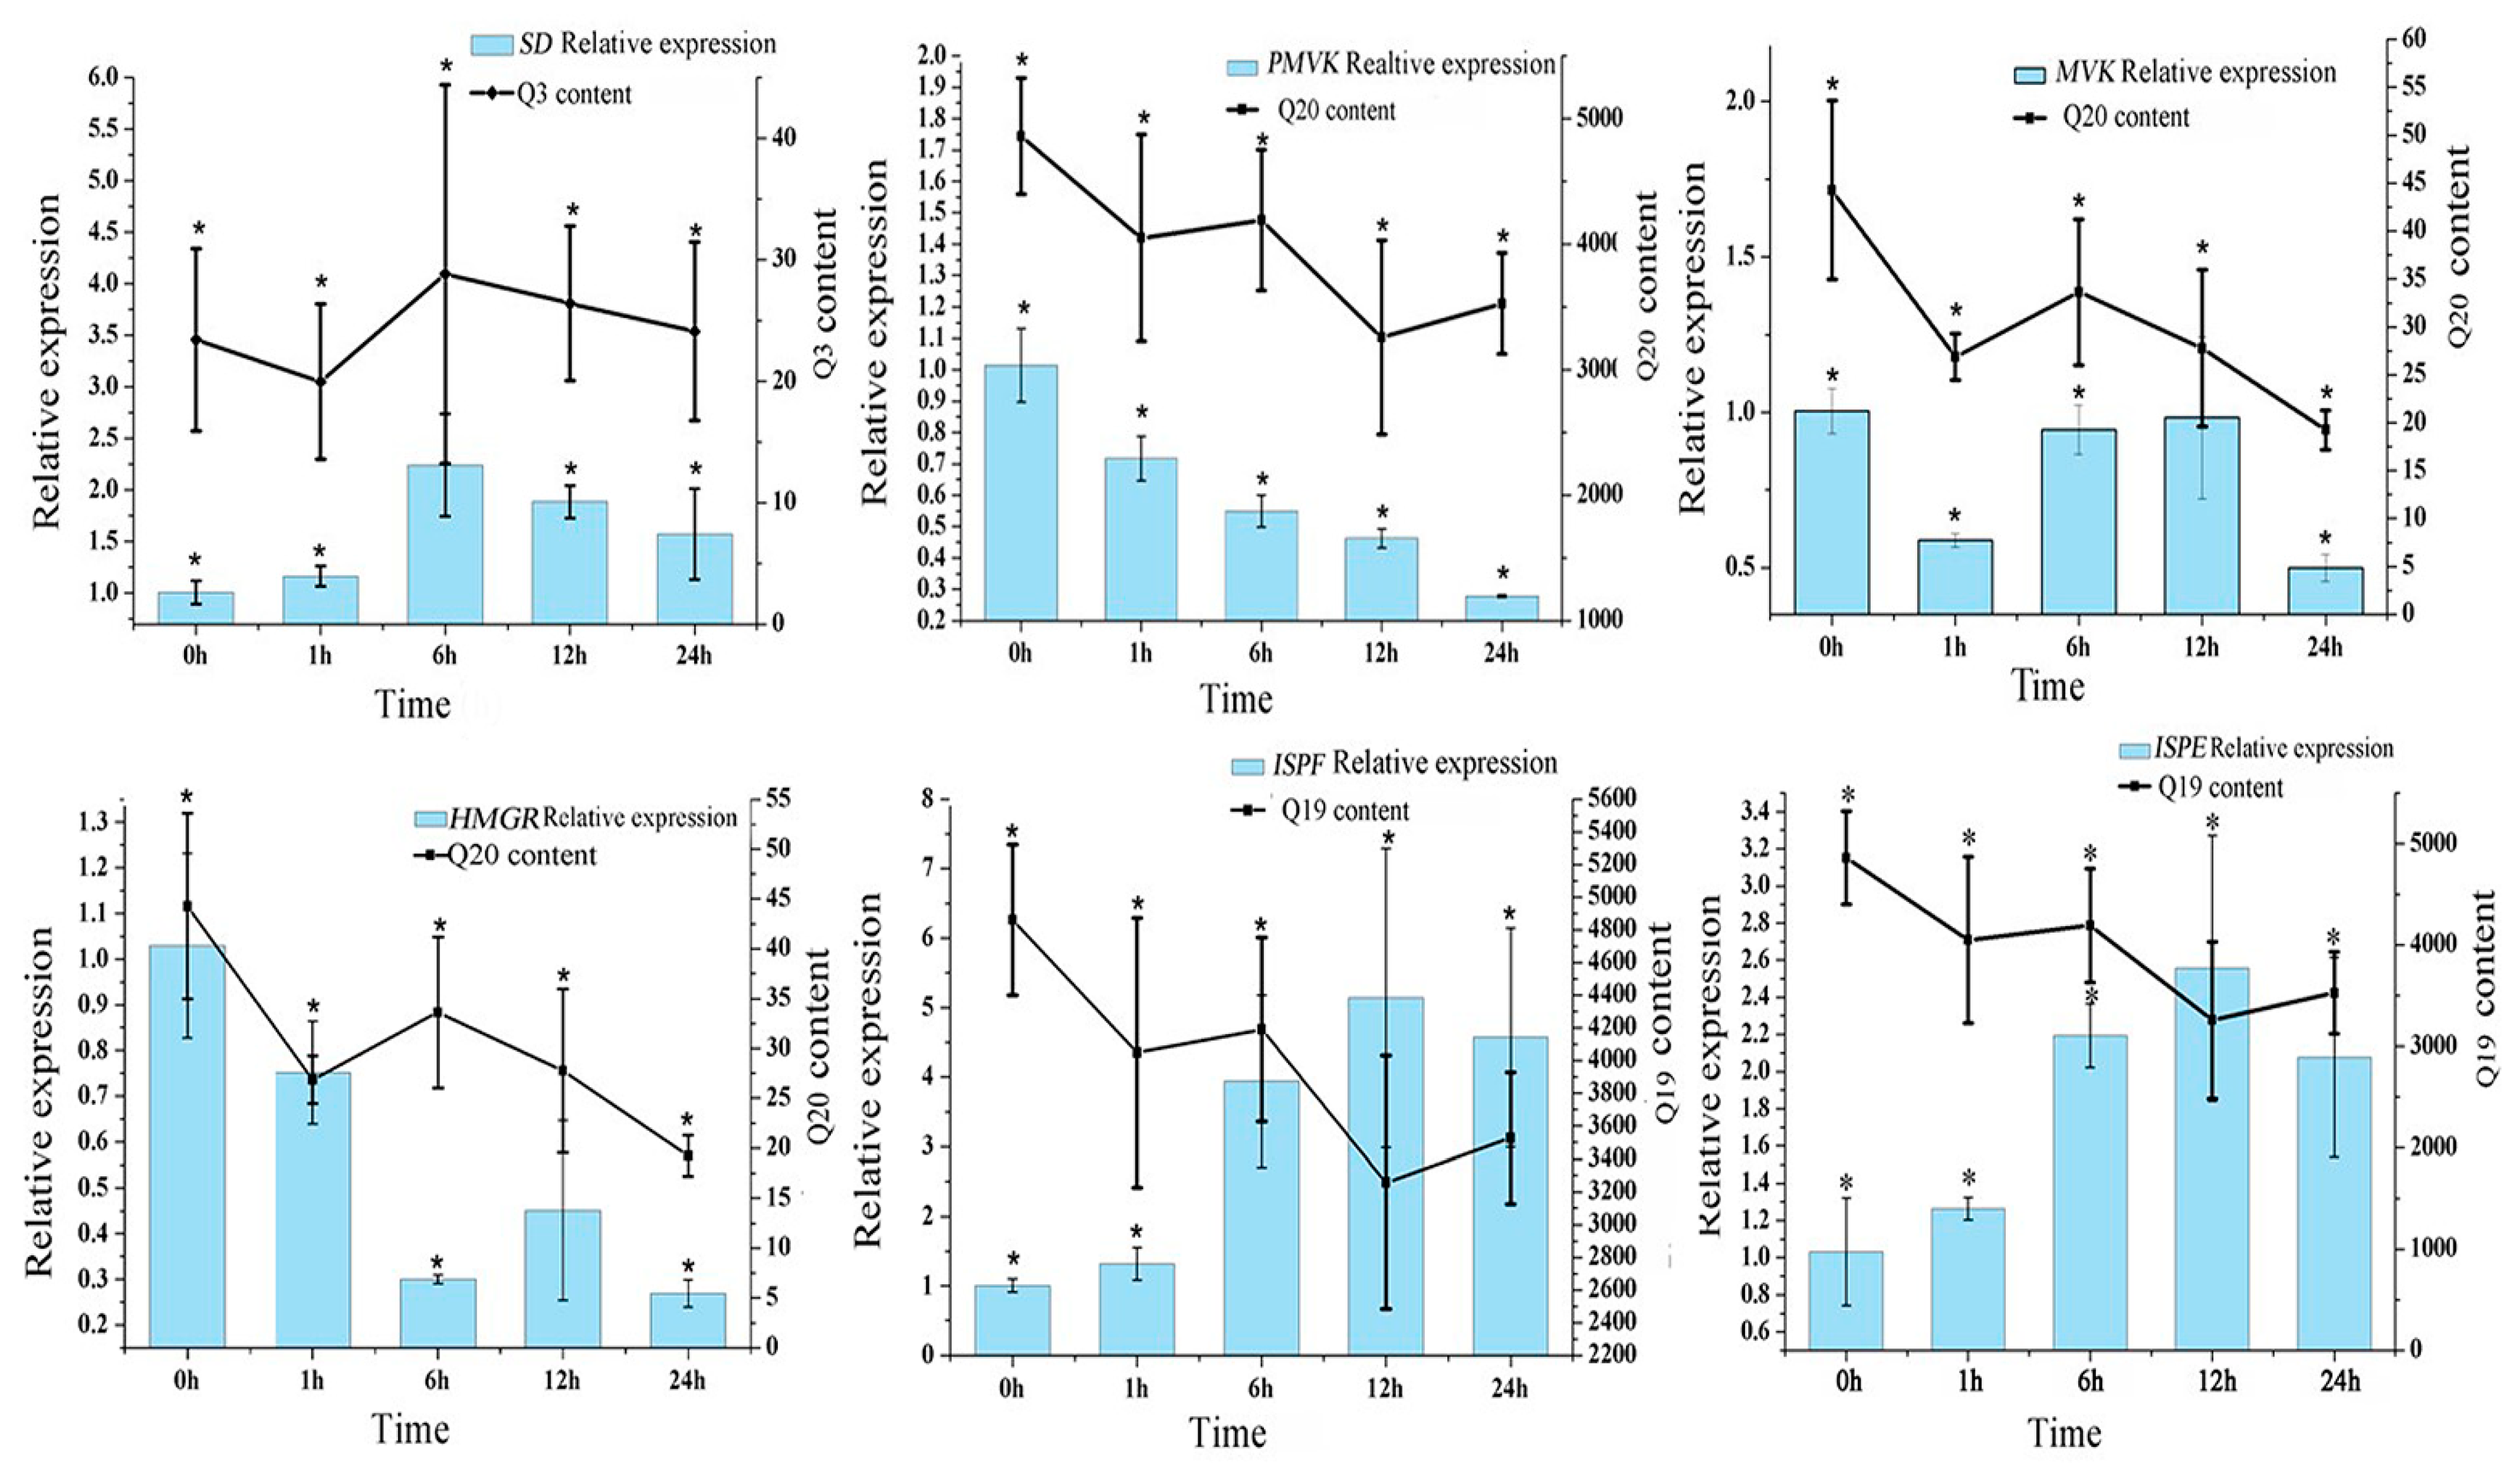
3.5. Gene Expressions Levels and Anthraquinone Contents in the Hairy Roots of R. yunnanensis under MeJA Treatment

To gain further insights into anthraquinone biosynthesis, the hairy roots of R. yunnanensis were treated by MeJA for 1, 6, 12, and 24 h, respectively. Then, the expression levels of the 15 putative genes involved in anthraquinone biosynthesis and the contents of six anthraquinones and two naphthoquinones were measured using RT-qPCR and UPLC-MS/MS, respectively. All treatments were compared with the control (0 h).
The results showed that the expressions for nine of these 15 genes was up-regulated after 6 and 12 h of MeJA treatment but was down-regulated after 24 h. The expression levels of HMGS, OSBS, OSBL, ISPE, ISPF, IPPI, SD, DXS, and DXR were up-regulated after being treated for 6 or 12 h, with the fold changes of 2.45, 5.96, 2.56, 2.12, 5.12, 2.23, 2.22, 2.55, and 5.12, respectively. The expression level of ICS increased 2.42 times after MeJA treatment for 24 h. However, AACT, MVK, SK, HMGR, and PMVK significantly reduced by 64.0%, 50.2%, 16.1%, 73.8%, and 70.3% at 24 h, respectively (Figure 4).
Eight quinones were found in R. yunnanensis, including two anthraquinones aglycones (Q3 and Q4), four anthraquinones glycosides (Q12, Q20, Q19, and Q11), and two naphthoquinones (Q17 and Q18). The contents of these anthraquinones were determined by UPLC-MS/MS analysis. The results showed the contents of Q4 increased by 28.01% after MeJA treatment for 24 h. The contents of Q3 increased by 23.05% at 6 h. However, the contents of Q11, Q20, Q19, and Q12 significantly decreased by 16.23%, 54.33%, 33.01%, and 33.30% for 6, 24, 12, and 24 h. The contents of Q17 and Q18 contents showed no significant difference at 0 or 24 h (Supplementary Figure S7).

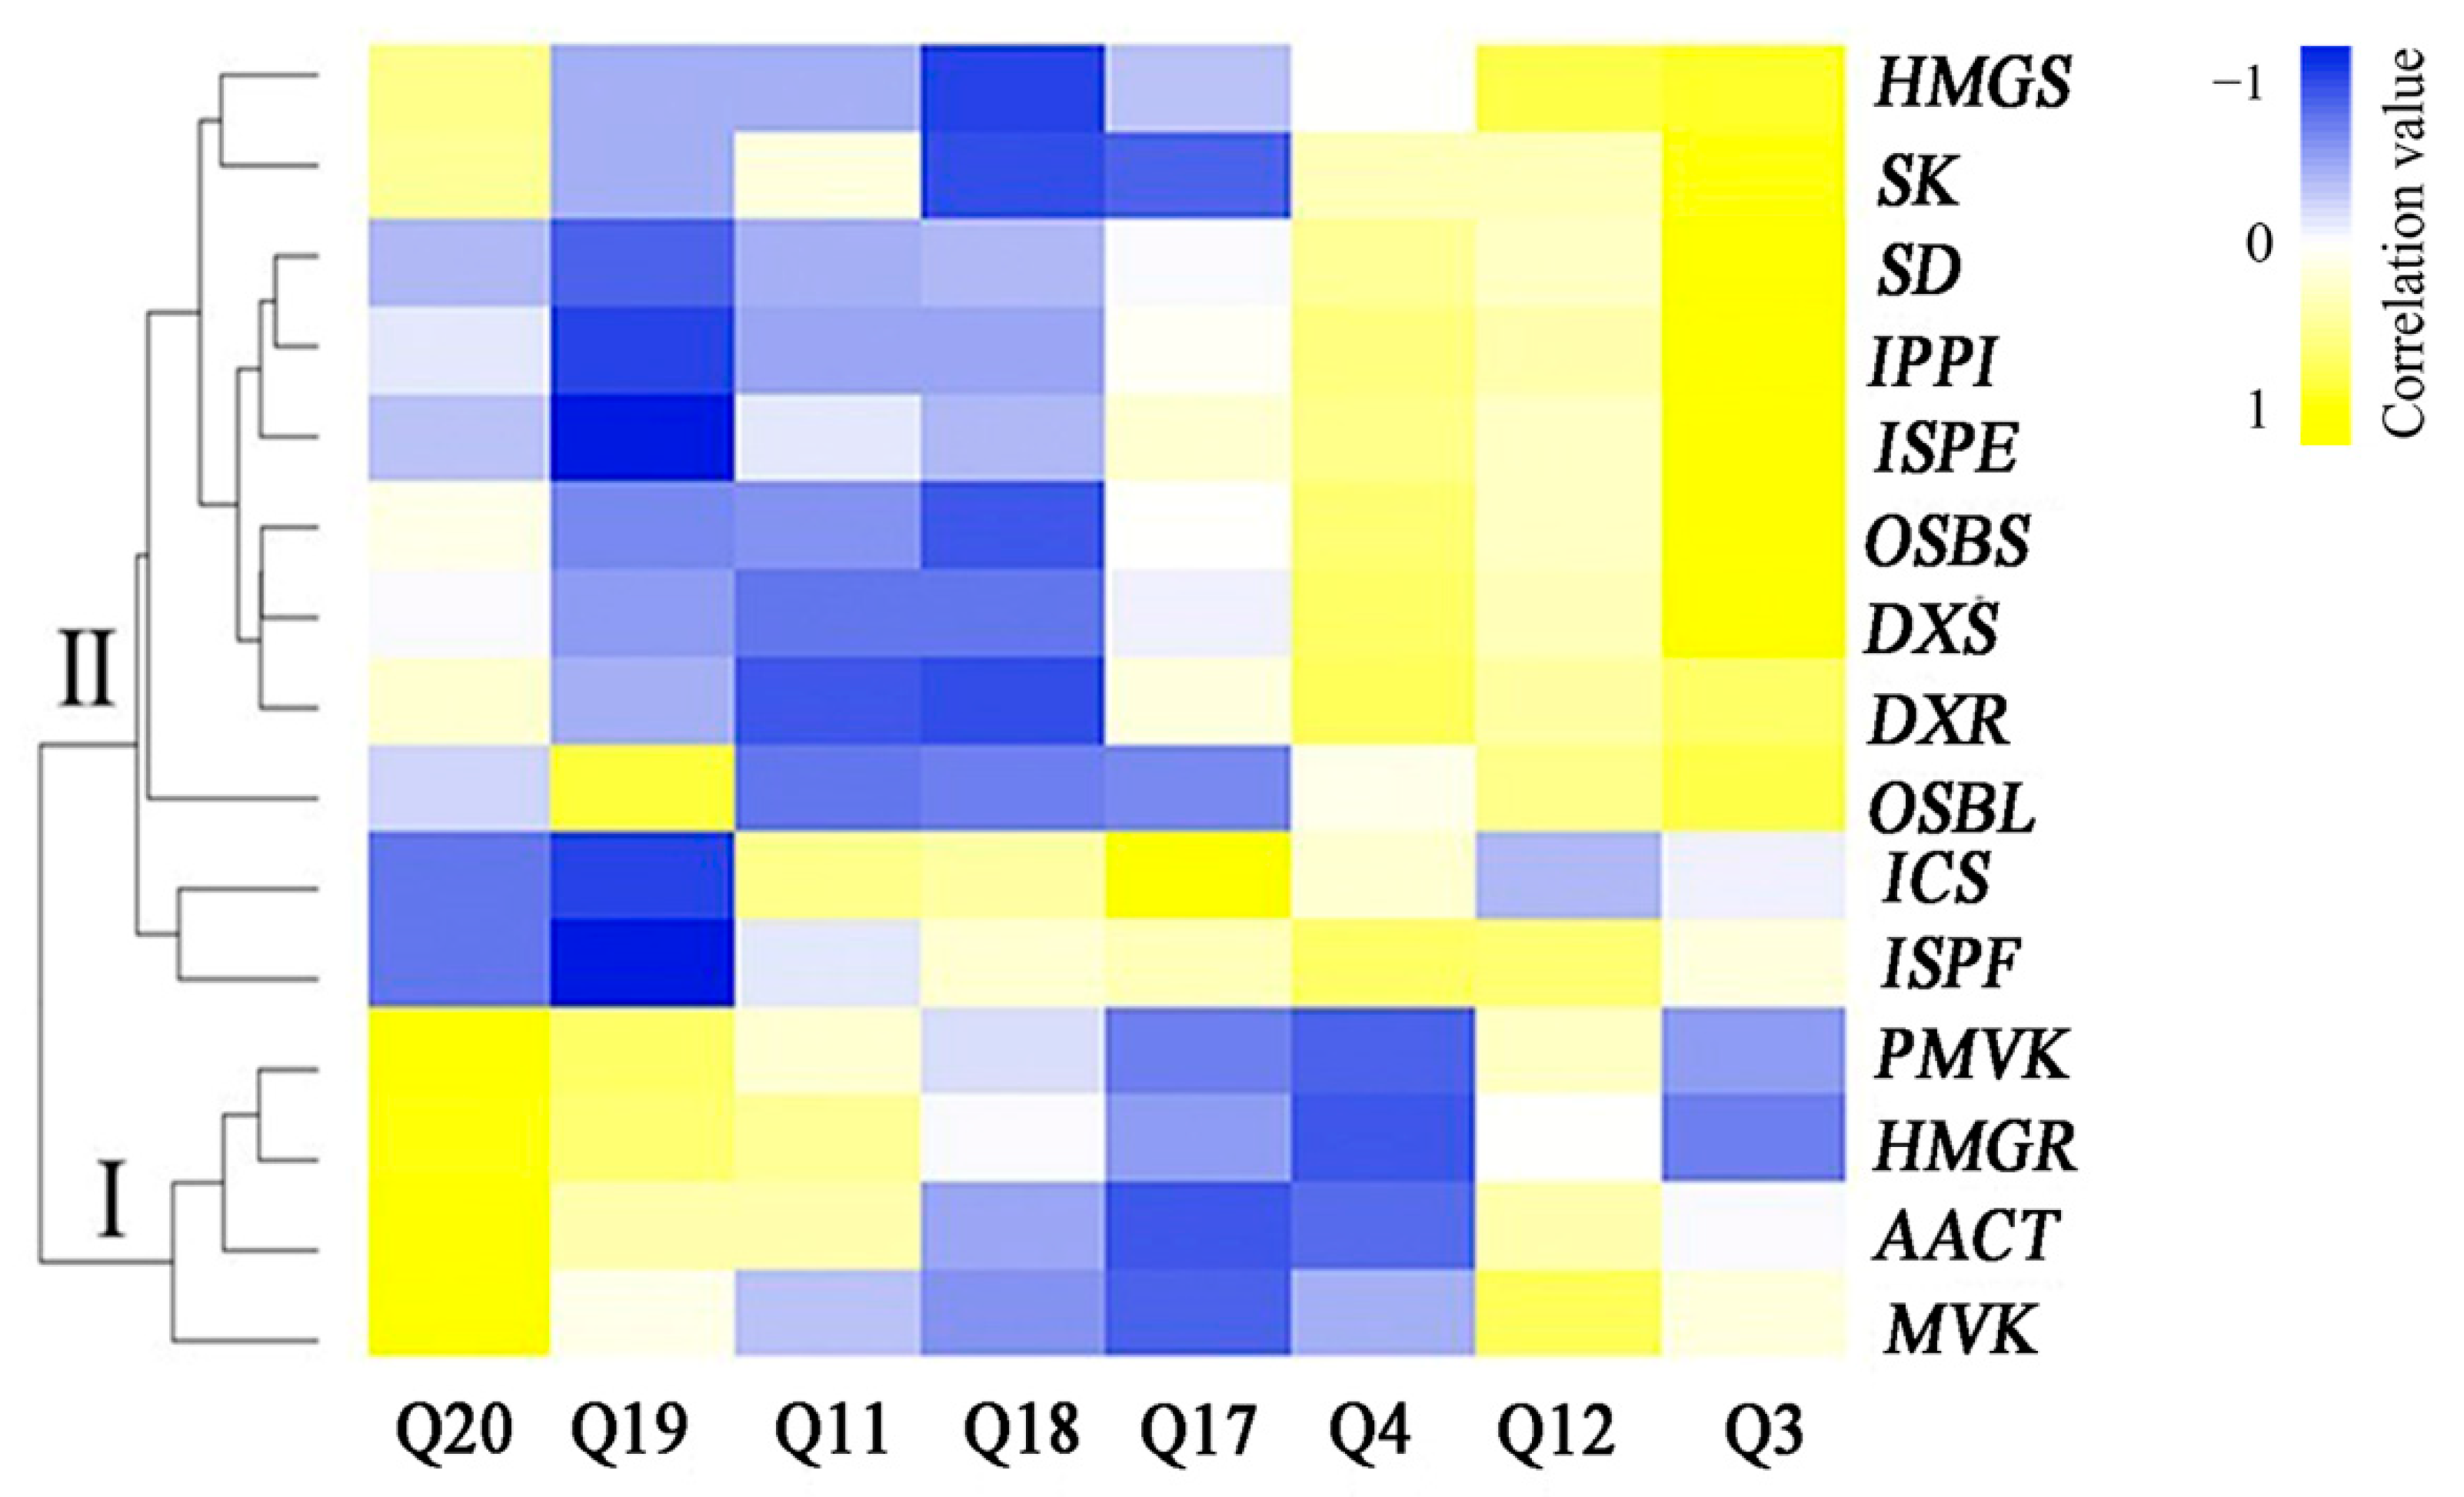
3.6. Correlation Analysis between the Expression Levels of Genes Involved in Anthraquinone Biosynthesis and Anthraquinone Contents

We treated the hairy roots of R. yunnanensis with MeJA and compared the expression levels of 15 genes (ICS, AACT, SK, HMGS, OSBS, OSBL, IPPI, DXS, DXR, HMGR, MVK, SD, PMVK, ISPE, and ISPF), the contents of six anthraquinone (Q3, Q4, Q12, Q20, Q19, and Q11), and two naphthoquinones (Q17 and Q18). Our results revealed that ten genes were upregulated and five were downregulated (Figure 4). Two anthraquinones were significantly increased. Four anthraquinones and two naphthoquinones were decreased after MeJA treatment (Supplementary Figure S7). To study the expression pattern of these 15 putative genes, we performed a correlation analysis between the gene expression levels and anthraquinone contents. As shown in Figure 5, 15 genes were grouped into two clusters based on the correlation values. The the contents of Q20, Q19, and Q12 were positively correlated with the expression of genes involved in the MVA pathways, which were positioned in Cluster I, including MVK, AACT, PMVK, and HMGR.
We used a |correlation coefficient| > 0.5 and p < 0.05 as the cutoff for a significant correlation (Supplementary Table S6). The results showed a significant correlation between three anthraquinones and six genes. The expressions of HMGR, MVK, and PMVK were positively correlated with the Q20 contents, with the correlation coefficients of 0.648, 0.694, and 0.797, respectively. The expression of SD was positively correlated with the Q3 contents. There was a negative correlation between the expression levels of ISPE and ISPF genes and the Q19 contents, with the correlation coefficients of −0.671 and −0.721, respectively (Figure 6).

4. Discussion

Due to its significant efficacy, R. yunnanensis is commonly used in promoting blood circulation, stretching tendons, and eliminating blood stasis. R. yunnanensis is rich in anthraquinones with some pharmacological effects [4,5,6,7]. Abiotic stress could promote the accumulation of anthraquinones in hairy roots [42,43,44]. For instance, elicitation with 200 µM MeJA increased the anthraquinones in hairy roots of Oplopanax elatus by 2.0-fold [45]. These findings indicated that MeJA can be used in hairy culture systems to increase metabolites production. In this study, when using a concentration of 200 µM MeJA, the anthraquinone contents increased 35.11%. It supported the opinion that effective elicitors, such as MeJA, were able to improve the accumulation of anthraquinones in the hairy roots of R. yunnanensis [31].
Anthraquinones in Rubia could be biosynthesized through the combination of shikimate and MVA/MEP pathways. Several genes in biosynthetic pathways of anthraquinones have been identified from the genus Rubia, including DXS, DXR, ICS, OSBS, OSBL, and IPPI [46,47,48]. Here, we reported the first de novo transcriptome of R. yunnanensis using the Illumina HiSeq platform. Most of the genes encoding enzymes, which have been reported to be involved in the biosynthesis of the anthraquinones [17,18,19], were present in the transcriptome of R. yunnanensis. Fifteen transcripts were found in the MEP pathway (DXS, DXR, ISPF, ISPF, and IPPI), MVA pathway (HMGR, AACT, HMGS, MVK, and PMVK), and shikimate pathway (SD, SK, ICS, OSBS, and OSBL), respectively. In addition, the correlation analysis in Figure 6, showed that the expressions of HMGR, MVK, PMVK, and SD were positively correlated with the anthraquinone contents. These genes were involved in the MVA (HMGR, MVK, and PMVK) and shikimate (SD) pathways. HMGR and MVK are rate-limiting enzyme genes [49,50] and participate in a series of biochemical reactions, such as anthraquinones, triterpenes, and phytosterols synthesis. PMVK is found to catalyze a key step in isoprenoid biosynthesis, converting mevalonate 5-phosphate to mevalonate 5-diphosphate in the MVA pathway [51,52]. SD was found to catalyze shikimate synthesis, representing the fourth step of the shikimate pathway, a conserved biosynthetic route commonly in plants, fungi, and bacteria [53,54]. It was also reported that the expressions of shikimate pathway genes responded to various types of elicitors [55]. Our results also showed that the expression level of SD was up-regulated at 6 h, possibly responding to the MeJA elicitor.
In addition, we found the contents of anthraquinones were increased after MeJA treatment, while two naphthoquinones (Q17 and Q18) showed no significant difference. These results were consistent with the cell suspension of Rubia cordifolia [56]. The biosynthetic pathways of anthraquinones and naphthoquinones are both derived from 1, 4-dihydroxy-2-naphthoic acid (DHNA) synthesized in the shikimate pathway, but branching occurs after the prenylation with an isopentenyl moiety IPP [18] (Figure 3). The IPP origin was synthesized from the MVA and MEP pathways. In our study, the genes in the MVA (HMGR, MVK, and PMVK) positively correlated with the anthraquinone contents, which may imply that MeJA mainly regulated the MVA pathway through these three genes to synthesize IPP for the accumulation of anthraquinones. However, the synthesis of IPP of naphthoquinone (Q17) appeared to be mainly from the MEP pathway [56]. Moreover, the function of the genes of the MEP pathway is influenced by the light [57,58], while the MVA pathway is negatively regulated by light [59]. In our study, the hairy root culture of R. yunnanensis was in darkness, which may promote the regulation of the MVA pathway leading to the increase of anthraquinones. These findings implied MVA pathway may play an important role in the biosynthesis of anthraquinones in R. yunnanensis, especially the four genes HMGR, MVK, PMVK, and SD, which could contribute to the production of anthraquinones. However, the integration and regulation of four targeted genes may need further investigation by using CRISPR activation/interference [60,61].
In the late stage of anthraquinone biosynthesis, the backbone of anthraquinones experiences various modifications, such as SAM-dependent methyltransferases [62], Cytochrome P450 (CYPs) [63], and UDP-glucose glucosyltransferases (UDPGs). These modification enzymes play different roles in anthraquinones’ metabolism. For example, CYPs could catalyze most of the oxidative reactions, including epoxidation, dealkylation, dehydration, and carbon–carbon bond cleavage of anthraquinones [64]. UDPGs catalyzed glycosylation at the site of the hydroxyl group to produce glycosylated anthraquinones [20]. In this study, 18 and 2 transcripts were identified for the first time as CYPs and UDPGs, respectively, from the R. yunnanensis transcriptome, which could contribute to a better understanding of the anthraquinone biosynthesis.

5. Conclusions

R. yunnanensis is rich in bioactive anthraquinones, while little is known regarding its genes in the anthraquinone biosynthesis. In this study, we reported the first de novo assembled transcriptome and identified 15 putative genes involved in the anthraquinone biosynthesis pathway in R. yunnanensis. Four of these genes (HMGR, MVK, PMVK, and SD) exhibited a high positive correlation in the anthraquinone contents. This study has a potential to discover putative genes in anthraquinone biosynthesis pathways in the Rubia plants.

Supplementary Materials

The following supporting information can be downloaded at: https://0-www-mdpi-com.brum.beds.ac.uk/article/10.3390/genes13030521/s1, Figure S1: Chemical structures of six anthraquinones and two naphthoquinones isolated from R. yunnanensis, Figure S2: Length distribution of the assembled R. yunnanensis transcripts, Figure S3: GO classification of R. yunnanensis assembled transcripts, Figure S4: KEGG classification of assembled transcripts from R. yunnanensis, Figure S5: Number of differentially expressed genes (DEGs) in the samples between roots (R) and a mixture of stems and leaves (SL) of R. yunnanensis, Figure S6: RT-qPCR validation of the expression levels of six putative key genes involved in anthraquinone biosynthesis pathways [40], Figure S7: Contents of anthraquinones and naphthoquinones in the hairy roots of R. yunnanensis after 1, 6, 12, and 24 h’s MeJA treatment, Table S1: RNA in roots (R), a mixture of stems and leaves (SL) of R. yunnanensis, Table S2. The sequences of the primers for 15 genes involved in anthraquinone biosynthesis, Table S3: A summary of raw data, Table S4: Statistics of transcript assembly, Table S5: Transcripts associated with ubiquinone and terpenoid-quinone biosynthesis according to the KEGG pathway mapping, Table S6: Correlation values between 15 genes involved in the anthraquinone biosynthesis and the contents of six anthraquinones and two naphthoquinones.

Author Contributions

Data processing, R.Z. and S.Y.; Methodology, S.Y. and Y.M.; writing—original draft preparation, R.Z.; writing—original draft, L.C. and N.T.; conceptualization and supports, N.T. All authors have read and agreed to the published version of the manuscript.

Funding

This research was funded by the National Natural Science Foundation (32070356) of China, National New Drug Innovation Major Project (2017ZX09309027) of Ministry of Science and Technology of China, the Program of Innovative Research Team of Jiangsu Province, the Natural Science Foundation (BK20180571) of Jiangsu Province, the Postdoctoral Science Foundation (2017M611959) of China, and “the Double First-Class” University Project (CPU2018GF05) of China Pharmaceutical University.

Institutional Review Board Statement

Not applicable.

Informed Consent Statement

Not applicable.

Data Availability Statement

Assembled transcriptomes, transcript annotation, and the differential expressed transcripts, and annotation of DEGs are available at the figshare: https://0-doi-org.brum.beds.ac.uk/10.6084/m9.figshare.17711582.v1, accessed on 2 January 2022.

Conflicts of Interest

The authors declare no conflict of interest. The funders had no role in the design of the study; in the collection, analyses, or interpretation of data; in the writing of the manuscript; or in the decision to publish the results.

References

  1. Chinese Flora Editorial Board; Chinese Academy of Science. Flora of China; Science Press: Beijing, China, 1999; pp. 303–305. [Google Scholar]
  2. Lan, M. Dian Nan Ben Cao; Yunnan People’s Publishing House: Kunming, China, 1978; pp. 349–351. [Google Scholar]
  3. Liou, M.J.; Wu, T.S. Triterpenoids from Rubia yunnanensis. J. Nat. Prod. 2002, 65, 1283–1287. [Google Scholar] [CrossRef] [PubMed]
  4. Gao, Y.; Su, Y.; Huo, Y.; Mi, J.; Wang, X.; Wang, Z.; Liu, Y.; Zhang, H. Identification of antihyperlipidemic constituents from the roots of Rubia yunnanensis Diels. J. Ethnopharmacol. 2014, 155, 1315–1321. [Google Scholar] [CrossRef] [PubMed]
  5. Zeng, G.Z.; Fan, J.T.; Xu, J.J.; Li, Y.; Tan, N.H. Apoptosis induction and G2/M arrest of 2-methyl-1,3,6-trihydroxy-9,10-anthraquinone from Rubia yunnanensis in human cervical cancer HeLa cells. Pharmazie 2013, 68, 293–299. [Google Scholar] [PubMed]
  6. Liu, M.J.; Teng, C.M.; Wu, T.S. Constituents from Rubia ustulata Diels and R. yunnanensis Diels and their antiplatelet aggregation activity. J. Chin. Chem. Soc. Taip. 2002, 49, 1025–1030. [Google Scholar] [CrossRef]
  7. Fan, J.T.; Kuang, B.; Zeng, G.Z.; Zhao, S.M.; Ji, C.J.; Zhang, Y.M.; Tan, N.H. Biologically active arborinane-type triterpenoids and anthraquinones from Rubia yunnanensis. J. Nat. Prod. 2011, 74, 2069–2080. [Google Scholar] [CrossRef] [PubMed]
  8. Hu, Y.Y.; Zhang, X.J.; Zhang, Z.H.; Wang, Z.; Tan, N.H. Qualitative and quantitative analyses of quinones in multi-origin Rubia species by ultra-performance liquid chromatography-tandem mass spectrometry combined with chemometrics. J. Pharm. Biomed. Anal. 2020, 189, 113471. [Google Scholar] [CrossRef] [PubMed]
  9. Zhao, S.M.; Kuang, B.; Zeng, G.Z.; Wang, Z.; Wang, J.; Chen, X.Q.; Tan, N.H. Nematicidal quinone derivatives from three Rubia plants. Tetrahedron 2018, 74, 2115–2220. [Google Scholar] [CrossRef]
  10. Bonadonna, G.; Monfardini, S.; De Lena, M.; Fossati-Bellani, F. Clinical evaluation of adriamycin, a new antitumour antibiotic. Br. Med. J. 1969, 3, 503–506. [Google Scholar] [CrossRef] [PubMed] [Green Version]
  11. Gessler, N.N.; Egorova, A.S.; Belozerskaya, T.A. Fungal anthraquinones. Appl. Biochem. Microbiol. 2013, 49, 85–99. [Google Scholar] [CrossRef]
  12. Pankewitz, F.; Zöllmer, A.; Hilker, M.; Gräser, Y. Presence of Wolbachia in insect eggs containing antimicrobially active anthraquinones. Microb. Ecol. 2007, 54, 713–721. [Google Scholar] [CrossRef]
  13. Malik, E.M.; Müller, C.E. Anthraquinones as pharmacological tools and drugs. Med. Res. Rev. 2016, 36, 705–748. [Google Scholar] [CrossRef] [PubMed]
  14. Caro, Y.; Anamale, L.; Fouillaud, M.; Laurent, P.; Petit, T.; Dufosse, L. Natural hydroxyanthraquinoid pigments as potent food grade colorants: An overview. Nat. Prod. Bioprospect. 2012, 2, 174–193. [Google Scholar] [CrossRef]
  15. Dufossé, L. Anthraquinones, the Dr Jekyll and Mr Hyde of the food pigment family. Food Res. Int. 2014, 65, 132–136. [Google Scholar] [CrossRef]
  16. Han, Y.S.; van der Heijden, R.; Verpoorte, R. Biosynthesis of anthraquinones in cell cultures of the Rubiaceae. Plant. Cell Tiss. Org. 2001, 67, 201–220. [Google Scholar] [CrossRef]
  17. Liang, W.; Sun, J.C.; Guo, F.X.; Zhang, X.M.; Xu, B.; Chen, Y.; Li, X. Research progress on synthesis of anthraquinones based on shikimic acid/o-succinylbenzoic acid pathway. Chin. Trad. Herb. Drugs 2020, 51, 1939–1950. [Google Scholar]
  18. Han, Y.S.; van der Heijden, R.; Lefeber, A.W.M.; Eekelens, C.; Verpoorte, R. Biosynthesis of anthraquinones in cell cultures of Cinchona ‘Robusta’ proceeds via the methylerythritol 4-phosphate pathway. Phytochemistry 2002, 59, 45–55. [Google Scholar] [CrossRef]
  19. Ramos-Valdivia, A.C.; van der Heijden, R.; Verpoorte, R. Isopentenyl diphosphate isomerase: A core enzyme in isoprenoid biosynthesis. A review of its biochemistry and function. Nat. Prod. Rep. 1997, 14, 591–603. [Google Scholar] [CrossRef] [PubMed]
  20. Yi, S.Y.; Kuang, T.D.; Miao, Y.Y.; Xu, Y.Q.; Wang, Z.; Dong, L.D.; Tan, N.H. Discovery and characterization of four glycosyltransferases involved in anthraquinone glycosides biosynthesis in Rubia yunnanensis. Org. Chem. Front. 2020, 7, 2442–2448. [Google Scholar] [CrossRef]
  21. Rama Reddy, N.R.; Mehta, R.H.; Soni, P.H.; Makasana, J.; Gajbhiye, N.A.; Ponnuchamy, M.; Kumar, J. Next generation sequencing and transcriptome analysis predicts biosynthetic pathway of sennosides from Senna (Cassia angustifolia Vahl.), a non-model plant with potent laxative properties. PLoS ONE 2015, 10, e0129422. [Google Scholar] [CrossRef] [PubMed] [Green Version]
  22. Hua, W.P.; Zhang, Y.; Song, J.; Zhao, L.J.; Wang, Z.Z. De novo transcriptome sequencing in Salvia miltiorrhiza to identify genes involved in the biosynthesis of active ingredients. Genomics 2011, 98, 272–279. [Google Scholar]
  23. Zhao, D.K.; Shen, Y.; Shi, Y.N.; Shi, X.Q.; Qiao, Q.; Zi, S.H.; Zhao, E.Q.; Yu, D.Q.; Kennelly, E.J. Probing the transcriptome of Aconitum carmichaelii reveals the candidate genes associated with the biosynthesis of the toxic aconitine-type C19-diterpenoid alkaloids. Phytochemistry 2018, 152, 113–124. [Google Scholar] [CrossRef] [PubMed]
  24. Choudhri, P.; Rani, M.; Sangwan, R.S.; Kumar, R.; Kumar, A.; Chhokar, V. De novo sequencing, assembly, and characterisation of Aloe vera transcriptome and analysis of expression profiles of genes related to saponin and anthraquinone metabolism. BMC Genomics 2018, 19, 427. [Google Scholar] [CrossRef] [PubMed]
  25. Zhou, D.W.; Gao, S.; Wang, H.; Lei, T.X.; Shen, J.W.; Gao, J.; Chen, S.L.; Yin, J.; Liu, J.Q. De novo sequencing transcriptome of endemic Gentiana straminea (Gentianaceae) to identify genes involved in the biosynthesis of active ingredients. Gene 2016, 575, 160–170. [Google Scholar] [CrossRef] [PubMed]
  26. Yan, H.Z.; Yoo, M.J.; Koh, J.; Liu, L.H.; Chen, Y.Z.; Acikgoz, D.G.; Wang, Q.M.; Chen, S.X. Molecular reprogramming of Arabidopsis in response to perturbation of jasmonate signaling. J. Proteome Res. 2014, 13, 5751–5766. [Google Scholar] [CrossRef] [PubMed]
  27. Kochan, E.; Balcerczak, E.; Lipert, A.; Szymańska, G.; Szymczyk, P. Methyl jasmonate as a control factor of the synthase squalene gene promoter and ginsenoside production in American ginseng hairy root cultured in shake flasks and a nutrient sprinkle bioreactor. Ind. Crops Prod. 2018, 115, 182–193. [Google Scholar] [CrossRef]
  28. Wang, C.H.; Zheng, L.P.; Tian, H.; Wang, J.W. Synergistic effects of ultraviolet-B and methyl jasmonate on tanshinone biosynthesis in Salvia miltiorrhiza hairy roots. J. Photochem. Photobiol. B 2016, 159, 93–100. [Google Scholar] [CrossRef] [PubMed]
  29. Vaccaro, M.C.; Alfieri, M.; Malafronte, N.; De Tommasi, N.; Leone, A. Increasing the synthesis of bioactive abietane diterpenes in Salvia sclarea hairy roots by elicited transcriptional reprogramming. Plant. Cell Rep. 2017, 36, 375–386. [Google Scholar] [CrossRef] [PubMed]
  30. Li, R.S.; Zhu, J.H.; Guo, D.; Li, H.L.; Wang, Y.; Ding, X.P.; Mei, W.L.; Chen, Z.B.; Dai, H.F.; Peng, S.Q. Genome-wide identification and expression analysis of terpene synthase gene family in Aquilaria sinensis. Plant. Physiol. Biochem. 2021, 164, 185–194. [Google Scholar] [CrossRef] [PubMed]
  31. Miao, Y.Y.; Hu, Y.Y.; Yi, S.Y.; Zhang, X.J.; Tan, N.H. Establishment of hairy root culture of Rubia yunnanensis Diels: Production of Rubiaceae-type cyclopeptides and quinones. J. Biotechnol. 2021, 341, 21–29. [Google Scholar] [CrossRef]
  32. Chen, Y.; Chen, Y.; Shi, C.; Huang, Z.B.; Zhang, Y.; Li, S.K.; Li, Y.; Ye, J.; Yu, C.; Zhou, L.; et al. SOAPnuke: A mapreduce acceleration supported software for integrated quality control and preprocessing of high-throughput sequencing data. Gigascience 2018, 7, 1–6. [Google Scholar] [CrossRef] [PubMed] [Green Version]
  33. Fu, L.M.; Niu, B.F.; Zhu, Z.W. CD-HIT: Accelerated for clustering the next-generation sequencing data. Bioinformatics 2012, 28, 3150–3152. [Google Scholar] [CrossRef] [PubMed]
  34. Altschul, S.F.; Gish, W.; Miller, W.; Myers, E.W.; Lipman, D.J. Basic local alignment search tool. J. Mol. Biol. 1990, 215, 403–410. [Google Scholar] [CrossRef]
  35. Langmead, B.; Salzberg, S.; Steven, L. Fast gapped-read alignment with Bowtie2. Nat. Methods 2012, 9, 357–359. [Google Scholar] [CrossRef] [PubMed] [Green Version]
  36. Li, B.; Dewey, C.N. RSEM: Accurate transcript quantification from RNA-Seq data with or without a reference genome. BMC Bioinform. 2011, 12, 323. [Google Scholar] [CrossRef] [PubMed] [Green Version]
  37. Robinson, M.D.; McCarthy, D.J.; Smyth, G.K. edgeR: A bioconductor package for differential expression analysis of digital gene expression data. Bioinformatics 2010, 26, 139–140. [Google Scholar] [CrossRef] [PubMed] [Green Version]
  38. Eichinger, D.; Bacher, A.; Zenk, M.H.; Eisenerich, W. Quantitative assessment of metabolic flux by 13C NMR analysis. Biosynthesis of anthraquinones in Rubia tinctorum. J. Am. Chem. Soc. 1999, 121, 7469–7475. [Google Scholar] [CrossRef]
  39. Livak, K.J.; Schmittgen, T.D. Analysis of relative gene expression data using real-time quantitative PCR and the 2(-Delta Delta C(T)) method. Methods 2011, 25, 402–408. [Google Scholar] [CrossRef] [PubMed]
  40. Yi, S.Y.; Lin, Q.W.; Zhang, X.J.; Wang, J.; Miao, Y.Y.; Tan, N.H. Selection and validation of appropriate reference genes for quantitative RT-PCR analysis in Rubia yunnanensis Diels based on transcriptome data. Biomed. Res. Int. 2020, 2020, 5824841. [Google Scholar] [CrossRef] [Green Version]
  41. Grabherr, M.G.; Haas, B.J.; Yassour, M.; Levin, J.Z.; Thompson, D.A.; Amit, I.; Adiconis, X.; Fan, L.; Raychowdhury, R.; Zeng, Q. Full-length transcriptome assembly from RNA-seq data without a reference genome. Nat. Biotechnol. 2011, 29, 644–652. [Google Scholar] [CrossRef] [Green Version]
  42. Ho, T.T.; Murthy, H.N.; Park, S.Y. Methyl jasmonate induced oxidative stress and accumulation of secondary metabolites in plant cell and organ cultures. Int. J. Mol. Sci. 2020, 21, 716. [Google Scholar] [CrossRef] [Green Version]
  43. Perassolo, M.; Cardillo, A.B.; Mugas, M.L.; Núñez Montoya, S.C.; Giulietti, A.M.; Rodríguez Talou, J. Enhancement of anthraquinone production and release by combination of culture medium selection and methyl jasmonate elicitation in hairy root cultures of Rubia tinctorum. Ind. Crops Prod. 2017, 105, 124–132. [Google Scholar] [CrossRef]
  44. Luo, H.M.; Zhu, Y.J.; Song, J.Y.; Xu, L.J.; Sun, C.; Zhang, X.; Xu, Y.H.; Sun, W.; Xu, H.B.; Wang, B.; et al. Transcriptional data mining of Salvia miltiorrhiza in response to methyl jasmonate to examine the mechanism of bioactive compound biosynthesis and regulation. Physiol. Plant. 2014, 152, 241–255. [Google Scholar] [CrossRef] [PubMed]
  45. Han, L.; Piao, X.C.; Jiang, J.; Jiang, X.L.; Yin, C.R.; Lian, M.L. A high production of flavonoids and anthraquinones via adventitious root culture of Oplopanax elatus and evaluating antioxidant activity. Plant. Cell Tiss. Org. 2019, 137, 173–179. [Google Scholar] [CrossRef]
  46. Han, Y.S.; Roytrakul, S.; Verberne, M.C.; van der Heijden, R.; Linthorst, H.J.; Verpoorte, R. Cloning of a cDNA encoding 1-deoxy-D-xylulose 5-phosphate synthase from Morinda citrifolia and analysis of its expression in relation to anthraquinone accumulation. Plant. Sci. 2003, 164, 911–917. [Google Scholar] [CrossRef]
  47. Stalman, M.; Koskamp, A.M.; Luderer, R.; Vernooy, J.H.; Wind, J.C.; Wullems, G.J.; Croes, A.F. Regulation of anthraquinone biosynthesis in cell cultures of Morinda citrifolia. J. Plant. Physiol. 2003, 160, 607–614. [Google Scholar] [CrossRef] [PubMed]
  48. Veremeichik, G.N.; Bulgakov, V.P.; Shkryl, Y.N.; Siliantieva, S.A.; Makhazen, D.S.; Tchernoded, G.K.; Mischenko, N.P.; Fedoreyev, S.A.; Vasileva, E.A. Activation of anthraquinone biosynthesis in long-cultured callus culture of Rubia cordifolia transformed with the rolA plant oncogene. J. Biotechnol. 2019, 306, 38–46. [Google Scholar] [CrossRef] [PubMed]
  49. Lombard, J.; Moreira, D. Origins and early evolution of the mevalonate pathway of isoprenoid biosynthesis in the three domains of life. Mol. Biol. Evol. 2011, 28, 87–99. [Google Scholar] [CrossRef] [Green Version]
  50. Anthony, J.R.; Anthony, L.C.; Nowroozi, F.; Kwon, G.; Newman, J.D.; Keasling, J.D. Optimization of the mevalonate-based isoprenoid biosynthetic pathway in Escherichia coli for production of the anti-malarial drug precursor amorpha-4,11-diene. Metab. Eng. 2009, 11, 13–19. [Google Scholar] [CrossRef]
  51. Yang, J.; Xian, M.; Su, S.Z.; Zhao, G.; Nie, Q.J.; Jiang, X.L.; Zheng, Y.N.; Liu, W. Enhancing production of bio-isoprene using hybrid MVA pathway and isoprene synthase in E. coli. PLoS ONE 2012, 7, e33509. [Google Scholar] [CrossRef]
  52. Yuan, Y.; Yu, J.; Jiang, C.; Li, M.H.; Lin, S.F.; Wang, X.M.; Huang, L.Q. Functional diversity of genes for the biosynthesis of paeoniflorin and its derivatives in Paeonia. Int. J. Mol. Sci. 2013, 14, 18502–18519. [Google Scholar] [CrossRef]
  53. Hawkins, A.R.; Lamb, H.K.; Moore, J.D.; Charles, I.G.; Roberts, C.F. The pre-chorismate (shikimate) and quinate pathways in filamentous fungi: Theoretical and practical aspects. J. Gen. Microbiol. 1993, 139, 2891–2899. [Google Scholar] [CrossRef] [PubMed] [Green Version]
  54. Maeda, H.; Dudareva, N. The shikimate pathway and aromatic amino acid biosynthesis in plants. Annu. Rev. Plant. Biol. 2012, 63, 73–105. [Google Scholar] [CrossRef] [PubMed]
  55. Karakas, F.P.; Cingoz, G.S.; Turker, A.U. The effects of oxidative stress on phenolic composition and antioxidant metabolism in callus culture of common daisy. Afr. J. Tradit. Complem. 2016, 13, 34–41. [Google Scholar] [CrossRef] [Green Version]
  56. Fan, X.; Hu, G.S.; Li, N.; Han, Z.F.; Jia, J.M. Effects of lovastatin, clomazone and methyl jasmonate treatment on the accumulation of purpurin and mollugin in cell suspension cultures of Rubia cordifolia. Chin. J. Nat. Med. 2013, 11, 0396–0400. [Google Scholar] [CrossRef]
  57. Leivar, P.; Monte, E. PIFs: Systems integrators in plant development. Plant. Cell 2014, 26, 56–78. [Google Scholar] [CrossRef] [PubMed] [Green Version]
  58. Pu, X.; Dong, X.; Li, Q.; Chen, Z.; Liu, L. An update on the function and regulation of methylerythritol phosphate and mevalonate pathways and their evolutionary dynamics. J. Integr. Plant. Biol. 2021, 63, 1211–1226. [Google Scholar] [CrossRef]
  59. Learned, R.M. Light suppresses 3-hydroxy-3-methylglutaryl coenzyme a reductase gene expression in Arabidopsis thaliana. Plant. Physiol. 1996, 110, 645–655. [Google Scholar] [CrossRef] [PubMed] [Green Version]
  60. Qi, L.S.; Larson, M.H.; Gilbert, L.A.; Doudna, J.A.; Weissman, J.S.; Arkin, A.P.; Lim, W.A. Repurposing CRISPR as an RNA-guided platform for sequence-specific control of gene expression. Cell 2013, 152, 1173–1183. [Google Scholar] [CrossRef] [Green Version]
  61. Schwartz, C.; Curtis, N.; Löbs, A.K.; Wheeldon, I. Multiplexed CRISPR activationmof cryptic sugar metabolism enables Yarrowia lipolytica growth on cel-lobiose. Biotechnol. J. 2018, 13, 1700584. [Google Scholar] [CrossRef] [PubMed]
  62. Yamazaki, M.; Mochida, K.; Asano, T.; Nakabayashi, R.; Chiba, M.; Udomson, N.; Yamazaki, Y.; Goodenowe, D.B.; Sankawa, U.; Yoshida, T.; et al. Coupling deep transcriptome analysis with untargeted metabolic profiling in Ophiorrhiza pumila to further the understanding of the biosynthesis of the anti-cancer alkaloid camptothecin and anthraquinones. Plant. Cell Physiol. 2013, 54, 686–696. [Google Scholar] [CrossRef] [Green Version]
  63. Durst, F.; Benveniste, I.; Salaün, J.P.; Werck-Reichhart, D. Function, mechanism and regulation of cytochrome P-450 enzymes in plants. Biochem. Soc. Trans. 1992, 20, 353–357. [Google Scholar] [CrossRef] [PubMed]
  64. Griffiths, S.; Mesarich, C.H.; Saccomanno, B.; Vaisberg, A.; De Wit, P.J.; Cox, R.; Collemare, J. Elucidation of cladofulvin biosynthesis reveals a cytochrome P450 monooxygenase required for anthraquinone dimerization. Proc. Natl. Acad. Sci. USA 2016, 113, 6851–6856. [Google Scholar] [CrossRef] [PubMed] [Green Version]
Figure 1. Heat map of gene expression level of the roots (R) samples and a mixture sample of stems and leaves (SL) of R. yunnanensis.
Genes 13 00521 g001
Figure 2. Statistics of DEGs enriched in the KEGG pathway between the samples of roots (R) and a mixture of stems and leaves (SL). Y-axis on the right side shows the number of differentially expressed genes.
Genes 13 00521 g002
Figure 3. The expression levels of anthraquinone related genes in the hairy roots of R. yunnanensis. The pathways were re-drawn refering to the literatures [16,17,18,19,38]. Subfigures: the hairy roots were treated by MeJA. 0, 1, 6, 12, and 24 h and each x-axis represents the time points (hours) of each sample; gene expression levels in y-axis were quantified using RT-qPCR; heatmaps were plotted in Heatmapper (http://www.heatmapper.ca/expression/, accessed on 25 May 2021).
Genes 13 00521 g003
Figure 4. The gene expression in the hairy roots of R. yunnanensis after MeJA treatment for 1, 6, 12, and 24 h. hnRNP was used as the reference gene. The vertical axis represents the relative gene expression level. Different lowercase letters for the same metabolite indicate significant differences (p < 0.05) between the samples.
Genes 13 00521 g004
Figure 5. Pearson correlation for the expression levels of 15 genes and the contents of six anthraquinones and two naphthoquinones. Heatmaps were generated using Heatmapper (http://www.heatmapper.ca/expression/, accessed on 25 May 2021).
Genes 13 00521 g005
Figure 6. The expression levels of six genes were significantly related to the contents of three anthraquinones after 0, 1, 6, 12, and 24 h under MeJA treatment. “*” indicates significant differences (p < 0.05) between the samples.
Genes 13 00521 g006
Table 1. Statistical results of transcript annotation.
DatabaseNumber of Annotated TranscriptsRatio of Annotated Transcripts (%)Number of Annotated GenesRatio of Annotated Genes (%)
All assembly transcripts636,198NANANA
All assembly genes554,646NANANA
NR108,75317.0977,18813.92
Swiss-Prot98,31115.4576,70313.83
KEGG103,52916.2773,11213.18
KOG87,21513.7167,46612.16
Pfam38,8776.1129,3695.30
GO72,57311.4151,1029.21
All annotated transcripts140,07822.02107,63119.41
Publisher’s Note: MDPI stays neutral with regard to jurisdictional claims in published maps and institutional affiliations.

