
The Impact of Sex, Circadian Disruption, and the ClockΔ19/Δ19 Genotype on Alcohol Drinking in Mice

 , ,
, ,
Abstract
:1. Introduction
2. Materials and Methods
2.1. Animals
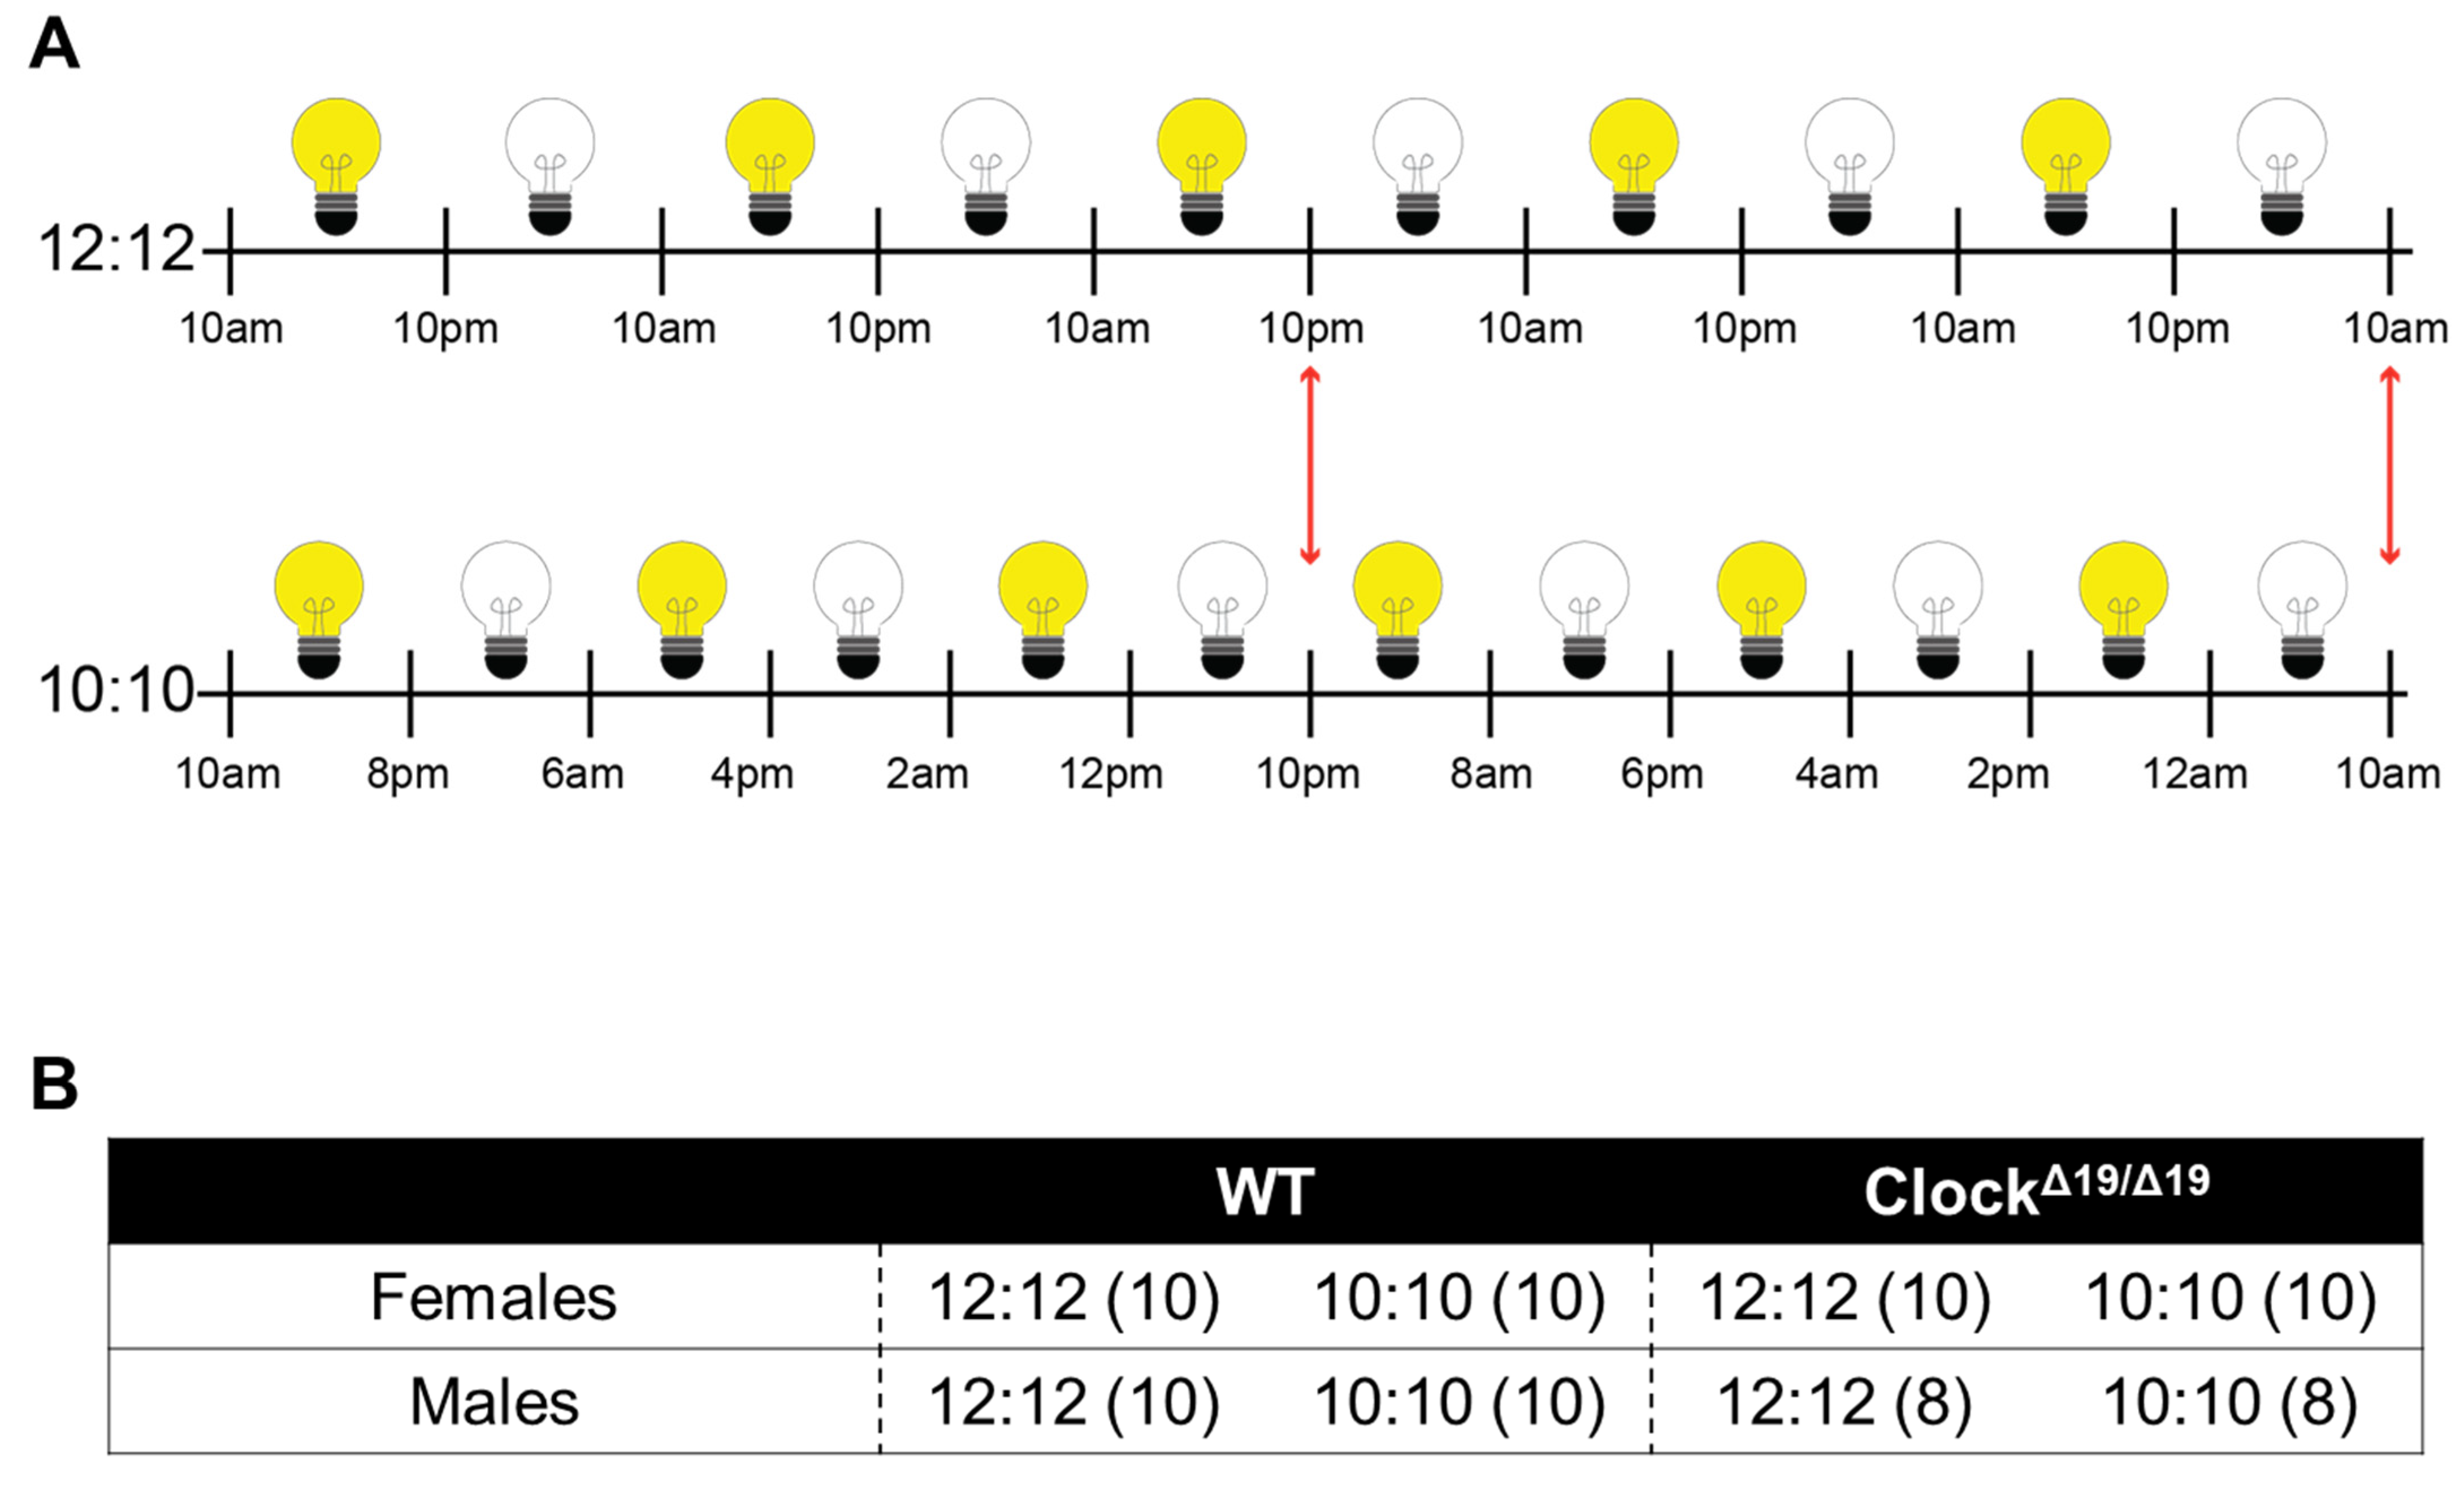
2.2. Diurnal Cycles
2.3. Two-Bottle Choice Paradigm
2.4. Daily Measures
2.5. Statistical Analysis
3. Results
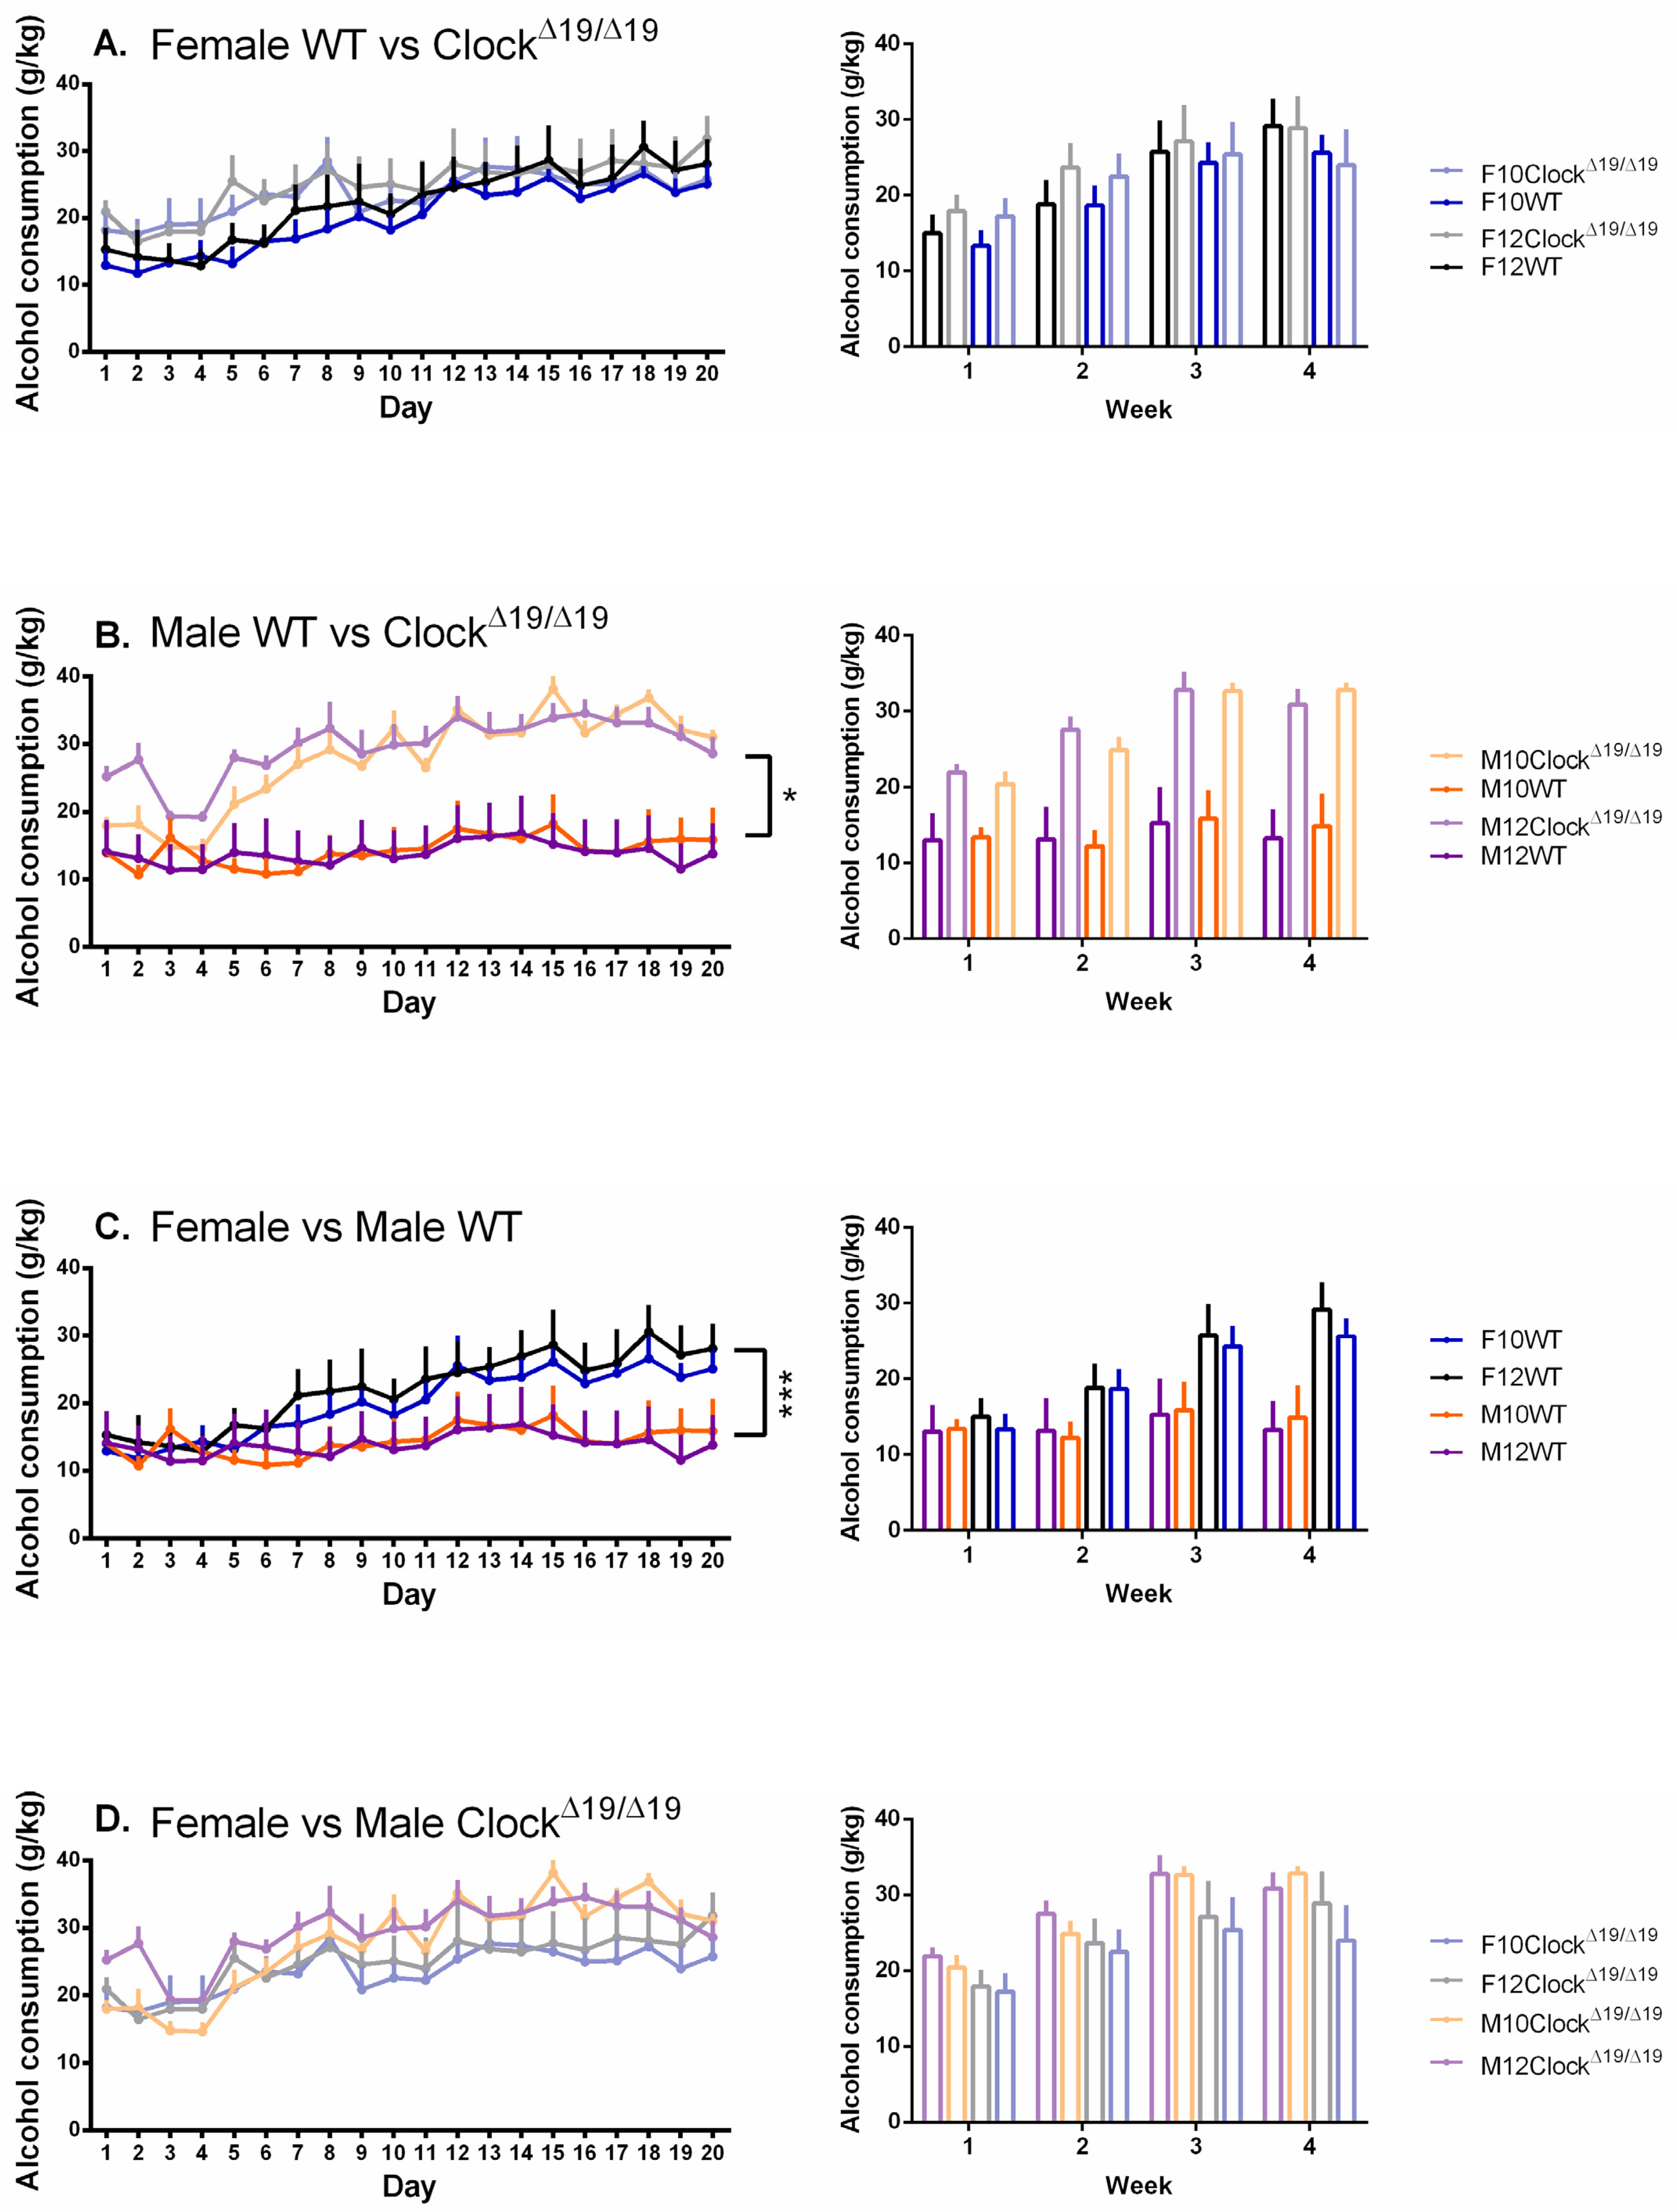
3.1. Alcohol Consumption
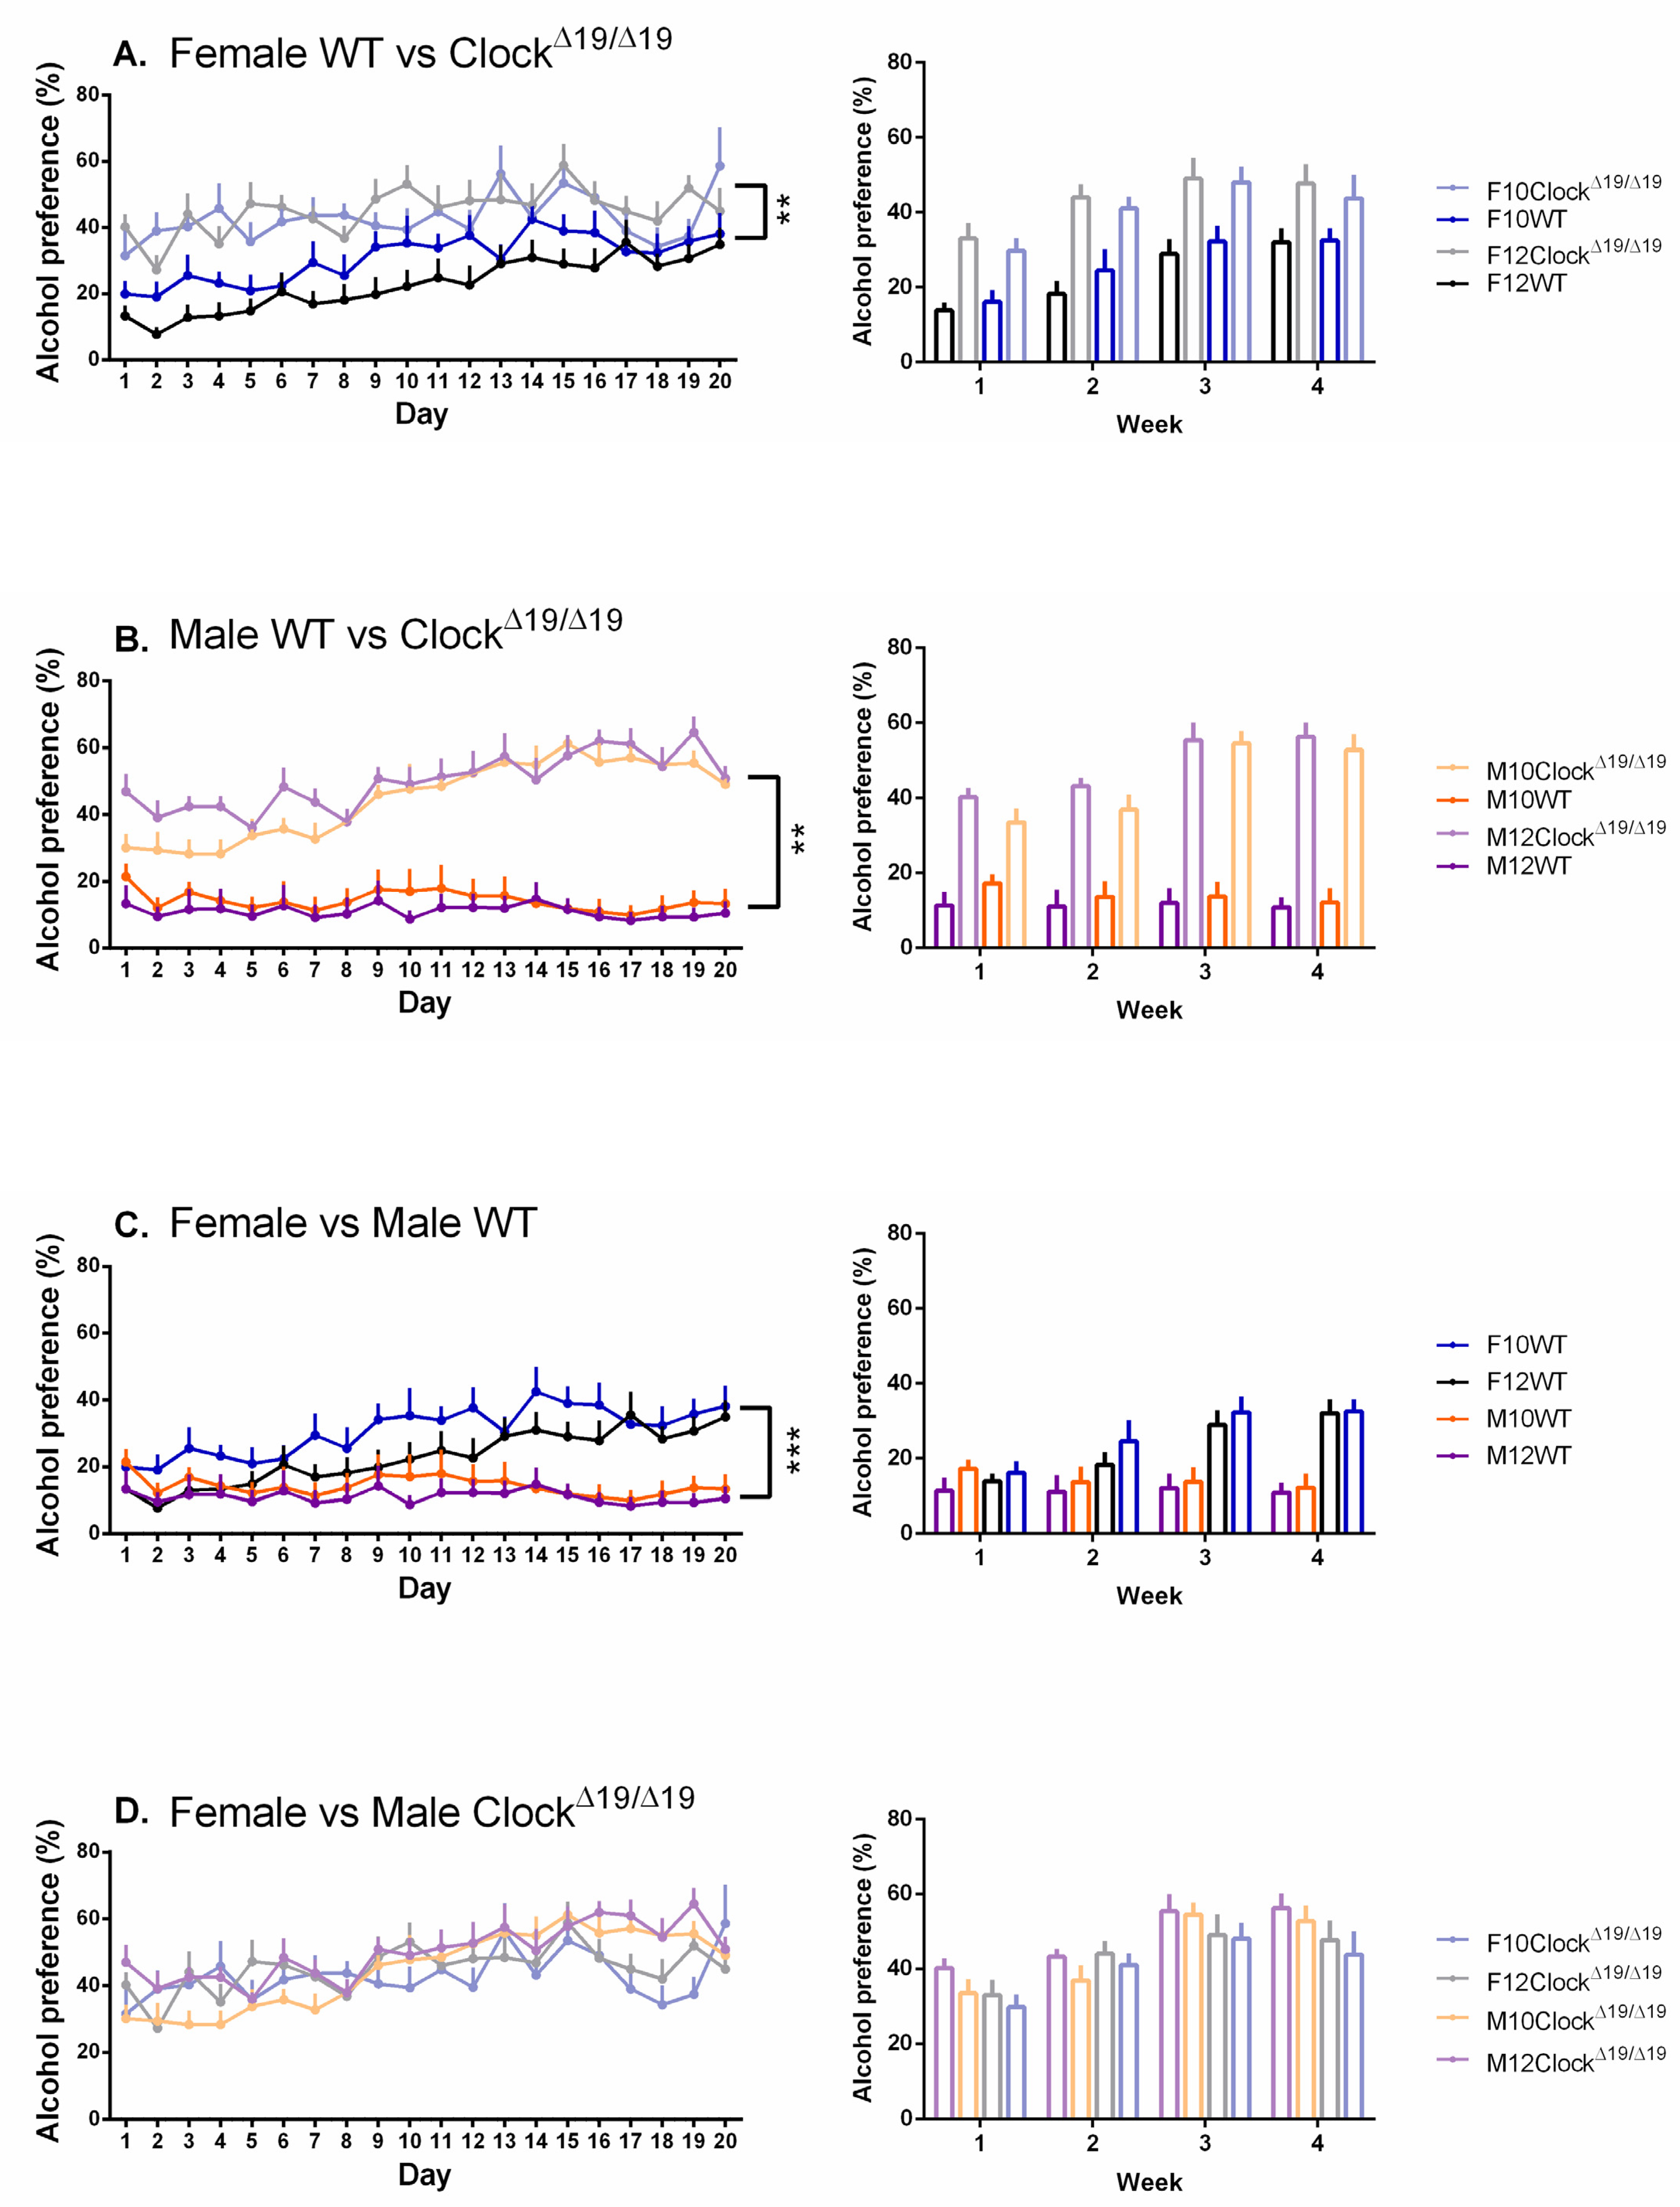
3.2. Alcohol Preference
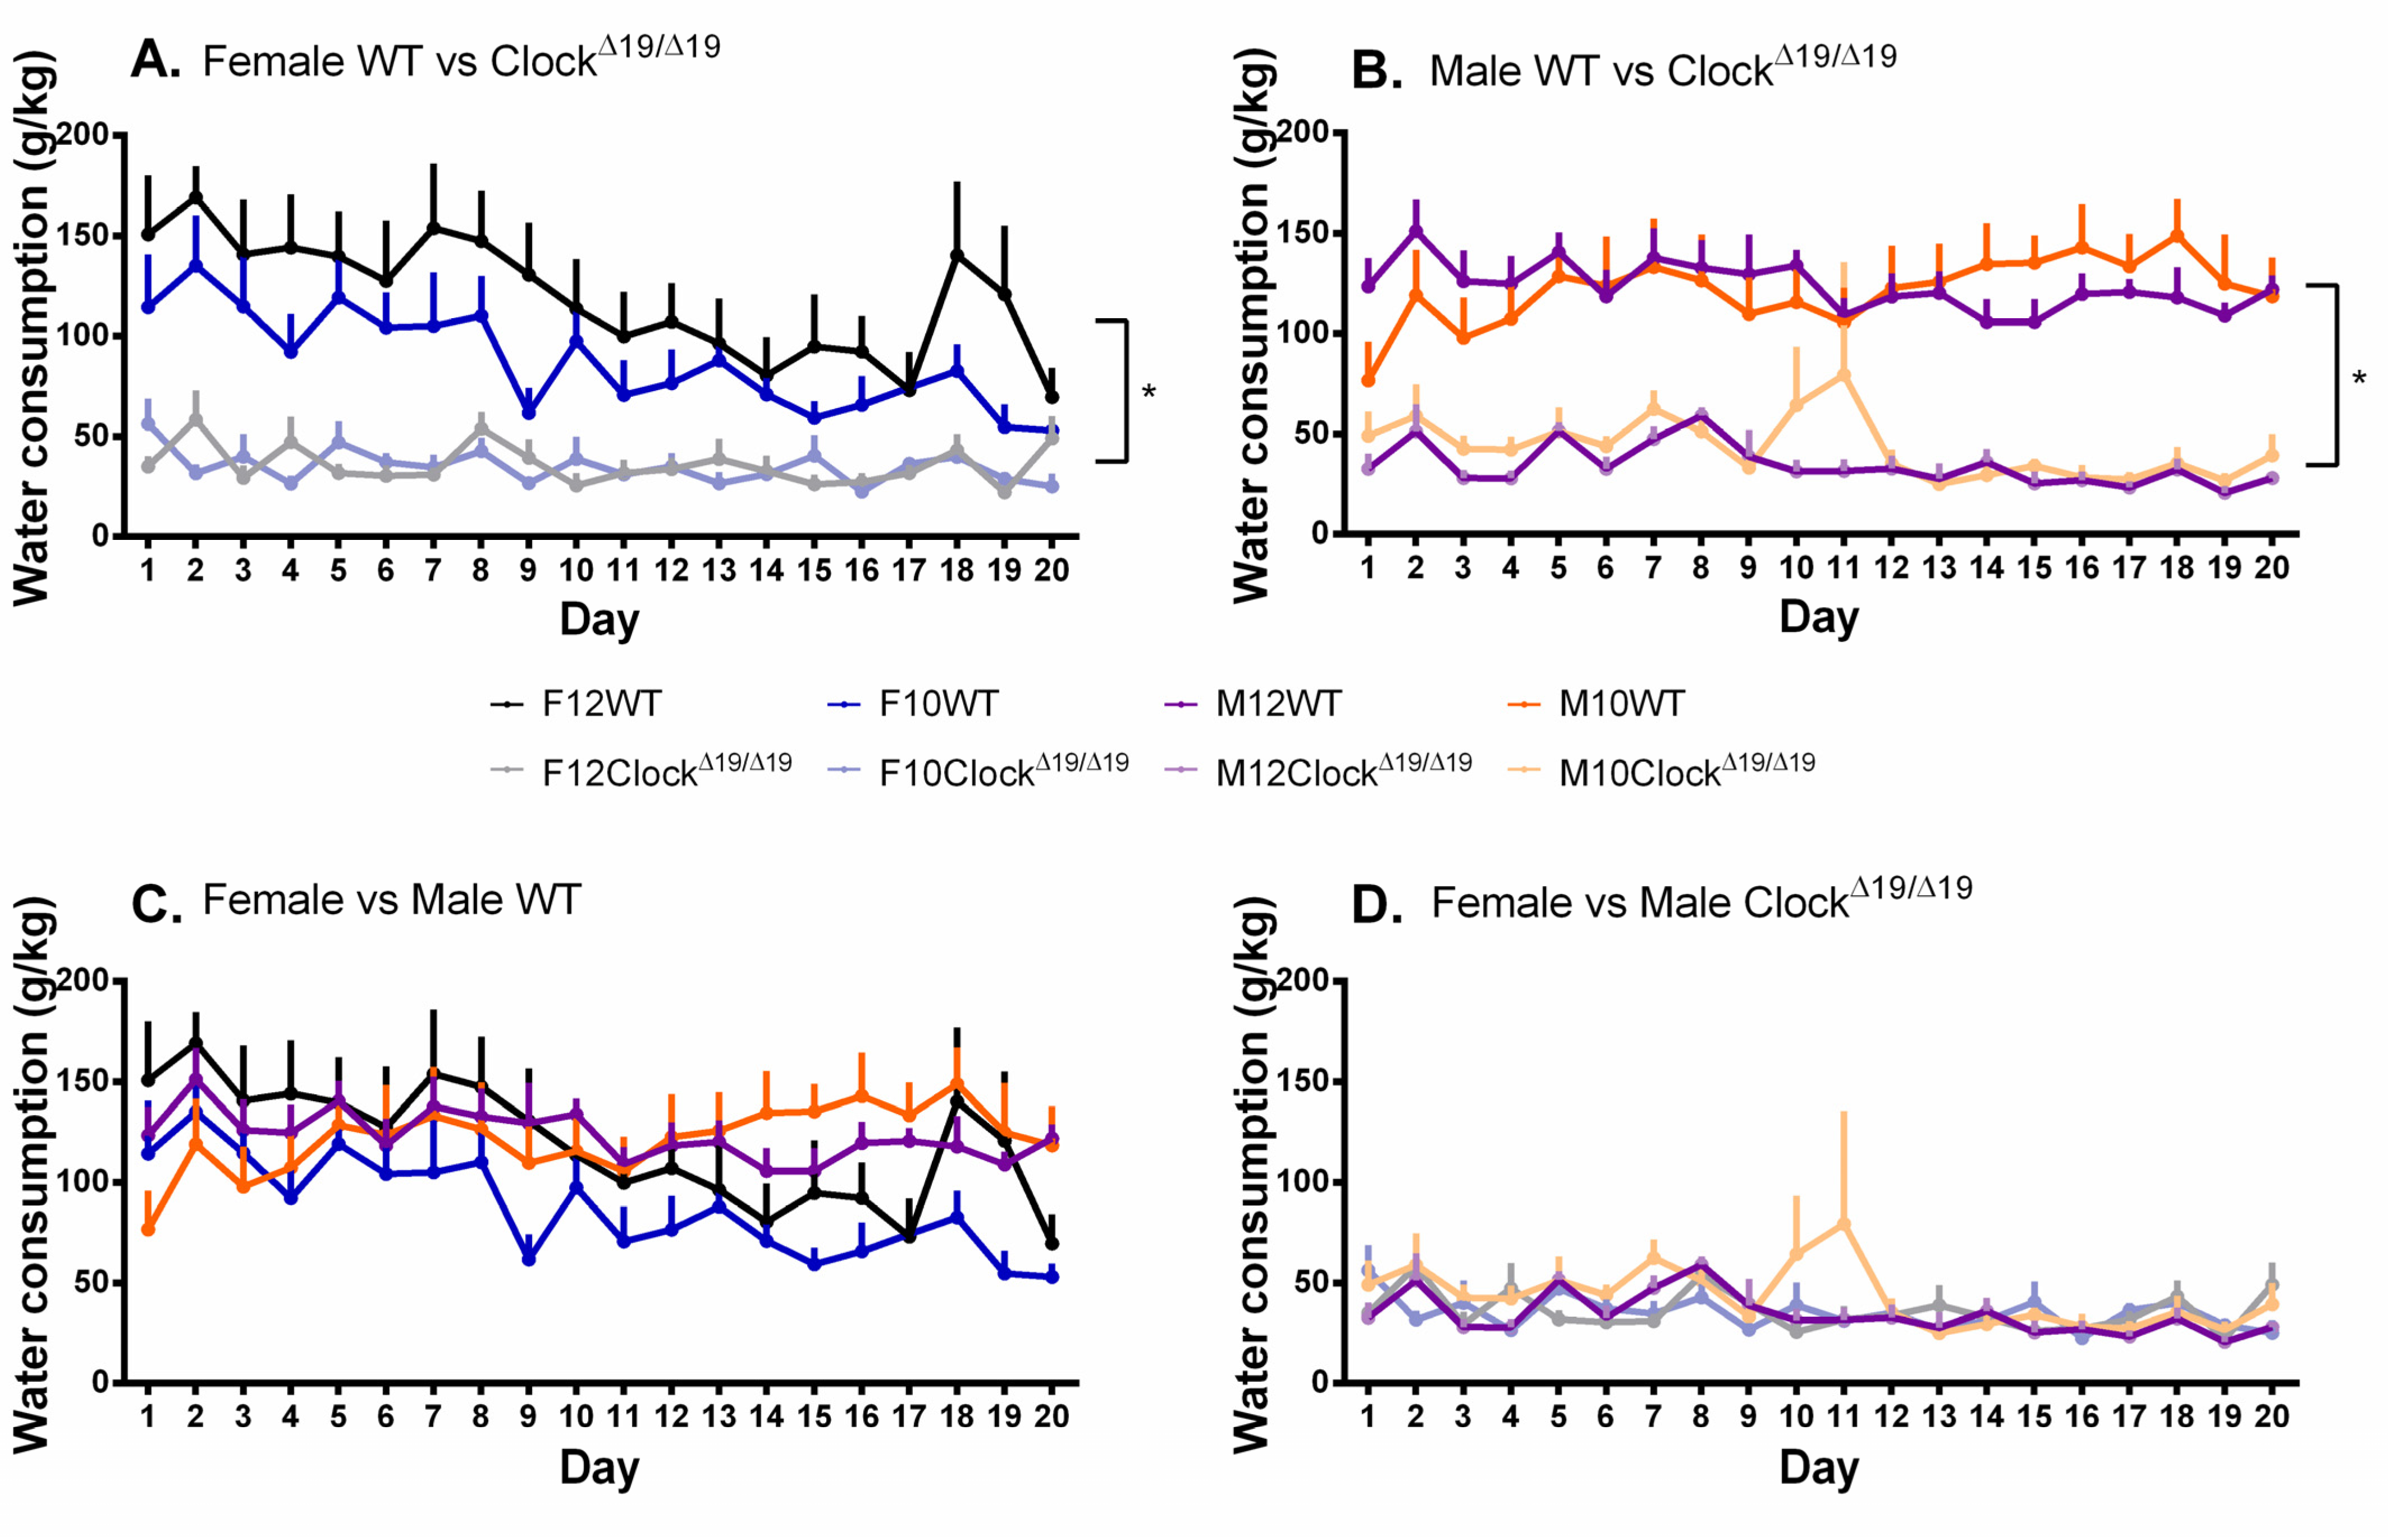
3.3. Water Consumption
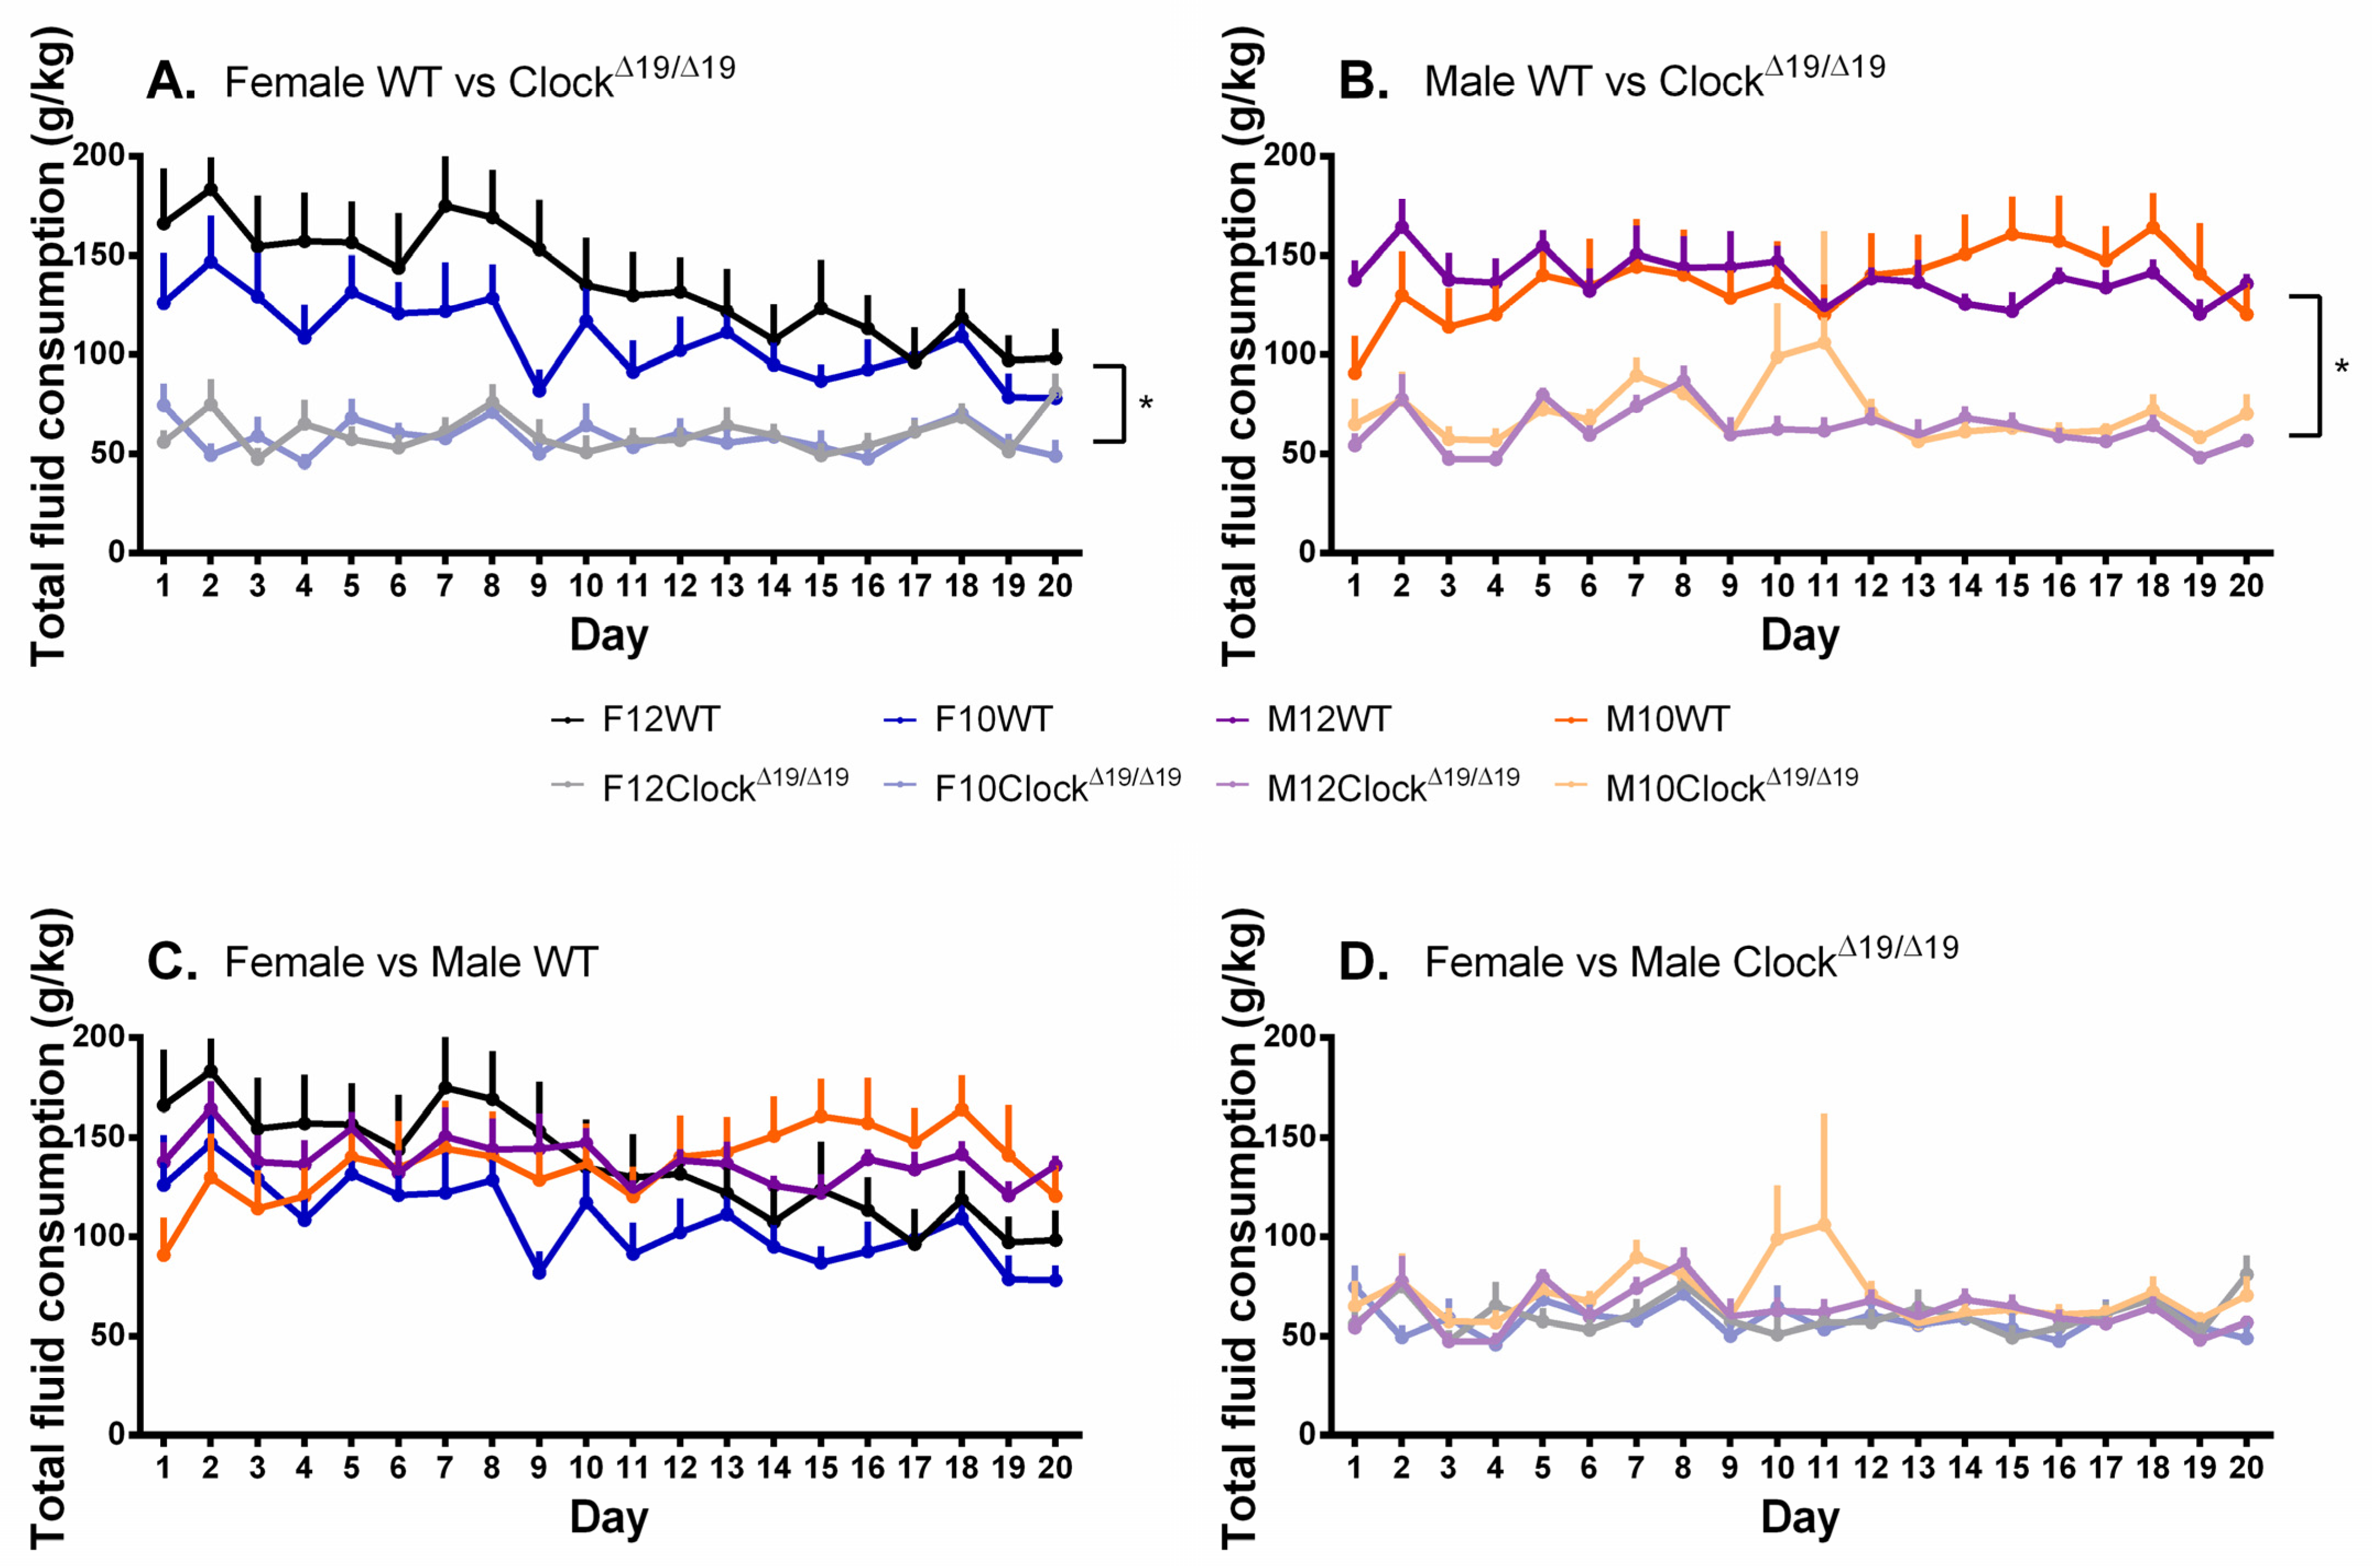
3.4. Total Fluid Consumption
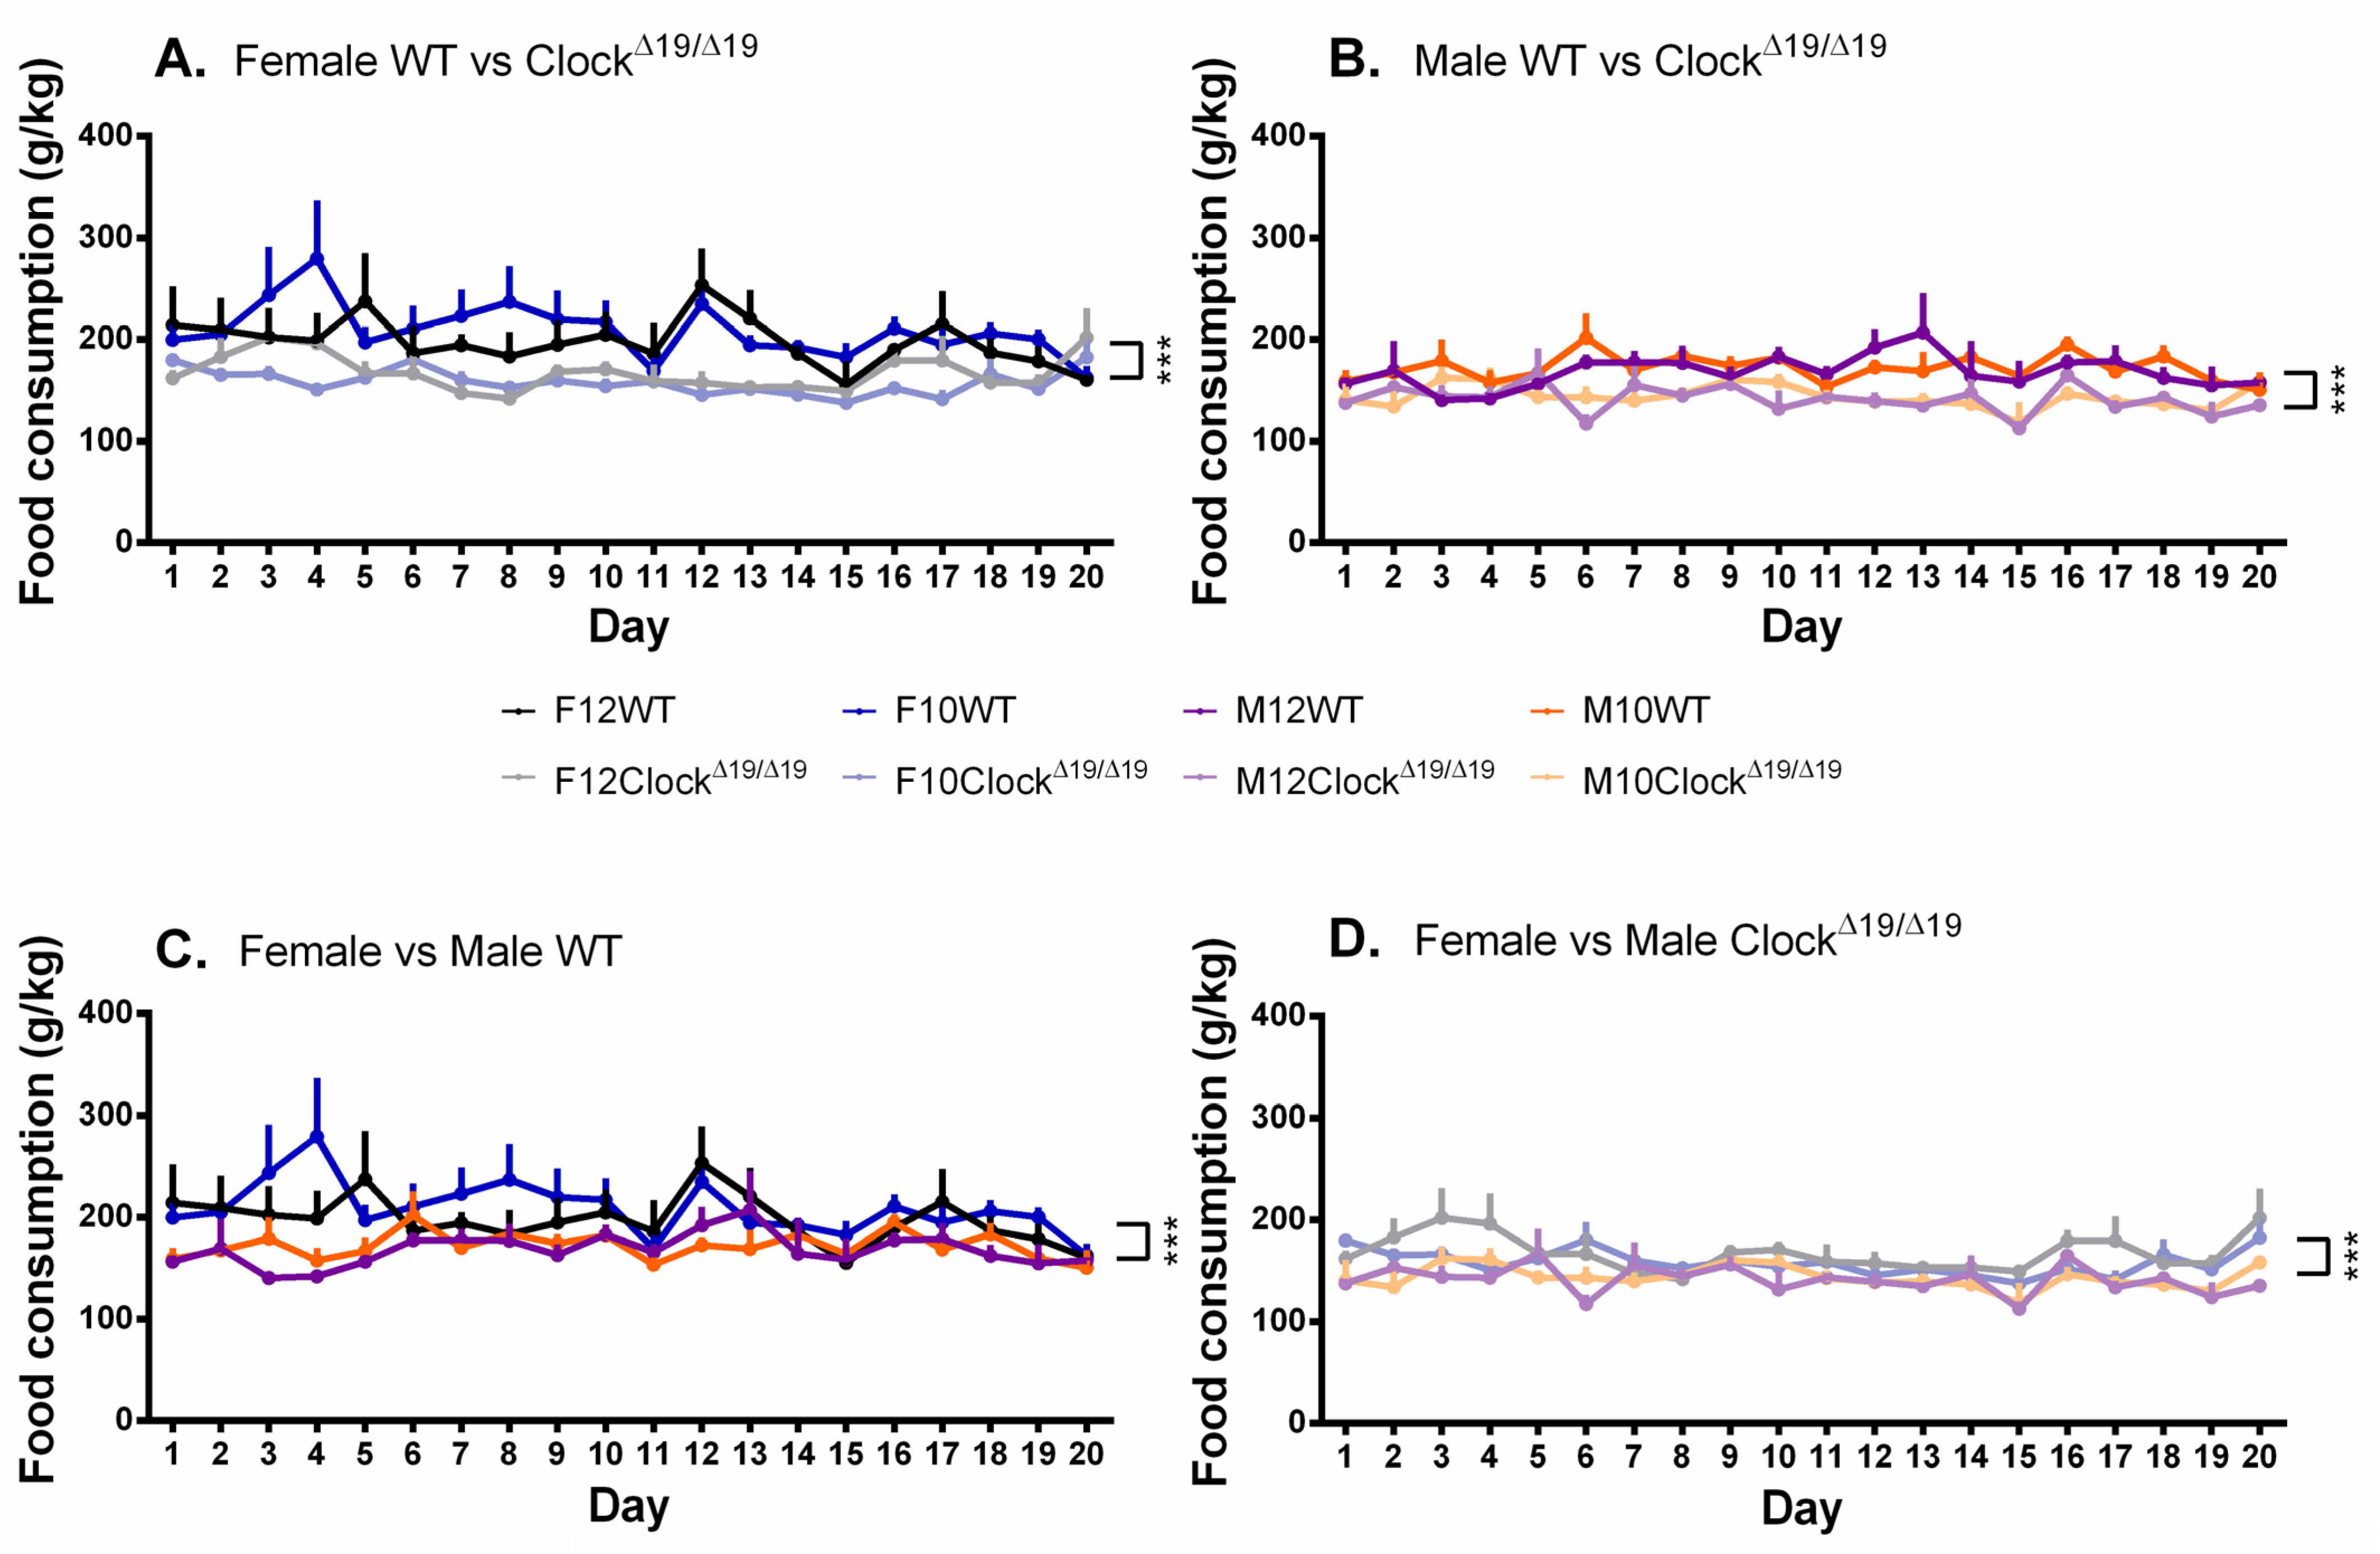
3.5. Food Consumption
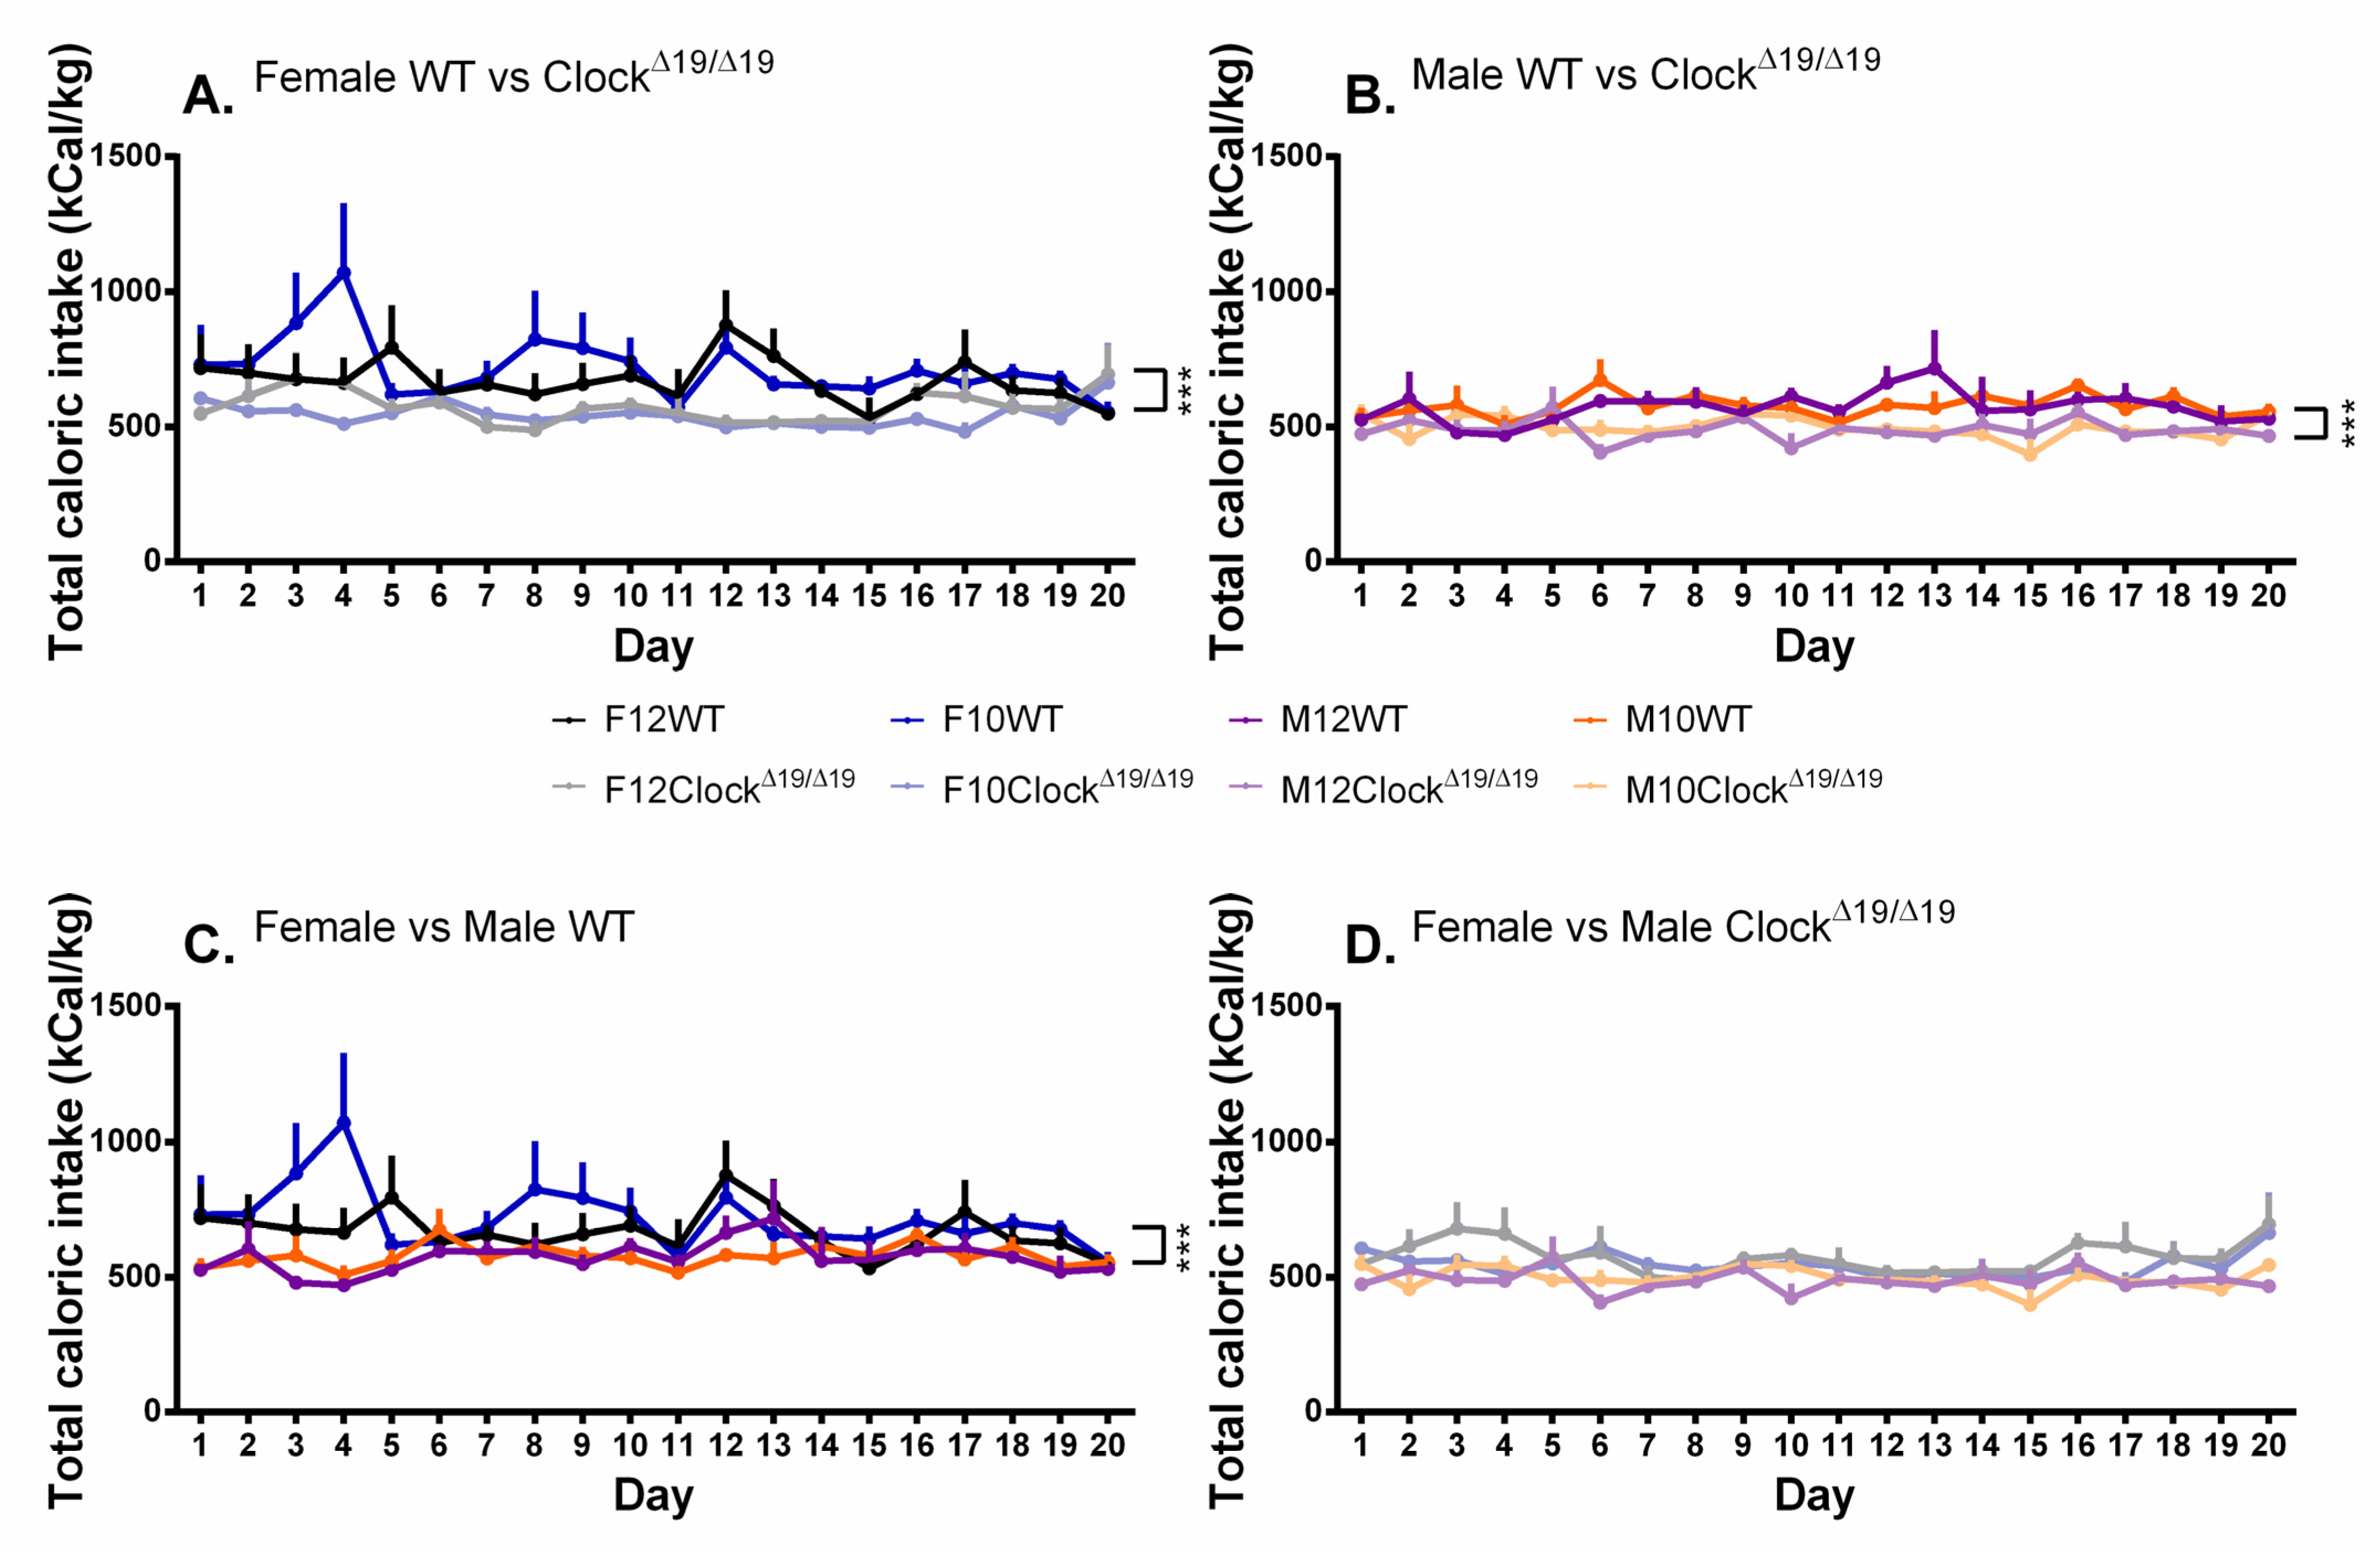
3.6. Caloric Intake
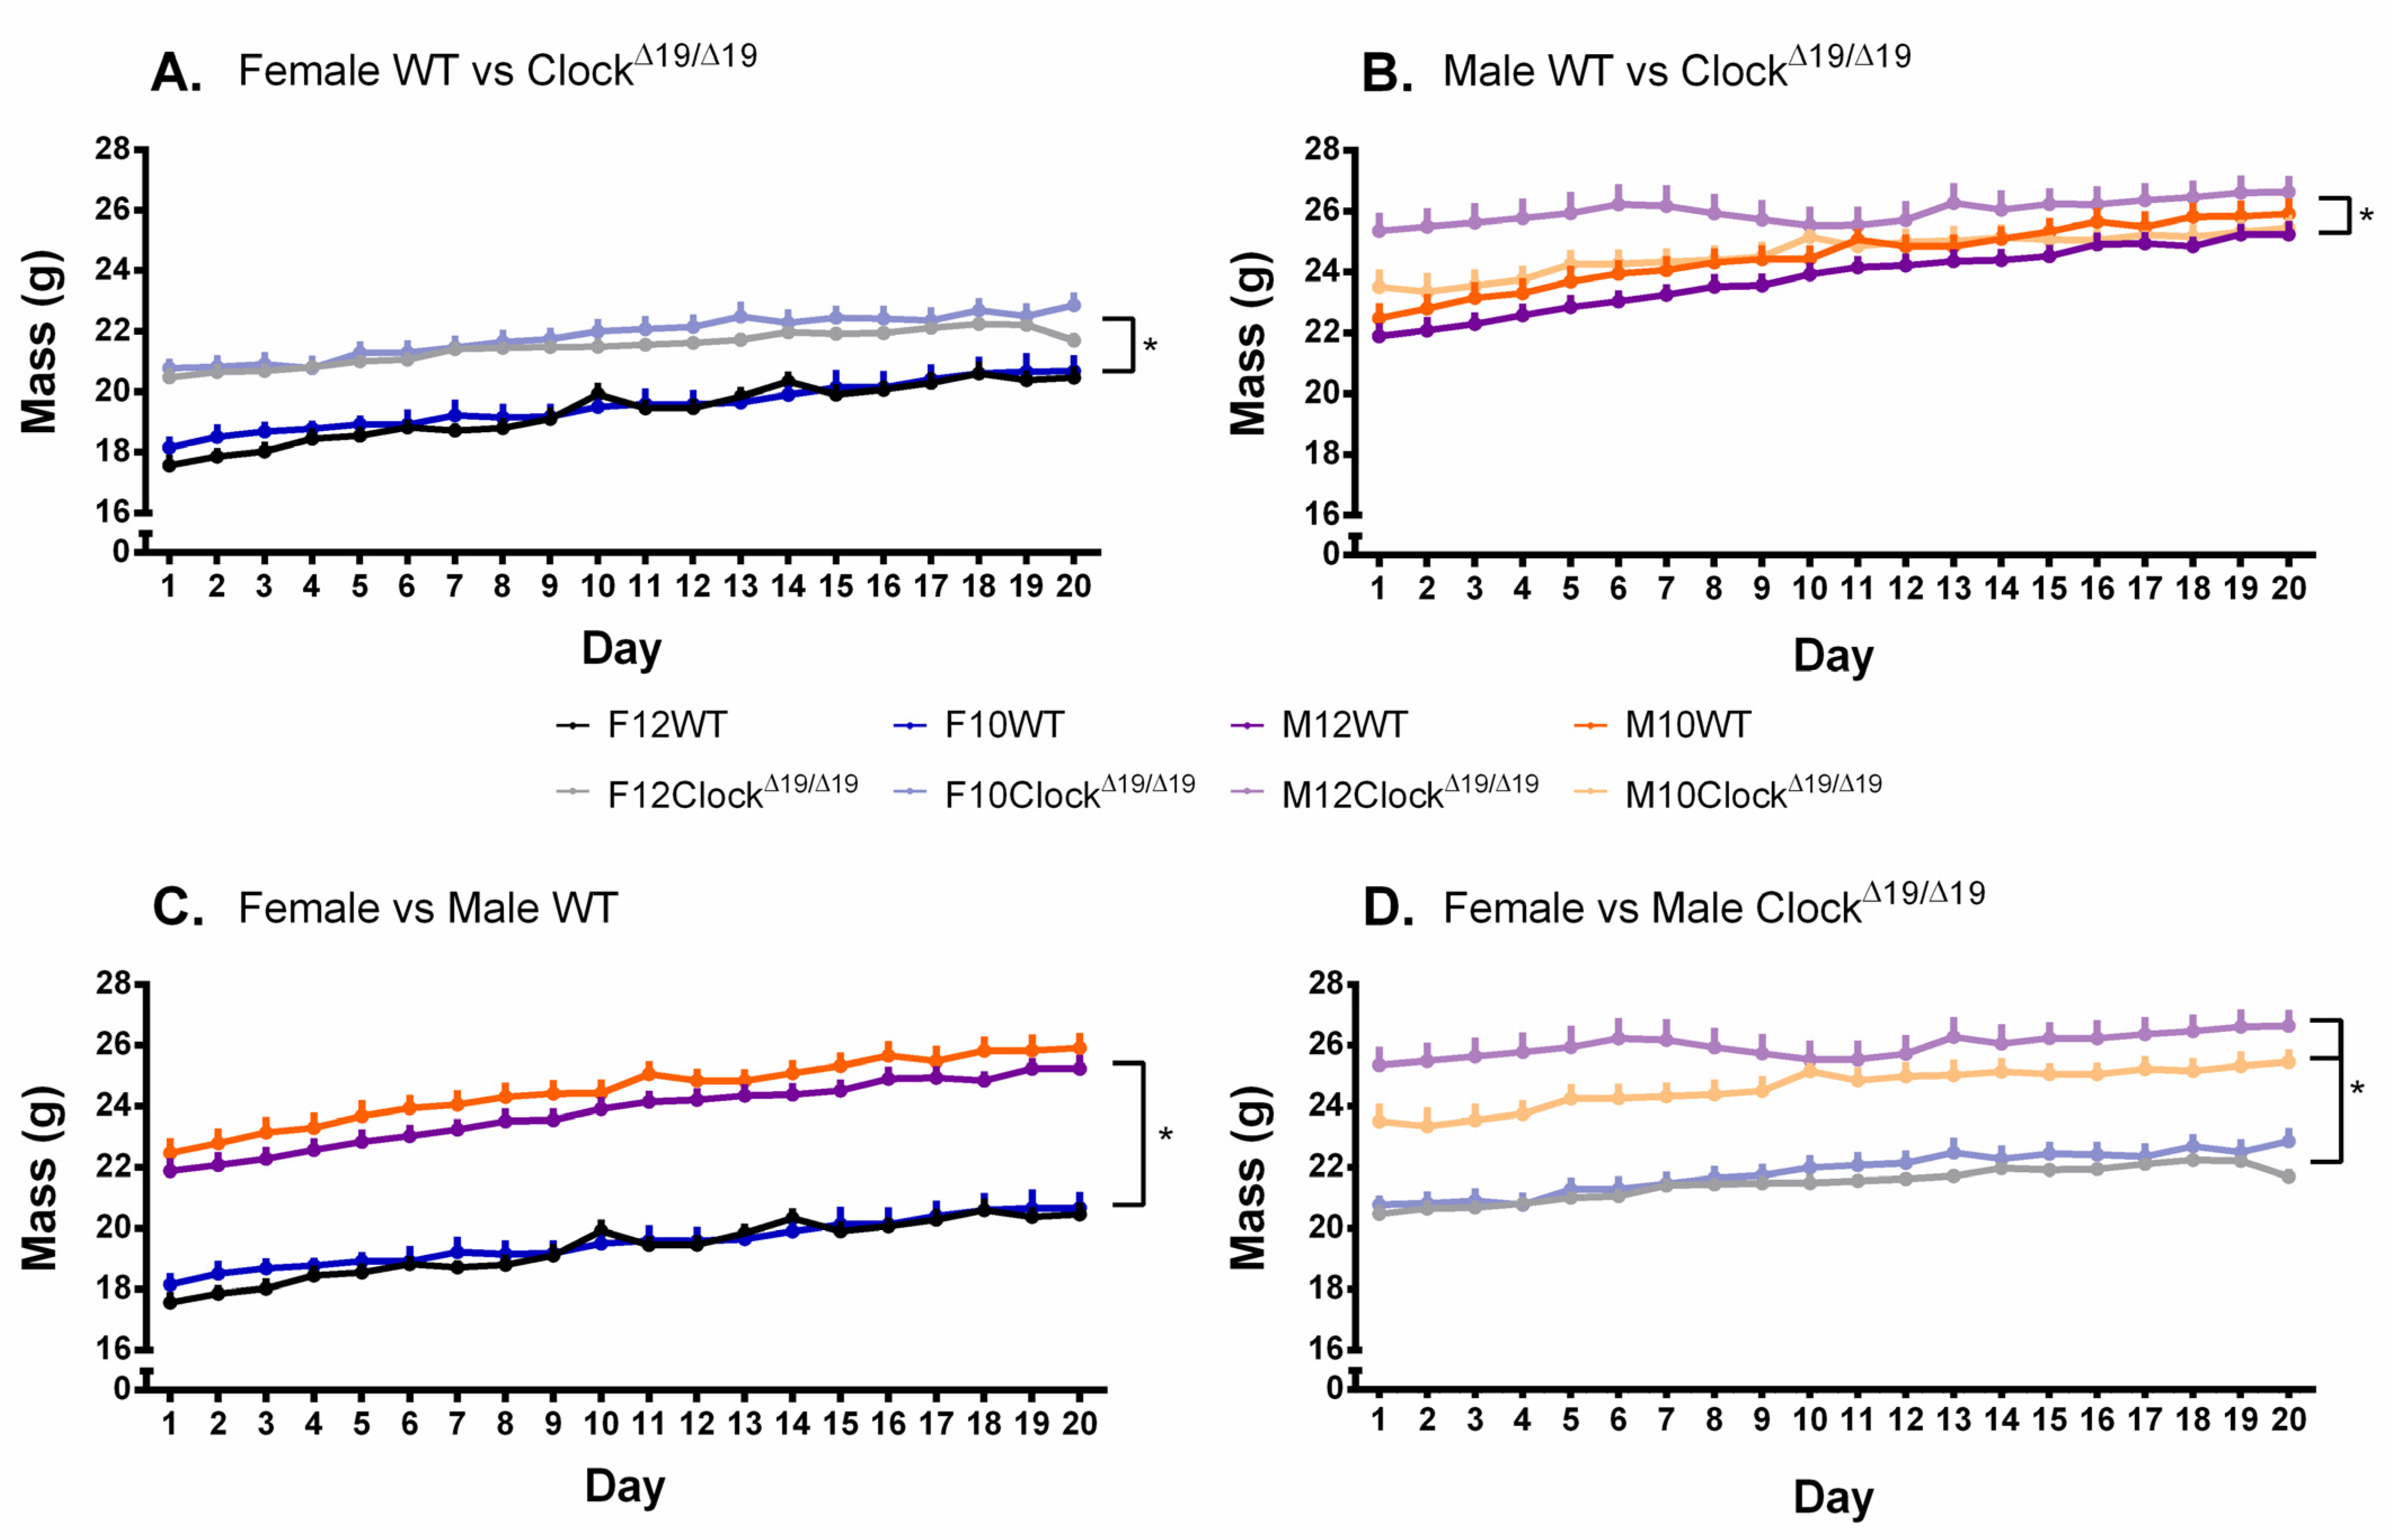
3.7. Body Weight
4. Discussion
5. Conclusions
Author Contributions
Funding
Institutional Review Board Statement
Data Availability Statement
Conflicts of Interest
References
- Richter, K.; Peter, L.; Rodenbeck, A.; Weess, H.G.; Riedel-Heller, S.G.; Hillemacher, T. Shiftwork and Alcohol Consumption: A Systematic Review of the Literature. Eur. Addict. Res. 2021, 27, 9–15. [Google Scholar] [CrossRef] [PubMed]
- Dorrian, J.; Skinner, N. Alcohol consumption patterns of shiftworkers compared with dayworkers. Chronobiol. Int. 2012, 29, 610–618. [Google Scholar] [CrossRef] [PubMed]
- Dorrian, J.; Heath, G.; Sargent, C.; Banks, S.; Coates, A. Alcohol use in shiftworkers. Accid. Anal. Prev. 2017, 99, 395–400. [Google Scholar] [CrossRef] [PubMed]
- Chatti, S.; Debbabi, F.; Ben Abdelaziz, A.; Harbaoui, R.; Ghannem, H.; Mrizak, N. Facteurs de risque cardiovasculaire chez les travailleurs postés d’une centrale de production d’électricité au centre tunisien. Ann. Cardiol. Et D’angéiologie 2010, 59, 190–195. [Google Scholar] [CrossRef] [PubMed]
- Morikawa, Y.; Sakurai, M.; Nakamura, K.; Nagasawa, S.-Y.; Ishizaki, M.; Kido, T.; Naruse, Y.; Nakagawa, H. Correlation between Shift-work-related Sleep Problems and Heavy Drinking in Japanese Male Factory Workers. Alcohol Alcohol. 2013, 48, 202–206. [Google Scholar] [CrossRef] [PubMed] [Green Version]
- Buchvold, H.V.; Pallesen, S.; Øyane, N.M.F.; Bjorvatn, B. Associations between night work and BMI, alcohol, smoking, caffeine and exercise—A cross-sectional study. BMC Public Health 2015, 15, 1112. [Google Scholar] [CrossRef] [Green Version]
- Kivimäki, M.; Kuisma, P.; Virtanen, M.; Elovainio, M. Does shift work lead to poorer health habits? A comparison between women who had always done shift work with those who had never done shift work. Work Stress 2001, 15, 3–13. [Google Scholar] [CrossRef]
- Partonen, T. Clock genes in human alcohol abuse and comorbid conditions. Alcohol 2015, 49, 359–365. [Google Scholar] [CrossRef]
- Evans, J.; Silver, R. The suprachiasmatic nucleus and the circadian timekeeping system of the body. In Neuroscience in the 21st Century; Springer: New York, NY, USA, 2015; pp. 1–49. [Google Scholar]
- Hasan, S.; Foster, R.G.; Vyazovskiy, V.V.; Peirson, S.N. Effects of circadian misalignment on sleep in mice. Sci. Rep. 2018, 8, 15343. [Google Scholar] [CrossRef]
- Brager, A.J.; Ehlen, J.C.; Castanon-Cervantes, O.; Natarajan, D.; Delisser, P.; Davidson, A.J.; Paul, K.N. Sleep loss and the inflammatory response in mice under chronic environmental circadian disruption. PLoS ONE 2013, 8, e63752. [Google Scholar] [CrossRef] [Green Version]
- Martino, T.A.; Tata, N.; Belsham, D.D.; Chalmers, J.; Straume, M.; Lee, P.; Pribiag, H.; Khaper, N.; Liu, P.P.; Dawood, F.; et al. Disturbed Diurnal Rhythm Alters Gene Expression and Exacerbates Cardiovascular Disease With Rescue by Resynchronization. Hypertension 2007, 49, 1104–1113. [Google Scholar] [CrossRef] [PubMed]
- Rosenwasser, A.M.; Fixaris, M.C.; McCulley, W.D. Photoperiodic modulation of voluntary ethanol intake in C57BL/6 mice. Physiol. Behav. 2015, 147, 342–347. [Google Scholar] [CrossRef] [PubMed]
- Trujillo, J.L.; Do, D.T.; Grahame, N.J.; Roberts, A.J.; Gorman, M.R. Ethanol consumption in mice: Relationships with circadian period and entrainment. Alcohol 2011, 45, 147–159. [Google Scholar] [CrossRef] [PubMed] [Green Version]
- Rosenwasser, A.M.; Clark, J.W.; Fixaris, M.C.; Belanger, G.V.; Foster, J.A. Effects of repeated light–dark phase shifts on voluntary ethanol and water intake in male and female Fischer and Lewis rats. Alcohol 2010, 44, 229–237. [Google Scholar] [CrossRef]
- Van Enkhuizen, J.; Minassian, A.; Young, J.W. Further evidence for ClockΔ19 mice as a model for bipolar disorder mania using cross-species tests of exploration and sensorimotor gating. Behav. Brain Res. 2013, 249, 44–54. [Google Scholar] [CrossRef] [Green Version]
- Sujino, M.; Asakawa, T.; Nagano, M.; Koinuma, S.; Masumoto, K.-H.; Shigeyoshi, Y. CLOCKΔ19 mutation modifies the manner of synchrony among oscillation neurons in the suprachiasmatic nucleus. Sci. Rep. 2018, 8, 854. [Google Scholar] [CrossRef] [Green Version]
- Kristensen, M.; Nierenberg, A.A.; Ostergaard, S.D. Face and predictive validity of the ClockDelta19 mouse as an animal model for bipolar disorder: A systematic review. Mol. Psychiatry 2018, 23, 70–80. [Google Scholar] [CrossRef]
- Vitaterna, M.H.; King, D.P.; Chang, A.M.; Kornhauser, J.M.; Lowrey, P.L.; McDonald, J.D.; Dove, W.F.; Pinto, L.H.; Turek, F.W.; Takahashi, J.S. Mutagenesis and mapping of a mouse gene, Clock, essential for circadian behavior. Science 1994, 264, 719–725. [Google Scholar] [CrossRef] [Green Version]
- King, D.P.; Vitaterna, M.H.; Chang, A.M.; Dove, W.F.; Pinto, L.H.; Turek, F.W.; Takahashi, J.S. The mouse Clock mutation behaves as an antimorph and maps within the W19H deletion, distal of Kit. Genetics 1997, 146, 1049–1060. [Google Scholar] [CrossRef]
- Naylor, E.; Bergmann, B.M.; Krauski, K.; Zee, P.C.; Takahashi, J.S.; Vitaterna, M.H.; Turek, F.W. The circadian clock mutation alters sleep homeostasis in the mouse. J. Neurosci. 2000, 20, 8138–8143. [Google Scholar] [CrossRef] [Green Version]
- Duong, A.T.H.; Reitz, C.J.; Louth, E.L.; Creighton, S.D.; Rasouli, M.; Zwaiman, A.; Kroetsch, J.T.; Bolz, S.S.; Winters, B.D.; Bailey, C.D.C.; et al. The Clock Mechanism Influences Neurobiology and Adaptations to Heart Failure in Clock(19/19) Mice With Implications for Circadian Medicine. Sci. Rep. 2019, 9, 4994. [Google Scholar] [CrossRef] [PubMed] [Green Version]
- Udoh, U.S.; Swain, T.M.; Filiano, A.N.; Gamble, K.L.; Young, M.E.; Bailey, S.M. Chronic ethanol consumption disrupts diurnal rhythms of hepatic glycogen metabolism in mice. Am. J. Physiol. Gastrointest. Liver Physiol. 2015, 308, G964–G974. [Google Scholar] [CrossRef] [PubMed]
- Ruby, C.L.; Palmer, K.N.; Zhang, J.; Risinger, M.O.; Butkowski, M.A.; Swartzwelder, H.S. Differential Sensitivity to Ethanol-Induced Circadian Rhythm Disruption in Adolescent and Adult Mice. Alcohol. Clin. Exp. Res. 2017, 41, 187–196. [Google Scholar] [CrossRef] [PubMed]
- Hofstetter, J.R.; Grahame, N.J.; Mayeda, A.R. Circadian activity rhythms in high-alcohol-preferring and low-alcohol-preferring mice. Alcohol 2003, 30, 81–85. [Google Scholar] [CrossRef]
- Rosenwasser, A.M.; Fecteau, M.E.; Logan, R.W.; Reed, J.D.; Cotter, S.J.; Seggio, J.A. Circadian activity rhythms in selectively bred ethanol-preferring and nonpreferring rats. Alcohol 2005, 36, 69–81. [Google Scholar] [CrossRef]
- Ozburn, A.R.; Falcon, E.; Mukherjee, S.; Gillman, A.; Arey, R.; Spencer, S.; McClung, C.A. The role of clock in ethanol-related behaviors. Neuropsychopharmacology 2013, 38, 2393–2400. [Google Scholar] [CrossRef] [Green Version]
- Yan, L.; Silver, R. Neuroendocrine underpinnings of sex differences in circadian timing systems. J. Steroid Biochem. Mol. Biol. 2016, 160, 118–126. [Google Scholar] [CrossRef] [Green Version]
- Clark, J.W.; Fixaris, M.C.; Belanger, G.V.; Rosenwasser, A.M. Repeated Light?Dark Phase Shifts Modulate Voluntary Ethanol Intake in Male and Female High Alcohol-Drinking (HAD1) Rats. Alcohol. Clin. Exp. Res. 2007, 31, 1699–1706. [Google Scholar] [CrossRef]
- Priddy, B.M.; Carmack, S.A.; Thomas, L.C.; Vendruscolo, J.C.M.; Koob, G.F.; Vendruscolo, L.F. Sex, strain, and estrous cycle influences on alcohol drinking in rats. Pharmacol. Biochem. Behav. 2017, 152, 61–67. [Google Scholar] [CrossRef] [Green Version]
- Cailhol, S.; Mormède, P. Sex and strain differences in ethanol drinking: Effects of gonadectomy. Alcohol. Clin. Exp. Res. 2001, 25, 594–599. [Google Scholar] [CrossRef]
- Alibhai, F.J.; Reitz, C.J.; Peppler, W.T.; Basu, P.; Sheppard, P.; Choleris, E.; Bakovic, M.; Martino, T.A. Female ClockDelta19/Delta19 mice are protected from the development of age-dependent cardiomyopathy. Cardiovasc. Res. 2018, 114, 259–271. [Google Scholar] [CrossRef] [PubMed]
- Alibhai, F.J.; Tsimakouridze, E.V.; Chinnappareddy, N.; Wright, D.C.; Billia, F.; O’Sullivan, M.L.; Pyle, W.G.; Sole, M.J.; Martino, T.A. Short-term disruption of diurnal rhythms after murine myocardial infarction adversely affects long-term myocardial structure and function. Circ. Res. 2014, 114, 1713–1722. [Google Scholar] [CrossRef] [PubMed] [Green Version]
- Lesscher, H.; Spoelder, M.; Rotte, M.D.; Janssen, M.J.; Hesseling, P.; Lozeman-van’t Klooster, J.G.; Baars, A.M.; Vanderschuren, L.J. Early social isolation augments alcohol consumption in rats. Behav. Pharmacol. 2015, 26, 673–680. [Google Scholar] [CrossRef] [PubMed] [Green Version]
- Hamidullah, S.; Lutelmowski, C.D.; Creighton, S.D.; Luciani, K.R.; Frie, J.A.; Winters, B.D.; Khokhar, J. Effects of vapourized THC and voluntary alcohol drinking during adolescence on cognition, reward, and anxiety-like behaviours in rats. Prog. Neuro-Psychopharmacol. Biol. Psychiatry 2020, 106, 110141. [Google Scholar] [CrossRef] [PubMed]
- Ruffolo, J.; Frie, J.A.; Thorpe, H.H.A.; Talhat, M.A.; Khokhar, J.Y. Alcohol and Vaporized Nicotine Co-Exposure During Adolescence Contribute Differentially to Sex-Specific Behavioral Effects in Adulthood. Nicotine Tob. Res. Off. J. Soc. Res. Nicotine Tob. 2021. [Google Scholar] [CrossRef] [PubMed]
- Li, J.; Chen, P.; Han, X.; Zuo, W.; Mei, Q.; Bian, E.Y.; Umeugo, J.; Ye, J. Differences between male and female rats in alcohol drinking, negative affects and neuronal activity after acute and prolonged abstinence. Int. J. Physiol. Pathophysiol. Pharmacol. 2019, 11, 163. [Google Scholar]
- Juárez, J.; De Tomasi, E.B. Sex Differences in Alcohol Drinking Patterns During Forced and Voluntary Consumption in Rats. Alcohol 1999, 19, 15–22. [Google Scholar] [CrossRef]
- Strong, M.N.; Yoneyama, N.; Fretwell, A.M.; Snelling, C.; Tanchuck, M.A.; Finn, D.A. “Binge” drinking experience in adolescent mice shows sex differences and elevated ethanol intake in adulthood. Horm. Behav. 2010, 58, 82–90. [Google Scholar] [CrossRef] [Green Version]
- Gelineau, R.R.; Arruda, N.L.; Hicks, J.A.; Monteiro De Pina, I.; Hatzidis, A.; Seggio, J.A. The behavioral and physiological effects of high-fat diet and alcohol consumption: Sex differences in C57BL6/J mice. Brain Behav. 2017, 7, e00708. [Google Scholar] [CrossRef]
- Sneddon, E.A.; White, R.D.; Radke, A.K. Sex Differences in Binge-Like and Aversion-Resistant Alcohol Drinking in C57BL/6J Mice. Alcohol. Clin. Exp. Res. 2019, 43, 243–249. [Google Scholar] [CrossRef]
- Mezey, E.; Sharma, S.; Rennie, L.; Potter, J.J. Sex differences in gastric alcohol dehydrogenase activity in Sprague-Dawley rats. Gastroenterology 1992, 103, 1804–1810. [Google Scholar] [CrossRef]
- Clarke, S.N.; Ossenkopp, K.-P. Taste reactivity responses in rats: Influence of sex and the estrous cycle. Am. J. Physiol.-Regul. Integr. Comp. Physiol. 1998, 274, R718–R724. [Google Scholar] [CrossRef] [PubMed]
- Lancaster, F.E. Gender differences in the brain: Implications for the study of human alcoholism. Alcohol. Clin. Exp. Res. 1994, 18, 740–746. [Google Scholar] [CrossRef] [PubMed]
- Blanchard, B.A.; Steindorf, S.; Wang, S.; LeFevre, R.; Mankes, R.F.; Glick, S.D. Prenatal ethanol exposure alters ethanol-induced dopamine release in nucleus accumbens and striatum in male and female rats. Alcohol. Clin. Exp. Res. 1993, 17, 974–981. [Google Scholar] [CrossRef]
- Lamia, K.A.; Papp, S.J.; Yu, R.T.; Barish, G.D.; Uhlenhaut, N.H.; Jonker, J.W.; Downes, M.; Evans, R.M. Cryptochromes mediate rhythmic repression of the glucocorticoid receptor. Nature 2011, 480, 552–556. [Google Scholar] [CrossRef]
- Balsalobre, A. Resetting of Circadian Time in Peripheral Tissues by Glucocorticoid Signaling. Science 2000, 289, 2344–2347. [Google Scholar] [CrossRef] [Green Version]
- Belknap, J.K.; Crabbe, J.C.; Young, E.R. Voluntary consumption of ethanol in 15 inbred mouse strains. Psychopharmacology 1993, 112, 503–510. [Google Scholar] [CrossRef]
- Yoneyama, N.; Crabbe, J.C.; Ford, M.M.; Murillo, A.; Finn, D.A. Voluntary ethanol consumption in 22 inbred mouse strains. Alcohol 2008, 42, 149–160. [Google Scholar] [CrossRef] [Green Version]
- McClung, C.A.; Sidiropoulou, K.; Vitaterna, M.; Takahashi, J.S.; White, F.J.; Cooper, D.C.; Nestler, E.J. Regulation of dopaminergic transmission and cocaine reward by the Clock gene. Proc. Natl. Acad. Sci. USA 2005, 102, 9377–9381. [Google Scholar] [CrossRef] [Green Version]
- Ozburn, A.R.; Larson, E.B.; Self, D.W.; McClung, C.A. Cocaine self-administration behaviors in ClockΔ19 mice. Psychopharmacology 2012, 223, 169–177. [Google Scholar] [CrossRef] [Green Version]
- Parekh, P.K.; Ozburn, A.R.; McClung, C.A. Circadian clock genes: Effects on dopamine, reward and addiction. Alcohol 2015, 49, 341–349. [Google Scholar] [CrossRef] [PubMed] [Green Version]
- Spencer, S.; Torres-Altoro, M.I.; Falcon, E.; Arey, R.; Marvin, M.; Goldberg, M.; Bibb, J.A.; McClung, C.A. A mutation in CLOCK leads to altered dopamine receptor function. J. Neurochem. 2012, 123, 124–134. [Google Scholar] [CrossRef] [PubMed] [Green Version]
- Hamidullah, S.; Thorpe, H.H.A.; Frie, J.A.; Mccurdy, R.D.; Khokhar, J.Y. Adolescent Substance Use and the Brain: Behavioral, Cognitive and Neural Correlates. Front. Hum. Neurosci. 2020, 14, 298. [Google Scholar] [CrossRef] [PubMed]
- Thorpe, H.H.A.; Hamidullah, S.; Jenkins, B.W.; Khokhar, J.Y. Adolescent neurodevelopment and substance use: Receptor expression and behavioral consequences. Pharmacol. Ther. 2020, 206, 107431. [Google Scholar] [CrossRef]
- Gamsby, J.J.; Pribish, A.M.; Stevanovic, K.D.; Yunus, A.; Gulick, D. Alcohol Intake Increases in Adolescent C57BL/6J Mice during Intermittent Cycles of Phase-Delayed, Long-Light Conditions. Front. Behav. Neurosci. 2017, 11, 152. [Google Scholar] [CrossRef] [Green Version]
- Rosenwasser, A.M.; McCulley, W.D., 3rd; Hartmann, M.C.; Fixaris, M.C.; Crabbe, J.C. Suppression of voluntary ethanol intake in mice under constant light and constant darkness. Alcohol 2020, 83, 37–46. [Google Scholar] [CrossRef]
- West, A.C.; Smith, L.; Ray, D.W.; Loudon, A.S.I.; Brown, T.M.; Bechtold, D.A. Misalignment with the external light environment drives metabolic and cardiac dysfunction. Nat. Commun. 2017, 8, 417. [Google Scholar] [CrossRef] [Green Version]
- Millard, W.J.; Dole, V.P. Intake of water and ethanol by C57BL mice: Effect of an altered light-dark schedule. Pharmacol. Biochem. Behav. 1983, 18, 281–284. [Google Scholar] [CrossRef]
- Huang, M.C.; Ho, C.W.; Chen, C.H.; Liu, S.C.; Chen, C.C.; Leu, S.J. Reduced expression of circadian clock genes in male alcoholic patients. Alcohol. Clin. Exp. Res. 2010, 34, 1899–1904. [Google Scholar] [CrossRef]
- Spanagel, R.; Pendyala, G.; Abarca, C.; Zghoul, T.; Sanchis-Segura, C.; Magnone, M.C.; Lascorz, J.; Depner, M.; Holzberg, D.; Soyka, M.; et al. The clock gene Per2 influences the glutamatergic system and modulates alcohol consumption. Nat. Med. 2005, 11, 35–42. [Google Scholar] [CrossRef]
- Comasco, E.; Nordquist, N.; Gokturk, C.; Aslund, C.; Hallman, J.; Oreland, L.; Nilsson, K.W. The clock gene PER2 and sleep problems: Association with alcohol consumption among Swedish adolescents. Ups J. Med. Sci. 2010, 115, 41–48. [Google Scholar] [CrossRef] [PubMed] [Green Version]
- Brager, A.J.; Prosser, R.A.; Glass, J.D. Circadian and acamprosate modulation of elevated ethanol drinking in mPer2 clock gene mutant mice. Chronobiol. Int. 2011, 28, 664–672. [Google Scholar] [CrossRef] [PubMed] [Green Version]
- Gamsby, J.J.; Templeton, E.L.; Bonvini, L.A.; Wang, W.; Loros, J.J.; Dunlap, J.C.; Green, A.I.; Gulick, D. The circadian Per1 and Per2 genes influence alcohol intake, reinforcement, and blood alcohol levels. Behav. Brain Res. 2013, 249, 15–21. [Google Scholar] [CrossRef] [PubMed] [Green Version]
- James, F.O.; Cermakian, N.; Boivin, D.B. Circadian rhythms of melatonin, cortisol, and clock gene expression during simulated night shift work. Sleep 2007, 30, 1427–1436. [Google Scholar] [CrossRef] [Green Version]
- de Zavalia, N.; Schoettner, K.; Goldsmith, J.A.; Solis, P.; Ferraro, S.; Parent, G.; Amir, S. Bmal1 in the striatum influences alcohol intake in a sexually dimorphic manner. Commun. Biol. 2021, 4, 1227. [Google Scholar] [CrossRef]
- Gamsby, J.J.; Gulick, D. Chronic shifts in the length and phase of the light cycle increase intermittent alcohol drinking in C57BL/6J mice. Front. Behav. Neurosci. 2015, 9, 9. [Google Scholar] [CrossRef] [Green Version]
- Rathod, Y.D.; Di Fulvio, M. The feeding microstructure of male and female mice. PLoS ONE 2021, 16, e0246569. [Google Scholar] [CrossRef]
- Nakamura, T.J.; Sellix, M.T.; Menaker, M.; Block, G.D. Estrogen directly modulates circadian rhythms of PER2 expression in the uterus. Am. J. Physiol. Endocrinol. Metab. 2008, 295, E1025–E1031. [Google Scholar] [CrossRef] [Green Version]
- Blegen, M.B.; Da Silva E Silva, D.; Bock, R.; Morisot, N.; Ron, D.; Alvarez, V.A. Alcohol operant self-administration: Investigating how alcohol-seeking behaviors predict drinking in mice using two operant approaches. Alcohol 2018, 67, 23–36. [Google Scholar] [CrossRef]
- Frie, J.A.; Khokhar, J.Y. An Open Source Automated Two-Bottle Choice Test Apparatus for Rats. HardwareX 2019, 5, e00061. [Google Scholar] [CrossRef]
- Owens, J. Insufficient Sleep in Adolescents and Young Adults: An Update on Causes and Consequences. Pediatrics 2014, 134, e921–e932. [Google Scholar] [CrossRef] [PubMed] [Green Version]


| Group | Alcohol Consumption | Alcohol Preference | Water Consumption | Total Fluid Consumption | Food Consumption | Caloric Intake | Weight Gain |
|---|---|---|---|---|---|---|---|
| F12WT | N/A | N/A | N/A | N/A | N/A | N/A | N/A |
| F10WT | – | – | – | – | – | – | – |
| F12ClockΔ19/Δ19 | ↑ | ↑ | ↓ | ↓ | ↓ | ↑ | ↑ |
| F10ClockΔ19/Δ19 | ↑ | ↑ | ↓ | ↓ | ↓ | ↑ | ↑ |
| M12WT | N/A | N/A | N/A | N/A | N/A | N/A | N/A |
| M10WT | – | – | – | – | – | – | – |
| M12ClockΔ19/Δ19 | ↑ | ↑ | ↓ | ↓ | ↓ | ↑ | ↑ |
| M10ClockΔ19/Δ19 | ↑ | ↑ | ↓ | ↓ | ↓ | ↑ | ↑ |
Publisher’s Note: MDPI stays neutral with regard to jurisdictional claims in published maps and institutional affiliations. |
© 2022 by the authors. Licensee MDPI, Basel, Switzerland. This article is an open access article distributed under the terms and conditions of the Creative Commons Attribution (CC BY) license (https://creativecommons.org/licenses/by/4.0/).
Share and Cite
Rizk, A.A.; Jenkins, B.W.; Al-Sabagh, Y.; Hamidullah, S.; Reitz, C.J.; Rasouli, M.; Martino, T.A.; Khokhar, J.Y. The Impact of Sex, Circadian Disruption, and the ClockΔ19/Δ19 Genotype on Alcohol Drinking in Mice. Genes 2022, 13, 701. https://0-doi-org.brum.beds.ac.uk/10.3390/genes13040701
Rizk AA, Jenkins BW, Al-Sabagh Y, Hamidullah S, Reitz CJ, Rasouli M, Martino TA, Khokhar JY. The Impact of Sex, Circadian Disruption, and the ClockΔ19/Δ19 Genotype on Alcohol Drinking in Mice. Genes. 2022; 13(4):701. https://0-doi-org.brum.beds.ac.uk/10.3390/genes13040701
Chicago/Turabian StyleRizk, Abanoub Aziz, Bryan W. Jenkins, Yasmine Al-Sabagh, Shahnaza Hamidullah, Cristine J. Reitz, Mina Rasouli, Tami A. Martino, and Jibran Y. Khokhar. 2022. "The Impact of Sex, Circadian Disruption, and the ClockΔ19/Δ19 Genotype on Alcohol Drinking in Mice" Genes 13, no. 4: 701. https://0-doi-org.brum.beds.ac.uk/10.3390/genes13040701