
Bioinformatic Prioritization and Functional Annotation of GWAS-Based Candidate Genes for Primary Open-Angle Glaucoma

 , , , ,
Abstract
:1. Introduction
2. Materials and Methods
2.1. Phase One: Gene Prioritization Analyses
2.1.1. In Silico Sequencing

2.1.2. Co-Regulated Genes within the POAG-Associated Loci
2.1.3. MetaXcan
2.1.4. Summary Data-Based Mendelian Randomization (SMR) Based on Gene Expression Data
2.2. Phase Two: Functional Assessment
2.2.1. Functional and Tissue Enrichment Analysis
2.2.2. Genetic Correlation of POAG with Other Traits
3. Results
3.1. Phase One: Gene Prioritization
3.1.1. In Silico Sequencing
3.1.2. Co-Regulation Analyses Using DEPICT
3.1.3. MetaXcan
3.1.4. SMR Based on Gene-Expression Data
3.1.5. SMR Based on Methylation Data and 3xSMR
3.1.6. Integration of Results (Phase One)
3.2. Phase Two: Functional Assessment
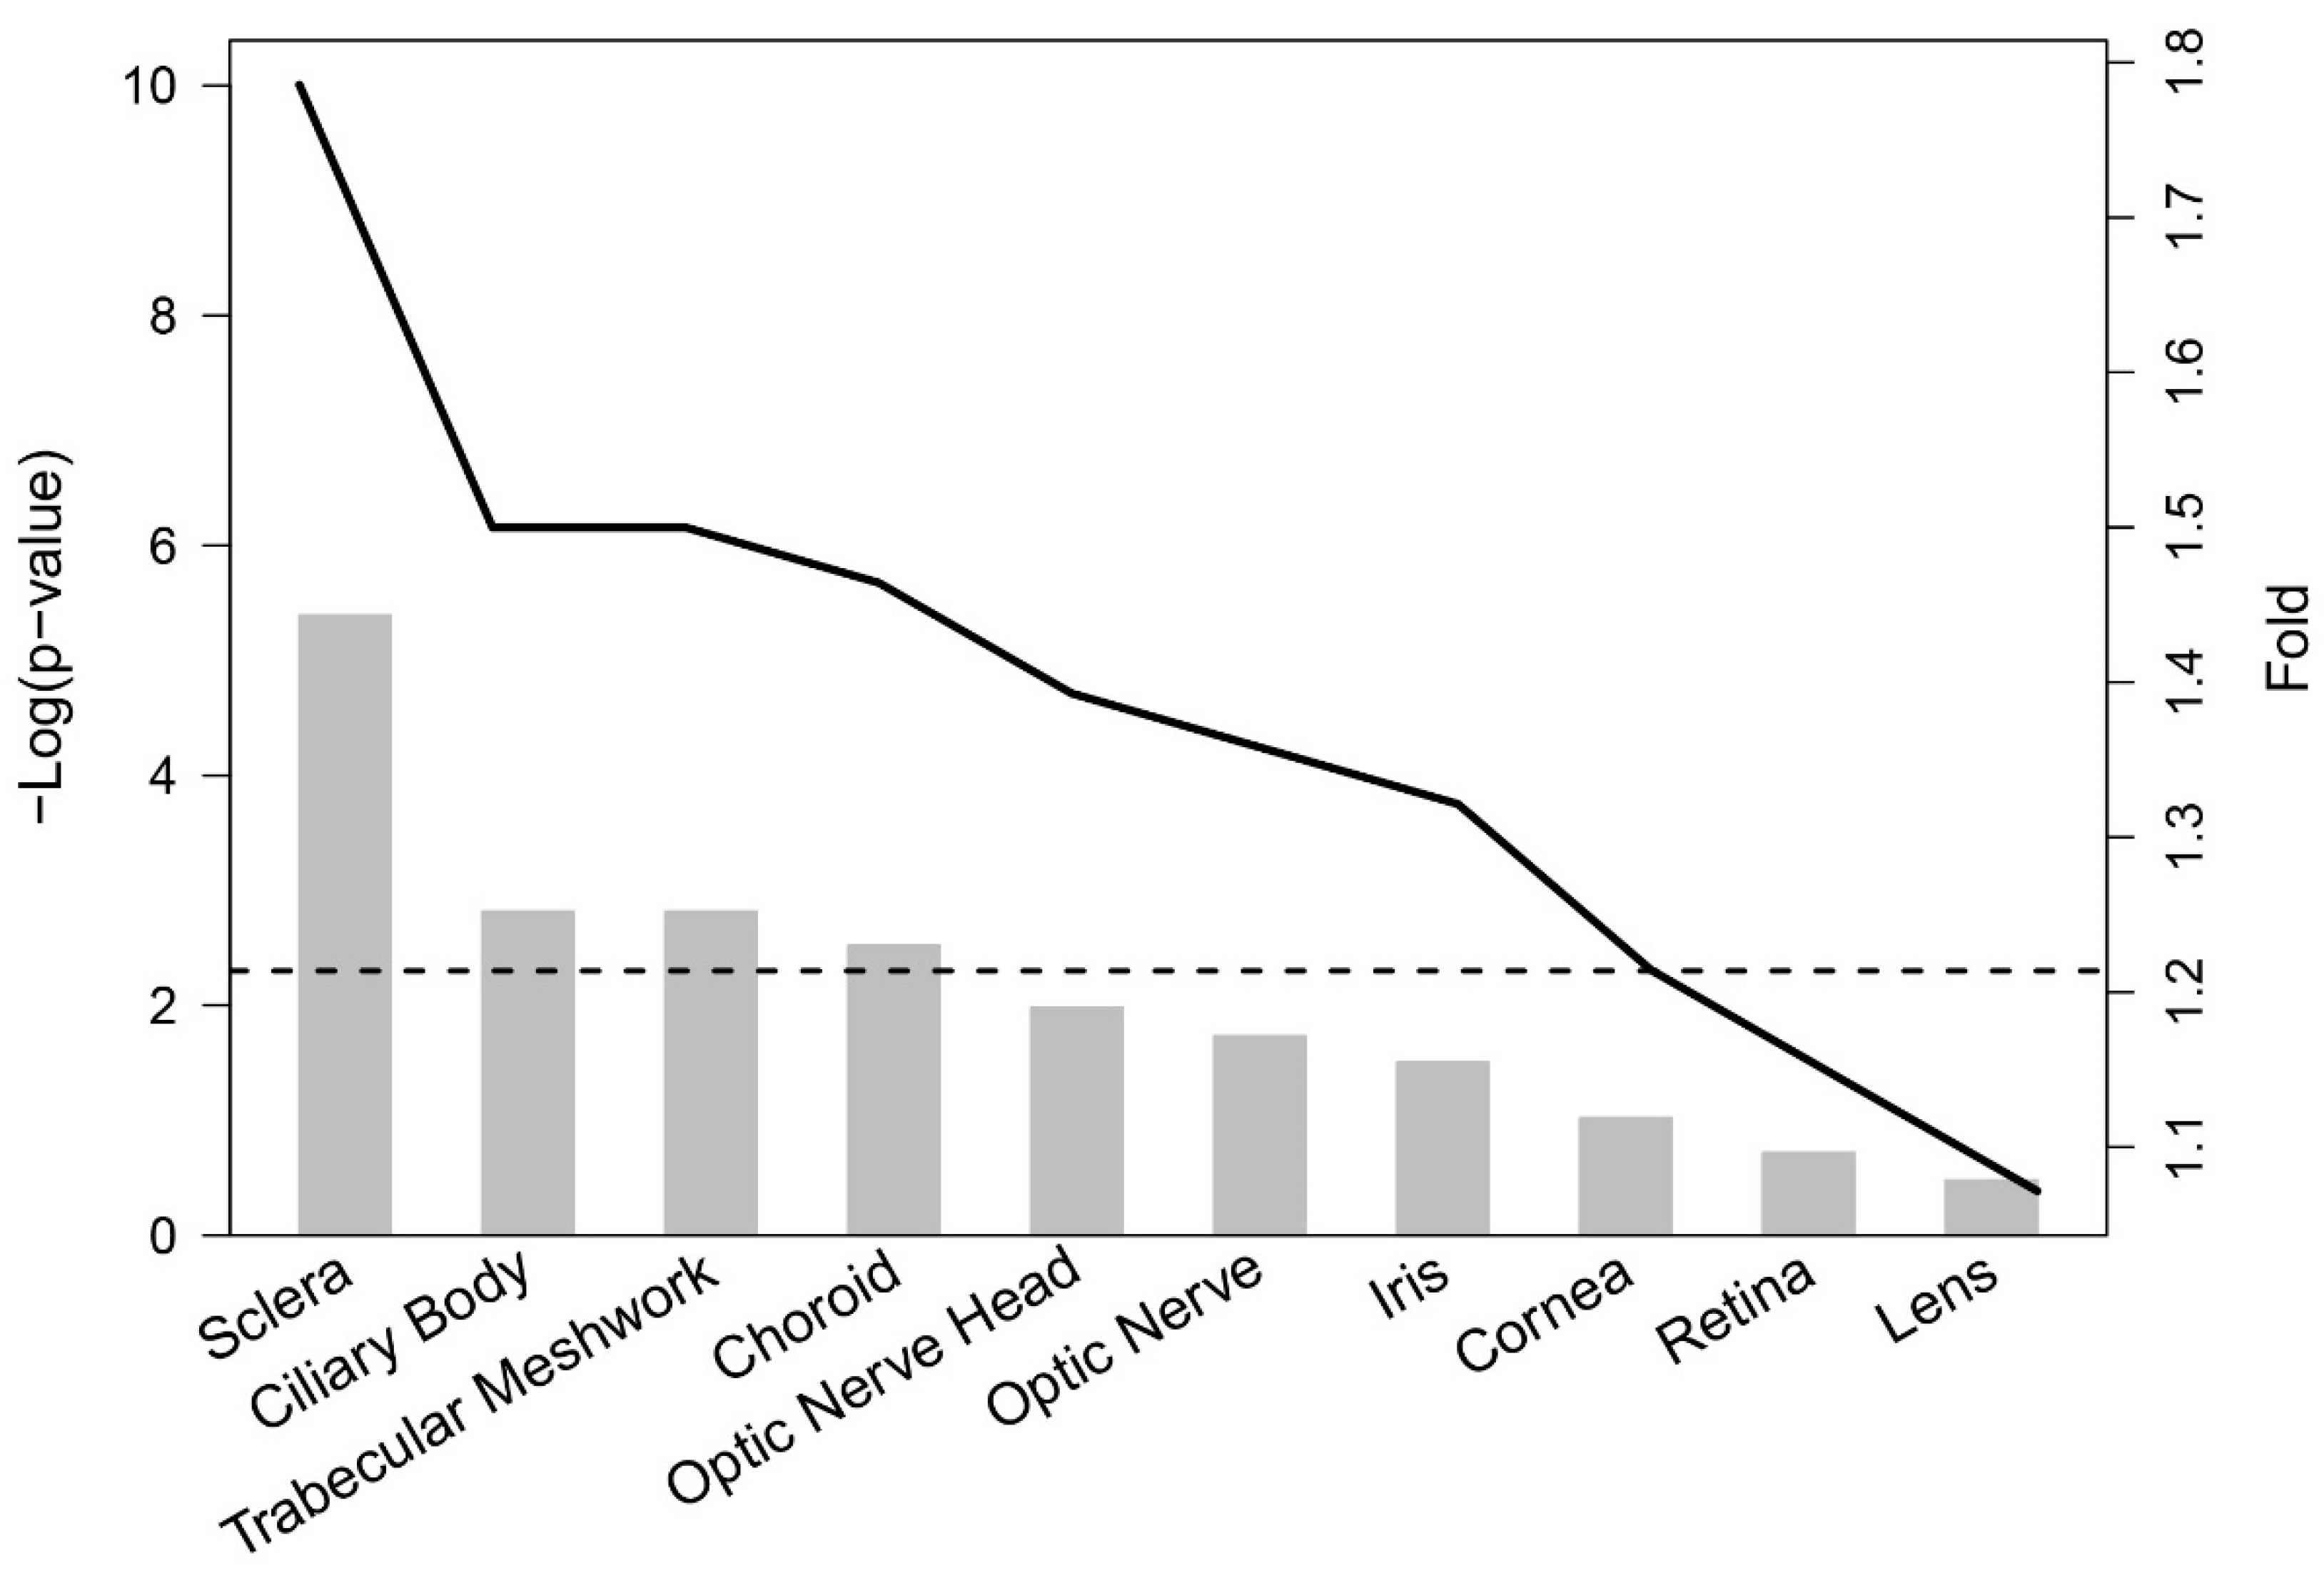
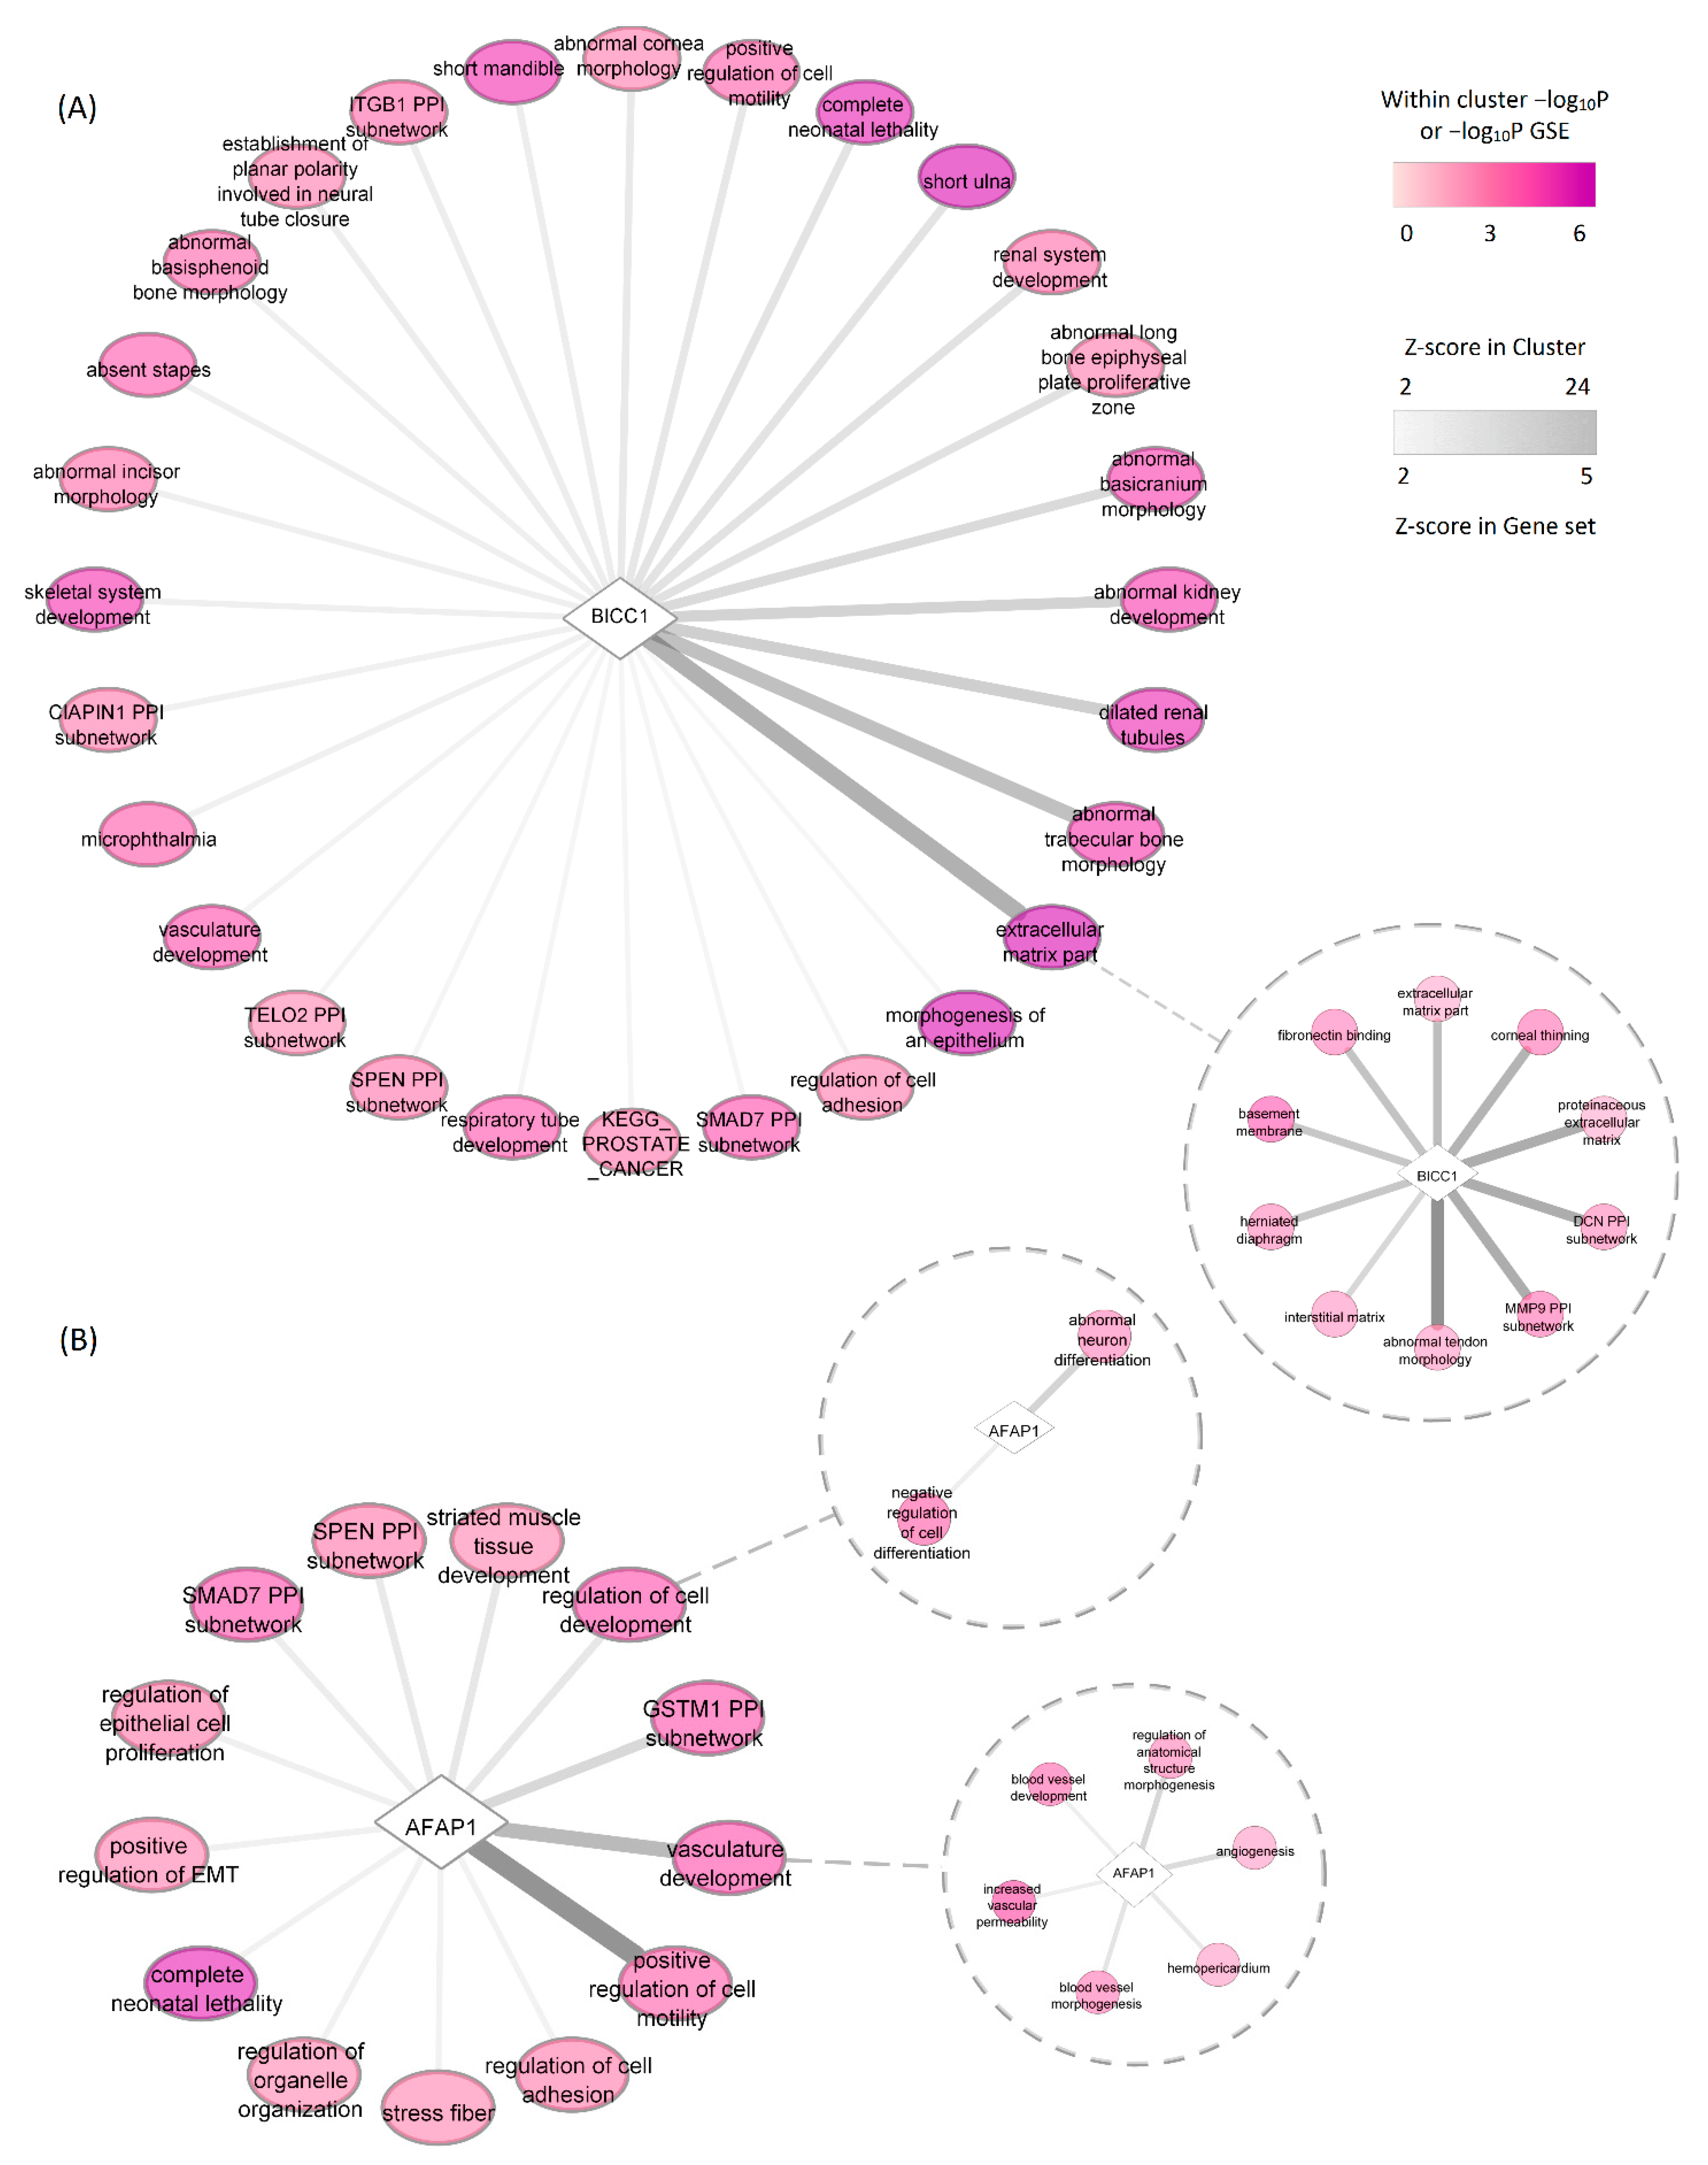
3.2.1. Functional and Tissue Enrichment Analysis
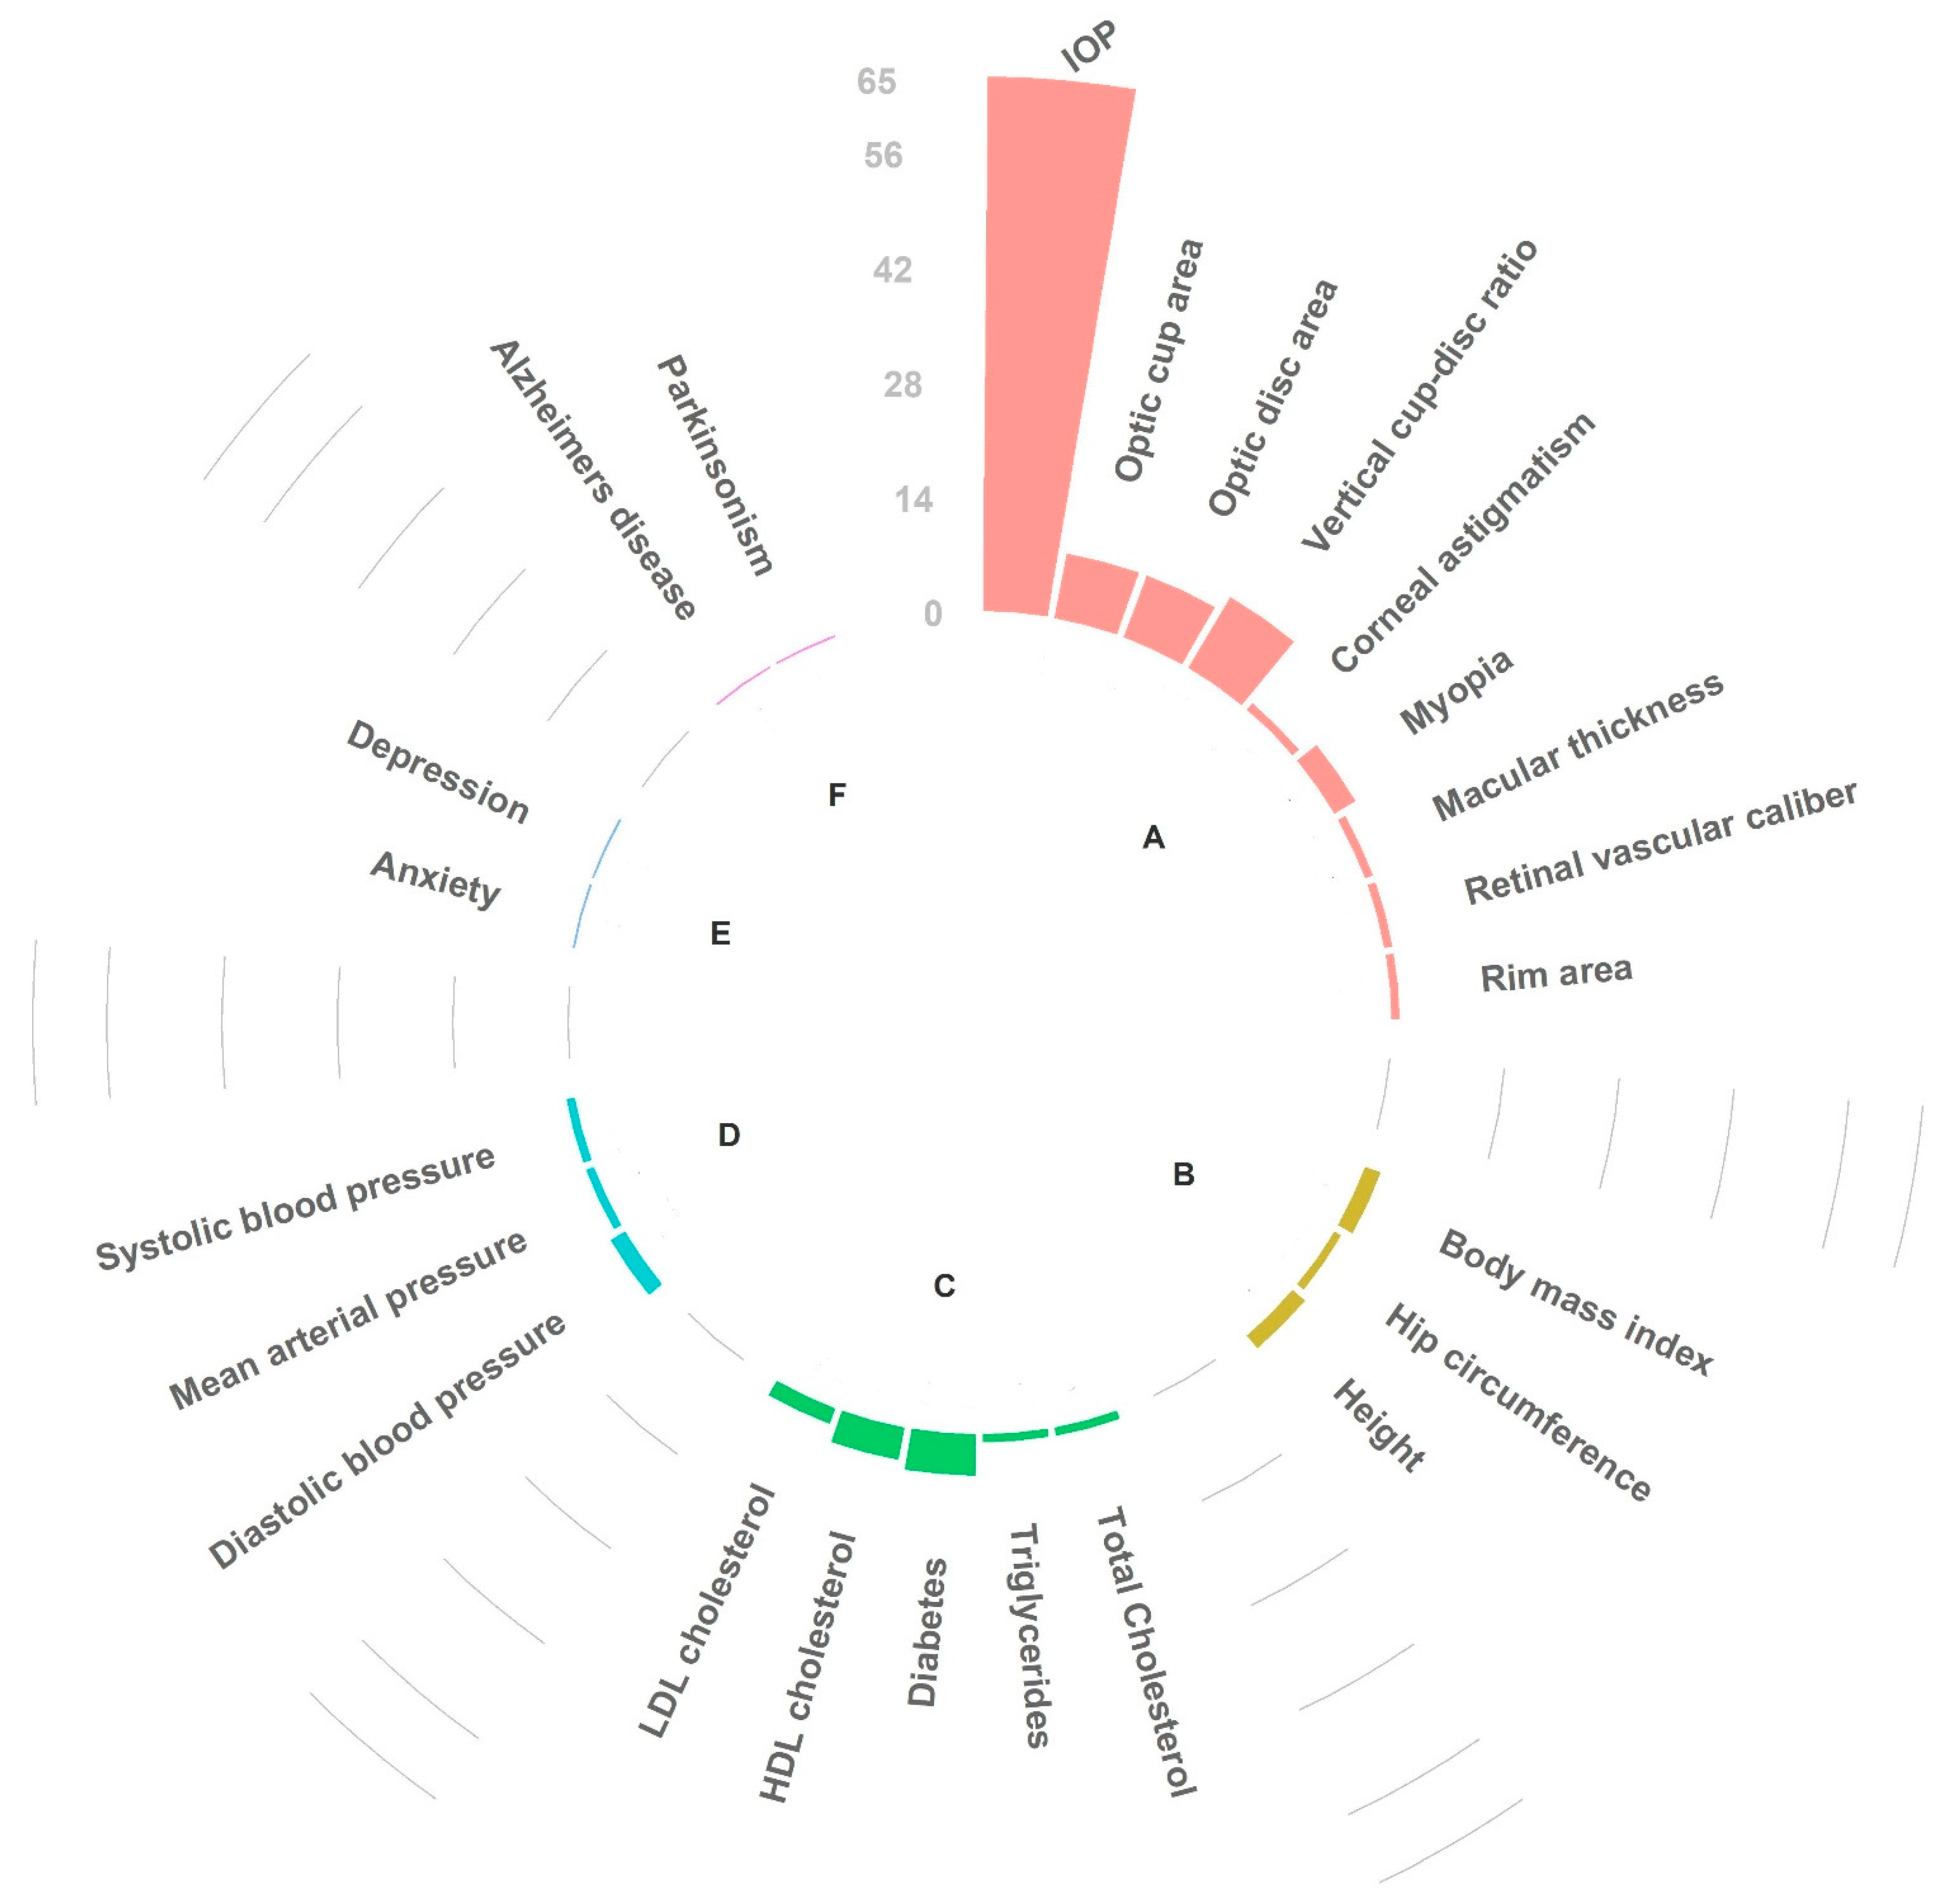
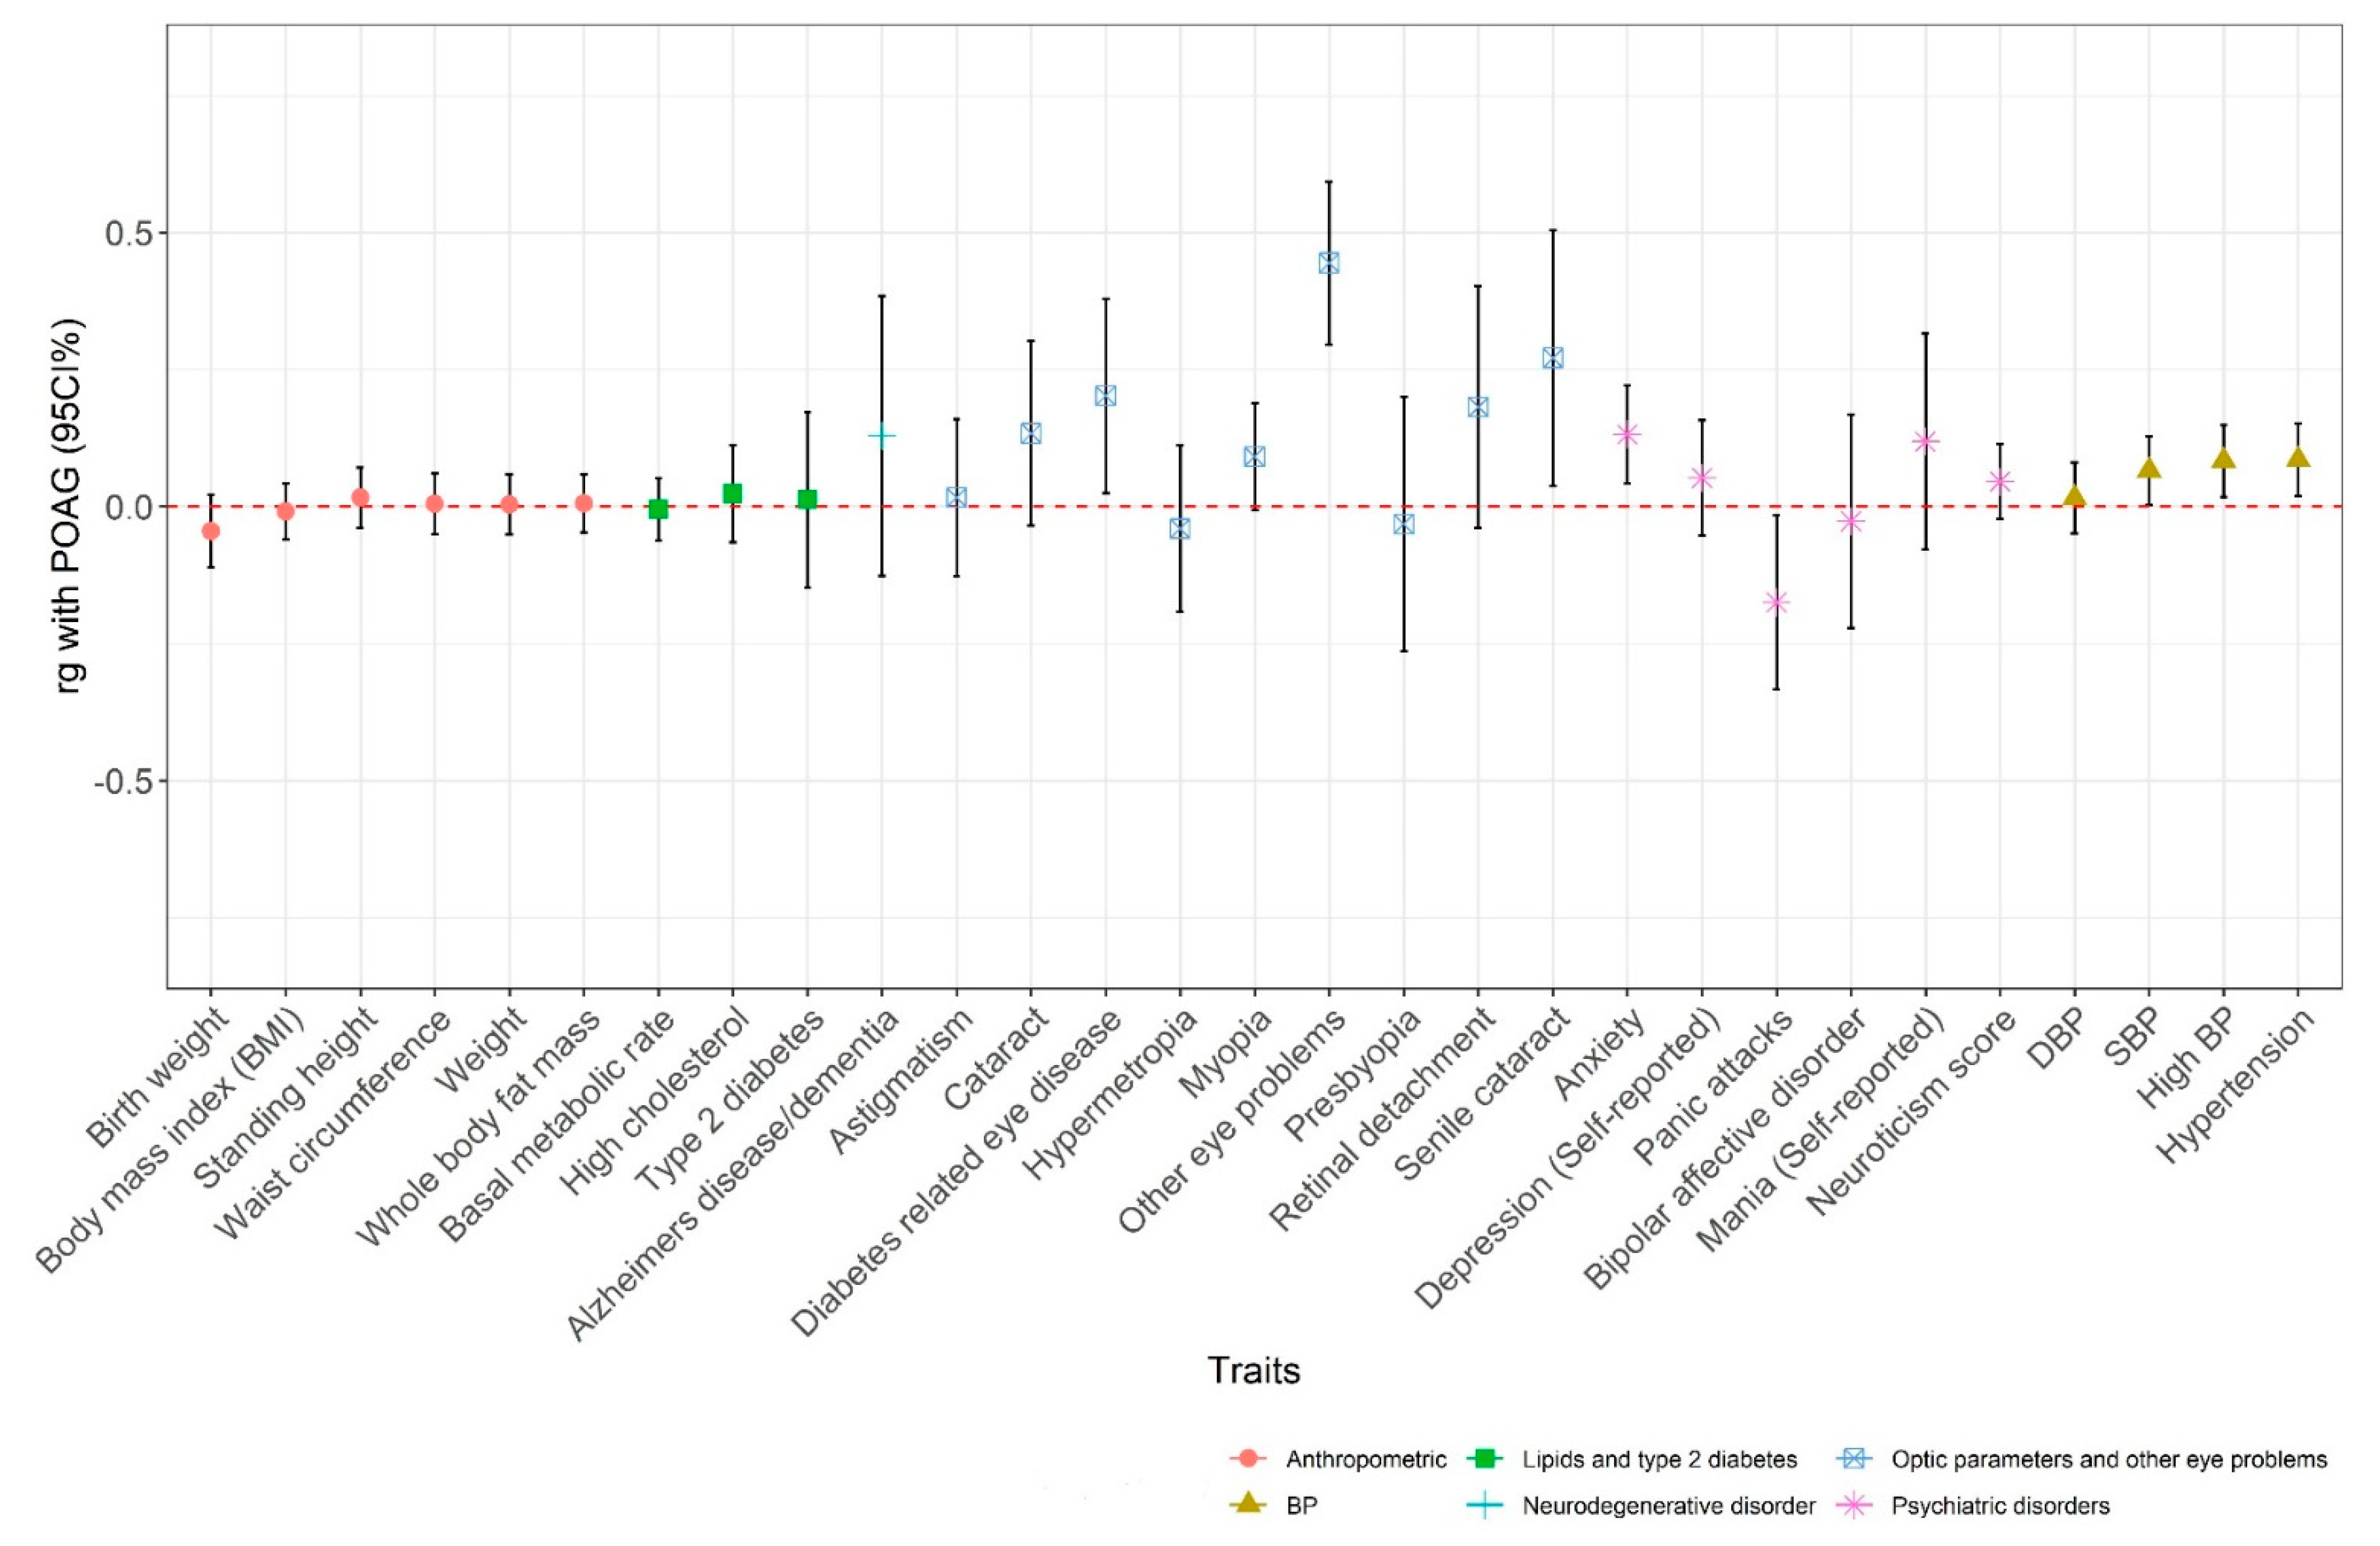
3.2.2. In Silico Pleiotropy Look-Up and Genetic Correlation
3.2.3. Integration of Results (Phase Two)
4. Discussion
4.1. Highlights of Separate Analyses
4.2. Post-GWAS Analyses Yielding Most Reliable Data
4.3. Functional Assessments
5. Strengths and Limitations
6. Conclusions
Supplementary Materials
Author Contributions
Funding
Institutional Review Board Statement
Informed Consent Statement
Data Availability Statement
Acknowledgments
Conflicts of Interest
References
- Wiggs, J.L.; Pasquale, L.R. Genetics of glaucoma. Hum. Mol. Genet. 2017, 26, R21–R27. [Google Scholar] [CrossRef]
- Asefa, N.G.; Neustaeter, A.; Jansonius, N.M.; Snieder, H. Heritability of glaucoma and glaucoma-related endophenotypes: Systematic review and meta-analysis. Surv. Ophthalmol. 2019, 64, 835–851. [Google Scholar] [CrossRef]
- Sheffield, V.C.; Stone, E.M.; Alward, W.L.; Drack, A.; Johnson, A.; Streb, L.M.; Nichols, B.E. Genetic linkage of familial open angle glaucoma to chromosome 1q21–q31. Nat. Genet. 1993, 4, 47–50. [Google Scholar] [CrossRef]
- Kumar, S.; Malik, M.A.; Sooraj, K.; Sihota, R.; Kaur, J. Genetic variants associated with primary open angle glaucoma in Indian population. Genomics 2016, 109, 27–35. [Google Scholar] [CrossRef]
- Choquet, H.; Paylakhi, S.; Kneeland, S.C.; Thai, K.K.; Hoffmann, T.J.; Yin, J.; Kvale, M.N.; Banda, Y.; Tolman, N.G.; Williams, P.A.; et al. A multiethnic genome-wide association study of primary open-angle glaucoma identifies novel risk loci. Nat. Commun. 2018, 9, 2278. [Google Scholar] [CrossRef] [Green Version]
- Gallagher, M.D.; Chen-Plotkin, A.S. The Post-GWAS Era: From Association to Function. Am. J. Hum. Genet. 2018, 102, 717–730. [Google Scholar] [CrossRef] [Green Version]
- Cano-Gamez, E.; Trynka, G. From GWAS to Function: Using Functional Genomics to Identify the Mechanisms Underlying Complex Diseases. Front. Genet. 2020, 11, 424. [Google Scholar] [CrossRef]
- Claussnitzer, M.; Dankel, S.N.; Kim, K.-H.; Quon, G.; Meuleman, W.; Haugen, C.; Glunk, V.; Sousa, I.S.; Beaudry, J.L.; Puviindran, V.; et al. FTO Obesity Variant Circuitry and Adi-pocyte Browning in Humans. N. Engl. J. Med. 2015, 373, 895–907. [Google Scholar] [CrossRef] [Green Version]
- Smemo, S.; Tena, J.J.; Kim, K.-H.; Gamazon, E.R.; Sakabe, N.J.; Gómez-Marín, C.; Aneas, I.; Credidio, F.L.; Sobreira, D.R.; Wasserman, N.F.; et al. Obesity-associated variants within FTO form long-range functional connections with IRX3. Nature 2014, 507, 371–375. [Google Scholar] [CrossRef] [Green Version]
- Danford, I.D.; Verkuil, L.D.; Choi, D.J.; Collins, D.W.; Gudiseva, H.V.; Uyhazi, K.E.; Lau, M.K.; Kanu, L.N.; Grant, G.R.; Chavali, V.R.M.; et al. Characterizing the “POAGome”: A bio-informatics-driven approach to primary open-angle glaucoma. Prog. Retin. Eye Res. 2017, 58, 89–114. [Google Scholar] [CrossRef] [Green Version]
- Janssen, S.F.; Gorgels, T.G.; Ramdas, W.D.; Klaver, C.C.; van Duijn, C.M.; Jansonius, N.M.; Bergen, A.A. The vast complexity of primary open angle glaucoma: Disease genes, risks, molecular mechanisms and pathobiology. Prog. Retin. Eye Res. 2013, 37, 31–67. [Google Scholar] [CrossRef]
- Ormel, J.; Hartman, C.A.; Snieder, H. The genetics of depression: Successful genome-wide association studies introduce new challenges. Transl. Psychiatry 2019, 9, 114. [Google Scholar] [CrossRef] [Green Version]
- Gamazon, E.R.; GTEx Consortium; Wheeler, H.E.; Shah, K.P.; Mozaffari, S.V.; Aquino-Michaels, K.; Carroll, R.J.; Eyler, A.E.; Denny, J.C.; Nicolae, D.L.; et al. A gene-based association method for mapping traits using reference transcriptome data. Nat. Genet. 2015, 47, 1091–1098. [Google Scholar] [CrossRef] [Green Version]
- Zhu, H.; Zhou, X. Transcriptome-wide association studies: A view from Mendelian randomization. Quant. Biol. 2020, 9, 1–15. [Google Scholar] [CrossRef]
- Barbeira, A.N.; GTEx Consortium; Dickinson, S.P.; Bonazzola, R.; Zheng, J.; Wheeler, H.E.; Torres, J.M.; Torstenson, E.S.; Shah, K.P.; Garcia, T.; et al. Exploring the phenotypic consequences of tissue specific gene expression variation inferred from GWAS summary statistics. Nat. Commun. 2018, 9, 1825. [Google Scholar] [CrossRef]
- Zhu, Z.; Zhang, F.; Hu, H.; Bakshi, A.; Robinson, M.R.; Powell, J.E.; Montgomery, G.W.; Goddard, M.E.; Wray, N.R.; Visscher, P.M.; et al. Integration of summary data from GWAS and eQTL studies predicts complex trait gene targets. Nat. Genet. 2016, 48, 481–487. [Google Scholar] [CrossRef]
- Huan, T.; Joehanes, R.; Song, C.; Peng, F.; Guo, Y.; Mendelson, M.; Yao, C.; Liu, C.; Ma, J.; Richard, M.; et al. Genome-wide identification of DNA methylation QTLs in whole blood highlights pathways for cardiovascular disease. Nat. Commun. 2019, 10, 4267. [Google Scholar] [CrossRef] [Green Version]
- Richardson, T.G.; Zheng, J.; Smith, G.D.; Timpson, N.J.; Gaunt, T.R.; Relton, C.L.; Hemani, G. Mendelian Randomization Analysis Identifies CpG Sites as Putative Mediators for Genetic Influences on Cardiovascular Disease Risk. Am. J. Hum. Genet. 2017, 101, 590–602. [Google Scholar] [CrossRef] [Green Version]
- Asefa, N.G.; Neustaeter, A.; Jansonius, N.M.; Snieder, H. Autonomic Dysfunction and Blood Pressure in Glaucoma Patients: The Lifelines Cohort Study. Investig. Ophthalmol. Vis. Sci. 2020, 61, 25. [Google Scholar] [CrossRef]
- Shiga, Y.; Akiyama, M.; Nishiguchi, K.M.; Sato, K.; Shimozawa, N.; Takahashi, A.; Momozawa, Y.; Hirata, M.; Matsuda, K.; Yamaji, T.; et al. Genome-wide association study identifies seven novel susceptibility loci for primary open-angle glaucoma. Hum. Mol. Genet. 2018, 27, 1486–1496. [Google Scholar] [CrossRef] [Green Version]
- Moon, J.Y.; Kim, H.J.; Park, Y.H.; Park, T.K.; Park, E.-C.; Kim, C.Y.; Lee, S.H. Association between Open-Angle Glaucoma and the Risks of Alzheimer’s and Parkinson’s Diseases in South Korea: A 10-year Nationwide Cohort Study. Sci. Rep. 2018, 8, 11161. [Google Scholar] [CrossRef]
- Pasquale, L.R.; Kang, J.H.; Manson, J.E.; Willett, W.C.; Rosner, B.A.; Hankinson, S.E. Prospective Study of Type 2 Diabetes Mellitus and Risk of Primary Open-Angle Glaucoma in Women. Ophthalmology 2006, 113, 1081–1086. [Google Scholar] [CrossRef]
- Vaez, A.; Jansen, R.; Prins, B.; Hottenga, J.-J.; de Geus, E.; Boomsma, D.; Penninx, B.W.; Nolte, I.M.; Snieder, H.; Alizadeh, B.Z. In Silico Post Genome-Wide Association Studies Analysis of C-Reactive Protein Loci Suggests an Important Role for Interferons. Circ. Cardiovasc. Genet. 2015, 8, 487–497. [Google Scholar] [CrossRef] [Green Version]
- The 1000 Genomes Project Consortium. A global reference for human genetic variation. Nature 2015, 526, 68–74. [Google Scholar] [CrossRef] [Green Version]
- Purcell, S.; Neale, B.; Todd-Brown, K.; Thomas, L.; Ferreira, M.A.R.; Bender, D.; Maller, J.; Sklar, P.; de Bakker, P.I.W.; Daly, M.J.; et al. PLINK: A tool set for whole-genome associ-ation and population-based linkage analyses. Am. J. Hum. Genet. 2007, 81, 559–575. [Google Scholar] [CrossRef] [Green Version]
- Wang, K.; Li, M.; Hakonarson, H. ANNOVAR: Functional annotation of genetic variants from high-throughput sequencing data. Nucleic Acids Res. 2010, 38, e164. [Google Scholar] [CrossRef]
- Sim, N.-L.; Kumar, P.; Hu, J.; Henikoff, S.; Schneider, G.; Ng, P.C. SIFT web server: Predicting effects of amino acid substitutions on proteins. Nucleic Acids Res. 2012, 40, W452–W457. [Google Scholar] [CrossRef]
- Choi, Y.; Chan, A.P. PROVEAN web server: A tool to predict the functional effect of amino acid substitutions and indels. Bioinformatics 2015, 31, 2745–2747. [Google Scholar] [CrossRef] [Green Version]
- Adzhubei, I.A.; Schmidt, S.; Peshkin, L.; E Ramensky, V.; Gerasimova, A.; Bork, P.; Kondrashov, A.S.; Sunyaev, S.R. A method and server for predicting damaging missense mutations. Nat. Methods 2010, 7, 248–249. [Google Scholar] [CrossRef] [Green Version]
- Buniello, A.; MacArthur, J.A.L.; Cerezo, M.; Harris, L.W.; Hayhurst, J.; Malangone, C.; McMahon, A.; Morales, J.; Mountjoy, E.; Sollis, E.; et al. The NHGRI-EBI GWAS Catalog of published genome-wide association studies, targeted arrays and summary statistics 2019. Nucleic Acids Res. 2019, 47, D1005–D1012. [Google Scholar] [CrossRef] [Green Version]
- Qi, T.; eQTLGen Consortium; Wu, Y.; Zeng, J.; Zhang, F.; Xue, A.; Jiang, L.; Zhu, Z.; Kemper, K.; Yengo, L.; et al. Identifying gene targets for brain-related traits using transcriptomic and methylomic data from blood. Nat. Commun. 2018, 9, 2282. [Google Scholar] [CrossRef] [PubMed] [Green Version]
- McRae, A.F.; Marioni, R.E.; Shah, S.; Yang, J.; Powell, J.E.; Harris, S.E.; Gibson, J.; Henders, A.K.; Bowdler, L.; Painter, J.N.; et al. Identification of 55,000 Replicated DNA Methylation QTL. Sci. Rep. 2018, 8, 17605. [Google Scholar] [CrossRef] [PubMed] [Green Version]
- Pers, T.H.; Genetic Investigation of ANthropometric Traits (GIANT) Consortium; Karjalainen, J.M.; Chan, Y.; Westra, H.-J.; Wood, A.R.; Yang, J.; Lui, J.C.; Vedantam, S.; Gustafsson, S.; et al. Biological interpretation of genome-wide association studies using predicted gene functions. Nat. Commun. 2015, 6, 5890. [Google Scholar] [CrossRef]
- Battle, A.; Mostafavi, S.; Zhu, X.; Potash, J.B.; Weissman, M.M.; McCormick, C.; Haudenschild, C.D.; Beckman, K.B.; Shi, J.; Mei, R.; et al. Characterizing the genetic basis of tran-scriptome diversity through RNA-sequencing of 922 individuals. Genome Res. 2014, 24, 14–24. [Google Scholar] [CrossRef] [PubMed] [Green Version]
- Giambartolomei, C.; Vukcevic, D.; Schadt, E.E.; Franke, L.; Hingorani, A.D.; Wallace, C.; Plagnol, V. Bayesian Test for Colocalisation between Pairs of Genetic Association Studies Using Summary Statistics. PLoS Genet. 2014, 10, e1004383. [Google Scholar] [CrossRef] [PubMed] [Green Version]
- Wu, Y.; Zeng, J.; Zhang, F.; Zhu, Z.; Qi, T.; Zheng, Z.; Lloyd-Jones, L.R.; Marioni, R.E.; Martin, N.G.; Mongomery, G.W.; et al. Integrative analysis of omics summary data reveals putative mecha-nisms underlying complex traits. Nat. Commun. 2018, 9, 918. [Google Scholar] [CrossRef] [PubMed]
- Võsa, U.; Claringbould, A.; Westra, H.-J.; Bonder, M.J.; Deelen, P.; Zeng, B.; Kirsten, H.; Saha, A.; Kreuzhuber, R.; Yazar, S.; et al. Large-Scale Cis- and Trans-EQTL Analyses Identify Thousands of Genetic Loci and Polygenic Scores That Regulate Blood Gene Expression. Nat. Genet. 2021, 53, 1300–1310. [Google Scholar] [CrossRef]
- Triche, T. Annotation package for Illumina Infinium DNA methylation probes. Bioconductor 2014. [Google Scholar] [CrossRef]
- Ng, B.; White, C.C.; Klein, H.-U.; Sieberts, S.K.; McCabe, C.; Patrick, E.; Xu, J.; Yu, L.; Gaiteri, C.; Bennett, D.A.; et al. An xQTL map integrates the genetic architecture of the human brain’s transcriptome and epigenome. Nat. Neurosci. 2017, 20, 1418–1426. [Google Scholar] [CrossRef] [Green Version]
- Hannon, E.; Spiers, H.; Viana, J.; Pidsley, R.; Burrage, J.; Murphy, T.M.; Troakes, C.; Turecki, G.; O’Donovan, M.C.; Schalkwyk, L.C.; et al. Methylation QTLs in the developing brain and their enrichment in schizophrenia risk loci. Nat. Neurosci. 2015, 19, 48–54. [Google Scholar] [CrossRef]
- Jaffe, A.E.; Gao, Y.; Deep-Soboslay, A.; Tao, R.; Hyde, T.M.; Weinberger, D.R.; Kleinman, J.E. Mapping DNA methylation across development, genotype and schizophrenia in the human frontal cortex. Nat. Neurosci. 2015, 19, 40–47. [Google Scholar] [CrossRef] [PubMed] [Green Version]
- Bodenhofer, U.; Kothmeier, A.; Hochreiter, S. APCluster: An R package for affinity propagation clustering. Bioinformatics 2011, 27, 2463–2464. [Google Scholar] [CrossRef] [PubMed]
- Ligthart, S.; Vaez, A.; Võsa, U.; Stathopoulou, M.G.; de Vries, P.S.; Prins, B.P.; Van der Most, P.J.; Tanaka, T.; Naderi, E.; Rose, L.M.; et al. Genome Analyses of >200,000 Individuals Identify 58 Loci for Chronic Inflammation and Highlight Pathways that Link Inflammation and Complex Disorders. Am. J. Hum. Genet. 2018, 103, 691–706. [Google Scholar] [CrossRef] [Green Version]
- Warde-Farley, D.; Donaldson, S.L.; Comes, O.; Zuberi, K.; Badrawi, R.; Chao, P.; Franz, M.; Grouios, C.; Kazi, F.; Lopes, C.T.; et al. The GeneMANIA prediction server: Bio-logical network integration for gene prioritization and predicting gene function. Nucleic. Acids Res. 2010, 38, W214–W220. [Google Scholar] [CrossRef]
- Wagner, A.; Anand, V.N.; Wang, W.-H.; Chatterton, J.E.; Sun, D.; Shepard, A.R.; Jacobson, N.; Pang, I.-H.; DeLuca, A.; Casavant, T.L.; et al. Exon-level expression profiling of ocular tissues. Exp. Eye Res. 2013, 111, 105–111. [Google Scholar] [CrossRef] [PubMed] [Green Version]
- Jin, L.; Zuo, X.-Y.; Su, W.-Y.; Zhao, X.-L.; Yuan, M.-Q.; Han, L.-Z.; Zhao, X.; Chen, Y.-D.; Rao, S.-Q. Pathway-based Analysis Tools for Complex Diseases: A Review. Genom. Proteom. Bioinform. 2014, 12, 210–220. [Google Scholar] [CrossRef] [PubMed] [Green Version]
- Hubens, W.H.G.; Breddels, E.M.; Walid, Y.; Ramdas, W.D.; Webers, C.A.B.; Gorgels, T.G.M.F. Mapping mRNA Expression of Glau-coma Genes in the Healthy Mouse Eye. Curr. Eye Res. 2019, 44, 1006–1017. [Google Scholar] [CrossRef] [Green Version]
- Bulik-Sullivan, B.; Finucane, H.K.; Anttila, V.; Gusev, A.; Day, F.R.; Loh, P.-R.; Duncan, L.; Perry, J.R.B.; Patterson, N.; Robinson, E.B.; et al. An atlas of genetic correlations across human diseases and traits. Nat. Genet. 2015, 47, 1236–1241. [Google Scholar] [CrossRef] [Green Version]
- Zheng, J.; Erzurumluoglu, A.M.; Elsworth, B.L.; Kemp, J.P.; Howe, L.; Haycock, P.C.; Hemani, G.; Tansey, K.; Laurin, C.; Pourcain, B.S.; et al. LD Hub: A centralized database and web interface to perform LD score regression that maximizes the potential of summary level GWAS data for SNP heritability and genetic correlation analysis. Bioinformatics 2017, 33, 272–279. [Google Scholar] [CrossRef] [Green Version]
- Khawaja, A.P.; Cooke Bailey, J.N.; Wareham, N.J.; Scott, R.A.; Simcoe, M.; Igo, R.P., Jr.; Song, Y.E.; Wojciechowski, R.; Cheng, C.-Y.; Khaw, P.T.; et al. Genome-wide analyses identify 68 new loci associated with intraocular pressure and improve risk prediction for primary open-angle glaucoma. Nat. Genet. 2018, 50, 778–782. [Google Scholar] [CrossRef]
- Zhang, X.; Olson, D.J.; Le, P.; Lin, F.-C.; Fleischman, D.; Davis, R.M. The Association Between Glaucoma, Anxiety, and Depression in a Large Population. Am. J. Ophthalmol. 2017, 183, 37–41. [Google Scholar] [CrossRef] [PubMed]
- Gao, X.R.; Huang, H.; Nannini, D.R.; Fan, F.; Kim, H. Genome-wide association analyses identify new loci influencing intraocular pressure. Hum. Mol. Genet. 2018, 27, 2205–2213. [Google Scholar] [CrossRef] [PubMed]
- Pohl, S.; Mitchison, H.M.; Kohlschütter, A.; van Diggelen, O.; Braulke, T.; Storch, S. Increased expression of lysosomal acid phosphatase in CLN3-defective cells and mouse brain tissue. J. Neurochem. 2007, 103, 2177–2188. [Google Scholar] [CrossRef]
- Simino, J.; Shi, G.; Bis, J.C.; Chasman, D.I.; Ehret, G.B.; Gu, X.; Guo, X.; Hwang, S.-J.; Sijbrands, E.; Smith, A.V.; et al. Gene-Age Interactions in Blood Pressure Regulation: A Large-Scale Investigation with the CHARGE, Global BPgen, and ICBP Consortia. Am. J. Hum. Genet. 2014, 95, 24–38. [Google Scholar] [CrossRef] [Green Version]
- Yoshikawa, M.; Yamashiro, K.; Miyake, M.; Oishi, M.; Akagi-Kurashige, Y.; Kumagai, K.; Nakata, I.; Nakanishi, H.; Oishi, A.; Gotoh, N.; et al. Comprehensive Replication of the Relationship Between Myopia-Related Genes and Refractive Errors in a Large Japanese Cohort. Investig. Ophthalmol. Vis. Sci. 2014, 55, 7343–7354. [Google Scholar] [CrossRef]
- Marcus, M.W.; de Vries, M.M.; Junoy Montolio, F.G.; Jansonius, N.M. Myopia as a risk factor for open-angle glaucoma: A systematic review and meta-analysis. Ophthalmology 2011, 118, 1989–1994.e2. [Google Scholar] [CrossRef]
- Wan, Y.; Li, S.; Gao, Y.; Tang, L.; Cao, W.; Sun, X. COL11A1 Polymorphisms Are Associated with Primary Angle-Closure Glaucoma Severity. J. Ophthalmol. 2019, 2019, 2604386. [Google Scholar] [CrossRef]
- Day, A.C.; Luben, R.; Khawaja, A.P.; Low, S.; Hayat, S.; Dalzell, N.; Wareham, N.J.; Khaw, K.-T.; Foster, P.J. Genotype-phenotype analysis of SNPs associated with primary angle closure glaucoma (rs1015213, rs3753841 and rs11024102) and ocular biometry in the EPIC-Norfolk Eye Study. Br. J. Ophthalmol. 2013, 97, 704–707. [Google Scholar] [CrossRef] [Green Version]
- Stamer, W.D. The Cell and Molecular Biology of Glaucoma: Mechanisms in the Conventional Outflow Pathway. Investig. Ophthalmol. Vis. Sci. 2012, 53, 2470–2472. [Google Scholar] [CrossRef] [Green Version]
- Thorleifsson, G.; Walters, G.B.; Hewitt, A.; Masson, G.; Helgason, A.; DeWan, A.; Sigurdsson, A.; Jonasdottir, A.; Gudjonsson, S.A.; Magnússon, K.P.; et al. Common variants near CAV1 and CAV2 are associated with primary open-angle glaucoma. Nat. Genet. 2010, 42, 906–909. [Google Scholar] [CrossRef] [Green Version]
- Gu, X.; Reagan, A.M.; McClellan, M.E.; Elliott, M.H. Caveolins and caveolae in ocular physiology and pathophysiology. Prog. Retin. Eye Res. 2016, 56, 84–106. [Google Scholar] [CrossRef] [PubMed] [Green Version]
- Chen, M.; Yu, X.; Xu, J.; Ma, J.; Chen, X.; Chen, B.; Gu, Y.; Wang, K. Association of Gene Polymorphisms With Primary Open Angle Glaucoma: A Systematic Review and Meta-Analysis. Investig. Ophthalmol. Vis. Sci. 2019, 60, 1105–1121. [Google Scholar] [CrossRef] [PubMed] [Green Version]
- Reagan, A.; Gu, X.; Hauck, S.M.; Ash, J.D.; Cao, G.; Thompson, T.C.; Elliott, M.H. Retinal Caveolin-1 Modulates Neuroprotective Signaling. Adv. Exp. Med. Biol. 2015, 854, 411–418. [Google Scholar] [CrossRef]
- Li, X.; Gu, X.; Boyce, T.M.; Zheng, M.; Reagan, A.M.; Qi, H.; Mandal, N.; Cohen, A.W.; Callegan, M.C.; Carr, D.J.; et al. Caveolin-1 Increases Proinflammatory Chemoattractants and Blood–Retinal Barrier Breakdown but Decreases Leukocyte Recruitment in Inflammation. Investig. Ophthalmol. Vis. Sci. 2014, 55, 6224–6234. [Google Scholar] [CrossRef]
- Wu, Y.; Zheng, Z.; Visscher, P.M.; Yang, J. Quantifying the mapping precision of genome-wide association studies using whole-genome sequencing data. Genome Biol. 2017, 18, 86. [Google Scholar] [CrossRef] [Green Version]
- Wang, H.; Lou, D.; Wang, Z. Crosstalk of Genetic Variants, Allele-Specific DNA Methylation, and Environmental Factors for Complex Disease Risk. Front. Genet. 2019, 9, 695. [Google Scholar] [CrossRef]
- Kumsta, R. The role of epigenetics for understanding mental health difficulties and its implications for psychotherapy research. Psychol. Psychother. 2019, 92, 190–207. [Google Scholar] [CrossRef]
- Fardi, M.; Solali, S.; Farshdousti, H.M. Epigenetic mechanisms as a new approach in cancer treatment: An updated review. Genes Dis. 2018, 5, 304–311. [Google Scholar] [CrossRef]
- Berdasco, M.; Gómez, A.; Rubio, M.J.; Mora, J.; Zanón-Moreno, V.; Lopez, M.; Hernández, C.; Yoshida, S.; Nakama, T.; Ishikawa, K.; et al. DNA Methylomes Reveal Biological Networks Involved in Human Eye Development, Functions and Associated Disorders. Sci. Rep. 2017, 7, 11762. [Google Scholar] [CrossRef] [Green Version]
- Burdon, K.P.; Awadalla, M.S.; Mitchell, P.; Wang, J.J.; White, A.; Keane, M.C.; Souzeau, E.; Graham, S.L.; Goldberg, I.; Healy, P.R.; et al. DNA methylation at the 9p21 glaucoma sus-ceptibility locus is associated with normal-tension glaucoma. Ophthalmic Genet. 2018, 39, 221–227. [Google Scholar] [CrossRef] [Green Version]
- Porter, L.F.; Saptarshi, N.; Fang, Y.; Rathi, S.; Hollander, A.I.D.; De Jong, E.K.; Clark, S.J.; Bishop, P.N.; Olsen, T.W.; Liloglou, T.; et al. Whole-genome methylation profiling of the retinal pigment epithelium of individuals with age-related macular degeneration reveals differential methylation of the SKI, GTF2H4, and TNXB genes. Clin. Epigenet. 2019, 11, 6. [Google Scholar] [CrossRef]
- Baisden, J.M.; Qian, Y.; Zot, H.M.; Flynn, D.C. The actin filament-associated protein AFAP-110 is an adaptor protein that modulates changes in actin filament integrity. Oncogene 2001, 20, 6435–6447. [Google Scholar] [CrossRef] [PubMed] [Green Version]
- Tsukamoto, T.; Kajiwara, K.; Nada, S.; Okada, M. Src mediates TGF-β-induced intraocular pressure elevation in glaucoma. J. Cell Physiol. 2019, 234, 1730–1744. [Google Scholar] [CrossRef]
- Kraus, M.R.-C.; Clauin, S.; Pfister, Y.; Di Maïo, M.; Ulinski, T.; Constam, D.; Bellanné-Chantelot, C.; Grapin-Botton, A. Two mutations in human BICC1 resulting in Wnt pathway hyperactivity associated with cystic renal dysplasia. Hum. Mutat. 2011, 33, 86–90. [Google Scholar] [CrossRef]
- MacGregor, S.; Ong, J.-S.; An, J.; Han, X.; Zhou, T.; Siggs, O.M.; Law, M.H.; Souzeau, E.; Sharma, S.; Lynn, D.; et al. Genome-wide association study of intraocular pressure uncovers new pathways to glaucoma. Nat. Genet. 2018, 50, 1067–1071. [Google Scholar] [CrossRef]
- Davidson, S.; Shanley, L.; Cowie, P.; Lear, M.; McGuffin, P.; Quinn, J.; Barrett, P.; MacKenzie, A. Analysis of the effects of depression associated polymorphisms on the activity of the BICC1 promoter in amygdala neurones. Pharm. J. 2015, 16, 366–374. [Google Scholar] [CrossRef] [PubMed]
- Jin, W.; Hepei, L.; Mingkun, X.; Li, W. Assessment of BicC family RNA binding protein 1 and Ras protein specific guanine nucleotide releasing factor 1 as candidate genes for high myopia: A case–control study. Indian J. Ophthalmol. 2017, 65, 926–930. [Google Scholar] [CrossRef] [PubMed]
- Uhlén, M.; Fagerberg, L.; Hallström, B.M.; Lindskog, C.; Oksvold, P.; Mardinoglu, A.; Sivertsson, A.; Kampf, C.; Sjostedt, E.; Asplund, A.; et al. Proteomics. Tissue-based map of the human proteome. Science 2015, 347, 1260419. [Google Scholar] [CrossRef]
- Ishigami, M.; Ogasawara, F.; Nagao, K.; Hashimoto, H.; Kimura, Y.; Kioka, N.; Ueda, K. Temporary sequestration of cholesterol and phosphatidylcholine within extracellular domains of ABCA1 during nascent HDL generation. Sci. Rep. 2018, 8, 6170. [Google Scholar] [CrossRef] [Green Version]
- Aguirre-Portolés, C.; Feliu, J.; Reglero, G.; Ramírez de Molina, A. ABCA1 overexpression worsens colorectal cancer prognosis by facilitating tumour growth and caveolin-1-dependent invasiveness, and these effects can be ameliorated using the BET inhibitor apabetalone. Mol. Oncol. 2018, 12, 1735–1752. [Google Scholar] [CrossRef] [Green Version]
- Esfandi, F.; Taheri, M.; Namvar, A.; Oskooei, V.K.; Ghafouri-Fard, S. AFAP1 and its naturally occurring antisense RNA are downregulated in gastric cancer samples. Biomed. Rep. 2019, 10, 296–302. [Google Scholar] [CrossRef] [PubMed] [Green Version]
- Pan, H.; Zheng, Y.; Pan, Q.; Chen, H.; Chen, F.; Wu, J.; Di, D. Expression of LXR-β, ABCA1 and ABCG1 in human triple-negative breast cancer tissues. Oncol. Rep. 2019, 42, 1869–1877. [Google Scholar] [CrossRef] [Green Version]
- Cui, X.-J.; Zhao, A.-G.; Wang, X.-L. Correlations of AFAP1, GMDS and PTGFR gene polymorphisms with intra-ocular pressure response to latanoprost in patients with primary open-angle glaucoma. J. Clin. Pharm. Ther. 2017, 42, 87–92. [Google Scholar] [CrossRef] [PubMed]
- Zhou, R.-R.; Li, H.-B.; You, Q.S.; Rong, R.; You, M.-L.; Xiong, K.; Huang, J.-F.; Xia, X.-B.; Ji, D. Silencing of GAS5 Alleviates Glaucoma in Rat Models by Reducing Retinal Ganglion Cell Apoptosis. Hum. Gene Ther. 2019, 30, 1505–1519. [Google Scholar] [CrossRef]
- Hunter, T. The Age of Crosstalk: Phosphorylation, Ubiquitination, and Beyond. Mol. Cell 2007, 28, 730–738. [Google Scholar] [CrossRef]
- Lütjen-Drecoll, E. Morphological changes in glaucomatous eyes and the role of TGFbeta2 for the pathogenesis of the disease. Exp. Eye Res. 2005, 81, 1–4. [Google Scholar] [CrossRef] [PubMed]
- Boyd, D.; Thomas, P.G. Towards integrating extracellular matrix and immunological pathways. Cytokine 2017, 98, 79–86. [Google Scholar] [CrossRef]
- Vranka, J.A.; Kelley, M.J.; Acott, T.S.; Keller, K.E. Extracellular matrix in the trabecular meshwork: Intraocular pressure regulation and dysregulation in glaucoma. Exp. Eye Res. 2015, 133, 112–125. [Google Scholar] [CrossRef] [Green Version]
- Sethi, A.; Mao, W.; Wordinger, R.J.; Clark, A.F. Transforming growth factor-β induces extracellular matrix protein cross-linking lysyl oxidase (LOX) genes in human trabecular meshwork cells. Investig. Ophthalmol. Vis. Sci. 2011, 52, 5240–5250. [Google Scholar] [CrossRef] [Green Version]
- Massagué, J. TGFβ signalling in context. Nat. Rev. Mol. Cell. Biol. 2012, 13, 616–630. [Google Scholar] [CrossRef]
- Akhurst, R.J.; Hata, A. Targeting the TGFβ signalling pathway in disease. Nat. Rev. Drug Discov. 2012, 11, 790–811. [Google Scholar] [CrossRef] [PubMed] [Green Version]
- Prendes, M.A.; Harris, A.; Wirostko, B.M.; Gerber, A.L.; Siesky, B. The role of transforming growth factor β in glaucoma and the therapeutic implications. Br. J. Ophthalmol. 2013, 97, 680–686. [Google Scholar] [CrossRef] [PubMed]
- Mead, A.L.; Wong, T.T.L.; Cordeiro, M.F.; Anderson, I.K.; Khaw, P.T. Evaluation of anti-TGF-beta2 antibody as a new postoperative anti-scarring agent in glaucoma surgery. Investig. Ophthalmol. Vis. Sci. 2003, 44, 3394–3401. [Google Scholar] [CrossRef] [PubMed] [Green Version]
- Tellios, N.; Belrose, J.C.; Tokarewicz, A.C.; Hutnik, C.; Liu, H.; Leask, A.; Motolko, M.; Iijima, M.; Parapuram, S.K. TGF-β induces phosphorylation of phosphatase and tensin homolog: Implications for fibrosis of the trabecular meshwork tissue in glaucoma. Sci. Rep. 2017, 7, 812. [Google Scholar] [CrossRef] [Green Version]
- Fuchshofer, R.; Welge-Lussen, U.; Lütjen-Drecoll, E. The effect of TGF-β2 on human trabecular meshwork extracellular proteolytic system. Exp. Eye Res. 2003, 77, 757–765. [Google Scholar] [CrossRef]
- Welge-Lüssen, U.; May, C.A.; Lütjen-Drecoll, E. Induction of tissue transglutaminase in the trabecular meshwork by TGF-beta1 and TGF-beta2. Investig. Ophthalmol. Vis. Sci. 2000, 41, 2229–2238. [Google Scholar]
- Wordinger, R.; Fleenor, D.L.; Hellberg, P.E.; Pang, I.-H.; Tovar, T.O.; Zode, G.S.; Fuller, J.; Clark, A.F. Effects of TGF-β2, BMP-4, and Gremlin in the Trabecular Meshwork: Implications for Glaucoma. Investig. Opthalmol. Vis. Sci. 2007, 48, 1191–1200. [Google Scholar] [CrossRef]
- Kim, M.; Lee, C.; Payne, R.; Yue, B.Y.; Chang, J.-H.; Ying, H. Angiogenesis in glaucoma filtration surgery and neovascular glaucoma: A review. Surv. Ophthalmol. 2015, 60, 524–535. [Google Scholar] [CrossRef] [Green Version]
- He, Z.; Vingrys, A.J.; Armitage, J.A.; Bui, B.V. The role of blood pressure in glaucoma. Clin. Exp. Optom. 2011, 94, 133–149. [Google Scholar] [CrossRef]
- Huelsken, J.; Birchmeier, W. New aspects of Wnt signaling pathways in higher vertebrates. Curr. Opin. Genet. Dev. 2001, 11, 547–553. [Google Scholar] [CrossRef]
- Wang, Z.; Liu, C.-H.; Huang, S.; Chen, J. Wnt Signaling in vascular eye diseases. Prog. Retin. Eye Res. 2018, 70, 110–133. [Google Scholar] [CrossRef]
- Piskunov, A.; Rochette-Egly, C. A retinoic acid receptor RARα pool present in membrane lipid rafts forms complexes with G protein αQ to activate p38MAPK. Oncogene 2011, 31, 3333–3345. [Google Scholar] [CrossRef] [PubMed] [Green Version]
- Luo, T.; Sakai, Y.; Wagner, E.; Dräger, U.C. Retinoids, eye development, and maturation of visual function. J. Neurobiol. 2006, 66, 677–686. [Google Scholar] [CrossRef] [PubMed]
- Samarawickrama, C.; Chew, S.; Watson, S. Retinoic acid and the ocular surface. Surv. Ophthalmol. 2015, 60, 183–195. [Google Scholar] [CrossRef] [PubMed]
- Prat, C.; Belville, C.; Comptour, A.; Marceau, G.; Clairefond, G.; Chiambaretta, F.; Sapin, V.; Blanchon, L. Myocilin expression is regulated by retinoic acid in the trabecular meshwork-derived cellular environment. Exp. Eye Res. 2017, 155, 91–98. [Google Scholar] [CrossRef]
- Duprey-Díaz, M.V.; Blagburn, J.; Blanco, R.E. Exogenous Modulation of Retinoic Acid Signaling Affects Adult RGC Survival in the Frog Visual System after Optic Nerve Injury. PLoS ONE 2016, 11, e0162626. [Google Scholar] [CrossRef] [Green Version]
- Vajaranant, T.S.; Nayak, S.; Wilensky, J.T.; Joslin, C.E. Gender and glaucoma: What we know and what we need to know. Curr. Opin. Ophthalmol. 2010, 21, 91–99. [Google Scholar] [CrossRef]
- Lee, A.J.; Mitchell, P.; Rochtchina, E.; Healey, P.R. Female reproductive factors and open angle glaucoma: The Blue Mountains Eye Study. Br. J. Ophthalmol. 2003, 87, 1324–1328. [Google Scholar] [CrossRef] [Green Version]
- Pasquale, L.R.; Kang, J.H. Female reproductive factors and primary open-angle glaucoma in the Nurses’ Health Study. Eye 2011, 25, 633–641. [Google Scholar] [CrossRef] [Green Version]
- Floyd, J.L.; Grant, M.B. The Gut–Eye Axis: Lessons Learned from Murine Models. Ophthalmol. Ther. 2020, 9, 499–513. [Google Scholar] [CrossRef]
- Hommer, A.; Fuchsjäger-Mayrl, G.; Resch, H.; Vass, C.; Garhofer, G.; Schmetterer, L. Estimation of Ocular Rigidity Based on Measurement of Pulse Amplitude Using Pneumotonometry and Fundus Pulse Using Laser Interferometry in Glaucoma. Investig. Opthalmol. Vis. Sci. 2008, 49, 4046–4050. [Google Scholar] [CrossRef] [PubMed] [Green Version]
- Schultz, D.S.; Lotz, J.C.; Lee, S.M.; Trinidad, M.L.; Stewart, J.M. Structural Factors That Mediate Scleral Stiffness. Investig. Opthalmol. Vis. Sci. 2008, 49, 4232–4236. [Google Scholar] [CrossRef] [PubMed] [Green Version]
- Coudrillier, B.; Tian, J.; Alexander, S.P.; Myers, K.; Quigley, H.A.; Nguyen, T.D. Biomechanics of the Human Posterior Sclera: Age- and Glaucoma-Related Changes Measured Using Inflation Testing. Investig. Opthalmol. Vis. Sci. 2012, 53, 1714–1728. [Google Scholar] [CrossRef] [PubMed]
- Downs, J.C.; Suh, J.-K.F.; Thomas, K.A.; Bellezza, A.J.; Hart, R.T.; Burgoyne, C. Viscoelastic Material Properties of the Peripapillary Sclera in Normal and Early-Glaucoma Monkey Eyes. Investig. Opthalmol. Vis. Sci. 2005, 46, 540–546. [Google Scholar] [CrossRef]
- Lavinsky, F.; Wu, M.; Schuman, J.S.; Lucy, K.A.; Liu, M.; Song, Y.; Fallon, J.; Ramos Cadena, M.D.L.A.; Ishikawa, H.; Wollstein, G. Can Macula and Optic Nerve Head Parameters Detect Glaucoma Progression in Eyes with Advanced Circumpapillary Retinal Nerve Fiber Layer Damage? Ophthalmology 2018, 125, 1907–1912. [Google Scholar] [CrossRef]
- Gupta, N.; Yücel, Y.H. Glaucoma as a neurodegenerative disease. Curr. Opin. Ophthalmol. 2007, 18, 110–114. [Google Scholar] [CrossRef]
- Criscuolo, C.; Fabiani, C.; Cerri, E.; Domenici, L. Synaptic Dysfunction in Alzheimer’s Disease and Glaucoma: From Common Degenerative Mechanisms Toward Neuroprotection. Front. Cell. Neurosci. 2017, 11, 53. [Google Scholar] [CrossRef] [Green Version]
- Sivak, J.M. The Aging Eye: Common Degenerative Mechanisms Between the Alzheimer’s Brain and Retinal Disease. Investig. Opthalmol. Vis. Sci. 2013, 54, 871–880. [Google Scholar] [CrossRef] [Green Version]
- Craig, J.E.; NEIGHBORHOOD Consortium; Han, X.; Qassim, A.; Hassall, M.; Bailey, J.N.C.; Kinzy, T.G.; Khawaja, A.P.; An, J.; Marshall, H.; et al. Multitrait analysis of glaucoma identifies new risk loci and enables polygenic prediction of disease susceptibility and progression. Nat. Genet. 2020, 52, 160–166. [Google Scholar] [CrossRef]
- Gharahkhani, P.; Jorgenson, E.; Hysi, P.; Khawaja, A.P.; Pendergrass, S.; Han, X.; Ong, J.S.; Hewitt, A.W.; Segrè, A.V.; Rouhana, J.M.; et al. Genome-wide meta-analysis identifies 127 open-angle glaucoma loci with consistent effect across ancestries. Nat. Commun. 2021, 12, 1258. [Google Scholar] [CrossRef]


| Ser. No. | SNP | Chr | Position | A1/A2 | GWAS p-Value | OR (95% CI) | Nearest Gene |
|---|---|---|---|---|---|---|---|
| 1 | rs41461152 | 1 | 88227120 | T/G | 4.1 × 10⁻⁹ | 1.09 (1.06–1.12) | LMO4/PKN2-AS1 |
| 2 | rs993471 | 1 | 103385373 | G/A | 2.0 × 10⁻⁸ | 1.08 (1.05–1.11) | COL11A1 |
| 3 | rs2814471 | 1 | 165739598 | C/T | 2.0 × 10−62 | 1.37 (1.32–1.42) | TMCO1 |
| 4 | rs7524755 | 1 | 165694897 | T/C | 8.3 × 10−41 | 1.35 (1.27–1.44) | TMCO1 |
| 5 | rs1192415 | 1 | 91611540 | G/A | 2.4 × 10⁻⁵ | 1.12 (1.06–1.18) | CDC7–TGFBR3 |
| 6 | rs4656461 | 1 | 165717968 | G/A | 1.2 × 10⁻¹⁹ | 1.33 (1.25–1.41) | TMCO1 |
| 7 | rs2627761 | 2 | 55933014 | C/T | 6.1 × 10⁻¹⁰ | 1.11 (1.07–1.15) | PNPT1 |
| 8 | rs2860235 | 2 | 66567896 | T/C | 3.9 × 10⁻⁸ | 0.93 (0.90–0.95) | MEIS1 |
| 9 | rs3789134 | 2 | 111680155 | T/C | 1.9 × 10⁻⁹ | 1.09 (1.06–1.12) | ACOXL |
| 10 | rs6434068 | 2 | 153357541 | G/C | 1.9 × 10⁻¹¹ | 0.91 (0.89–0.94) | FMNL2 |
| 11 | rs56335522 | 2 | 213758234 | G/C | 1.7 × 10⁻¹³ | 1.19 (1.13–1.24) | IKZF2 |
| 12 | rs34339006 | 2 | 234271522 | C/T | 1.7 × 10⁻⁸ | 0.93 (0.90–0.95) | DGKD |
| 13 | rs56117902 | 2 | 153304730 | A/C | 7.3 × 10⁻⁵ | 0.88 (0.84–0.92) | FMNL2 |
| 14 | rs1153606 | 3 | 25574186 | A/G | 3.4 × 10⁻⁸ | 1.10 (1.06–1.14) | RARB |
| 15 | rs9883252 | 3 | 85138818 | T/C | 6.1 × 10⁻¹⁴ | 1.11 (1.08–1.14) | CADM2 |
| 16 | rs73162480 | 3 | 150063454 | G/T | 1.8 × 10⁻⁸ | 1.15 (1.09–1.20) | TSC22D2 |
| 17 | rs9853115 | 3 | 186131600 | T/A | 1.9 × 10⁻¹³ | 1.10 (1.08–1.13) | DGKG/TBCCD1 |
| 18 | rs6771736 | 3 | 188066437 | C/G | 4.9 × 10⁻⁸ | 0.92 (0.89–0.95) | LPP |
| 19 | rs34201102 | 3 | 85137499 | A/G | 2.1 × 10⁻⁵ | 1.11 (1.08–1.15) | CADM2 |
| 20 | rs6857814 | 4 | 7916540 | A/G | 5.8 × 10⁻²⁷ | 0.86 (0.84–0.89) | AFAP1 |
| 21 | rs59521811 | 4 | 7909772 | T/C | 9.8 × 10⁻¹⁷ | 0.86 (0.82–0.90) | AFAP1 |
| 22 | rs9330348 | 4 | 7883887 | C/G | 5.7 × 10⁻¹⁰ | 1.16 (1.12–1.20) | AFAP1 |
| 23 | rs4619890 | 4 | 7851433 | G/A | 0.00025 | 1.08 (1.04–1.13) | AFAP1 |
| 24 | rs76325372 | 5 | 14837332 | A/C | 6.7 × 10⁻¹³ | 1.12 (1.08–1.15) | ANKH |
| 25 | rs255303 | 5 | 172588027 | G/T | 3.5 × 10⁻⁸ | 1.08 (1.05–1.11) | BNIP1 |
| 26 | rs72835984 | 6 | 642017 | C/T | 1.7 × 10⁻¹⁵ | 0.86 (0.83–0.89) | EXOC2 |
| 27 | rs9392348 | 6 | 1989604 | G/A | 1.7 × 10⁻¹⁰ | 1.11 (1.08–1.15) | GMDS |
| 28 | rs17752199 | 6 | 51406848 | A/G | 4.7 × 10⁻⁹ | 1.14 (1.09–1.19) | PKHD1 |
| 29 | rs3757155 | 6 | 136458593 | C/T | 9.5 × 10⁻¹⁵ | 1.12 (1.09–1.15) | PDE7B |
| 30 | rs4709212 | 6 | 158976277 | C/A | 7.8 × 10⁻⁹ | 1.09 (1.06–1.12) | TMEM181 |
| 31 | rs3012455 | 6 | 170448016 | A/G | 9.3 × 10⁻⁹ | 1.14 (1.09–1.20) | FAM120B |
| 32 | rs9494457 | 6 | 136474794 | T/A | 7.4 × 10⁻⁶ | 1.16 (1.11–1.22) | PDE7B |
| 33 | rs2073006 | 6 | 637465 | C/T | 1.2 × 10⁻⁶ | 0.86 (0.82–0.90) | EXOC2 |
| 34 | rs2745572 | 6 | 1548134 | A/G | 5.2 × 10⁻⁷ | 1.12 (1.07–1.18) | FOXC1 |
| 35 | rs11969985 | 6 | 1922673 | G/A | 0.00017 | 1.13 (1.06–1.20) | GMDS |
| 36 | rs2526101 | 7 | 11677452 | A/G | 1.4 × 10⁻¹⁰ | 0.92 (0.89–0.94) | THSD7A |
| 37 | rs327636 | 7 | 80848822 | A/G | 7.0 × 10⁻⁹ | 1.08 (1.06–1.12) | SEMA3C/CACNA2D1 |
| 38 | rs6969706 | 7 | 116154831 | G/T | 3.8 × 10⁻¹² | 0.90 (0.88–0.93) | CAV2/CAV1 |
| 39 | rs6947612 | 7 | 117632975 | A/G | 1.2 × 10⁻⁸ | 0.92 (0.90–0.95) | CTTNBP2/LSM8 |
| 40 | rs62478245 | 7 | 151505698 | C/T | 3.3 × 10⁻⁸ | 0.82 (0.76–0.88) | PRKAG2 |
| 41 | rs12699251 | 7 | 11679113 | A/G | 0.017 | 0.90 (0.87–0.93) | THSD7A |
| 42 | rs4236601 | 7 | 116522675 | G/A | 1.0 × 10⁻⁴ | 0.91 (0.87–0.95) | CAV2 |
| 43 | rs2514882 | 8 | 108275781 | C/T | 7.3 × 10⁻¹² | 0.87 (0.84–0.91) | ANGPT1 |
| 44 | rs62521287 | 8 | 124552133 | C/T | 8.3 × 10⁻⁹ | 0.86 (0.81–0.90) | FBXO32 |
| 45 | rs2514884 | 8 | 108276873 | C/T | 0.014 | 0.84 (0.80–0.88) | ANGPT1 |
| 46 | rs944801 | 9 | 22051670 | G/C | 2.1 × 10−49 | 0.81 (0.79–0.83) | CDKN2B-AS1 |
| 47 | rs2472493 | 9 | 107695848 | G/A | 6.1 × 10⁻²⁹ | 1.16 (1.13–1.19) | ABCA1 |
| 48 | rs1536907 | 9 | 129382560 | A/G | 1.1 × 10⁻¹⁷ | 0.87 (0.84–0.90) | LMX1B |
| 49 | rs10811645 | 9 | 22049656 | G/A | 1 × 10⁻¹⁸ | 0.77 (0.74–0.80) | CDKN2B-AS1 |
| 50 | rs1333037 | 9 | 22040765 | C/T | 2.9 × 10⁻²⁹ | 0.84 (0.81–0.87) | CDKN2B-AS1 |
| 51 | rs55770306 | 9 | 129388033 | C/A | 0.00019 | 0.86 (0.83–0.90) | LMX1B |
| 52 | rs4977756 | 9 | 22068653 | G/A | 9.7 × 10⁻²¹ | 0.81 (0.77–0.84) | CDKN2B-AS1 |
| 53 | rs2393455 | 10 | 60374898 | C/A | 7.1 × 10⁻⁹ | 1.08 (1.05–1.11) | BICC1 |
| 54 | rs3891783 | 10 | 96015793 | C/G | 1.6 × 10⁻⁸ | 0.93 (0.90–0.95) | PLCE1 |
| 55 | rs10838692 | 11 | 47345100 | T/C | 8.8 × 10⁻¹⁰ | 0.92 (0.89–0.94) | MADD |
| 56 | rs12808303 | 11 | 65225319 | C/G | 3.5 × 10⁻¹⁰ | 1.12 (1.08–1.16) | NEAT1 |
| 57 | rs7126413 | 11 | 120207405 | A/G | 1.1 × 10⁻¹¹ | 0.91 (0.89–0.94) | ARHGEF12 |
| 58 | rs12806740 | 11 | 120203628 | G/A | 0.0017 | 0.90 (0.87–0.93) | TMEM136 |
| 59 | rs58073046 | 11 | 120377784 | A/G | 4.3 × 10⁻⁵ | 0.87 (0.82–0.93) | ARHGEF12 |
| 60 | rs12309467 | 12 | 84038478 | C/G | 1.9 × 10⁻⁹ | 1.08 (1.06–1.11) | TMTC2/SLC6A15 |
| 61 | rs324794 | 12 | 83946450 | G/T | 6.8 × 10⁻³ | 0.87 (0.83–0.91) | TMTC2 |
| 62 | rs7137828 | 12 | 111494996 | C/T | 0.0034 | 0.93 (0.89–0.98) | ATXN2 |
| 63 | rs17075855 | 13 | 22669058 | G/A | 3.8 × 10⁻⁸ | 0.91 (0.88–0.94) | LINC00540 |
| 64 | rs34935520 | 14 | 61091401 | G/A | 7.8 × 10⁻²⁴ | 1.15 (1.12–1.18) | SIX1/SIX6 |
| 65 | rs35155027 | 14 | 61095174 | G/C | 6.2 × 10⁻¹³ | 1.17 (1.12–1.23) | SIX1/SIX6 |
| 66 | rs10483727 | 14 | 60606157 | T/C | 1.6 × 10⁻¹² | 1.17 (1.12–1.22) | SIX1/SIX6 |
| 67 | rs1647381 | 15 | 57086199 | C/G | 8.2 × 10⁻⁹ | 0.90 (0.87–0.93) | ZNF280D/TCF12 |
| 68 | rs2245899 | 15 | 61952501 | G/A | 5.1 × 10⁻⁹ | 1.08 (1.05–1.11) | VPS13C |
| 69 | rs2593221 | 15 | 57501414 | A/G | 0.025 | 0.86 (0.82–0.90) | TCF12 |
| 70 | rs9913911 | 17 | 10031183 | A/G | 9.1 × 10⁻³⁴ | 1.19 (1.15–1.22) | GAS7 |
| 71 | rs9897123 | 17 | 10117184 | C/T | 1.1 × 10⁻¹³ | 1.18 (1.13–1.23) | GAS7 |
| 72 | rs6140010 | 20 | 6473123 | A/G | 7.6 × 10⁻¹⁰ | 1.09 (1.06–1.12) | CASC20 |
| 73 | rs58714937 | 22 | 19856710 | C/T | 1.1 × 10⁻¹³ | 1.15 (1.11–1.20) | TXNRD2 |
| 74 | rs5752774 | 22 | 29105610 | C/T | 1.8 × 10⁻¹¹ | 0.91 (0.88–0.93) | CHEK2 |
| 75 | rs35934224 | 22 | 19885122 | C/T | 2.8 × 10⁻⁵ | 1.15 (1.08–1.22) | TXNRD2 |
| Entry | Gene Symbol | Top SNP | Nearest Genes (n = 50) | Genes with nsSNPs (n = 7) | DEPICT (n = 86) | SMR Blood (n = 13) | SMR Brain (n = 8) | MetaXcan (n = 8) | MSMR Blood (n = 7) | MSMR Brain (n = 12) | Common in Different Lines | Novelty * |
|---|---|---|---|---|---|---|---|---|---|---|---|---|
| 1 | AFAP1 | rs6857814 | 1 | 1 | 1 | 1 | 1 | 5 | Known | |||
| 2 | BICC1 | rs2393455 | 1 | 1 | 1 | 1 | 1 | 5 | Known | |||
| 3 | ABCA1 | rs2472493 | 1 | 1 | 1 | 1 | 4 | Known | ||||
| 4 | ARHGEF12 | rs7126413 | 1 | 1 | 1 | 3 | Known | |||||
| 5 | CAV2 | rs6969706 | 1 | 1 | 1 | 3 | Known | |||||
| 6 | COL11A1 | rs993471 | 1 | 1 | 1 | 3 | Known | |||||
| 7 | EXOC2 | rs72835984 | 1 | 1 | 1 | 3 | Known | |||||
| 8 | LTBP3 | rs12808303 | 1 | 1 | 1 | 3 | Known | |||||
| 9 | NR1H3 | rs326222 | 1 | 1 | 1 | 3 | Novel | |||||
| 10 | PLCE1 | rs3891783 | 1 | 1 | 1 | 3 | Known | |||||
| 11 | ACOXL | rs3789134 | 1 | 1 | 2 | Known | ||||||
| 12 | ACP2 | rs2167079 | 1 | 1 | 2 | Novel | ||||||
| 13 | ANGPT1 | rs2514882 | 1 | 1 | 2 | Known | ||||||
| 14 | C14orf39 | rs34935520 | 1 | 1 | 2 | Known | ||||||
| 15 | C22orf29 | rs58714937 | 1 | 1 | 2 | Known | ||||||
| 16 | CDKN2B | rs72652413 | 1 | 1 | 2 | Known | ||||||
| 17 | CDKN2B-AS1 | rs944801 | 1 | 1 | 2 | Known | ||||||
| 18 | CTTNBP2 | rs6947612 | 1 | 1 | 2 | Known | ||||||
| 19 | DGKD | rs34339006 | 1 | 1 | 2 | Known | ||||||
| 20 | EHBP1L1 | rs1346 | 1 | 1 | 2 | Novel | ||||||
| 21 | FBXO32 | rs62521287 | 1 | 1 | 2 | Known | ||||||
| 22 | GAS7 | rs9913911 | 1 | 1 | 2 | Known | ||||||
| 23 | LMX1B | rs1536907 | 1 | 1 | 2 | Known | ||||||
| 24 | LPP | rs6771736 | 1 | 1 | 2 | Known | ||||||
| 25 | LRRC37A2 | rs112560196 | 1 | 1 | 2 | Novel | ||||||
| 26 | LRRC37A4P | rs112560196 | 1 | 1 | 2 | Novel | ||||||
| 27 | NEAT1 | rs12808303 | 1 | 1 | 2 | Known | ||||||
| 28 | PDE7B | rs9494457 | 1 | 1 | 2 | Known | ||||||
| 29 | RARB | rs1153606 | 1 | 1 | 2 | Known | ||||||
| 30 | RP11-707O23.5 | rs112073200 | 1 | 1 | 2 | Novel | ||||||
| 31 | SIX6 | rs34935520 | 1 | 1 | 2 | Known | ||||||
| 32 | THSD7A | rs12699251 | 1 | 1 | 2 | Known | ||||||
| 33 | TMTC2 | rs324794 | 1 | 1 | 2 | Known | ||||||
| 34 | TXNRD2 | rs35934224 | 1 | 1 | 2 | Known | ||||||
| 35 | AC007038.1 | rs9646846 | 1 | 1 | Novel | |||||||
| 36 | AC040170.1 | rs1687660 | 1 | 1 | Novel | |||||||
| 37 | AFAP1-AS1 | rs62290601 | 1 | 1 | Novel | |||||||
| 38 | ANGPTL2 | rs4837119 | 1 | 1 | Novel | |||||||
| 39 | ANKH | rs76325372 | 1 | 1 | Known | |||||||
| 40 | ANTXR1 | rs6732795 | 1 | 1 | Known | |||||||
| 41 | AP004608.1 | rs7942818 | 1 | 1 | Novel | |||||||
| 42 | ARID2 | rs112405710 | 1 | 1 | Known | |||||||
| 43 | ATXN2 | rs7137828 | 1 | 1 | Known | |||||||
| 44 | BMP2 | rs2206916 | 1 | 1 | Known | |||||||
| 45 | BNIP1 | rs255303 | 1 | 1 | Known | |||||||
| 46 | C17orf57 | rs4794057 | 1 | 1 | Novel | |||||||
| 47 | C17orf69 | rs450751 | 1 | 1 | Novel | |||||||
| 48 | C5orf41 | rs255303 | 1 | 1 | Novel | |||||||
| 49 | CADM2 | rs34201102 | 1 | 1 | Known | |||||||
| 50 | CALD1 | rs1026274 | 1 | 1 | Novel | |||||||
| 51 | CASC20 | rs6140010 | 1 | 1 | Known | |||||||
| 52 | CAV1 | rs2896175 | 1 | 1 | Known | |||||||
| 53 | CCDC102A | rs9921158 | 1 | 1 | Novel | |||||||
| 54 | CDC14A | rs2809823 | 1 | 1 | Novel | |||||||
| 55 | CDKN2A | rs72652413 | 1 | 1 | Known | |||||||
| 56 | CHEK2 | rs5752774 | 1 | 1 | Known | |||||||
| 57 | CLIC5 | rs3777588 | 1 | 1 | Novel | |||||||
| 58 | COBLL1 | rs146065688 | 1 | 1 | Novel | |||||||
| 59 | COL16A1 | rs10914457 | 1 | 1 | Novel | |||||||
| 60 | COL8A2 | rs6664296 | 1 | 1 | Known | |||||||
| 61 | CRHR1-IT1 | rs112560196 | 1 | 1 | Novel | |||||||
| 62 | CYP26A1 | rs12260218 | 1 | 1 | Known | |||||||
| 63 | CYR61 | rs821395 | 1 | 1 | Novel | |||||||
| 64 | DCBLD2 | rs2439237 | 1 | 1 | Known | |||||||
| 65 | DND1P1 | rs113991678 | 1 | 1 | Novel | |||||||
| 66 | EP300 | rs139497 | 1 | 1 | Known | |||||||
| 67 | FERMT1 | rs947465 | 1 | 1 | Novel | |||||||
| 68 | FERMT2 | rs17125973 | 1 | 1 | Known | |||||||
| 69 | FMNL2 | rs6434068 | 1 | 1 | Known | |||||||
| 70 | FNDC3B | rs62283814 | 1 | 1 | Known | |||||||
| 71 | FOXC1 | rs2745572 | 1 | 1 | Known | |||||||
| 72 | FOXCUT | rs2745572 | 1 | 1 | Novel | |||||||
| 73 | FOXL1 | rs11864330 | 1 | 1 | Novel | |||||||
| 74 | GLIS1 | rs941125 | 1 | 1 | Known | |||||||
| 75 | GLIS3 | rs28683166 | 1 | 1 | Known | |||||||
| 76 | GMDS | rs72835984 | 1 | 1 | Known | |||||||
| 77 | GRHL2 | rs666026 | 1 | 1 | Novel | |||||||
| 78 | H1F0 | rs5756813 | 1 | 1 | Novel | |||||||
| 79 | KANSL1-AS1 | rs112073200 | 1 | 1 | Novel | |||||||
| 80 | KIAA1267 | rs115690894 | 1 | 1 | Novel | |||||||
| 81 | KIF1C | rs7208035 | 1 | 1 | Novel | |||||||
| 82 | KLF5 | rs4885062 | 1 | 1 | Novel | |||||||
| 83 | KREMEN1 | rs16987271 | 1 | 1 | Novel | |||||||
| 84 | LAMB4 | rs12670073 | 1 | 1 | Novel | |||||||
| 85 | LINC00540 | rs17075855 | 1 | 1 | Known | |||||||
| 86 | LINC01214 | rs73162480 | 1 | 1 | Novel | |||||||
| 87 | LINC01364 | rs41461152 | 1 | 1 | Novel | |||||||
| 88 | LINC02052 | rs9883252 | 1 | 1 | Known | |||||||
| 89 | LINC02349 | rs2245899 | 1 | 1 | Novel | |||||||
| 90 | LMO4 | rs7538446 | 1 | 1 | Known | |||||||
| 91 | LOC100147773 | rs2814471 | 1 | 1 | Novel | |||||||
| 92 | LOC102724511 | rs3012455 | 1 | 1 | Novel | |||||||
| 93 | LOC105369146 | rs327636 | 1 | 1 | Novel | |||||||
| 94 | LRRC37A | rs62641967 | 1 | 1 | Novel | |||||||
| 95 | LTBP1 | rs34447926 | 1 | 1 | Novel | |||||||
| 96 | LTBP2 | rs1077662 | 1 | 1 | Known | |||||||
| 97 | MADD | rs10838692 | 1 | 1 | Known | |||||||
| 98 | MAP7D1 | rs6664296 | 1 | 1 | Novel | |||||||
| 99 | MAPT | rs62641967 | 1 | 1 | Novel | |||||||
| 100 | MAST2 | rs499600 | 1 | 1 | Novel | |||||||
| 101 | MECOM | rs13062416; | 1 | 1 | Known | |||||||
| 102 | MEIS1 | rs2860235 | 1 | 1 | Known | |||||||
| 103 | MIR4776-2 | rs56335522 | 1 | 1 | Novel | |||||||
| 104 | MIR4778 | rs2860235 | 1 | 1 | Novel | |||||||
| 105 | MNAT1 | rs34935520 | 1 | 1 | Novel | |||||||
| 106 | MVB12B | rs10122788 | 1 | 1 | Known | |||||||
| 107 | MYL1 | rs9646846 | 1 | 1 | Novel | |||||||
| 108 | NACAP1 | rs79905896 | 1 | 1 | Novel | |||||||
| 109 | NPEPPS | rs4794057 | 1 | 1 | Novel | |||||||
| 110 | NUMBL | rs10416308 | 1 | 1 | Novel | |||||||
| 111 | PDGFRL | rs4921799 | 1 | 1 | Known | |||||||
| 112 | PIK3R3 | rs499600 | 1 | 1 | Novel | |||||||
| 113 | PKHD1 | rs17752199 | 1 | 1 | Known | |||||||
| 114 | PLEKHA7 | rs4141194 | 1 | 1 | Known | |||||||
| 115 | PNPT1 | rs2627761 | 1 | 1 | Known | |||||||
| 116 | PRKAG2 | rs62478245 | 1 | 1 | Known | |||||||
| 117 | PRRX1 | rs76117299 | 1 | 1 | Novel | |||||||
| 118 | ROR1 | rs2806545 | 1 | 1 | Novel | |||||||
| 119 | RP11-259G18.1 | rs112073200 | 1 | 1 | Novel | |||||||
| 120 | SALL3 | rs145025615 | 1 | 1 | Novel | |||||||
| 121 | SALRNA1 | rs34935520 | 1 | 1 | Known | |||||||
| 122 | SEMA3C | rs327636 | 1 | 1 | Known | |||||||
| 123 | SH2B3 | rs7137828 | 1 | 1 | Known | |||||||
| 124 | SIX1 | rs34935520 | 1 | 1 | Known | |||||||
| 125 | SIX4 | rs34935520 | 1 | 1 | Known | |||||||
| 126 | SLC2A12 | rs2627231 | 1 | 1 | Novel | |||||||
| 127 | SMG6 | rs2273984 | 1 | 1 | Known | |||||||
| 128 | SOCS3 | rs73382006 | 1 | 1 | Novel | |||||||
| 129 | STK38 | rs9380578 | 1 | 1 | Known | |||||||
| 130 | TBKBP1 | rs4794057 | 1 | 1 | Known | |||||||
| 131 | TCF12 | rs1647381 | 1 | 1 | Known | |||||||
| 132 | TGFBR3 | rs1192415 | 1 | 1 | Known | |||||||
| 133 | THSD4 | rs112786475 | 1 | 1 | Novel | |||||||
| 134 | TMEM136 | rs12806740 | 1 | 1 | Known | |||||||
| 135 | TMEM181 | rs4709212 | 1 | 1 | Known | |||||||
| 136 | TRIB2 | rs35002856 | 1 | 1 | Novel | |||||||
| 137 | TRIOBP | rs5756813 | 1 | 1 | Novel | |||||||
| 138 | TSC22D2 | rs59500396 | 1 | 1 | Known | |||||||
| 139 | TTC28 | rs5752774 | 1 | 1 | Known | |||||||
| 140 | UNC5B | rs79416409 | 1 | 1 | Novel | |||||||
| 141 | ZNF280D | rs1647381 | 1 | 1 | Known | |||||||
| 142 | ZNF516 | rs72973714 | 1 | 1 | Novel |
| Gene | Chr | Position | Z_Score | Effect Size | p-Value | Var_g | pred_perf r2 | pred_perf pval ¥ | pred_perf qval | n_snps in Model | COLOC |
|---|---|---|---|---|---|---|---|---|---|---|---|
| AFAP1 | 4 | 7851047 | −7.7319 | −8.77 × 10⁻² | 1.06 × 10⁻¹⁴ | 0.71242 | 0.72019 | 1.12 × 10−256 | 1.10 × 10−254 | 95 | Passed |
| CDKN2A | 9 | 21981525.5 | −6.51 | −3.07 × 10⁻¹ | 7.51 × 10⁻¹¹ | 0.04310 | 0.07153 | 1.45 × 10⁻¹⁶ | 3.79 × 10⁻¹⁶ | 19 | Rejected |
| TMEM136 | 11 | 120200114.5 | 6.42912 | 7.36 × 10⁻¹ | 1.28 × 10⁻¹⁰ | 0.00684 | 0.01375 | 3.59 × 10⁻⁴ | 5.59 × 10⁻⁴ | 12 | Passed |
| C22orf29 | 22 | 19838040 | 6.10818 | 1.20 × 10⁻¹ | 1.01 × 10⁻⁹ | 0.26323 | 0.30708 | 2.46 × 10−75 | 2.16 × 10−74 | 34 | Passed |
| FAM125B | 9 | 129179224 | 5.71259 | 1.32 × 10⁻¹ | 1.11 × 10⁻⁸ | 0.17292 | 0.23350 | 4.06 × 10−55 | 2.54 × 10−54 | 48 | Rejected |
| EHBP1L1 | 11 | 65351815 | 5.65037 | 5.88 × 10⁻¹ | 1.60 × 10⁻⁸ | 0.00914 | 0.01596 | 1.20 × 10⁻⁴ | 1.92 × 10⁻⁴ | 10 | Passed |
| ACP2 | 11 | 47265655 | −5.6276 | −8.67 × 10⁻² | 1.83 × 10⁻⁸ | 0.35781 | 0.40112 | 1.57 × 10−104 | 2.19 × 10−103 | 30 | Passed |
| LTBP3 | 11 | 65316338.5 | −5.4319 | −1.07 × 10⁻¹ | 5.57 × 10⁻⁸ | 0.24976 | 0.26340 | 4.32 × 10−63 | 3.12 × 10−62 | 42 | Passed |
| GAS7 | 17 | 9957897 | −5.1001 | −1.43 × 10⁻¹ | 3.40 × 10⁻⁷ | 0.11391 | 0.10400 | 9.33 × 10⁻²⁴ | 3.01 × 10⁻²³ | 117 | Rejected |
| NR1H3 | 11 | 47280123.5 | −4.9212 | −8.27 × 10⁻² | 8.60 × 10⁻⁷ | 0.30798 | 0.28447 | 6.61 × 10−69 | 5.24 × 10−68 | 66 | Passed |
| C17orf69 | 17 | 43711638 | 4.73445 | 7.05 × 10⁻² | 2.20 × 10⁻⁶ | 0.44321 | 0.50460 | 1.77 × 10−142 | 4.25 × 10−141 | 28 | Passed |
| NPEPPS | 17 | 45650475 | −4.6292 | −1.86 × 10⁻¹ | 3.67 × 10⁻⁶ | 0.05724 | 0.07549 | 1.97 × 10⁻¹⁷ | 5.27 × 10⁻¹⁷ | 22 | Rejected |
| Tissue | Gene Name | Top eQTL SNP | Top SNP Chr:Position | A1/A2 | β GWAS | SE GWAS | P GWAS | β eQTL | SE eQTL | P eQTL | β SMR | SE SMR | P SMR | P HEIDI | HEIDI |
|---|---|---|---|---|---|---|---|---|---|---|---|---|---|---|---|
| Blood | RP11-466F5.8 | rs2790049 | 1:165743523 | A/G | 0.3137 | 0.019 | 2.68 × 10−61 | 0.2014 | 0.0149 | 7.75 × 10−42 | 1.5574 | 0.1486 | 1.10 × 10⁻²⁵ | 3.93 × 10⁻⁵ | Rejected |
| RP11-217B7.2 | rs2980083 | 9:107691362 | A/C | 0.1039 | 0.0135 | 1.51 × 10⁻¹⁴ | 0.2011 | 0.0089 | 3.24 × 10−114 | 0.5166 | 0.071 | 3.32 × 10⁻¹³ | 5.72 × 10⁻⁴ | Rejected | |
| AFAP1 | rs62290601 | 4:7939008 | A/T | −0.1024 | 0.0146 | 2.35 × 10⁻¹² | 1.077 | 0.0091 | 0.00E+00 # | −0.0951 | 0.0136 | 2.57 × 10⁻¹² | 6.34 × 10⁻¹² | Rejected | |
| MVB12B | rs10122788 | 9:129206832 | A/G | −0.0761 | 0.0135 | 1.52 × 10⁻⁸ | −0.5181 | 0.0085 | 0.00E+00 # | 0.1469 | 0.0261 | 1.75 × 10⁻⁸ | 8.54 × 10⁻¹ | Passed | |
| NR1H3 | rs326222 | 11:47259668 | C/T | −0.0781 | 0.0143 | 4.32 × 10⁻⁸ | 0.3878 | 0.0086 | 0.00E+00 # | −0.2013 | 0.037 | 5.40 × 10⁻⁸ | 1.39 × 10⁻¹ | Passed | |
| LTBP3 | rs12789028 | 11:65326154 | A/G | −0.0981 | 0.0181 | 5.97 × 10⁻⁸ | 0.4798 | 0.0118 | 0.00E+00 # | −0.2045 | 0.0381 | 7.79 × 10⁻⁸ | 1.46 × 10⁻¹ | Passed | |
| BICC1 | rs10740734 | 10:60364363 | A/G | −0.0725 | 0.0134 | 6.78 × 10⁻⁸ | 0.1728 | 0.0089 | 3.58 × 10−84 | −0.4196 | 0.0807 | 1.99 × 10⁻⁷ | 2.18 × 10⁻¹ | Passed | |
| TMCO1 | rs4657473 | 1:165687151 | T/C | −0.0941 | 0.0152 | 5.85 × 10⁻¹⁰ | 0.0872 | 0.0098 | 5.15 × 10⁻¹⁹ | −1.08 | 0.2123 | 3.66 × 10⁻⁷ | 9.08 × 10⁻⁶ | Rejected | |
| EHBP1L1 | rs1346 | 11:65337251 | T/A | −0.0979 | 0.018 | 5.06 × 10⁻⁸ | −0.1473 | 0.0121 | 4.10 × 10⁻³⁴ | 0.6648 | 0.1337 | 6.56 × 10⁻⁷ | 4.67 × 10⁻¹ | Passed | |
| TXNRD2 | rs117985725 | 22:19860852 | C/T | −0.133 | 0.0267 | 5.98 × 10⁻⁷ | −0.4449 | 0.0209 | 1.76 × 10−100 | 0.299 | 0.0615 | 1.17 × 10⁻⁶ | 3.88 × 10⁻⁶ | Rejected | |
| ABCA1 | rs2487052 | 9:107686405 | T/C | −0.0858 | 0.0169 | 3.61 × 10⁻⁷ | −0.1588 | 0.0108 | 1.18 × 10−48 | 0.5402 | 0.1124 | 1.53 × 10⁻⁶ | 2.25 × 10⁻² | Passed | |
| KANSL1-AS1 | rs112073200 | 17:44201791 | C/G | 0.0772 | 0.0163 | 2.22 × 10⁻⁶ | 0.9074 | 0.0128 | 0.00E+00 # | 0.0851 | 0.018 | 2.34 × 10⁻⁶ | 1.09 × 10⁻² | Passed | |
| RP11-707O23.5 | rs112073200 | 17:44201791 | C/G | 0.0772 | 0.0163 | 2.22 × 10⁻⁶ | 0.8722 | 0.0129 | 0.00E+00 # | 0.0885 | 0.0188 | 2.35 × 10⁻⁶ | 2.34 × 10⁻¹ | Passed | |
| RP11-259G18.1 | rs112073200 | 17:44201791 | C/G | 0.0772 | 0.0163 | 2.22 × 10⁻⁶ | 0.496 | 0.0137 | 1.90 × 10−288 | 0.1556 | 0.0332 | 2.70 × 10⁻⁶ | 5.19 × 10⁻² | Passed | |
| DND1P1 | rs113991678 | 17:43795634 | T/C | 0.0766 | 0.0163 | 2.65 × 10⁻⁶ | 0.7525 | 0.013 | 0.00E+00 # | 0.1017 | 0.0217 | 2.85 × 10⁻⁶ | 1.72 × 10⁻¹ | Passed | |
| CRHR1-IT1 | rs112560196 | 17:44200078 | T/A | 0.0764 | 0.0163 | 2.83 × 10⁻⁶ | 1.1528 | 0.0119 | 0.00E+00 # | 0.0663 | 0.0142 | 2.90 × 10⁻⁶ | 6.64 × 10⁻¹ | Passed | |
| LRRC37A4P | rs112560196 | 17:44200078 | T/A | 0.0764 | 0.0163 | 2.83 × 10⁻⁶ | −0.9098 | 0.0127 | 0.00E+00 # | −0.084 | 0.018 | 2.97 × 10⁻⁶ | 2.45 × 10⁻¹ | Passed | |
| LRRC37A2 | rs112560196 | 17:44200078 | T/A | 0.0764 | 0.0163 | 2.83 × 10⁻⁶ | 0.7104 | 0.0132 | 0.00E+00 # | 0.1076 | 0.0231 | 3.08 × 10⁻⁶ | 7.72 × 10⁻³ | Passed | |
| Brain | TXNRD2 | rs73148965 | 22:19872935 | G/A | 0.1463 | 0.0211 | 3.99 × 10⁻¹² | 1.3077 | 0.0362 | 4.05 × 10−285 | 0.1119 | 0.0164 | 9.57 × 10⁻¹² | 2.01 × 10⁻² | Passed |
| RP11-466F5.8 | rs10918274 | 1:165714416 | C/T | −0.305 | 0.0188 | 5.96 × 10−59 | −0.3408 | 0.0588 | 6.66 × 10⁻⁹ | 0.8949 | 0.1639 | 4.77 × 10⁻⁸ | 4.72 × 10⁻³ | Rejected | |
| CDKN2B-AS1 | rs504318 | 9:22024023 | T/A | −0.1632 | 0.0135 | 1.50 × 10⁻³³ | −0.2904 | 0.0522 | 2.62 × 10⁻⁸ | 0.562 | 0.1112 | 4.33 × 10⁻⁷ | 2.03 × 10⁻¹ | Passed | |
| CDKN2B | rs490005 | 9:22020493 | A/G | −0.1631 | 0.0135 | 1.24 × 10⁻³³ | −0.2126 | 0.0384 | 3.16 × 10⁻⁸ | 0.767 | 0.1525 | 4.90 × 10⁻⁷ | 1.41 × 10⁻¹ | Passed | |
| RP11-217B7.2 | rs1800977 | 9:107690450 | G/A | 0.0846 | 0.0144 | 3.95 × 10⁻⁹ | 0.5958 | 0.073 | 3.31 × 10⁻¹⁶ | 0.142 | 0.0297 | 1.80 × 10⁻⁶ | 3.45 × 10⁻³ | Rejected | |
| RP11-707O23.5 | rs17575507 | 17:44134095 | G/A | 0.0771 | 0.0163 | 2.26 × 10⁻⁶ | 1.465 | 0.0381 | 0.00E+00 # | 0.0526 | 0.0112 | 2.68 × 10⁻⁶ | 5.56 × 10⁻¹ | Passed | |
| LRRC37A2 | rs62641967 | 17:44047216 | G/T | 0.0766 | 0.0163 | 2.65 × 10⁻⁶ | 1.3074 | 0.0331 | 0.00E+00 # | 0.0586 | 0.0126 | 3.11 × 10⁻⁶ | 5.66 × 10⁻² | Passed | |
| LRRC37A | rs62641967 | 17:44047216 | G/T | 0.0766 | 0.0163 | 2.65 × 10⁻⁶ | 1.3199 | 0.0339 | 0.00E+00 # | 0.058 | 0.0124 | 3.13 × 10⁻⁶ | 5.31 × 10⁻² | Passed | |
| LRRC37A4P | rs112746008 | 17:44126650 | T/C | 0.077 | 0.0163 | 2.46 × 10⁻⁶ | −1.3756 | 0.0444 | 4.34 × 10−211 | −0.056 | 0.012 | 3.19 × 10⁻⁶ | 3.28 × 10⁻¹ | Passed | |
| MAPT | rs62641967 | 17:44047216 | G/T | 0.0766 | 0.0163 | 2.65 × 10⁻⁶ | −1.1792 | 0.0341 | 2.77 × 10−262 | −0.0649 | 0.014 | 3.26 × 10⁻⁶ | 5.28 × 10⁻³ | Passed |
| Tissue | Probe ID | Nearest Gene | Top mQTL SNP | Top SNP Chr:Position | A1/A2 | β GWAS | SE GWAS | P GWAS | β mQTL | SE mQTL | P mQTL | β MSMR | SE MSMR | P MSMR | P HEIDI |
|---|---|---|---|---|---|---|---|---|---|---|---|---|---|---|---|
| Blood | cg17332705 | AFAP1-AS1 | rs62290601 | 4:7939008 | A/T | −0.1024 | 0.0146 | 2.35 × 10⁻¹² | 0.2569 | 0.0330 | 6.68 × 10⁻¹⁵ | −0.3986 | 0.0765 | 1.87 × 10⁻⁷ | 1.85 × 10⁻³ |
| cg24250820 | AFAP1 | rs55938116 | 4:7933940 | A/C | −0.1036 | 0.0148 | 2.66 × 10⁻¹² | 0.2685 | 0.0317 | 2.17 × 10⁻¹⁷ | −0.3859 | 0.0715 | 6.78 × 10⁻⁸ | 1.08 × 10⁻² | |
| cg12728606 | AFAP1 | rs2891928 | 4:7924802 | G/C | 0.1443 | 0.0137 | 7.16 × 10⁻²⁶ | −0.5031 | 0.0329 | 6.38 × 10−53 | −0.2869 | 0.0331 | 4.34 × 10⁻¹⁸ | 2.45 × 10⁻³ | |
| cg24023194 | AFAP1 | rs56220381 | 4:7907636 | A/G | −0.1294 | 0.0140 | 3.20 × 10⁻²⁰ | 0.2220 | 0.0324 | 6.85 × 10⁻¹² | −0.5827 | 0.1059 | 3.75 × 10⁻⁸ | 1.56 × 10⁻¹ | |
| cg15957394 | AFAP1 (dist = 169) | rs17771470 | 4:7931611 | C/G | −0.1119 | 0.0143 | 5.39 × 10⁻¹⁵ | −0.3150 | 0.0324 | 2.32 × 10⁻²² | 0.3552 | 0.0583 | 1.11 × 10⁻⁹ | 1.83 × 10⁻³ | |
| cg19564367 | AFAP1 (dist = 198) | rs56078222 | 4:7932073 | C/T | −0.1037 | 0.0145 | 9.74 × 10⁻¹³ | −0.2740 | 0.0350 | 4.96 × 10⁻¹⁵ | 0.3786 | 0.0718 | 1.34 × 10⁻⁷ | 1.57 × 10⁻³ | |
| cg09806625 | EXOC2 | rs17135234 | 6:593109 | C/A | 0.1490 | 0.0190 | 4.04 × 10⁻¹⁵ | 1.4851 | 0.0317 | 0.00E+00 # | 0.1003 | 0.0130 | 9.52 × 10⁻¹⁵ | 1.84 × 10⁻² | |
| cg21084119 | EXOC2 | rs17135679 | 6:614787 | C/T | 0.1462 | 0.0186 | 3.43 × 10⁻¹⁵ | −0.4399 | 0.0316 | 4.82 × 10−44 | −0.3323 | 0.0485 | 7.20 × 10⁻¹² | 1.28 × 10⁻² | |
| cg14812743 | PDE7B | rs6570062 | 6:136388422 | T/G | −0.0943 | 0.0139 | 1.32 × 10⁻¹¹ | −0.3324 | 0.0329 | 5.49 × 10⁻²⁴ | 0.2837 | 0.0505 | 1.89 × 10⁻⁸ | 1.18 × 10⁻² | |
| cg14470647 | ABCA1 | rs1800977 | 9:107690450 | A/G | −0.0846 | 0.0144 | 3.95 × 10⁻⁹ | −0.3347 | 0.0330 | 3.60 × 10⁻²⁴ | 0.2528 | 0.0497 | 3.56 × 10⁻⁷ | 2.43 × 10⁻³ | |
| cg13430450 | ABCA1 (dist = 536) | rs2422493 | 9:107690995 | A/G | −0.1037 | 0.0136 | 2.06 × 10⁻¹⁴ | −0.2364 | 0.0327 | 4.55 × 10⁻¹³ | 0.4389 | 0.0835 | 1.47 × 10⁻⁷ | 8.62 × 10⁻³ | |
| cg05938607 | BICC1 | rs10740731 | 10:60348886 | G/A | 0.0736 | 0.0134 | 3.85 × 10⁻⁸ | 0.8782 | 0.0273 | 4.86 × 10−227 | 0.0838 | 0.0155 | 5.99 × 10⁻⁸ | 3.28 × 10⁻¹ | |
| cg12342675 | BICC1 | rs7474570 | 10:60343085 | C/G | 0.0714 | 0.0134 | 9.69 × 10⁻⁸ | 1.1076 | 0.0224 | 0.00E+00 # | 0.0645 | 0.0122 | 1.15 × 10⁻⁷ | 6.11 × 10⁻¹ | |
| cg10738003 | ARHGEF12 | rs7117321 | 11:120239051 | C/T | 0.0827 | 0.0135 | 9.00 × 10⁻¹⁰ | −1.2781 | 0.0161 | 0.00E+00 # | −0.0647 | 0.0106 | 1.01 × 10⁻⁹ | 7.19 × 10⁻³ | |
| Brain | cg15605172 | ACOXL | rs6720503 | 2:111665137 | A/G | 0.0822 | 0.0142 | 6.79 × 10⁻⁹ | 1.2623 | 0.0341 | 1.00 × 10−300 | 0.0651 | 0.0114 | 1.02 × 10⁻⁸ | 1.55 × 10⁻³ |
| cg25107522 | DGKD | rs7422272 | 2:234268308 | A/C | −0.0759 | 0.0137 | 3.17 × 10⁻⁸ | −1.2605 | 0.0340 | 1.00 × 10−300 | 0.0602 | 0.0110 | 4.47 × 10⁻⁸ | 2.31 × 10⁻² | |
| cg20312457 | AFAP1 | rs35609019 | 4:7847892 | G/C | 0.1148 | 0.0148 | 8.56 × 10⁻¹⁵ | 0.4871 | 0.0603 | 6.28 × 10⁻¹⁶ | 0.2356 | 0.0421 | 2.17 × 10⁻⁸ | 4.60 × 10⁻³ | |
| cg24023194 | AFAP1 | rs13435730 | 4:7923991 | G/A | 0.1418 | 0.0137 | 4.81 × 10⁻²⁵ | 0.4259 | 0.0625 | 9.67 × 10⁻¹² | 0.3330 | 0.0585 | 1.29 × 10⁻⁸ | 6.70 × 10⁻¹ | |
| cg07406289 | AFAP1 | rs2385902 | 4:7921634 | A/G | 0.1419 | 0.0137 | 2.97 × 10⁻²⁵ | 0.3745 | 0.0632 | 3.05 × 10⁻⁹ | 0.3789 | 0.0736 | 2.62 × 10⁻⁷ | 6.79 × 10⁻¹ | |
| cg08544002 | EXOC2 | rs17756712 | 6:625071 | A/G | −0.1208 | 0.0169 | 9.46 × 10⁻¹³ | −1.4534 | 0.0376 | 0.00E+00 # | 0.0831 | 0.0118 | 2.22 × 10⁻¹² | 1.35 × 10⁻² | |
| cg21084119 | EXOC2 | rs17756712 | 6:625071 | A/G | −0.1208 | 0.0169 | 9.46 × 10⁻¹³ | −1.4224 | 0.0379 | 3.47 × 10−308 | 0.0849 | 0.0121 | 2.34 × 10⁻¹² | 1.62 × 10⁻³ | |
| cg14470647 | ABCA1 | rs2243312 | 9:107690124 | A/G | 0.0825 | 0.0143 | 8.49 × 10⁻⁹ | 0.5031 | 0.0440 | 3.10 × 10⁻³⁰ | 0.1640 | 0.0319 | 2.71 × 10⁻⁷ | 6.13 × 10⁻² | |
| cg01159576 | LMX1B | rs62578127 | 9:129386860 | C/T | 0.1279 | 0.0153 | 6.45 × 10⁻¹⁷ | −0.3895 | 0.0477 | 3.33 × 10⁻¹⁶ | −0.3282 | 0.0562 | 5.27 × 10⁻⁹ | 3.29 × 10⁻² | |
| cg09696939 | BICC1 (dist = 823) | rs10740731 | 10:60348886 | G/A | 0.0736 | 0.0134 | 3.85 × 10⁻⁸ | 1.2146 | 0.0328 | 1.00 × 10−300 | 0.0606 | 0.0111 | 5.38 × 10⁻⁸ | 1.18 × 10⁻² | |
| cg00554250 | NR1H3 | rs1052373 | 11:47354787 | C/T | −0.0843 | 0.0140 | 1.97 × 10⁻⁹ | 1.3202 | 0.0356 | 1.00 × 10−300 | −0.0638 | 0.0108 | 3.15 × 10⁻⁹ | 3.34 × 10⁻³ | |
| cg14056187 | C14orf39 (dist = 1445) | rs7155448 | 14:60937851 | C/T | −0.1184 | 0.0141 | 3.98 × 10⁻¹⁷ | 0.3808 | 0.0452 | 3.70 × 10⁻¹⁷ | −0.3110 | 0.0522 | 2.64 × 10⁻⁹ | 2.22 × 10⁻² | |
| cg01170045 | SIX6 (dist = 4306) | rs61991551 | 14:60982515 | A/G | −0.1187 | 0.0141 | 3.46 × 10⁻¹⁷ | −0.4162 | 0.0648 | 1.38 × 10⁻¹⁰ | 0.2851 | 0.0558 | 3.28 × 10⁻⁷ | 1.48 × 10⁻¹ | |
| cg10299448 | GAS7 | rs17687006 | 17:10019797 | C/T | 0.1102 | 0.0167 | 4.36 × 10⁻¹¹ | −0.6465 | 0.0533 | 8.03 × 10⁻³⁴ | −0.1705 | 0.0294 | 7.01 × 10⁻⁹ | 1.67 × 10⁻² | |
| cg15661389 | GAS7 | rs17687006 | 17:10019797 | C/T | 0.1102 | 0.0167 | 4.36 × 10⁻¹¹ | −0.5267 | 0.0548 | 6.75 × 10⁻²² | −0.2092 | 0.0385 | 5.42 × 10⁻⁸ | 3.14 × 10⁻² | |
| cg19784903 | TBKBP1 | rs4794057 | 17:45786452 | C/T | −0.0692 | 0.0137 | 4.14 × 10⁻⁷ | 1.0926 | 0.0277 | 0.00E+00 # | −0.0634 | 0.0126 | 5.14 × 10⁻⁷ | 2.93 × 10⁻³ |
Publisher’s Note: MDPI stays neutral with regard to jurisdictional claims in published maps and institutional affiliations. |
© 2022 by the authors. Licensee MDPI, Basel, Switzerland. This article is an open access article distributed under the terms and conditions of the Creative Commons Attribution (CC BY) license (https://creativecommons.org/licenses/by/4.0/).
Share and Cite
Asefa, N.G.; Kamali, Z.; Pereira, S.; Vaez, A.; Jansonius, N.; Bergen, A.A.; Snieder, H. Bioinformatic Prioritization and Functional Annotation of GWAS-Based Candidate Genes for Primary Open-Angle Glaucoma. Genes 2022, 13, 1055. https://0-doi-org.brum.beds.ac.uk/10.3390/genes13061055
Asefa NG, Kamali Z, Pereira S, Vaez A, Jansonius N, Bergen AA, Snieder H. Bioinformatic Prioritization and Functional Annotation of GWAS-Based Candidate Genes for Primary Open-Angle Glaucoma. Genes. 2022; 13(6):1055. https://0-doi-org.brum.beds.ac.uk/10.3390/genes13061055
Chicago/Turabian StyleAsefa, Nigus G., Zoha Kamali, Satyajit Pereira, Ahmad Vaez, Nomdo Jansonius, Arthur A. Bergen, and Harold Snieder. 2022. "Bioinformatic Prioritization and Functional Annotation of GWAS-Based Candidate Genes for Primary Open-Angle Glaucoma" Genes 13, no. 6: 1055. https://0-doi-org.brum.beds.ac.uk/10.3390/genes13061055