Article

Identification of Differentially Expressed IGFBP5-Related Genes in Breast Cancer Tumor Tissues Using cDNA Microarray Experiments

1
Department of Medical Biology, School of Medicine, Marmara University, Istanbul 34854, Turkey
2
General Surgery, School of Medicine, Marmara University, Istanbul 34899, Turkey
3
Department of Pathology, School of Medicine, Marmara University, Istanbul 34899, Turkey
*
Author to whom correspondence should be addressed.
Submission received: 3 September 2015 / Revised: 2 November 2015 / Accepted: 5 November 2015 / Published: 10 November 2015
(This article belongs to the Section Human Genomics and Genetic Diseases)

Abstract

:
IGFBP5 is an important regulatory protein in breast cancer progression. We tried to identify differentially expressed genes (DEGs) between breast tumor tissues with IGFBP5 overexpression and their adjacent normal tissues. In this study, thirty-eight breast cancer and adjacent normal breast tissue samples were used to determine IGFBP5 expression by qPCR. cDNA microarrays were applied to the highest IGFBP5 overexpressed tumor samples compared to their adjacent normal breast tissue. Microarray analysis revealed that a total of 186 genes were differentially expressed in breast cancer compared with normal breast tissues. Of the 186 genes, 169 genes were downregulated and 17 genes were upregulated in the tumor samples. KEGG pathway analyses showed that protein digestion and absorption, focal adhesion, salivary secretion, drug metabolism-cytochrome P450, and phenylalanine metabolism pathways are involved. Among these DEGs, the prominent top two genes (MMP11 and COL1A1) which potentially correlated with IGFBP5 were selected for validation using real time RT-qPCR. Only COL1A1 expression showed a consistent upregulation with IGFBP5 expression and COL1A1 and MMP11 were significantly positively correlated. We concluded that the discovery of coordinately expressed genes related with IGFBP5 might contribute to understanding of the molecular mechanism of the function of IGFBP5 in breast cancer. Further functional studies on DEGs and association with IGFBP5 may identify novel biomarkers for clinical applications in breast cancer.

Graphical Abstract

1. Introduction

The insulin-like growth factor (IGF) signaling pathway has an important role in cell growth, differentiation, apoptosis regulation and tumor development [1]. The IGF axis comprises two growth factors (IGF-I, IGF-II), two IGF receptors (IGF-IR, IGF-IIR), and seven IGF-binding proteins (IGFBPs) which regulate the mitogenic activities of the IGFs, a group of IGFBP-related proteins that bind IGFs with low affinity and IGFBP proteases. IGFBP5 is the most conserved binding protein of the IGFBP family in all vertebrates and is frequently dysregulated in human cancers.
IGFBP5 has numerous functional roles in carcinogenesis and it acts both IGF-dependent and independent mechanisms [2]. There are many findings and assumptions about the role of IGFBP5 and it is very crucial to identify the role of IGFBP5 in cancer progression, especially in breast cancer. Some studies concluded that IGFBP5 acts as an oncogene, since the high protein level is linked to proliferation, metastasis, poor prognosis, drug sensitivity and limited response to endocrine treatment, but on the other hand some studies revealed that IGFBP5 acts as a tumor suppressor gene due to being related with apoptotic, anti-metastatic, and anti-migratory effects and good outcomes [1].
Some studies indicated that IGFBP5 expression is high in tumors and considered IGFBP-5 as having pro-metastatic capacity [3,4]. Exogenous IGFBP5 has been shown to have a protective effect for ceramid-induced apoptosis [5]. IGFBP5 accumulates in the cytoplasm and is related with bad prognoses in the breast cancer tissue [6]. Our group previously reported that apoptotic and migratory potential of IGFBP5 depends on cellular localization which is regulated by nuclear localization signal into C-terminal domain of the protein in breast cancer cells [7]. Overexpression of IGFBP5 has been found to be associated with poor outcomes of breast cancer patients [8]. A recently published study indicated the important role of IGFBP5 in tumor progression in urothelial carcinoma and associated IGFBP5 over-expression with advanced tumor stage, frequent mitosis and poorer clinical outcomes [9].
A recently published genome-wide association study (GWAS) shows that the 2p35 locus is an important risk factor for breast cancer [10]. Furthermore, an SNP in the locus rs4442975 (G/T) has been reported to contribute to changes in IGFBP5 expression. The data suggested that the G-allele of rs4442975 refers to increased breast cancer susceptibility through reduced IGFBP5 expression. IGFBP-5 expression was also shown to be correlated with increased survival rate and to help maintaining tumor sensitivity to tamoxifen in breast cancer patients [11]. The same study showed over-expression of IGFBP-5 in MCF-7 xenografts inhibited tumor development in mice. In other recent studies the tumor suppressant role of IGFBP-5 has been shown in melanoma cells [12], osteosarcoma [13] and ovarian cancer cells [14]. IGFBP5 has been also reported to suppress cell growth and cause G2/M arrest in PANC-1 pancreatic cancer cells [15]. Sureshbabu et al. [16] verified that IGFBP-5 increases epithelial cell adhesion to the extracellular matrix (ECM) in MCF-7 human breast cancer cells and at the same time inhibits migration by maintaining E-cadherin expression. Sureshbabu et al. assume that this is how IGFBP5 plays a key role in preventing metastasis. One of the latest reports on the subject showed that over-expression of IGFBP5 levels inhibited the epithelial-mesenchymal transition (EMT) and decreased E-cadherin expression and the key stem cell markers NANOG, SOX2, OCT4, KLF4, and CD133 in human melanoma cell line [12].
Besides the anti-apoptotic effects, IGFBP5 was shown to have stimulatory effects on apoptosis in different cancer types. Overexpression of IGFBP5 is known to inhibit IGF-I activation of IRS-1 (IR substrate-1), FKHRL-1 (forkhead in rhabdomyosarcoma-like 1) and protein kinase B. This indicates that IGFBP5 acts as an apoptotic factor by inhibiting the action of local IGF-I [17]. Butt [18] et al. found that IGFBP5 activates caspase 8 and 9 MDA-MB-231 breast cancer cell line, which leads to apoptosis through Bcl-2 in the intrinsic apoptotic pathway. The apoptosis-inducing role of IGFBP5 has also been shown in prostate cells [19] and ovarian cells [20]. Recently it was reported that IGFBP5 intercedes neuronal apoptosis through the regulation of mitochondrial cytochrome c release and caspase 3 activation [21].
The functional and clinical meaning of expressional differences of IGFBP5 in tumor tissue is still controversial. To reveal differences in the gene expression profile between IGFBP5 overexpression in breast cancer tissues compared to matched normal breast tissue, a cDNA microarray experiment was conducted. Importantly, one of the top differentially expressed genes (DEGs), COL1A1, was validated by real time RT-qPCR and a positive correlation with IGFBP5 overexpression was found. In addition, there was one more positive correlation between the expression of COL1A1 and MMP11. Therefore, our results suggest that these two genes work together coordinately and contribute to breast cancer progression.

2. Experimental Section

2.1. Clinicopathological Parameters of Breast Cancer Patients

In total, 38 breast cancer patients, who were diagnosed at the Department of General Surgery, Marmara University School of Medicine from July 2010 to January 2012, were included in this study. Patients were between the ages of 38 and 73 and the median age was 59. Patients’ ages, histologic types, tumor grades, molecular subtypes, hormone statuses (Her2, ER, PR), proliferation marker Ki67 statuses, menopausal statuses, numbers of pregnancies, ages of menarche, tumor sizes and localizations have been recorded (Table 1). Human epidermal growth factor receptor 2 (Her2), progesterone (PR), estrogen (ER) receptor and Ki67 statuses were evaluated by means of immunohistochemical staining with specific monoclonal antibody. Moreover, if the Her2 score was 2, fluorescence in situ hybridization (FISH) was performed to clarify the Her2 status. Molecular subtypes were determined by using Goldhirsch classification [22]. The study protocol was approved by the Local Ethics Committee of Marmara University (Istanbul, Turkey).
Table 1. Differences of clinicopathological parameters depending on tumoral expression of IGFBP5 compared to adjacent normal tissue.
CharacteristicsTumoral Expression of IGFBP5 Compared to Adjacent Normal Tissuep-Value
High (n = 21)Low (n = 17)
Age (years)55.6655.520.9684
Menarche age (years)12.9514.180.0149
Pregnancy (number)3.663.110.5876
Menopausal state
Pre73ns
Peri21
Post1213
Tumor size (mm)26.71230.3578
Tumor localization
Left1013ns
Right104
Bilateral10
Estrogen receptor status
Positive1613ns
Negative54
Progesterone receptor status
Positive14130.7210
Negative74
Her2 status
Positive520.4267
Negative1615
Ki67 status
Positive11120.3264
Negative105
Tumor grade
1050.0123
2&32112
Tumor histology
IDC1511ns
ILC10
IMC33
Others23
Molecular subtypes
Luminal A65ns
Luminal B Her2(−)47
Luminal B Her2(+)61
Erb-B2 overexpression12
Basal-like42

2.2. RNA Isolation and Quantification of IGFBP5 Expression in Breast Cancer Using qPCR

RNA was isolated from fresh frozen breast cancer and adjacent normal breast tissues from the 38 cases were isolated with High Pure RNA Tissue Kit according to instruction protocol (Roche, Mannheim, Germany). Transcriptor High Fidelity cDNA synthesis kit (Roche) was used for cDNA synthesis with 500 ng of total RNA in a reaction volume of 20 µL. Real time qRT-PCR was performed in 20 µL of final reaction volume with 5 µL of cDNA, 10 µL LightCycler 480 Probes Master mix, and 2 µL of primer-probe mix and 3 µL water to complete final volume. Reactions were carried out under the following cycling conditions: 5 min at 95 °C for pre-incubation, 10 s at 95 °C, 30 s 60 °C, 1 s 72 °C for amplification with 45 cycles, 10 s at 40 °C for cooling. All reactions were performed in duplicate for reference housekeeping gene, beta actin and IGFBP5 by using LightCycler 480 instrument. Relative quantification was calculated by delta-delta Ct method, subsequent to IGFBP5 expression normalization to beta actin expression.

2.3. Selection of Samples and Coding for Microarray

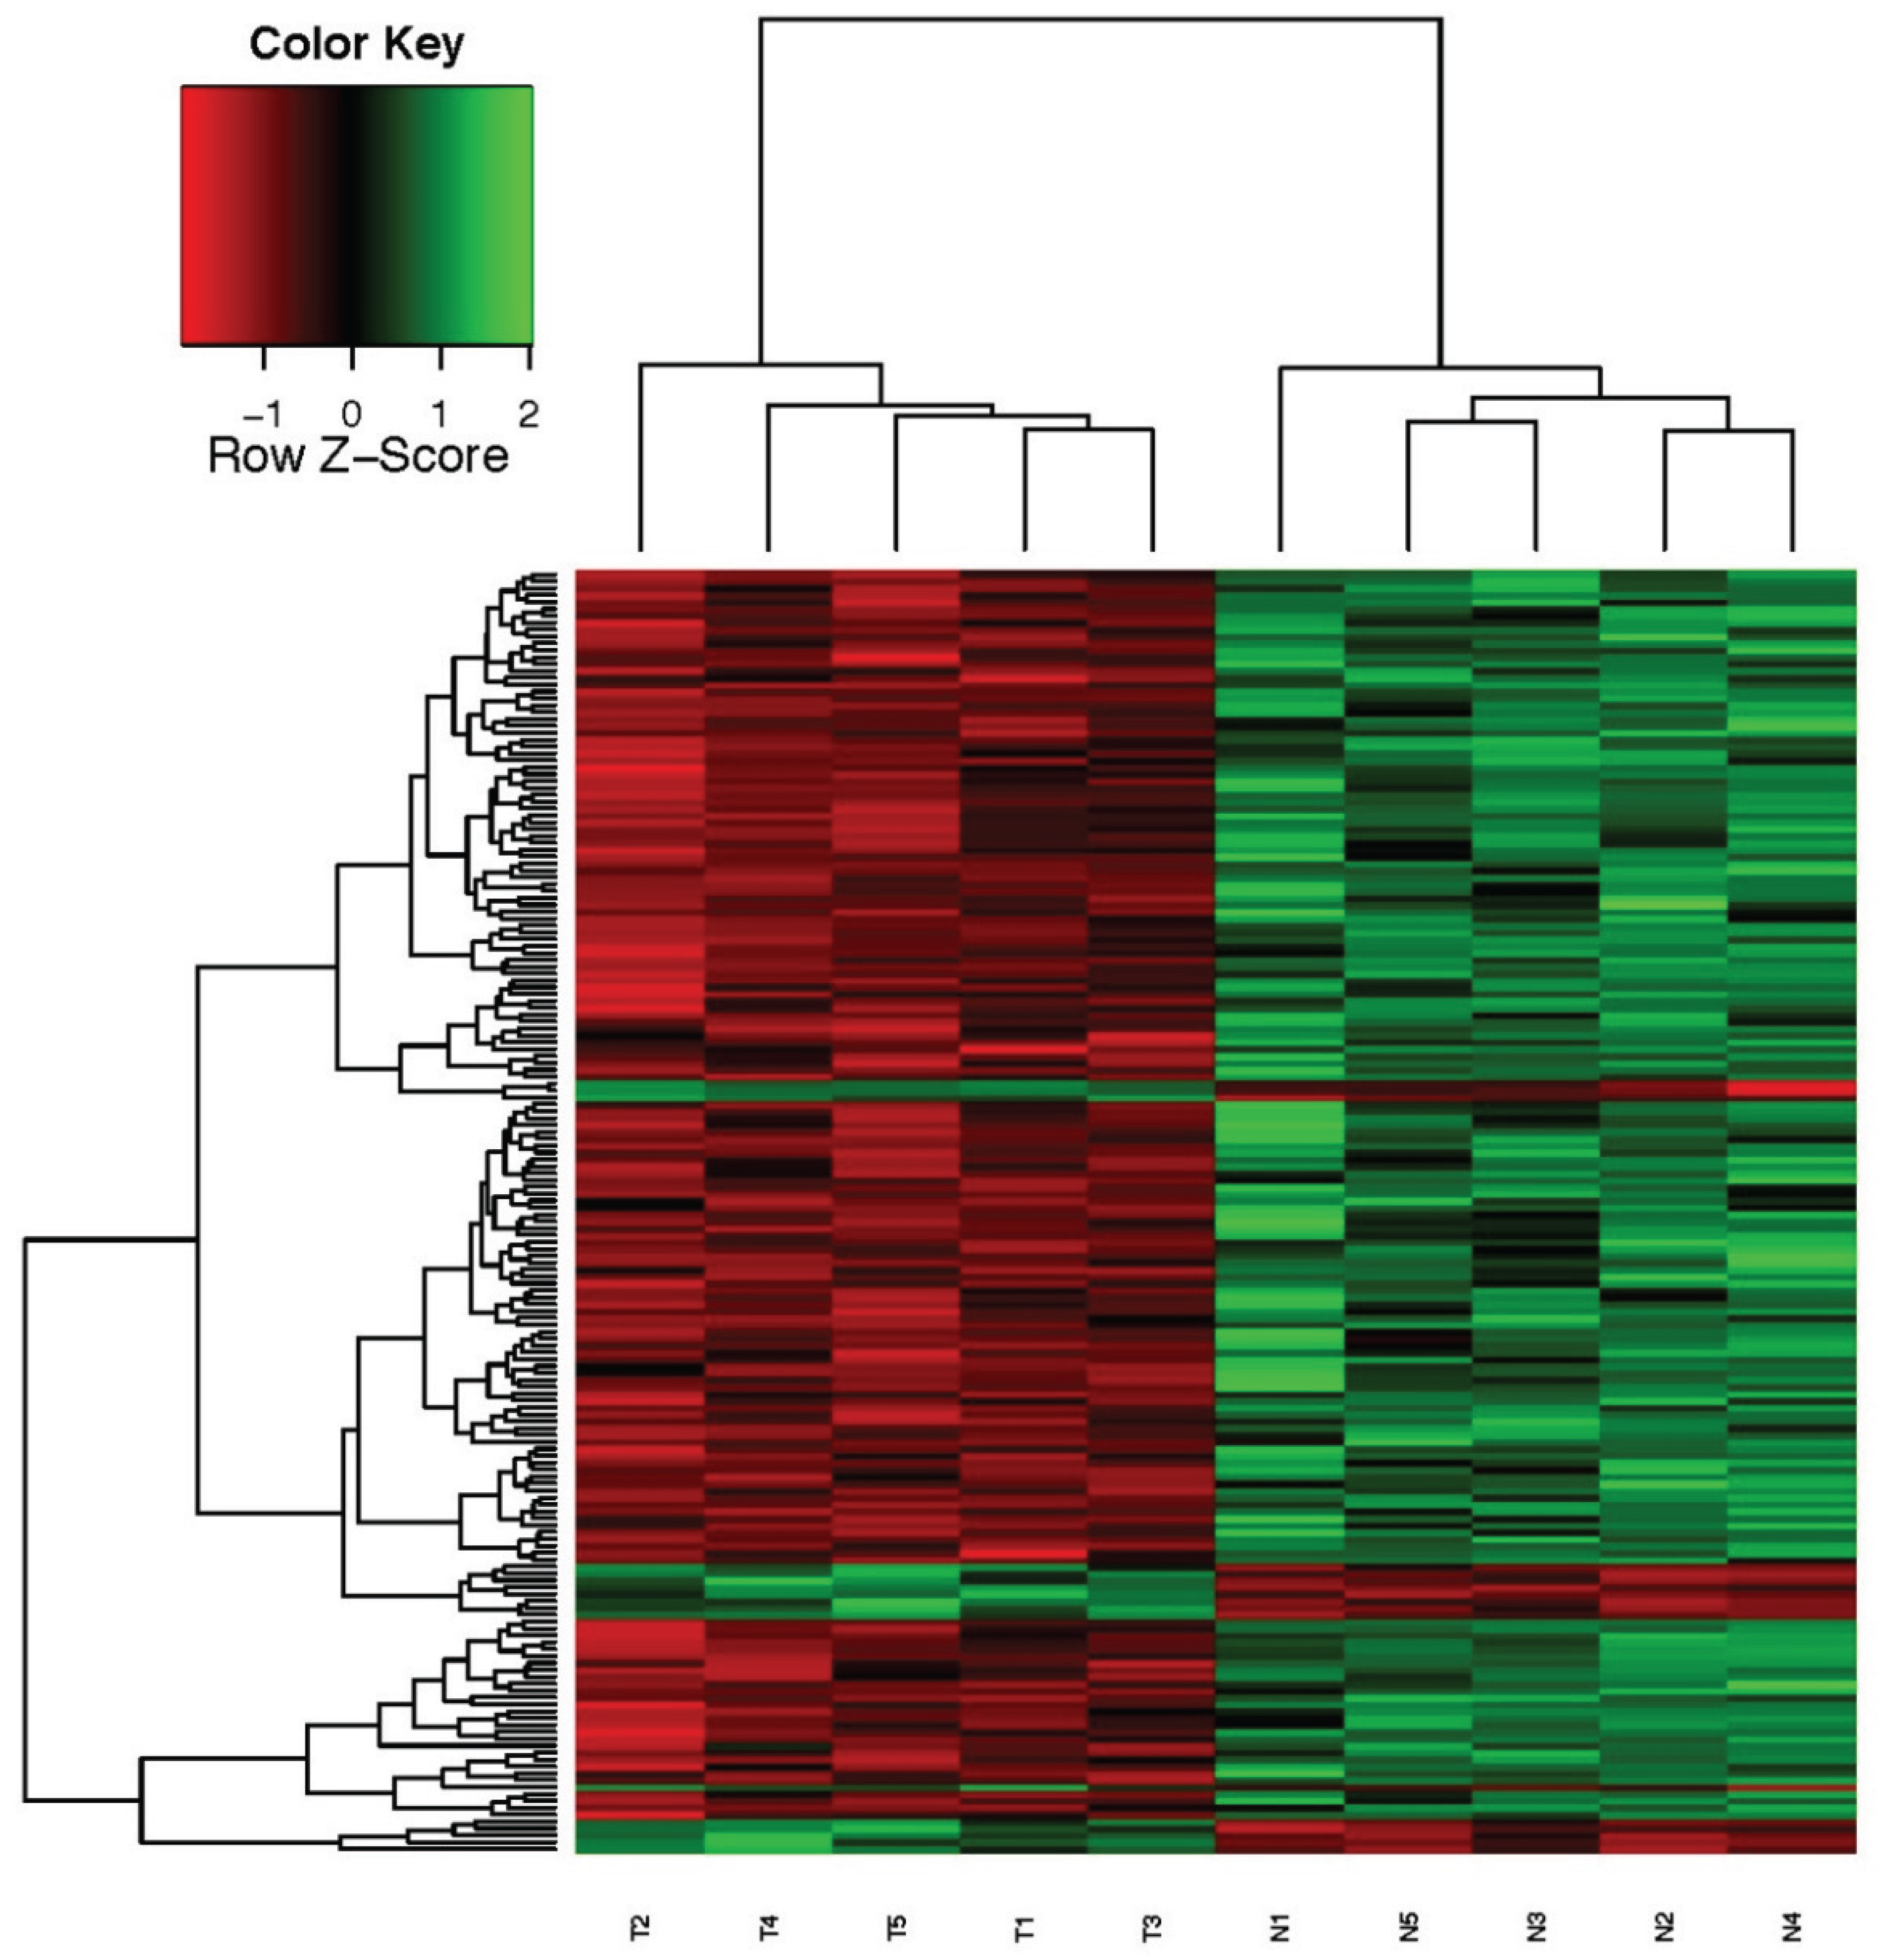
Of 38 samples for which we analyzed IGFBP5 expression level both in tumor and adjacent normal tissues, we selected those with the first 6 highest IGFBP5 expression in tumor samples compared to normal. T codes represent tumor tissues, N codes represent normal tissues. Microarray data analysis was excluded from one sample because it was found to be under the criteria for analysis. Finally, five tumor samples formed a group and five normal tissues formed another group. Examples belonging to the same group were evaluated as biological replicates. Tumor characteristics and fold changes of IGFBP5 expression in patients for use in microarray analysis are presented in Table 2.
Table 2. Tumor characteristics and fold changes of IGFBP5 expression in patients for use in microarray analysis.
Patients CodeAgeERPRHer2HistologyMolecular SubtypesStageSize (mm)Fold Changes of IGFBP5
T14760%60%(neg.)ILClumAT1N1152.276
T27350%10%(neg.)IDClumAT2N32316.528
T34090%90%(neg.)IMClumBT2N2303.233
T44290%60%(neg.)IDClumAT2N0222.022
T56770%70%(neg.)IDClumAT2N2304.892

2.4. Gene Expression Profiling by Microarray and Validation with qPCR

RNA quality of samples was carried out with Agilent Bioanalyzer. Gene expression profiling of highly expressed IGFBP5 in tumor tissue compared to their matching adjacent normal tissue were performed by using a humanHT-12 v4 expression bead chip (Illumina, CA, USA). Each bead chip has more than 47,000 probes derived from the National Center for Biotechnology Information Reference Sequence (NCBI) RefSeq Release 38 (7 November 2009) and other sources. The microarray data was converted into electronic data by means of the GenomeStudio program. Signal intensity graphics of microarray data before normalization were generated for quality control purposes. The background noise was removed from each sample for comparative data analysis and data percentages of all samples (quantile) were subjected to normalization. Then, for use in the data analysis step, log transformation was conducted on the data that has been normalized. Hierarchical clustering analysis of the whole genome gene expression profiles of the samples was carried out employing a “Euclidean-average” approach.
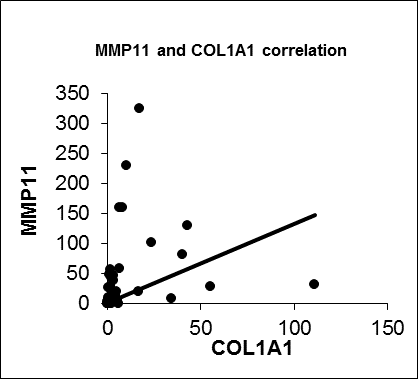
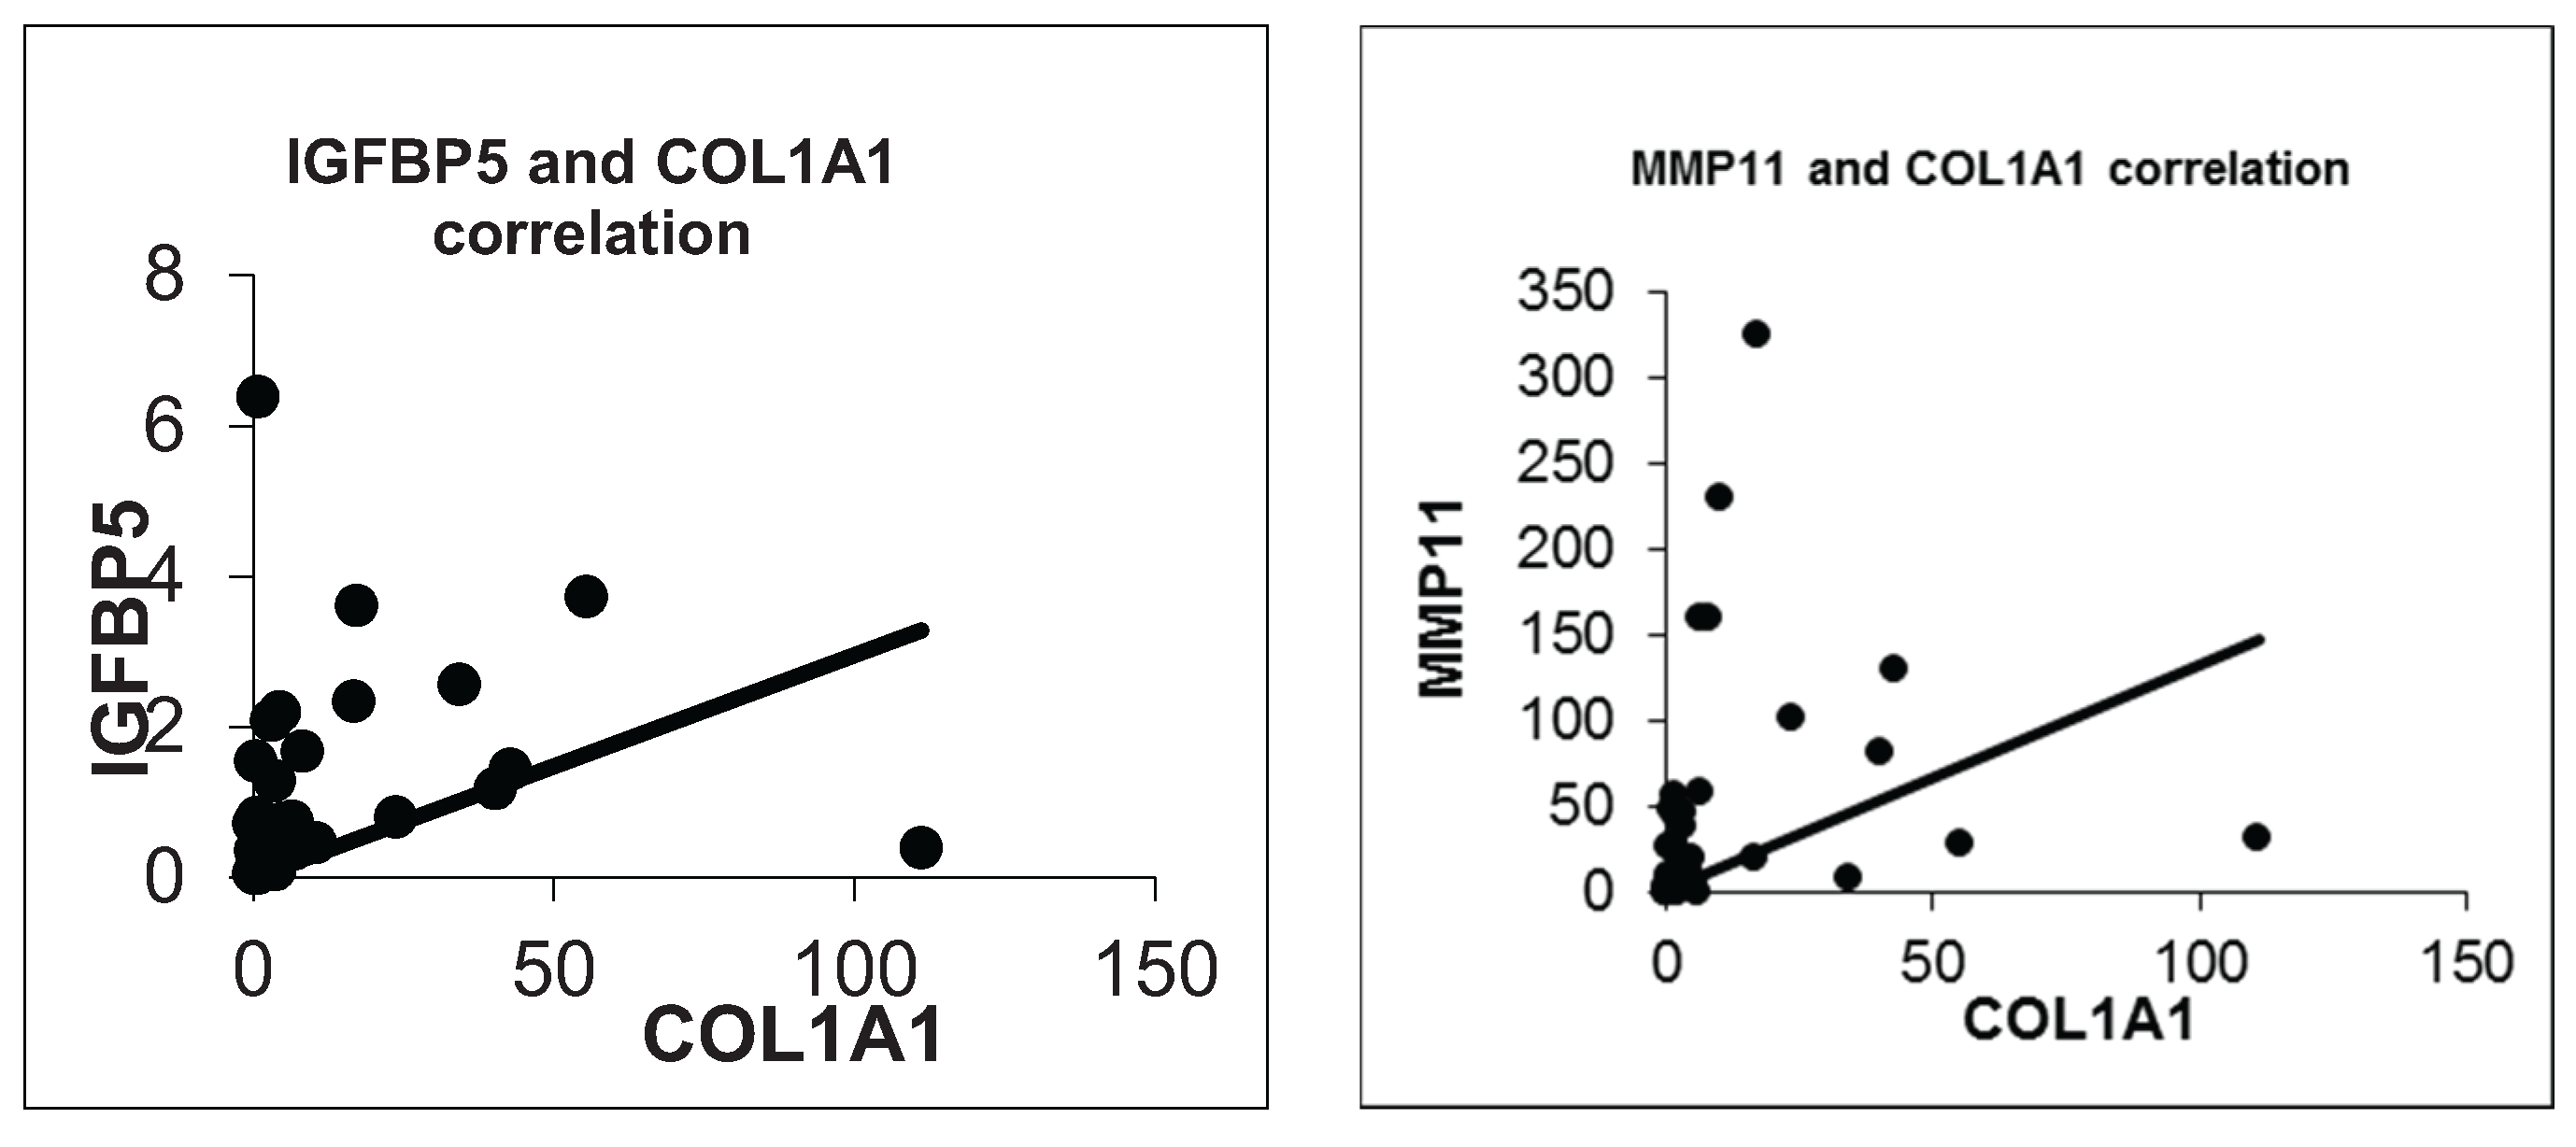
Validation of microarray results was accomplished by performing qRT-PCR on COL1A1 and MMP11 genes in 37 patients. The expression levels of the target genes in each sample were calculated with a ∆∆Ct method. Beta actin was used as a housekeeping gene and the relative quantification was done by normalizing the cancer tissue data to its adjacent normal tissue data. All qRT-PCR experiments were performed in duplicate.

2.5. Pathways Analysis

Pathways analysis was performed using a hypergeometric test method; the p-value was been calculated and modified according to the Benjamin-Hochberg procedure. The adjusted p-value = 0.05 filter states the statistical significance that is used to determine the linked pathway, the condition that at least two genes must show different expressions.

2.6. Statistical Analysis

Student’s t tests (unpaired, two-tailed), Fisher’s exact probability test or the chi-square test were used to evaluate possible associations between the mRNA expression of IGFBP5 and various clinicopathological parameters. The data obtained after completion of the preliminary analysis used for the differential expression analysis was conducted to the data obtained after completion of the preliminary analysis. A SAM (Significance Analysis of Microarrays) method was used for determining the probe indicating expression of different genes. The analysis was conducted by comparing the probes’ expression levels in the normal tissue group and the tumor tissue group. FC-fold change and p-value for each probe were calculated statistically. After the statistical comparisons between the two groups, values of the probes that had FDR (False Discovery Rate) ≤ 0. 05 and FC (Fold Change) ≥ 1.5 were identified. Correlation between the mRNA expression levels were calculated using Spearman’s correlation. p-values ˂ 0.05 were considered statistically significant.

3. Results

3.1. IGFBP5 mRNA Expression Levels in Breast Cancer Patients

IGFBP5 levels were detected to be upregulated in 21 (55.3%) and downregulated in 17 (44.7%) tumor samples compared to their adjacent normal tissues. The mean and median levels of IGFBP5 expression were in high and low expressed groups 4.2 and 0.53 fold for mean and 2.9 and 0.55 fold for median, respectively. IGFBP5 expression level was not statistically different between tumor and normal tissue (p = 0.2125). Overexpression of IGFBP5 was more common in patients with advanced tumor grades (p = 0.0123). Menarche age was found to be lower in patients with IGFBP5 overexpression (p = 0.0149).

3.2. Differentially Expressed Genes and Hierarchical Clustering of Microarray Data

Microarray analysis revealed that there were 186 probes that showed significantly different expression in breast cancer tissues compared to normal breast tissues. Of the 186 genes, 17 genes were upregulated (Table 3) and 169 genes were downregulated (Table 4) in tumor samples. Probes that were found with significantly different expression between two groups were used for hierarchical clustering and the samples were grouped according to their expression patterns. Clustering results and the expression scales are shown in the heat map (Figure 1). Our microarray data also proved that IGFBP5 was one of the upregulated genes in all the breast cancer samples compared with their adjacent normal tissues (p = 0.0004, median difference = 1.379).
Figure 1. Heat map of cDNA microarray expression data from breast cancer patients with overexpressed IGFBP5 in tumor tissue compared to adjacent normal tissue.
Genes 06 01201 g001
The expression of genes is hierarchically clustered on the y axis, and breast cancer tissues and their adjacent healthy normal breast tissue samples are hierarchically clustered on the x axis. The relative gene expression is depicted according to the color scale shown in the left corner. Numbers with T indicate cancer samples; numbers with N indicate healthy control samples.
Table 3. List of genes upregulated in the breast cancer group compared with normal breast tissues.
Gene SymbolRefSeqFold ChangeQ-Value
CST1NM_001898.258.117736125.88 × 10−6
MMP11NM_005940.341.389231131.08 × 10−5
COL1A1NM_000088.320.287658263.05 × 10−5
GRIA2NM_000826.219.4757094.92 × 10−5
COL5A2NM_000393.38.1541984144.28 × 10−5
SPOCK1NM_004598.37.7178823825.69 × 10−5
NKAIN1NM_024522.15.6864950973.71 × 10−5
DSCR6NM_018962.14.8535861464.65 × 10−5
CLGNNM_004362.14.3728093357.25 × 10−5
KCNF1NM_002236.44.037107344.96 × 10−6
SLC44A4NM_025257.23.3727361463.20 × 10−5
SLC44A4NM_032794.13.3530112072.99 × 10−5
FAM83DNM_030919.23.0635153034.59 × 10−5
ESM1NM_007036.32.3939055493.23 × 10−5
NINJ1NM_004148.32.244892986.78 × 10−5
LCLAT1NM_001002257.11.7331480326.39 × 10−5
SLC12A8NM_024628.41.6993833266.41 × 10−5
Table 4. List of genes downregulated in the breast cancer group compared with normal breast tissues.
Gene SymbolRefSeqFold ChangeQ-Value
DSTNM_001723.4−10.53187993.31 × 10−6
OXTRNM_000916.3−11.01055172.19 × 10−5
COL17A1NM_000494.3−11.042079843.03 × 10−5
HAS3NM_005329.2−11.248425757.35 × 10−7
SAA1NM_199161.1−11.591213891.25 × 10−5
KRT17NM_000422.1−12.704890153.84 × 10−5
ACTG2NM_001615.3−14.488631971.91 × 10−5
KRT14NM_000526.3−15.6920272.20 × 10−6
KRT5NM_000424.3−15.776415612.44 × 10−5
KRT15NM_002275.2−16.385310941.6 × 10−4
SYNMNM_015286.5−17.228616045.91 × 10−5
PPP1R1BNM_181505.1−17.740884951.65 × 10−6
KLK7NM_005046.2−17.888245156.61 × 10−6
SOX10NM_006941.3−19.242671291.84 × 10−7
KLK5NM_001077491.1−20.720227523.53 × 10−5
KRT6BNM_005555.3−21.639639221.82 × 10−5
STAC2NM_198993.2−21.881008579.37 × 10−6
KLK5NM_012427.4−22.062316754.41 × 10−6
MUCL1NM_058173.246.661209632.7 × 10−4
Only the results were listed as average ratio > 10.0

3.3. Analysis of KEGG Pathways

There are 186 probes that show different expression levels between two groups that are statistically significant. These 186 probes were assigned to their associated genes and the databases was searched for the linked pathways. As a result, the expression level of 149 unique genes code was assigned to at least one common pathway. The identified 149 genes were used to test any pathway significantly enriched in the status number and gene expression changes, having taken into consideration the 29.345 reference gene on Illumina Human HT-12V4A microarray system. According to the operating parameters, five pathways and related genes were found to significantly vary between the two groups (Table 5 and Table 6).
Table 5. KEGG pathway analysis of DEGs.
PathwayReference Genes in CategoryExpected Number in the CategoryGene CountEnrichment RatioRaw p-valAdjusted p-val
Protein digestion and absorption770.5858.620.00030.0087
Focal adhesion1841.3964.330.00270.0217
Salivary secretion790.646.720.0030.0217
Drug metabolism720.5447.370.00210.0217
Phenylalanine metabolism170.13215.620.00710.0412
Table 6. KEGG pathway analysis of DEGs and their fold changes in microarray data.
PathwayGene SymbolGene NameFold Change
Protein digestion and absorptionCOL17A1Collagen, type XVII, alpha 1−8.19
COL5A2Collagen, type V, alpha 28.15
COL1A1Collagen, type I, alpha 120.29
KCNN4Potassium intermediate/small conductance calcium-activated channel, subfamily N, member 4−5.43
MMEMembrane metallo-endopeptidase−7.67
Focal adhesionCOL5A2Collagen, type V, alpha 28.15
METMet proto-oncogen (hepatocyte growth factor)−2.43
LAMC2Laminin, gamma 2−2.61
COL1A1Collagen, type I, alpha 120.29
CAV2Caveolin 2−3.37
MYLKMyosin light chain kinase−6.93
Salivary secretionTRPV6Transient receptor potential cation channel, subfamily−3.64
CST1Cystatin SN58.12
KCNN4Potassium intermediate/small conductance calcium-activated channel, subfamily N, member 4−5.43
RYR3Ryanodine receptor 3−4.76
Drug metabolism cytochrome P450FMO2Flavin containing monooxygenase 2 (non-functional)−5.23
GSTP1Glutation S-transferase pi 1−3.79
ALDH3A1Aldehyde dehydrogenase 3 family, member A1−2.86
ALDH1A3Aldehyde dehydrogenase 1 family, member A3−9.46
Phenylalanine metabolismALDH3A1Aldehyde dehydrogenase 3 family, member A1−2.86
ALDH1A3Aldehyde dehydrogenase 1 family, member A3−9.46

3.4. Advanced Level Bioinformatics

We used the ExPASy bioinformatics resource portal and MiMI (Michigan molecular interactions) database for differentially expressed genes and their interactions and pathways considered with IGFBP5. Three genes, CST1 (gene id: 1469), MMP11 (gene id: 4320) and COL1A1 (gene id: 1277), which are involved in the highest increased genes within the differentially expressed genes list, came into prominence. CST1 plays a critical role in cancer progression and metastasis. MMP11 is an important cancer metastasis regulatory protein. On the other hand, COL1A1 is a main extracellular matrix protein and it also interacts with one of the IGFBP5 related proteins, FN1 (fibronectin 1, gene id: 2335). The COL1A1 gene and its interactions are shown in Figure 2. We can speculate that these three genes could be possibly playing a critical role in the molecular mechanism of the metastatic potential of IGFBP5 in breast cancer.
Figure 2. Evidence views of COL1A1 gene and its association with FN1 by using STRING 10.
Genes 06 01201 g002

3.5. Validation Experiments of COL1A1 and MMP11 with IGFBP5 by Real Time qPCR

According to Spearman’s rho correlation test, IGFBP5 and COL1A1, COL1A1 and MMP11 were significantly positively correlated (R = 0.476, p = 0.003 and R = 0.602, p = 0.000, respectively). The scatter diagram of the selected genes is shown in Figure 3. Unlike the microarray data, MMP11 and IGFBP5 did not show significant positive correlation (R = 0.226, p = 0.199).
Figure 3. Scatter plots of the selected genes in real time qPCR.
Genes 06 01201 g003

4. Discussion

IGFBP5 is one of the family members of IGF-binding proteins which play a critical role in tumor progression, especially cell survival, death and metastasis processes. The functional role of fluctuational IGFBP5 expression in origination and development of different types of cancer is still mysterious. IGFBP5 has diverse effects on growth of cancer cells depending on cell type and cell content. Because of the different functions of IGFBP5, a microarray system method, which provides a global picture in the cells, is the best method to clarify and discover new correlations with the genes. Using this method, we firstly determined potentially IGFBP5-related genes by using the microarray system in samples of breast cancer patients.
In this study, we identified that top differentially increased gene expressions with IGFBP5 are CST1, MMP11 and COL1A1. We focused on these three genes because of their associations and potential roles in extracellular matrix (ECM)-mediated pathways and metastasis process in cancer. Our previously published paper has shown the role of IGFBP5 on metastatic capacity of breast cancer [7]. In the present study, KEGG pathway analysis reveals that focal adhesion and drug metabolism pathways are correlated with IGFBP5 expressional differentiation. These two pathways play a pivotal role in understanding cancer progression and development of treatment strategies considering IGFBP5.
Our microarray data shows that CST1 (cystatin SN) is one of the top DEGs in IGFBP5 overexpressed group. The general function of cystatins is the inhibition of the proteolytic activity of cysteine proteases which are involved in migration of cancer cells. Recent findings show that CST1 was highly expressed in colon, gastric and pancreatic cancers. CST1-overexpressing colon cancer cell lines exhibited increased tumor growth as well as metastasis in a xenograft nude mouse model [23]. Overexpression of CST1 was also correlated with malignancy-associated proteins such as PCNA, cyclin D1, cyclin A2 and cyclin E in pancreatic cancer cell line [24]. And finally, suppression of metastasis has been found to be correlated with reduced expression of CST1 in breast cancer cell line [25]. We can suggest that metastatic potential of IGFBP5 might be correlated with CST1.
Extracellular matrix genes are critical players in tumor progression and metastasis. Here we identified an important correlation between IGFBP5 and two regulators of ECM-related pathways using gene co-expression analysis. The first is matrix metalloproteinase-11 (MMP11), which is related with distance metastasis [26], resistance to anoikis [27] and poor outcomes [
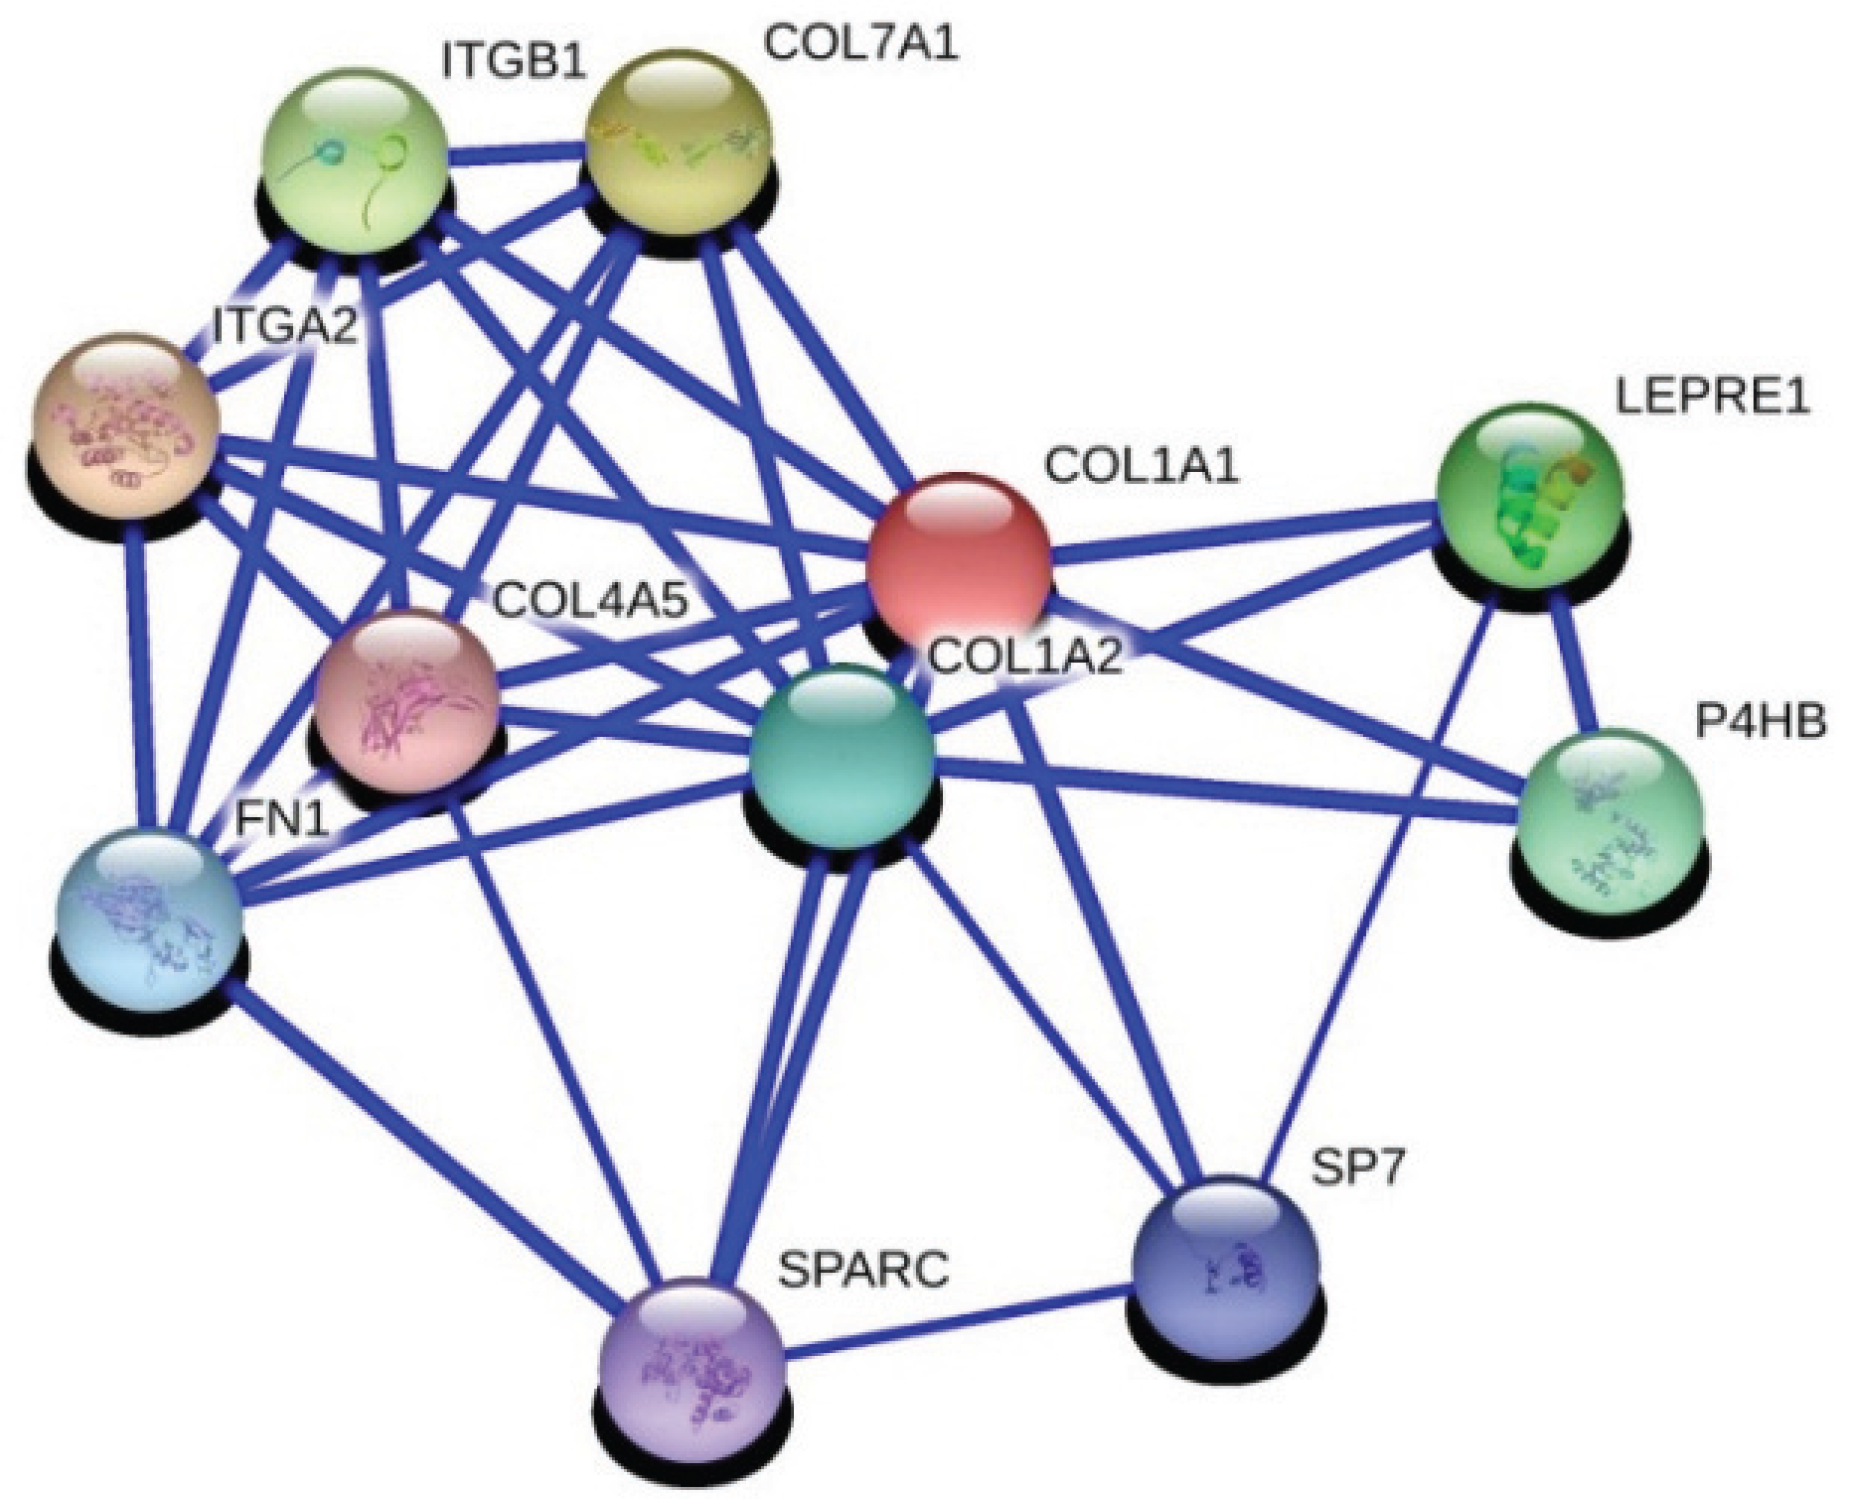
28] in breast cancer. The second is collagen 1a1 (COL1A1), which is an important regulator of pro-metastatic processes in cancer. Interactions with fibronectin and collagen 1a1 has been identified in breast cancer and related with adhesion of breast cancer in a previous study [29]. We also know that IGFBP5 interacts with fibronectin and regulates cell migration [30].
We also confirmed a positive correlation between IGFBP5 and COL1A1 expression (R = 0.476, p = 0.003). Besides that COL1A1 and MMP11 were significantly positively correlated (R = 0.602, p = 0.000). So we anticipate that IGFBP5 could be a possible modifier on metastatic capacity of breast cancer through regulating COL1A1 or MMP11. Further functional and protein-protein interactions studies are needed to clarify a likely correlation between IGFBP5, COL1A1 and MMP11 considering the metastasis process in breast cancer.
A recently published whole-genome analysis study identified a new breast cancer risk locus, 2q35. Fine scale mapping of the locus shows the strongest candidate for causality, SNP rs4442975, flanks a transcriptional enhancer that physically interacts with the promoter of IGFBP5. Furthermore, presence of this polymorphism reduced IGFBP5 expression [10]. Whereas, we did not reach statistically significant difference between tumor and normal tissue samples from breast cancer patients considering IGFBP5 expression (p = 0.2125), we found a positive correlation between higher expression of IGFBP5 and advanced stage of breast cancer. Further studies with a large sample size are needed to clarify tumoral expression of IGFBP5 and its clinical significance in breast cancer.

5. Conclusions

In conclusion, functional role of tumoral IGFBP5 expression is still controversial. We did not find a statistically significant increase in IGFBP5 in breast cancer tissues compared to adjacent normal tissue, but higher expression of IGFBP5 was correlated with advanced tumor grades (p = 0.0123). To understand differences of gene expression profile in samples with high tumoral expressions of IGFBP5 compared to matching normal breast tissue, cDNA microarray experiment was conducted. We determined that the top differentially expressed genes with coordinal expressed IGFBP5 were CST1, MMP11 and COL1A1. These three genes play a pivotal role in cancer progression and metastasis processes. Validation of a limited number of the genes shows that some of these genes could be potentially affecting IGFBP5 function about the processes. We can suggest that IGFBP5 may directly or indirectly regulate cancer metastasis pathways through the top differentially expressed genes. Further studies with a large sample size and functional experiments are needed to clarify importance of tumoral IGFBP5 expression and its molecular function in breast cancer metastasis.

Acknowledgments

The authors appreciate Can Erzik for his critical revision, Özge Emre for her English editing of the manuscript and Pınar Ay for her statistical helps to our data. This work was supported by a grant (SBAG-111S161 to Mustafa Akkiprik) from the Scientific and Technological Research Council of Turkey (TUBITAK).

Author Contributions

Mustafa Akkiprik, Tolga Özmen, Bahadır M. Güllüoğlu, Handan Kaya and Ayşe Özer planned and designed the experiments; İrem Peker, Gökçe Güllü Amuran and Mustafa Akkiprik performed the experiments; Mustafa Akkiprik analyzed the data and wrote the paper. All authors have read and approved of the manuscript.

Conflicts of Interest

The authors declare no conflict of interest.

References

  1. Gullu, G.; Karabulut, S.; Akkiprik, M. Functional roles and clinical values of insulin-like growth factor binding pro- tein-5 in different types of cancers. Chin. J. Cancer 2012, 6, 266–280. [Google Scholar] [CrossRef] [PubMed]
  2. Mohan, S.; Baylink, D.J. IGF-binding proteins are multi- functional and act via IGF-dependent and independent mechanisms. J. Endocrinol. 2002, 175, 19–31. [Google Scholar] [CrossRef] [PubMed]
  3. Mita, K.; Zhang, Z.; Ando, Y.; Toyama, T.; Hamaguchi, M.; Kobayashi, S.; Hayashi, S.I.; Fujii, Y.; Iwase, H.; Yamashita, H. Prognostic significance of insulin like growth factor binding protein (IGFBP)-4 and IGFBP-5 expression in breast cancer. J. Clin. Oncol. 2007, 37, 575–582. [Google Scholar]
  4. Pekonen, F.; Nyman, T.; Ilvesmaki, V.; Partanen, S. Insulin-like growth factor binding proteins in human breast cancer tissue. Cancer Res. 1992, 52, 5204–5207. [Google Scholar] [PubMed]
  5. Perks, C.M.; Bowen, S.; Gill, Z.P.; Newcomb, P.V.; Holly, J.M. Differential IGF-independent effects of insulin-like growth factor binding proteins (1–6) on apoptosis of breast epithelial cells. J. Cell Biochem. 1999, 75, 652–664. [Google Scholar] [CrossRef]
  6. Van’t Veer, L.J.; Dai, H.; van de Vijver, M.J.; He, Y.D.; Hart, A.A.; Mao, M.; Peterse, H.L.; van der Kooy, K.; Marton, M.J.; Witteveen, A.T.; et al. Gene expression profiling predicts clinical outcome of breast cancer. Nature 2002, 415, 530–536. [Google Scholar] [CrossRef] [PubMed]
  7. Akkiprik, M.; Hu, L.; Sahin, A.; Hao, X.; Zhang, W. The subcellular localization of IGFBP5 affects its cell growth and migration functions in breast cancer. BMC Cancer 2009. [Google Scholar] [CrossRef] [PubMed]
  8. Li, X.; Cao, X.; Li, X.; Zhang, W.; Feng, Y. Expression level of insulin-like growth factor binding protein 5 mRNA is a prognostic factor for breast cancer. Cancer Sci. 2007, 98, 1592–1596. [Google Scholar] [CrossRef] [PubMed]
  9. Liang, P.I.; Wang, Y.H.; Wu, T.F.; Wu, W.R.; Liao, A.C.; Shen, K.H.; Hsing, C.H.; Shiue, Y.L.; Huang, H.Y.; Hsu, H.P.; et al. IGFBP-5 overexpression as a poor prognostic factor in patients with urothelial carcinomas of upper urinary tracts and urinary bladder. J. Clin. Pathol. 2013, 66, 573–582. [Google Scholar] [CrossRef] [PubMed]
  10. Ghoussaini, M.; Edwards, S.L.; Michailidou, K.; Nord, S.; Cowper-Sal Lari, R.; Desai, K.; Kar, S.; Hillman, K.M.; Kaufmann, S.; Glubb, D.M.; et al. Evidence that breast cancer risk at the 2q35 locus is mediated through IGFBP5 regulation. Nat. Commun. 2014. [Google Scholar] [CrossRef] [PubMed] [Green Version]
  11. Ahn, B.Y.; Elwi, A.N.; Lee, B.; Trinh, D.L.; Klimowicz, A.C.; Yau, A.; Chan, J.A.; Magliocco, A.; Kim, S.W. Genetic screen identifies insulin-like growth factor binding protein 5 as a modulator of tamoxifen resistance in breast cancer. Cancer Res. 2010, 70, 3013–3019. [Google Scholar] [CrossRef] [PubMed]
  12. Wang, J.; Ding, N.; Li, Y.; Cheng, H.; Wang, D.; Yang, Q.; Deng, Y.; Yang, Y.; Li, Y.; Ruan, X.; et al. Insulin-like growth factor binding protein 5 (IGFBP5) functions as a tumor suppressor in human melanoma cells. Oncotarget 2015, 6, 20636–20649. [Google Scholar] [CrossRef] [PubMed]
  13. Su, Y.; Wagner, E.R.; Luo, Q.; Huang, J.; Chen, L.; He, B.C.; Zuo, G.W.; Shi, Q.; Zhang, B.Q.; Zhu, G.; et al. Insulin-like growth factor binding protein 5 suppresses tumor growth and metastasis of human osteosarcoma. Oncogene 2011, 30, 3907–3917. [Google Scholar] [CrossRef] [PubMed]
  14. Rho, S.B.; Dong, S.M.; Kang, S.; Seo, S.S.; Yoo, C.W.; Lee, D.O.; Woo, J.S.; Park, S.Y. Insulin-like growth factor-binding protein-5 (IGFBP-5) acts as a tumor suppressor by inhibiting angiogenesis. Carcinogenesis 2008, 29, 2106–2111. [Google Scholar] [CrossRef] [PubMed]
  15. Johnson, S.K.; Haun, R.S. Insulin-like growth factor binding protein-5 influences pancreatic cancer cell growth. World J. Gastroenterol. 2009, 15, 3355–3366. [Google Scholar] [CrossRef] [PubMed]
  16. Sureshbabu, A.; Okajima, H.; Yamanaka, D.; Tonner, E.; Shastri, S.; Maycock, J.; Szymanowska, M.; Shand, J.; Takahashi, S.I.; Beattie, J.; et al. IGFBP5 induces cell adhesion, increases cell survival and inhibits cell migration in MCF-7 human breast cancer cells. J. Cell Sci. 2012, 125, 1693–1705. [Google Scholar] [CrossRef] [PubMed]
  17. Marshman, E.; Green, K.A.; Flint, D.J.; White, A.; Streuli, C.H.; Westwood, M. Insulin-like growth factor binding protein 5 and apoptosis in mammary epithelial cells. J. Cell Sci. 2003, 116, 675–682. [Google Scholar] [CrossRef] [PubMed]
  18. Butt, A.J.; Dickson, K.A.; Jambazov, S.; Baxter, R.C. Enhancement of tumor necrosis factor-alpha-induced growth inhibition by insulin-like growth factor-binding protein-5 (IGFBP-5), but not IGFBP-3 in human breast cancer cells. Endocrinology 2005, 146, 3113–3122. [Google Scholar] [CrossRef] [PubMed]
  19. Nickerson, T.; Pollak, M.; Huynh, H. Castration-induced apoptosis in the rat ventral prostate is associated with increased expression of genes encoding insulin-like growth factor binding proteins 2–5. Endocrinology 1998, 139, 807–810. [Google Scholar] [CrossRef] [PubMed]
  20. Adashi, E.Y.; Resnick, C.E.; Hernandez, E.R.; Hurwitz, A.; Rosenfeld, R.G. Ovarian granulosa cell-derived insulin-like growth factor (IGF) binding proteins: release of low molecular weight, high-affinity IGF-selective species. Mol. Cell. Endocrinol. 1990, 74, 175–184. [Google Scholar] [CrossRef]
  21. Qiao, D.; Xu, J.; Le, C.; Huang, E.; Liu, C.; Qiu, P.; Lin, Z.M.; Xie, W.B.; Wang, H.J. Insulin-like growth factor binding protein 5 (IGFBP5) mediates methamphetamine-induced dopaminergic neuron apoptosis. Toxicol. Lett. 2014, 230, 444–453. [Google Scholar] [CrossRef] [PubMed]
  22. Goldhirsch, A.; Wood, W.C.; Coates, A.S.; Gelber, R.D.; Thürlimann, B.; Senn, H.J.; Panel members. Strategies for subtypes—Dealing with the diversity of breast cancer: Highlights of the St. Gallen International Expert Consensus on the Primary Therapy of Early Breast Cancer 2011. Ann. Oncol. 2011, 22, 1736–1747. [Google Scholar] [CrossRef] [PubMed]
  23. Kim, J.T.; Lee, S.J.; Kang, M.A.; Park, J.E.; Kim, B.Y.; Yoon, D.Y.; Yang, Y.; Lee, C.H.; Yeom, Y.I.; Choe, Y.K.; et al. Cystatin SN neutralizes the inhibitory effect of cystatin C on cathepsin B activity. Cell Death Dis. 2013. [Google Scholar] [CrossRef] [PubMed]
  24. Jiang, J.; Liu, H.L.; Liu, Z.H.; Tan, S.W.; Wu, B. Identification of cystatin SN as a novel biomarker for pancreatic cancer. Tumor Biol. 2015, 36, 3903–3910. [Google Scholar]
  25. Liu, X.F.; Xiang, L.; Zhang, Y.; Becker, K.G.; Bera, T.K.; Pastan, I. CAPC negatively regulates NF-κB activation and suppresses tumor growth and metastasis. Oncogene 2012, 31, 1673–1682. [Google Scholar] [CrossRef] [PubMed]
  26. Fernandez-Garcia, B.; Eiró, N.; Marín, L.; González-Reyes, S.; González, L.O.; Lamelas, M.L.; Vizoso, F.J. Expression and prognostic significance of fibronectin and matrix metalloproteases in breast cancer metastasis. Histopathology 2014, 64, 512–522. [Google Scholar] [CrossRef] [PubMed]
  27. Takeuchi, T.; Adachi, Y.; Nagayama, T.; Furihata, M. Matrix metalloproteinase-11 overexpressed in lobular carcinoma cells of the breast promotes anoikis resistance. Virchows Arch. 2011, 459, 291–297. [Google Scholar] [CrossRef] [PubMed]
  28. Min, K.W.; Kim, D.H.; Do, S.I.; Pyo, J.S.; Kim, K.; Chae, S.W.; Sohn, J.H.; Oh, Y.H.; Kim, H.J.; Choi, S.H.; et al. Diagnostic and prognostic relevance of MMP-11 expression in the stromal fibroblast-like cells adjacent to invasive ductal carcinoma of the breast. Ann. Surg. Oncol. 2013, 3, S433–S442. [Google Scholar] [CrossRef] [PubMed]
  29. Sipes, J.M.; Guo, N.; Nègre, E.; Vogel, T.; Krutzsch, H.C.; Roberts, D.D. Inhibition of fibronectin binding and fibronectin-mediated cell adhesion to collagen by a peptide from the second type I repeat of thrombospondin. J. Cell Biol. 1993, 121, 469–477. [Google Scholar] [CrossRef] [PubMed]
  30. Xu, Q.; Yan, B.; Li, S.; Duan, C. Fibronectin binds insulin-like growth factor-binding protein 5 and abolishes Its ligand-dependent action on cell migration. J. Biol. Chem. 2004, 279, 4269–4277. [Google Scholar] [CrossRef] [PubMed]

