
Impact of DCC (rs714) and PSCA (rs2294008 and rs2976392) Gene Polymorphism in Modulating Cancer Risk in Asian Population

Abstract
:
1. Introduction
2. Materials and Methods
2.1. Literature Search
2.2. Study Selection
2.3. Data Extraction
2.4. Statistical Analysis
3. Result
3.1. Study Characteristics

3.2. Quantitative Synthesis

| SN | Author | Reference | Country | Ethnicity | Cancer Type | Case/Control | pHWE | MAF | Genotyping Method |
|---|---|---|---|---|---|---|---|---|---|
| DCC rs714 (A > G) | |||||||||
| 1 | Toma et al., 2009 | [34] | Romania | Caucasian | CRC | 120/60 | 0.603 | 0.28 | PCR-RFLP |
| 2 | Rai et al., 2013 | [10] | India | Asian | GBC | 406/260 | 0.062 | 0.38 | PCR-RFLP |
| 3 | Malik et al., 2013 | [12] | India | Asian | EC | 135/195 | 0.187 | 0.36 | PCR-RFLP |
| 4 | Malik et al., 2013 | [12] | India | Asian | GC | 108/195 | 0.187 | 0.36 | PCR-RFLP |
| 5 | Djansugurova et al., 2015 | [13] | Kazakhstan | Mixed | CRC | 249/242 | 0.187 | 0.36 | PCR-RFLP |
| PSCA rs2294008 (C > T) | |||||||||
| 1 | Wu et al., 2009 | [36] | China | Asian | GC | 1736/1020 | 0.587 | 0.28 | PCR-RFLP |
| 2 | Matsuo et al., 2009 | [27] | Japan | Asian | GC | 708/708 | 0.638 | 0.38 | Taqman |
| 3 | Wang et al., 2010 | [28] | China | Asian | BC | 581/580 | 0.508 | 0.27 | PCR-RFLP |
| 4 | Lu et al., 2010 | [37] | China | Asian | GC | 1053/1100 | 0.166 | 0.25 | PCR-RFLP |
| 5 | Ou et al., 2010 | [38] | China | Asian | GC | 196/246 | 0.924 | 0.27 | PCR-LDR |
| 6 | Zeng et al., 2011 | [39] | China | Asian | GC | 460/549 | 0.493 | 0.27 | PCR-RFLP |
| 7 | Song et al., 2011 | [40] | Korea | Asian | GC | 3245/1700 | 0.131 | 0.48 | PCR-RFLP |
| 8 | Joung et al., 2011 | [41] | Korea | Asian | PC | 194/169 | 0.963 | 0.47 | MASS ARRAY |
| 9 | Lochhead et al., 2011 | [42] | USA | Caucasian | EC | 159/211 | 0.405 | 0.5 | Taqman |
| 10 | Lochhead et al., 2011 | [42] | USA | Caucasian | GC | 309/211 | 0.405 | 0.5 | Taqman |
| 11 | Sala et al., 2012 | [43] | Europe | Caucasian | GC | 411/1530 | 0.088 | 0.44 | SNP ARRAY |
| 12 | Kim et al., 2012 | [44] | Korea | Asian | BrC | 456/461 | 0.324 | 0.49 | MALDI-TOF MS |
| 13 | Smith et al., 2012 | [45] | Scotland | Caucasian | CRC | 77/804 | 0.981 | 0.4 | Taqman |
| 14 | Li et al., 2012 | [46] | China | Asian | GC | 300/300 | 0.65 | 0.26 | MASS-ARRAY IPLEX |
| 15 | Ono et al., 2013 | [47] | Japan | Asian | GBC | 44/173 | 0.242 | 0.39 | Taqman |
| 16 | Ma et al., 2013 | [48] | China | Asian | BC | 184/962 | 0.562 | 0.25 | MASS-ARRAY IPLEX |
| 17 | Zhao et al., 2013 | [35] | China | Asian | GC | 717/951 | 0.913 | 0.3 | PCR-DHPLC |
| 18 | Rai et al., 2013 | [24] | India | Asian | GBC | 405/247 | 0.492 | 0.43 | Taqman |
| 19 | Dai et al., 2014 | [49] | China | Asian | EC | 2083/2220 | 0.944 | 0.27 | Taqman |
| 20 | Sun et al., 2014 | [50] | Texas | Caucasian | GC | 132/125 | 0.926 | 0.49 | Taqman |
| 21 | Wang et al., 2014 | [51] | China | Asian | BC | 1210/1008 | 0.739 | 0.25 | Taqman |
| 22 | Lee et al., 2014 | [52] | Korea | Asian | BC | 411/1700 | 0.13 | 0.48 | HRM |
| 23 | Kupcinskas et al., 2014 | [53] | Lithuania | Caucasian | GC | 252/246 | 0.834 | 0.48 | Taqman |
| 24 | Sun et al., 2015 | [54] | China | Asian | GC | 692/774 | 0.105 | 0.28 | Taqman |
| 25 | MA et al., 2015 | [55] | Spain | Caucasian | GC | 603/675 | 0.349 | 0.45 | Taqman |
| 26 | Ichikawa et al., 2015 | [56] | Japan | Asian | GC | 193/266 | 0.185 | 0.42 | PCR-RFLP |
| 27 | Zhang et al., 2015 | [57] | China | Asian | GC | 476/481 | 0.617 | 0.27 | MASS ARRAY |
| 28 | Kupcinskas et al., 2015 | [58] | Latvia | Caucasian | CRC | 192/382 | 0.943 | 0.48 | Taqman |
| PSCA rs2976392 (G > A) | |||||||||
| 1 | Wu et al., 2009 | [36] | China | Asian | GC | 1724/1002 | 0.35 | 0.29 | PCR-RFLP |
| 2 | Matsuo et al., 2009 | [27] | Japan | Asian | GC | 707/707 | 0.635 | 0.37 | Taqman |
| 3 | Lu et al., 2010 | [37] | China | Asian | GC | 1043/1082 | 0.336 | 0.26 | PCR-RFLP |
| 4 | Ou et al., 2010 | [38] | China | Asian | GC | 196/246 | 0.298 | 0.26 | PCR-LDR |
| 5 | Joung et al., 2011 | [41] | Korea | Asian | PC | 194/168 | 0.848 | 0.47 | MASS ARRAY |
| 6 | Kim et al., 2012 | [44] | Korea | Asian | BrC | 453/460 | 0.397 | 0.49 | MALDI-TOF MS |
| 7 | Ono et al., 2013 | [47] | Japan | Asian | GBC | 44/173 | 0.328 | 0.61 | Taqman |
| 8 | Kupcinskas et al., 2014 | [53] | Lithuania | Caucasian | GC | 249/232 | 0.986 | 0.48 | Taqman |
| 9 | Sun et al., 2015 | [54] | China | Asian | GC | 692/774 | 0.13 | 0.29 | Taqman |
| 10 | Zhang et al., 2015 | [57] | China | Asian | GC | 476/481 | 0.939 | 0.28 | MASS ARRAY |
| 11 | Kupcinskas et al., 2015 | [58] | Latvia | Caucasian | CRC | 192/382 | 0.856 | 0.48 | Taqman |

| Variables | N | Case/Control | A vs. G Allele | AA vs. GG | GA vs. GG | GA + AA vs. GG | AA vs. GG + GA | ||||||||||
|---|---|---|---|---|---|---|---|---|---|---|---|---|---|---|---|---|---|
| OR (95% CI) | p | ph/I2 | OR (95% CI) | p | ph/I2 | OR (95% CI) | p | ph/I2 | OR (95% CI) | p | ph/I2 | OR (95% CI) | p | ph/I2 | |||
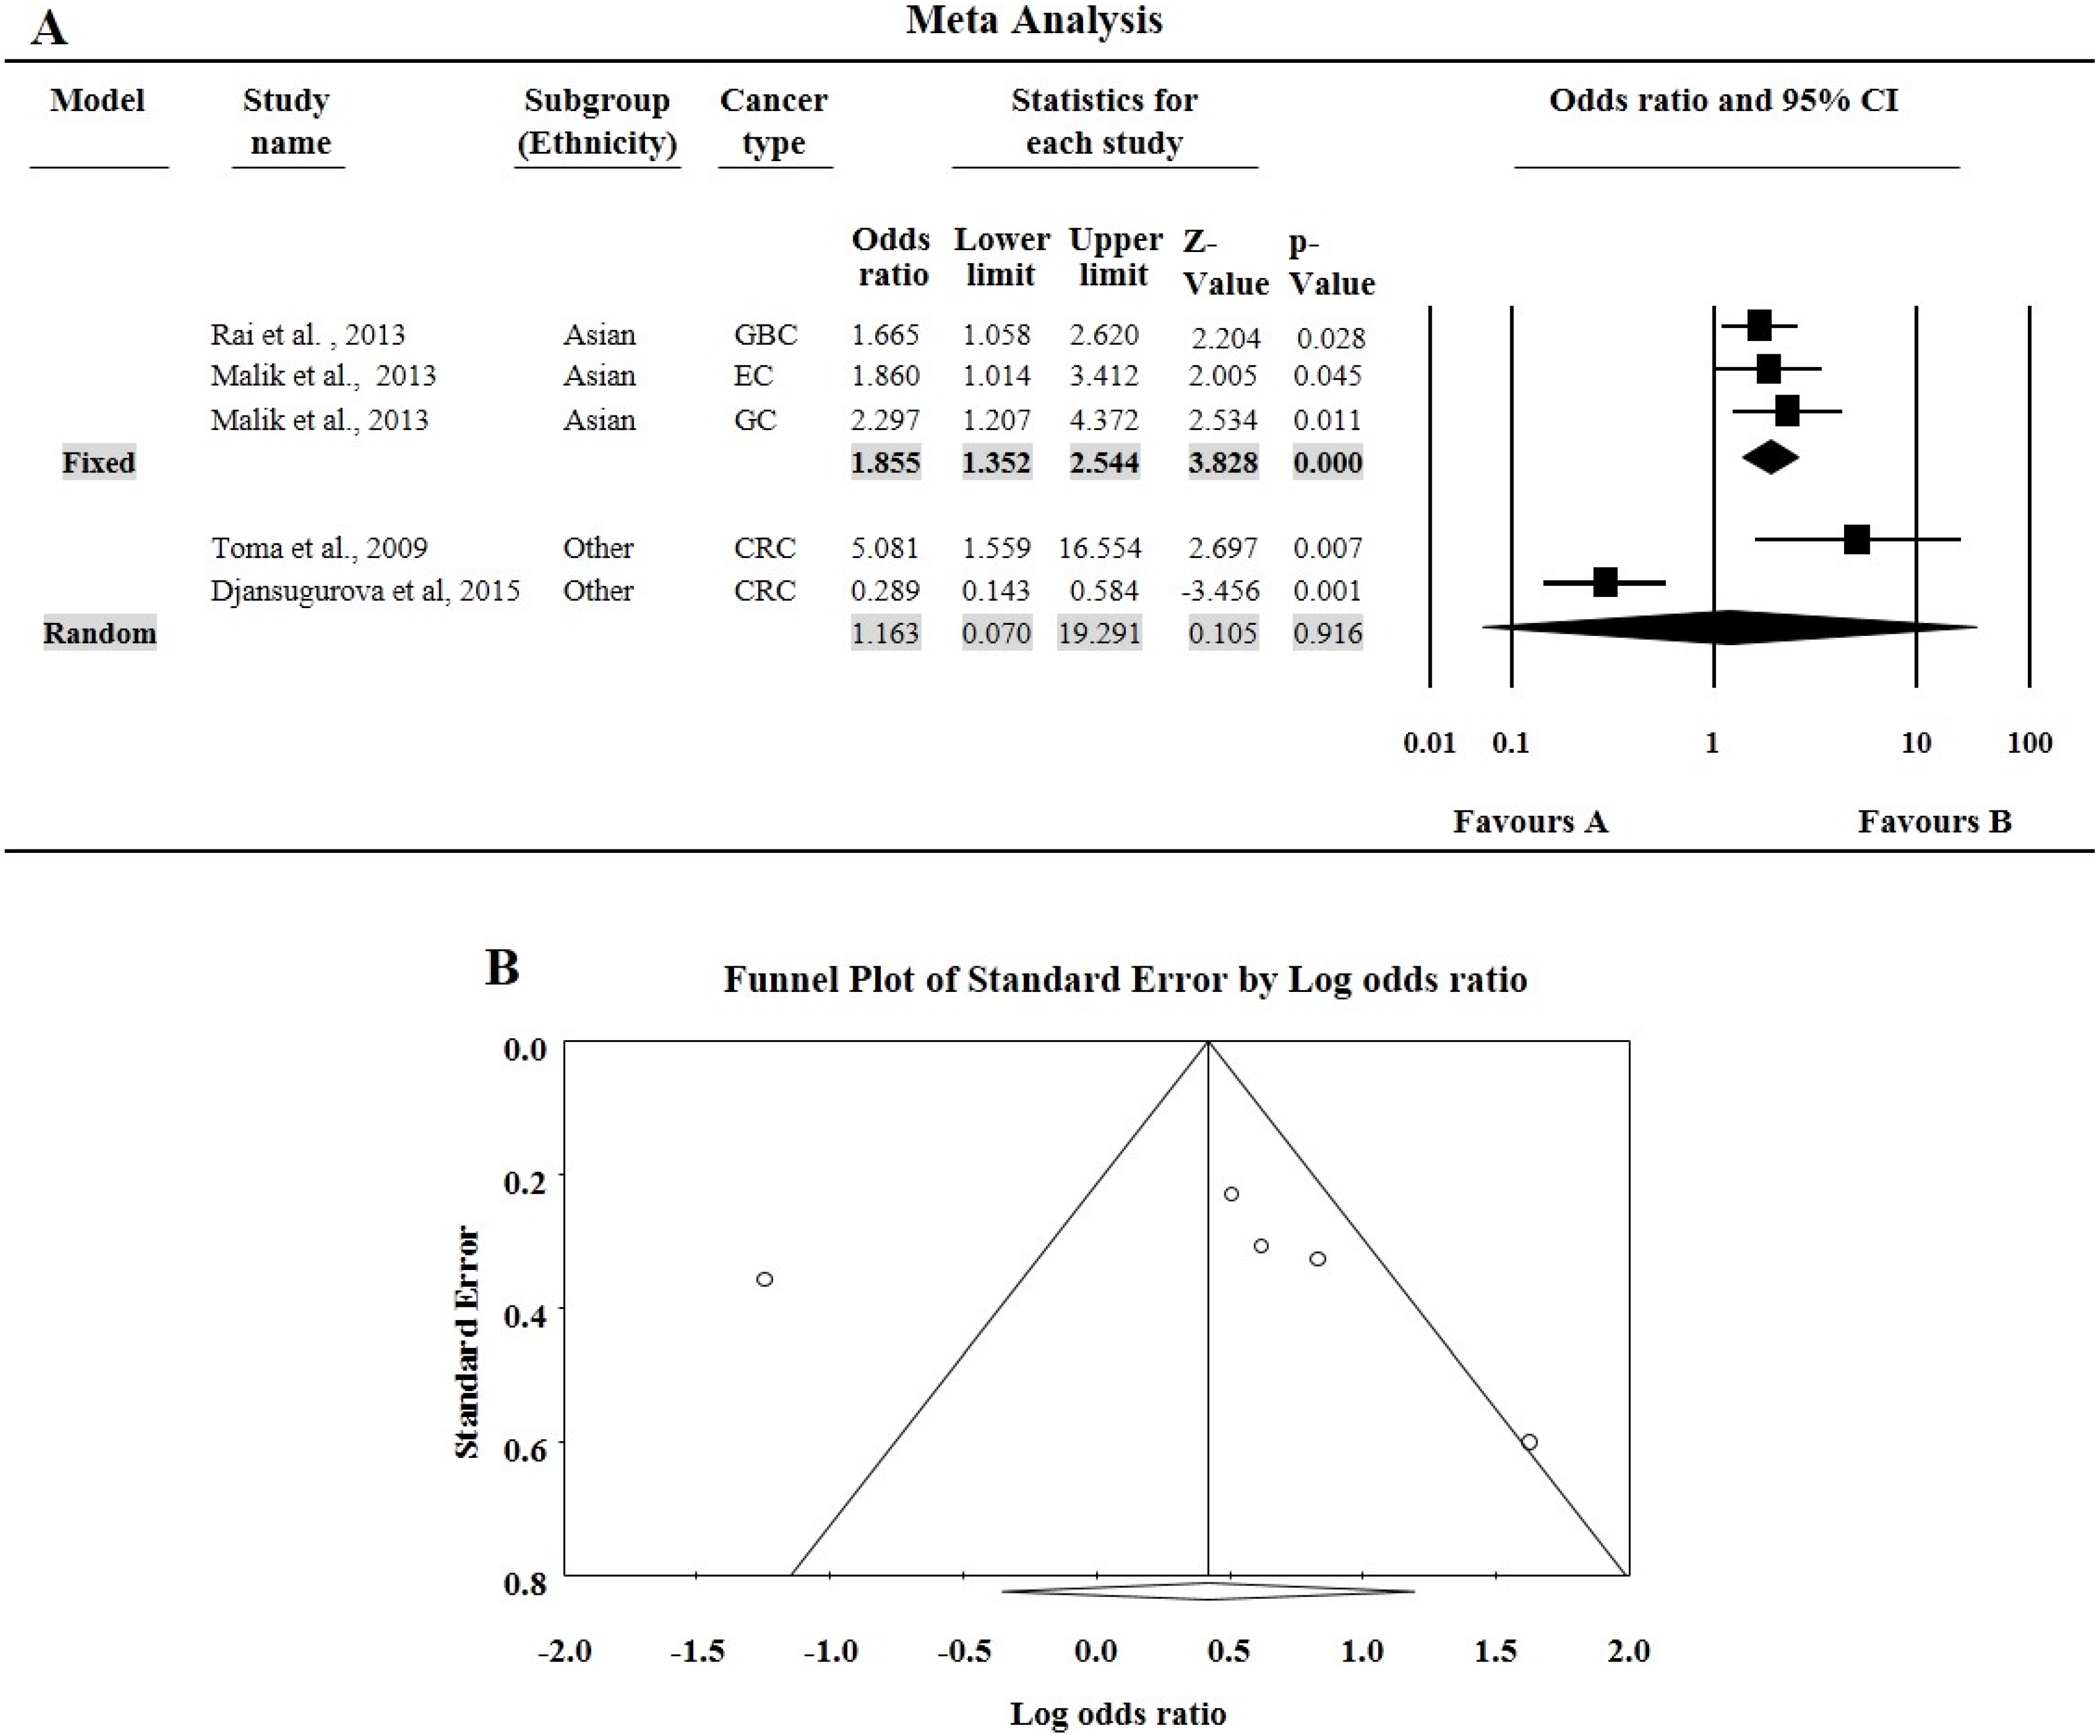
| All | 5 | 1018/952 | 1.31 (0.93–1.86) | 0.121 | 0.000/84.033 | 1.52 (0.70–3.3) | 0.289 | 0.000/85.434 | 1.37 (0.98–1.92) | 0.068 | 0.032 62.210 | 1.49 (0.98–2.28) | 0.063 | 0.001/79.104 | 1.27 (0.64–2.52) | 0.495 | 0.000/84.117 |
| Ethnicity | |||||||||||||||||
| Caucasian | 1 | 120/60 | 2.14 (1.34–3.43) | 0.002 | 1.000/0.000 | 5.08 (1.56–16.55) | 0.007 | 1.000/0.000 | 2.53 (1.29–4.97) | 0.007 | 1.000/0.000 | 2.87 (1.50–5.50) | 0.001 | 1.000/0.000 | 2.97 (0.97–9.09) | 0.056 | 1.000/0.000 |
| Asian | 3 | 649/650 | 1.41 (1.20–1.66) | 0.000 | 0.810/0.000 | 1.86 (1.35–2.54) | 0.000 | 0.725/0.000 | 1.43 (1.11–1.85) | 0.005 | 0.107 55.174 | 1.66 (1.31–2.09) | 0.000 | 0.182/41.288 | 1.52 (1.14–2.03) | 0.004 | 0.193/39.43 |
| Mixed | 1 | 249/242 | 0.70 (0.54–0.92) | 0.011 | 1.000/0.000 | 0.29 (0.14–0.58) | 0.001 | 1.000/0.000 | 0.99 (0.68–1.44) | 0.975 | 1.000/0.000 | 0.81 (0.57–1.16) | 0.246 | 1.000/0.000 | 0.29 (0.15–0.57) | 0.000 | 1.000/0.000 |

3.3. Tests of Heterogeneity and Sensitivity Analysis
| Variables | N | Case/Control | T vs. C Allele | TT vs. CC | CT vs. CC | CT + TT vs. CC | TT vs. CC + CT | ||||||||||
|---|---|---|---|---|---|---|---|---|---|---|---|---|---|---|---|---|---|
| OR (95% CI) | p | ph/I2 | OR (95% CI) | p | ph/I2 | OR (95% CI) | p | ph/I2 | OR (95% CI) | p | ph/I2 | OR (95% CI) | p | ph/I2 | |||
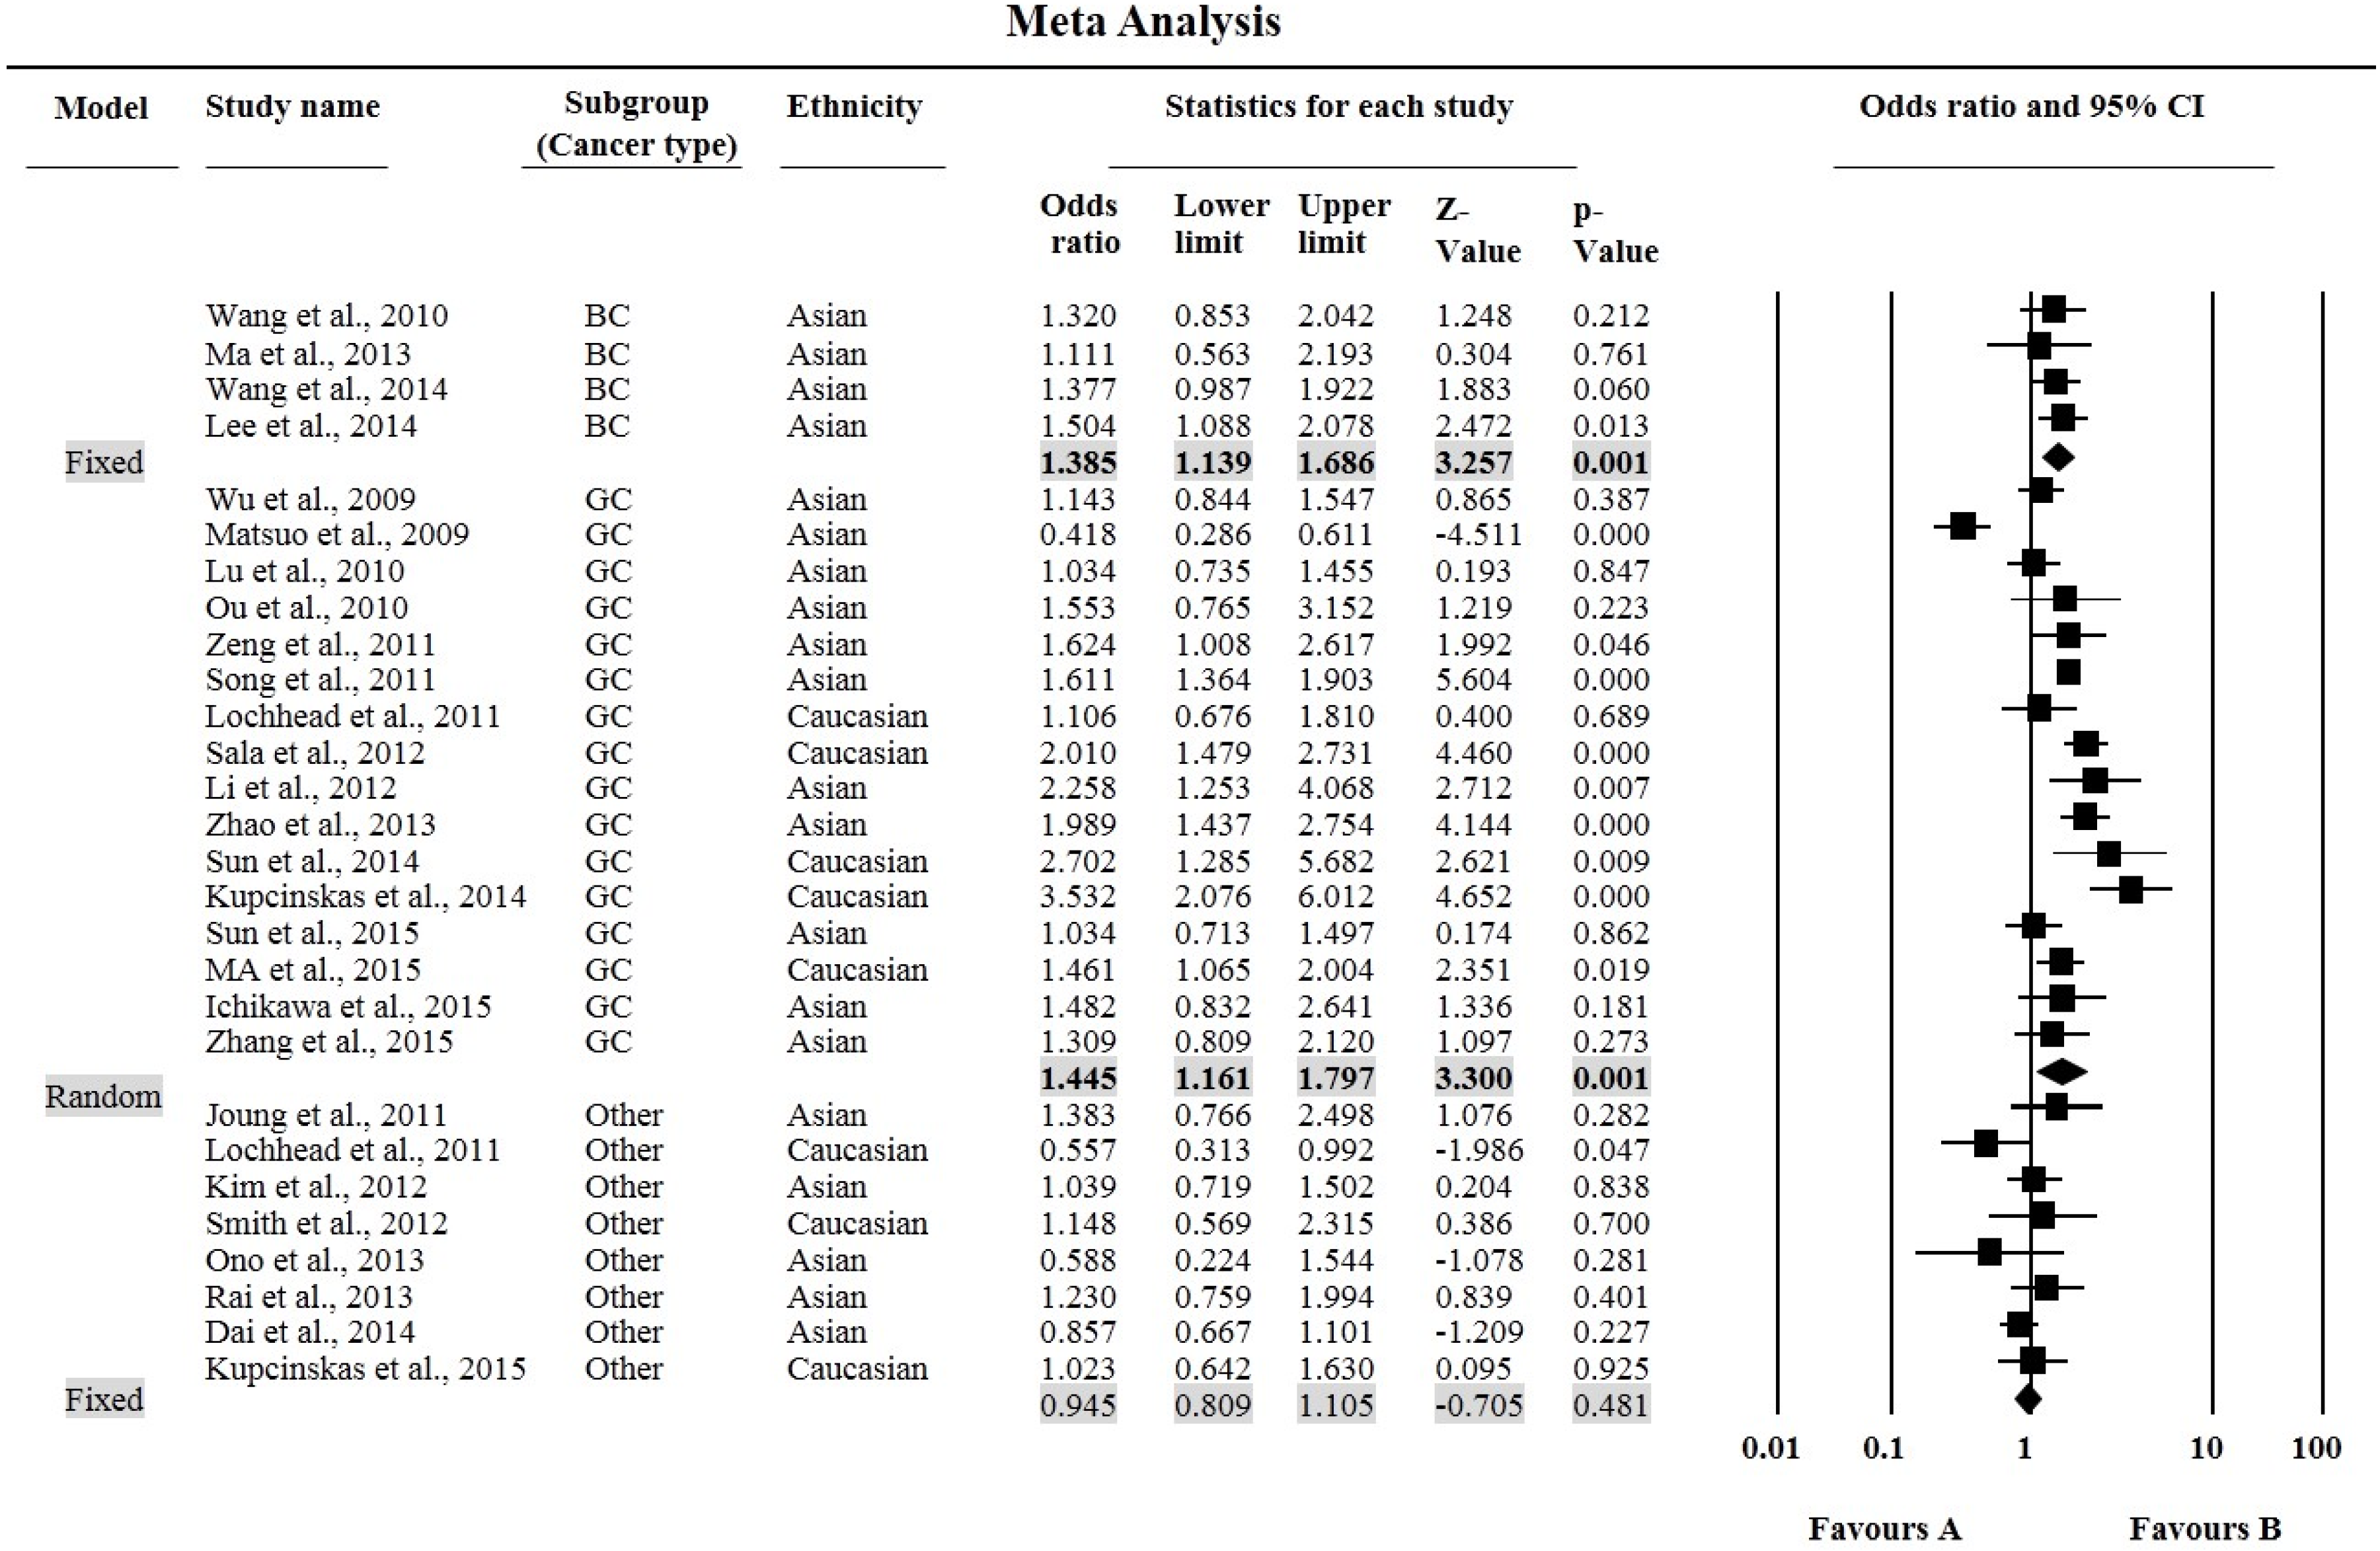
| All | 28 | 17,479/19,799 | 1.16 (1.07–1.25) | 0.000 | 0.000/79.335 | 1.28 (1.10–1.50) | 0.002 | 0.000/74.804 | 1.21 (1.09–1.34) | 0.000 | 0.000/75.122 | 1.24 (1.11–1.39) | 0.000 | 0.000/80.158 | 1.17 (1.05–1.30) | 0.005 | 0.000/60.832 |
| Ethnicity | |||||||||||||||||
| Caucasian | 8 | 2135/4184 | 1.20 (0.99–1.45) | 0.053 | 0.000/79.874 | 1.45 (1.02–2.08) | 0.040 | 0.000/78.000 | 1.03 (0.75–1.40) | 0.877 | 0.000/78.481 | 1.16 (0.84–1.60) | 0.373 | 0.000/82.426 | 1.46 (1.28–1.66) | 0.000 | 0.120/38.884 |
| Asian | 20 | 15,344/15,615 | 1.14 (1.05–1.24) | 0.002 | 0.000/79.288 | 1.22 (1.03–1.45) | 0.020 | 0.000/73.249 | 1.27 (1.14–1.41) | 0.000 | 0.000/74.134 | 1.27 (1.13–1.43) | 0.000 | 0.000/80.253 | 1.08 (0.96–1.22) | 0.262 | 0.001/57.234 |
| Cancer type | |||||||||||||||||
| BC | 4 | 2386/4250 | 1.21 (1.12–1.32) | 0.000 | 0.992/0.000 | 1.39 (1.14–1.69) | 0.001 | 0.873/0.000 | 1.37 (1.21–1.54) | 0.000 | 0.576/0.000 | 1.36 (1.22–1.53) | 0.000 | 0.689/0.000 | 1.12 (0.945–1.33) | 0.192 | 0.848 /0.000 |
| GC | 16 | 11,483/10,882 | 1.21 (1.09–1.35) | 0.000 | 0.000/83.251 | 1.45 (1.16–1.78) | 0.001 | 0.000/80.616 | 1.30 (1.16–1.45) | 0.000 | 0.000/62.932 | 1.36 (1.19–1.55) | 0.000 | 0.000/76.780 | 1.25 (1.07–1.47) | 0.007 | 0.000/72.933 |
| Other Cancer | 8 | 3610/4667 | 0.96 (0.90–1.03) | 0.291 | 0.218/26.402 | 0.95 (0.81–1.11) | 0.481 | 0.321/13.908 | 0.90 (0.72–1.11) | 0.312 | 0.013/60.713 | 0.92 (0.75–1.11) | 0.383 | 0.019/58.256 | 1.02 (0.89–1.17) | 0.765 | 0.552/0.000 |
| Variables | N | Case/Control | A vs. G Allele | AA vs. GG | GA vs. GG | GA + AA vs. GG | AA vs. GG + GA | ||||||||||
|---|---|---|---|---|---|---|---|---|---|---|---|---|---|---|---|---|---|
| OR (95% CI) | p | ph/I2 | OR (95% CI) | p | ph/I2 | OR (95% CI) | p | ph/I2 | OR (95% CI) | p | ph/I2 | OR (95% CI) | p | ph/I2 | |||
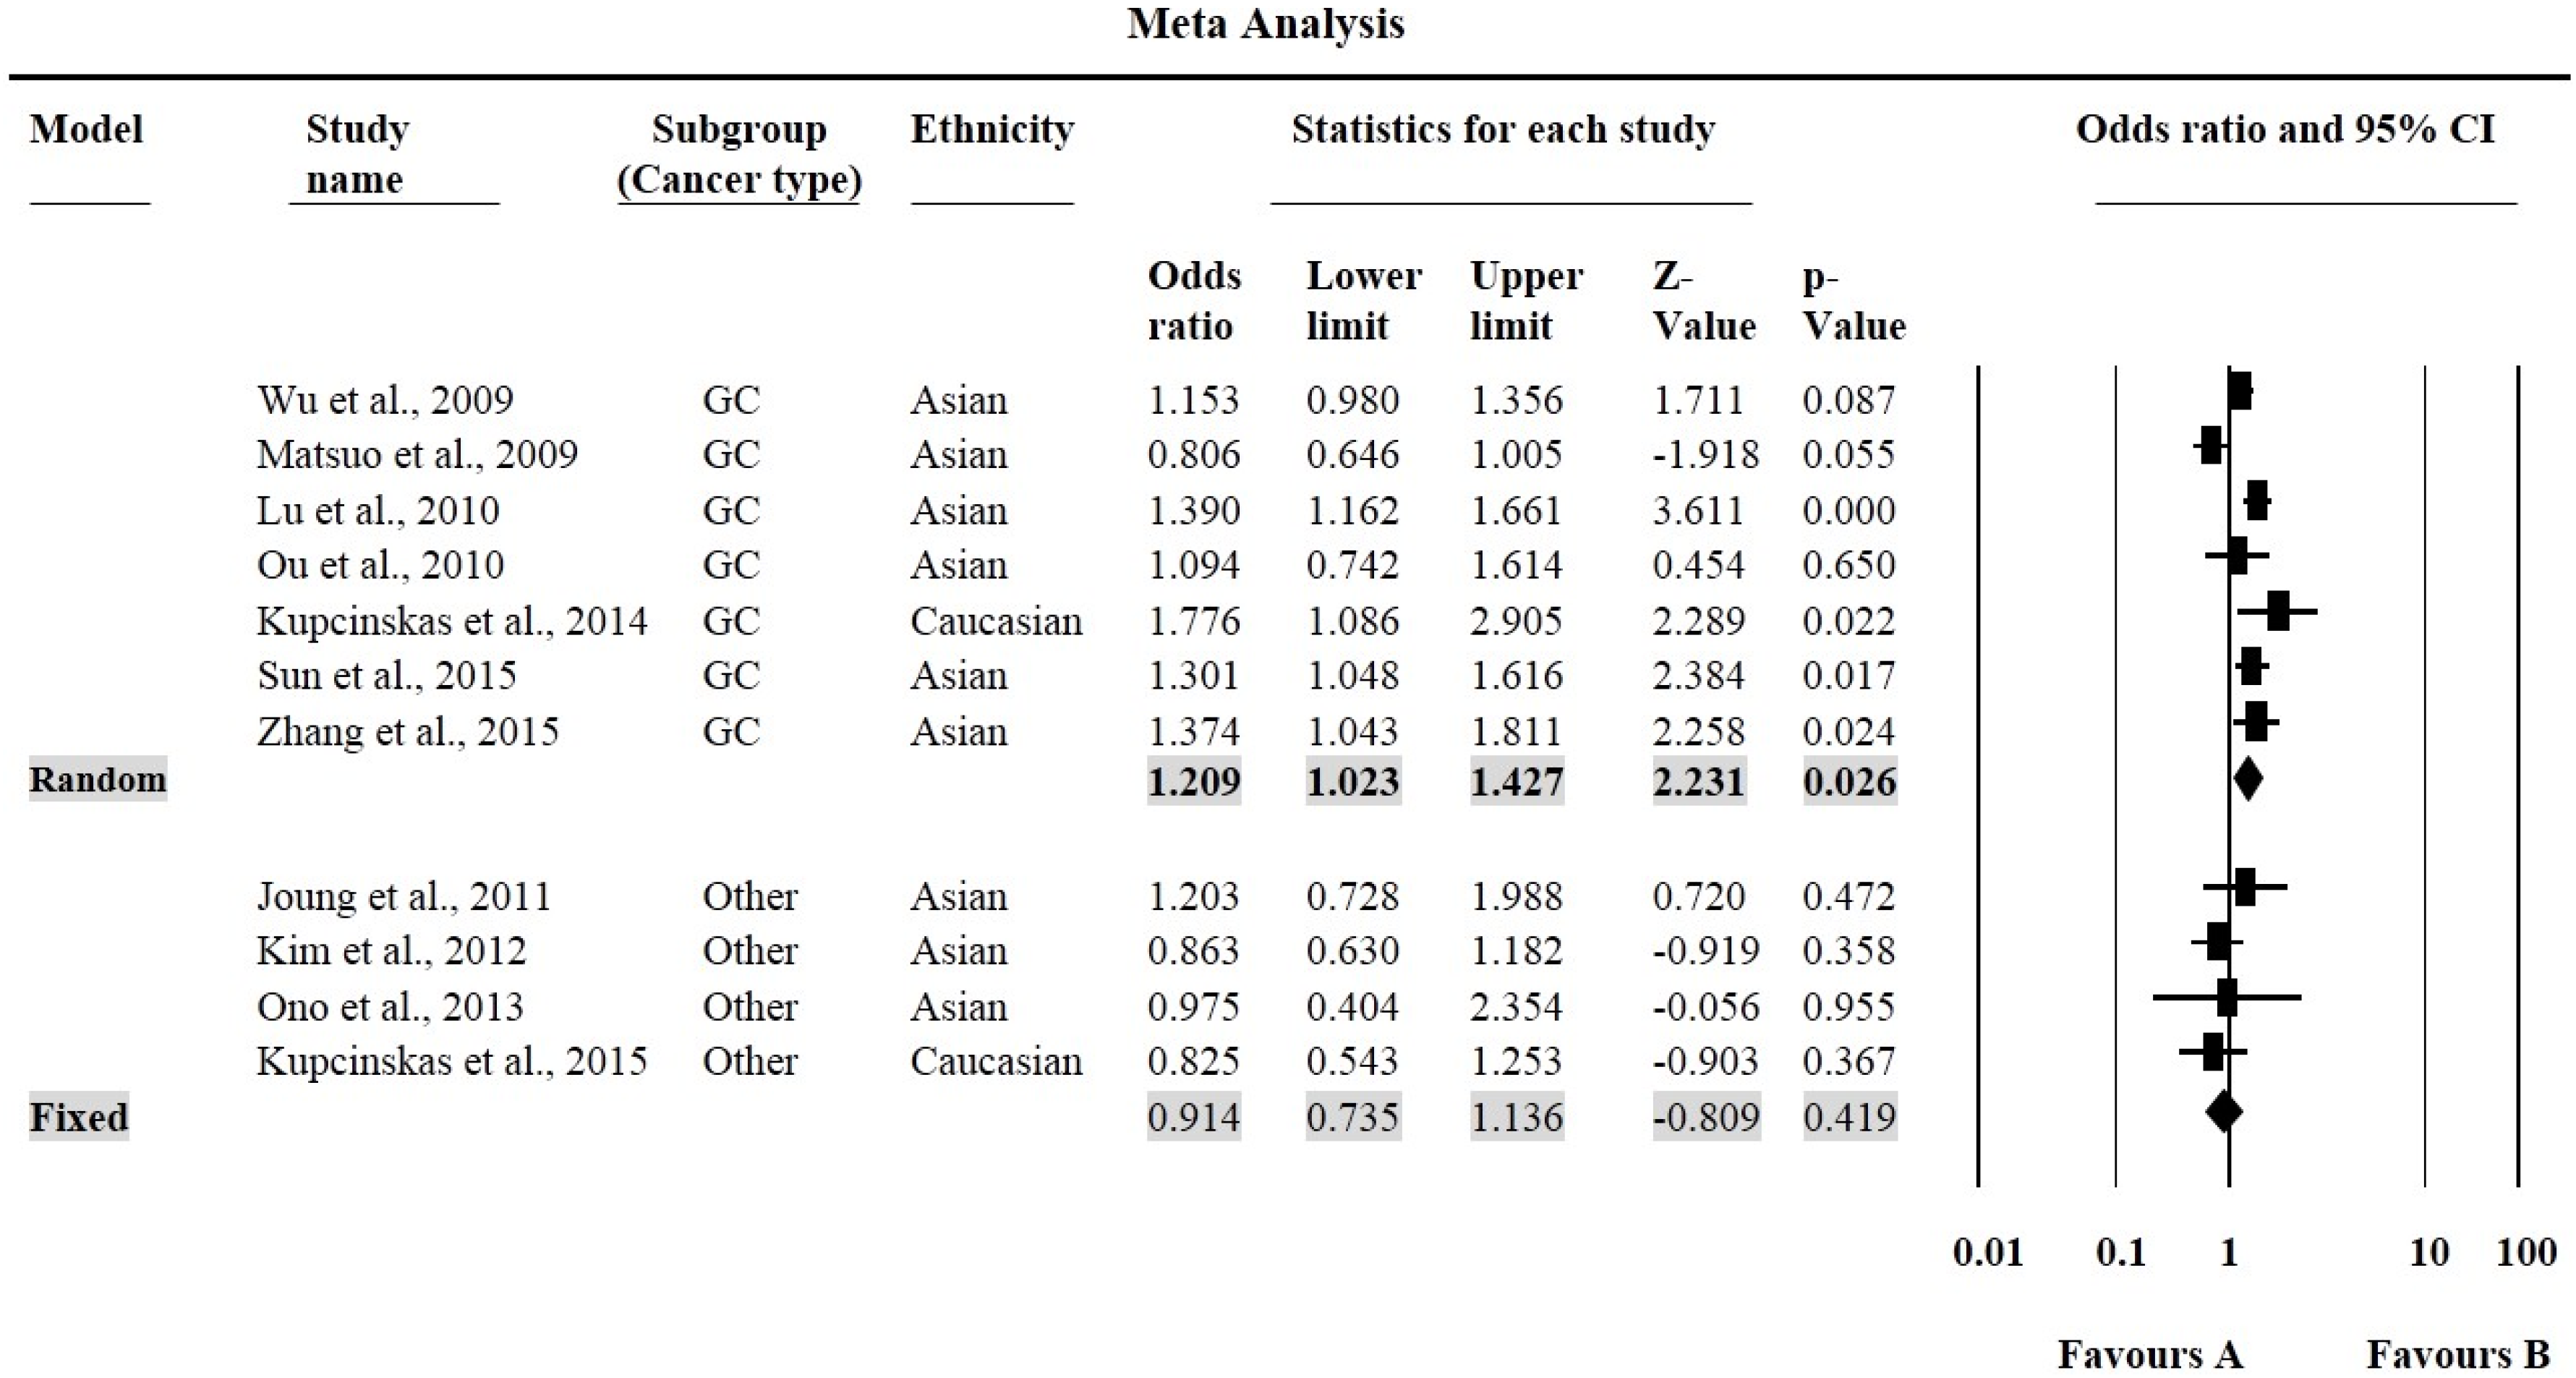
| All | 11 | 5970/5707 | 1.09 (0.95–1.25) | 0.210 | 0.000/81.116 | 1.10 (0.82–1.48) | 0.654 | 0.000/78.184 | 1.13 (0.98–1.31) | 0.087 | 0.004/61.549 | 1.161 (0.93–1.33) | 0.256 | 0.000/77.837 | 1.04 (0.82–1.32) | 0.756 | 0.000/73.621 |
| Ethnicity | |||||||||||||||||
| Caucasian | 2 | 431/614 | 1.39 (0.77–2.51) | 0.281 | 0.001/90.899 | 1.90 (0.60–6.03) | 0.276 | 0.001/90.399 | 1.20 (0.57–2.54) | 0.639 | 0.020/81.566 | 1.22 (0.36–4.19) | 0.753 | 0.000/94.07 | 1.66 (0.88–3.13) | 0.120 | 0.024/80.307 |
| Asian | 9 | 5053/4612 | 1.04 (0.91–1.19) | 0.540 | 0.000/76.841 | 0.981 (0.75–1.28) | 0.891 | 0.001/69.334 | 1.13 (0.98–1.31) | 0.100 | 0.008/61.119 | 1.10 (0.94–1.30) | 0.242 | 0.000/71.634 | 0.93 (0.75–1.16) | 0.529 | 0.010/60.305 |
| Cancer type | |||||||||||||||||
| GC | 7 | 5087/4524 | 1.14 (0.95–1.38) | 0.165 | 0.000/87.766 | 1.16 (0.76–1.77) | 0.498 | 0.000/86.220 | 1.21 (1.02–1.43) | 0.026 | 0.003/69.157 | 1.22 (0.99–1.50) | 0.066 | 0.000/82.190 | 1.04 (0.73–1.48) | 0.829 | 0.000/82.477 |
| Other Cancer | 4 | 873/1183 | 1.02 (0.90–1.16) | 0.264 | 0.428/0.000 | 1.05 (0.82–1.35) | 0.713 | 0.000/0.520 | 0.91 (0.74–1.14) | 0.419 | 0.676/0.000 | 0.87 (0.71–1.07) | 0.189 | 0.210/33.715 | 1.10 (0.89–1.36) | 0.365 | 0.349/8.804 |

3.4. Publication Bias

4. Discussion
Study Advantage
5. Conclusions
Author Contributions
Conflicts of Interest
Abbreviation
| PSCA | Prostate stem cell antigen |
| DCC | Deleted in Colorectal Carcinoma |
| SNP | Single nucleotide polymorphism |
| GBC | Gallbladder cancer |
| GC | Gastric cancer |
| EC | Esophageal cancer |
| BC | Bladder cancer |
| PC | Prostate cancer |
| CRC | Colorectal cancer |
| BrC | Breast cancer |
| OR | Odds ration |
| CI | Class interval |
| HWE | Hardy Weinberg Equilibrium |
| GWAS | Genome wide association study |
| PCR-RFLP | Polymerase chain reaction-restriction fragment length polymorphism |
| LDR | Ligation detection reaction |
| HRM | High-resolution melting (HRM) |
References
- Sharma, K.L.; Rai, R.; Srivastava, A.; Sharma, A.; Misra, S.; Kumar, A.; Mittal, B. A multigenic approach to evaluate genetic variants of PLCE1, LXRs, MMPs, TIMP, and CYP genes in gallbladder cancer predisposition. Tumour Biol. 2014, 35, 8597–8606. [Google Scholar] [CrossRef] [PubMed]
- Umar, M.; Upadhyay, R.; Mittal, B. PLCE1 rs2274223 A > G polymorphism and cancer risk: A meta-analysis. Tumour Biol. 2013, 34, 3537–3544. [Google Scholar] [CrossRef] [PubMed]
- Savas, S.; Liu, G. Genetic variations as cancer prognostic markers: Review and update. Hum. Mutat. 2009, 30, 1369–1377. [Google Scholar] [CrossRef] [PubMed]
- Guo, X.; Chen, C.; Liu, B.; Wu, Y.; Chen, Y.; Zhou, X.; Huang, X.; Li, X.; Yang, H.; Chen, Z.; et al. Genetic variations in monocarboxylate transporter genes as predictor of clinical outcomes in non-small cell lung cancer. Tumour Biol. 2015, 36, 3931–3939. [Google Scholar] [CrossRef] [PubMed]
- Chen, Y.Q.; Hsieh, J.T.; Yao, F.; Fang, B.; Pong, R.C.; Cipriano, S.C.; Krepulat, F. Induction of apoptosis and G2/M cell cycle arrest by DCC. Oncogene 1999, 18, 2747–2754. [Google Scholar] [CrossRef] [PubMed]
- Castets, M.; Broutier, L.; Molin, Y.; Brevet, M.; Chazot, G.; Gadot, N.; Paquet, A.; Mazelin, L.; Jarrosson-Wuilleme, L.; Scoazec, J.Y.; et al. DCC constrains tumour progression via its dependence receptor activity. Nature 2011, 482, 534–537. [Google Scholar] [CrossRef] [PubMed]
- Krimpenfort, P.; Song, J.Y.; Proost, N.; Zevenhoven, J.; Jonkers, J.; Berns, A. Deleted in colorectal carcinoma suppresses metastasis in p53-deficient mammary tumours. Nature 2012, 482, 538–541. [Google Scholar] [CrossRef] [PubMed]
- Khan, N.P.; Pandith, A.A.; Hussain, M.U.; Yousuf, A.; Khan, M.S.; Siddiqi, M.A.; Khrusheed, A.W.; Mudassar, S. Loss of heterozygosity (LOH) of deleted in colorectal cancer (DCC) gene and predisposition to colorectal cancer: Significant association in colorectal cancer patients of Kashmir. J. Cancer Res. Exp. Oncol. 2011, 3, 88–94. [Google Scholar]
- Bamias, A.T.; Bai, M.C.; Agnantis, N.J.; Michael, M.C.; Alamanos, Y.P.; Stefanaki, S.V.; Razi, E.D.; Skarlos, D.V.; Kappas, A.M.; Pavlidis, N.A. Prognostic significance of the deleted in colorectal cancer gene protein expression in high-risk resected gastric carcinoma. Cancer Investig. 2003, 21, 333–340. [Google Scholar] [CrossRef]
- Rai, R.; Sharma, K.L.; Tiwari, S.; Misra, S.; Kumar, A.; Mittal, B. DCC (deleted in colorectal carcinoma) gene variants confer increased susceptibility to gallbladder cancer (Ref. No.: Gene-D-12-01446). Gene 2013, 518, 303–309. [Google Scholar] [CrossRef] [PubMed]
- Cha, P.C.; Zembutsu, H.; Takahashi, A.; Kubo, M.; Kamatani, N.; Nakamura, Y.J. A genome-wide association study identifies SNP in DCC is associated with gallbladder cancer in the Japanese population. Hum. Genet. 2012, 57, 235–237. [Google Scholar] [CrossRef] [PubMed]
- Malik, M.A.; Gupta, A.; Zargar, S.A.; Mittal, B. Role of genetic variants of deleted in colorectal carcinoma (DCC) polymorphisms and esophageal and gastric cancers risk in Kashmir Valley and meta-analysis. Tumour Biol. 2013, 34, 3049–3057. [Google Scholar] [CrossRef] [PubMed]
- Djansugurova, L.; Zhunussova, G.; Khussainova, E.; Iksan, O.; Afonin, G.; Kaidarova, D.; Parker, M.I. Association of DCC, MLH1, GSTT1, GSTM1, and TP53 gene polymorphisms with colorectal cancer in Kazakhstan. Tumour Biol. 2015, 36, 279–289. [Google Scholar] [CrossRef] [PubMed]
- Raff, A.B.; Gray, A.; Kast, W.M. Prostate stem cell antigen: Prospective therapeutic and diagnostic target. Cancer Lett. 2009, 277, 126–132. [Google Scholar] [CrossRef] [PubMed]
- Han, K.R.; Seligson, D.B.; Liu, X.; Horvath, S.; Shintaku, P.I.; Thomas, G.V.; Said, J.W.; Reiter, R.E. Prostate stem cell antigen expression is associated with gleason score, seminal vesicle invasion and capsular invasion in prostate cancer. J. Urol. 2004, 171, 1117–1121. [Google Scholar] [CrossRef] [PubMed]
- Amara, N.; Palapattu, G.S.; Schrage, M.; Gu, Z.; Thomas, G.V.; Dorey, F.; Said, J.; Reiter, R.E. Prostate stem cell antigen is overexpressed in human transtitional cell carcinoma. Cancer Res. 2001, 61, 4660–4665. [Google Scholar] [PubMed]
- Ono, H.; Hiraoka, N.; Lee, Y.S.; Woo, S.M.; Lee, W.J.; Choi, I.J.; Saito, A.; Yanagihara, K.; Kanai, Y.; Ohnami, S.; et al. Prostate stem cell antigen, a presumable organ-dependent tumor suppressor gene, is down-regulated in gallbladder carcinogenesis. Genes Chromosome Cancer 2012, 51, 30–41. [Google Scholar] [CrossRef] [PubMed]
- Zou, Q.; Yang, L.; Yang, Z.; Huang, J.; Fu, X. PSCA and Oct-4 expression in the benign and malignant lesions of gallbladder: Implication for carcinogenesis, progression, and prognosis of gallbladder adenocarcinoma. Biomed. Res. Int. 2013, 2013. [Google Scholar] [CrossRef] [PubMed]
- Wente, M.N.; Jain, A.; Kono, E.; Berberat, P.O.; Giese, T.; Reber, H.A.; Friess, H.; Büchler, M.W.; Reiter, R.E.; Hines, O.J. Prostate stem cell antigen is a putative target for immunotherapy in pancreatic cancer. Pancreas 2005, 31, 119–125. [Google Scholar] [CrossRef] [PubMed]
- Ramírez, M.L.; Nelson, E.C.; Evans, C.P. Beyond prostate-specific antigen: Alternate serum markers. Prostate Cancer Prostatic Dis. 2008, 11, 216–229. [Google Scholar] [CrossRef] [PubMed]
- Madu, C.O.; Lu, Y. Novel diagnostic biomarkers for prostate cancer. J. Cancer 2010, 1, 150–177. [Google Scholar] [CrossRef] [PubMed]
- Sakamoto, H.; Yoshimura, K.; Saeki, N.; Katai, H.; Shimoda, T.; Matsuno, Y.; Saito, D.; Sugimura, H.; Tanioka, F.; Kato, S.; et al. Genetic variation in PSCA is associated with susceptibility to diffuse-type gastric cancer. Nat. Genet. 2008, 40, 730–740. [Google Scholar] [CrossRef] [PubMed]
- Fu, Y.P.; Kohaar, I.; Rothman, N.; Earl, J.; Figueroa, J.D.; Ye, Y.; Malats, N.; Tang, W.; Liu, L.; Garcia-Closas, M.; et al. Common genetic variants in the PSCA gene influence gene expression and bladder cancer risk. Proc. Natl. Acad. Sci. USA 2012, 109, 4974–4979. [Google Scholar] [CrossRef] [PubMed]
- Rai, R.; Sharma, K.L.; Misra, S.; Kumar, A.; Mittal, B. PSCA gene variants (rs2294008 and rs2978974) confer increased susceptibility of gallbladder carcinoma in females. Gene 2013, 530, 172–177. [Google Scholar] [CrossRef] [PubMed]
- Saeki, N.; Gu, J.; Yoshida, T.; Wu, X. Prostate stem cell antigen: A Jekyll and Hyde molecule? Clin. Cancer Res. 2010, 16, 3533–3538. [Google Scholar] [CrossRef] [PubMed]
- Wang, M.; Wang, X.J.; Ma, Y.F.; Ma, X.B.; Dai, Z.M.; Lv, Y.; Lin, S.; Liu, X.H.; Yang, P.T.; Dai, Z.J. PSCA rs2294008 C > T contributed to gastric and bladder cancer risk. J. Ther. Clin. Risk Manag. 2015, 11, 237–245. [Google Scholar]
- Matsuo, K.; Tajima, K.; Suzuki, T.; Kawase, T.; Watanabe, M.; Shitara, K.; Misawa, K.; Ito, S.; Sawaki, A.; Muro, K.; et al. Association of prostate stem cell antigen gene polymorphisms with the risk of stomach cancer in Japanese. Int. J. Cancer 2009, 125, 1961–1964. [Google Scholar] [CrossRef] [PubMed]
- Wang, S.; Tang, J.; Wang, M.; Yuan, L.; Zhang, Z. Genetic variation in PSCA and bladder cancer susceptibility in a Chinese population. Carcinogenesis 2010, 31, 621–624. [Google Scholar] [CrossRef] [PubMed]
- Moher, D.; Shamseer, L.; Clarke, M.; Ghersi, D.; Liberati, A.; Petticrew, M. Preferred reporting items for systematic review and meta-analysis protocols (PRISMA-P) 2015 statement. Syst. Rev. 2015, 4. [Google Scholar] [CrossRef] [PubMed]
- Higgins, J.P.; Thompson, S.G.; Deeks, J.J.; Altman, D.G. Measuring inconsistency in meta-analyses. BMJ 2003, 327, 557–560. [Google Scholar] [CrossRef] [PubMed] [Green Version]
- Mantel, N.; Haenszel, W. Statistical aspects of the analysis of data from retrospective studies of disease. J. Natl. Cancer Inst. 1959, 22, 719–748. [Google Scholar] [PubMed]
- DerSimonian, R.; Laird, N. Meta-analysis in clinical trials. Control. Clin. Trials 1986, 7, 177–188. [Google Scholar] [CrossRef]
- Egger, M.; Smith, D.G.; Schneider, M.; Minder, C. Bias in meta-analysis detected by a simple, graphical test. BMJ 1997, 315, 629–634. [Google Scholar] [CrossRef] [PubMed]
- Toma, M.; Stavarachi, M.; Cimponeriu, D.; Apostol, P.; Cojocaru, M.; Belusica, L.; Panduru, N.; Radu, I.; Gavrila, L. P53 And DCC Polymorphisms and the risk for colorectal cancer in Romanian Patients—A preliminary study. J. Anal. Univ. Oradea Fasc. Biol. 2009, 16, 162–165. [Google Scholar]
- Zhao, J.; Geng, P.; Li, Z.; Cui, S.; Zhao, J.; Wang, L.; Li, J.; Ji, F.; Li, G.; Shen, G.; et al. Prostate stem cell antigen rs2294008 polymorphism differentially contributes to Helicobacter pylori-negative gastric cancer among various populations in China. Mol. Clin. Oncol. 2013, 1, 493–498. [Google Scholar] [CrossRef] [PubMed]
- Wu, C.; Wang, G.; Yang, M.; Huang, L.; Yu, D.; Tan, W.; Lin, D. Two genetic variants in prostate stem cell antigen and gastric cancer susceptibility in a Chinese population. Mol. Carcinog. 2009, 48, 1131–1138. [Google Scholar] [CrossRef] [PubMed]
- Lu, Y.; Chen, J.; Ding, Y.; Jin, G.; Wu, J.; Huang, H.; Deng, B.; Hua, Z.; Zhou, Y.; Shu, Y.; et al. Genetic variation of PSCA gene is associated with the risk of both diffuse- and intestinal-type gastric cancer in a Chinese population. Int. J. Cancer 2010, 127, 2183–2189. [Google Scholar] [CrossRef] [PubMed]
- Ou, J.; Li, K.; Ren, H.; Bai, H.; Zeng, D.; Zhang, C. Association and haplotype analysis of prostate stem cell antigen with gastric cancer in Tibetans. DNA Cell Biol. 2010, 29, 319–323. [Google Scholar] [CrossRef] [PubMed]
- Zeng, Z.; Wu, X.; Chen, F.; Yu, J.; Xue, L.; Hao, Y.; Wang, Y.; Chen, M.; Sung, J.J.; Hu, P. Polymorphisms in prostate stem cell antigen gene rs2294008 increase gastric cancer risk in Chinese. Mol. Carcinog. 2011, 50, 353–358. [Google Scholar] [CrossRef] [PubMed]
- Song, H.R.; Kim, H.N.; Piao, J.M.; Kweon, S.S.; Choi, J.S.; Bae, W.K. Association of a common genetic variant in prostate stem-cell antigen with gastric cancer susceptibility in a Korean population. Mol. Carcinog. 2011, 50, 871–875. [Google Scholar] [CrossRef] [PubMed]
- Joung, J.Y.; Lee, Y.S.; Park, S.; Yoon, H.; Lee, S.J.; Park, W.S.; Chung, J.; Kim, S.Y.; Hong, S.H.; Kim, J.S.; et al. Haplotype analysis of prostate stem cell antigen and association with prostate cancer risk. J. Urol. 2011, 185, 2112–2118. [Google Scholar] [CrossRef] [PubMed]
- Lochhead, P.; Frank, B.; Hold, G.L.; Rabkin, C.S.; Ng, M.T.; Vaughan, T.L.; Risch, H.A.; Gammon, M.D.; Lissowska, J.; Weck, M.N.; et al. Genetic variation in the prostate stem cell antigen gene and upper gastrointestinal cancer in white individuals. Gastroenterology 2011, 140, 435–441. [Google Scholar] [CrossRef] [PubMed]
- Sala, N.; Muñoz, X.; Travier, N.; Agudo, A.; Duell, E.J.; Moreno, V.; Overvad, K.; Tjonneland, A.; Boutron-Ruault, M.C.; Clavel-Chapelon, F.; et al. Prostate stem-cell antigen gene is associated with diffuse and intestinal gastric cancer in Caucasians: Results from the EPIC-EURGAST study. Int. J. Cancer 2012, 130, 2417–2427. [Google Scholar] [CrossRef] [PubMed]
- Kim, S.Y.; Yoo, J.Y.; Shin, A.; Kim, Y.; Lee, E.S.; Lee, Y.S. Prostate stem cell antigen single nucleotide polymorphisms influence risk of estrogen receptor negative breast cancer in Korean females. Asian Pac. J. Cancer Prev. 2012, 13, 41–48. [Google Scholar] [CrossRef] [PubMed]
- Smith, C.; Lochhead, P.; Basavaraju, U.; Hold, G.L.; Fyfe, N.; Murray, G.I.; El-Omar, E.M. Lack of association between the rs2294008 polymorphism in the prostate stem cell antigen gene and colorectal neoplasia: A case-control and immunohistochemical study. BMC Res. Notes 2012, 5. [Google Scholar] [CrossRef] [PubMed] [Green Version]
- Li, F.; Zhong, M.Z.; Li, J.H.; Liu, W.; Li, B. Case-control study of single nucleotide polymorphisms of PSCA and MUC1 genes with gastriccancer in a Chinese. Asian Pac. J. Cancer Prev. 2012, 13, 2593–2596. [Google Scholar] [CrossRef] [PubMed]
- Ono, H.; Chihara, D.; Chiwaki, F.; Yanagihara, K.; Sasaki, H.; Sakamoto, H.; Tanaka, H.; Yoshida, T.; Saeki, N.; Matsuo, K. Missense allele of a single nucleotide polymorphism rs2294008 attenuated antitumor effects of prostate stem cell antigen in gallbladder cancer cells. J. Carcinog. 2013, 12. [Google Scholar] [CrossRef]
- Ma, Z.; Hu, Q.; Chen, Z.; Tao, S.; Macnamara, L.; Kim, S.T.; Tian, L.; Xu, K.; Ding, Q.; Zheng, S.L.; et al. Systematic evaluation of bladder cancer risk-associated single-nucleotide polymorphisms in a Chinese population. Mol. Carcinog. 2013, 52, 916–921. [Google Scholar] [CrossRef] [PubMed]
- Dai, N.; Zheng, M.; Wang, C.; Ji, Y.; Du, J.; Zhu, C.; He, Y.; Zhu, M.; Zhu, X.; Sun, M.; et al. Genetic variants at 8q24 are associated with risk of esophageal squamous cell carcinoma in a Chinese population. Cancer Sci. 2014, 105, 731–735. [Google Scholar] [CrossRef] [PubMed]
- Sun, Y.; Gu, J.; Ajani, J.A.; Chang, D.W.; Wu, X.; Stroehlein, J.R. Genetic and intermediate phenotypic susceptibility markers of gastric cancer in Hispanic Americans: A case-control study. Cancer 2014, 120, 3040–3048. [Google Scholar] [CrossRef] [PubMed]
- Wang, P.; Ye, D.; Guo, J.; Liu, F.; Jiang, H.; Gong, J.; Gu, C.; Shao, Q.; Sun, J.; Zheng, S.L.; et al. Genetic score of multiple risk-associated single nucleotide polymorphisms is a marker for genetic susceptibility to bladder cancer. Genes Chromosomes Cancer 2014, 53, 98–105. [Google Scholar] [CrossRef] [PubMed]
- Lee, J.H.; Song, H.R.; Kim, H.N.; Kweon, S.S.; Yun, Y.W.; Choi, J.S.; Jung, S.I.; Kwon, D.D.; Kim, S.H.; Choi, Y.D.; et al. Genetic variation in PSCA is associated with bladder cancer susceptibility in a Korean population. Asian Pac. J. Cancer Prev. 2014, 15, 8901–8904. [Google Scholar] [CrossRef] [PubMed]
- Kupcinskas, J.; Wex, T.; Link, A.; Bartuseviciute, R.; Dedelaite, M.; Kevalaite, G.; Leja, M.; Skieceviciene, J.; Kiudelis, G.; Jonaitis, L.; et al. PSCA and MUC1 gene polymorphisms are linked with gastric cancer and pre-malignant gastric conditions. Anticancer Res. 2014, 34, 7167–7175. [Google Scholar] [PubMed]
- Sun, H.; Wu, X.; Wu, F.; Li, Y.; Yu, Z.; Chen, X.; Chen, Y.; Yang, W. Associations of genetic variants in the PSCA, MUC1 and PLCE1 genes with stomach cancer susceptibility in a Chinese population. PLoS ONE 2015, 10, e0117576. [Google Scholar] [CrossRef] [PubMed]
- García-González, M.A.; Bujanda, L.; Quintero, E.; Santolaria, S.; Benito, R.; Strunk, M.; Sopeña, F.; Thomson, C.; Pérez-Aisa, A.; Nicolás-Pérez, D.; et al. Association of PSCA rs2294008 gene variants with poor prognosis and increased susceptibility to gastric cancer and decreased risk of duodenal ulcer disease. Int. J. Cancer 2015, 15, 1362–13736. [Google Scholar] [CrossRef] [PubMed]
- Ichikawa, H.; Sugimoto, M.; Uotani, T.; Sahara, S.; Yamade, M.; Iwaizumi, M.; Yamada, T.; Osawa, S.; Sugimoto, K.; Miyajima, H.; et al. Influence of prostate stem cell antigen gene polymorphisms on susceptibility to Helicobacter pylori-associated diseases: A case-control study. Helicobacter 2015, 20, 106–113. [Google Scholar] [CrossRef] [PubMed]
- Zhang, W.; Liang, P.; Wang, W.; Dai, P.; Wang, Q.; Yan, W.; Zhao, J.; Sun, J.; Peng, Y.; Cui, D.; et al. The Influence of PSCA Gene Variation on Its Expression and Gastric Adenocarcinoma Susceptibility in the Northwest Chinese Population. Int. J. Mol. Sci. 2015, 16, 11648–11658. [Google Scholar] [CrossRef] [PubMed]
- Kupcinskas, J.; Gyvyte, U.; Bruzaite, I.; Leja, M.; Kupcinskaite-Noreikiene, R.; Pauzas, H.; Tamelis, A.; Jonaitis, L.; Skieceviciene, J.; Kiudelis, G. Common Genetic Variants of PSCA, MUC1 and PLCE1 Genes are not associated with Colorectal Cancer. Asian Pac. J. Cancer Prev. 2015, 16, 6027–6032. [Google Scholar] [CrossRef] [PubMed]
- Qiao, L.; Feng, Y. Genetic variations of prostate stem cell antigen (PSCA) contribute to the risk of gastric cancer for EasternAsians: A meta-analysis based on 16792 individuals. Gene 2012, 493, 83–91. [Google Scholar] [CrossRef] [PubMed]
- Wu, X.; Ye, Y.; Kiemeney, L.A.; Sulem, P.; Rafnar, T.; Matullo, G.; Seminara, D.; Yoshida, T.; Saeki, N.; Andrew, A.S.; et al. Genetic variation in the prostate stem cell antigen gene PSCA confers susceptibility to urinary bladder cancer. Nat. Genet. 2009, 41, 991–995. [Google Scholar] [CrossRef] [PubMed]
- Zhang, T.; Chen, Y.N.; Wang, Z.; Chen, J.Q.; Huang, S. Effect of PSCA gene polymorphisms on gastric cancer risk and survival prediction: A meta-analysis. Exp. Ther. Med. 2012, 4, 158–164. [Google Scholar] [PubMed]
- Shi, D.; Wang, S.; Gu, D.; Wu, D.; Wang, M.; Chu, H.; Tong, N.; Ma, L.; Zhong, D.; Zhang, Z. The PSCA polymorphisms derived from genome-wide association study are associated with risk of gastric cancer: A meta-analysis. J. Cancer Res. Clin. Oncol. 2012, 138, 1339–1345. [Google Scholar] [CrossRef] [PubMed]
- Wang, T.; Zhang, L.; Li, H.; Wang, B.; Chen, K. Prostate stem cell antigen polymorphisms and susceptibility to gastric cancer: A systematic review and meta-analysis. Cancer Epidemiol. Biomark. Prev. 2012, 21, 843–850. [Google Scholar] [CrossRef] [PubMed]
- Zhang, Q.H.; Yao, Y.L.; Gu, T.; Gu, J.H.; Chen, L.; Liu, Y. Association of the PSCA rs2294008 C > T polymorphism with gastric cancer risk: Evidence from a meta-analysis. Asian Pac. J. Cancer Prev. 2012, 13, 2867–2871. [Google Scholar] [CrossRef] [PubMed]
- Gu, X.; Zhang, W.; Xu, L.; Cai, D. Quantitative assessment of the influence of prostate stem cell antigen polymorphisms on gastric cancer risk. Tumour Biol. 2014, 35, 2167–2174. [Google Scholar] [CrossRef] [PubMed]
- Gao, J.; Yang, P.T.; Diao, Y.; Kang, H.F.; Zhao, Y.; Lin, S.; Wang, Z.M.; Wang, M.; Wang, X.J.; Dai, Z.J. Effects of PSCA rs2294008 (C/T) and c-MYC rs9642880 (G/T) polymorphisms on bladder cancer: Evidence from a meta-analysis. Int. J. Clin. Exp. Med. 2015, 8, 2156–2164. [Google Scholar] [PubMed]
- Zhao, Y.; Gui, Z.L.; Liao, S.; Gao, F.; Ge, Y.Z.; Jia, R.P. Prostate stem cell antigen rs2294008 (C > T) polymorphism and bladder cancer risk: A meta-analysis based oncases and controls. Genet. Mol. Res. 2014, 13, 5534–5540. [Google Scholar] [CrossRef] [PubMed]
- 1. Gu, Y.; Dai, Q.S.; Hua, R.X.; Zhang, B.; Zhu, J.H.; Huang, J.W.; Xie, B.H.; Xiong, S.Q.; Tan, G.S.; Li, H.P. PSCA rs2294008 C > T and rs2976392 G > A polymorphism contribute to cancer susceptibility: Evidence from published studies. Genet. Cancer 2015, 6, 254–264. [Google Scholar]
© 2016 by the authors; licensee MDPI, Basel, Switzerland. This article is an open access article distributed under the terms and conditions of the Creative Commons by Attribution (CC-BY) license (http://creativecommons.org/licenses/by/4.0/).
Share and Cite
Chandra, V.; Kim, J.J.; Gupta, U.; Mittal, B.; Rai, R. Impact of DCC (rs714) and PSCA (rs2294008 and rs2976392) Gene Polymorphism in Modulating Cancer Risk in Asian Population. Genes 2016, 7, 9. https://0-doi-org.brum.beds.ac.uk/10.3390/genes7020009
Chandra V, Kim JJ, Gupta U, Mittal B, Rai R. Impact of DCC (rs714) and PSCA (rs2294008 and rs2976392) Gene Polymorphism in Modulating Cancer Risk in Asian Population. Genes. 2016; 7(2):9. https://0-doi-org.brum.beds.ac.uk/10.3390/genes7020009
Chicago/Turabian StyleChandra, Vishal, Jong Joo Kim, Usha Gupta, Balraj Mittal, and Rajani Rai. 2016. "Impact of DCC (rs714) and PSCA (rs2294008 and rs2976392) Gene Polymorphism in Modulating Cancer Risk in Asian Population" Genes 7, no. 2: 9. https://0-doi-org.brum.beds.ac.uk/10.3390/genes7020009