Article

Enhancer Trapping and Annotation in Zebrafish Mediated with Sleeping Beauty, piggyBac and Tol2 Transposons

1
Institute of Mobilome and Genome, College of Animal Science & Technology, Yangzhou University, Yangzhou 225009, China
2
Institute of Cancer and Genomic Sciences, College of Medical and Dental Sciences, University of Birmingham, Edgbaston, Birmingham B15 2TT, UK
*
Author to whom correspondence should be addressed.
These authors contributed equally to this work.
Submission received: 5 September 2018 / Revised: 7 December 2018 / Accepted: 10 December 2018 / Published: 13 December 2018
(This article belongs to the Section Molecular Genetics and Genomics)

Abstract

:
Although transposon-mediated enhancer trapping (ET) is successfully applied in diverse models, the efficiency of various transposon systems varies significantly, and little information is available regarding efficiency of enhancer trapping by various transposons in zebrafish. Most potential enhancers (Ens) still lack evidence of actual En activity. Here, we compared the differences in ET efficiency between sleeping beauty (SB), piggyBac (PB) and Tol2 transposons. Tol2 represented the highest germline transfer efficiencies at 55.56% (NF0 = 165), followed by SB (38.36%, NF0 = 151) and PB (32.65%, NF0 = 149). ET lines generated by the Tol2 transposon tended to produce offspring with a single expression pattern per line, while PB and SB tended to generate embryos with multiple expression patterns. In our tests, 10 putative Ens (En1–10) were identified by splinkerette PCR and comparative genomic analysis. Combining the GFP expression profiles and mRNA expression patterns revealed that En1 and En2 may be involved in regulation of the expression of dlx1a and dlx2a, while En6 may be involved in regulation of the expression of line TK4 transgene and rps26, and En7 may be involved in the regulation of the expression of wnt1 and wnt10b. Most identified Ens were found to be transcribed in zebrafish embryos, and their regulatory function may involve eRNAs.

1. Introduction

The term ‘enhancer’ (En) was first introduced to describe the effects of SV40 DNA on the ectopic expression of the gene for a cloned rabbit β-globin [1]. Ens can mediate the on/off switch patterns of gene expression in specific cell types at particular stages during animal embryogenesis and development [2]. Ens can act at a long distance away from their target gene and independent of their orientation [3]; some Ens have also been shown to be involved in genetic disease in humans [4,5]. These functional properties make Ens an important part of the genomic regulatory architecture.
The methods of identification of novel Ens are continuously improving, yet the typical En trapping (ET) technology is based on a randomly inserted transposon-mediated vector, which harbors a trapping box containing a mini-promoter, reporter open reading frame (ORF) and polyA, and the trapping box is flanked by inverse terminal repeats (ITRs) of transposon [6,7,8,9,10]. As the development of retrovirus- and transposon-based technologies for gene transfer progresses, the efficiency of integrating reporters into the genome has been improved significantly [11]. Transposons represent the most effective insertion technology in vertebrates to date, and have been developed as gene delivery vectors for gene therapy, insertional mutagenesis and other experimental approaches. Numerous studies of transposon-mediated En detection have been reported for medaka [12], zebrafish [13,14,15], mice [16], and insects [17]. A multifunctional mutagenesis system in zebrafish using the maize Ds transposon has been described, in which ET efficiency as measured by reporter green fluorescent protein (GFP) expression frequency was 23% [18]. A piggyBac (PB) transposon-based ET system developed for a human malaria vector resulted in 314 progeny arising with ET [19]. Subsequently, PB-mediated ET was efficiently used for discovering and manipulating neuronal cell types [20]. Large-scale analysis of the regulatory architecture of the mouse genome with a SB transposon-associated sensor generated several hundred mice and embryos, each with a regulatory sensor inserted at a random genomic position [21]. The SB transposon system has also been tested for ET in zebrafish, and nine transgenic zebrafish lines with distinct tissue-specific GFP expression patterns were obtained, but only one En (mkp3) was finally identified [13]. Tol2 transposons have been extensively applied for ET in zebrafish [22,23]. Zebrafish ET transgenics performed with the Tol2 transposon technique could be instrumental for studies of the development of the circumventricular organs in zebrafish and for understanding the molecular mechanisms of diseases such as hydrocephalus in humans [24]. Twelve zebrafish lines with a single copy and tissue- or cell-specific GFP expression were obtained using a Tol2 transposable system containing a minimal mouse metallothionein gene promoter and GFP, and one potential En element was identified [11]. Tol2 transposon-mediated gene trap and ET screens found a subpopulation of neurons in the zebrafish dorsal telencephalon (Dm) essential for fear conditioning, which were called 120A-Dm neurons. Inhibition of the 120A-Dm neurons caused reduced performance in Pavlovian fear conditioning [25]. The Tol2 insertions were also mobilized efficiently in the germline, and a Tol2 gene trap construct mobilized an insertion into nup214 [26]. As an alternative to traditional ET methods, a binary Gal4-UAS system has been used successfully for ET construction and monitoring cell- or tissue-specific expression of reporter genes in Drosophila and zebrafish [16,27,28,29].
Preference of target sites of transposons may play roles in influencing ET efficiency. Target site preferences of different transposons range from essentially random to selective with respect to the actual DNA sequences, at which integrations occur, but are invariably non-random on the genome-wide scale [30]. The SB element does not appear to exhibit a pronounced preference for targeted sequence [31], and it tends to generate predominantly single-copy insertion [30]. However, both PB and Tol2 have been found to be biased towards transcriptional units, CpG islands and transcription start sites (TSSs), open chromatin in general [32,33,34], and as a result, target site preferences may have a significant influence on ET efficiency.
Despite the success of various transposon-mediated ETs in a number of species, including ET mediated with SB, Tol2 and Ds applied in zebrafish, there is a lack of direct comparison of ET efficiency between the various transposons in zebrafish. Moreover, few studies have tested the actual enhancer activity of trapped potential Ens. Here, we compared the differences in ET efficiency, including transient GFP expression frequency, germline transmission efficiency and the diversity of captured patterns, among PB, SB, and Tol2 transposons. We have annotated the Ens trapped by stable transgenic lines, and detected the actual activity of each trapped En in reporter constructs in vivo. The transposon mediated ET methods and results described here represent a systematic approach to discover and evaluate cis-regulatory activity and aim to enhance our understanding of transcriptional regulation during vertebrate embryonic development.

2. Materials and Methods

2.1. Vector Construction, Injection and Transgenic Screening

To compare the efficiency of ET by SB, PB and Tol2 transposons, the GFP trapping box containing mini-promoter Krt4 (keratin4), GFP and β-globin polyA was constructed. The Krt4 minimal promoter was cloned from the zebrafish genome using primers 5′-gcACTAGTAAGCTTgtgtgtgtgtgagagcagtc-3′ and 5′-atGAATTCaggtacgagagtgctctctg-3′, and the CAG promoter of pCAG-GFP vector (Addgene: 11150) was replaced with SpeI/EcoRI sites. Then, the GFP trapping box was subcloned into the SB, PB and Tol2 transposon structural frames and named pSB-Krt4-GFP, pPB-Krt4-GFP and pTol2-Krt4-GFP, respectively (Figure 1a). The SB100X transposase plasmid was a gift from Dr. Zoltan Ivics (Paul Ehrlich Institute, Germany); the PB transposase plasmid was a gift from Dr. Allan Bradley (Wellcome Trust Sanger Institute, UK); the Tol2 transposase plasmid was received from Vladim Korzh (National University of Singapore, Singapore); the SB100X and PB and Tol2 ORFs were subcloned into the pTNTTM vector, while pTNTTM plasmid was ordered from (AL5610; Promega, Fitchburg, WI, USA). We named them pTNT-SB100X, pTNT-PB and pTNT-Tol2. Then, transposase mRNA was synthesized in vitro using a mMESSAGE mMACHINE T7 Kit (AM1344; Ambion, Austin, Texas, USA) from the pTNT-SB100X/PB/Tol2 constructs according to the kit instructions.

2.2. Injection of Fertilized Eggs

To compare the GFP expression frequency of the three transposons, transposon donor plasmids (pSB-Krt4-GFP, pPB-Krt4-GFP, and pTol2-Krt4-GFP) at 20 ng/µL were mixed with capped transposase mRNA at 50 ng/µL for SB and PB, or at 30 ng/µL for Tol2 respectively. In each batch of experiments, 10–20 pairs of parental fish were used to naturally produce fertilized eggs and these eggs were evenly allocated to the three transposon groups for microinjection. Then, the mixture was injected into individual zebrafish fertilized in the yolk cell. There were approximately 500 eggs in each group. Three batches of independent experiments were repeated to obtain statistically significant results. After injection, GFP expression was screened at 48 and 120 h postfertilization (hpf) by fluorescence microscopy. GFP-positive embryos at 120 hpf were raised to adulthood and crossed to (wild-type) WT for GFP germline transfer analysis, and the GFP expression of F1 embryos was screened at 1, 2, 3, 4, 5, 6 and 7 days postfertilization (dpf) under the Leica (Solms, Germany) M165 FC fluorescent microscope.
Zebrafish were maintained at 28.5 °C in a licensed aquarium facility (ESEN, Beijing, China) according to standard protocols. All treatments and protocols involving zebrafish in this study were strictly done in accordance with the guidelines of the Animal Experiment Ethics Committee of Yangzhou University (approval number:YZUDWSY2018-12).

2.3. Amplification of Transposon Insertion Sites

To clarify the genetic backgrounds corresponding to ET lines with specific GFP expression patterns, we detected insertion events in these lines. First, GFP-positive F0 fish were outcrossed with WT fish to obtain GFP-positive offspring (F1 fish) for stable transgenic lines. Then, F1 fish were outcrossed with WT fish to generate positive offspring for splinkerette PCR assay according to the protocol described previously, and each line was outcrossed five times to observe the segregation of expression pattern, and at least three batches of embryos from different outcrossing were used for splinkerette PCR [35]. Genomic DNAs were digested with Sau3AI, followed by two rounds of PCR amplification with primers specific for the transposon and splinkerette (Table S1). The first-round PCR was performed using the digested genomic DNA as the template with the primer pairs of SPLINK1/TN-1R under the following conditions: 1 cycle at 94 °C for 5 min; 35 cycles at 94 °C for 30 s, 60 °C for 30 s, 72 °C for 2 min; 1 cycle at 72 °C for 10 min. Then, the first-round PCR product (1 µL) was used as a template for the second-round PCR with primer pairs SPLINK2/TN-2R under the following conditions: 1 cycle at 94 °C for 5 min; 35 cycles at 94 °C for 30 s, 58 °C for 30 s, 72 °C for 1 min 30 s; 1 cycle at 72 °C for 10 min. The products of the second round of PCR amplification were purified and submitted for sequencing using primer T1.

2.4. Computational Analysis of Genomic Sequences

To identify the putative Ens, the chromosomal flanking DNA sequences around the insertion sites were mapped on the zebrafish genome sequence (GRCz10) in the Ensembl (http://asia.ensembl.org) by BLASTN (https://blast.ncbi.nlm.nih.gov/Blast.cgi), then genomic sequences spanning the region between the target genes from diverse representative species of vertebrates were downloaded from the Ensembl browser, and multiple alignments of genomic sequences were made using mVISTA (http://genome.lbl.gov/vista/mvista/submit.shtml) to identify the conserved non-coding sequences, which are putative Ens.

2.5. Whole-Mount RNA In Situ Hybridization and Transcription Analysis of Identified Ens

To identify the expression profile of the endogenous gene near the insertion site, whole-mount RNA in situ hybridization (WISH) of the nearest gene was performed as previously described [36]. Antisense RNA probes for dlx1a, dlx2a, wnt1, wnt10b, rps26 and ednraa were synthesized by using digoxigenin (Roche, Basel, Switzerland) as a label. Images were captured using the M165 FC fluorescent microscope (Leica, Solms, Germany).
To investigate the transcription of the identified Ens, the embryos, developed to 24 and 48 hpf (hours post fertilization), were used for reverse transcription (RT)-PCR and real-time quantitative-PCR (qPCR) (the primers for qPCR are listed in Table S2).

2.6. Enhancer Activity Analysis In Vivo

The newly identified Ens were cloned from the zebrafish genome with the primers listed in Table S1 and inserted into an En test vector to retest the expression dynamics. The En test vector contained the gata mini-promoter, GFP ORF, and β-globin polyA flanked with two insulators; we named the new vector including Ens as pEn-gata-GFP. Then, the plasmid (pEn-gata-GFP) at 20 ng/µL containing Ens was mixed with capped Tol2 transposase mRNA at 30 ng/µL injected into individual zebrafish embryos at the one-cell stage. After injection, embryos were screened at 24 and 48 hpf.

3. Results

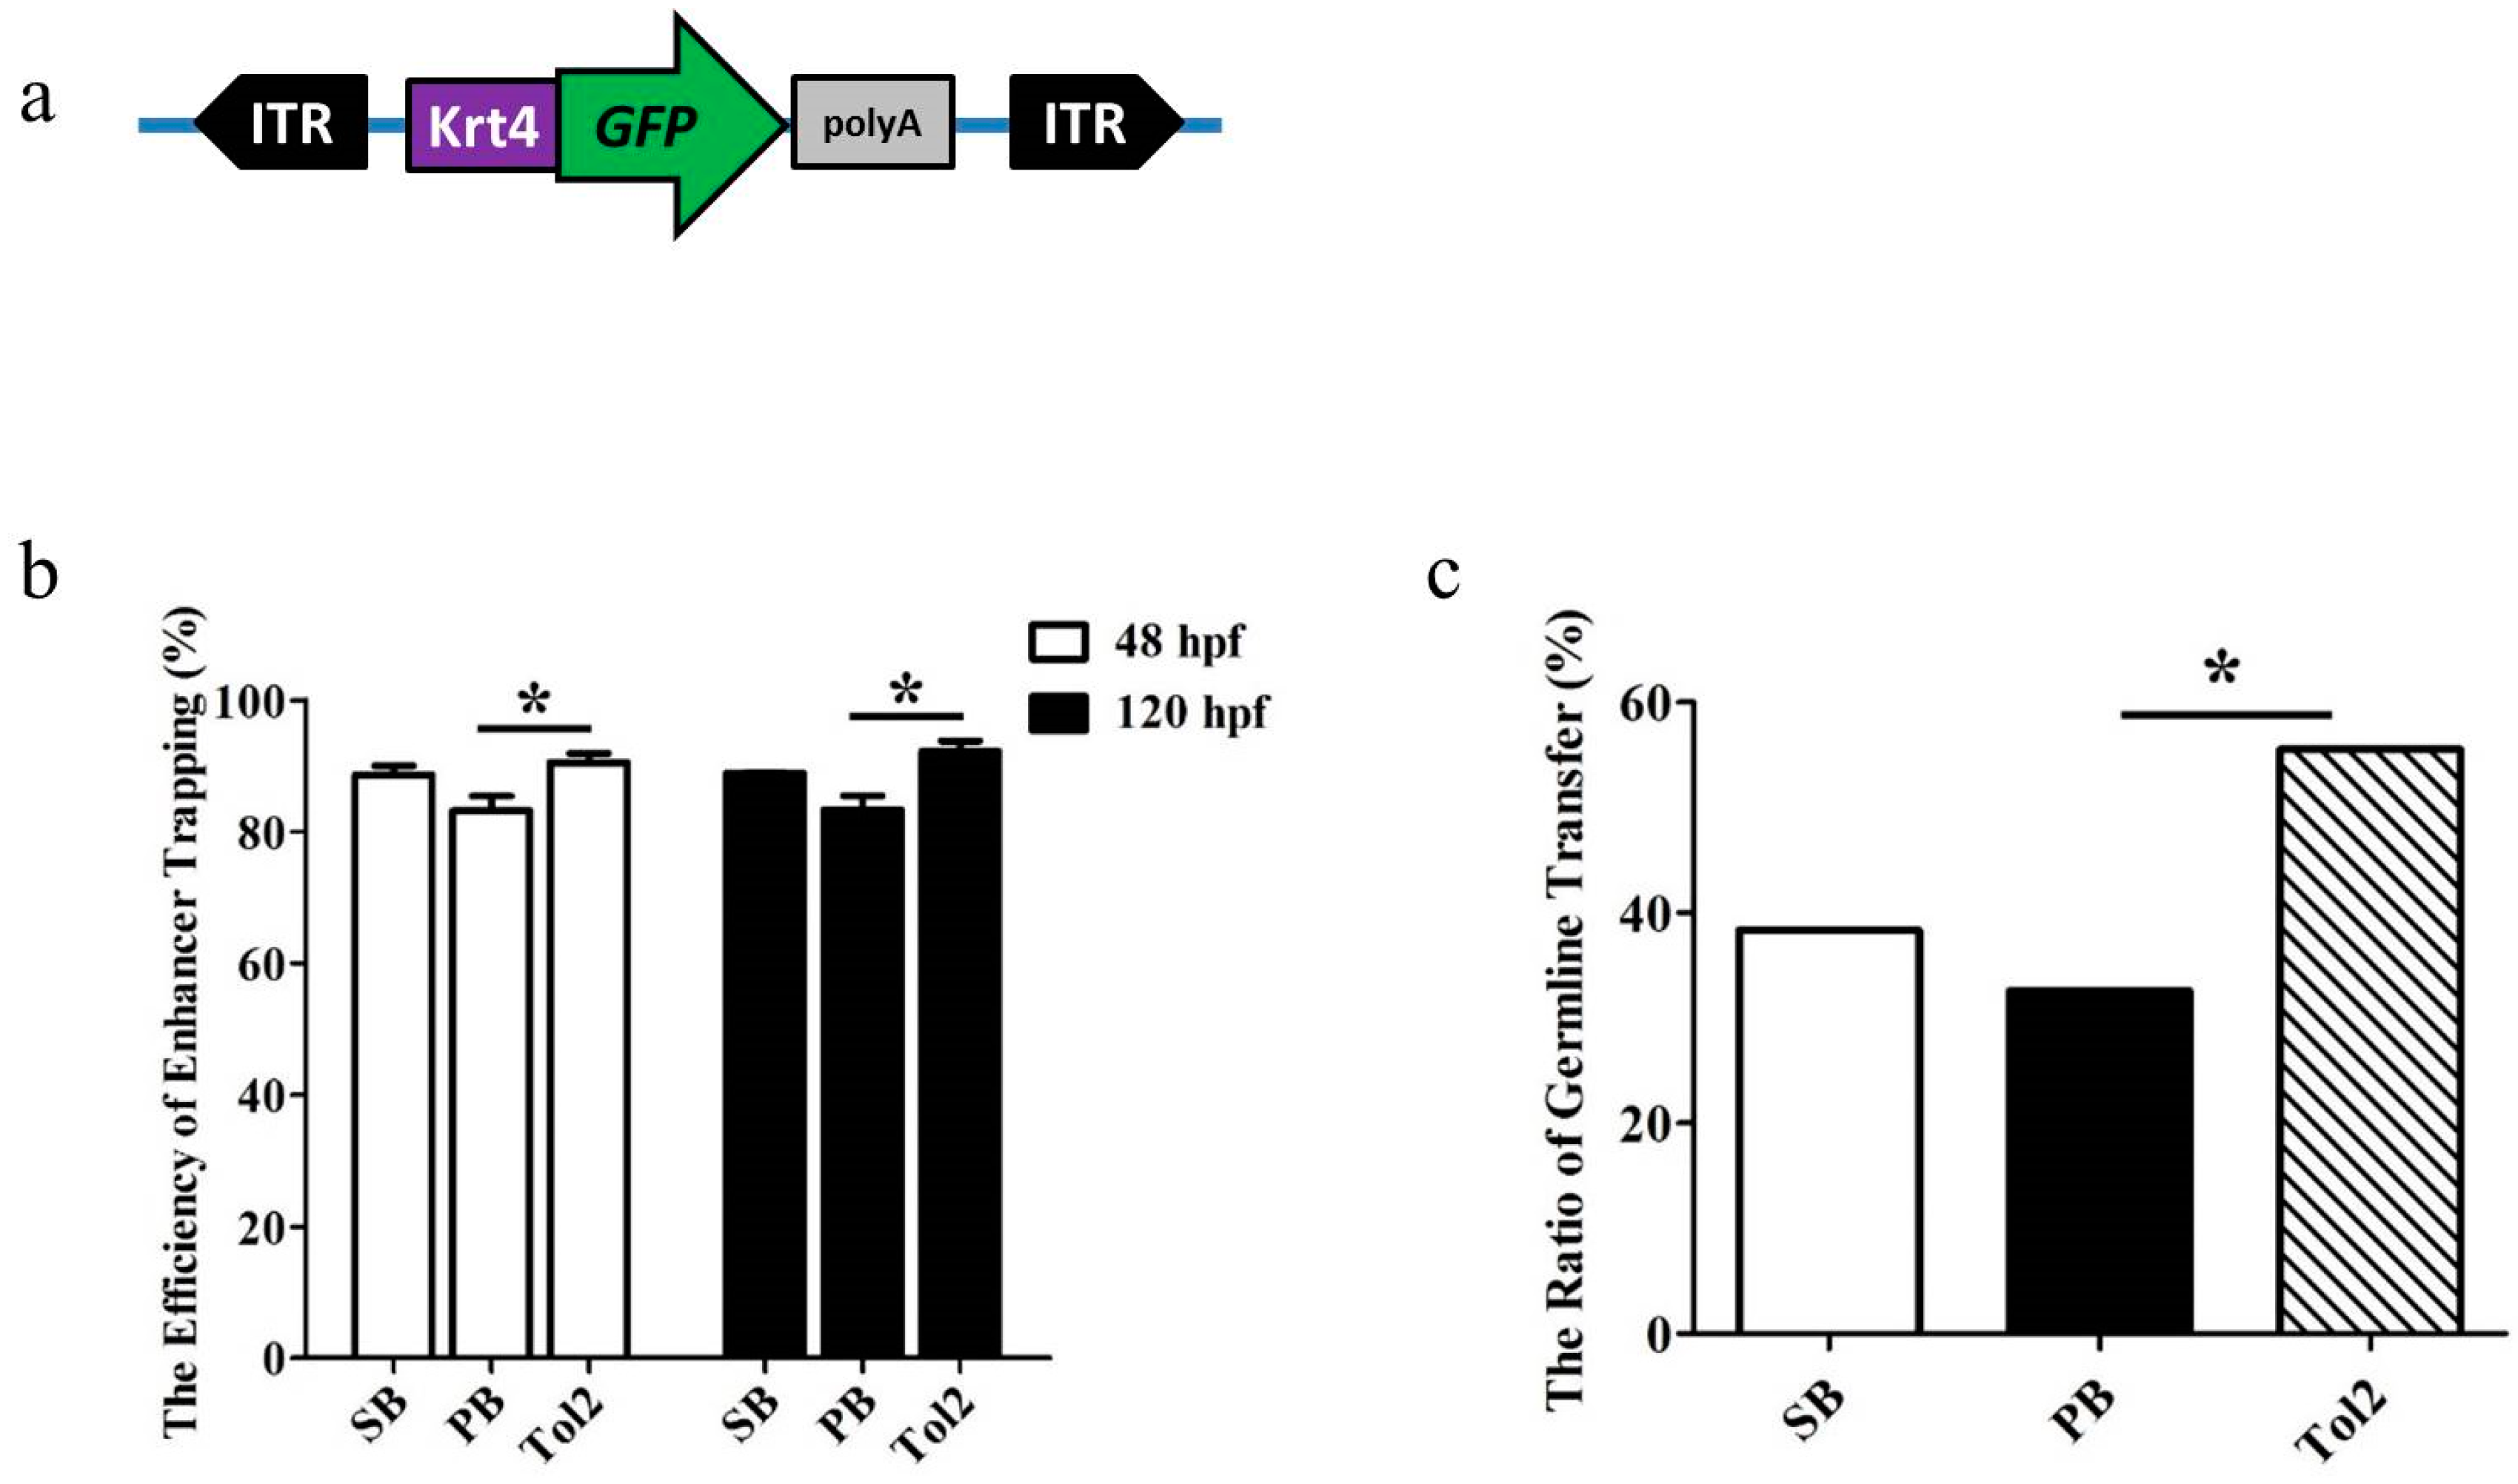
3.1. Comparative Analysis of the Enhancer Trapping Efficiency of PB, SB and Tol2 Transposons

To compare the transposition frequency of three transposons in zebrafish embryos, we co-injected a mixture of ET vector and transposase mRNA of PB, SB, or Tol2 transposon into one-cell stage embryos of zebrafish, and screened for GFP expression at 48 and 120 hpf. The ET vector contains an ET box with a mini-promoter Krt4, GFP reporter gene and β-globin polyA, and the ET box is flanked with PB, SB or Tol2 transposon ITRs (Figure 1a). The amounts of transposase mRNA and transposon plasmid in the co-injected mixture were optimized for each transposon by measuring under fixed amount of transposon plasmids (20 ng/µL) co-injected with increasing amount of transposase mRNA (10, 30, 50, 80, 100 ng/µL). The optimal dose of SB, PB, and Tol2 transposase was 50, 50 and 30 ng/µL (data not shown), each transposon kept the highest efficiency and survival rate under the optimal dose, and the survival rate varied between 70% and 90%, while for non-injected embryos it was around 90%. Then, we compared the differences in ET efficiency at the optimal injection dose. We found that the Tol2 transposon represented the highest GFP expression (90.45%, 92.71%, N = 1524), followed by SB (88.64% 88.87%, N = 1378) and PB (83.18%, 83.18%, N = 1276) at 48 and 120 hpf, respectively, and there was a significant difference in GFP expression between Tol2 and PB treatment (p < 0.05) (Figure 1b). Embryos (designated as F0) that showed GFP expression at 120 hpf for each transposon were raised for further germline transmission and GFP expression pattern analysis. The embryos surviving to adulthood were separately outcrossed with WT fish to generate F1 embryos for GFP screening. Various germline transfer efficiencies were observed among three transposon groups: The Tol2 transposon represented the highest at 55.56% (NF0 = 165), followed by SB (38.36%, NF0 = 151), while PB represented the lowest at 32.65% (NF0 = 149), and the difference between PB and the Tol2 group was significant (p < 0.05) (Figure 1c). The distribution of the GFP expression pattern of F1 embryos across the three transposon groups was also compared. We found that ET lines generated by the Tol2 transposon (named TK) were most likely to produce offspring with a single expression pattern, while the lines generated by PB (named PK) and SB (named SK) tended to produce offspring with more expression patterns (≥2), and significant differences were observed (p < 0.05, X2 test) (Figure 2). Some representative GFP expression patterns of F1 embryos from SB, PB and Tol2 transgenic lines are shown in Figure S1.

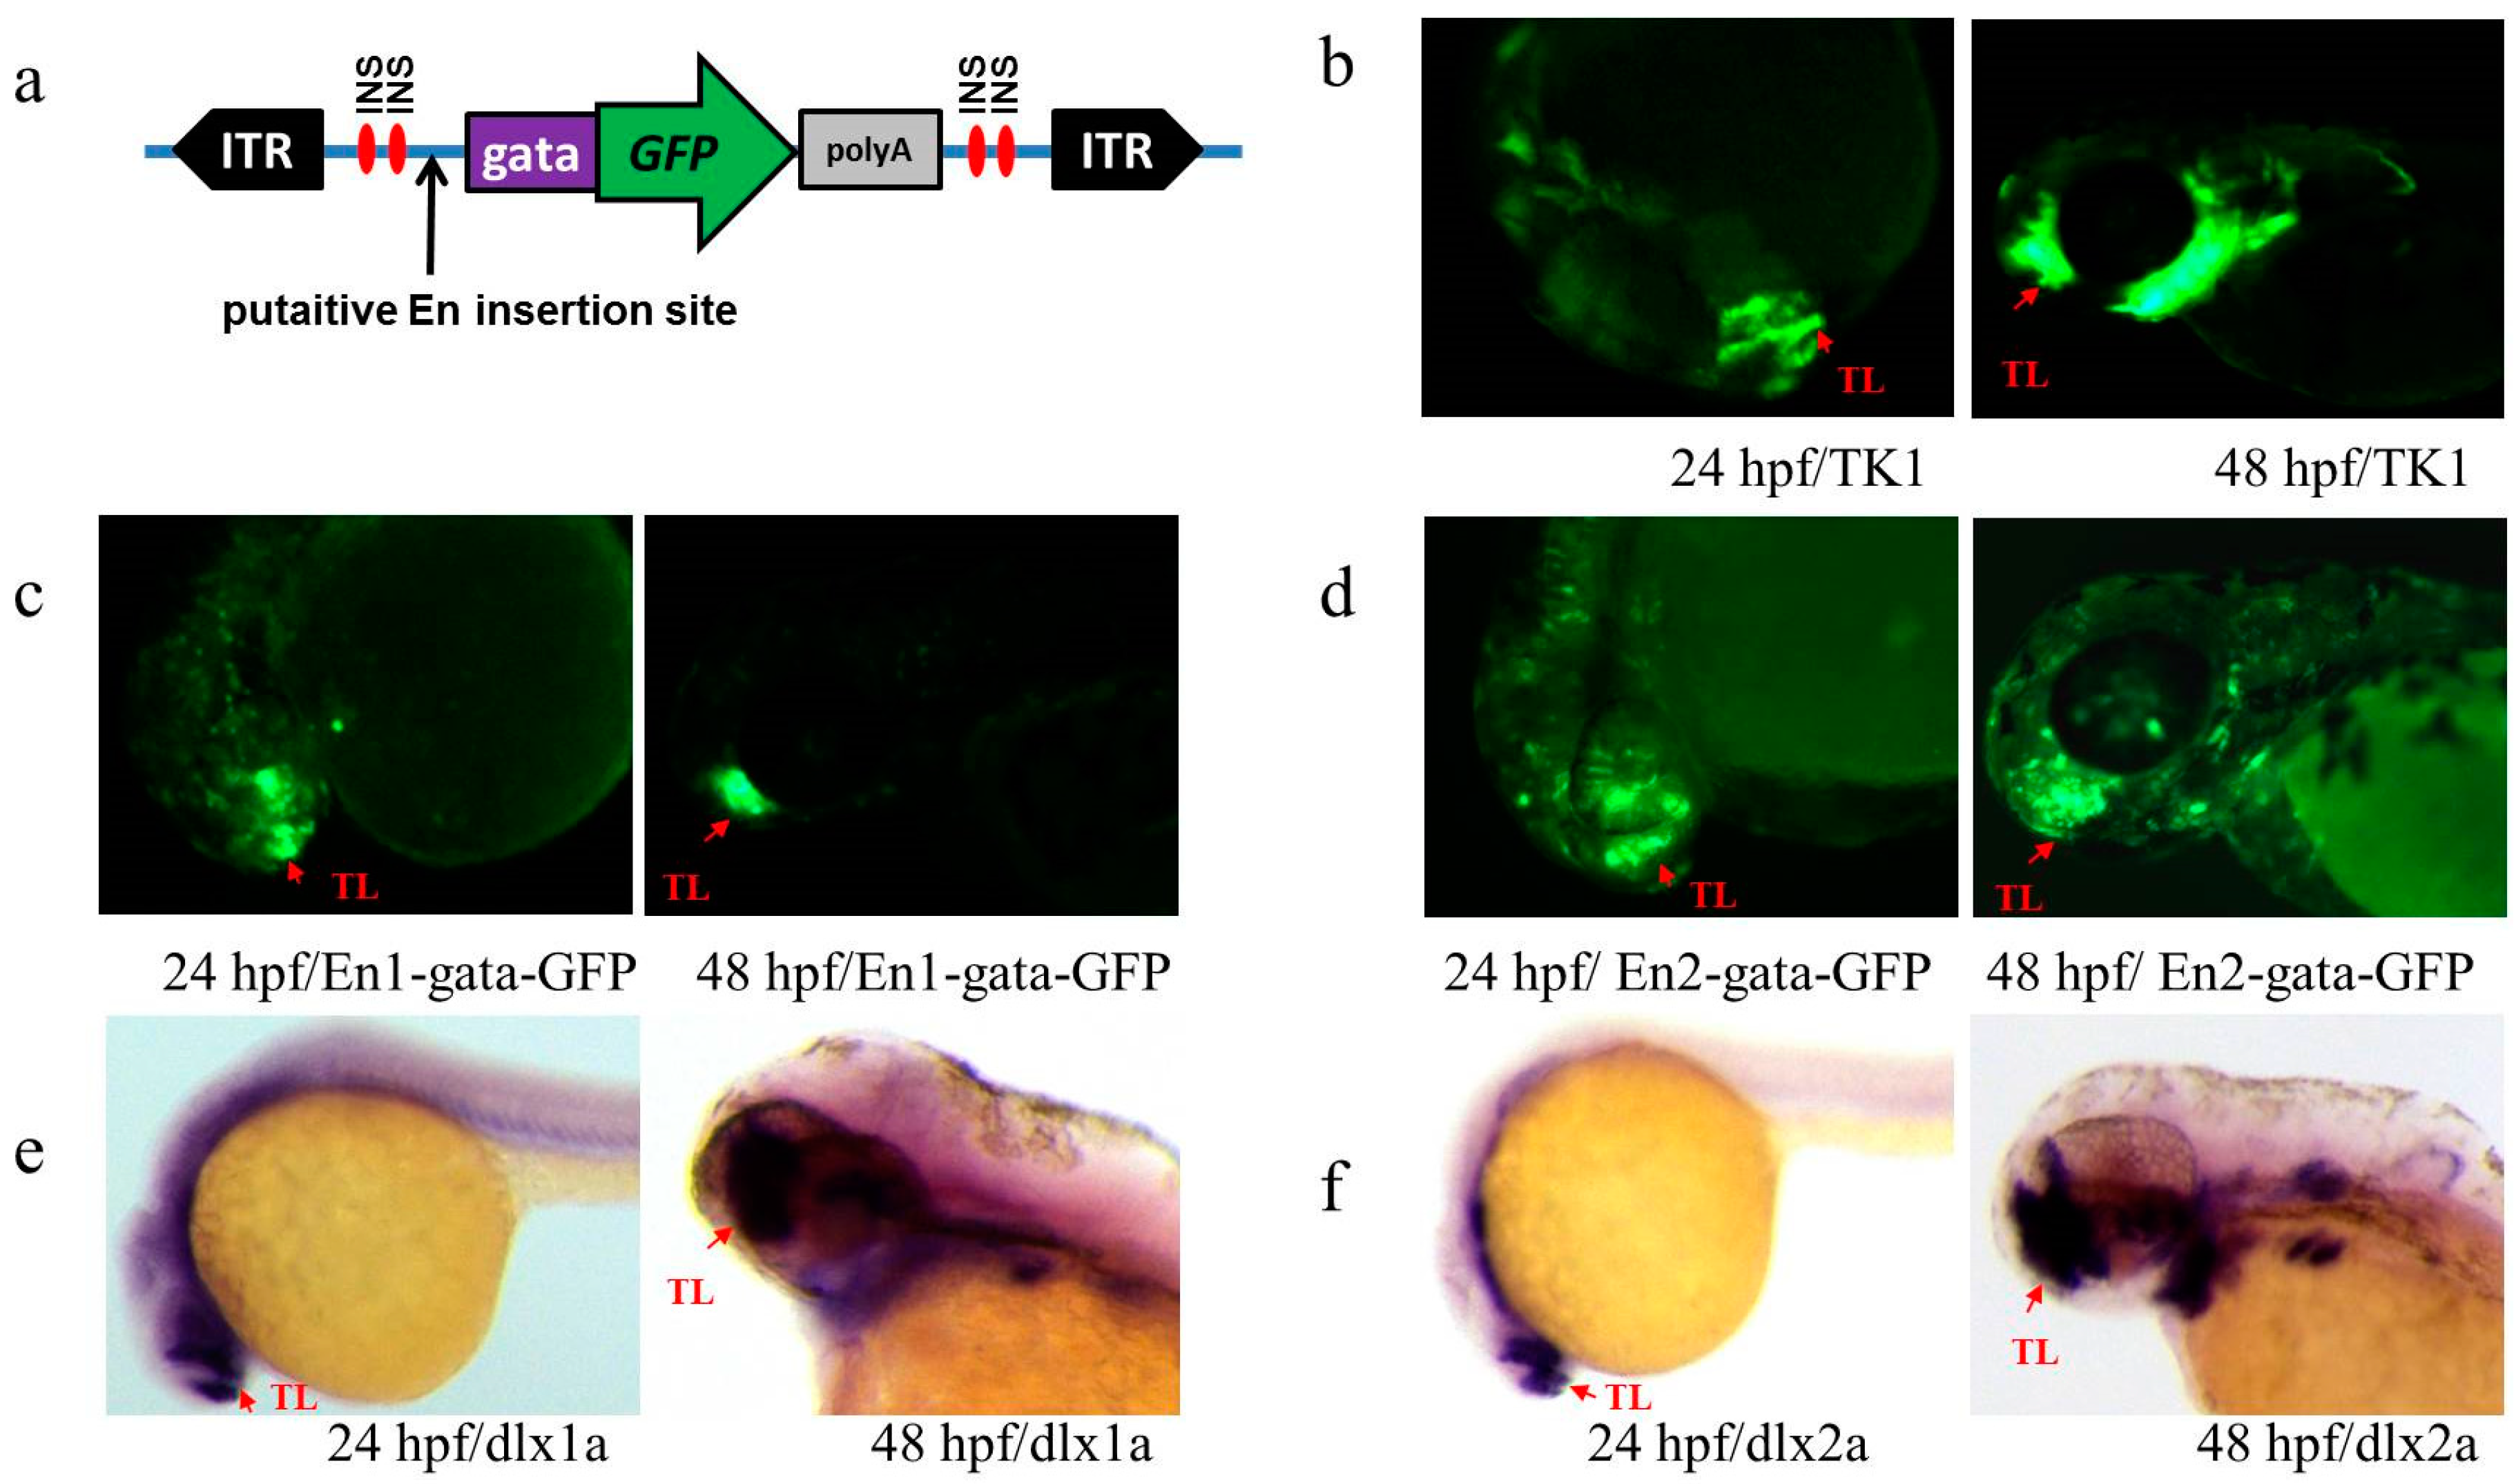
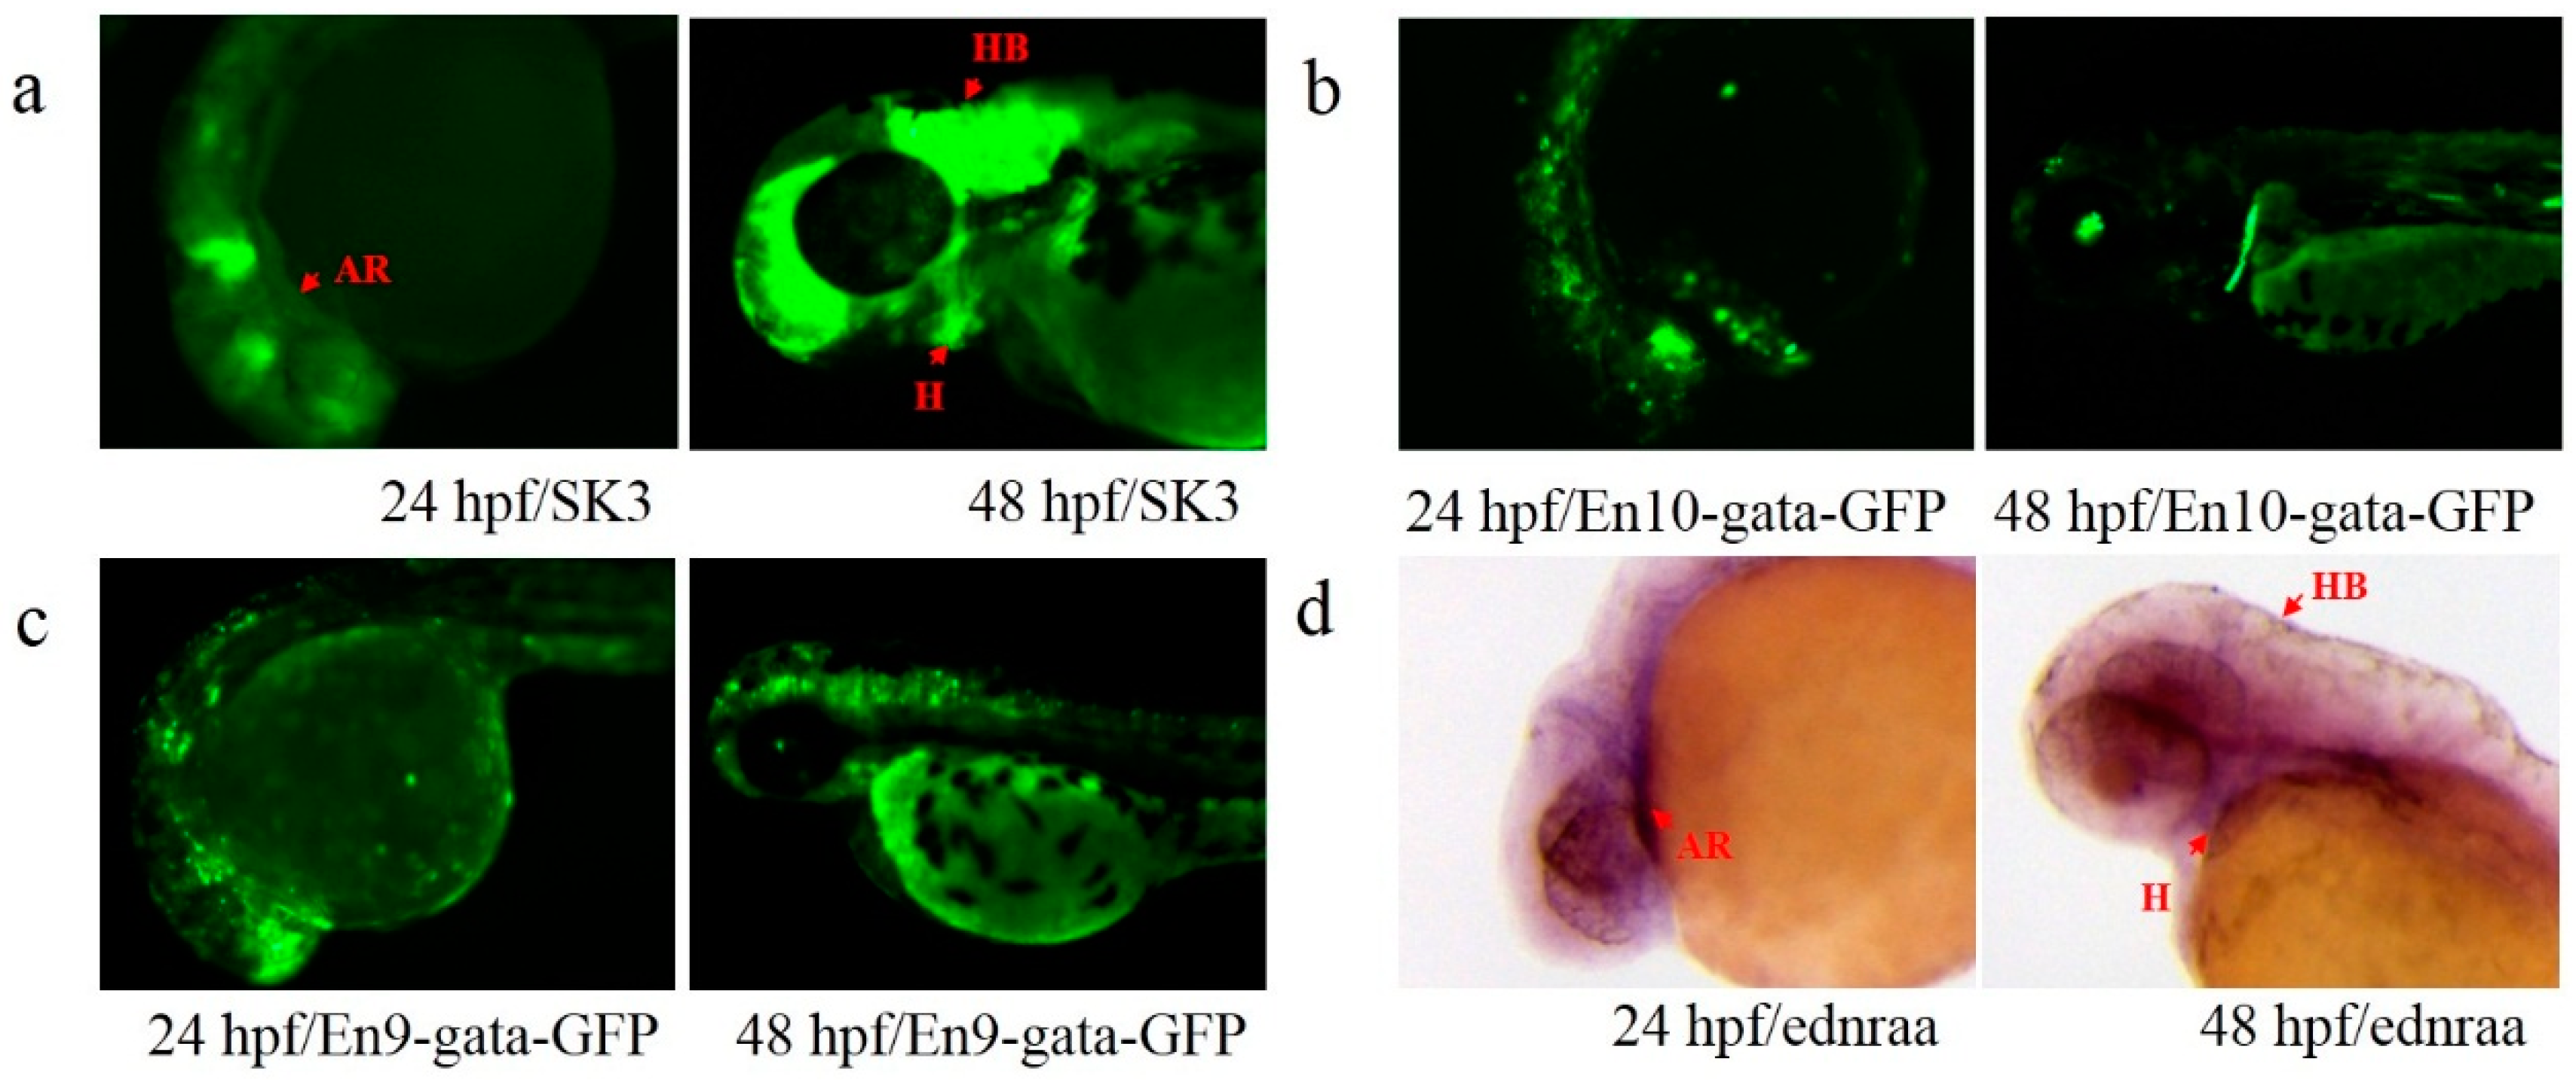
3.2. Annotation of Trapped Enhancers

Due to the fact that many founders (F0) of transgenic zebrafishes contained multiple insertions, which may confuse the annotation of En, GFP-positive F1 embryos were raised to adulthood, and outcrossed with WT fish to obtain stable transgenic F2 embryos for subsequent annotation of Ens. Seven stable F1 ET lines (four from SB, named SK1, SK3, SK6 and SK12; one from PB, named PK0, and two from Tol2, named TK1 and TK4) that exhibited distinct patterns of GFP expression were selected for further En annotation. These ET lines were separately outcrossed with WT fish to generate F2 offspring for GFP expression screening and insertion site annotation. The insertion sites of the seven ET lines were repeatedly determined by splinkerette PCR assay with embryos from different outcrossing (at least three times). All seven F1 ET lines were confirmed to harbor single insertion, and the insertion sites of the seven ET lines were successfully mapped to the zebrafish genome (GRCz10). These results were summarized in Table 1. In TK1, the ET cassette was inserted in exon 1 of dlx1a in forward direction, and two other nearby genes (dlx2a and itga6a) were also found (within 50 kb upstream and downstream of the insertion site). In TK4, the insertion was located in forward orientation in intron 1 of rps26, and six other endogenous genes (arf3a, wnt10b, wnt1, IKZF4, dnajc22 and lmbr1l) were also located near the insertion site. In SK1, the ET cassette was inserted in intron 8 of slc9a8 in reverse orientation, and close to the FP102158.1 gene. In SK3, the ET cassette was located at about 20 kb downstream of ednraa in the forward direction. In SK6, the ET cassette was located at mettl22 and abat in the reverse direction. In SK12, the ET cassette was located in intron 10 of wdr33 in the reverse direction, and diverse endogenous genes (si:ch1073-184j22.1, sft2d3, dusp28 and proca) were found nearby. The ET cassette in the PK0 line was located in intron 4 of itgav in the forward orientation, and in proximity to two other genes (si:dkey-69o16.5 and zc3h15) (Table 1).
To detect putative Ens near the integration site, an alignment analysis of genomic sequences from 50 kb upstream to 50 kb downstream of insertion site across diverse vertebrate species, including fish, amphibians, birds and mammals, was performed using VISTA (https://enhancer.lbl.gov/). A total of 10 highly conserved non-coding sequence regions, were identified within three ET lines (TK1, TK4 and SK3), based on the comparative genomic analysis, as putative Ens (Figure 3). The genome location and sequence length of these putative Ens are summarized in Table 2. Among these Ens, two (named En1 and En2) were identified in the TK1 ET line, and they were conserved across all the investigated vertebrate species (Figure 3a). En1 was located 20 kb upstream of dlx1a, and En2 was located between dlx1a and dlx2a. An En cluster, containing six typical Ens (En3–8) was identified in the TK4 ET line, and they were conserved across the investigated teleost species (Figure 3b). En3 was located 4 kb upstream of wnt10b, and En6 was located between wnt10b and wnt1, while En7 and En8 were located between wnt1 and rps26, which were respectively ~11 and ~3 kb upstream of rps26, and ~17 and ~25 kb downstream of wnt10b (Figure 3b). En9 and En10 were identified in the SK3 ET line, and they were also conserved across the investigated teleost species (Figure 3c). Furthermore, En9 and En10 were located 7.5 kb upstream of ednraa and intron 3 of ednraa, respectively. Among these Ens, En1 and En2 were conserved across all the investigated vertebrate species, while the other Ens (En3–10) were conserved across all the investigated teleost species.

3.3. Activity Test of Identified Enhancers

To determine the actual activity of these putative Ens, they were cloned and inserted into a new En test vector, which contains a trapping box flanked with two insulators (Figure 4a) intended to block the genomic position effect. Then, their En activities were evaluated in vivo by injecting the plasmids into zebrafish embryos at a one-cell stage and then screening the GFP signal at 24 and 48 hpf. In previous studies, we found that the Krt4 minimal promoter was still kept at a background noise even if it was flanked by double insulators. Here, we replaced the Krt4 minimal promoter by gata minimal promoter to minimize the background noise. The mRNA expression profiles of the nearest endogenous gene of these Ens were investigated by WISH.
En1, which was identified in the TK1 line, produced a distinct GFP expression in the telencephalon of embryos. About 45% embryos (N = 300) exhibited the specific expression at 24 hpf and 2 dpf after injection with plasmid (pEn1-gata-GFP) carrying the En1 (Figure 4c), which was similar to but did not match well the GFP expression patterns of embryos from the TK1 line (Figure 4b). The expression profile of En2, which included two conserved sequence peaks, was generally similar to that of En1 (Figure 4d), but an additional weak signal in the hindbrain was also observed. We found that when the two genomic regions corresponding to two conserved peaks of En2 were separately subcloned into the En detection plasmid, neither of them showed any En activity (data not shown). Compared with the mRNA profiles of the genes closest to En1 and En2 (dlx1a, dlx2a and itga6a), we found the GFP expression patterns of En1, En2 and TK1 lines were markedly different from itga6a expression, which has been described previously [37]. Expression signal of the TK1 line was not only detected in the telencephalon, but it largely mimicked that of dlx1a and dlx2a (WISH revealed that dlx1a and dlx2a were expressed in the telencephalon and other tissues including the diencephalon, prethalamus, hypothalamus, pharyngeal arch and ventral thalamus) (Figure 4e,f).
In the TK4 line, six putative Ens (En3–8) were identified near the insertion site, and diverse endogenous genes (arf3a, wnt10b, wnt1, rps26, IKZF4, dnajc22 and lmbr1l) were located between 50 kb upstream and 50 kb downstream of the insertion site (Figure 3b). Two of them (En6 and En7) displayed strong En activity, while other En activity (En3–5 and En8) was extremely weak and difficult to detect (data not shown). We found that about 32% embryos (N = 280) injected with the plasmid carrying En6 (pEn6-gata-GFP) exhibited ubiquitous GFP expression at 24 hpf, and specific expression in the eyes, jaw and spinal cord at 48 hpf (Figure 5b), which was partly similar to that in the TK4 line (Figure 5a). The embryos injected with the plasmid carrying En7 (pEn7-gata-GFP) displayed various GFP expression, and about 30% embryos (N = 300) displayed strong and specific GFP expression in the midbrain and hindbrain boundary (Figure 5c), and were different from that in the TK4 line, but overlapped at least partially with the mRNA expression profiles of wnt1 and wnt10b at 24 and 2 dpf (Figure 5d–f). We also found that none of the expression patterns of all detected endogenous genes (rps26, wnt1, wnt10b and Lmbr1l) matched well with those of the TK4 line, suggesting that this region may contain diverse regulatory elements, and each plays a role in the regulation of genes during the development of embryos, resulting in complicated expression patterns.
Two putative Ens (En9 and En10) were identified in the SK3 line, and only one endogenous gene (ednraa) located ~15 kb downstream of the insertion site was found. En9 was located upstream (~7.2 kb) of ednraa, while En10 was located in intron 3 of ednraa (Figure 3c). Expression of ednraa occurred in neural crest cells of the arches at 24 hpf and in hindbrain and heart at 2 dpf (Figure 6d), which mimicked the GFP expression pattern of the SK3 line (Figure 6a). Both En9 and En10 displayed weak En activity, but were distinctly different from the GFP expression pattern of SK3 and ednraa (Figure 6b,c).

3.4. Transcription Detection of Putative Enhancers

Recent studies have revealed that active Ens are often transcribed in mammalian systems, producing a class of non-coding RNAs called En RNAs (eRNAs), which have a role in the activity of Ens [38], and make the annotation of Ens more complicated. Here, we also found that the GFP expression patterns of some lines did not match very well with that of nearby genes, indicating these trapped Ens could express eRNAs to activate the transcription of distal genes. Then, the transcription of Ens identified in the current study was also investigated by RT-PCR and qPCR. The RT-PCR results revealed that most identified Ens (En1, En2, En4-7, En9 and En10) were transcribed in zebrafish embryos at 2 dpf, while the transcript of En3 and En8 was not detectable or very weak (Figure 7a). The qPCR results revealed that the expression dynamics of Ens were generally consistent with those of endogenous genes (Figure 7b–d). In the TK1 line, the expression of En1 and En2 was consistent with that of endogenous genes of dlx1a and dlx2a, with a higher expression at 48 hpf than at 24 hpf, and the expression levels of dlx1a and dlx2a were similar (Figure 7b). In the TK4 line, the expression of most Ens (En 4–6) and endogenous genes was similar, with an increased expression from 24 to 48 hpf (Figure 7c). In the SK3 line, the RNA expression of En9 at 24 hpf was higher than at 48 hpf, which was inconsistent with the expression of ednraa, while both En10 and ednraa displayed an increasing expression trend from 24 to 48 hpf (Figure 7d). The results also revealed that the expression levels of most intergenic Ens (En1, En2, En5, En6 and En9) were relatively lower than their nearby endogenous genes, and most En expression trends were consistent with those of their endogenous genes.

4. Discussion

The Tol2, SB, and PB transposon system has been widely used to create gene and En traps in diverse animal models [39,40,41,42], but the ET efficiency differences among these transposons in zebrafish has not been systematically studied [43]. Here, we took advantage of the SB, PB and Tol2 transposon systems to introduce the ET transgene into the genome of zebrafish. Our data confirmed that in zebrafish the germline transmission of Tol2 was the highest, and the efficiency of PB was the lowest. These data also demonstrated that the transposon vectors based on SB, PB or Tol2 act as efficient En detectors in the zebrafish genome, with an ET efficiency between 32.65% and 55.56%, and the trapping efficiency of Tol2 being the highest among the three transposons.
Here, our results also revealed that although the ET efficiency of PB was the lowest among the three transposons in zebrafish, it tends to produce offspring with multiple expression patterns. This suggests that PB inserts at multiple locations more frequently than other transposons or that the insertions are biased towards transcriptional units and TSSs, and the GFP reporter may be under multiple regulators, which is in agreement with the insertion preference of the PB transposon [32,33,34]. These data suggest that PB may be a reasonable option for ET in zebrafish because it tends to capture more regulatory elements compared with SB and Tol2 (given that the ET efficiency at above 30% in zebrafish was still acceptable).
Ten putative Ens were identified in three transgenic lines: En1 and En2 in line TK1, En3–8 in line TK4, and En9 and En10 in line SK3. By bioinformatic analysis, we found that En3–10 were highly conserved in fish, but not in amphibians, reptiles, and mammals, while En1 and En2 were conserved in all investigated species of vertebrates. Not knowing the expression patterns of all candidate Ens in the vicinity of an insertion, we have subcloned the Ens into an En detection vector to predict the specificity of the Ens driving expression of the GFP reporter. An important source of noise in En detection assays is the cis-regulatory activity from genomic regions surrounding the transposon insertion site, also known as the position effect [44]. Here, we developed an En detection vector flanked by double insulators to reduce the position effect [45]. It is notable that the Ens may not regulate the nearest gene. For example, En6 was 26 kb upstream of rps26, but was closer to other genes (wnt1 and wnt10b) ~2 kb distant; yet En6 displayed an expression pattern similar to that of rps26 (Figure 5). Moreover, in line SK3, although two Ens were obtained and one of them (En10) also displayed En activity in vivo, the expression profiles did not match those of the nearest gene (ednraa); En10 showed a very specific expression pattern in the eye, but the closest gene, ednraa, was expressed in neural crest cells of the arches (Figure 6). A previous study suggested that one possible explanation could be that the mini-promoter was not compatible with the Ens of the neighbouring genes, and/or was activated by different regulatory elements [46], and that these elements may affect ednraa and GFP at long distance. It has been demonstrated that Ens can exert their effect over long distances of thousands or even hundreds of thousands of base pairs, either from upstream, downstream, or from within a transcription unit [47]. Two Ens close to dlx1a and dlx2a were obtained in zebrafish. We named them En1 and En2, which is homologous to the I12a and I12b Ens identified in mice [48,49], and the GFP expression pattern in transgenic TK1 embryos was similar to that of the endogenous genes (dlx1a and dlx2a), which is also generally similar to the expression pattern reported in mice [50]. The En detector vector driven by the gata mini-promoter shows that the GFP signal in zebrafish embryos was similar to that of dlx1a and dlx2a. TK1 was actually in dlx1a so it was likely that the expression of GFP in TK1 represented the combined effect of many enhancers that direct dlx1a expression. Therefore, it is reasonable that En1 and En2 only activated a specific GFP expression in forebrain. These data demonstrate that the En detector vector driven by the gata mini-promoter was efficient and useful for detecting putative Ens in the genome.
Based on the comparison of the expression profiles of transgenes, putatively targeted genes, and the En activity test, we found that four Ens showed similar activity to expression of nearby genes. Activity of other transgenes did not match the expression of nearest genes, and some cloned Ens (En3–5 and En8) did not even show any GFP expression signal in the En activity test, indicating the interaction between En and targeting gene is more complicated. Other genes in the surrounding can also be targets as suggested by Harmston [51], and the Ens may act as distal regulatory elements. It has been suggested that Ens work within the context of chromatin domains, and they may regulate genes located one megabase or more from them [52] (e.g., 20% to 30% of Drosophila Ens may act as distal elements [53,54,55]). A variety of contrasting mechanisms of En function have been proposed over the years, including En tracking, linking and looping. Thus, defining the trapped Ens and identification of their target genes are still very challenging, especially if Ens act as distal elements or are in potentially larger regulatory blocks. The efficiency of the current ET method, and annotation of Ens is very limited and needs to improve significantly. For ET vectors, it may help to block the upstream or downstream position effect by introducing insulators.
In addition, the activity of some Ens, not matching the expression of nearby genes, may be related to functioning of these Ens acting through eRNA. The expression of eRNAs have been independently confirmed in many different cell types and species, suggesting that eRNA synthesis is not unique to neurons as previously thought, but more likely represent a universal cellular mechanism involved in governing En function [56]. Recent studies have provided more direct evidence that at least some eRNAs are functionally important for target gene expression. The knockdown of several eRNAs caused decreased expression of target genes [57,58,59]. In the present study, we found that most Ens can be transcribed, suggesting that the transcription of En may be a common phenomenon [38]. The functional properties of these eRNAs and their interaction with target genes warrant further exploration.

5. Conclusions

We conducted a comparative study of the ET efficiency using PB, SB, and Tol2 transposons, and demonstrated that the ET system mediated by these transposons is highly efficient, with Tol2 having the highest efficiency. We identified 10 putative Ens based on the seven transgenic ET lines mediated by SB, PB, and Tol2, and four of them displayed robust enhancer activity upon placement in the En test vector. Comparison of the GFP expression pattern and WISH results suggest that En1 and En2 may be involved in the regulation of dlx1a and dlx2a expression. En6 may be involved in regulation of the expression of line TK4 transgene and rps26, and En7 may be involved in regulation of the expression of wnt1 and wnt10b. En1, En2, En6, En7 and En10 are transcribed at an early stage of zebrafish embryo development, and may regulate target genes by eRNA-based mechanism.

Supplementary Materials

The following are available online at https://0-www-mdpi-com.brum.beds.ac.uk/2073-4425/9/12/630/s1, Figure S1: Representative GFP expression patterns of F1 embryos. (a–e) GFP expression of lines TK1, TK4, SK1, SK3 and PK0 at various developmental stages (1 dpf, 2 dpf, 3 dpf, 4 dpf and 5 dpf), respectively. Table S1. Primers used for the splinkerette PCR assay and En cloning, Table S2: Primers used for qPCR to investigate the transcription of the identified Ens and endogenous genes.

Author Contributions

C.S. and F.M. conceived the study; B.G. participated in its design. D.S., S.C. and Y.S. performed the analysis. D.S., S.X., S.W., Y.W. and C.C. performed the research. S.D., C.S. and B.G. wrote the manuscript. All authors read and approved the final manuscript.

Funding

This work was supported by the Natural Science Foundation of China (31671313); Major projects of national genetically modified organism breeding (2018ZX0801008B), the Priority Academic Program Development of Jiangsu Higher Education Institutions; the Postgraduate Research & Practical Innovation Program of Jiangsu Province (2018); and the Yangzhou University International Academic Exchange Fund (2018).

Acknowledgments

We thank Zoltan Ivics (Paul Ehrlich Institute, Germany) for providing the SB100X transposase plasmid, Allan Bradley (Wellcome Trust Sanger Institute, UK) for providing the PB transposase plasmid and Vladim Korzh (National University of Singapore, Singapore) for providing the Tol2 transposase plasmid. We are grateful to all members of the Chengyi Song Laboratory for their hard work and thoughtful insights.

Conflicts of Interest

All authors declare that they have no conflict of interest.

References

  1. Banerji, J.; Rusconi, S.; Schaffner, W. Expression of a β-globin gene is enhanced by remote SV40 DNA sequences. Cell 1981, 27, 299–308. [Google Scholar] [CrossRef]
  2. Furlong, E.E.M.; Levine, M. Developmental enhancers and chromosome topology. Science 2018, 361, 1341–1345. [Google Scholar] [CrossRef] [PubMed]
  3. Li, W.; Notani, D.; Rosenfeld, M.G. Enhancers as non-coding RNA transcription units: Recent insights and future perspectives. Nat. Rev. Genet. 2016, 17, 207–223. [Google Scholar] [CrossRef] [PubMed]
  4. Soldner, F.; Stelzer, Y.; Shivalila, C.S.; Abraham, B.J.; Latourelle, J.C.; Barrasa, M.I.; Goldmann, J.; Myers, R.H.; Young, R.A.; Jaenisch, R. Parkinson-associated risk variant in distal enhancer of α-synuclein modulates target gene expression. Nature 2016, 533, 95. [Google Scholar] [CrossRef] [PubMed]
  5. Weedon, M.N.; Cebola, I.; Patch, A.M.; Flanagan, S.E.; De, F.E.; Caswell, R.; Rodríguezseguí, S.A.; Shawsmith, C.; Cho, C.H.; Lango, A.H. Recessive mutations in a distal PTF1A enhancer cause isolated pancreatic agenesis. Nat. Genet. 2014, 46, 61. [Google Scholar] [CrossRef] [PubMed]
  6. Bellen, H.J. Ten Years of Enhancer Detection: Lessons from the Fly. Plant Cell 1999, 11, 2271. [Google Scholar] [CrossRef]
  7. Bier, E.; Vaessin, H.; Shepherd, S.; Lee, K.; Mccall, K.; Barbel, S.; Ackerman, L.; Carretto, R.; Uemura, T.; Grell, E. Searching for pattern and mutation in the Drosophila genome with a P-lacZ vector. Genes Dev. 1989, 3, 1273–1287. [Google Scholar] [CrossRef] [PubMed]
  8. Wilson, C.; Pearson, R.K.; Bellen, H.J.; O’Kane, C.J.; Grossniklaus, U.; Gehring, W.J. P-element-mediated enhancer detection: An efficient method for isolating and characterizing developmentally regulated genes in Drosophila. Genes Dev. 1989, 3, 1301–1313. [Google Scholar] [CrossRef]
  9. O’Kane, C.J.; Gehring, W.J. Detection in situ of genomic regulatory elements in Drosophila. Proc. Natl. Acad. Sci. USA 1987, 84, 9123–9127. [Google Scholar] [CrossRef]
  10. Dunne, C.R.; Cillo, A.R.; Glick, D.R.; John, K.; Johnson, C.; Kanwal, J.; Malik, B.T.; Mammano, K.; Petrovic, S.; Pfister, W. Structured inquiry-based learning: Drosophila GAL4 enhancer trap characterization in an undergraduate laboratory course. PLoS Biol. 2014, 12, e1002030. [Google Scholar] [CrossRef]
  11. Liu, C.; Song, G.; Mao, L.; Long, Y.; Li, Q.; Cui, Z. Generation of an enhancer-trapping vector for insertional mutagenesis in Zebrafish. PLoS ONE 2015, 10, e0139612. [Google Scholar] [CrossRef] [PubMed]
  12. Grabher, C.; Henrich, T.; Sasado, T.; Arenz, A.; Wittbrodt, J.; Furutani-Seiki, M. Transposon-mediated enhancer trapping in medaka. Gene 2003, 322, 57–66. [Google Scholar] [CrossRef]
  13. Balciunas, D.; Davidson, A.E.; Sivasubbu, S.; Hermanson, S.B.; Welle, Z.; Ekker, S.C. Enhancer trapping in zebrafish using the Sleeping Beauty transposon. BMC Genom. 2004, 5, 62. [Google Scholar] [CrossRef] [PubMed]
  14. Scott, E.K.; Mason, L.; Arrenberg, A.B.; Ziv, L.; Gosse, N.J.; Xiao, T.; Chi, N.C.; Asakawa, K.; Kawakami, K.; Baier, H. Targeting neural circuitry in zebrafish using GAL4 enhancer trapping. Nat. Methods 2007, 4, 323–326. [Google Scholar] [CrossRef]
  15. Parinov, S.; Kondrichin, I.; Korzh, V.; Emelyanov, A. Tol2 transposon-mediated enhancer trap to identify developmentally regulated zebrafish genes in vivo. Dev. Dyn. 2004, 231, 449–459. [Google Scholar] [CrossRef]
  16. Kawakami, K.; Abe, G.; Asada, T.; Asakawa, K.; Fukuda, R.; Ito, A.; Lal, P.; Mouri, N.; Muto, A.; Suster, M.L. zTrap: Zebrafish gene trap and enhancer trap database. BMC Dev. Biol. 2010, 10, 105. [Google Scholar] [CrossRef] [PubMed]
  17. Koelzer, S.; Kölsch, Y.; Panfilio, K.A. Visualizing Late Insect Embryogenesis: Extraembryonic and mesodermal enhancer trap expression in the beetle Tribolium castaneum. PLoS ONE 2014, 9, e103967. [Google Scholar] [CrossRef] [PubMed]
  18. Quach, H.N.; Tao, S.; Vrljicak, P.; Joshi, A.; Ruan, H.; Sukumaran, R.; Varshney, G.K.; Lafave, M.C. The Ds Screen Team; Burgess, S.M. A Multifunctional mutagenesis system for analysis of gene function in zebrafish. G3 Genes Genomes Genet. 2015, 5, 1283–1299. [Google Scholar]
  19. O’Brochta, D.A.; Pilitt, K.L.; Harrell, R.A.; Channa, A.; Alford, R.T. Gal4-based enhancer-trapping in the malaria mosquito Anopheles stephensi. G3 Genes Genomes Genet. 2012, 2, 1305–1315. [Google Scholar] [CrossRef]
  20. Shima, Y.; Sugino, K.; Hempel, C.M.; Shima, M.; Taneja, P.; Bullis, J.B.; Mehta, S.; Lois, C.; Nelson, S.B. A mammalian enhancer trap resource for discovering and manipulating neuronal cell types. Elife 2016, 5, e13503. [Google Scholar] [CrossRef]
  21. Ruf, S.; Symmons, O.; Uslu, V.V.; Dolle, D.; Hot, C.; Ettwiller, L.; Spitz, F. Large-scale analysis of the regulatory architecture of the mouse genome with a transposon-associated sensor. Nat. Genet. 2011, 43, 379–386. [Google Scholar] [CrossRef] [PubMed]
  22. Asakawa, K.; Suster, ML.; Mizusawa, K.; Naqayoshi, S.; Kotani, T.; Urasaki, A.; Kishimoto, Y.; Hibi, M.; Kawakami, K. Genetic dissection of neural circuits by Tol2 transposon-mediated Gal4 gene and enhancer trapping in zebrafish. Proc. Natl. Acad. Sci. USA 2008, 105, 1255–1260. [Google Scholar] [CrossRef] [PubMed] [Green Version]
  23. Ishibashi, M.; Mechaly, A.S.; Becker, T.S.; Rinkwitz, S. Using zebrafish transgenesis to test human genomic sequences for specific enhancer activity. Methods 2013, 62, 216–225. [Google Scholar] [CrossRef] [PubMed]
  24. García-Lecea, M.; Gasanov, E.; Jedrychowska, J.; Kondrychyn, I.; Teh, C.; You, M.S.; Korzh, V. Development of circumventricular organs in the mirror of zebrafish enhancer-trap transgenics. Front. Neuroanat. 2017, 11, 114. [Google Scholar] [CrossRef] [PubMed]
  25. Lal, P.; Tanabe, H.; Suster, M.L.; Ailani, D.; Kotani, Y.; Muto, A.; Itoh, M.; Iwasaki, M.; Wada, H.; Yaksi, E. Identification of a neuronal population in the telencephalon essential for fear conditioning in zebrafish. Bmc Biol. 2018, 16, 45. [Google Scholar] [CrossRef] [PubMed]
  26. Urasaki, A.; Asakawa, K.; Kawakami, K. Efficient transposition of the Tol2 transposable element from a single-copy donor in zebrafish. Proc. Natl. Acad. Sci. USA 2008, 105, 19827–19832. [Google Scholar] [CrossRef] [PubMed] [Green Version]
  27. Huang, P.; Sahaihernandez, P.; Bohm, R.A.; Welch, W.P.; Zhang, B.; Nystul, T. Enhancer-trap flippase lines for clonal analysis in the Drosophila ovary. G3 Genes Genomes Genet. 2014, 4, 1693–1699. [Google Scholar] [CrossRef]
  28. Abidi, S.; Smithbolton, R.K. Cell fate changes induced by a Distal-less enhancer-trap transgene in the Drosophila antennal imaginal disc. Sci. Rep. 2018, 8, 4950. [Google Scholar] [CrossRef]
  29. Otsuna, H.; Hutcheson, D.A.; Duncan, R.N.; Mcpherson, A.D.; Scoresby, A.N.; Gaynes, B.F.; Tong, Z.; Fujimoto, E.; Kwan, K.M.; Chien, C.B. High-resolution analysis of CNS expression patterns in zebrafish Gal4enhancer-trap lines. Dev. Dyn. 2015, 244, 785–796. [Google Scholar] [CrossRef]
  30. Grabundzija, I.; Irgang, M.L.; Belay, E.; Matrai, J.; Gogol, D.A.; Kawakami, K.; Chen, W.; Ruiz, P.; Chuah, M.K.; Vandendriessche, T. Comparative analysis of transposable element vector systems in human cells. Mol. Ther. J. Am. Soc. Gene Ther. 2010, 18, 1200. [Google Scholar] [CrossRef]
  31. Mátés, L.; Chuah, M.K.; Belay, E.; Jerchow, B.; Manoj, N.; Acosta-Sanchez, A.; Grzela, D.P.; Schmitt, A.; Becker, K.; Matrai, J. Molecular evolution of a novel hyperactive Sleeping Beauty transposase enables robust stable gene transfer in vertebrates. Nat. Genet. 2009, 41, 753–761. [Google Scholar] [CrossRef] [PubMed]
  32. Liang, Q.; Kong, J.; Stalker, J.; Bradley, A. Chromosomal mobilization and reintegration of Sleeping Beauty and PiggyBac transposons. Genesis 2009, 47, 404. [Google Scholar] [CrossRef] [PubMed]
  33. Li, M.A.; Pettitt, S.J.; Eckert, S.; Ning, Z.; Rice, S.; Cadiñanos, J.; Yusa, K.; Conte, N.; Bradley, A. The piggyBac transposon displays local and distant reintegration preferences and can cause mutations at noncanonical integration sites. Mol. Cell. Biol. 2013, 33, 1317–1330. [Google Scholar] [CrossRef] [PubMed]
  34. Wang, W.; Lin, C.; Lu, D.; Ning, Z.; Cox, T.; Melvin, D.; Wang, X.; Bradley, A.; Liu, P. Chromosomal transposition of PiggyBac in mouse embryonic stem cells. Proc. Natl. Acad. Sci. USA 2008, 105, 9290–9295. [Google Scholar] [CrossRef] [PubMed]
  35. Dupuy, A.J.; Akagi, K.; Largaespada, D.A.; Copeland, N.G.; Jenkins, N.A. Mammalian mutagenesis using a highly mobile somatic Sleeping Beauty transposon system. Nature 2005, 436, 221–226. [Google Scholar] [CrossRef] [PubMed]
  36. Thisse, C.; Thisse, B. High-resolution in situ hybridization to whole-mount zebrafish embryos. Nat. Protoc. 2008, 3, 59–69. [Google Scholar] [CrossRef]
  37. Goody, M.F.; Kelly, M.W.; Reynolds, C.J.; Khalil, A.; Crawford, B.D.; Henry, C.A. NAD+ biosynthesis ameliorates a Zebrafish model of muscular dystrophy. PLoS Biol. 2012, 10, e1001409. [Google Scholar] [CrossRef]
  38. Kim, T.K.; Hemberg, M.; Gray, J.M. Enhancer RNAs: A class of long noncoding RNAs synthesized at enhancers. Cold Spring Harb. Perspect. Biol. 2015, 7, a018622. [Google Scholar] [CrossRef]
  39. Ivics, Z.; MA, L.; Mátés, L.; Boeke, J.D.; Nagy, A.; Bradley, A.; Izsvák, Z. Transposon-mediated genome manipulation in vertebrates. Nat. Methods 2009, 6, 415–422. [Google Scholar] [CrossRef] [Green Version]
  40. Ivics, Z.; Mates, L.; Yau, T.Y.; Landa, V.; Zidek, V.; Bashir, S.; Hoffmann, O.I.; Hiripi, L.; Garrels, W.; Kues, W.A.; et al. Germline transgenesis in rodents by pronuclear microinjection of Sleeping Beauty transposons. Nat. Protoc. 2014, 9, 773–793. [Google Scholar] [CrossRef]
  41. Ivics, Z.; Garrels, W.; Mates, L.; Yau, T.Y.; Bashir, S.; Zidek, V.; Landa, V.; Geurts, A.; Pravenec, M.; Rulicke, T.; et al. Germline transgenesis in pigs by cytoplasmic microinjection of Sleeping Beauty transposons. Nat. Protoc. 2014, 9, 810–827. [Google Scholar] [CrossRef] [PubMed]
  42. Katter, K.; Geurts, A.M.; Hoffmann, O.; Mátés, L.; Landa, V.; Hiripi, L.; Moreno, C.; Lazar, J.; Bashir, S.; Zidek, V. Transposon-mediated transgenesis, transgenic rescue, and tissue-specific gene expression in rodents and rabbits. Faseb J. 2013, 27, 930–941. [Google Scholar] [CrossRef] [PubMed] [Green Version]
  43. Qi, Z.; Wilkinson, M.N.; Chen, X.; Sankararaman, S.; Mayhew, D.; Mitra, R.D. An optimized, broadly applicable piggyBac transposon induction system. Nucleic Acids Res. 2017, 45, 1–13. [Google Scholar] [CrossRef]
  44. Chung, J.H.; Whiteley, M.; Felsenfeld, G. A 5′ element of the chicken β-globin domain serves as an insulator in human erythroid cells and protects against position effect in Drosophila. Cell 1993, 74, 505–514. [Google Scholar] [CrossRef]
  45. Bessa, J.; Tena, J.J.; Elisa, D.L.C.; Naranjo, S.; Fernández, A.; Montoliu, L.; Akalin, A.; Lenhard, B.; Casares, F. Zebrafish enhancer detection (ZED) vector: A new tool to facilitate transgenesis and the functional analysis of cis-regulatory regions in zebrafish. Dev. Dyn. 2009, 238, 2409. [Google Scholar] [CrossRef] [PubMed]
  46. Ellingsen, S.; Laplante, M.A.; König, M.; Kikuta, H.; Furmanek, T.; Hoivik, E.A.; Becker, T.S. Large-scale enhancer detection in the zebrafish genome. Development 2005, 132, 3799. [Google Scholar] [CrossRef] [PubMed]
  47. Schaffner, W. Enhancers, enhancers—From their discovery to today’s universe of transcription enhancers. Biol. Chem. 2015, 396, 311–327. [Google Scholar] [CrossRef]
  48. Ghanem, N.; Yu, M.; Long, J.; Hatch, G.; Rubenstein, J.L.R.; Ekker, M. Distinct cis-regulatory elements from the Dlx1/Dlx2 locus mark different progenitor cell populations in the ganglionic eminences and different subtypes of adult cortical interneurons. J. Neurosci. Off. J. Soc. Neurosci. 2007, 27, 5012. [Google Scholar] [CrossRef]
  49. Zerucha, T.; Stühmer, T.; Hatch, G.; Park, B.K.; Long, Q.; Yu, G.; Gambarotta, A.; Schultz, J.R.; Rubenstein, J.L.; Ekker, M. A highly conserved enhancer in the Dlx5/Dlx6 intergenic region is the site of cross-regulatory interactions between Dlx genes in the embryonic forebrain. J. Neurosci. Off. J. Soc. Neurosci. 2000, 20, 709–721. [Google Scholar] [CrossRef]
  50. Ghanem, N.; Jarinova, O.; Amores, A.; Long, Q.; Hatch, G.; Park, B.K.; Rubenstein, J.L.R.; Ekker, M. Regulatory roles of conserved intergenic domains in vertebrate Dlx bigene clusters. Genome Res. 2003, 13, 533–543. [Google Scholar] [CrossRef]
  51. Harmston, N.; Ing-Simmons, E.; Tan, G.; Perry, M.; Merkenschlager, M.; Lenhard, B. Topologically associating domains are ancient features that coincide with Metazoan clusters of extreme noncoding conservation. Nat. Commun. 2017, 8, 441. [Google Scholar] [CrossRef] [PubMed]
  52. Lettice, L.A.; Williamson, I.; Devenney, P.S.; Kilanowski, F.; Dorin, J.; Hill, R.E. Development of five digits is controlled by a bipartite long-range cis-regulator. Development 2014, 141, 1715–1725. [Google Scholar] [CrossRef] [Green Version]
  53. Kvon, E.Z.; Kazmar, T.; Stampfel, G.; Yáñezcuna, J.O.; Pagani, M.; Schernhuber, K.; Dickson, B.J.; Stark, A. Genome-scale functional characterization of Drosophila developmental enhancers in vivo. Nature 2005, 512, 91–95. [Google Scholar] [CrossRef]
  54. Cannavò, E.; Koelling, N.; Harnett, D.; Garfield, D.; Casale, F.P.; Ciglar, L.; Gustafson, H.E.; Viales, R.R.; Marcoferreres, R.; Degner, J.F. Genetic variants regulating expression levels and isoform diversity during embryogenesis. Nature 2016, 541, 402. [Google Scholar] [CrossRef] [PubMed]
  55. Ghavi-Helm, Y.; Klein, F.A.; Pakozdi, T.; Ciglar, L.; Noordermeer, D.; Huber, W.; Furlong, E.E.M. Enhancer loops appear stable during development and are associated with paused polymerase. Nature 2014, 512, 96–100. [Google Scholar] [CrossRef] [PubMed]
  56. Kim, T.K.; Al, E. Widespread transcription at neuronal activity-regulated enhancers. Nature 2010, 465, 182–187. [Google Scholar] [CrossRef] [Green Version]
  57. Lam, M.T.Y.; Han, C.; Lesch, H.P.; Gosselin, D.; Heinz, S.; Tanakaoishi, Y.; Benner, C.; Kaikkonen, M.U.; Kim, A.S.; Kosaka, M. Rev-Erbs repress macrophage gene expression by inhibiting enhancer-directed transcription. Nature 2013, 498, 511. [Google Scholar] [CrossRef]
  58. Li, W.; Notani, D.; Ma, Q.; Tanasa, B.; Nunez, E.; Chen, A.Y.; Merkurjev, D.; Zhang, J.; Ohgi, K.; Song, X. Functional roles of enhancer RNAs for oestrogen-dependent transcriptional activation. Nature 2013, 498, 516–520. [Google Scholar] [CrossRef] [Green Version]
  59. Melo, C.A.; Drost, J.; Wijchers, P.J.; van de Werken, H.; de Wit, E.; Oude Vrielink, J.A.; Elkon, R.; Melo, S.A.; Léveillé, N.; Kalluri, R. eRNAs are required for p53-dependent enhancer activity and gene transcription. Mol. Cell 2013, 49, 524–535. [Google Scholar] [CrossRef]
Figure 1. Green fluorescent protein (GFP) expression efficiency and germline transfer efficiency of enhancer trapping (ET) based on sleeping beauty (SB), piggyBa (PB) and Tol2 transposons in zebrafish. (a) Schematic of the transposon-based ET cassette (not to scale). The cassette includes two inverted repeat sequences (SB, PB, or Tol2 inverse terminal repeats (ITRs)), and a minimal Krt4 promoter, GFP, and β-globin polyA signal; (b) GFP expression efficiency was measured by GFP screen at 48 and 120 h postfertilization (hpf) after co-injection of a fixed amount of transposon plasmid with the corresponding transposase mRNA into zebrafish embryos. The total number of injected embryos was 1378 in SB, 1276 in PB, 1524 in Tol2. Error bars represent SD; (c) germline efficiency was measured by crossing the GFP-positive founders with wild-type (WT) fish. Significant difference was detected using a χ-squared test; asterisk indicates p < 0.05.
Genes 09 00630 g001
Figure 2. ET pattern difference based on SB, PB and Tol2 transposons in zebrafish. (a) Pattern difference was measured by counting the different patterns of offspring at five days postfertilization (dpf) from each single founder. Significant difference was detected using a χ-squared test; asterisk indicates p < 0.05; (bd) Offspring patterns of lines generated by SK (ET lines generated by the SB transposon), TK (ET lines generated by the Tol2 transposon), and PK (ET lines generated by the PB transposon). In various expression patterns, specific expression in tissues such as eyes, kidney tubes, muscles, and swim bladders could be detected, as well as specific expression patterns in various cells such as nerve cells (NC) and muscle cells (MC). White dotted lines in (d) indicate the WT fish.
Genes 09 00630 g002
Figure 3. Enhancer annotation of three ET lines. Distribution in the region between 50 kb upstream and 50 kb downstream of insertion. Genomic sequences from Danio rerio (Dr), Oryzias latipes (Ol), Poecilia formosa (Pf), Xenopus tropicalis (Xt), Ficedula albicollis (Fa), Gallus gallus (Gg) and Homo sapiens (Hs) were analyzed in the VISTA browser (https://enhancer.lbl.gov/), and 10 enhancers (Ens) were predicted in zebrafish genome as indicated (red frame); the location of each insertion site is marked with a red line. (ac) represent zebrafish lines TK1, TK4 and SK3, respectively.
Genes 09 00630 g003
Figure 4. (a) Transposon-mediated En test vector cassette. The cassette contains an En test box flanked by two ITRs, the ITR represents Tol2 inverted repeat sequences, and the En test box contains a minimal gata promoter, GFP, and β-globin polyA signal flanked with two insulators. INS represents a single insulator; (bf) Expression patterns of Ens and endogenous dlx1a and dlx2a in TK1; (b) GFP expression of line TK1 at 24 and 48 hpf; (c,d) GFP expression of the embryos injected with plasmids carrying En1 and En2 at 24 and 48 hpf, respectively; (e,f) expression of dlx1a and dlx2a at 24 and 48 hpf, respectively. Red arrows indicate similar patterns in telencephalon (TL).
Genes 09 00630 g004
Figure 5. Expression patterns of En and endogenous rps26, wnt1 and wnt10b in TK4. (a) GFP expression of line TK4 at 24 and 48 hpf; (b,c) GFP expression of the embryos injected with plasmids carrying En6 and En7 at 24 and 48 hpf, respectively; (df) gene expression of rps26, wnt1 and wnt10b at 24 and 48 hpf, respectively. Red arrows indicate similar patterns in eye (E), midbrain and hindbrain boundary (MHB), spinal cord (SC) and jaw (J).
Genes 09 00630 g005
Figure 6. Expression patterns of En and endogenous ednraa in SK3. (a) GFP expression of line SK3 at 24 and 48 hpf; (b,c) GFP expression of the embryos injected with plasmids carrying En10 and En9 at 24 and 48 hpf; (d) gene expression of ednraa at 24 and 48 hpf. Red arrows indicate the similar patterns in arches (AR), hindbrain (HB) and heart (H).
Genes 09 00630 g006
Figure 7. Expression of Ens. (a) En expression confirmed by RT-PCR, numbers 1–10 represented En1-10; M: DL500 DNA marker; (bd) relative quantification of expressions of En and endogenous genes by qPCR at 24 and 48 hpf; error bars represent SD.
Genes 09 00630 g007
Table 1. Insertion sites in seven ET lines.
ET LinesNearest GeneOther Genes within 50 kb Upstream and Downstream RegionsChromosomeInsertion Position Relative to Gene Orientation in Genome
TK1ENSDARG00000013125 (dlx1a)dlx2a, itga6a9Exon 1Forward
TK4ENSDARG00000037071(rps26)arf3a, wnt10b, wnt1, IKZF4, dnajc22, lmbr1l23Intron 1Forward
SK1ENSDARG00000020699 (slc9a8)FP102158.123Intron 8Reverse
SK3ENSDARG00000011876 (ednraa)120 kb (upstream)Forward
SK6ENSDARG00000077863 (mettl22)abat, CU464120.3 3Exon 12Reverse
SK12ENSDARG00000018272 (wdr33)si:ch1073-184j22.1, sft2d3, dusp28, proca2Intron 10Reverse
PK0ENSDARG00000006314 (itgav)si:dkey-69o16.5, zc3h159Intron 4Forward
Table 2. The detailed information of 10 Ens.
NameET LinesLocation En Length (bp)En Position Relative to the Insertion
En1TK1chromosome_GRCz10_9_3366792_3466905_1:34392-353941003Upstream
En2TK1chromosome_GRCz10_9_3366792_3466905_1:55781-572321452Downstream
En3TK4chromosome_GRCz10_23_27699247_27799361_1:11781-12216436Upstream
En4TK4chromosome_GRCz10_23_27699247_27799361_1:14057-14217161Upstream
En5TK4chromosome_GRCz10_23_27699247_27799361_1:15551-15703153Upstream
En6TK4chromosome_GRCz10_23_27699247_27799361_1:23944-24162219Upstream
En7TK4chromosome_GRCz10_23_27699247_27799361_1:38416-39198783Upstream
En8TK4chromosome_GRCz10_23_27699247_27799361_1:46874-47866993Upstream
En9SK3chromosome_GRCz10_1_35864498_35964621_1:61133-61728596Downstream
En10SK3chromosome_GRCz10_1_35864498_35964621_1:90391-90590200Downstream

