Identification of Differentially Expressed Genes between Original Breast Cancer and Xenograft Using Machine Learning Algorithms

 , and
, and
Abstract
:1. Introduction
2. Materials and Methods
2.1. Data Preparation and Feature Construction
2.2. Monte Carlo Feature Selection Method
2.3. Incremental Forward Selection Method and Random Forest Classification
2.4. Rough Set-Based Rule Learning
2.5. Measurements
3. Results
4. Discussion
4.1. Differentially Expressed Genes
4.2. Rules of Quantitative Expression Level Requirements
5. Conclusions
Supplementary Materials
Acknowledgments
Author Contributions
Conflicts of Interest
References
- Sopik, V.; Sun, P.; Narod, S.A. The prognostic effect of estrogen receptor status differs for younger versus older breast cancer patients. Breast Cancer Res. Treat. 2017, 165, 391–402. [Google Scholar] [CrossRef] [PubMed]
- Boerman, L.M.; Maass, S.; van der Meer, P.; Gietema, J.A.; Maduro, J.H.; Hummel, Y.M.; Berger, M.Y.; de Bock, G.H.; Berendsen, A.J. Long-term outcome of cardiac function in a population-based cohort of breast cancer survivors: A cross-sectional study. Eur. J. Cancer 2017, 81, 56–65. [Google Scholar] [CrossRef] [PubMed]
- Lundberg, F.E.; Iliadou, A.N.; Rodriguez-Wallberg, K.; Bergh, C.; Gemzell-Danielsson, K.; Johansson, A.L.V. Ovarian stimulation and risk of breast cancer in Swedish women. Fertil. Steril. 2017, 108, 137–144. [Google Scholar] [CrossRef] [PubMed]
- Kawaguchi, T.; Foster, B.A.; Young, J.; Takabe, K. Current update of patient-derived xenograft model for translational breast cancer research. J. Mammary Gland Biol. Neoplasia 2017, 22, 131–139. [Google Scholar] [CrossRef] [PubMed]
- De la Cruz, F.S.; Diolaiti, D.; Turk, A.T.; Rainey, A.R.; Ambesi-Impiombato, A.; Andrews, S.J.; Mansukhani, M.M.; Nagy, P.L.; Alvarez, M.J.; Califano, A.; et al. A case study of an integrative genomic and experimental therapeutic approach for rare tumors: Identification of vulnerabilities in a pediatric poorly differentiated carcinoma. Genome Med. 2016, 8, 116. [Google Scholar] [CrossRef] [PubMed]
- Furuyama, T.; Tanaka, S.; Shimada, S.; Akiyama, Y.; Matsumura, S.; Mitsunori, Y.; Aihara, A.; Ban, D.; Ochiai, T.; Kudo, A.; et al. Proteasome activity is required for the initiation of precancerous pancreatic lesions. Sci. Rep. 2016, 6, 27044. [Google Scholar] [CrossRef] [PubMed]
- Zhan, B.; Wen, S.; Lu, J.; Shen, G.; Lin, X.; Feng, J.; Huang, H. Identification and causes of metabonomic difference between orthotopic and subcutaneous xenograft of pancreatic cancer. Oncotarget 2017, 8, 61264–61281. [Google Scholar] [CrossRef] [PubMed]
- Chijiwa, T.; Kawai, K.; Noguchi, A.; Sato, H.; Hayashi, A.; Cho, H.; Shiozawa, M.; Kishida, T.; Morinaga, S.; Yokose, T.; et al. Establishment of patient-derived cancer xenografts in immunodeficient NOG mice. Int. J. Oncol. 2015, 47, 61–70. [Google Scholar] [CrossRef] [PubMed]
- Unno, K.; Ono, M.; Winder, A.D.; Maniar, K.P.; Paintal, A.S.; Yu, Y.; Wei, J.J.; Lurain, J.R.; Kim, J.J. Establishment of human patient-derived endometrial cancer xenografts in NOD scid gamma mice for the study of invasion and metastasis. PLoS ONE 2014, 9, e116064. [Google Scholar] [CrossRef] [PubMed]
- Bertotti, A.; Migliardi, G.; Galimi, F.; Sassi, F.; Torti, D.; Isella, C.; Cora, D.; Di Nicolantonio, F.; Buscarino, M.; Petti, C.; et al. A molecularly annotated platform of patient-derived xenografts (“xenopatients”) identifies HER2 as an effective therapeutic target in cetuximab-resistant colorectal cancer. Cancer Discov. 2011, 1, 508–523. [Google Scholar] [CrossRef] [PubMed]
- Tignanelli, C.J.; Herrera Loeza, S.G.; Yeh, J.J. KRAS and PIK3CA mutation frequencies in patient-derived xenograft models of pancreatic and colorectal cancer are reflective of patient tumors and stable across passages. Am. Surg. 2014, 80, 873–877. [Google Scholar] [PubMed]
- Li, H.; Zhu, Y.J.; Tang, X.Y.; Li, J.Y.; Li, Y.Y.; Zhong, Z.M.; Ding, G.H.; Li, Y.X. Integrated analysis of transcriptome in cancer patient-derived xenografts. PLoS ONE 2015, 10, e0124780. [Google Scholar] [CrossRef] [PubMed]
- Lawson, D.A.; Bhakta, N.R.; Kessenbrock, K.; Prummel, K.D.; Yu, Y.; Takai, K.; Zhou, A.; Eyob, H.; Balakrishnan, S.; Wang, C.Y.; et al. Single-cell analysis reveals a stem-cell program in human metastatic breast cancer cells. Nature 2015, 526, 131–135. [Google Scholar] [CrossRef] [PubMed]
- Draminski, M.; Rada-Iglesias, A.; Enroth, S.; Wadelius, C.; Koronacki, J.; Komorowski, J. Monte Carlo feature selection for supervised classification. Bioinformatics 2008, 24, 110–117. [Google Scholar] [CrossRef] [PubMed]
- Dramiński, M.; Kierczak, M.; Nowak-Brzezińska, A.; Koronecki, J.; Komorowski, J. The Monte Carlo feature selection and interdependency discovery is unbiased. Control Cybern. 2011, 40, 199–211. [Google Scholar]
- Chen, L.; Li, J.; Zhang, Y.-H.; Feng, K.; Wang, S.; Zhang, Y.; Huang, T.; Kong, X.; Cai, Y.-D. Identification of gene expression signatures across different types of neural stem cells with the Monte-Carlo feature selection method. J. Cell. Biochem. 2017, 119, 3394–3403. [Google Scholar] [CrossRef] [PubMed]
- Breiman, L. Random forests. Mach. Learn. 2001, 45, 5–32. [Google Scholar] [CrossRef]
- Ho, T.K. Random decision forests. In Proceedings of the 3rd International Conference on Document Analysis and Recognition, Montreal, QC, Canada, 14–16 August 1995; pp. 278–282. [Google Scholar]
- Pawlak, Z. Rough Sets: Theoretical Aspects of Reasoning about Data; Kluwer Academic Publisher: Dordrecht, The Netherlands, 1991. [Google Scholar]
- Hastie, T.; Tibshirani, R.; Sherlock, G.; Eisen, M.; Brown, P.; Botstein, D. Imputing Missing Data for Gene Expression Arrays; Technical Report; Stanford University Statistics Department: Stanford, CA, USA, 1999. [Google Scholar]
- Troyanskaya, O.; Cantor, M.; Sherlock, G.; Brown, P.; Hastie, T.; Tibshirani, R.; Botstein, D.; Altman, R.B. Missing value estimation methods for DNA microarrays. Bioinformatics 2001, 17, 520–525. [Google Scholar] [CrossRef] [PubMed]
- Wang, S.; Zhang, Y.H.; Lu, J.; Cui, W.; Hu, J.; Cai, Y.D. Analysis and identification of aptamer-compound interactions with a maximum relevance minimum redundancy and nearest neighbor algorithm. Biomed. Res. Int. 2016, 2016, 8351204. [Google Scholar] [CrossRef] [PubMed]
- Wang, S.; Zhang, Q.; Lu, J.; Cai, Y.-D. Analysis and prediction of nitrated tyrosine sites with the mRMR method and support vector machine algorithm. Curr. Bioinform. 2018, 13, 3–13. [Google Scholar] [CrossRef]
- Wang, S.; Zhang, Y.-H.; Huang, G.; Chen, L.; Cai, Y.-D. Analysis and prediction of myristoylation sites using the mRMR method, the IFS method and an extreme learning machine algorithm. Comb. Chem. High Throughput Screen. 2017, 20, 96–106. [Google Scholar] [CrossRef] [PubMed]
- Pugalenthi, G.; Kandaswamy, K.; Chou, K.-C.; Vivekanandan, S.; Kolatkar, P. RSARF: Prediction of residue solvent accessibility from protein sequence using random forest method. Protein Pept. Lett. 2011, 19, 50–56. [Google Scholar] [CrossRef]
- Zhao, X.; Zou, Q.; Liu, B.; Liu, X. Exploratory predicting protein folding model with random forest and hybrid features. Curr. Proteom. 2014, 11, 289–299. [Google Scholar] [CrossRef]
- Kohavi, R. A Study of Cross-Validation and Bootstrap for Accuracy Estimation and Model Selection; International Joint Conference on Artificial Intelligence; Lawrence Erlbaum Associates Ltd.: Montreal, QC, Canada, 1995; pp. 1137–1145. [Google Scholar]
- Geisser, S. Predictive Inference; CRC Press: Boca Raton, FL, USA, 1993; Volume 55. [Google Scholar]
- Øhrn, A. Discernibility and Rough sets in Medicine: Tools and Applications; Norwegian University of Science and Technology (NTNU): Trondheim, Norway, 1999. [Google Scholar]
- Johnson, D.S. Approximation algorithms for combinatorial problems. J. Comput. Syst. Sci. 1974, 9, 256–278. [Google Scholar] [CrossRef]
- Cohen, W.W. Fast effective rule induction. In Proceedings of the Twelfth International Conference on Machine Learning, Tahoe City, CA, USA, 9–12 July 1995; pp. 115–123. [Google Scholar]
- Furnkranz, J.; Widmer, G. Incremental reduced error pruning. In Proceedings of the Machine Learning: Proceedings of the Eleventh Annual Conference, Rutgers University, New Brunswick, NJ, USA, 10–13 July 1994. [Google Scholar]
- Quinlan, J.R. Learning logical definitions from relations. Mach. Learn. 1990, 266, 239–266. [Google Scholar] [CrossRef]
- Brunk, C.A.; Pazzani, M.J. An investigation of noise-tolerant relational concept learning algorithms. In Proceedings of the 8th International Workshop on Machine Learning, Evanston, IL, USA, June 1991; pp. 389–393. [Google Scholar]
- Dramiński, M.; Da̧browski, M.J.; Diamanti, K.; Koronacki, J.; Komorowski, J. Discovering networks of interdependent features in high-dimensional problems. In Big Data Analysis: New Algorithms for a New Society; Springer International Publishing: Cham, Switzerland, 2016; pp. 285–304. [Google Scholar]
- Chen, L.; Zhang, Y.-H.; Lu, G.; Huang, T.; Cai, Y.-D. Analysis of cancer-related lncRNAs using gene ontology and KEGG pathways. Artif. Intell. Med. 2017, 76, 27–36. [Google Scholar] [CrossRef] [PubMed]
- Li, B.-Q.; Zhang, Y.-H.; Jin, M.-L.; Huang, T.; Cai, Y.-D. Prediction of protein-peptide interactions with a nearest neighbor algorithm. Curr. Bioinform. 2018, 13, 14–24. [Google Scholar] [CrossRef]
- Zhang, Q.; Sun, X.; Feng, K.; Wang, S.; Zhang, Y.H.; Wang, S.; Lu, L.; Cai, Y.D. Predicting citrullination sites in protein sequences using mRMR method and random forest algorithm. Comb. Chem. High Throughput Screen. 2017, 20, 164–173. [Google Scholar] [CrossRef] [PubMed]
- Chen, L.; Zhang, Y.H.; Huang, T.; Cai, Y.D. Gene expression profiling gut microbiota in different races of humans. Sci. Rep. 2016, 6, 23075. [Google Scholar] [CrossRef] [PubMed]
- Chen, L.; Zhang, Y.-H.; Zheng, M.; Huang, T.; Cai, Y.-D. Identification of compound–protein interactions through the analysis of gene ontology, KEGG enrichment for proteins and molecular fragments of compounds. Mol. Genet. Genom. 2016, 291, 2065–2079. [Google Scholar] [CrossRef] [PubMed]
- Ni, Q.; Chen, L. A feature and algorithm selection method for improving the prediction of protein structural classes. Comb. Chem. High Throughput Screen. 2017, 20, 612–621. [Google Scholar] [CrossRef] [PubMed]
- Fang, Y.; Chen, L. A binary classifier for prediction of the types of metabolic pathway of chemicals. Comb. Chem. High Throughput Screen. 2017, 20, 140–146. [Google Scholar] [CrossRef] [PubMed]
- Chen, L.; Wang, S.; Zhang, Y.-H.; Li, J.; Xing, Z.-H.; Yang, J.; Huang, T.; Cai, Y.-D. Identify key sequence features to improve CRISPR sgRNA efficacy. IEEE Access 2017, 5, 26582–26590. [Google Scholar] [CrossRef]
- Chen, L.; Zhang, Y.-H.; Huang, G.; Pan, X.; Wang, S.; Huang, T.; Cai, Y.-D. Discriminating cirRNAs from other lncRNAs using a hierarchical extreme learning machine (H-ELM) algorithm with feature selection. Mol. Genet. Genom. 2018, 293, 137–149. [Google Scholar] [CrossRef] [PubMed]
- Zhang, Y.H.; Xing, Z.H.; Liu, C.L.; Wang, S.P.; Huang, T.; Cai, Y.D.; Kong, X.Y. Identification of the core regulators of the HLA I-peptide binding process. Sci. Rep. 2017, 7, 42768. [Google Scholar] [CrossRef] [PubMed]
- Huang, G.; Chu, C.; Huang, T.; Kong, X.; Zhang, Y.; Zhang, N.; Cai, Y.D. Exploring mouse protein function via multiple approaches. PLoS ONE 2016, 11, e0166580. [Google Scholar] [CrossRef] [PubMed]
- Cherkassky, V. The nature of statistical learning theory. IEEE Trans. Neural Netw. 1997, 8, 1564. [Google Scholar] [CrossRef] [PubMed]
- Ting, K.M.; Witten, I.H. Stacking bagged and dagged models. In Proceedings of the Fourteenth International Conference on Machine Learning, San Francisco, CA, USA, 8–12 July 1997. [Google Scholar]
- Almeida, G.S.; Bawn, C.M.; Galler, M.; Wilson, I.; Thomas, H.D.; Kyle, S.; Curtin, N.J.; Newell, D.R.; Maxwell, R.J. PARP inhibitor rucaparib induces changes in NAD levels in cells and liver tissues as assessed by MRS. NMR Biomed. 2017, 30, e3736. [Google Scholar] [CrossRef] [PubMed]
- Ghosh, R.; Roy, S.; Kamyab, J.; Dantzer, F.; Franco, S. Common and unique genetic interactions of the poly(ADP-ribose) polymerases PARP1 and PARP2 with DNA double-strand break repair pathways. DNA Repair 2016, 45, 56–62. [Google Scholar] [CrossRef] [PubMed]
- Pignochino, Y.; Capozzi, F.; D’Ambrosio, L.; Dell’Aglio, C.; Basirico, M.; Canta, M.; Lorenzato, A.; Lutati, F.V.; Aliberti, S.; Palesandro, E.; et al. PARP1 expression drives the synergistic antitumor activity of trabectedin and PARP1 inhibitors in sarcoma preclinical models. Mol. Cancer 2017, 16, 86. [Google Scholar] [CrossRef] [PubMed]
- Johnson, S.F.; Cruz, C.; Greifenberg, A.K.; Dust, S.; Stover, D.G.; Chi, D.; Primack, B.; Cao, S.; Bernhardy, A.J.; Coulson, R.; et al. CDK12 inhibition reverses de novo and acquired PARP inhibitor resistance in BRCA wild-type and mutated models of triple-negative breast cancer. Cell Rep. 2016, 17, 2367–2381. [Google Scholar] [CrossRef] [PubMed]
- Foyle, A.; Sangalang, V.E. Intraskeletal myofiber metastasis of breast-carcinoma. Hum. Pathol. 1984, 15, 198. [Google Scholar] [CrossRef]
- Saha, S.K.; Choi, H.Y.; Kim, B.W.; Dayem, A.A.; Yang, G.M.; Kim, K.S.; Yin, Y.F.; Cho, S.G. KRT19 directly interacts with β-catenin/RAC1 complex to regulate NUMB-dependent NOTCH signaling pathway and breast cancer properties. Oncogene 2017, 36, 332–349. [Google Scholar] [CrossRef] [PubMed]
- Whittle, J.R.; Lewis, M.T.; Lindeman, G.J.; Visvader, J.E. Patient-derived xenograft models of breast cancer and their predictive power. Breast Cancer Res. 2015, 17, 17. [Google Scholar] [CrossRef] [PubMed]
- Jiang, Z.; Jiang, X.; Chen, S.; Lai, Y.; Wei, X.; Li, B.; Lin, S.; Wang, S.; Wu, Q.; Liang, Q.; et al. Anti-GPC3-CAR T cells suppress the growth of tumor cells in patient-derived xenografts of hepatocellular carcinoma. Front. Immunol. 2016, 7, 690. [Google Scholar] [CrossRef] [PubMed]
- Leca, J.; Martinez, S.; Lac, S.; Nigri, J.; Secq, V.; Rubis, M.; Bressy, C.; Serge, A.; Lavaut, M.N.; Dusetti, N.; et al. Cancer-associated fibroblast-derived annexin A6+ extracellular vesicles support pancreatic cancer aggressiveness. J. Clin. Investig. 2016, 126, 4140–4156. [Google Scholar] [CrossRef] [PubMed]
- Katdare, M.R.; Bhonde, R.R.; Parab, P.B. Analysis of morphological and functional maturation of neoislets generated in vitro from pancreatic ductal cells and their suitability for islet banking and transplantation. J. Endocrinol. 2004, 182, 105–112. [Google Scholar] [CrossRef] [PubMed]
- Khanom, R.; Sakamoto, K.; Pal, S.K.; Shimada, Y.; Morita, K.; Omura, K.; Miki, Y.; Yamaguchi, A. Expression of basal cell keratin 15 and keratin 19 in oral squamous neoplasms represents diverse pathophysiologies. Histol. Histopathol. 2012, 27, 949–959. [Google Scholar] [PubMed]
- Deng, J.; Wang, L.; Chen, H.; Li, L.; Ma, Y.; Ni, J.; Li, Y. The role of tumour-associated MUC1 in epithelial ovarian cancer metastasis and progression. Cancer Metast. Rev. 2013, 32, 535–551. [Google Scholar] [CrossRef] [PubMed]
- Jeschke, U.; Wiest, I.; Schumacher, A.L.; Kupka, M.; Rack, B.; Stahn, R.; Karsten, U.; Mayr, D.; Friese, K.; Dian, D. Determination of MUC1 in sera of ovarian cancer patients and in sera of patients with benign changes of the ovaries with CA15–3, CA27.29, and PankoMab. Anticancer Res. 2012, 32, 2185–2189. [Google Scholar] [PubMed]
- Qadir, A.S.; Ceppi, P.; Brockway, S.; Law, C.; Mu, L.; Khodarev, N.N.; Kim, J.; Zhao, J.C.; Putzbach, W.; Murmann, A.E.; et al. CD95/Fas increases stemness in cancer cells by inducing a STAT1-dependent type I interferon response. Cell Rep. 2017, 18, 2373–2386. [Google Scholar] [CrossRef] [PubMed]
- Snowden, E.; Porter, W.; Hahn, F.; Ferguson, M.; Tong, F.; Parker, J.S.; Middlebrook, A.; Ghanekar, S.; Dillmore, W.S.; Blaesius, R. Immunophenotyping and transcriptomic outcomes in PDX-derived TNBC tissue. Mol. Cancer Res. 2017, 15, 429–438. [Google Scholar] [CrossRef] [PubMed]
- Freitas, C.; Wittner, M.; Nguyen, J.; Rondeau, V.; Biajoux, V.; Aknin, M.L.; Gaudin, F.; Beaussant-Cohen, S.; Bertrand, Y.; Bellanne-Chantelot, C.; et al. Lymphoid differentiation of hematopoietic stem cells requires efficient Cxcr4 desensitization. J. Exp. Med. 2017, 214, 2023–2040. [Google Scholar] [CrossRef] [PubMed]
- Lis, R.; Karrasch, C.C.; Poulos, M.G.; Kunar, B.; Redmond, D.; Duran, J.G.B.; Badwe, C.R.; Schachterle, W.; Ginsberg, M.; Xiang, J.; et al. Conversion of adult endothelium to immunocompetent haematopoietic stem cells. Nature 2017, 545, 439–445. [Google Scholar] [CrossRef] [PubMed]
- Lefort, S.; Thuleau, A.; Kieffer, Y.; Sirven, P.; Bieche, I.; Marangoni, E.; Vincent-Salomon, A.; Mechta-Grigoriou, F. CXCR4 inhibitors could benefit to HER2 but not to triple-negative breast cancer patients. Oncogene 2017, 36, 1211–1222. [Google Scholar] [CrossRef] [PubMed]
- Nobutani, K.; Shimono, Y.; Mizutani, K.; Ueda, Y.; Suzuki, T.; Kitayama, M.; Minami, A.; Momose, K.; Miyawaki, K.; Akashi, K.; et al. Downregulation of CXCR4 in metastasized breast cancer cells and implication in their dormancy. PLoS ONE 2015, 10, e0130032. [Google Scholar] [CrossRef] [PubMed]
- Jacobi, N.; Seeboeck, R.; Hofmann, E.; Eger, A. ErbB family signalling: A paradigm for oncogene addiction and personalized oncology. Cancers 2017, 9, 33. [Google Scholar] [CrossRef] [PubMed]
- Manning, H.C.; Buck, J.R.; Cook, R.S. Mouse models of breast cancer: Platforms for discovering precision imaging diagnostics and future cancer medicine. J. Nucl. Med. 2016, 57, 60–68. [Google Scholar] [CrossRef] [PubMed]
- Choy, L.; Hagenbeek, T.J.; Solon, M.; French, D.; Finkle, D.; Shelton, A.; Venook, R.; Brauer, M.J.; Siebel, C.W. Constitutive NOTCH3 signaling promotes the growth of basal breast cancers. Cancer Res. 2017, 77, 1439–1452. [Google Scholar] [CrossRef] [PubMed]
- Baker, L.A.; Holliday, H.; Swarbrick, A. ID4 controls luminal lineage commitment in normal mammary epithelium and inhibits BRCA1 function in basal-like breast cancer. Endocr.-Relat. Cancer 2016, 23, R381–R392. [Google Scholar] [CrossRef] [PubMed]
- Kashi, V.P.; Hatley, M.E.; Galindo, R.L. Probing for a deeper understanding of rhabdomyosarcoma: Insights from complementary model systems. Nat. Rev. Cancer 2015, 15, 426–439. [Google Scholar] [CrossRef] [PubMed]
- Berezovsky, A.D. Sox2 promotes malignancy in glioblastoma by regulating plasticity and astrocytic differentiation. Neoplasia 2014, 16, 193–206. [Google Scholar] [CrossRef] [PubMed]
- Bornelov, S.; Marillet, S.; Komorowski, J. Ciruvis: A web-based tool for rule networks and interaction detection using rule-based classifiers. BMC Bioinform. 2014, 15, 139. [Google Scholar] [CrossRef] [PubMed]
- Mehrazarin, S.; Chen, W.; Oh, J.E.; Liu, Z.X.; Kang, K.L.; Yi, J.K.; Kim, R.H.; Shin, K.H.; Park, N.H.; Kang, M.K. The p63 gene is regulated by grainyhead-like 2 (GRHL2) through reciprocal feedback and determines the epithelial phenotype in human keratinocytes. J. Biol. Chem. 2015, 290, 19999–20008. [Google Scholar] [CrossRef] [PubMed]
- Kiselyov, A.; Bunimovich-Mendrazitsky, S.; Startsev, V. Key signaling pathways in the muscle-invasive bladder carcinoma: Clinical markers for disease modeling and optimized treatment. J. Int. Cancer 2016, 138, 2562–2569. [Google Scholar] [CrossRef] [PubMed]
- Moheimani, F.; Roth, H.M.; Cross, J.; Reid, A.T.; Shaheen, F.; Warner, S.M.; Hirota, J.A.; Kicic, A.; Hallstrand, T.S.; Kahn, M.; et al. Disruption of β-catenin/CBP signaling inhibits human airway epithelial–mesenchymal transition and repair. Int. J. Biochem. Cell Biol. 2015, 68, 59–69. [Google Scholar] [CrossRef] [PubMed]
- Glatter, T.; Wepf, A.; Aebersold, R.; Gstaiger, M. An integrated workflow for charting the human interaction proteome: Insights into the PP2A system. Mol. Syst. Biol. 2009, 5, 237. [Google Scholar] [CrossRef] [PubMed]
- Rual, J.F.; Venkatesan, K.; Hao, T.; Hirozane-Kishikawa, T.; Dricot, A.; Li, N.; Berriz, G.F.; Gibbons, F.D.; Dreze, M.; Ayivi-Guedehoussou, N.; et al. Towards a proteome-scale map of the human protein-protein interaction network. Nature 2005, 437, 1173–1178. [Google Scholar] [CrossRef] [PubMed]
- Koringa, P.G.; Jakhesara, S.J.; Bhatt, V.D.; Meshram, C.P.; Patel, A.K.; Fefar, D.T.; Joshi, C.G. Comprehensive transcriptome profiling of squamous cell carcinoma of horn in Bos indicus. Vet. Comp. Oncol. 2016, 14, 122–136. [Google Scholar] [CrossRef] [PubMed]
- Gorski, J.J.; James, C.R.; Quinn, J.E.; Stewart, G.E.; Staunton, K.C.; Buckley, N.E.; McDyer, F.A.; Kennedy, R.D.; Wilson, R.H.; Mullan, P.B.; et al. BRCA1 transcriptionally regulates genes associated with the basal-like phenotype in breast cancer. Breast Cancer Res. Treat. 2010, 122, 721–731. [Google Scholar] [CrossRef] [PubMed]
- Li, C.; Ma, H.; Wang, Y.; Cao, Z.; Graves-Deal, R.; Powell, A.E.; Starchenko, A.; Ayers, G.D.; Washington, M.K.; Kamath, V.; et al. Excess PLAC8 promotes an unconventional ERK2-dependent EMT in colon cancer. J. Clin. Investig. 2014, 124, 2172–2187. [Google Scholar] [CrossRef] [PubMed]
- Ju, J.H.; Oh, S.; Lee, K.M.; Yang, W.; Nam, K.S.; Moon, H.G.; Noh, D.Y.; Kim, C.G.; Park, G.; Park, J.B.; et al. Cytokeratin19 induced by HER2/ERK binds and stabilizes HER2 on cell membranes. Cell Death Differ. 2015, 22, 665–676. [Google Scholar] [CrossRef] [PubMed]
- Markou, A.; Lazaridou, M.; Paraskevopoulos, P.; Chen, S.; Swierczewska, M.; Budna, J.; Kuske, A.; Gorges, T.M.; Joosse, S.A.; Kroneis, T.; et al. Multiplex gene expression profiling of in vivo isolated circulating tumor cells in high-risk prostate cancer patients. Clin. Chem. 2018. [Google Scholar] [CrossRef] [PubMed]
- Bredemeier, M.; Edimiris, P.; Mach, P.; Kubista, M.; Sjoback, R.; Rohlova, E.; Kolostova, K.; Hauch, S.; Aktas, B.; Tewes, M.; et al. Gene expression signatures in circulating tumor cells correlate with response to therapy in metastatic breast cancer. Clin. Chem. 2017, 63, 1585–1593. [Google Scholar] [CrossRef] [PubMed]
- Lin, C.; Chen, W.; Qiu, C.; Wu, Y.; Krishnan, S.; Zou, Q. LibD3C: Ensemble classifiers with a clustering and dynamic selection strategy. Neurocomputing 2014, 123, 424–435. [Google Scholar] [CrossRef]


| Model | Feature No. | MCC | Sensitivity | Specificity | Accuracy |
|---|---|---|---|---|---|
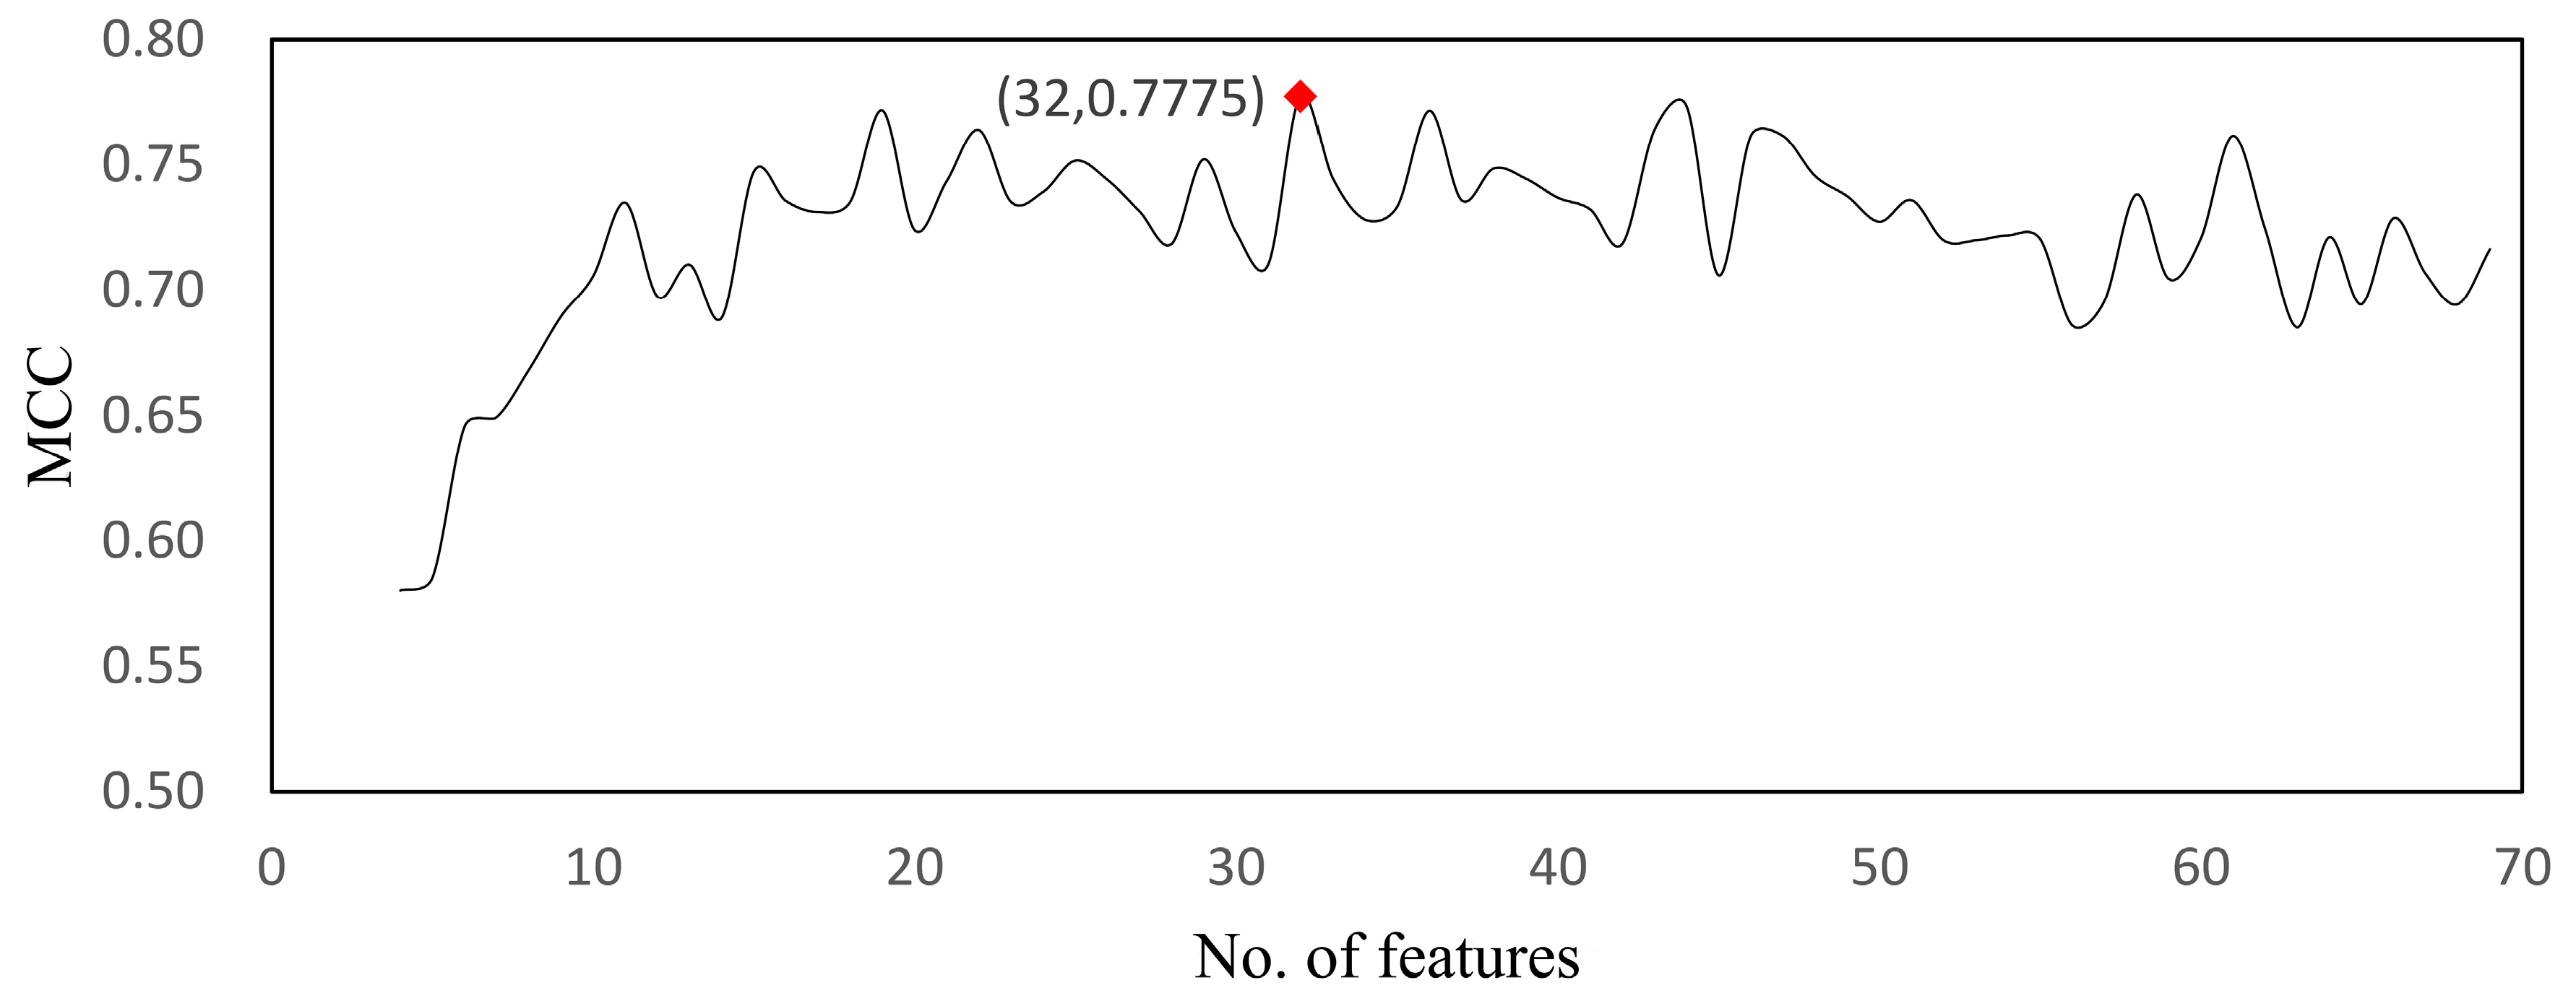
| RF | 32 | 0.777 | 0.996 | 0.672 | 0.929 |
| RF | 57 (MCFS cutoff) | 0.695 | 0.995 | 0.598 | 0.905 |
| Rough Set | 57 (MCFS cutoff) | 0.665 | 0.950 | 0.680 | 0.893 |
| SVM | 41 | 0.695 | 0.995 | 0.563 | 0.904 |
| Dagging | 58 | 0.599 | 0.996 | 0.436 | 0.878 |
| Rules | Criteria | Classification |
|---|---|---|
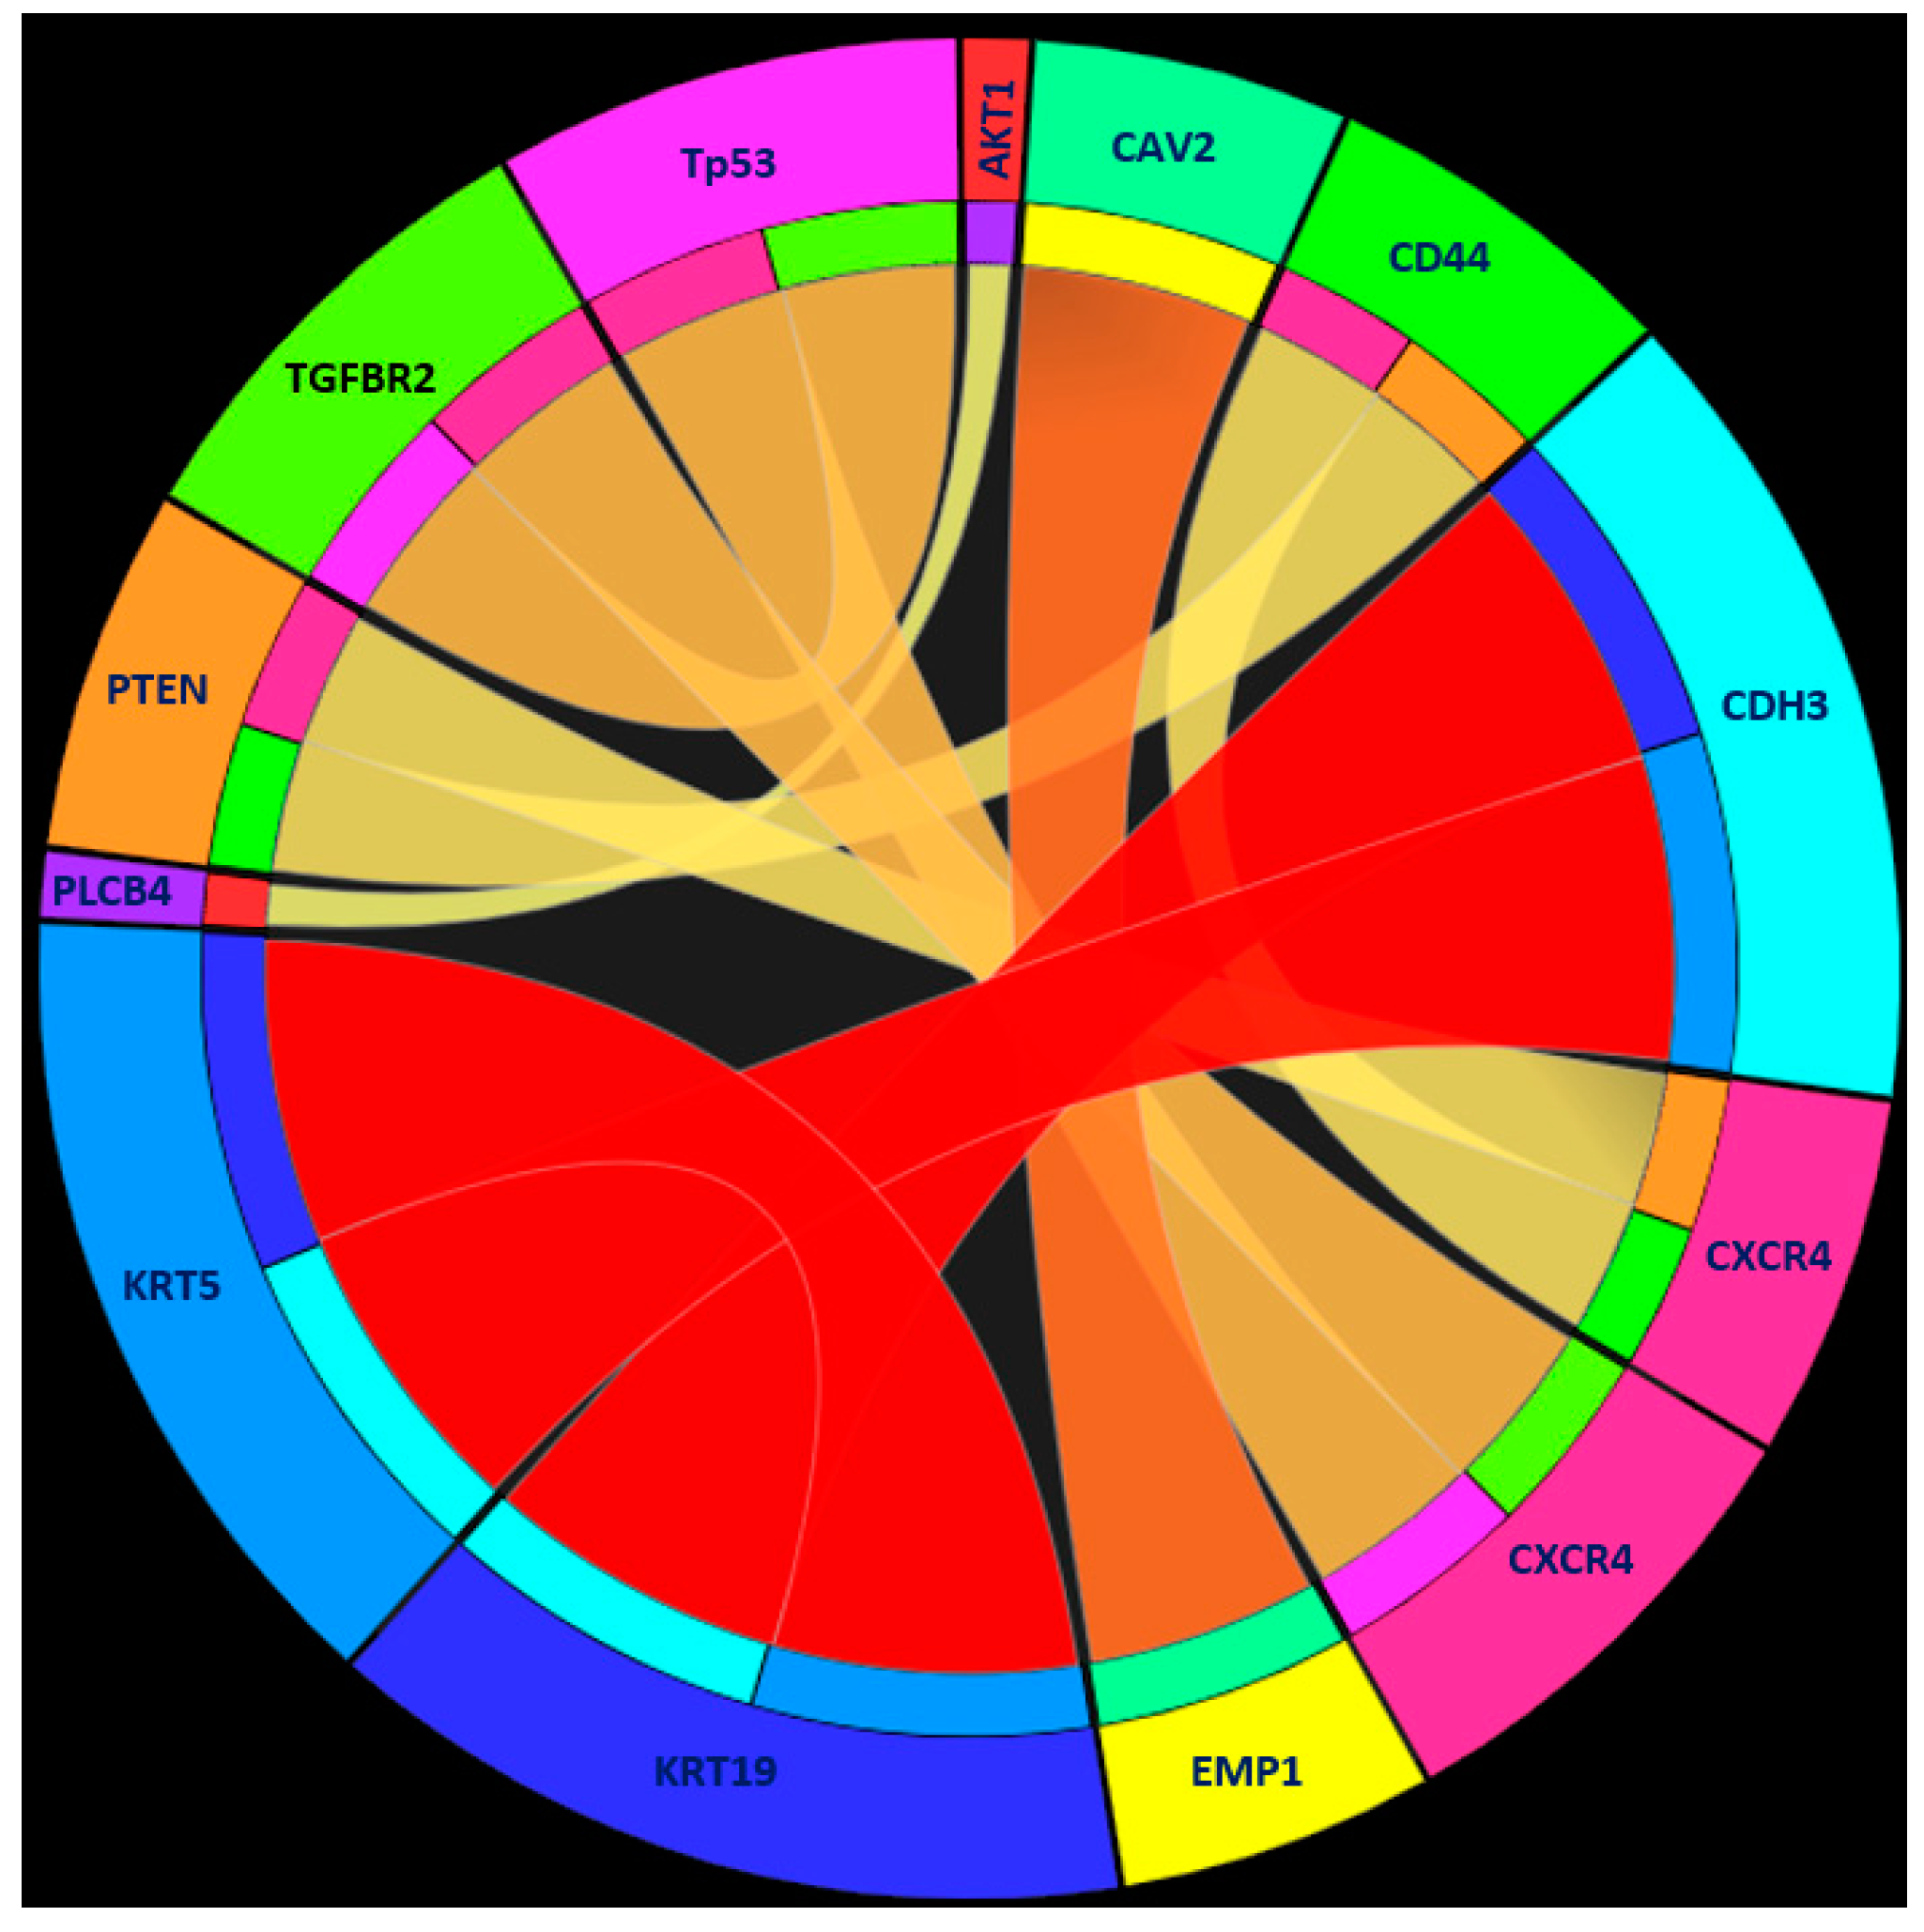
| Rule 1 | KRT19 ≥ 1.939224 | Human tumor |
| KRT5 ≤ 0.148786 | ||
| CDH3 ≤ 0.868794 | ||
| Rule 2 | EMP1 ≥ 4.237572 | Human tumor |
| CAV2 ≤ 1.610886 | ||
| Rule 3 | TP53 ≤ 0.291193 | Human tumor |
| CXCR4 ≥ 4.367387 | ||
| TGFBR2 ≤ 1.868461 | ||
| Rule 4 | CXCR4 ≤ −2.474571 | Human tumor |
| CD44 ≥ 0.086944 | ||
| PTEN ≥ 0.143515 | ||
| VIM ≤ 0.647694 | ||
| Rule 5 | PARP2 ≥ 3.111536 | Human tumor |
| Rule 6 | PLCB4 ≥ 3.744729 | Human tumor |
| AKT1 ≤ −0.070679 | ||
| Rule 7 | Other conditions | PDX tumor |
| HUGO Symbol | HUGO Name | RI |
|---|---|---|
| EMP1 | epithelial membrane protein 1 | 0.16895404 |
| PARP2 | poly(ADP-ribose) polymerase 2 | 0.15058246 |
| KRT19 | keratin 19 | 0.12158414 |
| MUC1 | mucin 1, cell surface associated | 0.11115772 |
| CXCR4 | C-X-C motif chemokine receptor 4 | 0.07917199 |
| PROM1 | prominin 1 | 0.06480689 |
| ERBB2 | erb-b2 receptor tyrosine kinase 2 | 0.048957534 |
| ERBB3 | erb-b2 receptor tyrosine kinase 3 | 0.04209958 |
| KRT5 | keratin 5 | 0.037512265 |
| ID4 | inhibitor of DNA binding 4, HLH protein | 0.03389286 |
| PTEN | phosphatase and tensin homolog | 0.029668033 |
| NTRK2 | neurotrophic receptor tyrosine kinase 2 | 0.022596486 |
| PGR | progesterone receptor | 0.020494139 |
| TP53 | tumor protein p53 | 0.019557578 |
| CDH3 | cadherin 3 | 0.01846532 |
| BMI1 | BMI1 proto-oncogene, polycomb ring finger | 0.013900218 |
| TGFBR2 | transforming growth factor beta receptor 2 | 0.013375987 |
| CCNB1 | cyclin B1 | 0.013296658 |
| PLCB4 | phospholipase C beta 4 | 0.013219586 |
| CLDN4 | claudin 4 | 0.013182897 |
| CXCL12 | C-X-C motif chemokine ligand 12 | 0.010324035 |
| EGFR | epidermal growth factor receptor | 0.010273729 |
| CD44 | CD44 molecule (Indian blood group) | 0.009676576 |
| LGR5 | leucine rich repeat containing G protein-coupled receptor 5 | 0.008659011 |
| NOTCH4 | notch 4 | 0.007799821 |
| BCL2 | BCL2, apoptosis regulator | 0.007518955 |
| CAV2 | caveolin 2 | 0.007474113 |
| VEGFC | vascular endothelial growth factor C | 0.006789302 |
| TGFBR1 | transforming growth factor beta receptor 1 | 0.006149265 |
| VIM | vimentin | 0.005953075 |
| TGFB2 | transforming growth factor beta 2 | 0.005226418 |
| KRT8 | keratin 8 | 0.00506866 |
© 2018 by the authors. Licensee MDPI, Basel, Switzerland. This article is an open access article distributed under the terms and conditions of the Creative Commons Attribution (CC BY) license (http://creativecommons.org/licenses/by/4.0/).
Share and Cite
Wang, D.; Li, J.-R.; Zhang, Y.-H.; Chen, L.; Huang, T.; Cai, Y.-D. Identification of Differentially Expressed Genes between Original Breast Cancer and Xenograft Using Machine Learning Algorithms. Genes 2018, 9, 155. https://0-doi-org.brum.beds.ac.uk/10.3390/genes9030155
Wang D, Li J-R, Zhang Y-H, Chen L, Huang T, Cai Y-D. Identification of Differentially Expressed Genes between Original Breast Cancer and Xenograft Using Machine Learning Algorithms. Genes. 2018; 9(3):155. https://0-doi-org.brum.beds.ac.uk/10.3390/genes9030155
Chicago/Turabian StyleWang, Deling, Jia-Rui Li, Yu-Hang Zhang, Lei Chen, Tao Huang, and Yu-Dong Cai. 2018. "Identification of Differentially Expressed Genes between Original Breast Cancer and Xenograft Using Machine Learning Algorithms" Genes 9, no. 3: 155. https://0-doi-org.brum.beds.ac.uk/10.3390/genes9030155