Oxidative Potential Associated with Urban Aerosol Deposited into the Respiratory System and Relevant Elemental and Ionic Fraction Contributions


 , , , and
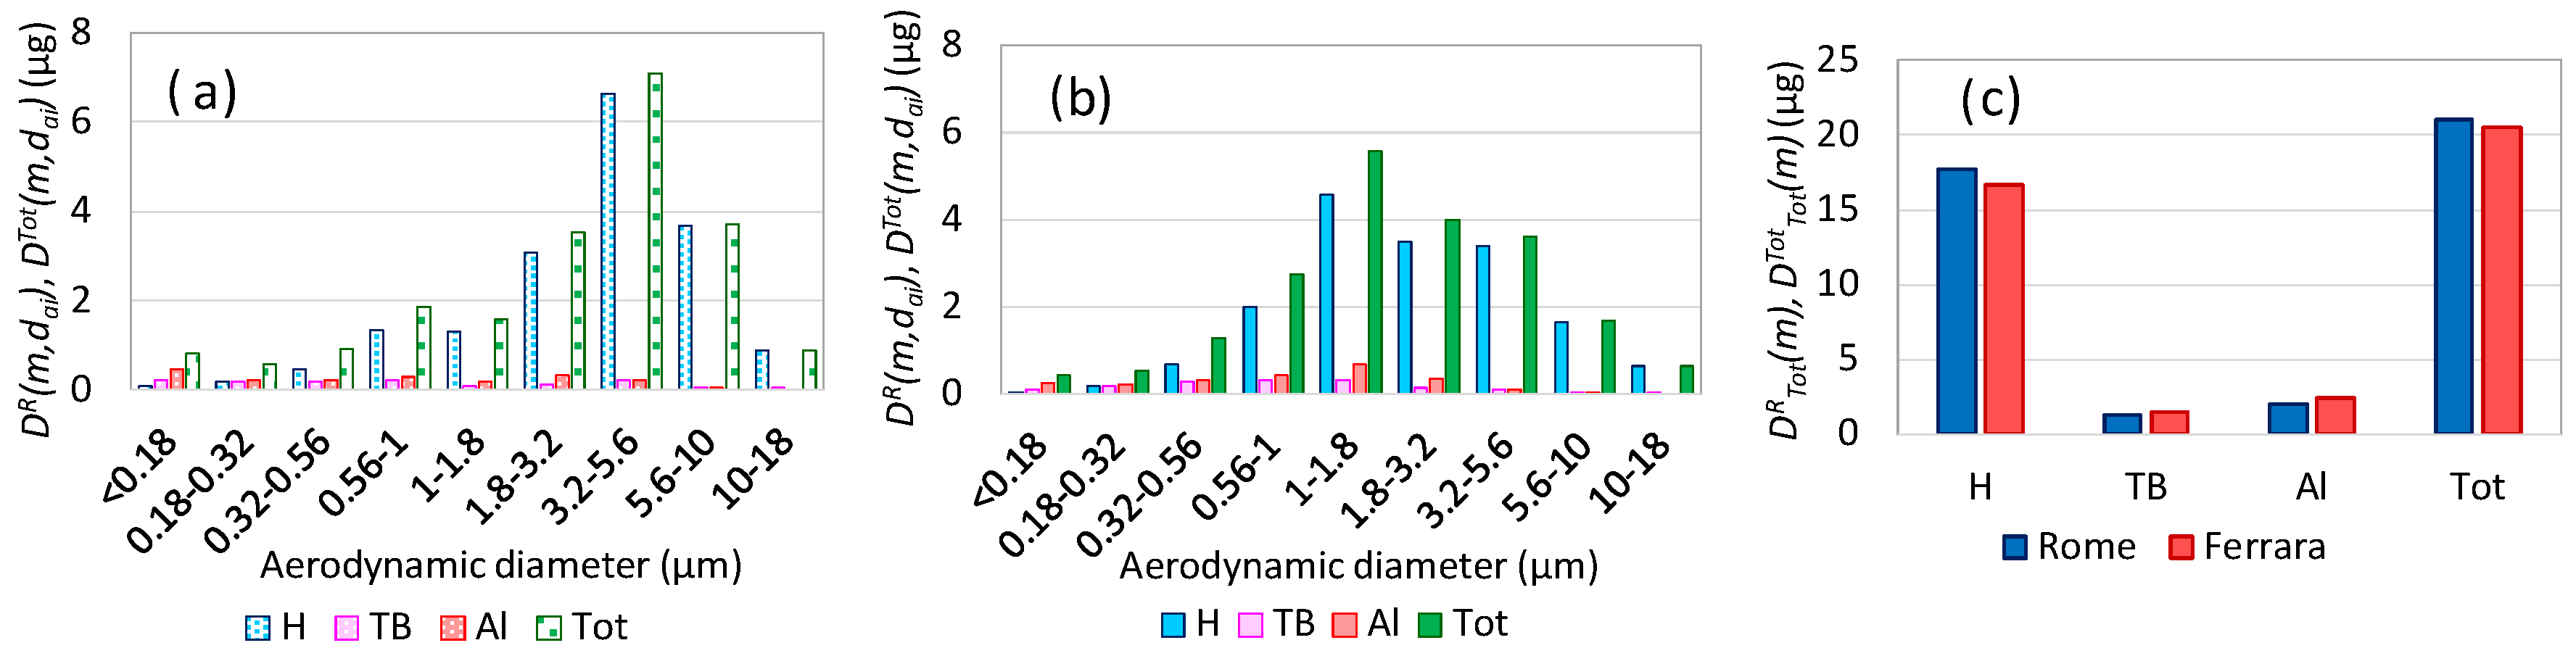
Abstract
:1. Introduction
2. Experiments
2.1. Aerosol Sampling
2.2. Chemical Analysis
2.3. Aerosol Dosimetry
3. Results and Discussion
3.1. Total Aerosol Mass Respiratory Doses
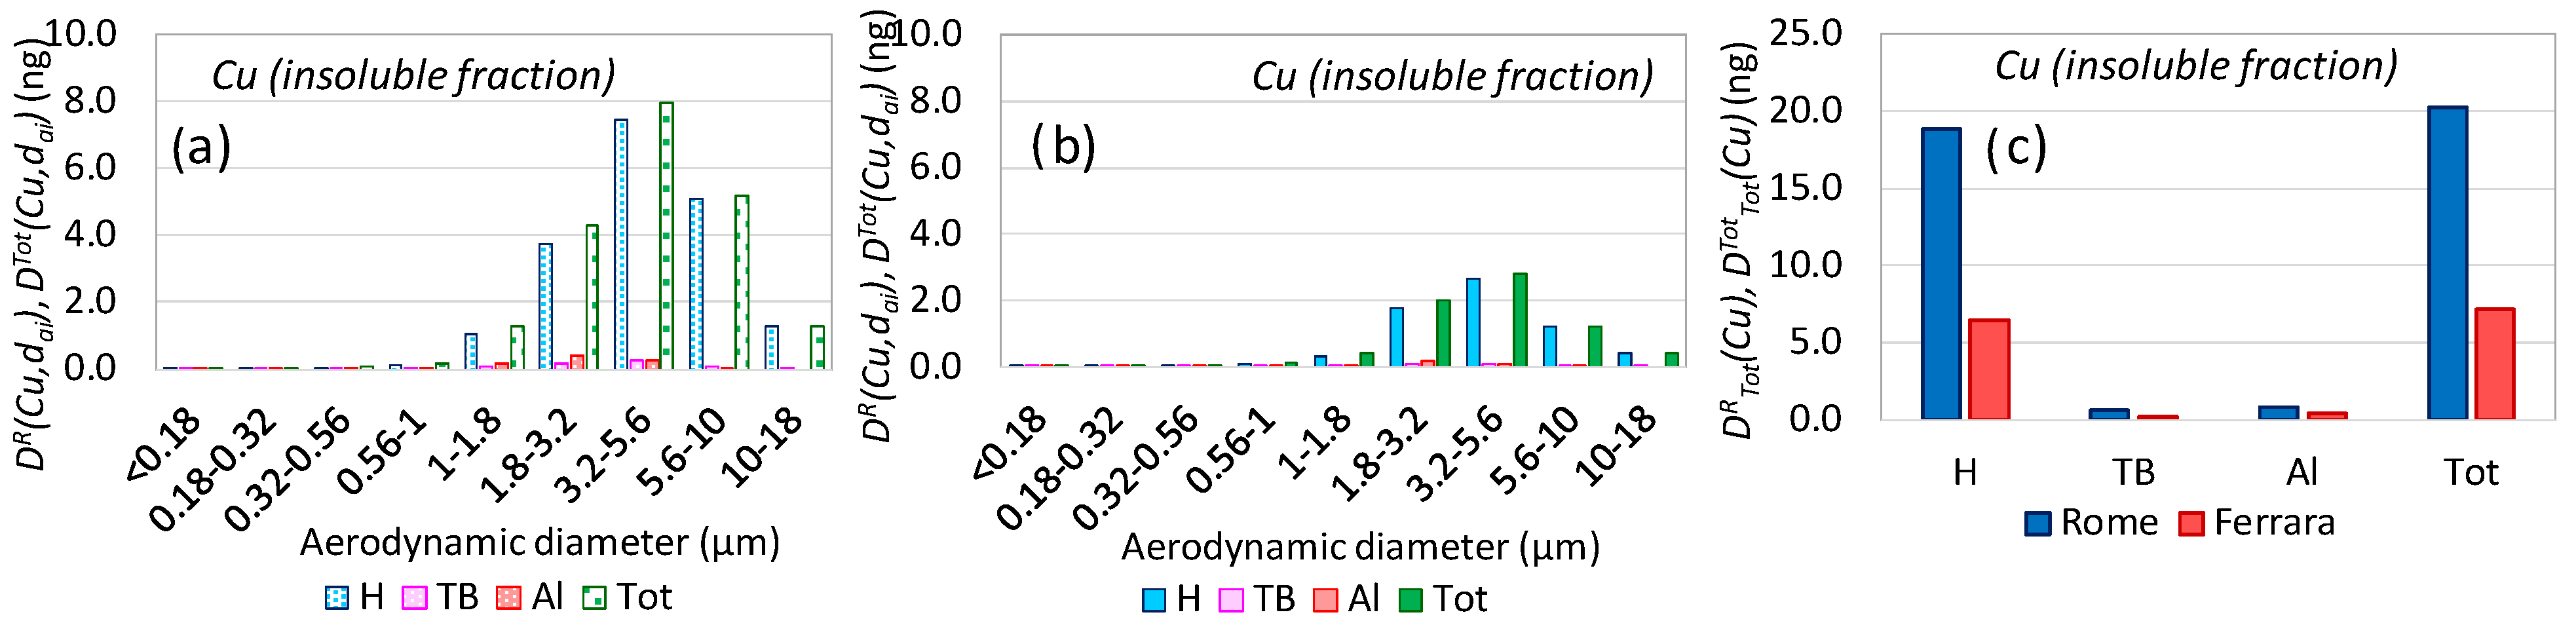
3.2. Aerosol Respiratory Doses from Brake Pads Abrasion
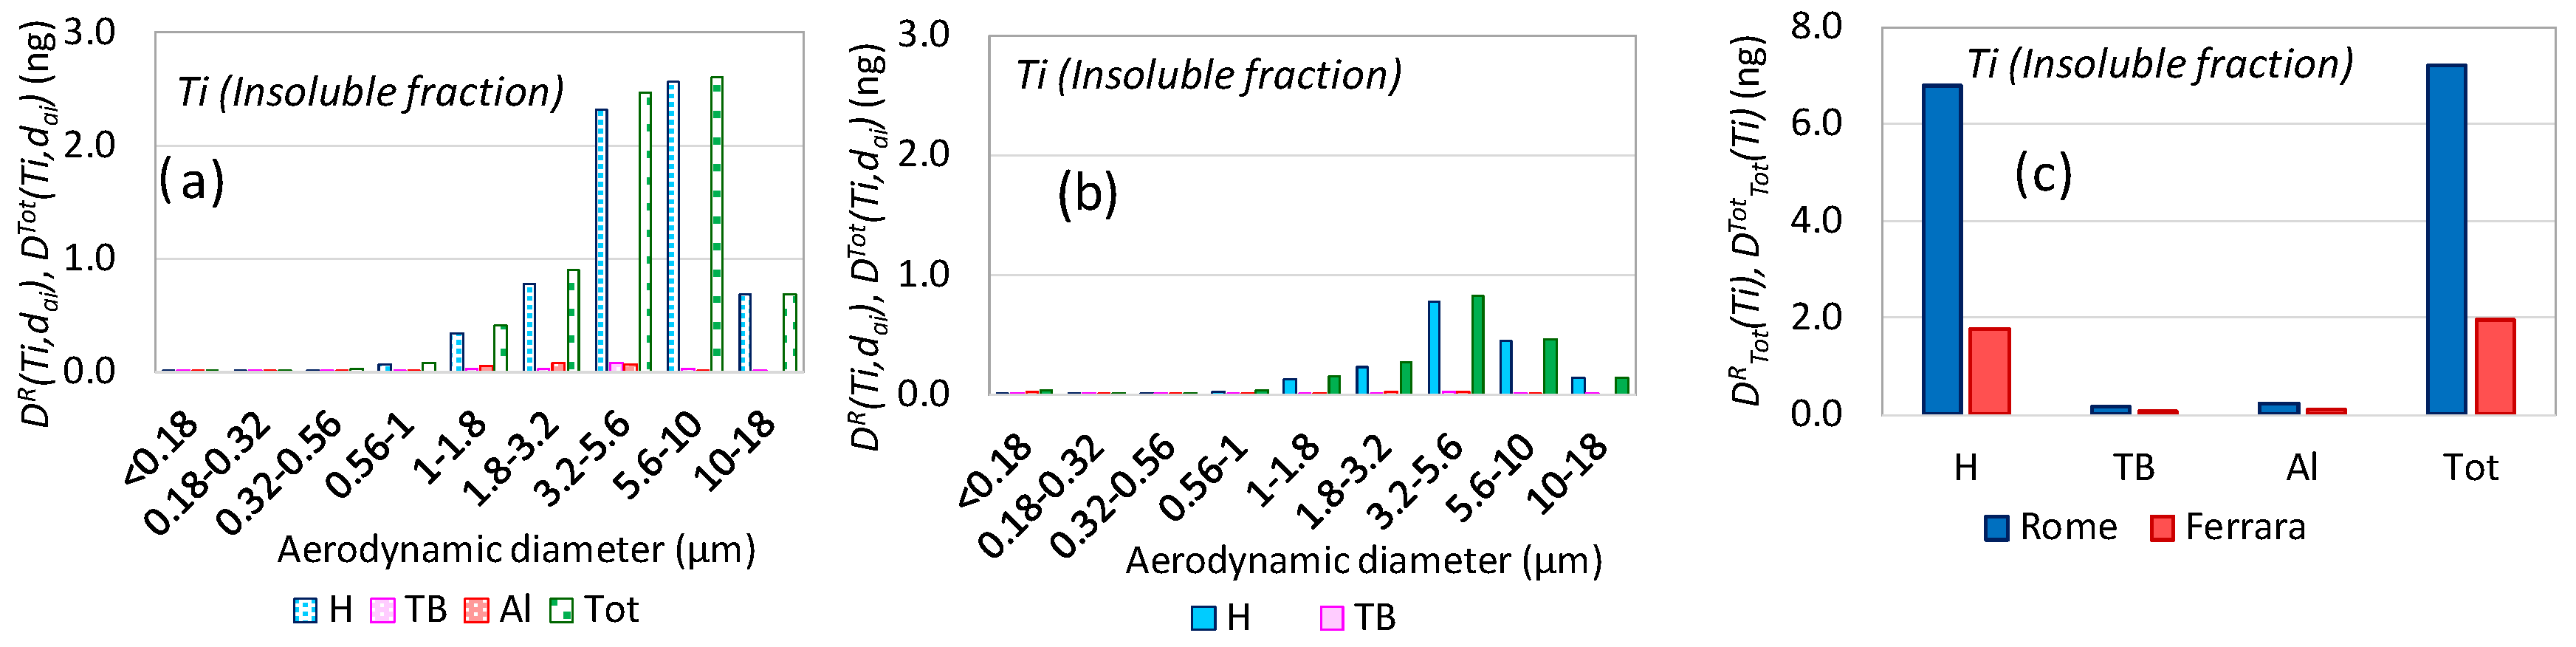
3.3. Aerosol Respiratory Doses from Soil Dust Resuspension
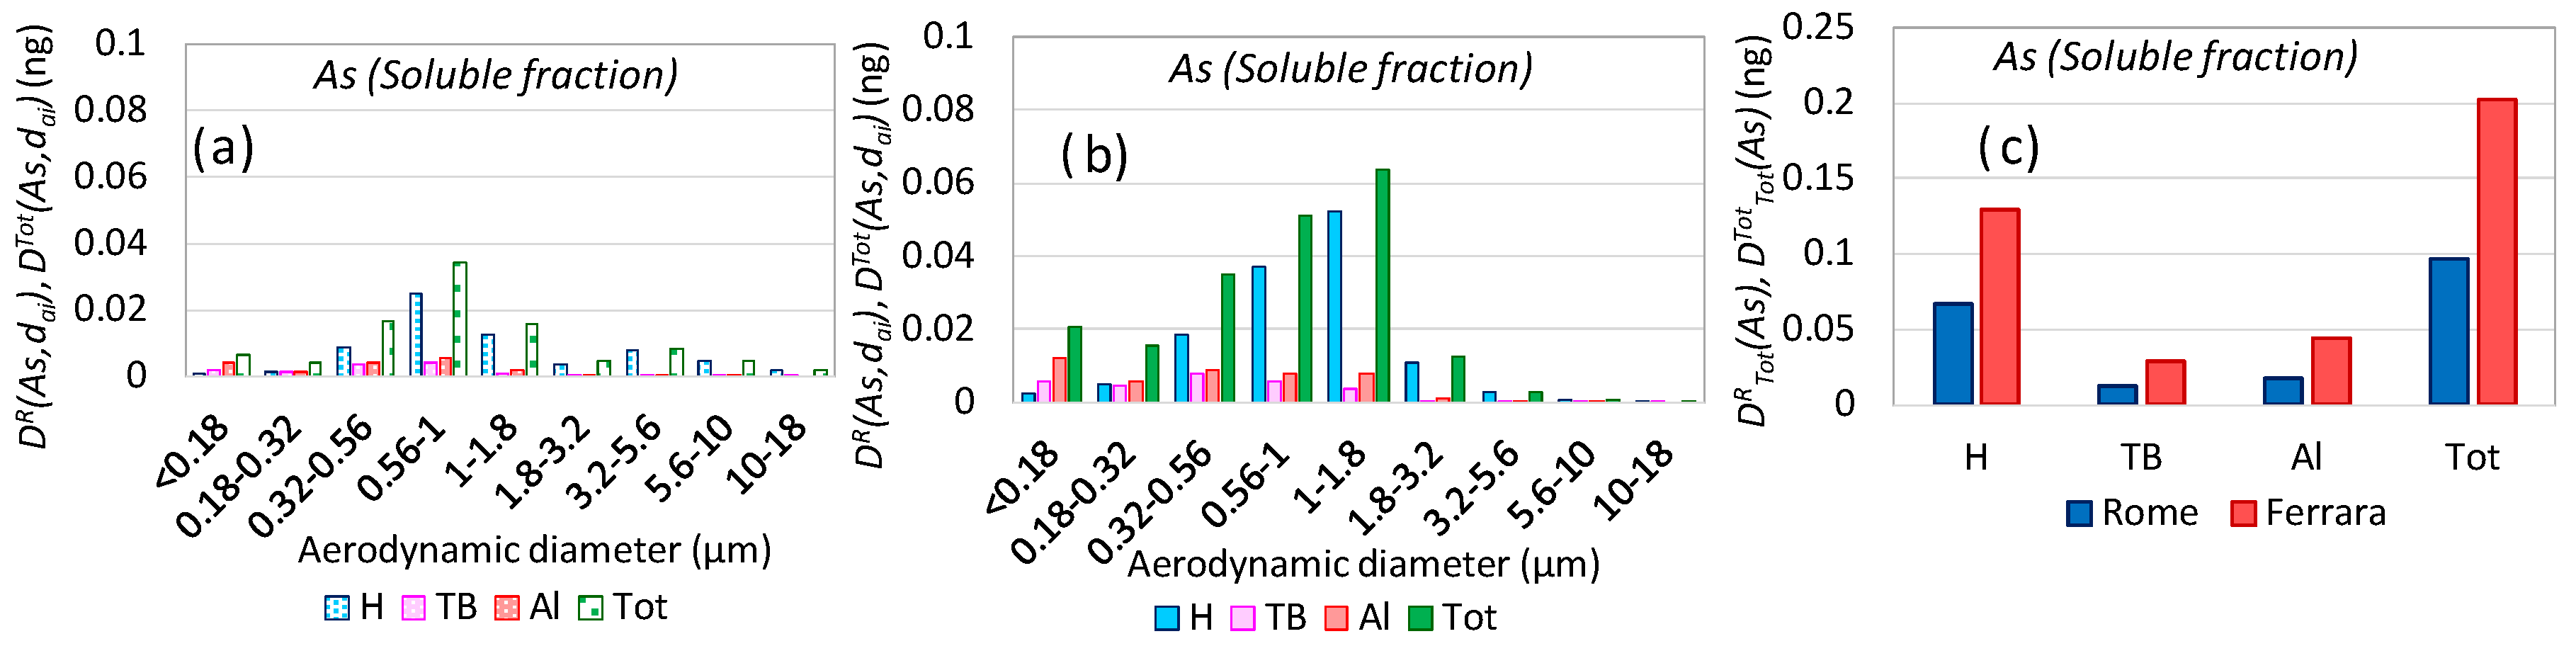
3.4. Aerosol Respiratory Doses from Industrial Emissions
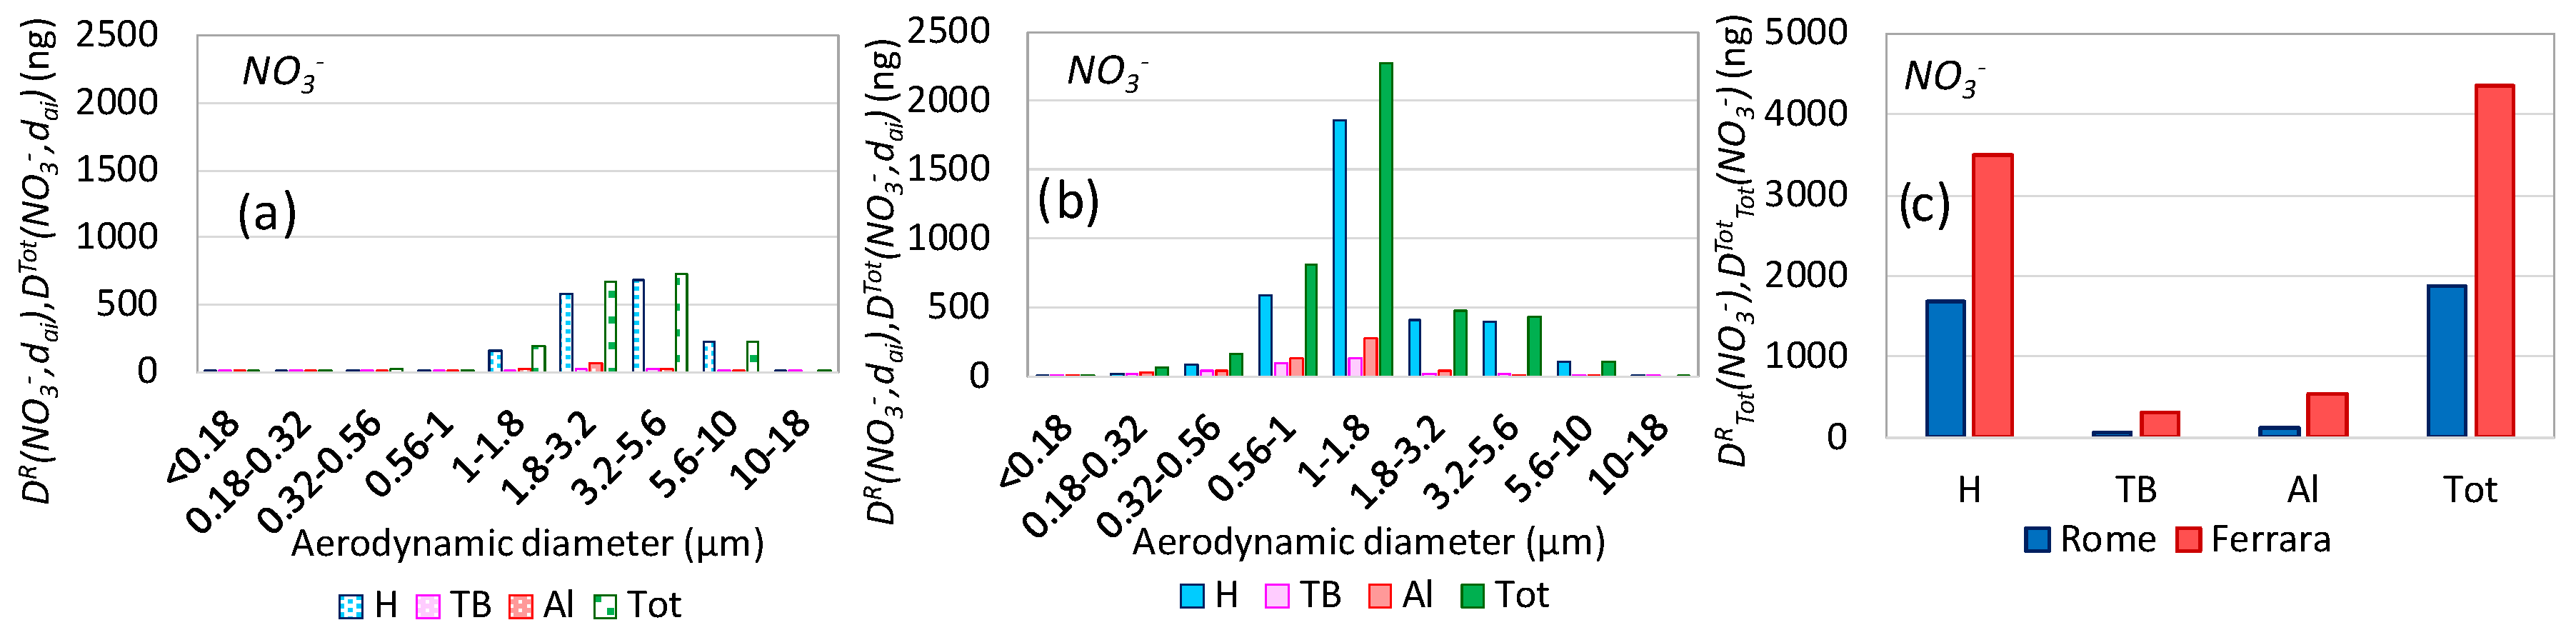
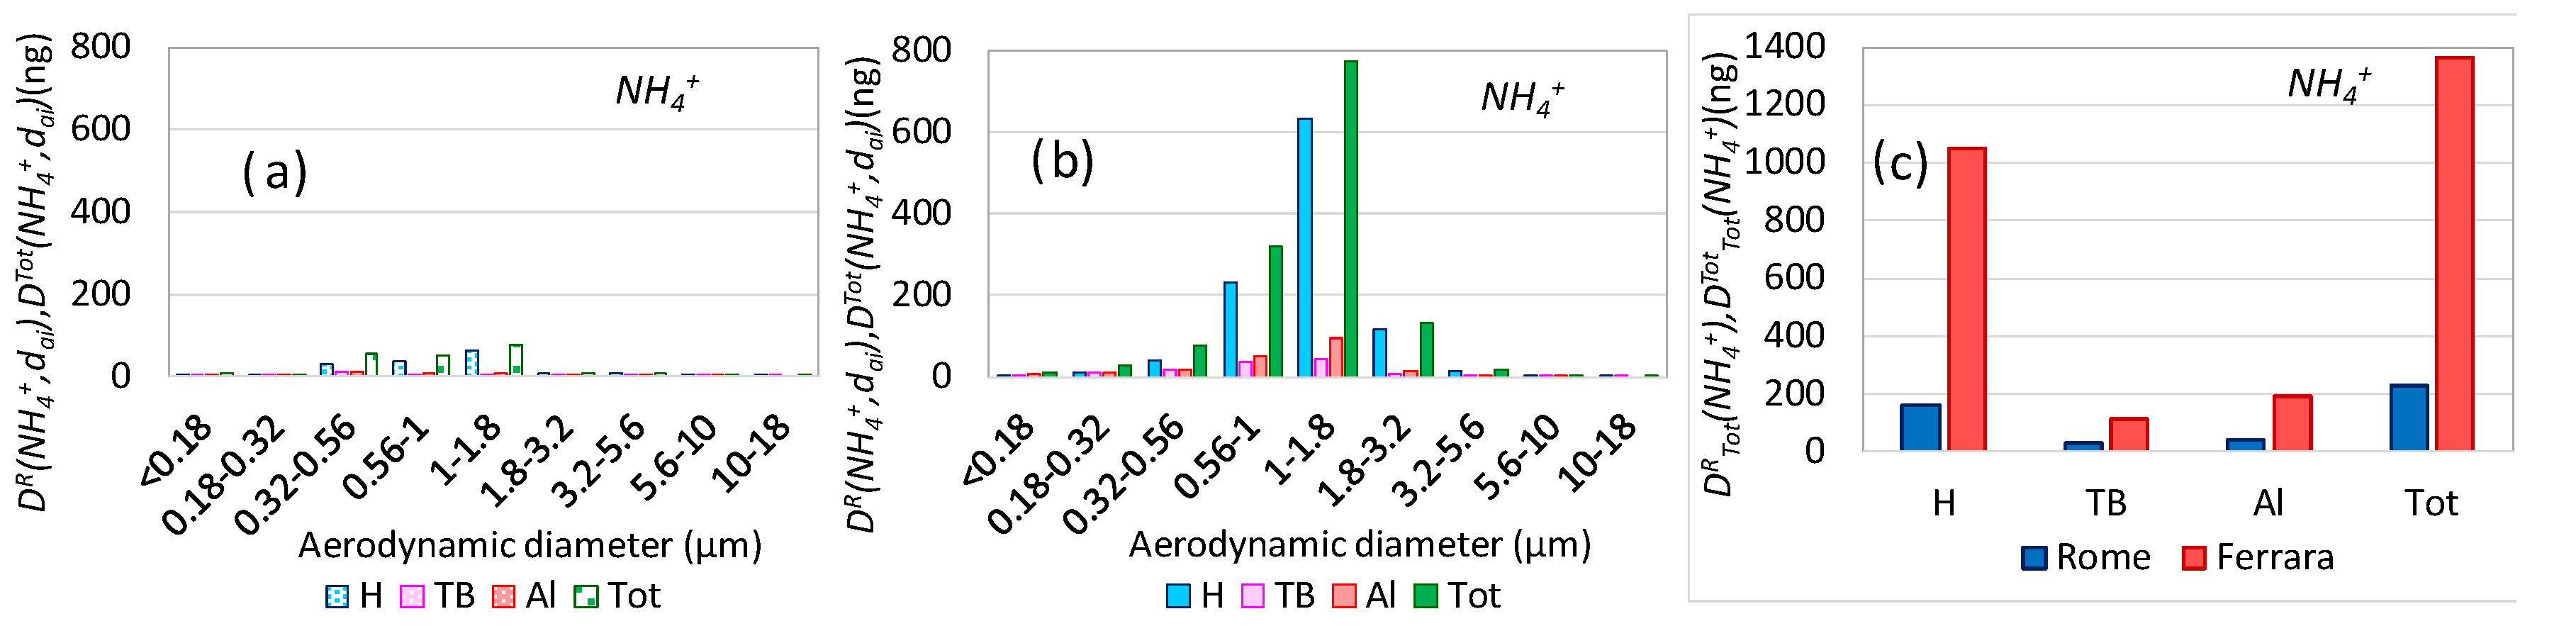
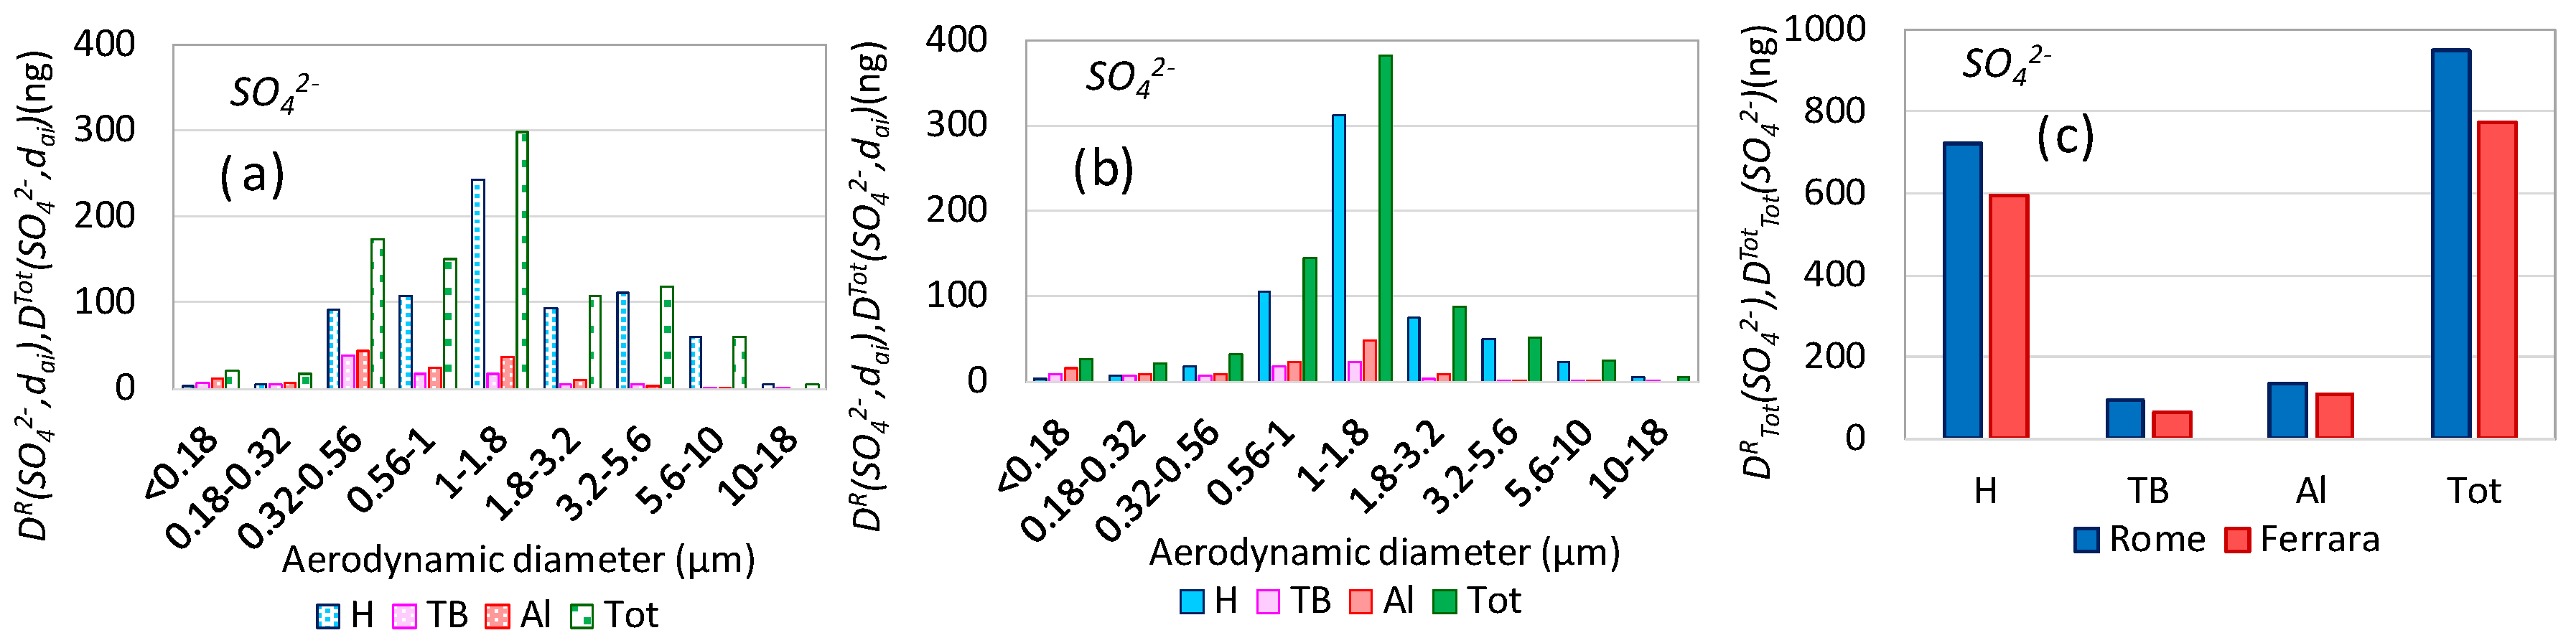
3.5. Aerosol Respiratory Doses from Secondary Inorganic Aerosol
3.6. Aerosol Respiratory Doses from Biomass Burning
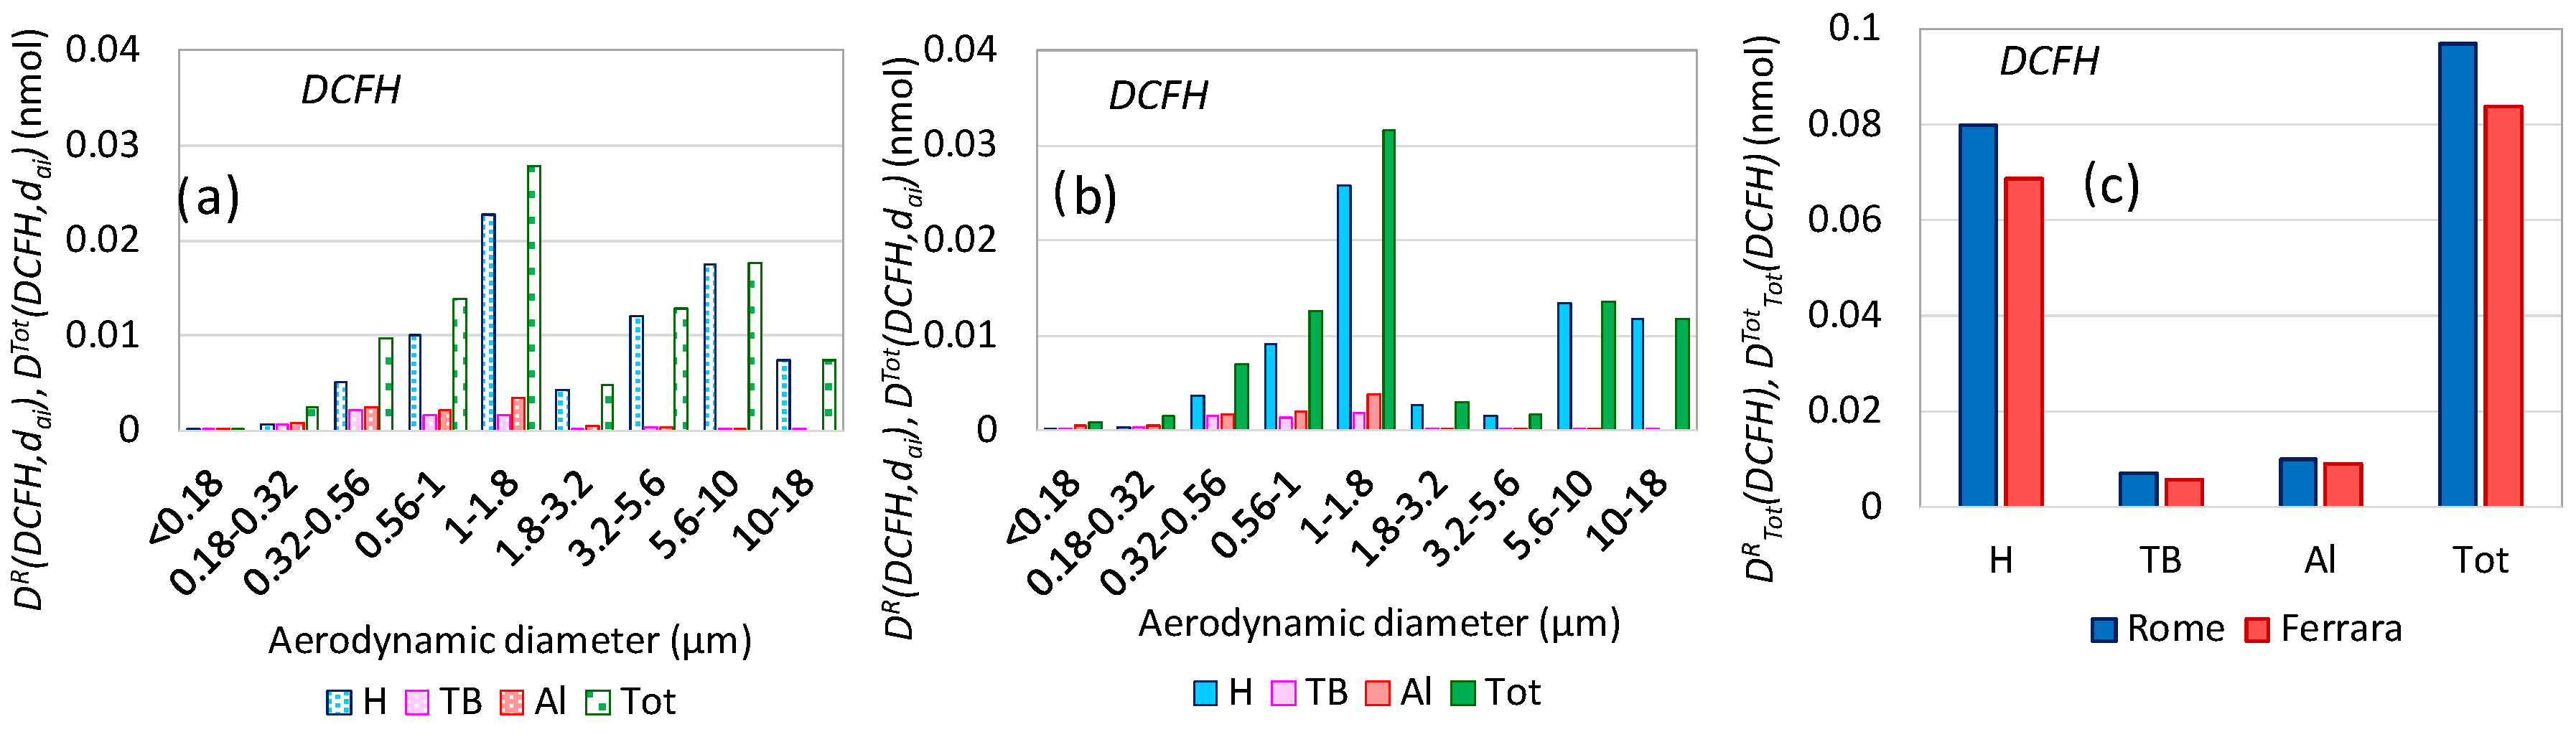
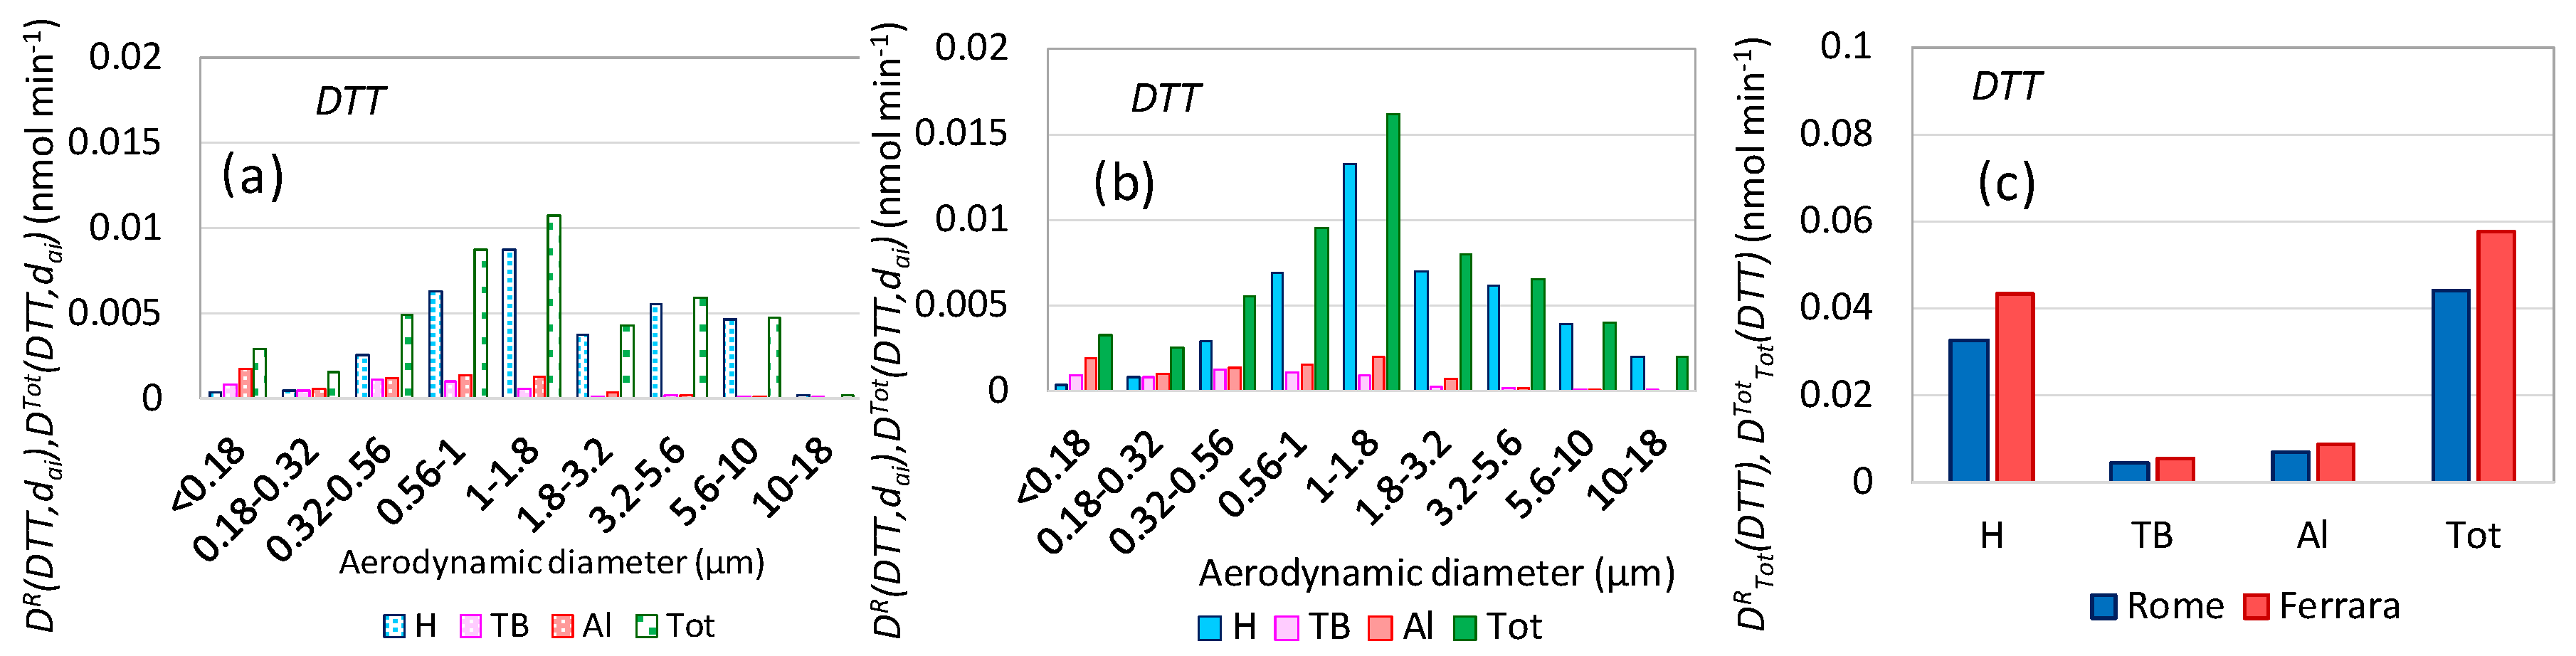
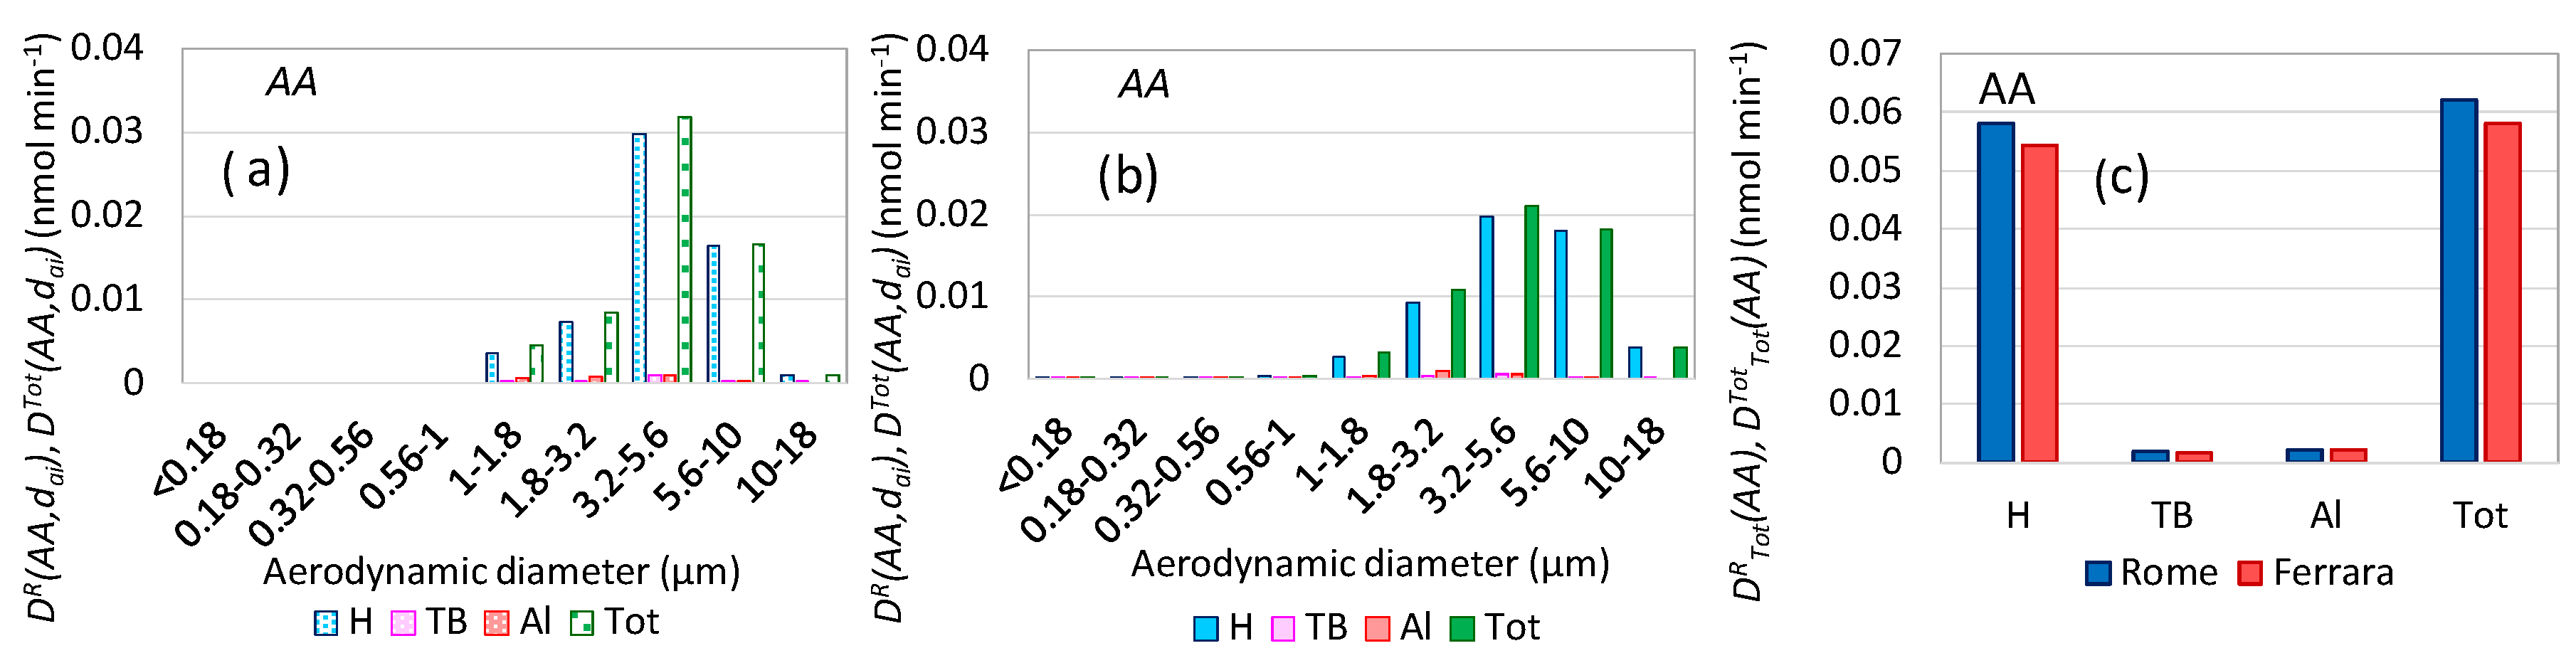
3.7. Oxidative Potential Respiratory Doses
4. Conclusions
Supplementary Materials
Author Contributions
Funding
Acknowledgments
Conflicts of Interest
References
- Hamanaka, R.B.; Mutlu, G.M. Particulate matter air pollution: Effects on the cardiovascular system. Front. Endocrinol. 2018, 9, 680. [Google Scholar] [CrossRef] [Green Version]
- Abdolahnejad, A.; Jafari, N.; Mohammadi, A.; Miri, M.; Hajizadeh, Y.; Nikoonahad, A. Cardiovascular, respiratory, and total mortality ascribed to PM10 and PM2.5 exposure in Isfahan, Iran. J. Educ. Health Promot. 2017, 6, 109. [Google Scholar] [CrossRef]
- Anderson, J.O.; Thundiyil, J.G.; Stolbach, A. Clearing the air: A review of the effects of particulate matter air pollution on human health. J. Med. Toxicol. 2012, 8, 166–175. [Google Scholar] [CrossRef] [PubMed] [Green Version]
- Li, Z.; Tang, Y.; Song, X.; Lazar, L.; Li, Z.; Zhao, J. Impact of ambient PM2.5 on adverse birth outcome and potential molecular mechanism. Ecotoxicol. Environ. Saf. 2019, 169, 248–254. [Google Scholar] [CrossRef] [PubMed]
- IARC. Working Group on the Evaluation of Carcinogenic Risks to Humans. Outdoor Air Pollution. IARC Monogr. Eval. Carcinog. Risks Hum. 2016, 109, 9. [Google Scholar]
- Fang, T.; Lakey, P.S.J.; Weber, R.J.; Shiraiwa, M. Oxidative potential of particulate matter and generation of reactive oxygen species in epithelial lining fluid. Environ. Sci. Technol. 2019. [Google Scholar] [CrossRef] [PubMed]
- Bates, J.T.; Fang, T.; Verma, V.; Zeng, L.; Weber, R.J.; Tolbert, P.E.; Abrams, J.Y.; Sarnat, S.E.; Klein, M.; Mulholland, J.A.; et al. Review of acellular assays of ambient particulate matter oxidative potential: Methods and relationships with composition, sources, and health effects. Environ. Sci. Technol. 2019, 53, 4003–4019. [Google Scholar] [CrossRef]
- Manigrasso, M.; Protano, C.; Vitali, M.; Avino, P. Where do ultrafine particles and nano-sized particles come from? J. Alzheimers Dis. 2019, 68, 1371–1390. [Google Scholar] [CrossRef]
- EPA, U. Air Quality Criteria for Particulate Matter (Final Report, Oct 2004); Environmental Protection Agency: Washington, DC, USA, 2004.
- Manigrasso, M.; Vitali, M.; Protano, C.; Avino, P. Ultrafine particles in domestic environments: Regional doses deposited in the human respiratory system. Environ. Int. 2018, 118, 134–145. [Google Scholar] [CrossRef]
- Simonetti, G.; Conte, E.; Perrino, C.; Canepari, S. Oxidative potential of size-segregated PM in an urban and an industrial area of Italy. Atmos. Environ. 2018, 187, 292–300. [Google Scholar] [CrossRef]
- Canepari, S.; Perrino, C.; Astolfi, M.L.; Catrambone, M.; Perret, D. Determination of soluble ions and elements in ambient air suspended particulate matter: Inter-technique comparison of XRF, IC and ICP for sample-by-sample quality control. Talanta 2009, 77, 1821–1829. [Google Scholar] [CrossRef] [PubMed]
- Astolfi, M.L.; Marconi, E.; Protano, C.; Vitali, M.; Schiavi, E.; Mastromarino, P.; Canepari, S. Optimization and validation of a fast digestion method for the determination of major and trace elements in breast milk by ICP-MS. Anal. Chim. Acta 2018, 1040, 49–62. [Google Scholar] [CrossRef] [PubMed]
- Crobeddu, B.; Aragao-Santiago, L.; Bui, L.C.; Boland, S.; Squiban, A.B. Oxidative potential of particulate matter 2.5 as predictive indicator of cellular stress. Environ. Pollut. 2017, 230, 125–133. [Google Scholar] [CrossRef] [PubMed]
- Manigrasso, M.; Protano, C.; Vitali, M.; Avino, P. Nanoparticle behaviour in an urban street canyon at different heights and implications on indoor respiratory doses. Atmosphere 2019, 10, 772. [Google Scholar] [CrossRef] [Green Version]
- Asgharian, B.; Hofmann, W.; Bergmann, R. Particle deposition in a multiple path model of the human lung. Aerosol Sci. Technol. 2009, 34, 332–339. [Google Scholar] [CrossRef]
- ICRP. Publication 66: Human Respiratory Tract Model for Radiological Protection, International Commission on Radiological Protection (ICRP); Elsevier Science: Oxford, UK, 1994. [Google Scholar]
- Canepari, S.; Astolfi, M.L.; Catrambone, M.; Frasca, D.; Marcoccia, M.; Marcovecchio, F.; Massimi, L.; Rantica, E.; Perrino, C. A combined chemical/size fractionation approach to study winter/summer variations, ageing and source strength of atmospheric particles. Environ. Pollut. 2019, 253, 19–28. [Google Scholar] [CrossRef]
- Vecchi, R.; Marcazzan, G.; Valli, G.; Ceriani, M.; Antoniazzi, C. The role of atmospheric dispersion in the seasonal variation of PM1 and PM2.5 concentration and composition in the urban area of Milan (Italy). Atmos. Environ. 2004, 38, 4437–4446. [Google Scholar] [CrossRef]
- Canepari, S.; Astolfi, M.L.; Farao, C.; Maretto, M.; Frasca, D.; Marcoccia, M.; Perrino, C. Seasonal variations in the chemical composition of particulate matter: A case study in the Po Valley. Part II: Concentration and solubility of micro-and trace-elements. Environ. Sci. Pollut. Res. 2014, 21, 4010–4022. [Google Scholar] [CrossRef]
- Sanchez, T.R.; Perzanowski, M.; Graziano, J.H. Inorganic arsenic and respiratory health, from early life exposure to sex-specific effects: A systematic review. Environ Res. 2016, 147, 537–555. [Google Scholar] [CrossRef] [Green Version]
- Public Health England. Nickel, Toxicological Overview, Toxicology Department CRCE, PHE 2009, Version 1; Public Health England: London, UK, 2009.
- Wilbur, S.; Abadin, H.; Fay, M.; Yu, D.; Tencza, B.; Ingerman, L.; Klotzbach, J.; James, S. Toxicological Profile for Chromium; Atlanta (GA) Agency for Toxic Substances and Disease Registry (US): Atlanta, GA, USA, 2012.
- Manigrasso, M.; Abballe, F.; Jack, R.F.; Avino, P. Time-resolved measurement of the ionic fraction of atmospheric fine particulate matter. J. Chromatogr. Sci. 2010, 48, 549–552. [Google Scholar] [CrossRef] [Green Version]
- Perrino, C.; Canepari, S.; Catrambone, M.; Dalla Torre, S.; Rantica, E.; Sargolini, T. Influence of natural events on the concentration and composition of atmospheric particulate matter. Atmos. Environ. 2009, 43, 4766–4779. [Google Scholar] [CrossRef]
- Corsini, E.; Marinovich, M.; Vecchi, R. Ultrafine particles from residential biomass combustion: A review of experimental data and toxicological response. Int. J. Mol. Sci. 2019, 20, 4992. [Google Scholar] [CrossRef] [PubMed] [Green Version]
- Simonetti, G.; Conte, E.; Massimi, L.; Frasca, D.; Perrino, C.; Canepari, S. Oxidative potential of particulate matter components generated by specific emission sources. J. Aerosol Sci. 2018, 126, 99–109. [Google Scholar] [CrossRef]
- Gonzalez, D.H.; Cala, C.K.; Peng, Q.; Paulson, S.E. HULIS enhancement of hydroxyl radical formation from Fe (II): Kinetics of fulvic acid–Fe (II) complexes in the presence of lung antioxidants. Environ. Sci. Technol. 2017, 51, 7676–7685. [Google Scholar] [CrossRef]
- Campbell, S.J.; Utinger, B.; Lienhard, D.M.; Paulson, S.E.; Shen, J.; Griffiths, P.T.; Stell, A.C.; Kalberer, M. Development of a Physiologically Relevant Online Chemical Assay To Quantify Aerosol Oxidative Potential. Anal. Chem. 2019, 91, 13088–13095. [Google Scholar] [CrossRef]
- Godri, K.J.; Harrison, R.M.; Evans, T.; Baker, T.; Dunster, C.; Mudway, I.S.; Kelly, F.J. Increased oxidative burden associated with traffic component of ambient particulate matter at roadside and urban background schools sites in London. PLoS ONE 2011, 6, e21961. [Google Scholar] [CrossRef] [Green Version]
- Fang, T.; Zeng, L.; Gao, D.; Verma, V.; Stefaniak, A.B.; Weber, R.J. Ambient size distributions and lung deposition of aerosol dithiothreitol-measured oxidative potential: Contrast between soluble and insoluble particles. Environ. Sci. Technol. 2017, 51, 6802–6811. [Google Scholar] [CrossRef]
- Canepari, S.; Farao, C.; Marconi, E.; Giovannelli, C.; Perrino, C. Qualitative and quantitative determination of water in airborne particulate matter. Atmos. Chem. Phys. 2013, 13, 1193–1202. [Google Scholar] [CrossRef] [Green Version]
- Manigrasso, M.; Vernale, C.; Avino, P. Traffic aerosol lobar doses deposited in the human respiratory system. Environ. Sci. Pollut. Res. Int. 2017, 24, 13866–13873. [Google Scholar] [CrossRef]
- Oberdörster, G.; Oberdörster, E.; Oberdörster, J. Nanotoxicology: An emerging discipline evolving from studies of ultrafine particles. Environ. Health Perspect. 2005, 113, 823–839. [Google Scholar] [CrossRef]
- Wang, S.; Ye, J.; Soong, R.; Wu, B.; Yu, L.; Simpson, A.J.; Chan, A.W. Relationship between chemical composition and oxidative potential of secondary organic aerosol from polycyclic aromatic hydrocarbons. Atmos. Chem. Phys. 2018, 18, 3987–4003. [Google Scholar] [CrossRef] [Green Version]
- Shafer, M.M.; Perkins, D.A.; Antkiewicz, D.S.; Stone, E.A.; Quraishi, T.A.; Schauer, J.J. Reactive oxygen species activity and chemical speciation of size-fractionated atmospheric particulate matter from Lahore, Pakistan: An important role for transition metals. J. Environ. Monit. 2010, 12, 704–715. [Google Scholar] [CrossRef] [PubMed]
- Rodrigo-Moreno, A.; Poschenrieder, C.; Shabala, S. Transition metals: A double edge sward in ROS generation and signaling. Plant Signal Behav. 2013, 8, e23425. [Google Scholar] [CrossRef] [PubMed] [Green Version]
- Lin, P.; Yu, J.Z. Generation of reactive oxygen species mediated by humic-like substances in atmospheric aerosols. Environ. Sci. Technol. 2011, 45, 10362–10368. [Google Scholar] [CrossRef] [PubMed]
- Lin, M.; Yu, J.Z. Effect of metal-organic interactions on the oxidative potential of mixtures of atmospheric humic-like substances and copper/manganese as investigated by the dithiothreitol assay. Sci. Total Environ. 2019, 697, 134012. [Google Scholar] [CrossRef]
- Paris, R.; Desboeufs, K.V. Effect of atmospheric organic complexation on iron-bearing dust solubility. Atmos. Chem. Phys. 2013, 13, 4895–4905. [Google Scholar] [CrossRef] [Green Version]


© 2019 by the authors. Licensee MDPI, Basel, Switzerland. This article is an open access article distributed under the terms and conditions of the Creative Commons Attribution (CC BY) license (http://creativecommons.org/licenses/by/4.0/).
Share and Cite
Manigrasso, M.; Simonetti, G.; Astolfi, M.L.; Perrino, C.; Canepari, S.; Protano, C.; Antonucci, A.; Avino, P.; Vitali, M. Oxidative Potential Associated with Urban Aerosol Deposited into the Respiratory System and Relevant Elemental and Ionic Fraction Contributions. Atmosphere 2020, 11, 6. https://0-doi-org.brum.beds.ac.uk/10.3390/atmos11010006
Manigrasso M, Simonetti G, Astolfi ML, Perrino C, Canepari S, Protano C, Antonucci A, Avino P, Vitali M. Oxidative Potential Associated with Urban Aerosol Deposited into the Respiratory System and Relevant Elemental and Ionic Fraction Contributions. Atmosphere. 2020; 11(1):6. https://0-doi-org.brum.beds.ac.uk/10.3390/atmos11010006
Chicago/Turabian StyleManigrasso, Maurizio, Giulia Simonetti, Maria Luisa Astolfi, Cinzia Perrino, Silvia Canepari, Carmela Protano, Arianna Antonucci, Pasquale Avino, and Matteo Vitali. 2020. "Oxidative Potential Associated with Urban Aerosol Deposited into the Respiratory System and Relevant Elemental and Ionic Fraction Contributions" Atmosphere 11, no. 1: 6. https://0-doi-org.brum.beds.ac.uk/10.3390/atmos11010006