Article

Health Risk Assessment of the Levels of BTEX in Ambient Air of One Urban Site Located in Leon, Guanajuato, Mexico during Two Climatic Seasons

by
Julia Griselda Cerón Bretón
1,*,
Rosa María Cerón Bretón
1,
Stephanie Martínez Morales
1,
Jonathan D. W. Kahl
2,
Claudio Guarnaccia
3,
Reyna del Carmen Lara Severino
1,
Marcela Rangel Marrón
1,
Evangelina Ramírez Lara
4,
María de la Luz Espinosa Fuentes
5,
Martha Patricia Uc Chi
1 and
Gerardo Licona Sánchez
1
1
Facultad de Química, Universidad Autónoma del Carmen, Calle 56 Num. 4 Esq. Ave. Concordia, Col. Benito Juárez, Ciudad del Carmen C.P. 24180, Campeche, Mexico
2
Department of Mathematical Sciences, Atmospheric Science Group, University of Wisconsin-Milwaukee, 2200 E. Kenwood Blvd, Milwaukee, WI 53211, USA
3
Civil Engineering Department, University of Salerno, Via Giovanni Paolo II, 132 84084 Fisciano (SA), Italy
4
Facultad de Ciencias Químicas, Universidad Autónoma de Nuevo León, Avenida Universidad s/n, Ciudad Universitaria, San Nicolás de los Garza C.P. 66455, N.L., Mexico
5
Laboratorio de Aerosoles Atmosféricos, Centro de Ciencias de la Atmósfera, Universidad Nacional Autónoma de Mexico, Investigación Científica s/n, Ciudad de Mexico 04510, CDMX, Mexico
*
Author to whom correspondence should be addressed.
Submission received: 20 November 2019 / Revised: 22 January 2020 / Accepted: 27 January 2020 / Published: 5 February 2020
(This article belongs to the Special Issue Exposure Assessment of Air Pollution)

Abstract

:
Levels of BTEX (benzene, toluene, ethylbenzene, and p-xylene) were determined in ambient air of an urban site located at the center of Mexico (Leon City in Guanajuato State) during two climatic seasons of 2018 (summer and autumn). Ethylbenzene (11.86 µg m−3) and toluene (11.85 µg m−3) showed the highest median concentrations during the study period. BTEX concentrations did not show a diurnal pattern but a seasonal trend was observed for benzene and toluene at a significant level of α = 0.05. Bi-variate and multivariate analysis showed significant positive correlations (at α = 0.05) among BTEX (excepting benzene), indicating common sources for toluene, ethylbenzene, and p-xylene and a different origin for benzene. A meteorological study was also conducted in order to determine the origin of air masses that could influence the BTEX concentrations in the study site. Finally, it was found that all BTEX species presented hazard quotient values (HQs) <1, indicating that there is no risk of non-cancer during the studied period. Lifetime cancer risk due to benzene exposure for the adult and child populations studied were estimated to be 7 in 1,000,000 and 1 in 100,000, respectively.

1. Introduction

Air quality in urban areas can be degraded by the presence of different types of air pollutants that, depending on their concentrations and toxic potential, may affect the health of the population [1]. Sources of these air pollutants include the use of solvents, vehicular traffic, biomass burning, oil and gas combustion processes, forest fires, and industrial emissions, among others [2]. Atmospheric monitoring is one of the main indicators of air quality, in addition to being a management tool for implementing prevention and control actions in order to protect the population’s health [3]. Air pollutants are typically classified as Particulate Matter (PM10 and PM2.5) and gaseous pollutants. Gaseous pollutants include sulfur dioxide (SO2), carbon monoxide (CO), nitrogen dioxide (NO2), organic compounds (VOCs), and ozone (O3), among others. These compounds (excepting VOCs) are considered criteria air pollutants and are regulated through national standards that establish their maximum permissible levels in ambient air in order to protect human health. A category of polluting substances of increasing importance in recent decades are volatile organic compounds (VOCs), which are usually hydrocarbons in gaseous state at room temperature. They are released by burning fuels such as gasoline, wood, coal, or natural gas, and from the evaporation of solvents, paints, glues, and other products used and stored in homes and workplaces. The negative impact of these compounds on the environment and on the public health has become a matter of concern, since some of them are carcinogenic and toxic to humans [4,5]. Within the VOCs there is a subgroup called BTEX, which includes benzene alkyl-derivatives (benzene, toluene, ethylbenzene and xylenes). In the atmosphere, BTEX are mainly degraded by photolysis and/or chemical reactions with reactive species such as OH radical (daytime reactions) and nitrate radicals (nighttime reactions). In both reactions, free radicals such as organic peroxy (RO2) and hydroperoxy (HO2) are formed, which favor the formation of NO in NO2, contributing to increased tropospheric ozone. On the other hand, BTEX also play a very important role in atmospheric chemistry. They are considered precursors in the formation of other highly oxidizing substances in addition to ozone, such as peroxyacetyl nitrate (PAN), as well as contributing to the formation of secondary organic aerosols (SOA) [6,7]. These compounds are known to be toxic. The International Agency for Research on Cancer (IARC) has classified benzene as “carcinogenic to humans” (Group 1) based on sufficient evidence that this compound causes acute myeloid leukemia, while toluene has been classified within Group 3 (not classifiable as to its carcinogenicity to humans) [5,8]. Despite the importance of BTEX in atmospheric chemistry and their effects on human health, in Mexico there is no regulation that controls their concentrations in ambient air. Most of the studies about BTEX in ambient air as well as the establishment of control policies of these pollutants have been focused on the metropolitan area of Mexico City and there are not enough studies about these pollutants in other metropolitan areas of Mexico.
This study is focused on one of the most important urban and industrial areas in the central region of the country, Leon, located in Guanajuato state in central Mexico. Leon belongs to Group 2 (metropolitan areas and cities with more than 1 million and less than 4 million inhabitants) and is one of the five most important municipalities in the state of Guanajuato. Additionally, according to the National Institute of Statistics, Geography and Informatics (INEGI) [9], Leon is the most populated municipality in the state and represents an important health care center (high specialty and diagnosis center), where higher education and research institutions are also located, and where industrial, business, and tourism activities are carried out. The present work addresses air quality, considering criteria pollutants and BTEX concentrations, in the urban-industrial site of Leon city during summer and autumn 2018.

2. Materials and Methods

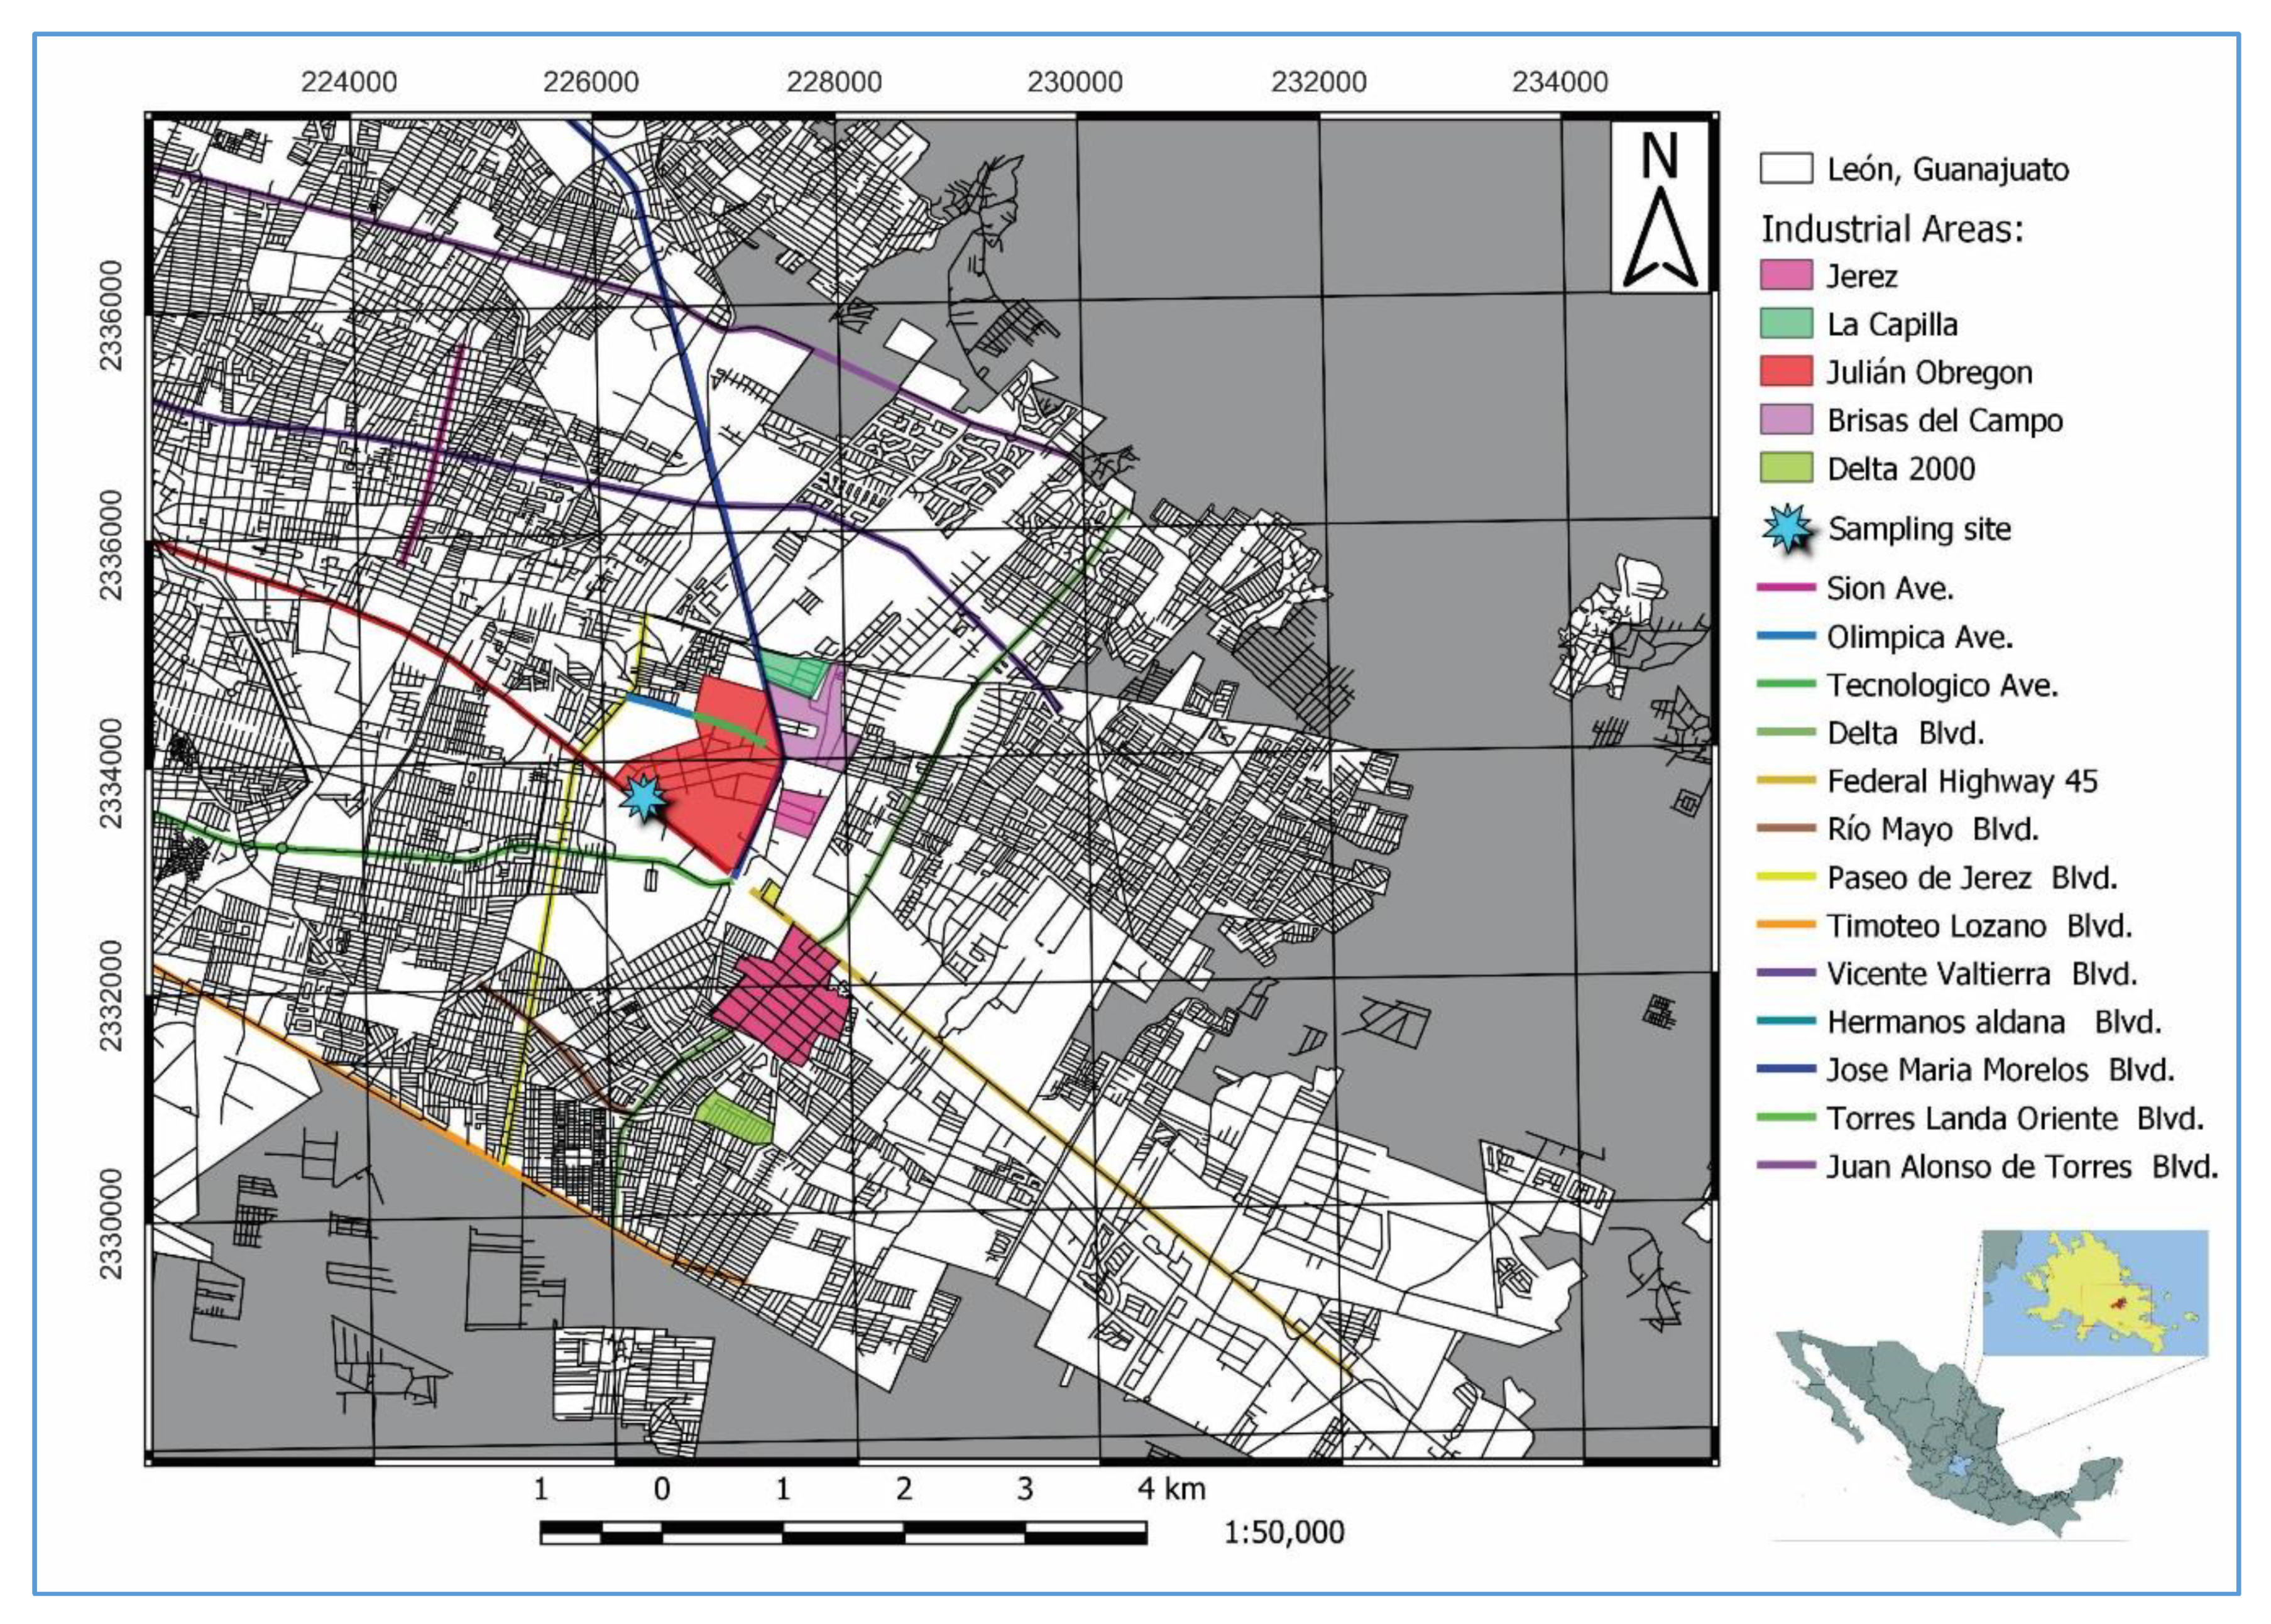
2.1. Monitoring Site

Leon, Guanajuato is located at 21°07′11″ N and 101°40′50″ W. According to the 2015 census survey [6] it has a population of 1,578,626 inhabitants with a population density of 191 people/km2, making Leon the most populous city in the state. This municipality is part of the Metropolitan Area of Leon, which together with the surrounding municipalities (Silao de la Victoria, San Francisco del Rincon, and Purisima del Rincon) forms the seventh largest metropolis in the country. It is a city with an entrepreneurial vocation—its leadership in the production of leather goods has given it the merit of being called “The Leather and Footwear World Capital”—but the automotive, mining, and food industries have also prospered. For this reason the air quality in the city is expected to be degraded as a result of urban development.
Samples were obtained at the CICEG monitoring station, part of the Guanajuato state government’s atmospheric monitoring network (Figure 1). The sampling station is located near industrial areas, high-density housing, and mixed-use shops and services. Around 82,391 people live in this area, of which 20,886 (25.35%) are children, and with a high population density of 6556 people/km2 in comparison to that of the entire city.

2.2. Sampling Methodology

The BTEX were collected using SKC glass tubes model 226-01 Anasorb CSC (70 mm long, 4 mm inner diameter), filled with activated carbon and packed in two sections (one with 50 mg and the second section with 100 mg). Ambient air was passed through the tubes using an SKC vacuum pump model XR PCXR4 at a flow rate of 200 mL/min, according to the MTA/MA-030/A92 [10]. After each sampling, the glass tubes were covered in foil and refrigerated for later laboratory analysis. Three daily samples were taken during a week, in the morning (7:00–8:30 h), during midday (13:30–15:00 h), and in the afternoon (17:30–19:00 h). Sampling was conducted during two climatic seasons: summer (6–13 August 2018) and autumn (5–14 October 2018), thus obtaining 48 samples in total.

2.3. Analysis of the Samples by Gas Chromatography–Flame Ionization Detection (BTEX Determination)

The content of each of the sampling tubes was poured into 2 mL amber vials and desorbed with 1 mL of HPLC-grade carbon disulfide, stirring for 5 min to ensure maximum desorption [10]. The vials were kept refrigerated for 24 h, and subsequently analyzed by gas chromatography (GC). A Thermoscientific brand TRACE GC model gas chromatograph was used, in splitless mode, using ultra high purity nitrogen as a carrier gas. The capillary column used was of the fused methyl silica type, with a film thickness of 0.5 µm, 30 m long × 0.32 mm in diameter. The samples were injected in duplicate and the BTEX measured were quantified by the external standard method, for which calibration curves were prepared at different concentrations, prepared from standard solutions. Seven-point calibration (0.10, 1.00, 5.00, 10.00, 20.00, 50.00, and 100.00 μg/mL) was performed using 99.98% Sigma Aldrich analytical reagents. R-square values for all BTEX calibration curves were higher than 0.998. The method detection limits for benzene, toluene, ethylbenzene, and p-xylene were 0.05, 0.06, 0.06, and 0.05 μg/mL, respectively.

2.4. Statistical Analysis

Descriptive, bivariate (Spearman correlation matrix) and multivariate principal component analysis (PCA) were performed using the XLSTAT version 2017 software [11]. PCA has been widely used in environmental studies to identify patterns in the data [12]. PCA results are generally presented in bi-plots or factor load tables to reveal correlations between observations. The information disclosed by PCA is useful to identify if a contaminant is secondary or primary, or to identify the specific source of air pollutants. Non-parametric Friedman tests (α = 0.05) were applied using variance analysis (ANOVA) in order to determine if there were significant differences between daytime sampling periods (morning, half day, and afternoon) and between climatic seasons (summer and autumn).

2.5. Meteorological Conditions

Meteorological parameters (temperature, atmospheric pressure, wind speed, wind direction, solar radiation, and relative humidity) were recorded during the study period by an automatic meteorological station (from the air quality monitoring network of Guanajuato state). Wind roses were constructed using the software WRPLOT View Version 8.0.2 2018 (from Lakes Environmental) in order to know the dominant and prevailing winds during the study period [13].

2.6. Air Criteria Pollutants

Concentrations of the criteria air pollutants CO, NO2, O3, PM10, and SO2 were measured during the study period. Table 1 shows general details of the measurement instruments used to monitor the criteria pollutants. These data were obtained from the air quality monitoring station shown in Figure 1 [14].

2.7. Health Risk Assessment

The health risks (cancer and non-cancer) associated with benzene by inhalation were determined according to the methodology described by Zhang and collaborators [15]. Daily exposure (E), the non-carcinogenic risk ratio (HQ), which considers respiratory and cardiovascular diseases derived from exposure to air pollutants, and the lifetime cancer risk (LTCR) were determined. LTCR represents the probability of developing cancer during the lifetime of the population of the study area and is compared to the U.S. EPA standard of 1 × 10⁻⁶ (1 in 1,000,000 chances of developing cancer in the lifetime).
Daily exposure (E) was calculated as
E = (C × IRa × DA)/BW
where E is the daily exposure expressed in mg/kg per day of an individual by inhalation and C (mg m−3) is the concentration of benzene in ambient air. IRa is the inhalation rate, being 0.83 m3 h−1 for adults and 0.87 m3 h−1 for children [15], DA is the exposure duration in an outdoor ambient according the typical activities (light activity: 16 h/day for adults and 10 h/day for children) [16] and BW is the body weight, being 65 kg for adults and 36 kg for children [17].
The lifetime cancer risk (LTCR) is calculated as
LTCR = E × SF
where SF is the slope factor (kg day/mg) of the inhalation unit risk for toxic substances when the exposure–carcinogenic effect is considered linear (See Table 2).
The non-cancer risk HQ, also called hazard quotient, was calculated as
HQ = CY/RfC
where CY is the average daily received concentration and RfC represents the inhalation reference concentration of specific air pollutants [19]. An HQ > 1 indicates that long-term exposure may cause adverse non-cancer health effects (respiratory and cardiovascular diseases). An HQ < 1 is considered as acceptable level. The inhalation reference concentrations values (RfC) for benzene [20], toluene [21], ethylbenzene [22] and p-xylene [23] were taken as 0.03, 5, 1, and 0.1 mg m−3, respectively. The overall potential for non-carcinogenic effects due to exposure to more than one chemical is determined as a hazard index (HI), which is the product of the hazard quotients (HQ) of all the individual chemicals.

3. Results

3.1. Diurnal and Seasonal Variation of BTEX and Meteorological Parameters at the Study Site

Descriptive statistics for BTEX during the summer and autumn periods, considering the three diurnal sampling periods (morning, midday, and afternoon) are presented in Figure 2. The relative abundance of median BTEX values during the entire study period was the following: ethylbenzene (11.86 μg m−3) > toluene (11.85 μg m−3) > p-xylene (3.31 μg m−3) > benzene (1.73 μg m−3). All measured BTEX showed a clear seasonal trend. Toluene, ethylbenzene, and p-xylene showed the highest median concentrations during summer season: 15.78 μg m−3, 15.28 μg m−3, and 3.46 μg m−3, respectively. Benzene had the highest median concentration during autumn (2.633 μg m−3).
According to the Friedman test, BTEX concentrations did not show a diurnal pattern—statistically significant differences were absent among the morning, midday, and afternoon sampling periods. The Mann–Whitney test for seasonal variation revealed significant differences in BTEX concentration in summer and autumn at a significance level of α = 0.05. This behavior indicates that BTEX concentrations in the study site were more influenced by local and regional sources (industrial emissions and traffic intensity) than by photochemical activity. The seasonal and diurnal variation of BTEX levels in urban areas strongly depend on meteorological conditions, photochemical activity, and source strength. We found significant differences in wind speed and wind direction between summer and autumn periods, raising the possibility of sources a little farther away contributing to the BTEX levels. Table 3 shows a summary of the meteorological parameters found during summer and autumn in the study site.
The Mann–Whitney test showed significant differences between summer and autumn for wind speed, wind direction, and temperature. The average wind directions for summer and autumn were SE and SSW, respectively, indicating that air masses transporting from these directions could contribute to BTEX levels. Wind speeds were higher during summer than autumn indicating that during this period the contribution of regional sources could be important.
We compared our results with those found in other studies in urban areas around the world (Table 4). The results found for benzene in Leon are comparable to those found in cities such as Ahvaz, Iran [24], and Valencia, Spain [25], with urban–industrial land use, vehicle traffic influence, and population between 1 and 3 million. Benzene concentrations in Leon were higher than those reported for Gdansk, Poland [26], (a city with approximately one third of the population of León) but lower than concentrations in Hanoi, Vietnam [27], Algiers, Algeria [28], Kolkata, India [29], Yazd, Iran [30], Carmen, Mexico [31], Paris, France [6], Vienna, Austria [6], London, U.K. [6] and Rome, Italy [7]. Toluene concentrations were similar to those reported in Bari, Italy [32], Beijing, China [4], Mexico City, Carmen City in Mexico [31,33], and Paris, France [6], higher than those reported in Valencia, Spain [24], Ahvaz, Iran [24], Vienna, Austria [6] and London, U.K. [6], but lower than those reported for Yazd, Iran [30], Delhi, India [5], Algiers, Algeria [28], and Rome, Italy [7]. Ethylbenzene concentrations were similar to those reported for Yazd, Iran [30], Kolkata, India [29] and Hanoi, Vietnam [27], but higher than those reported for Delhi and Kolkata in India [5,29], Mexico City, Carmen City and Monterrey in Mexico [31,33,34], Vienna, Austria [6], London, U.K. [6] and Paris, France [6]. p-Xylene concentrations in this study were higher than those reported in Valencia, Spain [25], Gdansk, Poland [26], Ahvaz, Iran [24], Monterrey, Mexico [34], Vienna, Austria [6], Paris, France [6] and London, U.K. [6], but lower than those reported for Yazd, Iran [30], Hanoi, Vietnam [27], Kolkata and Delhi in India [5,29], Algiers, Algeria [28], and Carmen, Mexico [31]. The difference in BTEX levels reported in different cities around the world can be attributed to differences in fuel quality and their BTEX content, traffic, variety of industries, different atmospheric conditions, and topography, among other factors.

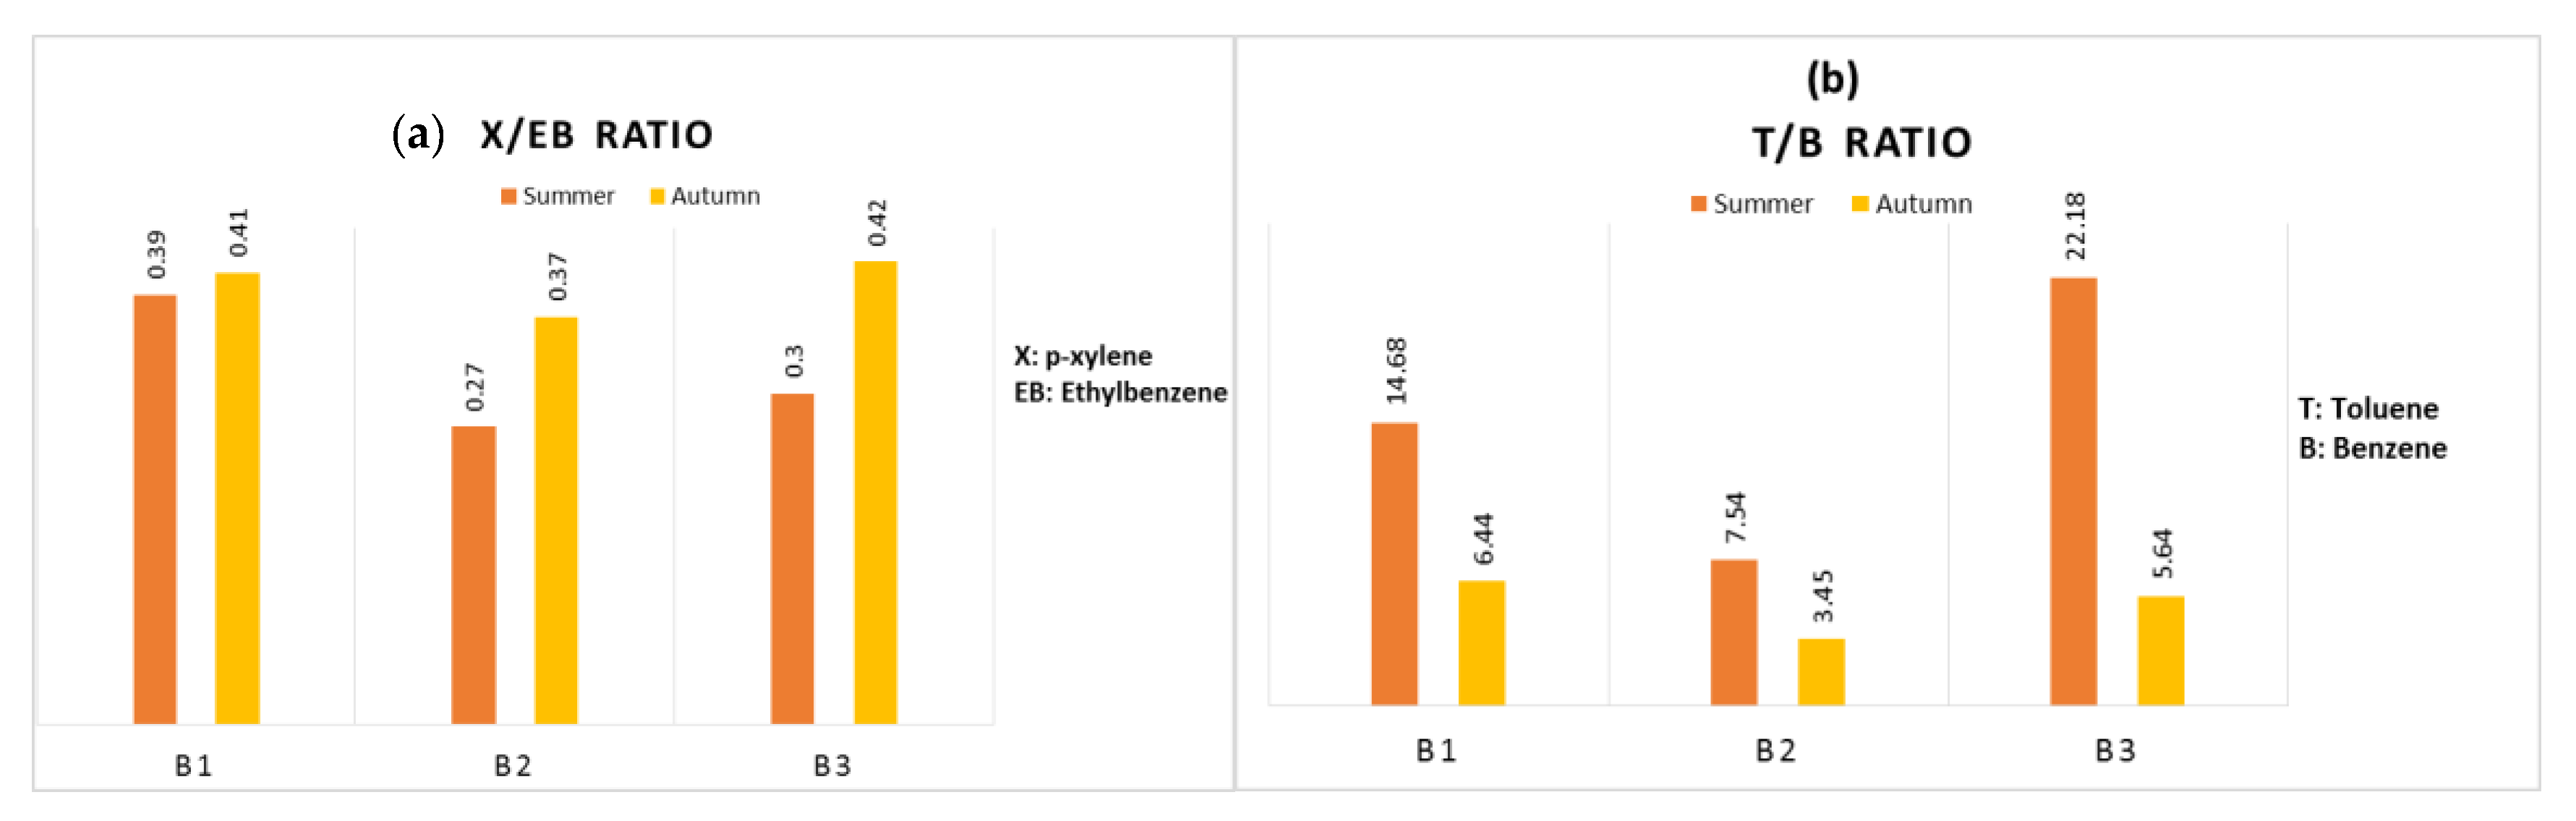
3.2. Toluene to Benzene and p-Xylene to Ethylbenzene Ratios

BTEX ratios are widely reported in the literature [4,35,36] and are useful tools to obtain information on the relative contribution of BTEX sources at the study site. Toluene to benzene (T/B) and p-xylene to ethylbenzene (X/Ebz) ratios for both sampling seasons are shown in Figure 3. It can be observed that T/B ratios during summer were higher than those found in autumn. X/Ebz ratios were similar in both sampling seasons.
In urban areas, light duty gasoline exhaust is an important source of atmospheric BTEX. Toluene and benzene are commonly constituents of gasoline, however toluene has other sources of origin, such as solvent evaporation, evaporative emissions from coated surfaces, and fuel service–storage stations as well as industrial and area sources [37,38,39]. Low values of the toluene/benzene ratio indicate that the contribution of emissions derived from vehicular traffic is important at the study site, while high values indicate a strong contribution to BTEX levels from sources beyond vehicular traffic [40,41]. According to the Friedman tests, diurnal variations of toluene/benzene ratios were not significant, but showed significant differences between sampling seasons, being higher during summer (median value: 12.17) and decreasing during autumn (median value: 4.72). The high values found for this ratio (Figure 3) indicate that there was probably a higher contribution of non-traffic sources in the study site, with the higher contribution during the summer season. The difference between benzene and the rest of the measured BTEX in terms of usage is that toluene, ethylbenzene, and p-xylene are commonly used in solvents, while benzene is not [42]. Solvents are the main component of coating, adhesives, paints, and cleaning agents; this probably led to increased BTEX emissions in the study area during summer. In addition, wind speed was higher in summer than in autumn, indicating that transport from other locations could influence BTEX levels during this season. Singh and collaborators [43], found toluene/benzene ratios higher than 2:1 in commercial and industrial areas. Similar values for this ratio were reported in Kaohsung, Taiwan, Seoul, South Korea, and Shizuoka, Japan [44,45,46]. The Guanajuato State emissions inventory (2016), reported that the emissions in Guanajuato State included 408,657.05 tons of VOCs, with area sources the main contributor with 48.45% of the total emissions [47]. Area sources include the following activities: municipal waters, pesticide application, graphic arts, coal cooking, asphalting, domestic combustion, livestock emissions, forest fires, bricks factories, dry cleaning, cleaning of industrial surfaces, handling and distribution of fuels, paint shops, agricultural burning, waste burning, surface coating, use of solvents, and sanitary landfills, among others.
Ratios of BTEX species with different photochemical reactivity can give information about the nature of BTEX influencing the different urban areas. The p-xylene/ethylbenzene ratio is commonly used as an indicator of the photochemical age of air masses containing BTEX [48]. Low values of this ratio indicate that BTEX remain in the atmosphere due to a faster reactivity of p-xylene with the OH radical (aged air masses). On the contrary, high values of this ratio indicate that the BTEX species were influenced by fresh emissions. Values of the p-xylene/ethylbenzene ratio less than 3 indicate that the BTEX were probably transported from distant sources. As may be observed in Figure 3, p-xylene/ethylbenzene ratios found in this study were lower than 3, indicating that BTEX are likely the result of the transport of air masses from industrial and area sources in nearby locations. According to the Friedman and Mann–Whitney test, there were no significant differences at α = 0.05 among diurnal sampling periods and between sampling seasons. Median values of this ratio for the morning, midday, and afternoon sampling periods were 0.38, 0.37, and 0.37, respectively. The p-xylene/ethylbenzene ratio median values for summer and autumn were 0.24 and 0.39, respectively.

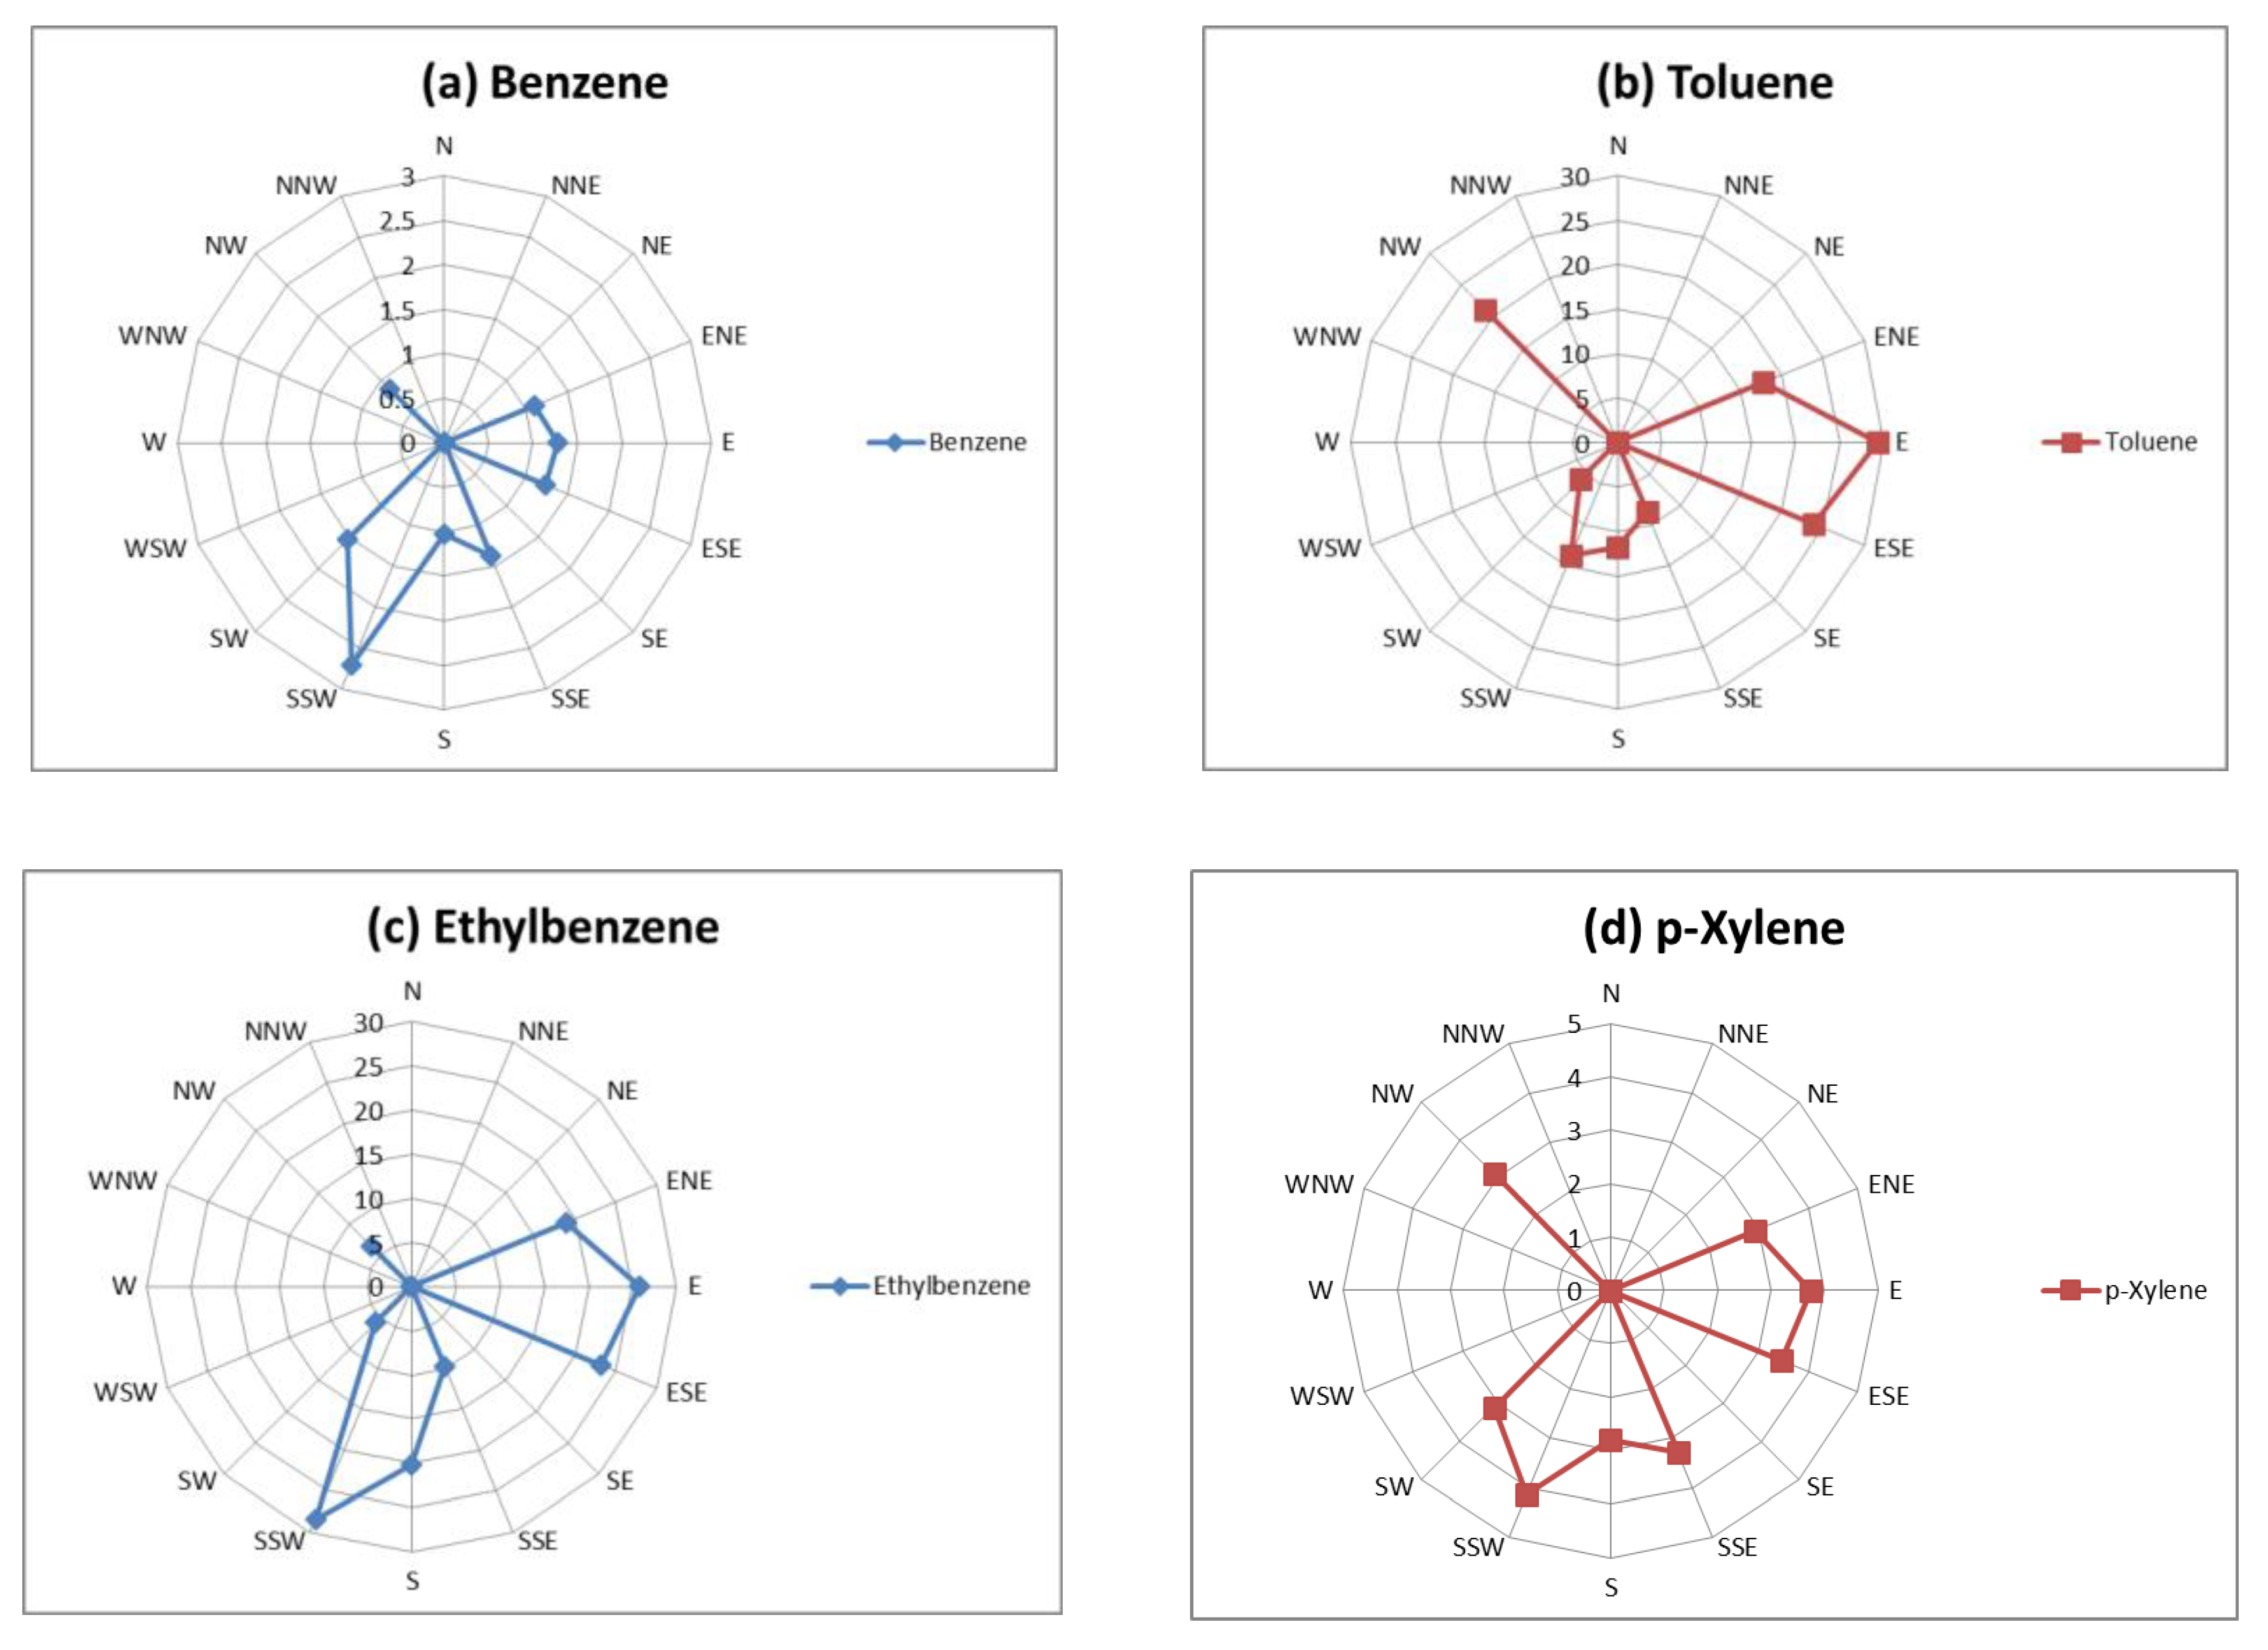
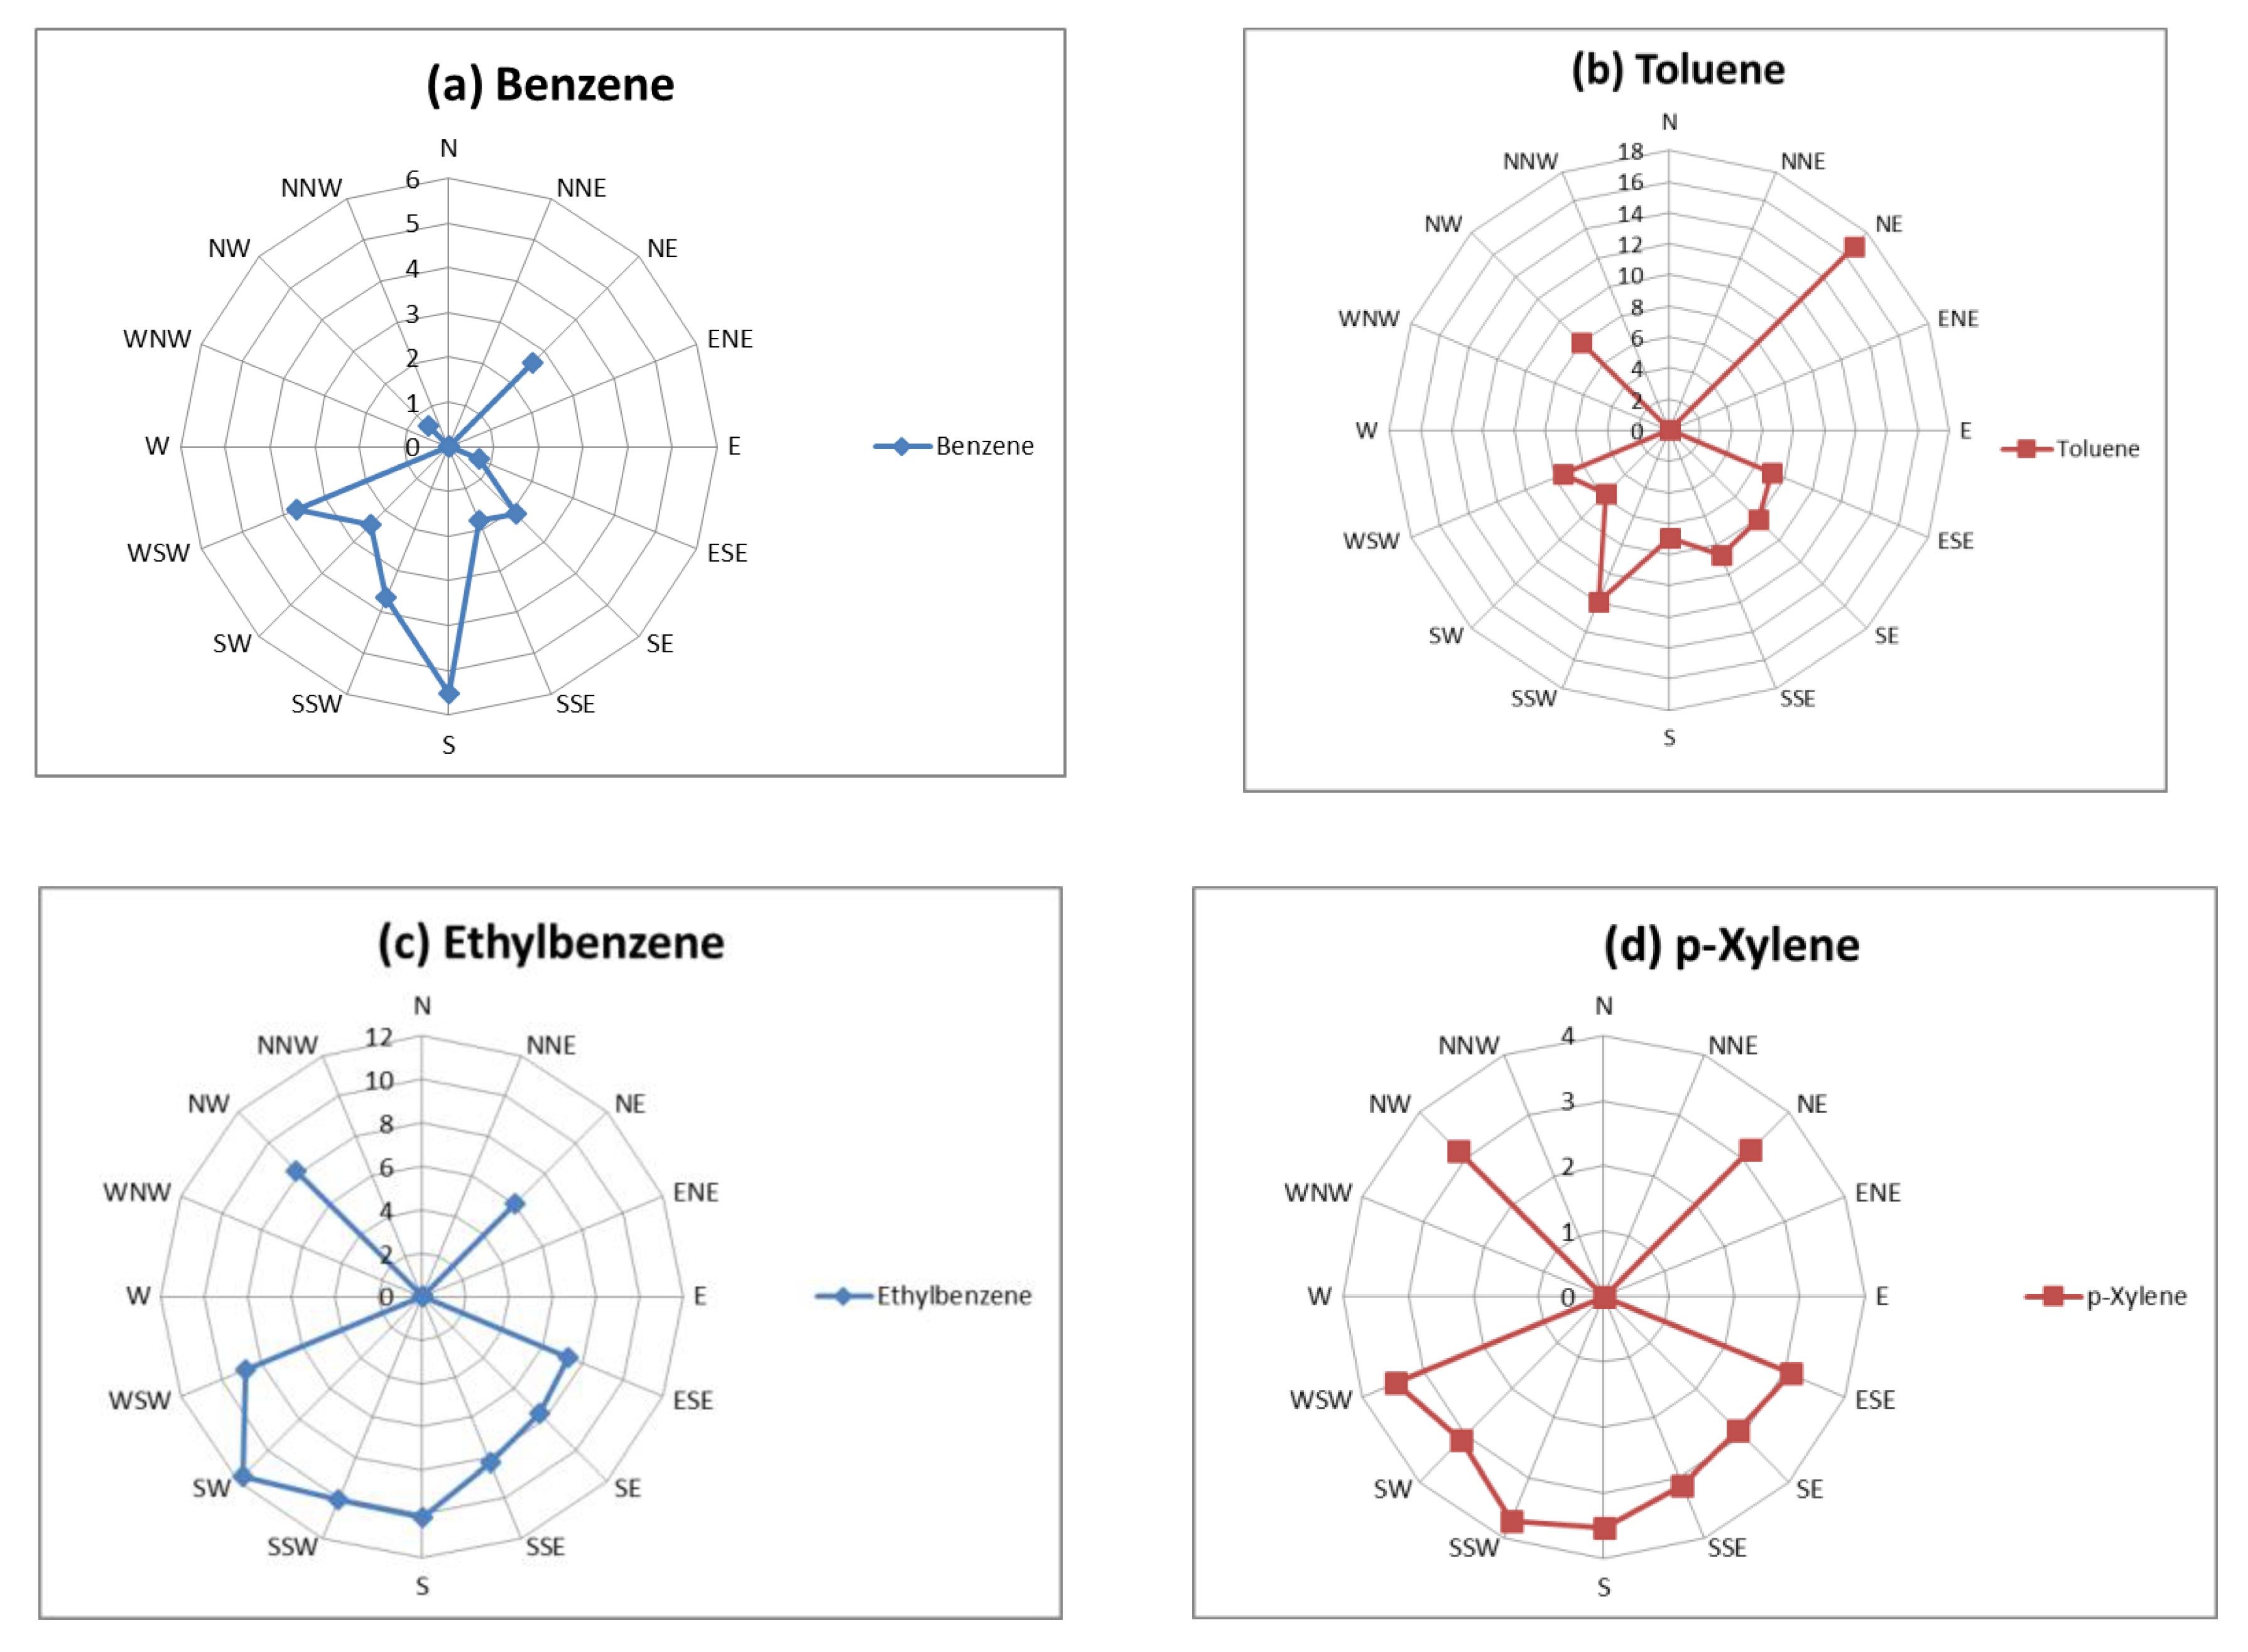
3.3. Effect of Meteorology on BTEX Concentrations

Meteorology (wind direction and speed) influences the removal, accumulation, transport, dispersion, and transformation of pollutants in the atmosphere. Based on prevailing winds, concentration roses were constructed to identify local sources contributing to BTEX levels measured in Leon, considering seasonal variation (Figure 4 and Figure 5). During summer (Figure 4), higher concentrations were observed for ethylbenzene, benzene, and p-xylene when winds came from SSW. Numerous gasoline and natural gas service stations are located to the SSW of the sampling site, as well as industrial areas such as Santa Julia, Delta, and Delta Sur, and high vehicular traffic avenues such as Delta and Río Mayo, Boulevard Paseo de Jerez, and the Federal highway number 45 Silao-León (Figure 1). Toluene showed higher concentrations when air masses came from E. The industrial area of La Capilla is located in this direction, as well as numerous service stations and liquid petroleum gas and gasoline distribution facilities, as well as avenues with high vehicular flow such as Tecnológico Avenue and Olímpica Avenue, as well as Juan Alonso de Torres Boulevard and Jose Maria Morelos Boulevard. In this direction are also located the industrial areas of Julián de Obregón and Silao, the Federal highway number 45 from Silao to León, and the Airport and Metropolitan Boulevards. All these sources are likely contributors to the BTEX levels measured at the study site.
During autumn (Figure 5), p-xylene and toluene had higher concentrations with winds blowing from NE. Industrial areas such as Brisas del Campo, Jerez, and La Capilla are located in this direction; as are avenues with high vehicular density including Sion Avenue, Juan Alonso de Torres Boulevard, Téllez Cruces Avenue, and Vicente Valtierra Boulevard. Ethylbenzene and benzene registered higher levels of concentration when winds were from SW and S, respectively. In these directions, there are avenues and boulevards with high traffic density such as Boulevard Torres Landa Oriente, Boulevard Timoteo Lozano, and Boulevard Hermanos Aldana, and several industrial facilities such as corrugated plastics production, adhesives factories, one asphalt plant, and numerous gasoline and automobile service stations.
The Spearman correlation coefficients between BTEX and criteria pollutants and meteorological parameters are presented in Table 5. During summer (Table 5a), significant positive correlation coefficients (at α = 0.05) were found between CO and NO2 (0.886), SO2 (0.481), PM10 (0.463), toluene (0.470), and p-xylene (0.643), indicating that these pollutants could originate from common sources (motor vehicle transport). Even if there are no real-time vehicle count records or visual observations of vehicles, CO can be considered a tracer of vehicular sources in the study area based on the following reports:
  • According to the Emissions Inventory of criteria air pollutants in Leon for 2017 [49], CO, VOCs, and NOx showed the highest emissions with 148,047, 35,292, and 34,077 t/year, respectively.
  • The highest contribution to CO levels in Leon came from mobile sources (134,670 t/year), with vehicles (including taxis) being the main contributors [50].
  • The vehicular fleet in Leon is 512,878 vehicles within a population of 1,553,437 inhabitants, giving an index of motorization of 0.33 (meaning 330 vehicles for each 1000 inhabitants) [50,51].
SO2 showed a significant negative correlation with ozone, indicating that SO2 suffered from photochemical reactions in order to produce ozone during this period. This behavior has been previously reported by Wilson and collaborators [52] in which SO2 was shown to influence the production of oxidants during episodes of urban photochemical smog.
NO2 presented positive significant correlations with SO2 (0.407), toluene (0.408), and p-xylene (0.721), suggesting that these pollutants could originate from sources that implicate high temperature combustion processes of sulfur-containing fossil fuels. According to the criteria air pollutants emissions inventory for Leon City carried out in 2017, the second and third most important contributors to NOx emissions are commercial and industrial combustion sources, comprising 2209 t/year [49].
Toluene showed a good correlation with ethylbenzene and p-xylene, indicating that these BTEX species had their origin in common sources. Toluene has been very well correlated with ethylbenzene in biomass combustion samples [6]. p-Xylene and PM10 showed a significant correlation with each other, indicating that this aromatic hydrocarbon could contribute to secondary organic aerosol (SOA) formation. Ozone was the only pollutant that was influenced by solar radiation during this sampling period (0.595). BTEX did not have significant correlations with temperature; suggesting that evaporative emissions were not important during this period. Benzene and ethylbenzene did not correlate with CO, indicating that vehicular emissions did not contribute to ambient levels of these compounds during summer.
During autumn (Table 5b), CO showed significant positive correlations with NO2 (0.857), SO2 (0.440), and PM10 (0.746), indicating that these air pollutants could originate from common sources, probably diesel and gasoline vehicle sources, since CO may be considered as a tracer of vehicular sources in the study area. Ozone showed significant negative correlation with NO2 (−0.564), indicating NO2 may act as an ozone precursor in Leon. During daytime hours NO2 is converted to NO as a result of photolysis, which leads to the tropospheric ozone formation [53].
The significant inverse correlation between O3 and PM10 (−0.477) indicates that high concentrations of ozone in highly oxidizing atmospheric environments could promote secondary particle formation, thus increasing PM10 levels [54]. On the other hand, there is also the possibility that high concentrations of PM10 could suppress environmental levels of O3 by reducing atmospheric radiation. Both processes constitute a cycle of interaction between O3 and PM10. O3 correlated in a significant way with temperature (0.847) and solar radiation (0.625), evidence of its photochemical origin during this period. This was expected since ozone, solar radiation, and temperature usually show similar diurnal patterns [53]. NO2 showed a significant correlation with PM10 (0.785), indicating that both air pollutants could originate from high temperature combustion sources. There were significant positive correlations between toluene–p-xylene (0.490) and ethylbenzene–p-xylene (0.623), suggesting that these species originated from common sources. CO showed a significant negative correlation with ozone. This might be explained by considering that the main atmospheric sink for CO is its reaction with OH, and this process thus makes CO a precursor of tropospheric ozone [55]. Benzene did not correlate with any other BTEX species, suggesting an additional and different source of this hydrocarbon within the study area. Solar radiation had influence on the levels of CO (−0.457), O3 (0.625), and NO2 (−0.590).
Relative humidity (RH) was negatively correlated with ozone in both seasons (Spearman correlation coefficients of −0.663 in summer and −0.453 in autumn), indicating that high concentrations of water vapor partially removed this pollutant from the atmosphere by means of chemical reactions or condensation processes [56].
We carried out a principal component analysis (PCA) to identify patterns of correlation among the measured air pollutants in order to reduce a large data set into a small number of principal factors. It is important to note that a multivariate analysis such as PCA is a useful and widely used tool to infer the possible sources contributing to the measured levels of air pollution [56,57]. It is recommended, however, that in future works a receptor model be applied, considering the emission profiles of the existing sources in the vicinity of the sampling site. We performed PCA using XLSTAT statistical software in order to determine principal components with Eigen-values > 1.00 in order to identify probable sources of measured air pollutants. We considered a factor score of 0.5 as the lowest level of significance. Table 6 shows the PCA factor loadings for the measured air pollutants during summer (a) and autumn (b), respectively, at the study site. It can be observed that during summer (Table 6a), four factors were necessary to explain 80.509% of the total variance of data set. The first factor (F1), which accounted for 40.337% of the total variance, included CO, O3, NO2, SO2, p-xylene, wind speed, relative humidity, temperature, pressure, and solar radiation, indicating that this factor was associated with the combustion of fossil fuels, evaporative emissions, photochemical activity, and the influence of meteorological parameters (temperature and relative humidity). Nitrogen compounds (NO, NO2, and NOx), mainly from vehicular emissions in urban areas, usually show strong positive correlations with BTEX compounds, suggesting that these compounds are probably emitted from common sources and present similarities in the atmospheric degradation process. This is in agreement with results obtained in the bi-variate analysis. Carbon monoxide (CO) is generated by incomplete combustion processes of nearby vehicle engines and has been used as an indicator of vehicular emissions in urban areas. The second factor (F2) contributed 17.239% to the total variance and included ethylbenzene and PM10, indicating that these pollutants could originate from common sources. The third factor (F3) accounted for 14.654% and had a high factor loading for toluene and wind direction, indicating that this pollutant was transported from other locations. It can be explained due to the two-day atmospheric lifetime of toluene; it makes this BTEX species a stable compound [58]. This agrees with the p-xylene/ethylbenzene ratios, which are used as a measure of air mass age. The fourth factor (F4) contributed 8.280% to the total variance and included only benzene, indicating that this aromatic hydrocarbon had a different source within the study area during this sampling period. This agrees with the results of the toluene/benzene ratios that indicate a higher contribution of non-traffic sources to the BTEX levels and to the fact that benzene is less used in solvent formulations, unlike the other BTEX species.
Table 6b shows the factor loadings for measured air pollutants during autumn. Three factors were required to explain 68.876% of the total variance of the data set. F1 contributed 40.900% of the total variance and included CO, O3, NO2, SO2, PM10, wind speed, relative humidity, temperature, and pressure. This factor (F1) is associated with air pollutants emitted from road traffic, high temperature combustion sources, and evaporative emissions and influenced by photochemical activity and meteorological parameters. Factor F2 accounted for 16.673% of the total variability and included toluene, ethylbenzene, and p-xylene, indicating that these BTEX species have common origins, probably industrial and area sources. The third factor contributed 11.296% and included only benzene, indicating that this pollutant likely has a different source during autumn. Some authors have also reported high factor loadings in PCA for BTEX, indicating that they have common sources [42,45,57,59,60]. Toluene, ethylbenzene, and xylenes, for example, have been associated with common sources (solvent usage and degreasing solvents), while benzene is commonly absent in solvent usage [42]. This is supported by the 2017 Leon air pollutant emissions inventory, which reported that area sources, particularly solvents usage, are the main contributors to VOC levels with emissions of 24,548 t/year [49]. Associations between BTEX and SO2 and NO2 have been reported by other authors [45,60,61,62] since toluene, ethylbenzene, and xylenes can have multiple sources including road traffic and industrial emissions. Combustion activities for heating and power generation are associated with emissions of NO2 and BTEX.
During autumn, temperatures were higher than those registered during the summer season, indicating that evaporative emissions could be an important source of BTEX in the study area. During summer, wind speed values were higher than during autumn, indicating that the contribution of regional sources could be important in this period. Some studies have also reported seasonal differences between graph scores and factor loadings [60,63]; these differences have been attributable to the influence of meteorological parameters on pollutant concentrations (precipitation, relative humidity, temperature, solar radiation, wind speed, and wind direction).

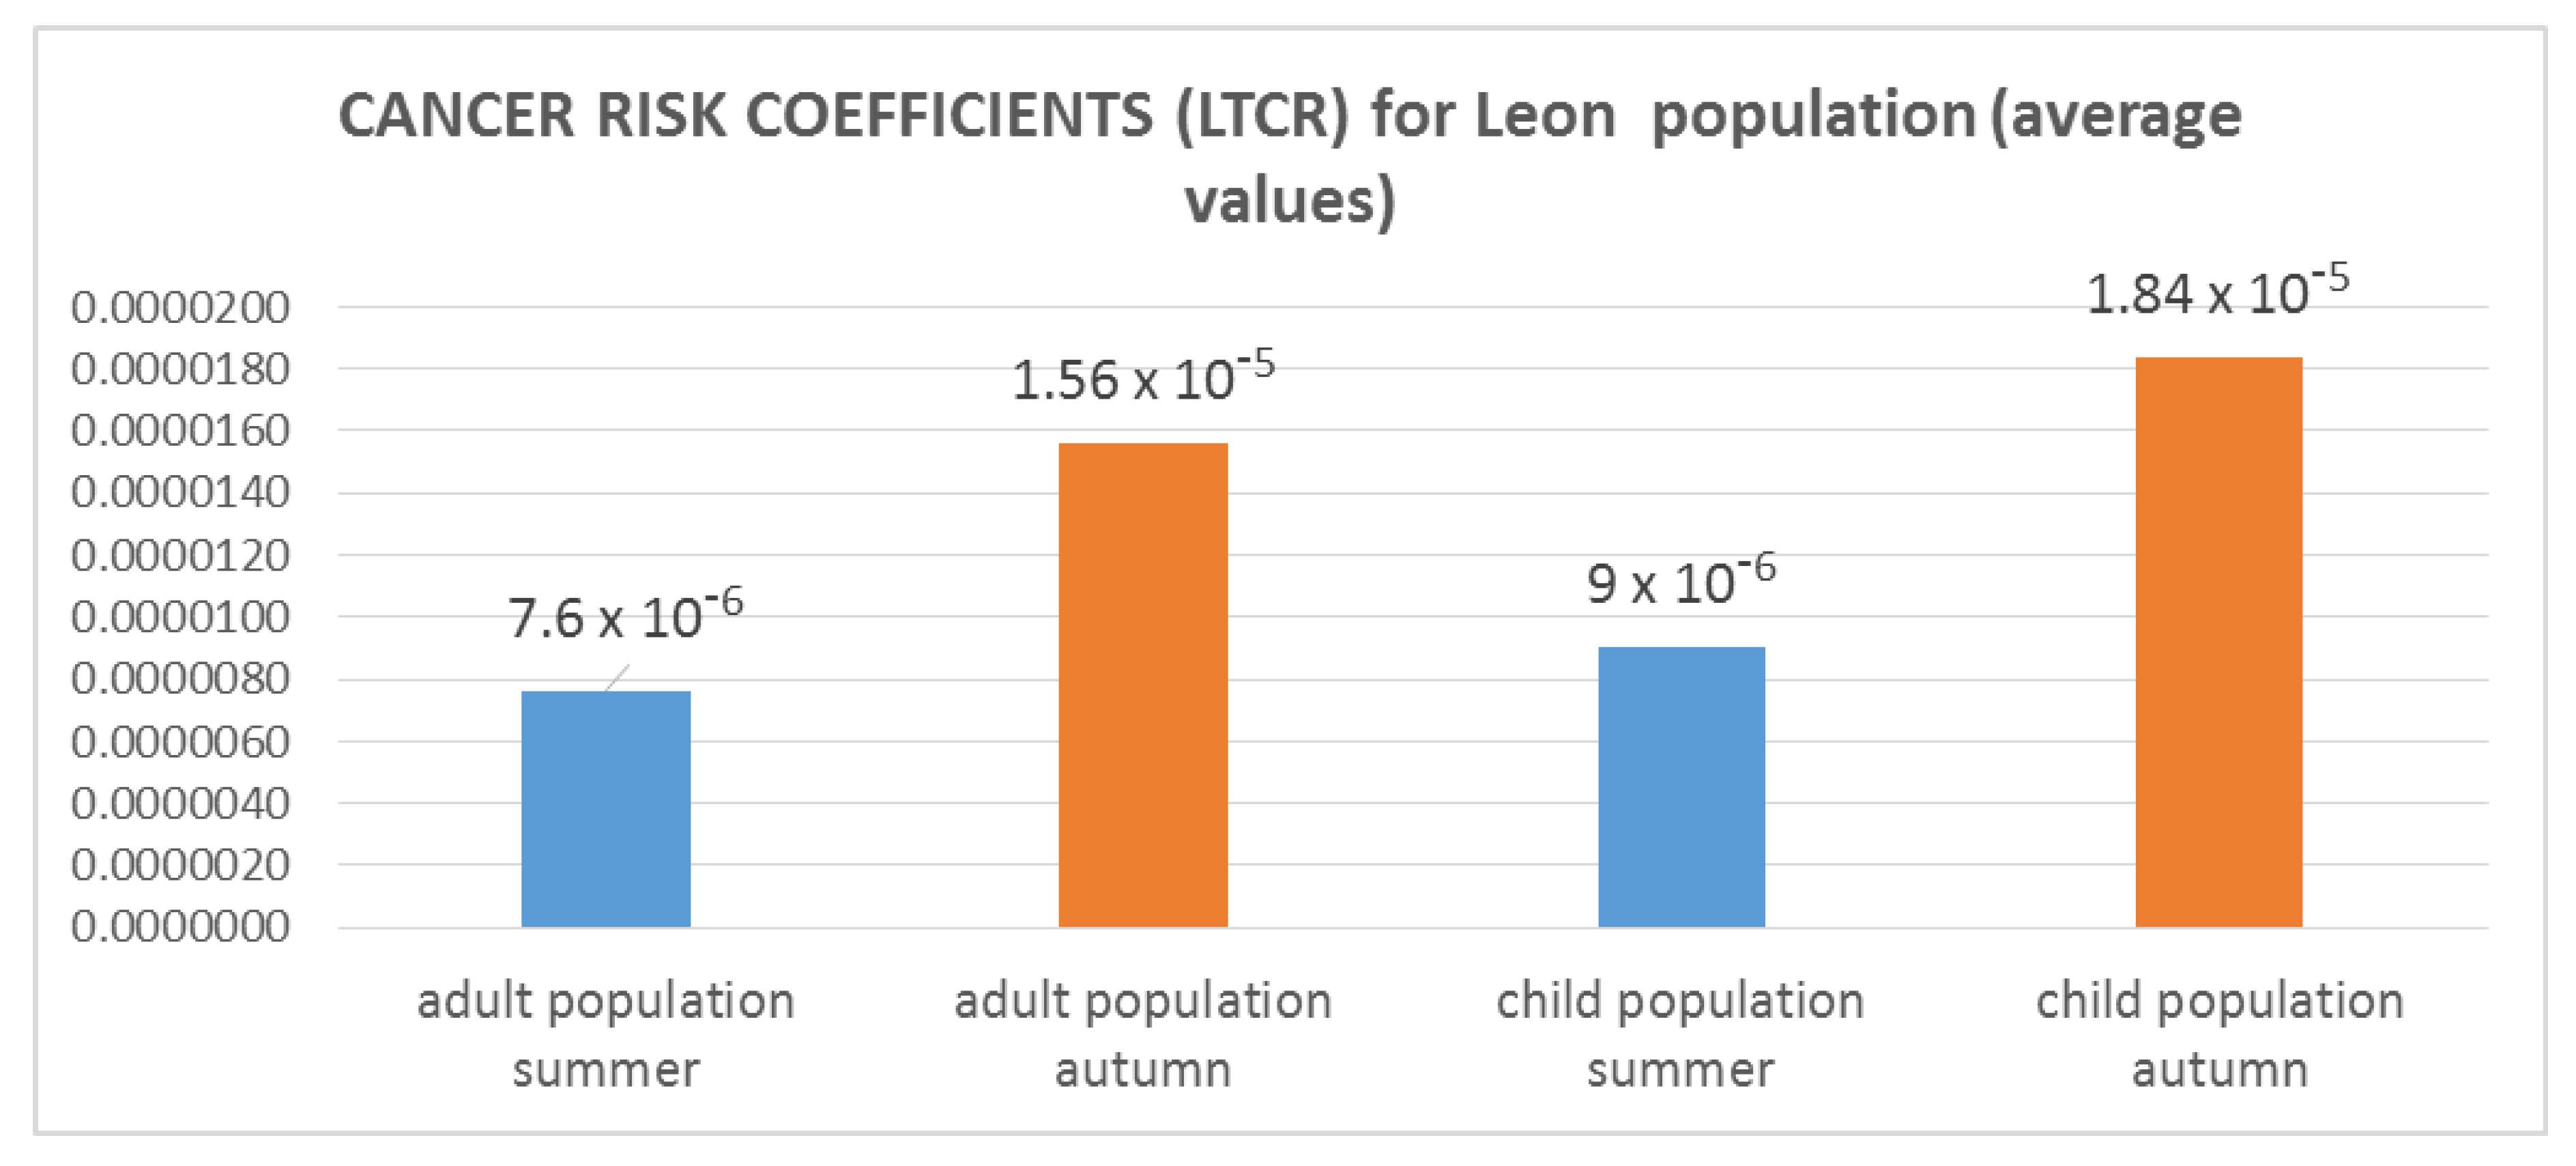
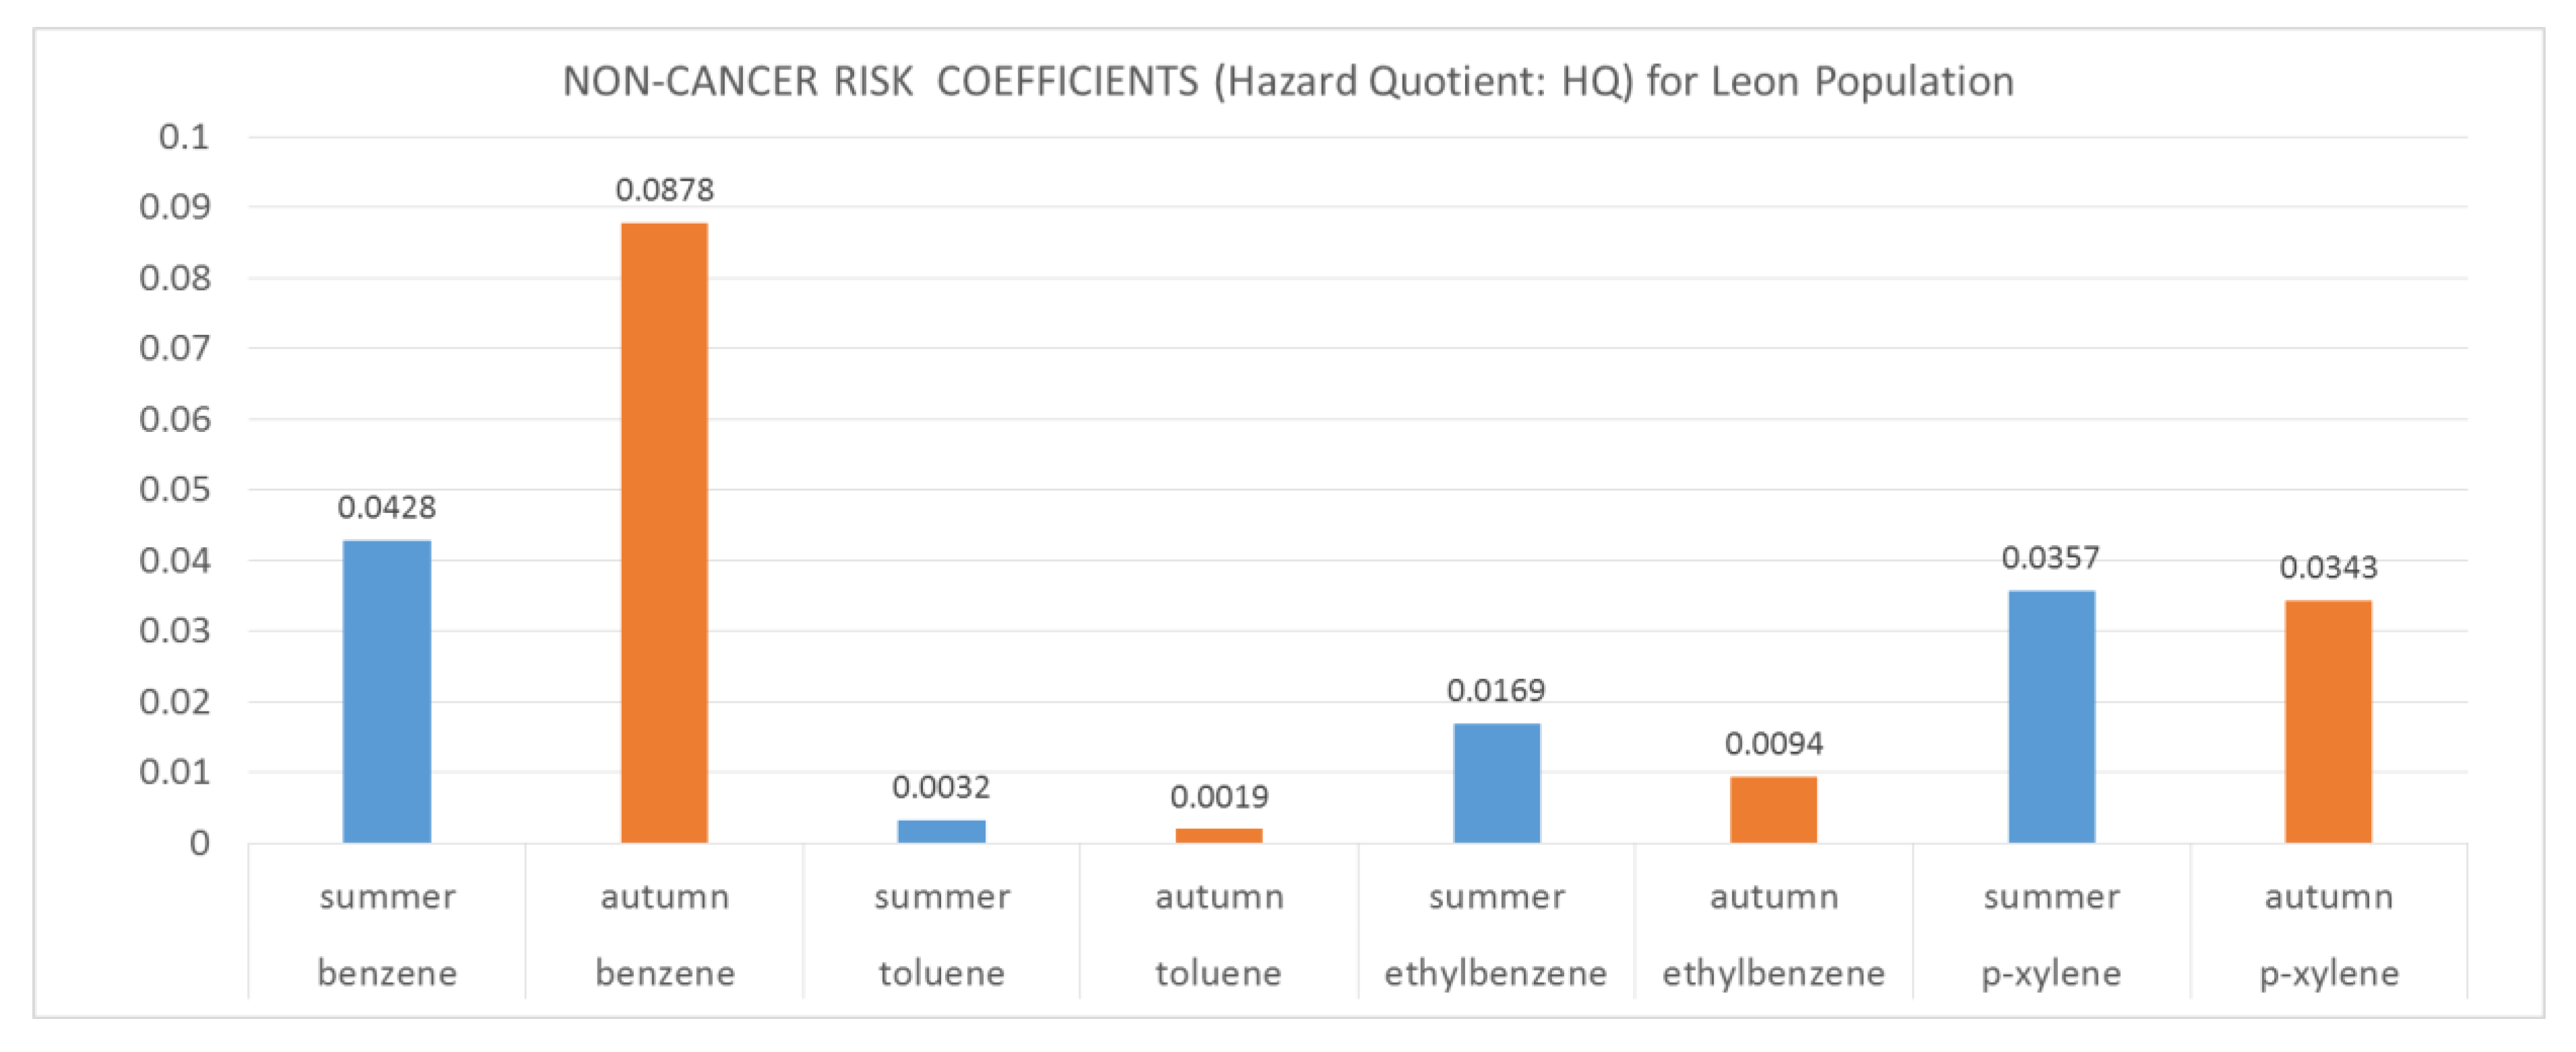
3.4. Health Risk Assessment

A health risk assessment was carried out in order to determine the effects of BTEX on population health in Leon, considering both cancer and non-cancer effects. The risk of cancer associated with benzene exposure by inhalation was determined according to the methodology described by Zhang and collaborators [15]. The average daily exposures (E) associated with benzene inhalation (mg/kg per day) were determined considering two population groups: adults and children, with a period of exposure of DA = 16 h/day for adults and 10 h/day for children [16]. The average daily exposures were 2.63 × 10⁻⁴ and 5.38 × 10⁻⁴ mg/kg per day for adults during the summer and autumn seasons, respectively. In the child population, the average daily exposure values were 3.11 × 10⁻⁴ and 6.36 × 10⁻⁴ mg/kg per day for summer and autumn, respectively. The estimated cancer risk (LTCR values) for adults and children were in the range of 5.26 × 10⁻⁶ to 4.33 × 10⁻⁵ (see Figure 6), which are greater than the limit value established in the U.S. EPA Guidelines (1 × 10⁻⁶). LTCR values also exceeded, in some cases, the limit value established by the World Health Organization (WHO) (1 × 10⁻⁵). Cancer risk can be classified into three categories as reported by Sexton and collaborators [64]: Definitive cancer risk if LTCR > 1.0 × 10⁻⁴, probable risk (if LTCR is between 1 × 10⁻⁵ and 1 × 10⁻⁴), and possible risk (if LTCR is between 1 × 10⁻⁵ and 1 × 10⁻⁶). According to this classification, the child and adult population of the studied area would be at possible risk of suffering cancer in the lifetime. The LTCR value in adults in summer ranged from 1.09 × 10⁻⁶ to 5.28 × 10⁻⁶ (1–5 in 1,000,000 chances of developing cancer in lifetime). In autumn the range was 5.26 × 10⁻⁶ to 3.66 × 10⁻⁵ (from 5 in 1,000,000 to 4 in 100,000 chances of developing cancer in lifetime). For the child population, LTCR values during summer ranged from 6.24 × 10⁻⁶ to 1.29 × 10⁻⁵ (from 6 in 1,000,000 to 1 in 100,000 chances that the study area population may develop cancer in their lifetime). Lifetime cancer risk estimation for the child population during autumn ranged from 6.23 × 10⁻⁶ to 4.34 × 10⁻⁵ (from 6 in 1,000,000 to 4 in 100,000 chances of developing cancer in lifetime).
The non-cancer risk index (Hazard Quotient: HQ) considers the risk of suffering non-cancer diseases due to exposure to air pollutants, while the integrated non-cancer risk (IHQ) represents the product of the individual non-cancer risk coefficients (IHQ). A value of HQ > 1 indicates that long-term exposure can cause non-carcinogenic health effects (respiratory and cardiovascular diseases), whereas a value of HQ < 1 is considered as acceptable. The individual non-carcinogenic risk coefficients (HQ) for benzene were <1 for children and adults in both summer and autumn (see Figure 7). The HQ values for benzene calculated for the adult population were in the range of 0.0297–0.0613 for the summer, and 0.029611–0.2062 for the autumn, with average values of 0.0428 and 0.0878 for summer and autumn, respectively. For children, the HQ values for benzene were in the range of 0.0297–0.0613 for summer and 0.0296–0.2063 for autumn, with average values of 0.0428 and 0.0878 for summer and autumn, respectively. We can conclude that long-term exposure to the concentrations found of benzene does not represent a risk of suffering respiratory and cardiovascular diseases in the study area. Individual non-carcinogenic risk coefficients for toluene were in the range of 0.0015–0.0052 (Average: 0.0032) for the summer season and 0.0010–0.0031 (average: 0.0019) for the autumn season. The HQ values found for toluene were below the limit value established as acceptable, so it can be concluded that there is no risk of non-cancer illnesses due to exposure to toluene via inhalation in the study area. HQ values for ethylbenzene in both children and adults showed ranges of 0.0058–0.0030 (Average: 0.0169) for summer and 0.0064–0.0137 (average: 0.0095) for autumn. These values were below the limit value established as acceptable, so it can be concluded that there is no risk of non-cancer illnesses due to exposure to ethylbenzene. Individual HQ values for p-xylene in both children and adults were in the range of 0.0255–0.0481 (Average: 0.0358) for summer and 0.0283–0.0379 (average: 0.0344) for autumn. These values were below the recommended limit, so it can be concluded that there is no risk of non-cancer due to exposure to ethylbenzene. The integrated non-cancer risk value (IHQ) was also lower than the recommended limit. The highest values of HQ were found in the child population during the autumn season, being higher for benzene.

4. Conclusions

Toluene and ethylbenzene were the dominant BTEX species in this study, whereas benzene and p-xylene showed the lowest concentration values. There was not a clear diurnal pattern in BTEX concentrations but statistically significant differences were found between summer and autumn. This seasonal variation can be attributed to differences in wind conditions and temperature. BTEX concentrations found in this study were similar to those found in Mexico City but lower than those reported for cities such as Kolkata and Delhi in India, and Algiers, Algeria, and Hanoi, Vietnam, respectively. Meteorological analysis showed that sources (several industrial complexes and distribution and storage stations of fuels) located southeast, south-southwest, and northeast of the sampling site could contribute to BTEX levels. The observed values of T/B and X/Ebz ratios indicate that the study site was likely influenced by transported air masses from non-local locations. The highest T/B ratios observed during summer may indicate that photochemistry, meteorology, and source strength were the major factors influencing the seasonal trend of this ratio. The bi-variate and PCA analyses confirmed that some air pollutants such as CO, O3, SO2, NO2 had their origin in common sources (fossil fuel combustion, road traffic, and photochemical activity) in both sampling seasons. The statistical analysis also suggested that toluene was more influenced by wind direction during summer, with significant positive correlations (at α = 0.05) with ethylbenzene and p-xylene, indicating that these BTEX species had their origin in common sources. During autumn, toluene, ethylbenzene, and p-xylene also showed significant positive correlations (at α = 0.05), indicating that they could originate from common sources. The Spearman correlation coefficients and PCA results demonstrated that benzene was probably emitted from a different source, since this pollutant did not correlate with the rest of measured BTEX. Results from the health risk assessment showed that LTCR values for adults and children exceed the 10−6 and 10−5 threshold values for benzene (recommended values by EPA and WHO, respectively) during both seasons, indicating that this pollutant may constitute a potential health risk for the study area population. Hazard quotients (HQ) for all the measured BTEX were below the acceptable limit value, indicating that observed BTEX concentrations in this study do not constitute a risk of suffering non-cancer diseases associated with their inhalation.

Author Contributions

Conceptualization, J.G.C.B. and R.M.C.B.; Formal analysis, C.G. and G.L.S.; Investigation, J.G.C.B., R.M.C.B., S.M.M., J.D.W.K., E.R.L. and M.P.U.C.; Methodology, S.M.M., R.d.C.L.S., M.R.M., M.d.l.L.E.F. and M.P.U.C.; Project administration, J.G.C.B. and R.M.C.B.; Software, R.d.C.L.S. and M.d.l.L.E.F.; Validation, E.R.L.; Writing—original draft, J.G.C.B.; Writing—review & editing, R.M.C.B., S.M.M., J.D.W.K. and C.G. All authors have read and agreed to the published version of the manuscript.

Acknowledgments

The authors appreciate the support provided by the Air Quality Information System of Guanajuato State (SEICA), especially Juan Manuel Perez Guzman and Ricardo Rene Garcia Lopez for the facilities provided during the sampling in Leon city.

Conflicts of Interest

Authors declare no conflict of interest.

References

  1. Du, Z.; Mo, J.; Zhang, Y. Risk assessment of population inhalation exposure to volatile organic compounds and carbonyls in urban China. Environ. Int. 2014, 73, 33–45. [Google Scholar] [CrossRef] [PubMed]
  2. Hoshi, J.; Amano, S.; Sasaki, Y.; Korenaga, T. Investigation and estimation of emission sources of 54 volatile organic compounds in ambient air in Tokyo. Atmos. Environ. 2007, 42, 2383–2393. [Google Scholar] [CrossRef]
  3. Hoque, R.R.; Khillare, P.S.; Agarwal, T.; Shridhar, V.; Balachandran, S. Spatial and temporal variation of BTEX in the urban atmosphere of Delhi, India. Sci. Total Environ. 2008, 392, 30–40. [Google Scholar] [CrossRef] [PubMed]
  4. Zhang, Y.; Mu, Y.; Liu, J.; Mellouki, A. Levels, sources and health risks of carbonyls and BTEX in the ambient air of Beijing, China. J. Environ. Sci. 2012, 24, 124–130. [Google Scholar] [CrossRef]
  5. Chameides, W.L.; Fehsenfeld, F.; Rodgers, M.O.; Cardellino, C.; Martinez, J.; Parrish, D.; Lonneman, W.; Lawson, D.R.; Rasmussen, R.A.; Zimmerman, P.; et al. Ozone precursor relationships in the ambient atmosphere. J. Geophys. Res. 1992, 97, 6037–6056. [Google Scholar] [CrossRef]
  6. Monod, A.; Sive, B.C.; Avino, P.; Chen, T.; Blake, D.R.; Rowland, F.S. Monoaromatic compounds in ambient air of various cities: A focus on correlations between the xylenes and ethylbenzene. Atmos. Environ. 2001, 35, 135–149. [Google Scholar] [CrossRef] [Green Version]
  7. Avino, P.; Manigrasso, M. Ten-year measurements of gaseous pollutants in urban air by an open-path analyzer. Atmos. Environ. 2008, 42, 4138–4148. [Google Scholar] [CrossRef]
  8. The International Agency for Research on Cancer. IARC Monographs on the Evaluation of Carcinogenic Risks to Humans; The International Agency for Research on Cancer: Benzene, France, 2018. [Google Scholar]
  9. National Institute of Geography and Informatics Statistics (INEGI). Intercensal Survey 2015. Available online: https://www.inegi.org.mx/programas/intercensal/2015/default.html#Documentacion (accessed on 11 January 2019).
  10. Aromatic Hydrocarbons Determination in Air (Benzene, Toluene, Ethylbenzene, p-Xylene, 1,2,4-Trimethyl-Benzene): Adsorption in Activated Carbon/Gas Chromatography Method; INSHT Method MTA/MA-030/A92; Social and Occupational Affairs Office: Madrid, Spain, 1992. Available online: http://www.insht.es/InshtWeb/Contenidos/Documentacion/FichasTecnicas/MetodosAnalisis/Ficheros/MA/MA_032_A98.pdf (accessed on 15 May 2018).
  11. Statistical Software and Data Analysis Add-on for Excel (XLSTAT). 2016. Available online: https://www.xlstat.com/en/ (accessed on 15 August 2018).
  12. Abdul-Wahab, S.A.; Bakheit, C.S.; Al-Alawi, S.M. Principal component and multiple regression analysis in modeling of ground-level ozone and factors affecting its concentrations. Environ. Model. Softw. 2005, 20, 1263–1271. [Google Scholar] [CrossRef]
  13. Wind Rose Plots for Meteorological Data (WRPLOTView), Version 8.0.2 2018 from Lakes Environmental. Available online: https://www.weblakes.com/products/wrplot/index.html (accessed on 30 January 2020).
  14. Subsistema Estatal de Información de Calidad del Aire (SEICA). Subsecretaría del Medio Ambiente y Ordenamiento Territorial del Estado de Guanajuato. Datos históricos 2018. Available online: https://smaot.guanajuato.gob.mx/sitio/seica/historicos/leon (accessed on 30 January 2020).
  15. Zhang, Z.; Wang, X.; Zhang, Y.; Lü, S.; Huang, Z.; Huang, X.; Wang, X. Ambient air benzene at background sites in China’s most developed coastal regions: Exposure levels, source implications and health risks. Sci. Total Environ. 2015, 511, 792–800. [Google Scholar] [CrossRef]
  16. United States Environmental Protection Agency, USEPA. Child–Specific Exposure Factors Handbook. National Center for Environmental Assessment; Office of Research and Development: Washington, DC, USA, 2008.
  17. United States Environmental Protection Agency, USEPA. A Minimal Risk Levels List; Agency for Toxic Substances and Disease Registry (ATSDR): Atlanta, GA, USA, 2009. [Google Scholar]
  18. United States Environmental Protection Agency (US EPA) IRIS. Integrated Risk Information System. Benzene; National Center for Environmental Assessment, Office of Research and Development: Washington, DC, USA, 2013. Available online: http://www.epa.gov/iris/subst/0276.htm (accessed on 15 September 2018).
  19. United States Environmental Protection Agency (US EPA). Integrated Risk Information System (IRIS) Carcinogenic Effects of Benzene: An Update (EPA/600/P-97/001F); United States Environmental Protection Agency (US EPA): Washington, DC, USA, 1998. Available online: http://www.epa.gov/iris/supdocs/0276index.html (accessed on 1 October 2018).
  20. Toxicological Profile for Benzene; Agency for Toxic Substances and Disease Registry (ATSDR): Atlanta, GA, USA, 2005. Available online: https://www.atsdr.cdc.gov/toxprofiles/tp3.pdf (accessed on 2 October 2018).
  21. Toxicological Review of Toluene: In support of Summary Information Integrated Risk Information System (IRIS); EPA/635/R-05/004; United States Environmental Protection Agency (US EPA): Washington, DC, USA, 2005. Available online: https://cfpub.epa.gov/ncea/iris/iris_documents/documents/toxreviews/0118tr.pdf (accessed on 25 October 2018).
  22. Toxicological Profile for Ethylbenzene; Agency for Toxic Substances and Disease Registry (ATSDR): Atlanta, GA, USA, 2005. Available online: https://www.atsdr.cdc.gov/ToxProfiles/tp110.pdf (accessed on 21 October 2018).
  23. Toxicological Review of Xylenes: In support of Summary Information Integrated Risk Information System (IRIS); EPA/635/R-03/001; United States Environmental Protection Agency (US EPA): Washington, DC, USA, 2003. Available online: https://cfpub.epa.gov/ncea/iris/iris_documents/documents/toxreviews/0270tr.pdf (accessed on 25 October 2018).
  24. Rad, H.D.; Babaei, A.; Gourdarzi, G.; Angali, K.A.; Ramezani, Z.; Mohammadi, M. Levels and sources of BTEX in ambient air of Ahvaz metropolitan city. Air Qual. Atmos. Health 2014, 7, 515–524. [Google Scholar] [CrossRef]
  25. Esplugues, A.; Ballester, F.; Estarlich, M.; Llop, S.; Fuentes, V.; Mantilla, E.; Iñiguez, C. Indoor and outdoor air concentrations of BTEX and determinants in a cohort of one-year old children in Valencia, Spain. Sci. Total Environ. 2010, 409, 63–69. [Google Scholar] [CrossRef] [PubMed]
  26. Marc, M.; Namiesnik, J.; Zabiegala, B. BTEX concentration levels in urban air in the area of the Tri-City agglomeration (Gdansk, Gdynia, Sopot), Poland. Air Qual. Atmos. Health 2014, 7, 489–504. [Google Scholar] [CrossRef]
  27. Nguyen, V.T.L.H.; Hien, T.T.; Dung, N.T.; Yoneda, M.; Vinh, T.H. Preliminary assessment of BTEX concentrations indoor and outdoor air in residential homes in Hanoi, Vietnam. Vietnam J. Sic. Technol. 2017, 55, 78–84. [Google Scholar]
  28. Kerchich, Y.; Kerbachi, R. Measurement of BTEX (benzene, toluene, ethylbenzene, and xylene) levels at urban and semirural areas of Algiers City using passive air samplers. A&WMA 2012, 62, 1370–1379. [Google Scholar]
  29. Dutta, C.; Som, D.; Chatterjee, A.; Mukherjee, A.; Jana, T.; Sen, S. Mixing ratios of carbonyls and BTEX in ambient air of Kolkata, India and their associated health risk. Environ. Monit Assess. 2009, 148, 97–107. [Google Scholar] [CrossRef]
  30. Hajizadeh, Y.; Mokhtari, M.; Faraji, M.; Mohammadi, A.; Nemati, S.; Ghanbari, R.; Abdolahnejad, A.; Fard, R.F.; Nikoonahad, A.; Jafari, N.; et al. Trends of BTEX in the central urban area of Iran: A preliminary study of photochemical ozone pollution and health risk assessment. Atmos. Pollut. Res. 2018, 9, 220–229. [Google Scholar] [CrossRef]
  31. Ceron, J.G.; Ramirez, E.; Ceron, R.M.; Carballo, C.; Aguilar, C.; Lopez, U.; Ramirez, A.; Garcias, Y.; Naal, D.; Campero, A.; et al. Diurnal and Seasonal Variation of BTX in Ambient air of One Urban Site in Carmen City, Campeche, Mexico. J. Environ. Prot. 2013, 4, 40–49. [Google Scholar] [CrossRef]
  32. Caselli, M.; Gennaro, G.; Marzocca, A.; Trizio, L.; Tutino, L. Assessment of the impact of the vehicular traffic on BTEX concentration in ring roads in urban areas of Bari (Italy). Chemosphere 2020, 81, 306–311. [Google Scholar] [CrossRef]
  33. Bravo, H.; Sosa, R.; Sanchez, P.; Bueno, B.; Gonzales, L. Concentrations of benzene and toluene in the atmosphere of the southwestern area at the Mexico City Metropolitan Zone. Atmos. Environ. 2002, 36, 3843–3849. [Google Scholar] [CrossRef]
  34. Menchaca, L.; Mercado, R.; Mendoza, A. Diurnal and seasonal variation of volatile organic compounds in the atmosphere of Monterrey, Mexico. Atmos. Pollut. Res. 2015, 6, 1073–1081. [Google Scholar] [CrossRef]
  35. Garg, A.; Gupta, N.C. A comprehensive study on spatio-temporal distribution health risk assessment and ozone formation potential of BTEX emissions in ambient air of Delhi, India. Sci. Total Environ. 2019, 659, 1090–1099. [Google Scholar] [CrossRef] [PubMed]
  36. Truc, V.; Oanh, N. Roadside BTEX and other gaseous air pollutants in relation to emission sources. Atmos. Environ. 2007, 41, 7685–7697. [Google Scholar] [CrossRef]
  37. Yurdakul, S.; Civan, M.; Kuntasal, O.; Dogan, G.; Pekey, H.; Tuncel, G. Temporal variations of VOC concentrations in Bursa atmosphere. Atmos. Pollut. Res. 2018, 9, 189–206. [Google Scholar] [CrossRef]
  38. Alghamdi, M.; Khoder, M.; Abdelmaksoud, A.; Harrison, R.; Hussein, T.; Lihavainen, H.; Al-Jeelani, H.; Goknil, M.; Shabbaj, I.; Almehmadi, F. Seasonal and diurnal variations of BTEX and their potential for ozone formation in the urban background atmosphere of the coastal city Jeddah, Saudi Arabia. Air Qual. Atmos. Health 2014, 7, 467–480. [Google Scholar] [CrossRef]
  39. Tiwari, V.; Hanai, Y.; Masunaga, S. Ambient levels of volatile organic compounds in the vicinity of petrochemical industrial area of Yokohama, Japan. Air Qual. Atmos. Health 2010, 3, 65–75. [Google Scholar] [CrossRef] [Green Version]
  40. Jia, C.; Batterman, S.; Godwin, C. VOCs in industrial, urban and suburban neighborhoods: Part 1: Indoor and outdoor concentrations, variation, and risk drivers. Atmos. Environ. 2008, 42, 2083–2100. [Google Scholar] [CrossRef]
  41. Mokhtari, M.; Miri, M.; Mohammadi, A.; Khorsandi, H.; Hajizadeh, Y.; Abdolahnejad, A. Assessment of air quality index and health impact of PM10, PM2.5 and SO2 in Yazd, Iran. J. Mazandaran Univ. Med. Sci. 2015, 25, 14–23. [Google Scholar]
  42. Na, K.; Moon, K.C.; Kim, Y.P. Source contribution to aromatic VOC concentration and ozone formation potential in the atmosphere of Seoul. Atmos. Environ. 2005, 39, 5517–5524. [Google Scholar] [CrossRef]
  43. Singh, D.; Kumar, A.; Singh, B.P.; Anandam, K.; Singh, M.; Mina, U.; Kumar, K.; Jain, V.K. Spatial and Temporal variability of VOCs and its source estimation during rush/non-rush hours in ambient air of Delhi, India. Air Qual. Atmos. Health 2016, 9, 483–493. [Google Scholar] [CrossRef]
  44. Liu, P.W.; Yao, Y.C.; Tsai, J.H.; Hsu, Y.C. Source impacts by volatile organic compounds in an industrial city of southern Taiwan. Sci. Total Environ. 2008, 398, 154–163. [Google Scholar] [CrossRef]
  45. Na, K.; Kim, Y.P. Seasonal characteristics of ambient volatile organic compounds in Seoul. Atmos. Environ. 2001, 35, 2603–2614. [Google Scholar] [CrossRef]
  46. Ohura, T.; Amagai, T.; Fusaya, M. Regional assessment of ambient volatile organic compounds in an industrial harbor area, Shizuoka, Japan. Atmos. Environ. 2006, 40, 238–248. [Google Scholar] [CrossRef]
  47. Inventario de Emisiones de Contaminantes Criterio y Precursores del Estado de Guanajuato. Actualización 2016. Secretaría de Medio Ambiente y Ordenamiento Territorial; Dirección General de la Gestión de la Calidad del Aire: Guanajuato, Mexico, 2016. Available online: https://smaot.guanajuato.gob.mx/sitio/calidad-del-aire/4/Inventario-de-Emisiones-de-Contaminantes-Criterio (accessed on 30 January 2020).
  48. Rappenglück, B.; Fabian, P.; Rappenglück, B.; Fabian, P. An Analysis of simultaneous GC-Measurements of BTEX-aromatics at three selected sites in the Greater Munich area. J. Appl. Meteorol. 1999, 38, 1448–1462. [Google Scholar] [CrossRef]
  49. Inventario de Emisiones de Contaminantes Criterio. León. 2017. Dirección General de Gestión Ambiental; Gobierno del Estado de Guanajuato: Guanajuato, México, 2017.
  50. Consejo Nacional de Población (CONAPO). Proyecciones de la Población de los Municipios de México, 2015-2030 (base 1), Estado de Guanajuato proyección año 2017; Gobierno Federal: México City, México. Available online: https://datos.gob.mx/busca/dataset/proyecciones-de-la-poblacion-de-mexico-y-de-las-entidades-federativas-2016-2050/resource/a76ad5a8-3f9d-44af-bf57-179490b3b107?inner_span=True (accessed on 30 January 2020).
  51. Instituto de Ecología del Estado de Guanajuato. Padrón de vehículos registrados en León; Gobierno del Estado de Guanajuato: Guanajuato, México, 2016.
  52. Wilson, W.E.; Levy, A.; Wimmer, D.B. A study of sulfur dioxide in photochemical smog II. Effect of sulfur dioxide on oxidant formation in photochemical smog. J. Air Pollut. Control Assoc. 1972, 22, 27–32. [Google Scholar] [CrossRef] [PubMed]
  53. Han, S.; Bian, H.; Feng, Y.; Liu, A.; Li, X.; Zeng, F.; Zhang, X. Analysis of the relationship between O3, NO and NO2 in Tianjin, China. Aerosol Air Qual. Res. 2011, 11, 128–139. [Google Scholar] [CrossRef] [Green Version]
  54. Jia, M.; Zhao, T.; Cheng, X.; Gong, S.; Zhang, X.; Tang, L.; Liu, D.; Wu, X.; Wang, L.; Chen, Y. Inverse relations of PM2.5 and O3 in air compound pollution between cold and hot seasons over an urban area of East China. Atmosphere 2017, 8, 59. [Google Scholar] [CrossRef] [Green Version]
  55. Crutzen, P.J. Estimates of Possible Variations in Total Ozone Due to Natural Causes and Human Activities. Ambio 1974, 3, 201–210. [Google Scholar]
  56. Felipe-Sotelo, M.; Gustems, L.; Hernández, I.; Terrado, M.; Tauler, R. Investigation of geographical and temporal distribution of tropospheric ozone in Catalonia (North-East Spain) during the period 2000–2004 using multivariate data analysis methods. Atmos Environ. 2006, 40, 7421–7436. [Google Scholar] [CrossRef]
  57. Cruz, L.P.S.; Santos, D.F.; dos Santos, I.F.; Gomes, Í.V.S.; Santos, A.V.S.; Souza, K.S.P.P. Exploratory analysis of the atmospheric levels of BTEX, criteria air pollutants and meteorological parameters in a tropical urban area in Northeastern Brazil. Microchem. J. 2020, 152, 104265. [Google Scholar] [CrossRef]
  58. Prinn, R.; Cunnold, D.; Rasmussen, R.; Simmonds, P.; Alyea, F.; Crawford, A.; Fraser, P.; Rosen, R. Atmospheric trends in methylchloroform and the global average for the hydroxyl radical. Science 1987, 238, 945–950. [Google Scholar] [CrossRef]
  59. Kumar, A.; Singh, D.; Kumar, K.; Singh, B.B.; Kumar, V. Distribution of VOCs in urban and rural atmospheres of subtropical India: Temporal variation, source attribution, ratios, OFP and risk assessment. Sci. Total Environ. 2018, 613, 492–501. [Google Scholar] [CrossRef] [PubMed]
  60. Petracchini, F.; Paciucci, L.; Vichi, F.; D’Angelo, B.; Aihaiti, A.; Liotta, F.; Paolini, V.; Cecinato, A. Gaseous pollutants in the city of Urumqi, Xinjiang: Spatial and temporal trends, sources and implications. Atmos. Pollut. Res. 2016, 7, 925–934. [Google Scholar] [CrossRef]
  61. Fu, L.; Hao, J.; He, D.; He, K.; Li, P. Assessment of vehicular pollution in China. J. Air Waste Manag. Assoc. 2001, 51, 658–668. [Google Scholar] [CrossRef] [PubMed] [Green Version]
  62. Wang, H.; Chen, C.; Huang, C.; Fu, L. On-road vehicle emission inventory and its uncertainty analysis for Shanghai, China. Sci. Total Environ. 2008, 398, 60–67. [Google Scholar] [CrossRef]
  63. Marčiulaitienė, E.; Šerevičienė, V.; Baltrėnas, P.; Baltrėnaitė, E. The characteristics of BTEX concentration in various types of environment in the Baltic Sea Region, Lithuania. Environ. Sci. Pollut. Res. 2017, 24, 4162–4173. [Google Scholar] [CrossRef]
  64. Sexton, K.; Linder, S.H.; Marko, D.; Bethel, H.; Lupo, P.J. Comparative assessment of air pollution-related health risks in Houston. Environ. Health Perspect. 2007, 115, 1388–1393. [Google Scholar] [CrossRef]
Figure 1. Location of the sampling site.
Atmosphere 11 00165 g001
Figure 2. Descriptive statistics and box plot for (a) benzene and p-xylene concentrations, and (b) for toluene and ethylbenzene concentrations, during the two climatic seasons and the different diurnal sampling periods. Note: SU: Summer; AU: Autumn; B1: morning (7:00–8:30 h); B2: midday (13:30–15:00 h); B3: afternoon (17:30–19:00 h). The central horizontal bars are the medians. The lower and upper limits of the box are the first and third quartiles. Where, + is the mean value; • represents maximum and minimum values.
Atmosphere 11 00165 g002
Figure 3. BTEX ratios for both sampling seasons: (a) X/EB ratio and (b) T/B ratio. (B1: morning (7:00–8:30 h); B2: midday (13:30–15:00 h); B3: afternoon (17:30–19:00 h)).
Atmosphere 11 00165 g003
Figure 4. BTEX concentration roses for the summer sampling season: (a) benzene, (b) toluene, (c) ethylbenzene, and (d) p-xylene. SSW: gasoline and automobile service stations, industrial areas (Santa Julia, Delta), avenues with heavy vehicular traffic (Delta, Rio Mayo, Paseo de Jerez Blvd., and federal highway 45). E: Avenues with heavy vehicular traffic (Tecnológico, Olímpica, Juan Alonso de Torres, Jose Ma. Morelos); industrial areas and the airport.
Atmosphere 11 00165 g004
Figure 5. BTEX concentration roses for the autumn sampling season: (a) benzene, (b) toluene, (c) ethylbenzene, and (d) p-xylene. NE: Industrial Areas (Brisas del Campo, Jerez, La Capilla) and some important avenues such as Sion, Juan Alonso de Torres. Bi-variate and multi-variate (Principal Component Analysis) statistical analysis.
Atmosphere 11 00165 g005
Figure 6. Cancer risk coefficients for Leon population during the summer and autumn seasons.
Atmosphere 11 00165 g006
Figure 7. Non-cancer risk coefficients for Leon population during the summer and autumn seasons.
Atmosphere 11 00165 g007
Table 1. Instrument and measurement characteristics for criteria air pollutants.
Criteria Air PollutantsInstrument Details
Carbon Monoxide (CO)Teledyne Model 300E equipment, using the Gas Filter Correlation Method and certified according to US EPA RFCA-1093-093
Nitrogen Dioxide (NO2)Teledyne Model 200E equipment for measuring NO, NO2, and NOx; using the Chemoluminiscence Method and certified according to US EPA RFNA-1194-099
Ozone (O3)Teledyne Model 400E equipment, using the UV Absorption Method and certified according to US EPA EQOA-0992-087
Particulate Matter (PM10)Met One Instruments equipment Model BAM 1020, using the Beta Ray Dimming Method and certified according to US EPA EQPM-0308-170
Sulfur Dioxide (SO2)Ecotech equipment Model EC9850 A&B series, using Ultraviolet Fluorescence Spectrometer and certified according to US EPA.
Table 2. Slope Factor and Toxicity Profile for Benzene.
Air PollutantSlope Factor a (SF)CAS No.Carcinogenicity bReference
Benzene2.9 × 10−2 (mg/kg/day)−171,432Group Aa The Risk Assessment Information System [18]
b EPA Cancer classification [17]
Table 3. Summary of the meteorological parameters during summer and autumn 2018 found in the study site. B1: morning (7:00–8:30 h); B2: midday (13:30–15:00 h); B3: afternoon (17:30–19:00 h).
Climatic Season/
Meteorological Parameters
Wind Speed
(km h−1)
Wind DirectionTemperature
(°C)
Relative
Humidity
(%)
Solar Radiation
(W m−2)
Barometric Pressure
(hPa)
SummerB12.3ESE13.778.4126.4829.0
B26.3SSE22.744.6694.3816.5
B33.8ESE20.252.6165.7809.7
AutumnB11.5SSE14.475.1132.8821.4
B24.5SSE23.841.5649.2819.5
B33.5SW21.349.2101.3818.1
Table 4. Comparison of the found results for BTEX in Leon with other studies around the world.
Site/BTEX ConcentrationsBenzene
µg m−3
Toluene
µg m−3
Ethylbenzene
µg m−3
p-Xylene
µg m−3
Characteristics of the Study SiteSampling and Analysis Details
Leon, Guanajuato, Mexico
(This study)
1.9612.9213.193.511.57 million inhabitants, 1220 km2, urban–industrial, heavy traffic areaCharcoal sorbent tubes, 1.5 h, active sampling: 200 mL min−1, CS2 desorption, GC/FID
Delhi, India [3]7.0719.195.9013.3013.79 million inhabitants, 1483 km2, urban–industrial, heavy traffic areaCharcoal tubes, passive sampling, One week, CS2 desorption, GC/FID
Yazd, Iran [30]21381441529,673 inhabitants, 97 km2, urban–industrial, heavy traffic areaCharcoal sorbent tubes, active sampling: 200 mL min−1, 1.5 h, CS2 desorption, GC/FID
Hanoi, Vietnam [27]30–12338–879–2426–568.054 million inhabitants, 3329 km2, urban–industrial, heavy traffic areaCharcoal sorbent tubes, active sampling: 200 mL min−1, 2 h, CS2 desorption, GC/FID
Kolkata, India [29]24.97–79.1827.65–1034.5–36.2511.17–35.8514.7 million inhabitants, 205 km2, urban–industrial, heavy traffic areaCharcoal sorbent tubes, active sampling: 100 mL min−1, 6 h, CS2 desorption, GC/FID
Valencia, Spain [25]1.26.80.91.42.531 million inhabitants, 134.6 km2, urban–industrial, heavy traffic areaCharcoal tubes, passive sampling, 15 day, CS2 desorption, GC/FID
Bari, Italy [32]0.8–90.9–15.50.2–2.71.1–13.9400,000 inhabitants, 116.21 km2, urban–industrial, heavy traffic areaCharcoal tubes Radiello, passive sampling, One week, CS2 desorption, GC/FID
Algiers, Algeria [28]16.740.56.8173.16 million inhabitants, 1190 km2, urban–industrial, heavy traffic areaCharcoal tubes Radiello, passive sampling, two week, CS2 desorption, GC/FID
Beijing, China [4]2.1–9.25.9–14.52.3–4.41.7–3.521.54 million inhabitants, 185 km2, urban–industrial, heavy traffic areaTenax sorbent tubes, active sampling: 350 mL min−1, 1 h, GC/PID
Gdansk, Poland [26]0.49–0.820.74–1.390.13–0.420.43–1.27460,500 inhabitants, 262 km2, urban–industrial, heavy traffic areaCharcoal tubes Radiello, passive sampling, two week, CS2 desorption, TD-GC/FID
Ahvaz, Iran [24]1.785.190.511.131.185 million inhabitants, 185 km2, urban–industrial, heavy traffic areaCharcoal sorbent tubes, active sampling: 200 mL min−1, 8 h, CS2 desorption, GC/FID
Mexico City [33]1.66–3.677.5–17.6320 million inhabitants, 1485 km2, urban–industrial, heavy traffic areaStainless Steel SUMMA canisters, active sampling: 24 h, GC/FID
Carmen, Campeche, Mexico [31]5.4211.233.978.32500,000 inhabitants, 153 km2, oil and gas industryCharcoal sorbent tubes, 1.5 h, active sampling: 200 mL min−1, CS2 desorption, GC/FID
Monterrey, Nuevo Leon, Mexico [34]0.3–5.11.8–4.50.1–0.40.2–2.23.93 million inhabitants, 5346 km2Stainless Steel SUMMA canisters, active sampling: 4 h, GC/FID
Vienna, Austria [6]3.154.410.630.821.8 million inhabitants, 414.7 km22-1-electropolished stainless steel canisters, active sampling, GC/FID
London, U.K. [6]2.557.571.011.178.9 million inhabitants, 1737 km22-1-electropolished stainless steel canisters, active sampling, GC/FID
Paris, France [6]4.5212.361.442.042.1 million inhabitants, 105.4 km22-1-electropolished stainless steel canisters, active sampling, GC/FID
Rome, Italy [7]25.0
(In 1991)
8.0
(In 2000)
108
(In 1991)
54
(In 2000)
--2.8 million inhabitants, 1285 km2Differential optical absorption spectroscopy (DOAS)
Table 5. Spearman correlation coefficients between BTEX and criteria pollutants during the study period.
(a) Summer
Measured ParametersCOO3NO2SO2PM10BenzeneTolueneEthyl-benzenep-XyleneWind SpeedWind DirectionRelative HumidityTemperaturePressureSolar Radiation
CO1−0.3700.8860.4810.4630.0240.4700.0490.643−0.6980.1130.449−0.4170.363−0.230
O3−0.3701−0.308−0.5710.0140.393−0.330−0.073−0.2100.4290.430−0.6630.748−0.4770.595
NO20.886−0.30810.4070.4000.0040.408−0.1670.721−0.6830.3160.438−0.4170.326−0.299
SO20.481−0.5710.40710.123−0.2330.3850.0600.256−0.290−0.3400.234−0.3150.180−0.097
PM100.4630.0140.4000.12310.1170.3720.3270.506−0.1130.315−0.1910.144−0.1150.254
Benzene0.0240.3930.004−0.2330.1171−0.2020.2780.3330.0430.181−0.2310.358−0.0100.388
Toluene0.470−0.3300.4080.3850.372−0.20210.4820.485−0.229−0.2620.143−0.217−0.167−0.225
Ethylbenzene0.049−0.073−0.1670.0600.3270.2780.48210.2420.177−0.337−0.1530.128−0.2680.244
p-Xylene0.643−0.2100.7210.2560.5060.3330.4850.2421−0.4170.1440.330−0.2840.209−0.180
Wind
speed
−0.6980.429−0.683−0.290−0.1130.043−0.2290.177−0.4171−0.269−0.7170.677−0.6710.466
Wind
direction
0.1130.4300.316−0.3400.3150.181−0.262−0.3370.144−0.2691−0.1200.1570.0320.039
Relative
humidity
0.449−0.6630.4380.234−0.191−0.2310.143−0.1530.330−0.717−0.1201−0.9710.749−0.758
Temperature−0.4170.748−0.417−0.3150.1440.358−0.2170.128−0.2840.6770.157−0.9711−0.7040.790
Pressure0.363−0.4770.3260.180−0.115−0.010−0.167−0.2680.209−0.6710.0320.749−0.7041−0.304
Solar
radiation
−0.2300.595−0.299−0.0970.2540.388−0.2250.244−0.1800.4660.039−0.7580.790−0.3041
(b) Autumn
Measured ParametersCOO3NO2SO2PM10BenzeneTolueneEthyl-benzenep-XyleneWind SpeedWind DirectionRelative HumidityTemperaturePressureSolar Radiation
CO1−0.6900.8570.4400.746−0.1560.0270.1770.163−0.4760.1750.557−0.5300.494−0.457
O3−0.6901−0.564−0.366−0.4770.012−0.1170.098−0.0380.5490.057−0.6810.847−0.4530.625
NO20.857−0.56410.3120.785−0.3440.0700.097−0.063−0.3790.0830.627−0.4940.503−0.590
SO20.440−0.3660.31210.3630.3940.1290.0120.121−0.6390.0960.058−0.1960.4150.177
PM100.746−0.4770.7850.3631−0.330−0.0030.146−0.066−0.369−0.2540.478−0.3630.729−0.249
Benzene−0.1560.012−0.3440.394−0.33010.1450.2030.330−0.2830.095−0.182−0.113−0.2100.297
Toluene0.027−0.1170.0700.129−0.0030.14510.2900.490−0.212−0.157−0.030−0.1280.1780.155
Ethylbenzene0.1770.0980.0970.0120.1460.2030.29010.6230.1830.0270.014−0.0700.0960.213
p-Xylene0.163−0.038−0.0630.121−0.0660.3300.4900.6231−0.1490.165−0.155−0.0090.0680.280
Wind
speed
−0.4760.549−0.379−0.639−0.369−0.283−0.2120.183−0.14910.016−0.3240.411−0.5190.061
Wind
direction
0.1750.0570.0830.096−0.2540.095−0.1570.0270.1650.0161−0.0550.065−0.403−0.156
Relative
humidity
0.557−0.6810.6270.0580.478−0.182−0.0300.014−0.155−0.324−0.0551−0.8720.583−0.691
Temperature−0.5300.847−0.494−0.196−0.363−0.113−0.128−0.070−0.0090.4110.065−0.8721−0.4750.661
Pressure0.494−0.4530.5030.4150.729−0.2100.1780.0960.068−0.519−0.4030.583−0.4751−0.101
Solar
Radiation
−0.4570.625−0.5900.177−0.2490.2970.1550.2130.2800.061−0.156−0.6910.661−0.1011
Spearman correlation coefficients in bold are significant at α = 0.05.
Table 6. PCA factor loadings for measured air pollutants in Leon during summer (a) and autumn (b).
(a) Summer
Factor LoadingsF1F2F3F4
CO0.709
O30.673
NO20.503
SO20.399
PM100.428
Benzene0.350
Toluene0.301
Ethylbenzene0.445
p-Xylene0.413
Wind speed0.615
Wind direction0.743
Relative Humidity0.789
Temperature0.773
Pressure0.498
Solar Radiation0.357
(b) Autumn
Factor LoadingsF1F2F3
CO0.846
O30.784
NO20.585
SO20.309
PM100.637
Benzene0.651
Toluene0.365
Ethylbenzene0.658
p-Xylene0.705
Wind speed0.430
Wind direction
Relative humidity0.692
Temperature0.767
Pressure0.545
Solar Radiation
Only statistically significant loadings are shown.

