Article

Characteristics of Black Carbon Particle-Bound Polycyclic Aromatic Hydrocarbons in Two Sites of Nanjing and Shanghai, China

1
Jiangsu Key Laboratory of Atmospheric Environment Monitoring and Pollution Control, Collaborative Innovation Center of Atmospheric Environment and Equipment Technology, School of Environmental Sciences and Engineering, Nanjing University of Information Science and Technology, Nanjing 210044, China
2
School of Earth Sciences, Zhejiang University, Hangzhou 310027, China
3
State Environmental Protection Key Laboratory of Formation and Prevention of Urban Air Pollution Complex, Shanghai Academy of Environmental Sciences, Shanghai 200233, China
*
Author to whom correspondence should be addressed.
Submission received: 6 February 2020 / Accepted: 11 February 2020 / Published: 14 February 2020
(This article belongs to the Special Issue Sources and Composition of Ambient Particulate Matter)

Abstract

:
Airborne polycyclic aromatic hydrocarbons (PAHs) are of great concern to human health due to their potential high toxicity. Understanding the characteristics and sources of PAHs, as well as the governing factors, is therefore critical. PAHs and refractory black carbon (rBC) are both from combustion sources. This work, for the first time, investigated exclusively the rBC-bound PAH properties by using a laser-only Aerodyne soot-particle aerosol mass spectrometer (SP-AMS). This technique offers highly time-resolved PAH results that a traditional offline measurement is unable to provide. We analyzed two datasets conducted in urban Shanghai during the fall of 2018 and in suburban Nanjing during the winter of 2017, respectively. Results show that the average concentration of PAHs in Nanjing was much higher than that in Shanghai. Nanjing PAHs contained more low molecular weight components while Shanghai PAHs contained more high molecular weight ones. PAHs in Shanghai presented two peaks in early morning and evening, while Nanjing PAHs had only one significant morning peak, but remained high throughout the nighttime. A multi-linear regression algorithm combined with positive matrix factorization (PMF) analyses on sources of PAHs reveals that the industry emissions contributed the majority of PAHs in Nanjing (~80%), while traffic emissions dominated PAHs in Shanghai (~70%). We further investigated the relationships between PAHs with various factors. PAHs in both sites tended to positively correlate with primary pollutants, including primary organic aerosol (OA) factors, and gaseous pollutants of CO, NO2 and SO2, but negatively correlated with secondary OA factors and O3. This result highlights the enhancement of rBC-bound PAHs level due to primary emissions and their oxidation loss upon atmospheric aging reactions. High concentration of PAHs seemed to frequently appear under low temperature and high relative humidity conditions, especially in Shanghai.

1. Introduction

Polycyclic aromatic hydrocarbons (PAHs) are a group of organic species that are ubiquitously present in ambient air, derived mainly from anthropogenic sources, including incomplete combustion or pyrolysis of fossil fuels (such as gasoline, diesel, and coal), solid waste, as well as biomass [1,2,3,4,5,6]. PAHs themselves are known to possess high health hazards [7,8,9,10]. When emitted into the air, PAHs can be further oxidized into other PAH derivatives (such as nitrated and oxygenated PAHs), which are likely more toxic and carcinogenic and have longer atmospheric lifetimes than their parent PAHs [11,12,13,14,15]. Studies on concentrations, size distributions, sources, chemical transformations, as well as the spatial distributions and temporal variations of airborne PAHs, are therefore essential.
As is well known, identification and quantification of PAHs are typically conducted by offline analysis of filter extracts by using the gas chromatography mass spectrometry (GC-MS) technique [16,17], which also has the advantage to differentiate PAH isomers with the same molecular weight (MW). Of course, filter samples often require longer collection time, resulting in lower temporal resolution, which sometimes limit detailed investigations on quick changes of PAH behaviors in ambient [18]. Sampling artifacts are also difficult to eliminate during offline analysis. Online measurement techniques are also developed in the past decades, including the photoelectric aerosol sensor (PAS) [17,19] and Aerodyne aerosol mass spectrometry (AMS) [20]. AMS is an instrument that is designed to determine the aerosol concentration, composition, and size distribution in real time with very fine time resolution. Dzepina et al. [20] first proposed the method to determine PAHs via the quadruple-AMS, and such method can be used by other versions of Aerodyne AMS, such as the high resolution-AMS (HR-AMS) [21,22] and soot-particle AMS (SP-AMS) [23]. A number of studies have used this method to quantify particulate PAHs, studied the chemical evolution of PAHs [16,24,25,26], as well as PAH emissions from specific sources, including biomass burning [27] and vehicle emissions [28]. The AMS technique offers unique highly time-resolved results on PAHs, whereas offline GC-MS measurement cannot.
Note the emission sources of PAHs are similar as those of refractory black carbon (rBC) or soot, and PAHs are in fact intermediates during soot formation [29], and can be converted to soot during combustion [28,30,31]. Different PAH compounds have different gas-to-particle partitioning properties [32,33,34]. PAHs with relatively large numbers of benzene rings mainly exist in fine particles [35], and those with smaller MWs may partition into gas phase [36]. In addition, some studies have shown that the particle-bound PAHs can react with ozone (O3), and form a viscous layer to protect the underlying PAHs from ozonolysis, so that prolongs their chemical lifetimes [37]. Therefore, the PAHs co-emitted with rBC particles might evaporate or be oxidized into other species during their atmospheric transport; PAHs that are emitted separately from rBC may coagulate or adsorb on rBC particles as well. As an aerosol component, rBC also exerts adverse effects on human health [38], although not as toxic as PAHs when inhaling the same amount. Studies of the rBC-bound PAH properties, and its correlation with other factors, can advance our understanding on both rBC and PAH properties, as well as the health co-benefits from rBC and PAH reductions.
The Aerodyne SP-AMS is the most advanced version of Aerodyne AMS, which uses an intra-cavity infrared laser to measure rBC, and another thermal vaporizer to measure non-refractory materials [39]. If we remove the thermal vaporizer, the SP-AMS can exclusively measure rBC-containing particles only, acquiring the concentration, size, and composition of both rBC cores and any species that coat on rBC cores [40,41], including, of course, rBC-bound PAHs. In this study, we aim to use the SP-AMS technique to elucidate the characteristics of the PAHs species associated with rBC particles in two representative megacities in the Yangtze River Delta (YRD) region of China, investigate their concentrations, source contributions, as well as their relationships with a series of factors, including different primary and secondary particle-phase components, gas-phase pollutants, and meteorological parameters.

2. Experiments

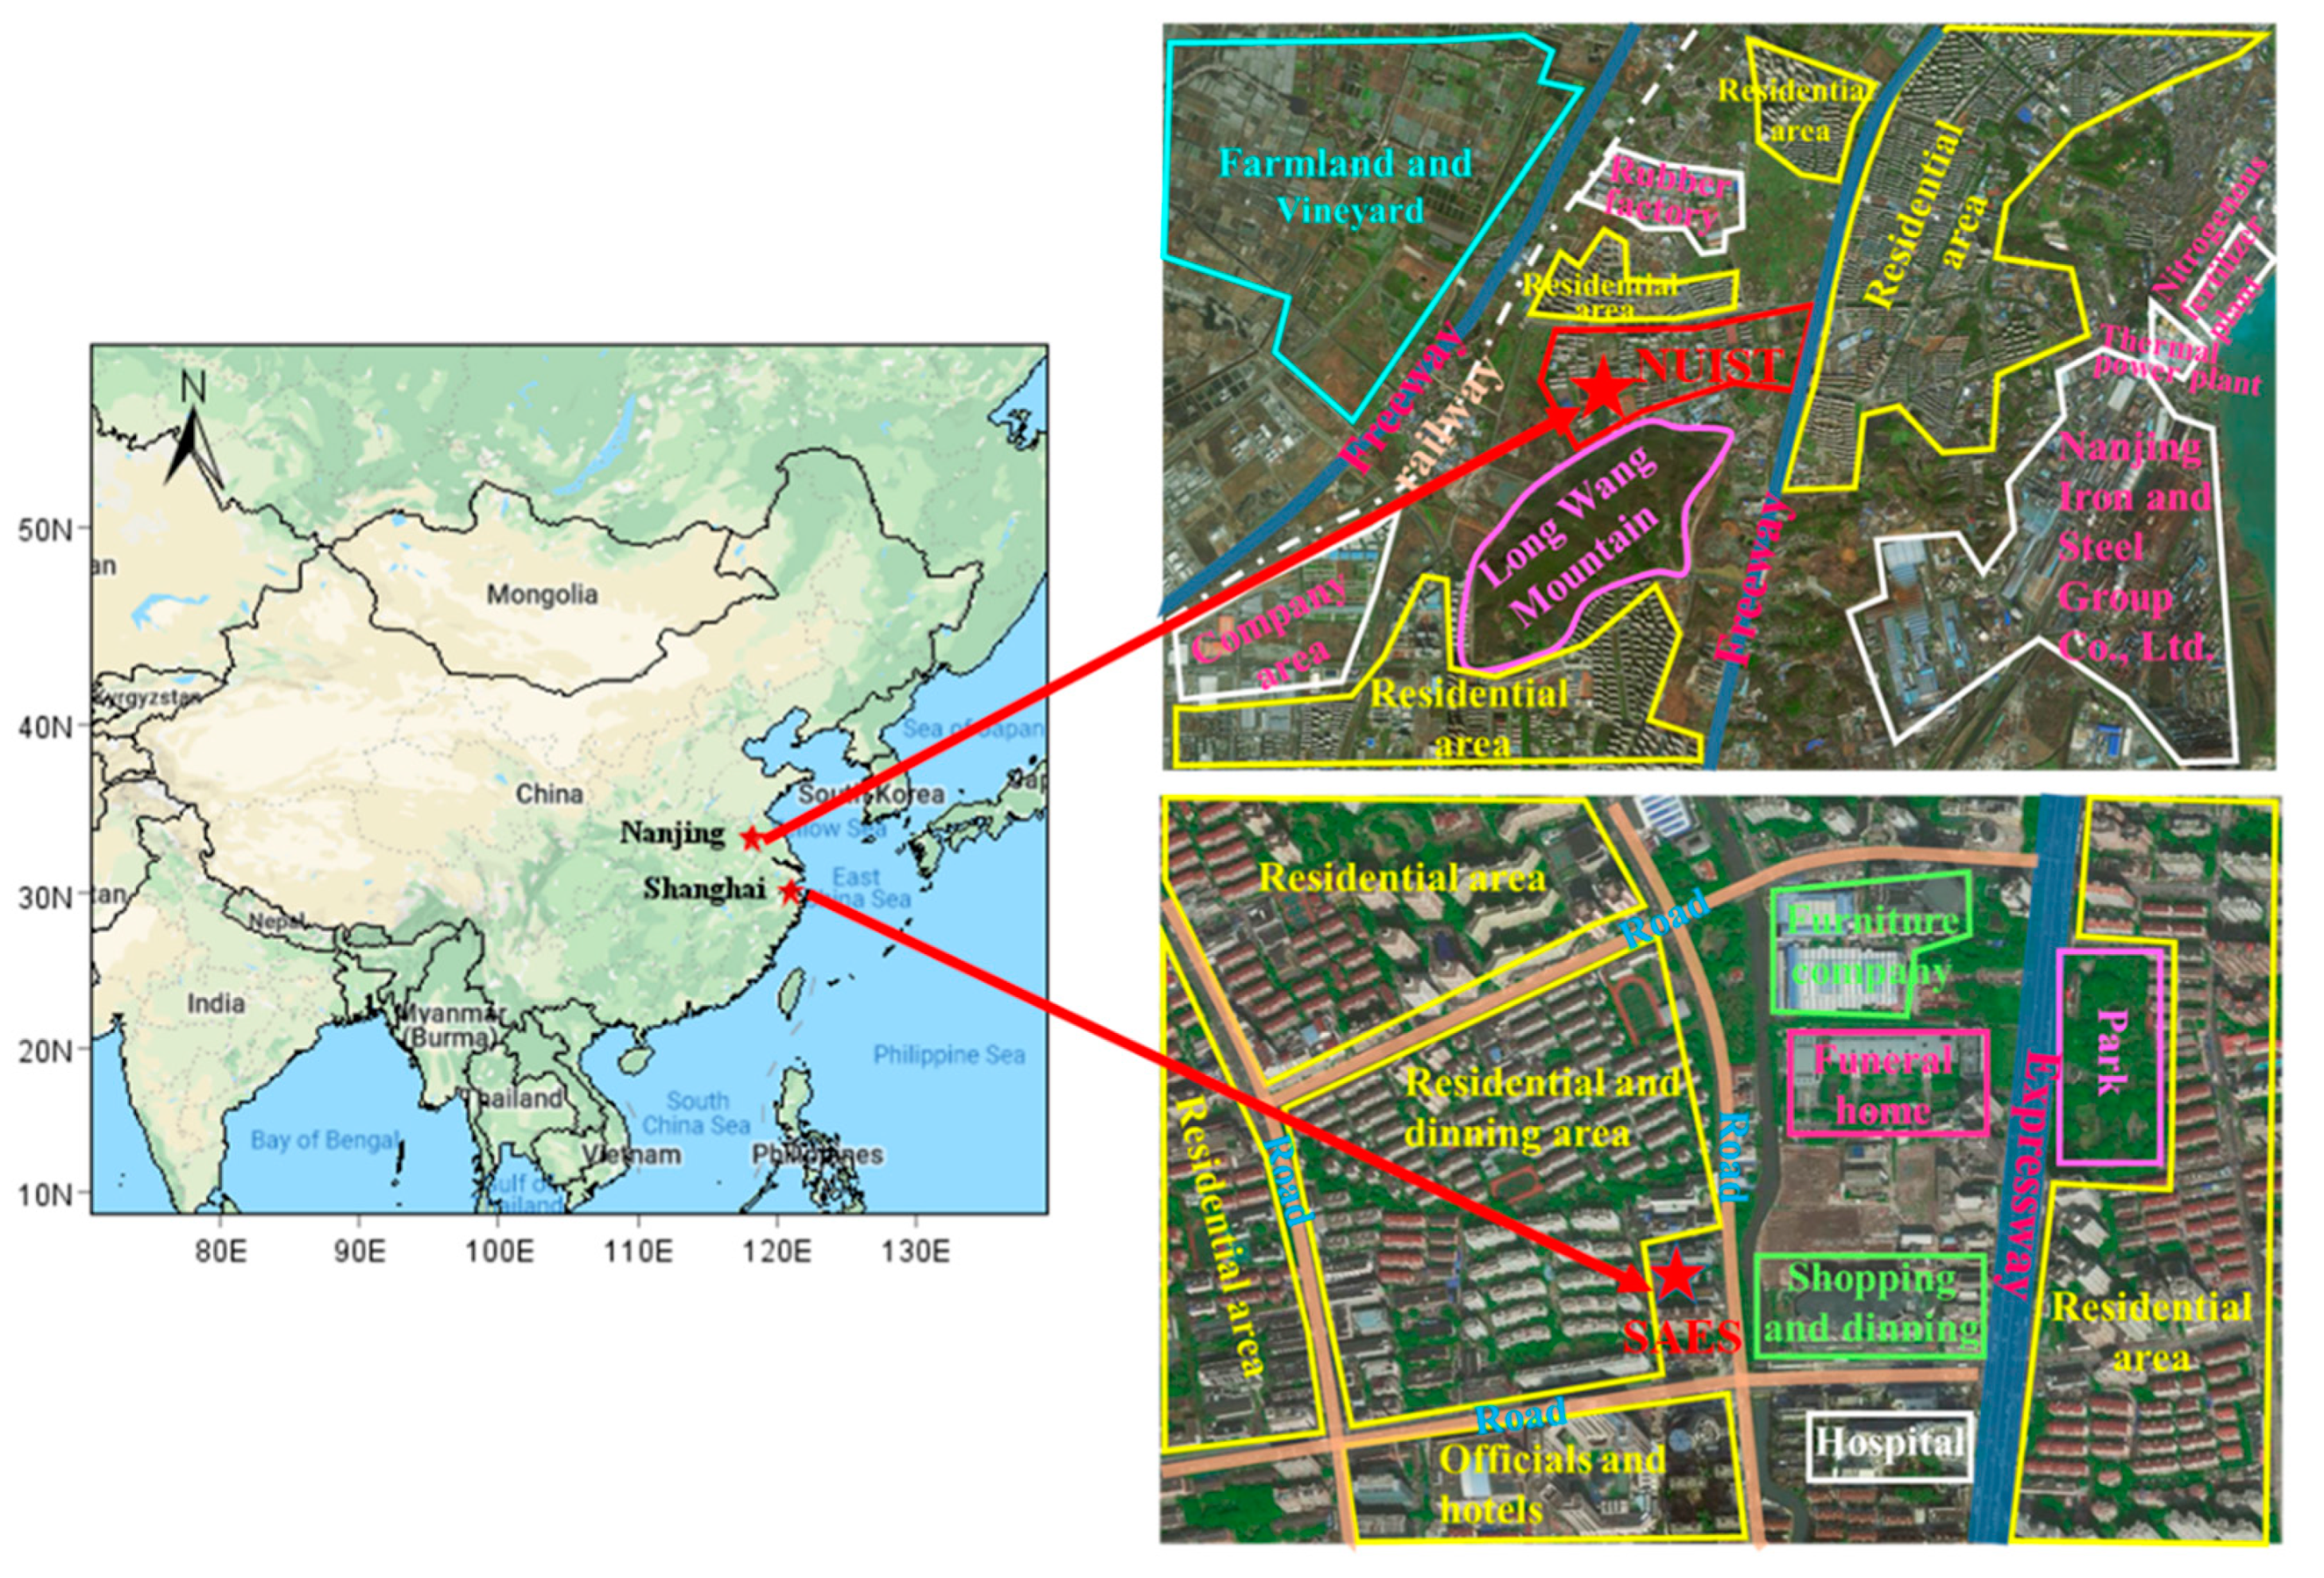
2.1. Sampling Sites and Instrumentation

In this study, we conducted SP-AMS measurements in two megacities (as shown in Figure 1). The first study was performed during winter in suburban Nanjing (from 23 January to 24 February, 2017). The SP-AMS was deployed inside the campus of Nanjing University of Information Science and Technology (NUIST). The site was mainly affected by nearby industrial emissions (petrochemical plants, chemical plants, power plants, ironmaking, and steelmaking plants, etc.), residential activities, and road traffic (Nanjing Jiangbei expressway), as marked in Figure 1. The dataset is denoted as NUIST hereafter. The second campaign was performed in urban Shanghai from 31 October to 2 December, 2018. The sampling site was located inside the Shanghai Academy of Environmental Sciences (SAES). It was surrounded by business buildings, and influenced mainly by dense residential and traffic activities (Figure 1). The dataset is denoted as SAES hereafter. The two sites both locate in the densely populated YRD region, but under different environments as indicated above. Therefore, comparison of their results may provide useful insights into the ambient PAH properties emitted from different sources. Of course, since we only have one SP-AMS, it should be noted that the results from two sites were not for the same period, but both measurements were performed in seasons with relatively high particular matter (PM) pollution.
During these two campaigns, the laser-only mode of SP-AMS was operated to measure rBC-containing particles only. More instrument details can be found in our previous work [41]. Concentrations of major gas pollutants (CO, NO2, SO2, and O3) and the meteorological parameters (temperature, relative humidity, wind speed, and direction) were determined simultaneously in parallel with aerosol measurements in both sites.

2.2. PAHs Quantification and Source Apportionment

The SP-AMS data were analyzed by using Igor Pro 6.37 (WaveMetrics, Oregon, USA) with the SQUIRREL (version 1.59D) and PIKA (1.19D) data analysis toolkit (publicly available from: http://cires1.colorado.edu/jimenez-group/ToFAMSResources/ToFSoftware/index.html#Upgrade). The SP-AMS laser can evaporate the rBC-containing particles, and all species are subjected to 70 eV electron impact (EI) ionization [38], and we can obtain signals of ion fragments from these species. Most PAHs existing in particle phase in ambient air have relatively high molecular weight (>200 g/mol). Based on possible molecular formulas of PAHs and mass-to-charge (m/z) ratios of corresponding fragments, and the fact that PAHs are very resistant to fragmentation (which means that the molecular ions represent most signals of the corresponding parent PAH compounds), Dzepina et al. [20] proposed a well-validated method to identify different PAH compounds and calculate the total PAHs mass concentration. Here, the same methodology was adopted to determine the mass loadings of rBC-bound PAHs in Shanghai and Nanjing. A relative ionization efficiency of 1.4 was used here for PAHs quantification, consistent with previous studies [21,22,26].
Positive matrix factorization (PMF) [42] was employed to deconvolute the rBC-associated organic aerosol (OA) species to a few factors indicative of specific sources or processes. It is a receptor-only model, which requires no prior information about factor profiles or time series. Ulbrich et al. [43] developed an evaluation software tool with a user-friendly interface, which allows us to conduct the PMF analysis on AMS data. Zhang et al. [44] further provide standard procedures to evaluate PMF solutions and choose the optimal one. For NUIST dataset, five OA factors were resolved, as detailed in Wu et al. [45]. Note in Wu et al. [45], the PMF results were used to elucidate the relationship of OA with hygroscopicity of rBC-containing particles, while characteristics of rBC-bound PAHs were not discussed. For the SAES dataset, PMF analysis was conducted on the OA mass spectra including ions with m/zs of 12 to 120. The OA mass spectral matrix was further pre-processed by removing ions with low signal-to-noise ratio (SNR<0.2), down-weighting of ions with SNR of 0.2–2.0, and some time points appearing to be outliers. PMF solutions with a different number of factors, varying fpeak values (rotations), and seeds (initial values) were also systematically explored, and finally a six-factor solution was chosen to be the best solution. More details regarding the diagnostic and justification of the PMF results of SAES dataset are presented in Cui et al. [46]; note that work focuses on the chemical properties and aging process of rBC-containing particles, while current work aims to elucidate PAH properties, and compare it with those in Nanjing.
After we obtained the time series of PMF factors, a multi-linear regression method was applied to apportion the PAHs and rBC signals to different sources for NUIST and SAES datasets, respectively (details in Section 3.2). Such method has been used in our previous work to quantify sources of fullerene soot [47], and in some other studies for rBC [48]. Correlation analyses were also performed on PAHs with other aerosol components, gaseous pollutants, as well as meteorological parameters.

3. Results and Discussion

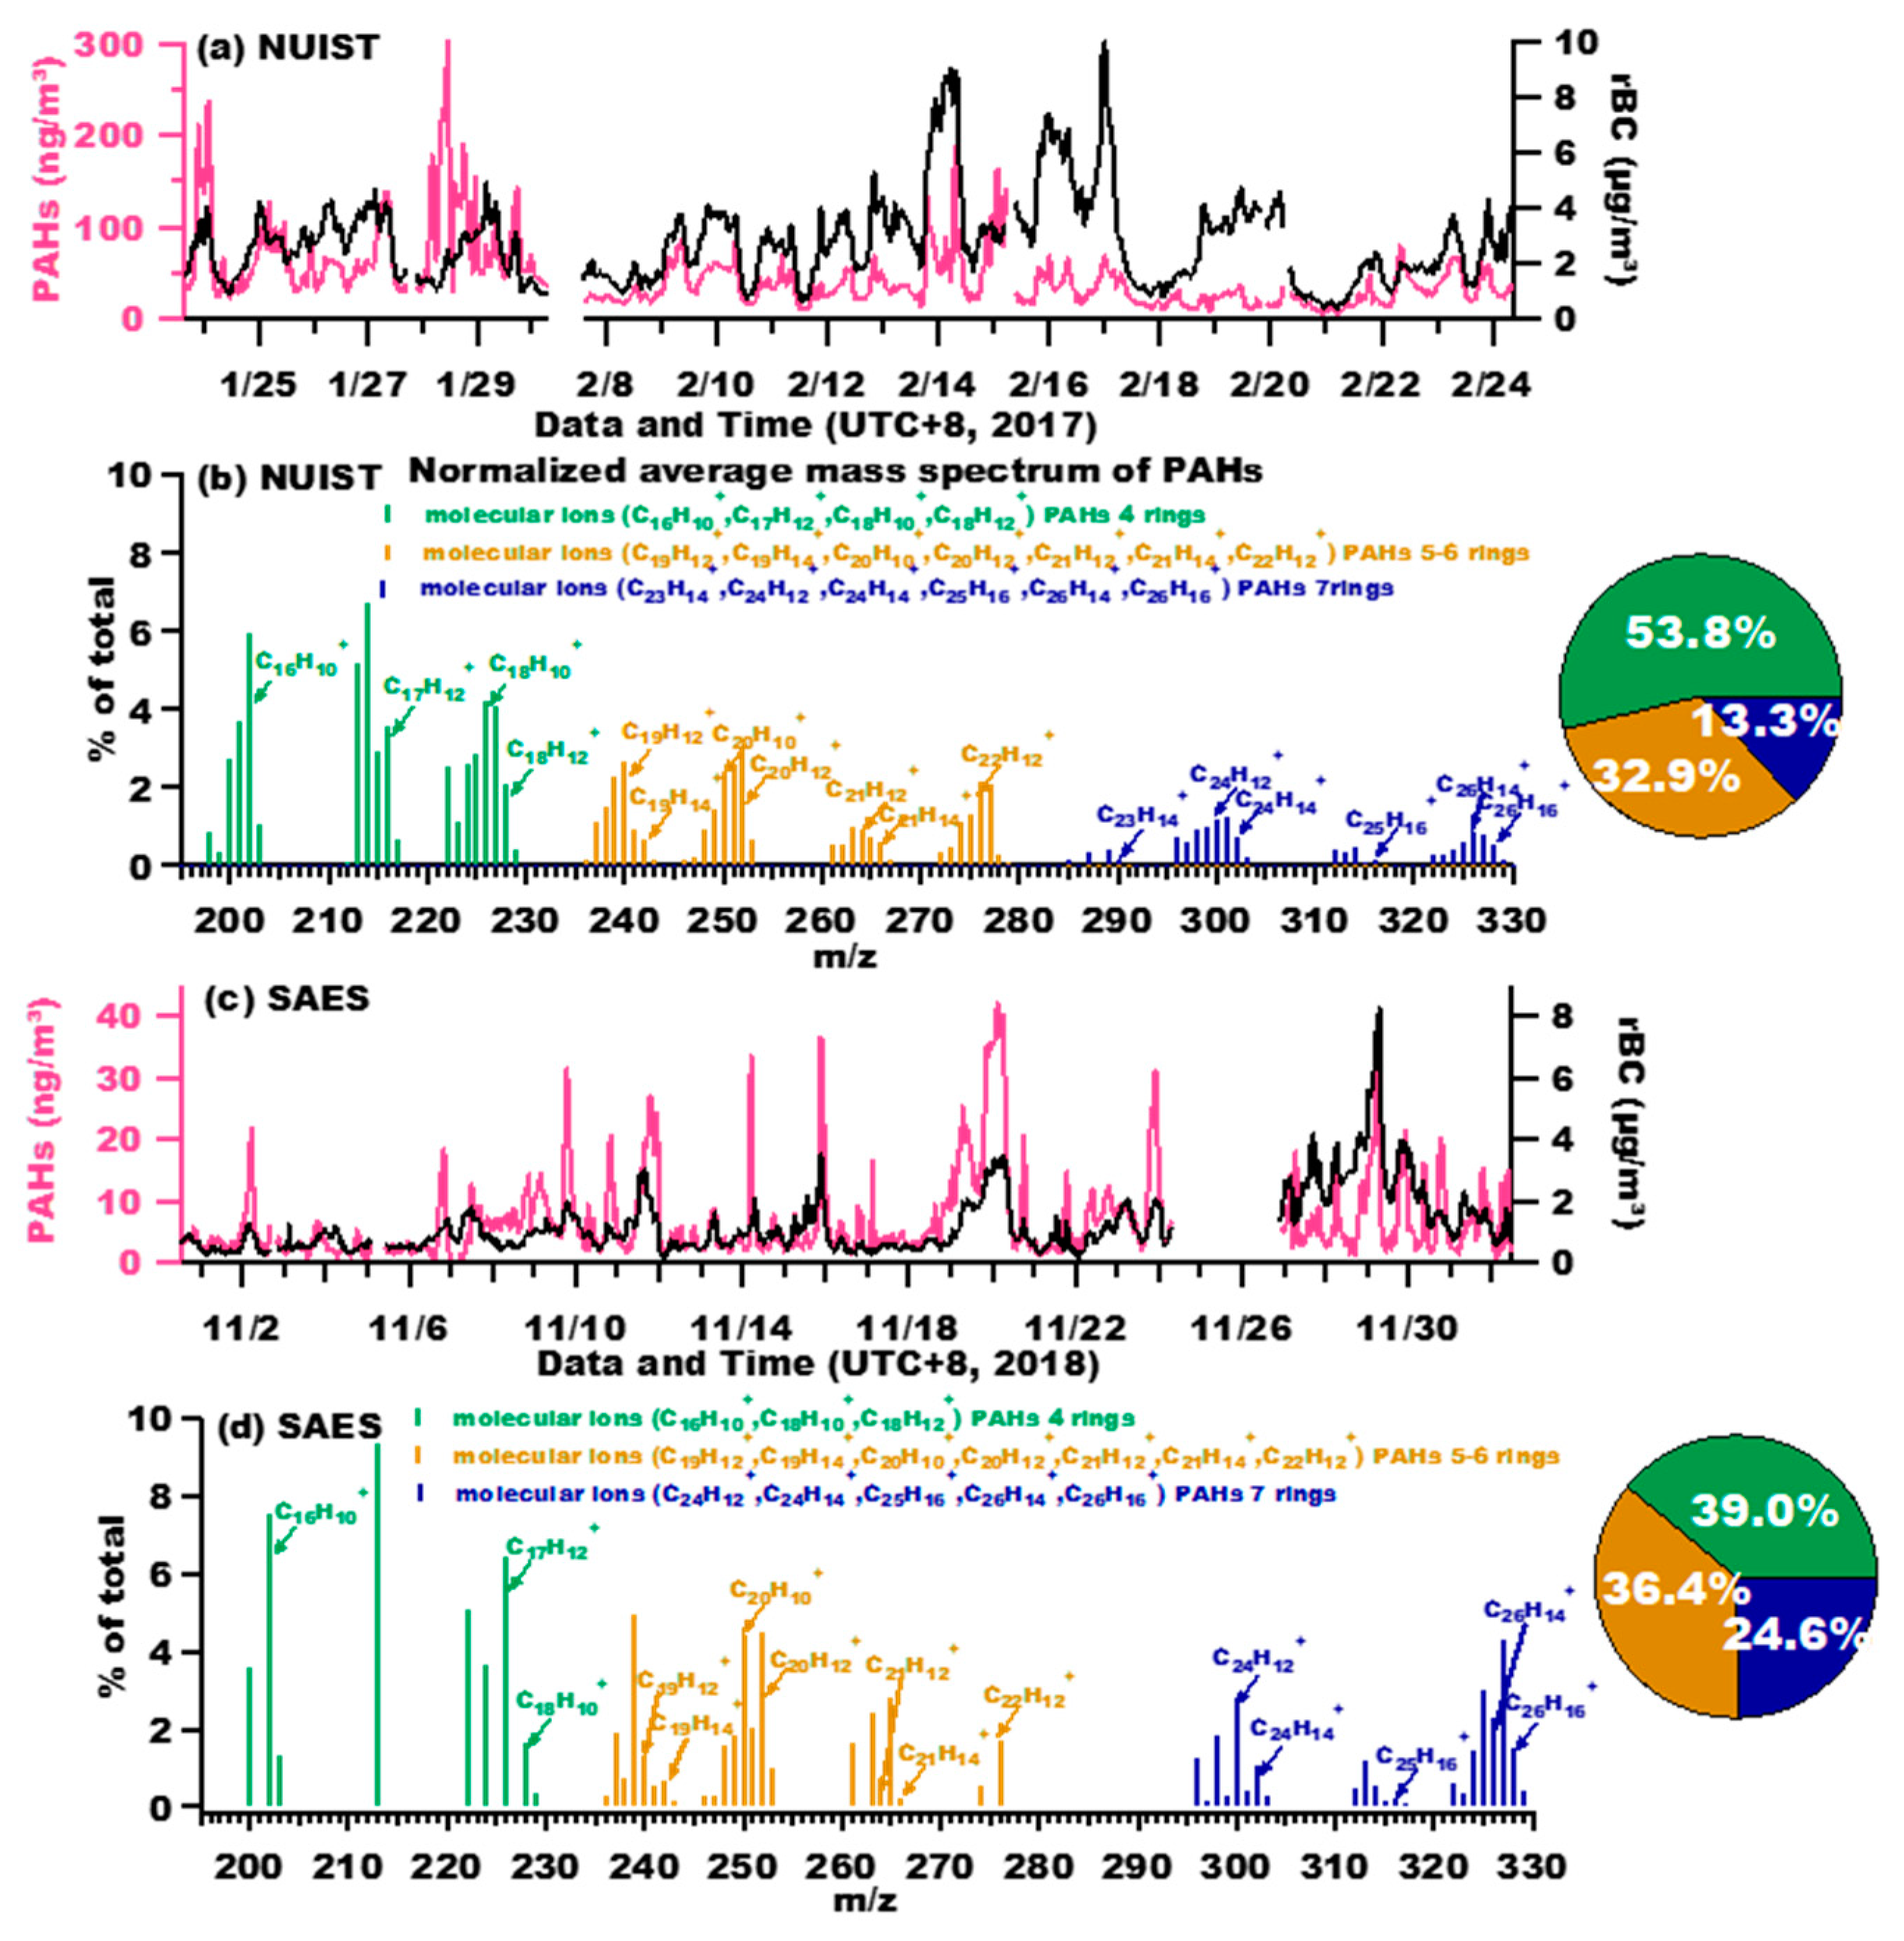
3.1. Overview of PAHs Concentration and Distribution

Figure 2 presents the mass concentrations of rBC and rBC-bound PAHs, normalized mass spectrum of PAHs, and mass contributions of different groups of PAHs. The rBC-bound PAHs concentration in NUIST ranged from 5.4 to 301.9 ng/m3, with an average value of 46.0( ± 38.0) ng/m3 (mean ± one standard deviation). This average PAHs level is lower than, but in a similar order as that measured by offline GC-MS in the same location (64.3 ng/m3) during winter of 2014–2015 [49]. PAHs concentration in SAES varied from 0.38 to 42.25 ng/m3, with a mean of 6.6( ± 6.9) ng/m3. This PAHs level is much lower than that of NUIST, but is in the same order of previous reported values of 7.2 ng/m3 (suburban area) and 6.5 ng/m3 (urban area) in Shanghai [50]. Considering that we only measured the portion of PAHs bound with rBC, lower levels therefore could be anticipated. Overall, the results show that PAHs pollution in suburban Nanjing, at least during winter, was more significant than that during fall in Shanghai, likely due to enhanced emissions from nearby industry activities around NUIST; much more heavy-duty diesel trucks around NUIST (no restrictions on those vehicles around this site) than those around SAES might also add the rBC-bound PAH emissions.
Correspondingly, average rBC concentrations in NUIST and SAES were 2.76 (±1.60) and 1.21 (±0.99) μg/m3, and the mean mass ratios of rBC-bound PAHs to rBC were 0.0167 and 0.0055, respectively. Moderate correlations were found between time series of PAHs and rBC (0.53 of NUIST and 0.62 of SAES), and there were periods with relatively high PAHs loadings, yet low rBC concentrations (for example, 28 January, 2017 in NUIST), and vice versa (16–18 February, 2017 in NUIST) (Figure 2a). Both results point to different source contributions to and/or influences of atmospheric processes on PAHs and rBC. This is discussed in detail in the following sections.
Figure 2b,d display the normalized mass spectra of PAHs in NUIST and SAES, respectively. The fragments were grouped into PAHs with 4 rings, 5-6 rings, and 7 rings. For NUIST, relatively low MW 4-ring PAHs were dominant (53.8%), followed by 5-6 ring PAHs (32.9%), and 7-ring PAHs (13.3%). In contrast, for SAES, mass contribution of 4-ring PAHs was much less (39.0%), while high MW 7-ring ones became more important (24.6%), and contribution of 5-6 ring PAHs (36.4%) were similar to that of NUIST. Since different groups of PAHs have different gas-to-particle partitioning properties and vapor pressures, different distributions of PAHs in NUIST and SAES might lead to their distinct atmospheric behaviors.
Figure 3 illustrates the diurnal variations of rBC, rBC-bound PAHs and mass ratios of PAHs to rBC. For NUIST, both rBC and PAHs presented morning peaks (3.39 μg/m3 of rBC, and 68.76 ng/m3 of PAHs) likely due to elevated traffic or industrial emissions. They had minimums (1.91 μg/m3 of rBC, and 29.47 ng/m3 of PAHs) in the afternoon, probably owing to emission decrease and the dilution effect by elevated planetary boundary layer (PBL) height, etc.; their concentrations rose continuously in the early evening and remained at a high level throughout the nighttime. PAHs/rBC ratios also showed a morning peak and an afternoon minimum, reflecting the semi-volatile behavior of PAHs (high evaporation loss due to high temperature in the afternoon) and possible loss due to photochemical reactions of PAHs with atmospheric oxidants. For SAES, beside the morning peaks (1.56 μg/m3 of rBC, and 10.23 ng/m3 of PAHs) and afternoon minimums (1.02 μg/m3 of rBC, and 4.96 ng/m3 of PAHs), early evening peaks of rBC (1.35 μg/m3) and PAHs (11.86 ng/m3) were more apparent than those in NUIST. Such differences between the two datasets may be attributed to diverse source contributions: the NUIST site was affected significantly by industrial emissions, which were relatively stable, and the early evening increases were probably owing to a decrease of PBL height. Meanwhile, the SEAS site was predominantly governed by traffic emissions; therefore, in addition to the PBL influence, evening rush hour traffic stood out and led to more obvious enhancements.

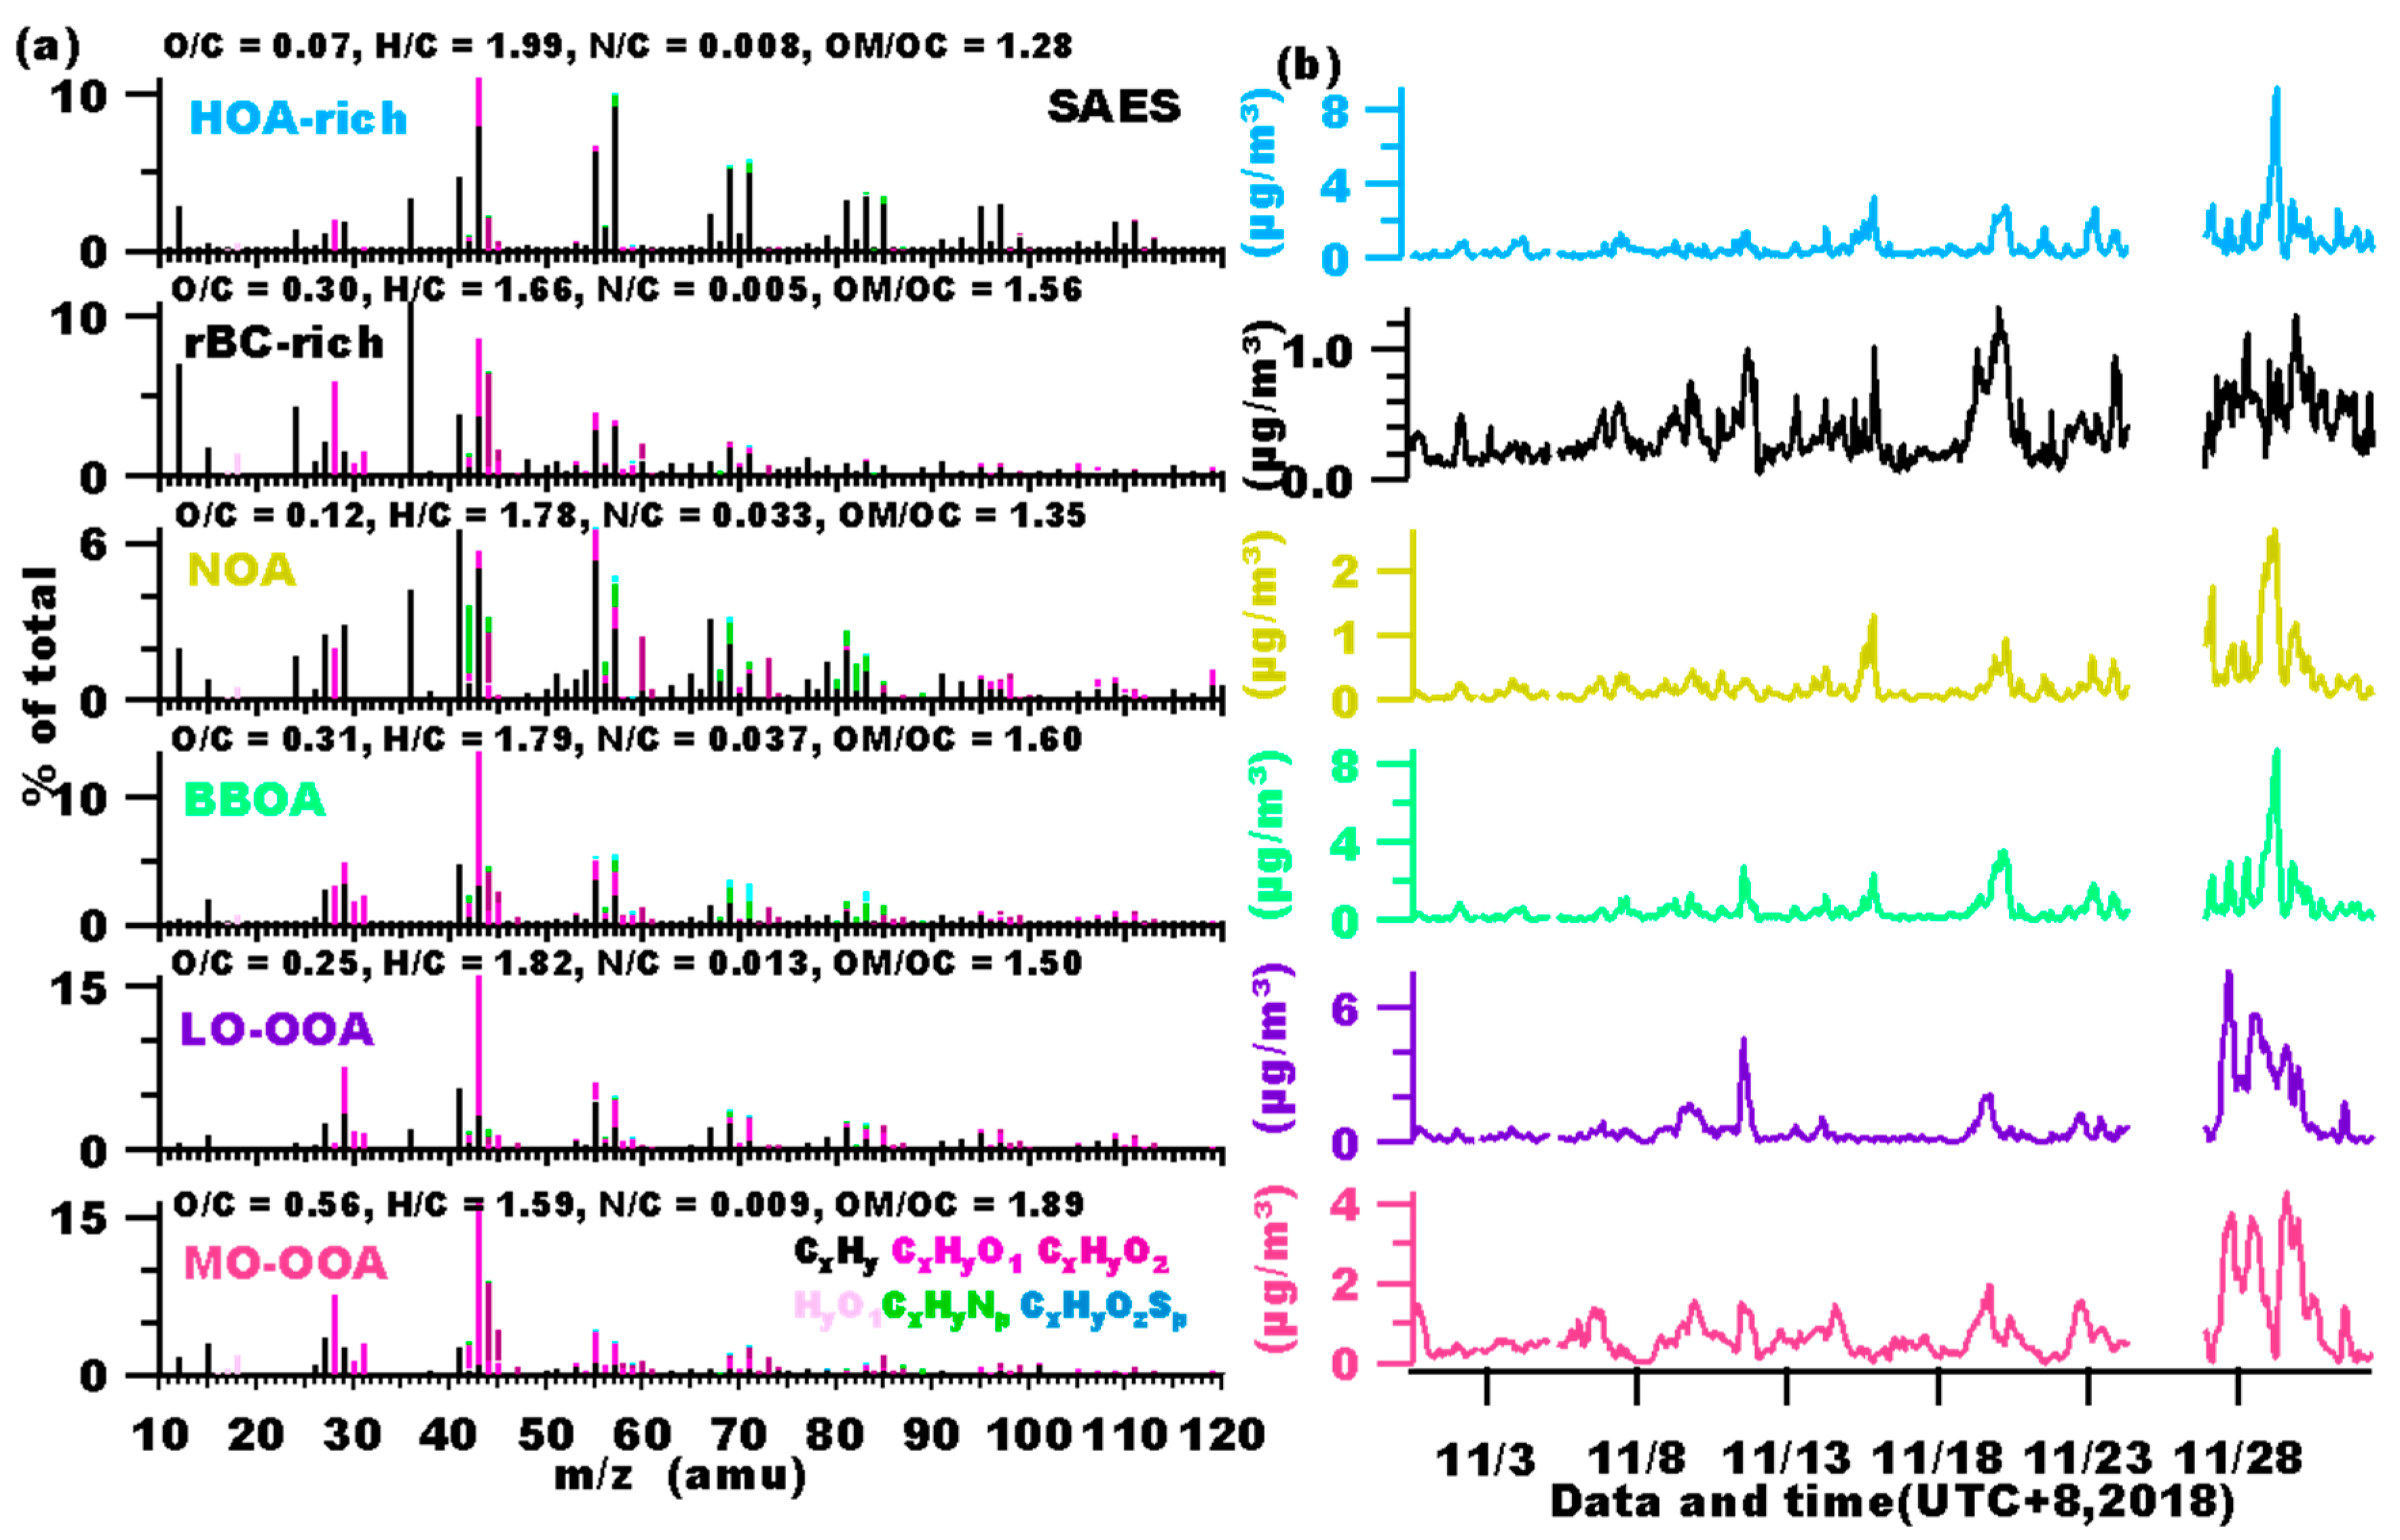
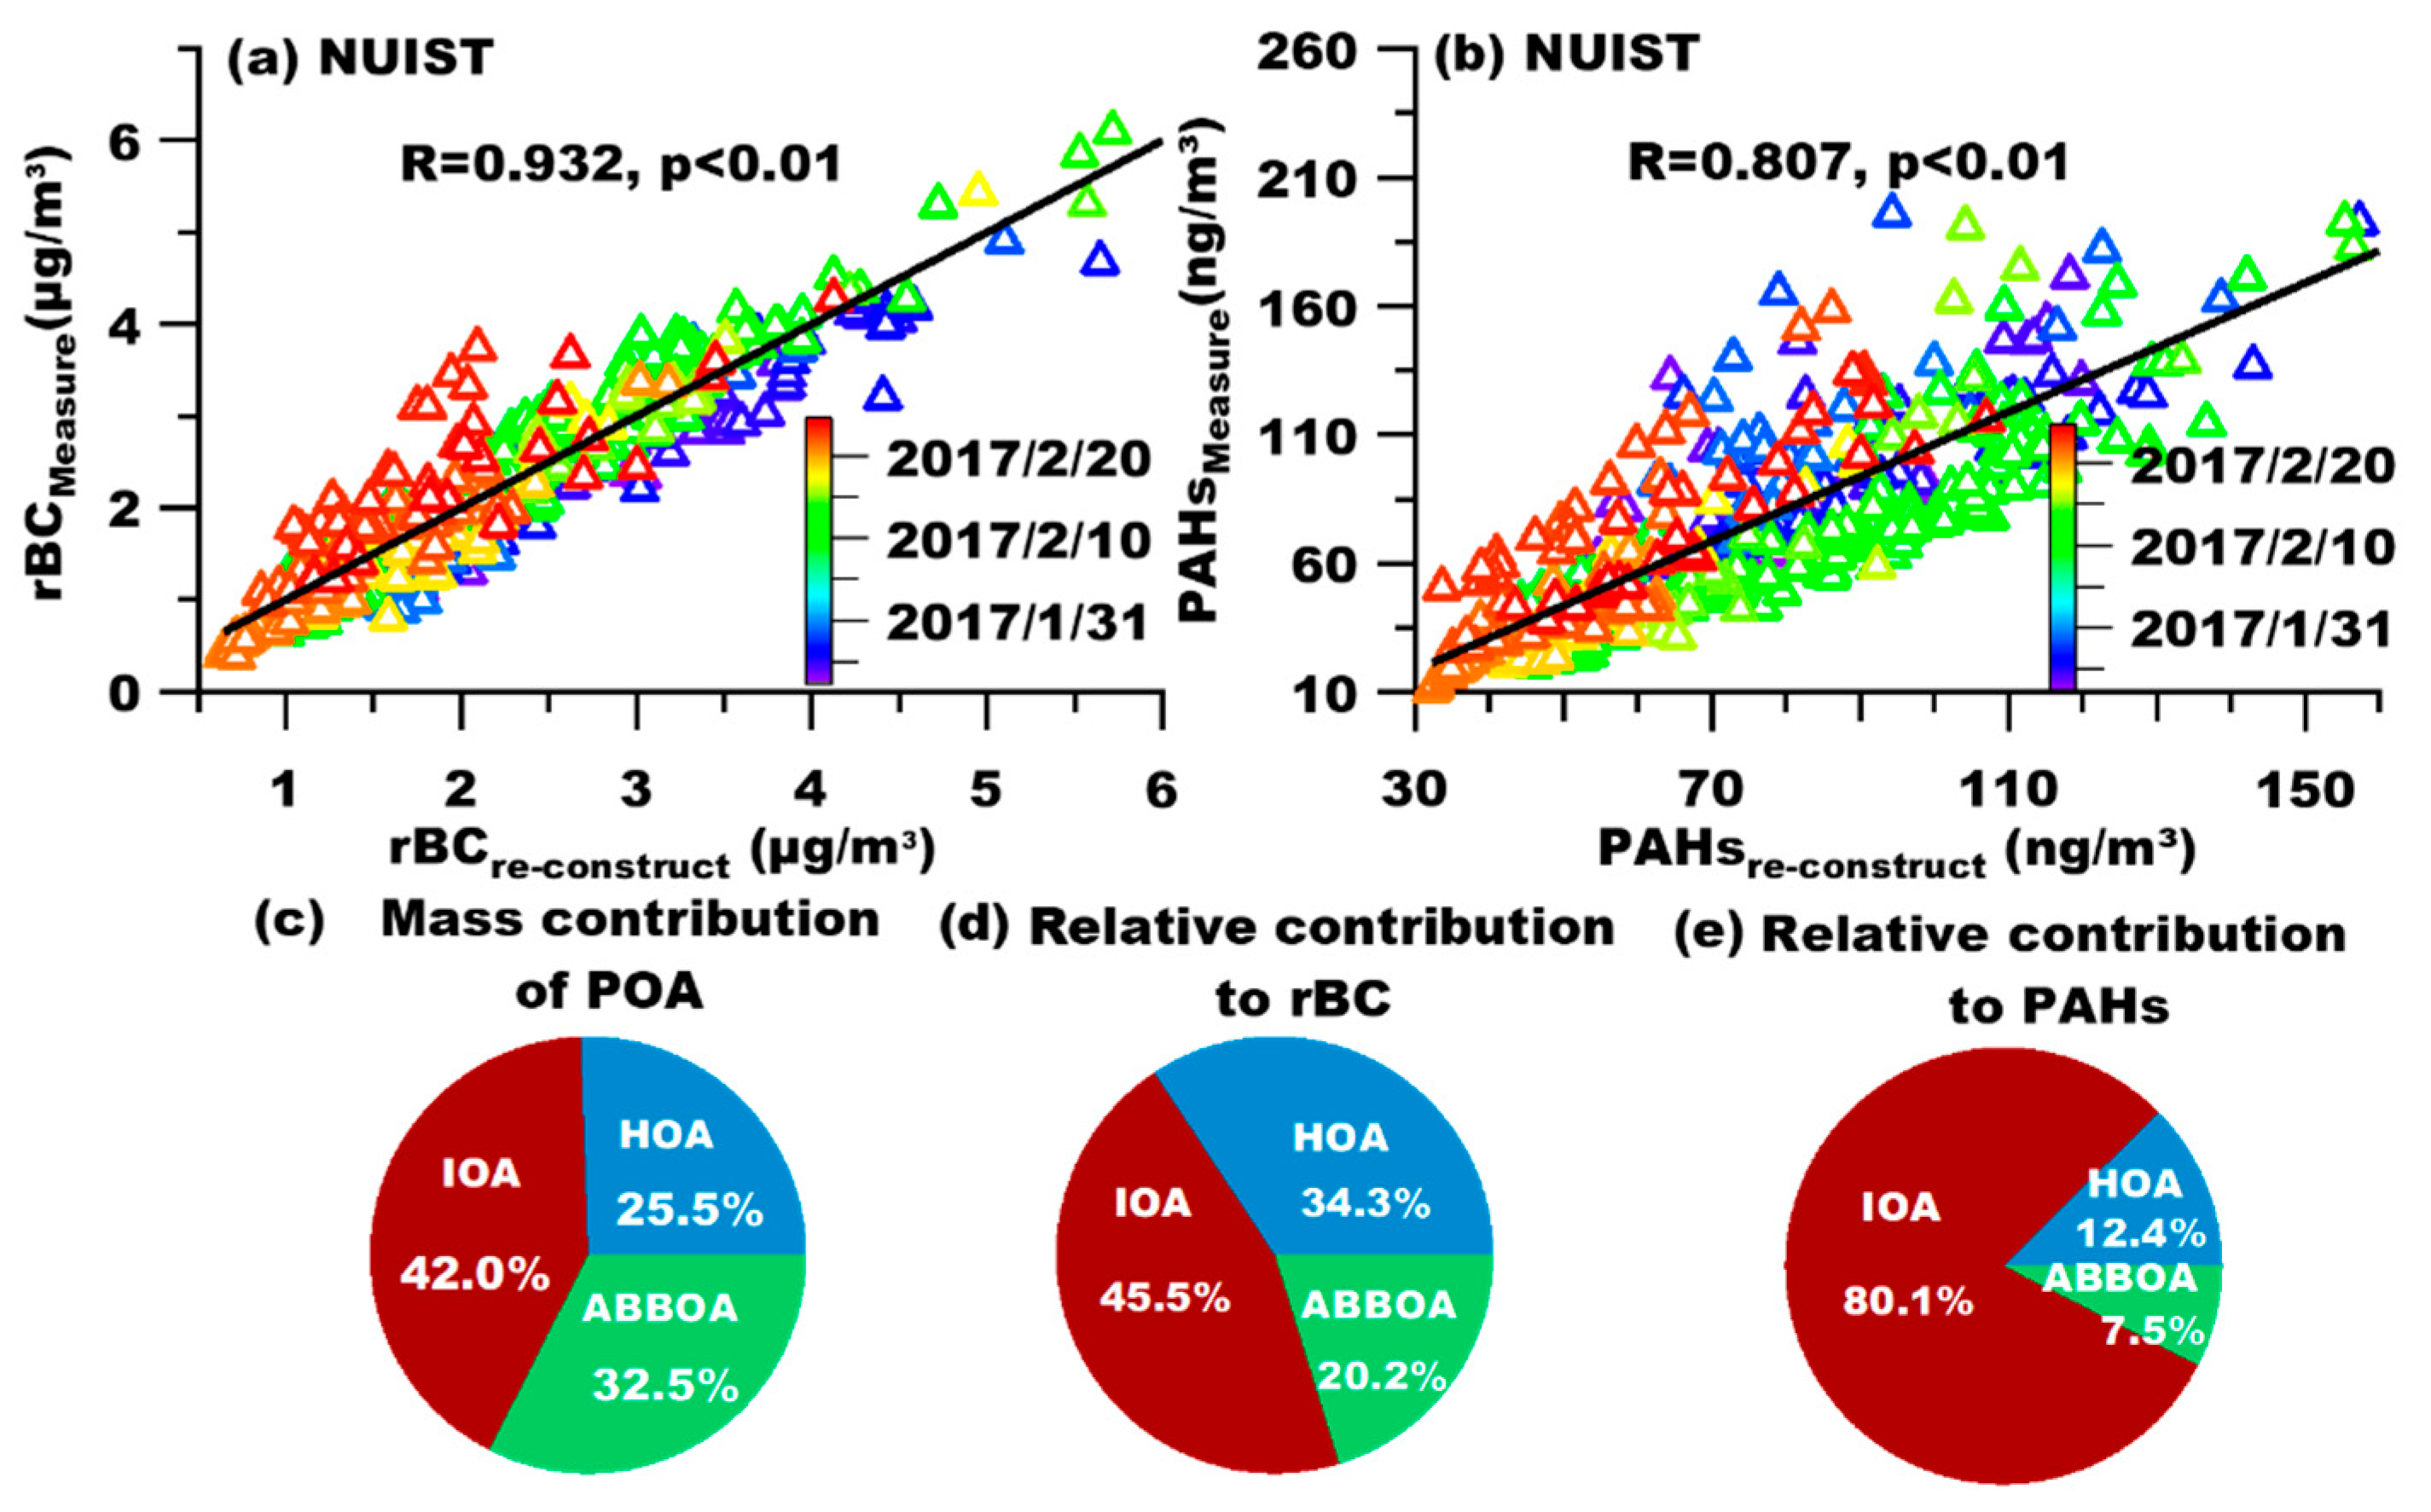
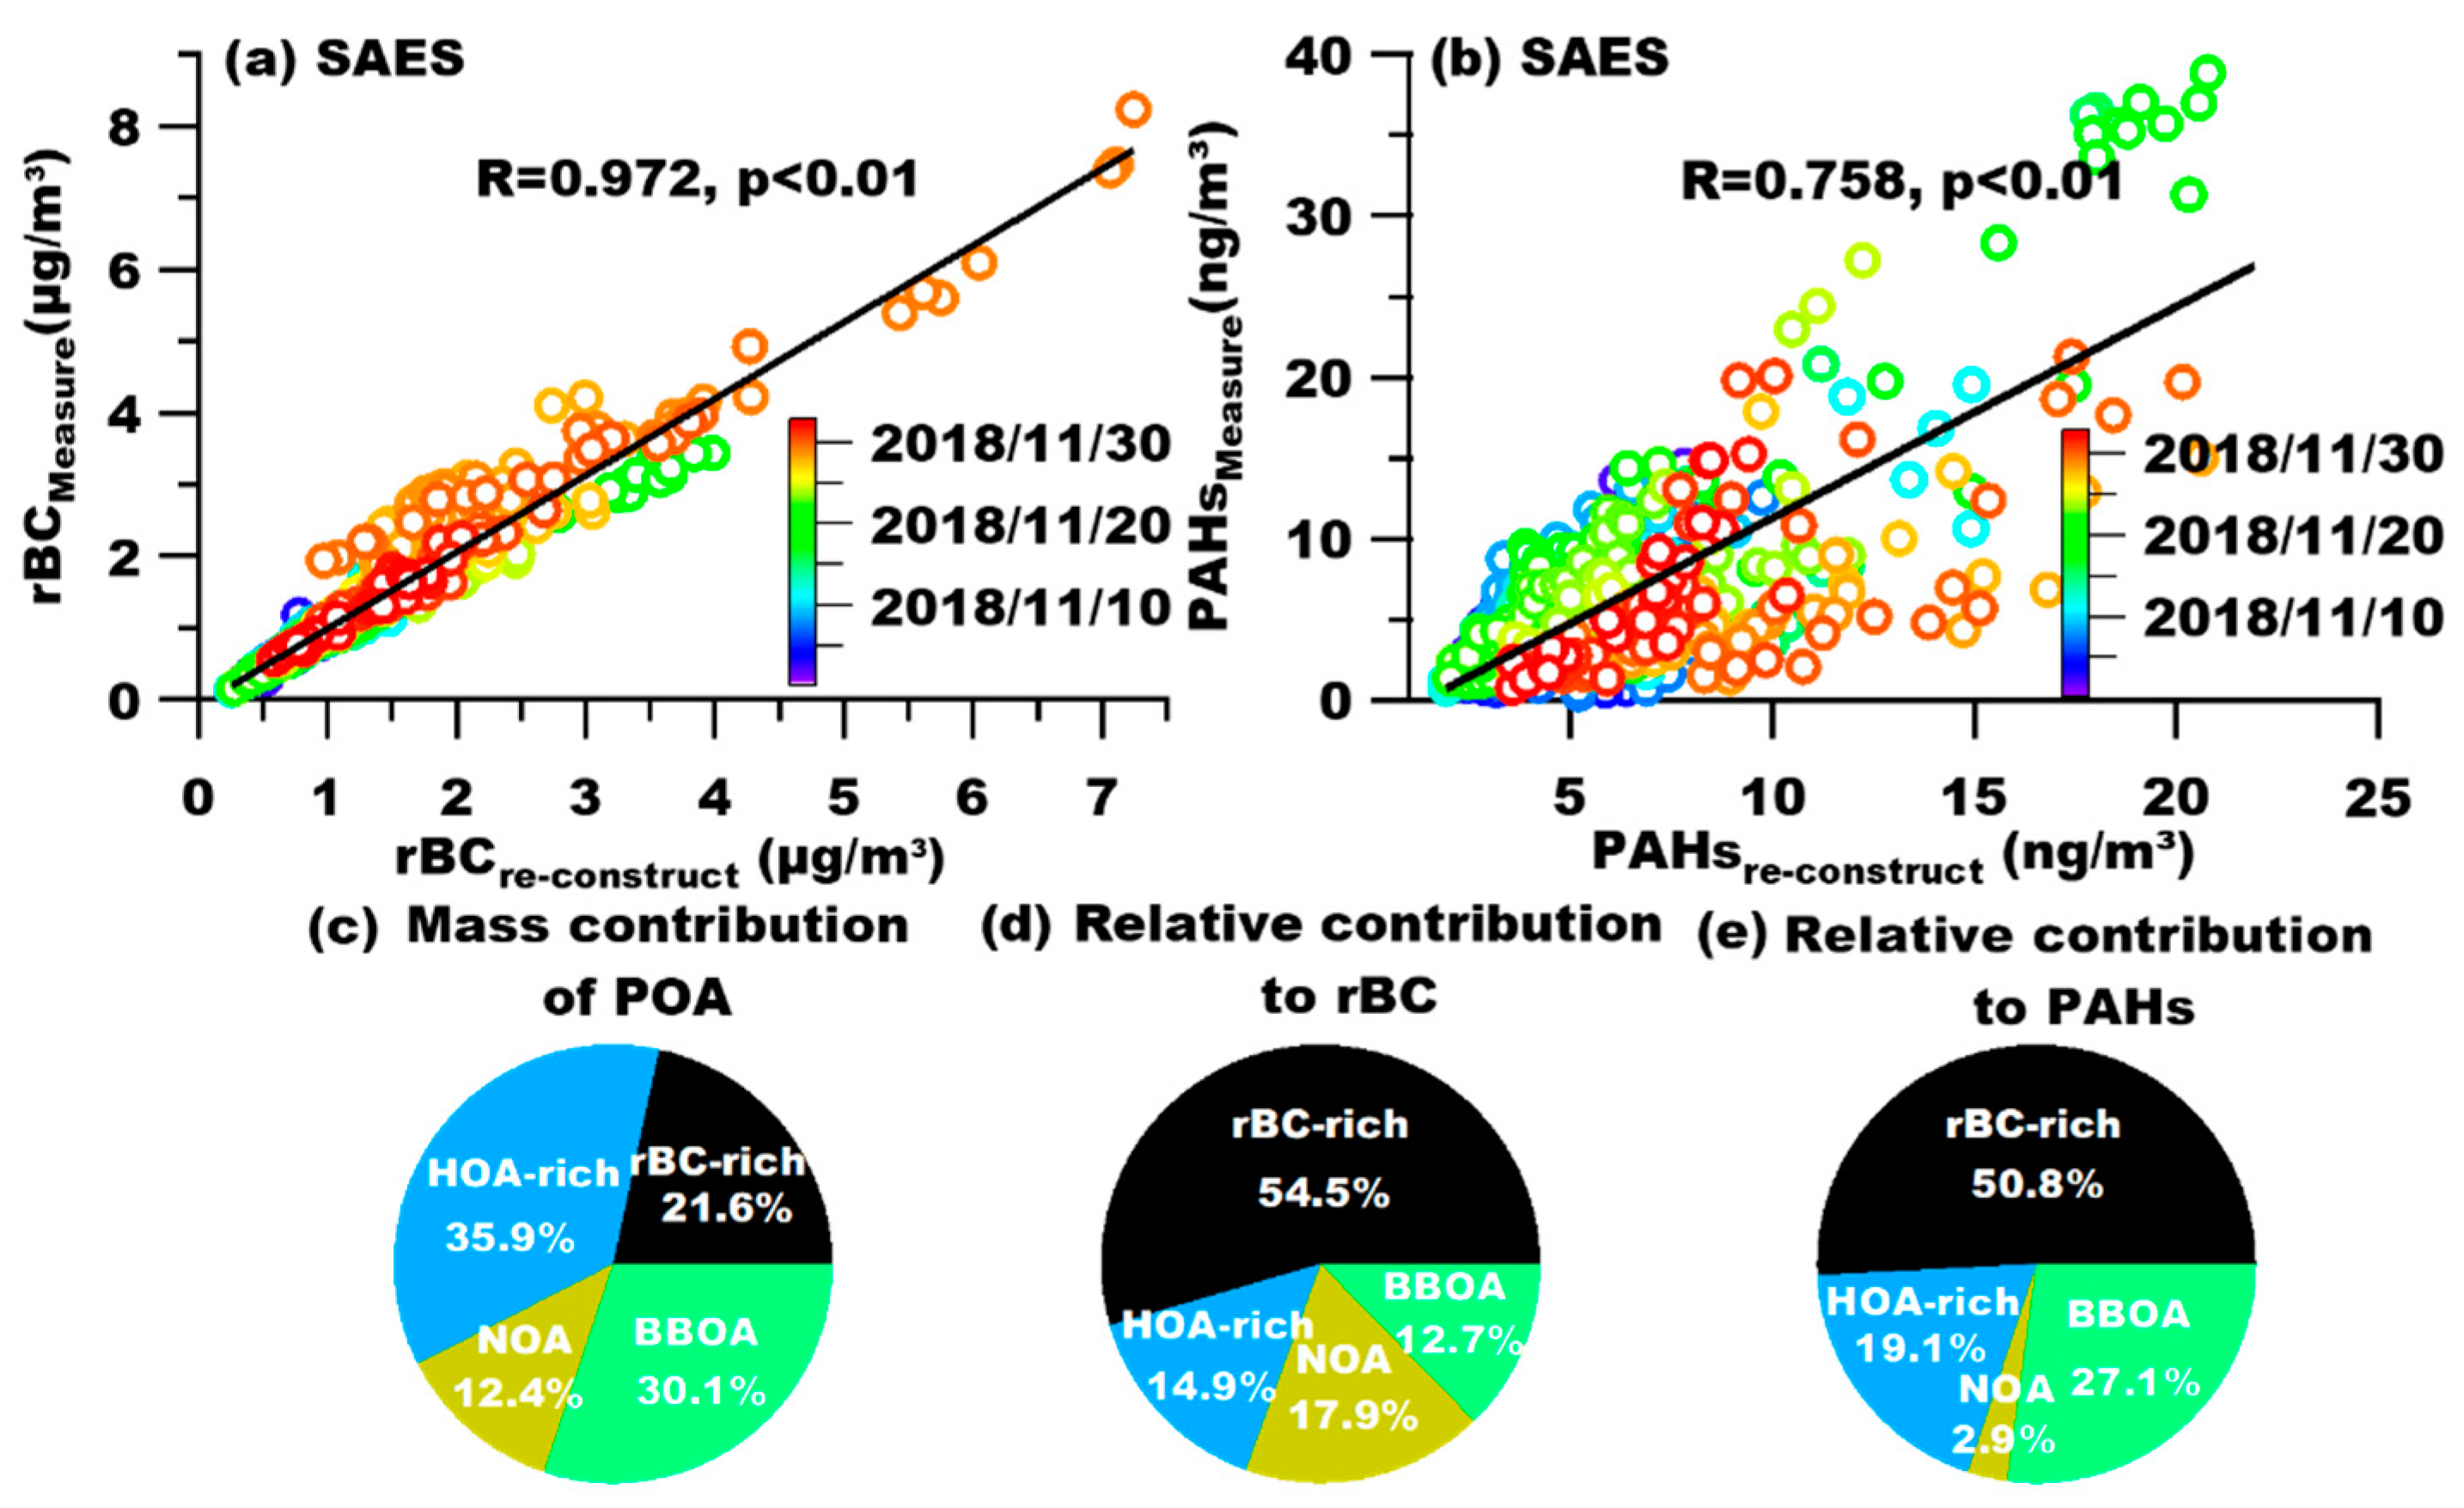
3.2. Source Appointments of PAHs and rBC

To further elucidate the PAHs and rBC sources, we employed a multi-linear regression method to apportion the signals of PAHs and rBC to different sources (i.e., different PMF factors). For the NUIST dataset, five factors were resolved, including the traffic-related hydrocarbon-like OA (HOA), industry-related OA (IOA), aged biomass burning OA (ABBOA), semi-volatile oxygenated OA (SV-OOA), and low-volatility oxygenated OA (LV-OOA). Their mass spectral profiles and time series are presented in Wu et al. [45], therefore are not shown here. For SAES dataset, we separated six factors, including the enriched hydrocarbon-like OA (HOA-rich), rBC-enriched OA (rBC-rich), biomass burning OA (BBOA), nitrogen-enriched OA (NOA), less oxidized oxygenated OA (LO-OOA), and more oxidized oxygenated OA (MO-OOA). The high-resolution mass spectra and corresponding time series of those factors are depicted in Figure 4. For NUIST dataset, HOA, IOA, and BBOA were primary OA (POA) factors, SV-OOA and LV-OOA were secondary OA (SOA) factors; for the SAES dataset, HOA-rich, rBC-rich, BBOA and NOA were four POA factors, LO-OOA and MO-OOA were SOA factors.
Note that PAHs and rBC mostly originate from primary sources [1,38] rather than secondary sources; thus, the regressions were only conducted on primary factors. Actually, if we added secondary factors into the fitting, correlations between measured and re-constructed rBC and PAH concentrations would all become weaker; therefore, exclusion of SOA factors was reasonable (SOA factors were, in fact, negatively correlated with PAHs as shown in Section 3.3). Finally, we established the following empirical formulas for PAHs and rBC for NUIST and SAES datasets, respectively.
rBCre-constructed, NUSIT
= 1.171 × [HOA] + 0.945 × [IOA] + 0.543 × [ABBOA] + 0.456
rBCre-constructed, SAES
= 1.453 × [rBC-rich] + 0.240 × [HOA-rich] + 0.833 × [NOA]
+ 0.243 × [BBOA] + 0.146
where rBCre-constructed, NUSIT and rBCre-constructed, SAES (μg/m3) represent the re-constructed mass concentrations of rBC in NUIST and SAES, respectively. Factors in braces were time series of corresponding factors.
PAHsre-constructed, NUSIT
= 11.44 × [HOA] + 44.917 × [IOA] + 5.43 × [ABBOA] + 26.14
PAHsre-constructed, SAES
= 6.478 × [rBC-rich] + 1.474 × [HOA-rich] + 0.655 × [NOA]
+ 2.495 × [BBOA] + 1.314
where PAHsre-constructed, NUSIT and PAHsre-constructed, SAES (ng/m3) represent the reconstructed PAHs concentrations in NUIST and SEAS, respectively. Meanings of braced factors were the same as those in Equations (1) and (2).
By using above formulas, re-constructed PAHs and rBC concentrations agreed fairly well with corresponding measured data (all with p <0.01, Pearson’s r of 0.93 and 0.97 for rBC, Pearson’s r of 0.81 and 0.76 for PAHs of NUIST and SAES, respectively) (as shown in Figure 5 and Figure 6), indicating effectiveness of this method. We then used the regressed coefficients and mean concentrations of factors to calculate their relative contributions to rBC and PAHs, as shown in the pie charts. Results show that source contributions to total POA, rBC, and PAHs were remarkably different for NUIST and SAES datasets. POA in NUIST was comprised of 42.0% IOA, 32.5% ABBOA, and 25.5% HOA; source contributions to rBC was 45.5% IOA, 34.3% HOA, and 20.2% ABBOA; while PAHs appeared to be overwhelmingly contributed by IOA (80.1%), followed by HOA (12.4%), and a minor contribution from ABBOA (7.5%). POA in SEAS was composed of 21.6% rBC-rich OA, 25.5% HOA-rich, 30.1% BBOA, and 12.4% NOA. Note rBC-rich OA was likely associated closely with traffic diesel combustion (and possibly some ship emissions), HOA-rich factor was likely linked with traffic gasoline emissions, and NOA was a local POA factor, possibly from industrial activities. Relative mass contribution to rBC was largest from the rBC-rich factor (54.5%), followed by 17.9% NOA, 14.9% HOA-rich, and 12.7% BBOA. For PAHs, direct traffic-related OA contributions were still dominant (50.8% rBC-rich OA and 19.1% HOA-rich); BBOA contribution was a bit more (27.1%) than its contribution to rBC, while NOA contribution (possible industry contribution) was very small (2.9%). Source contributions to PAHs in NUIST and SEAS were found to be contrastingly different.

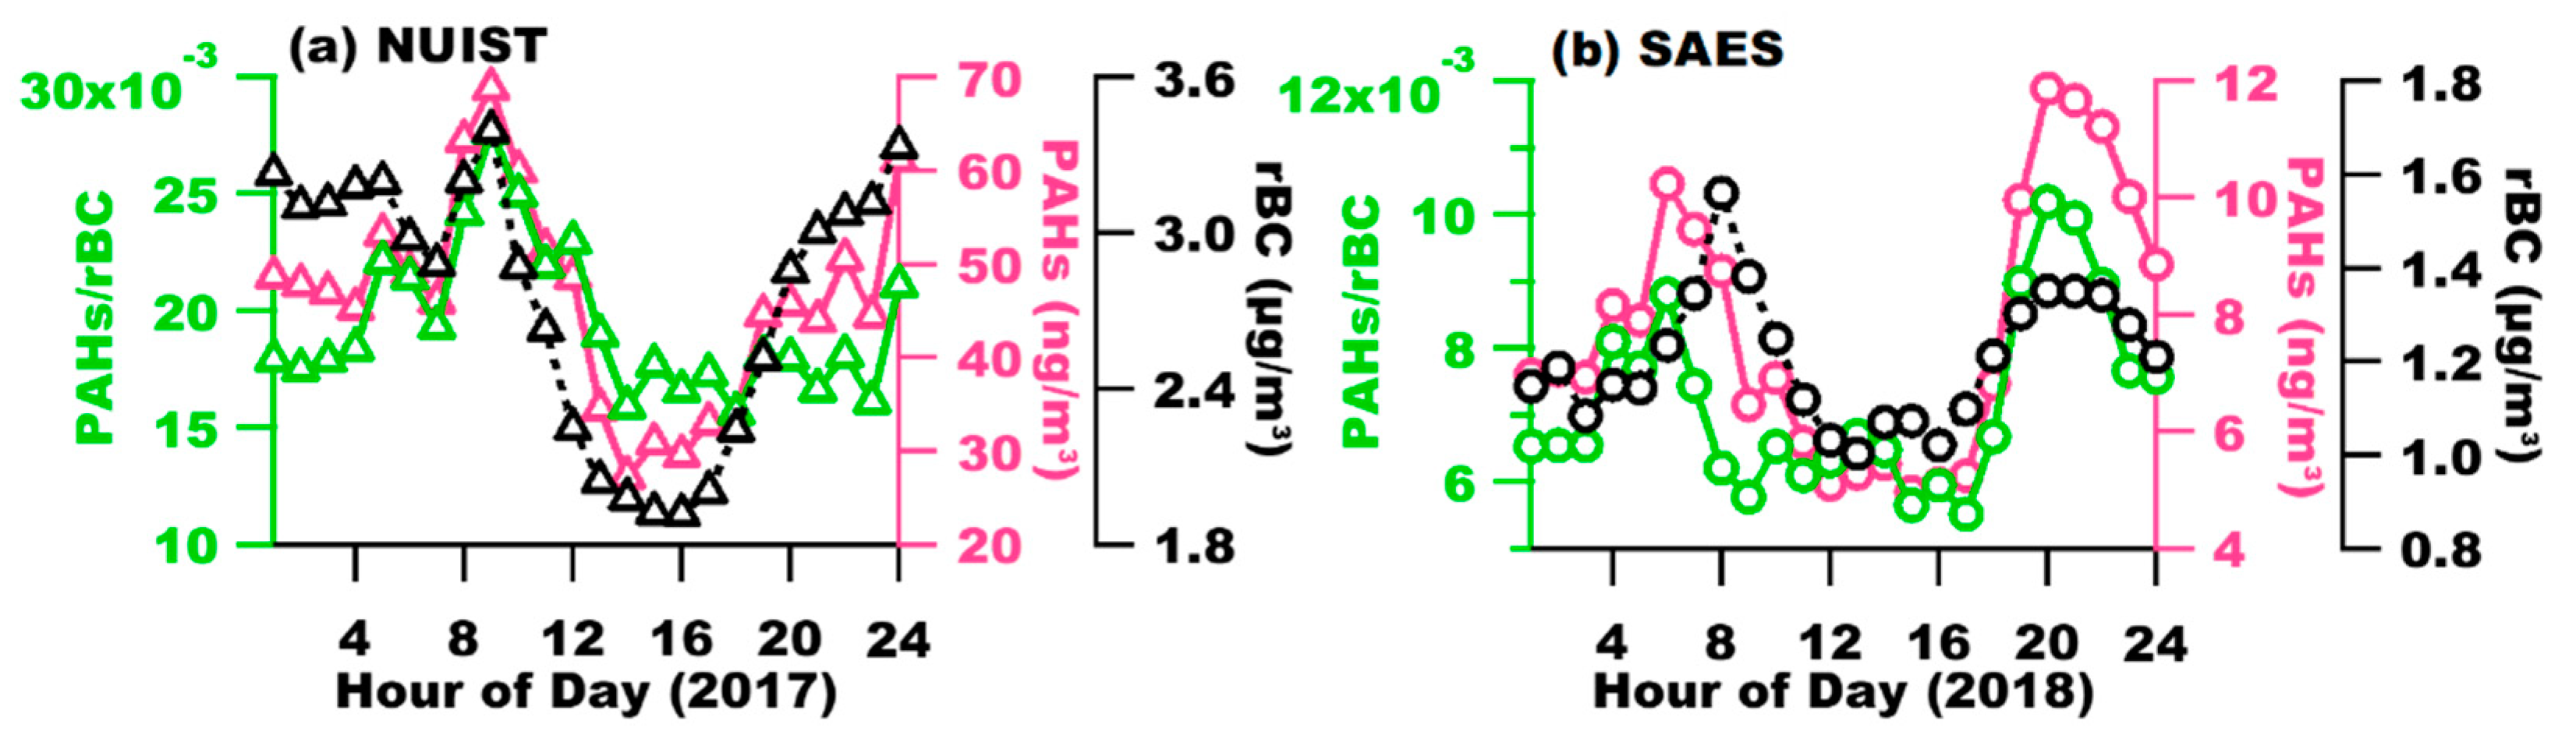
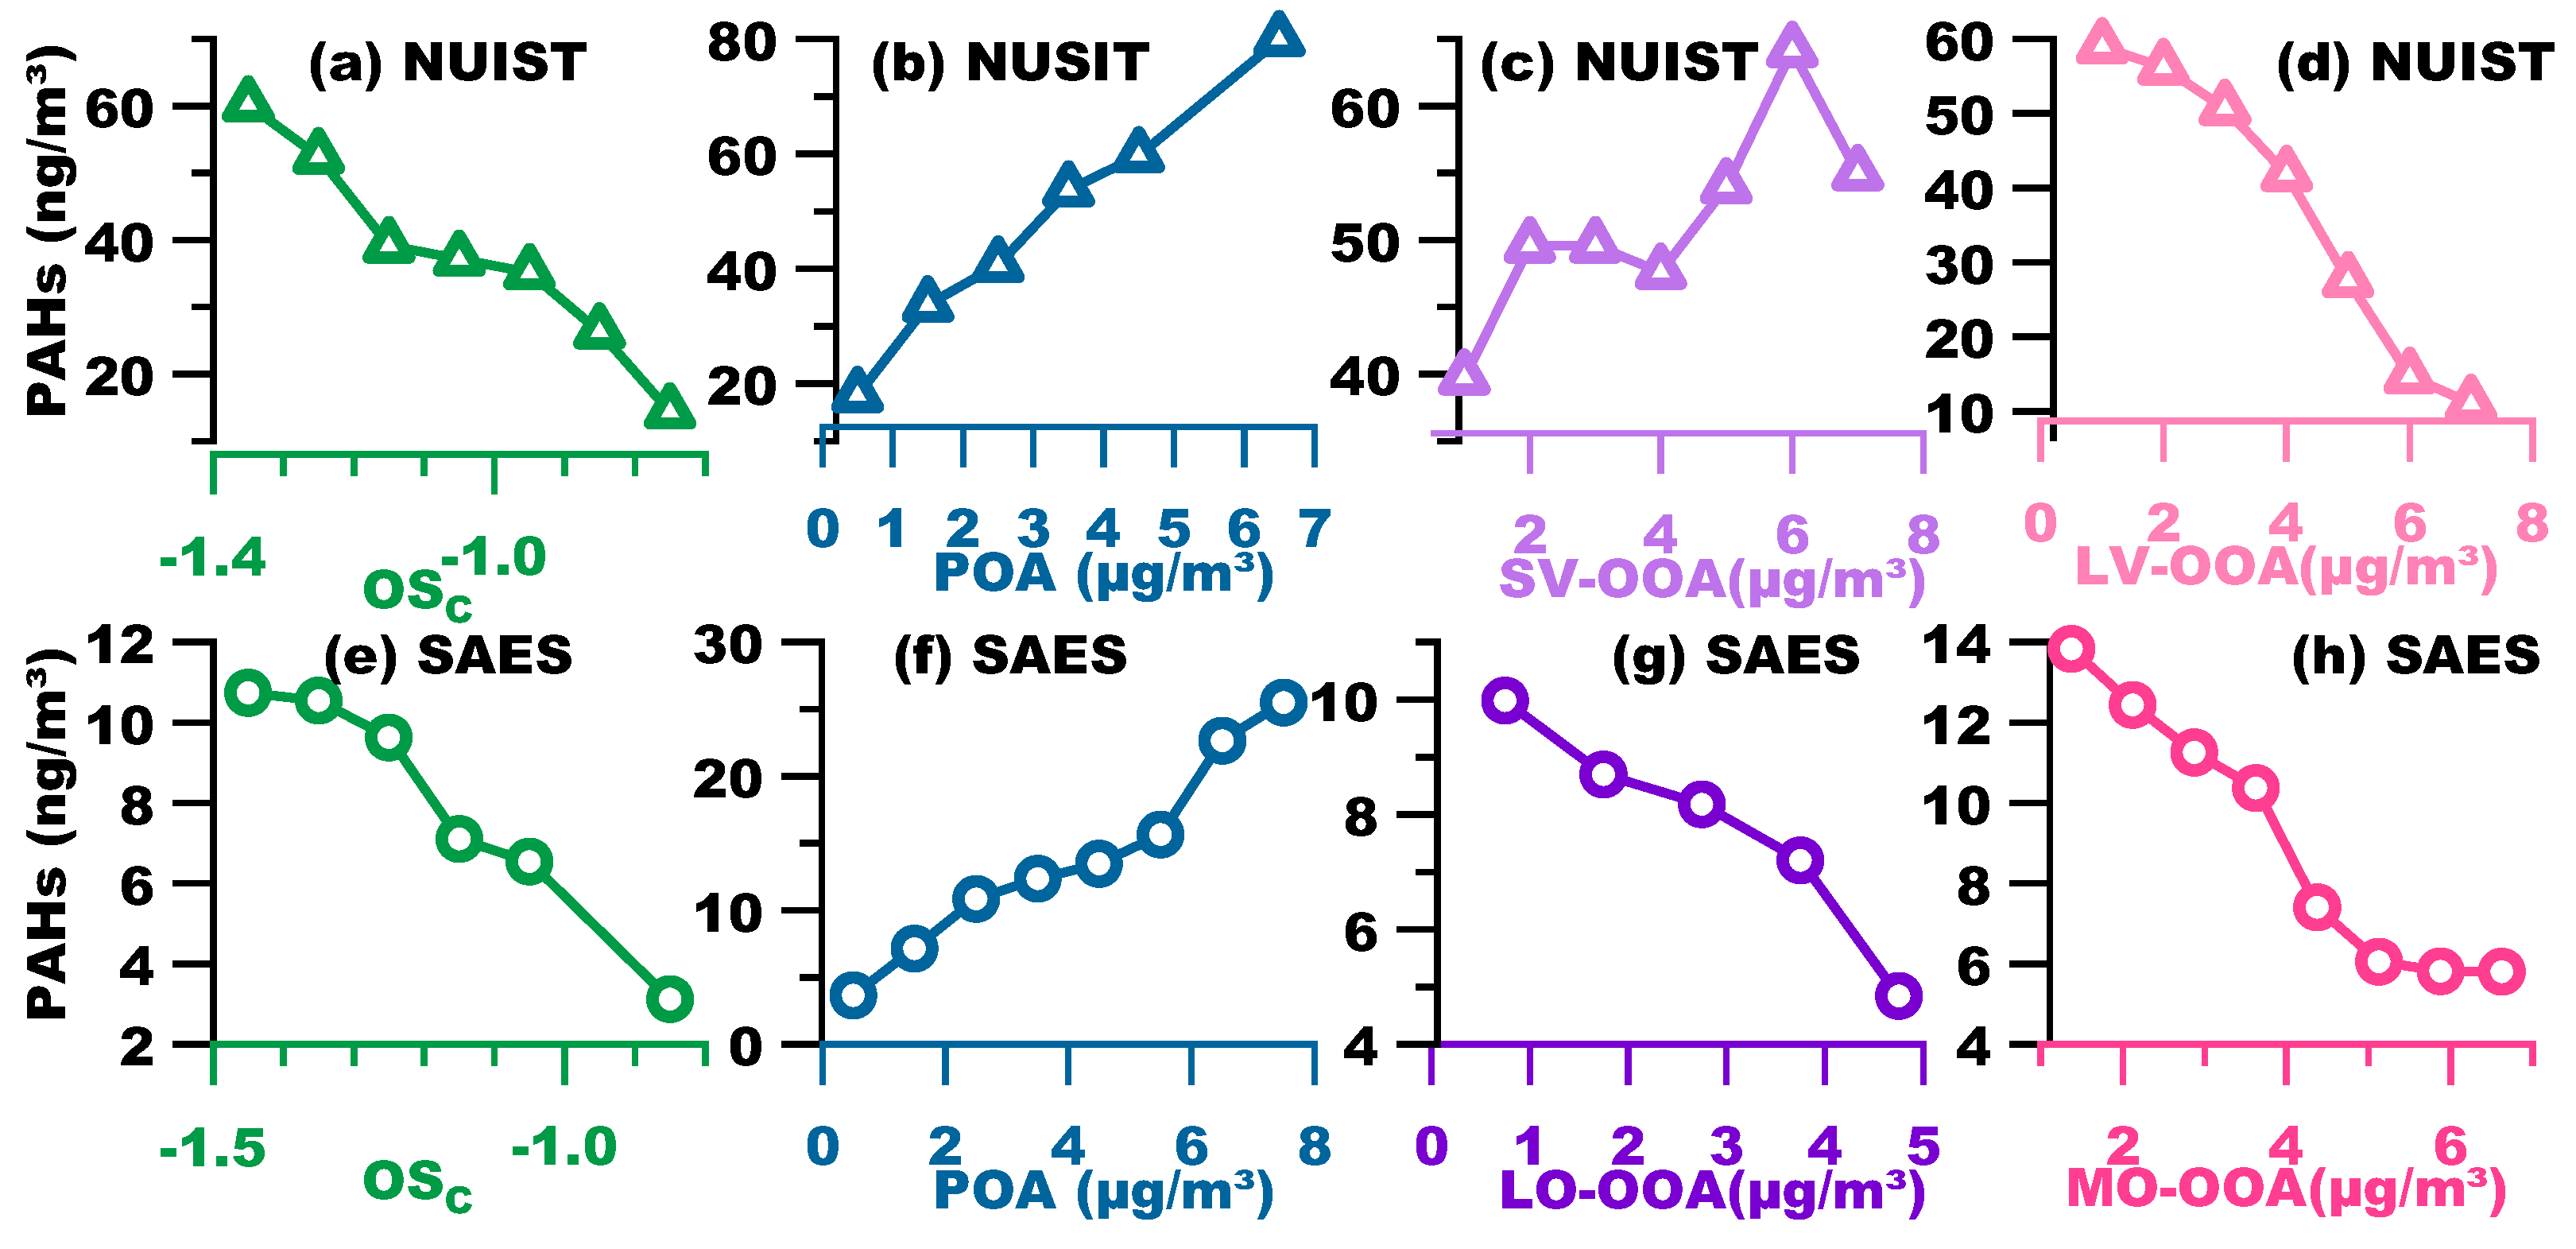
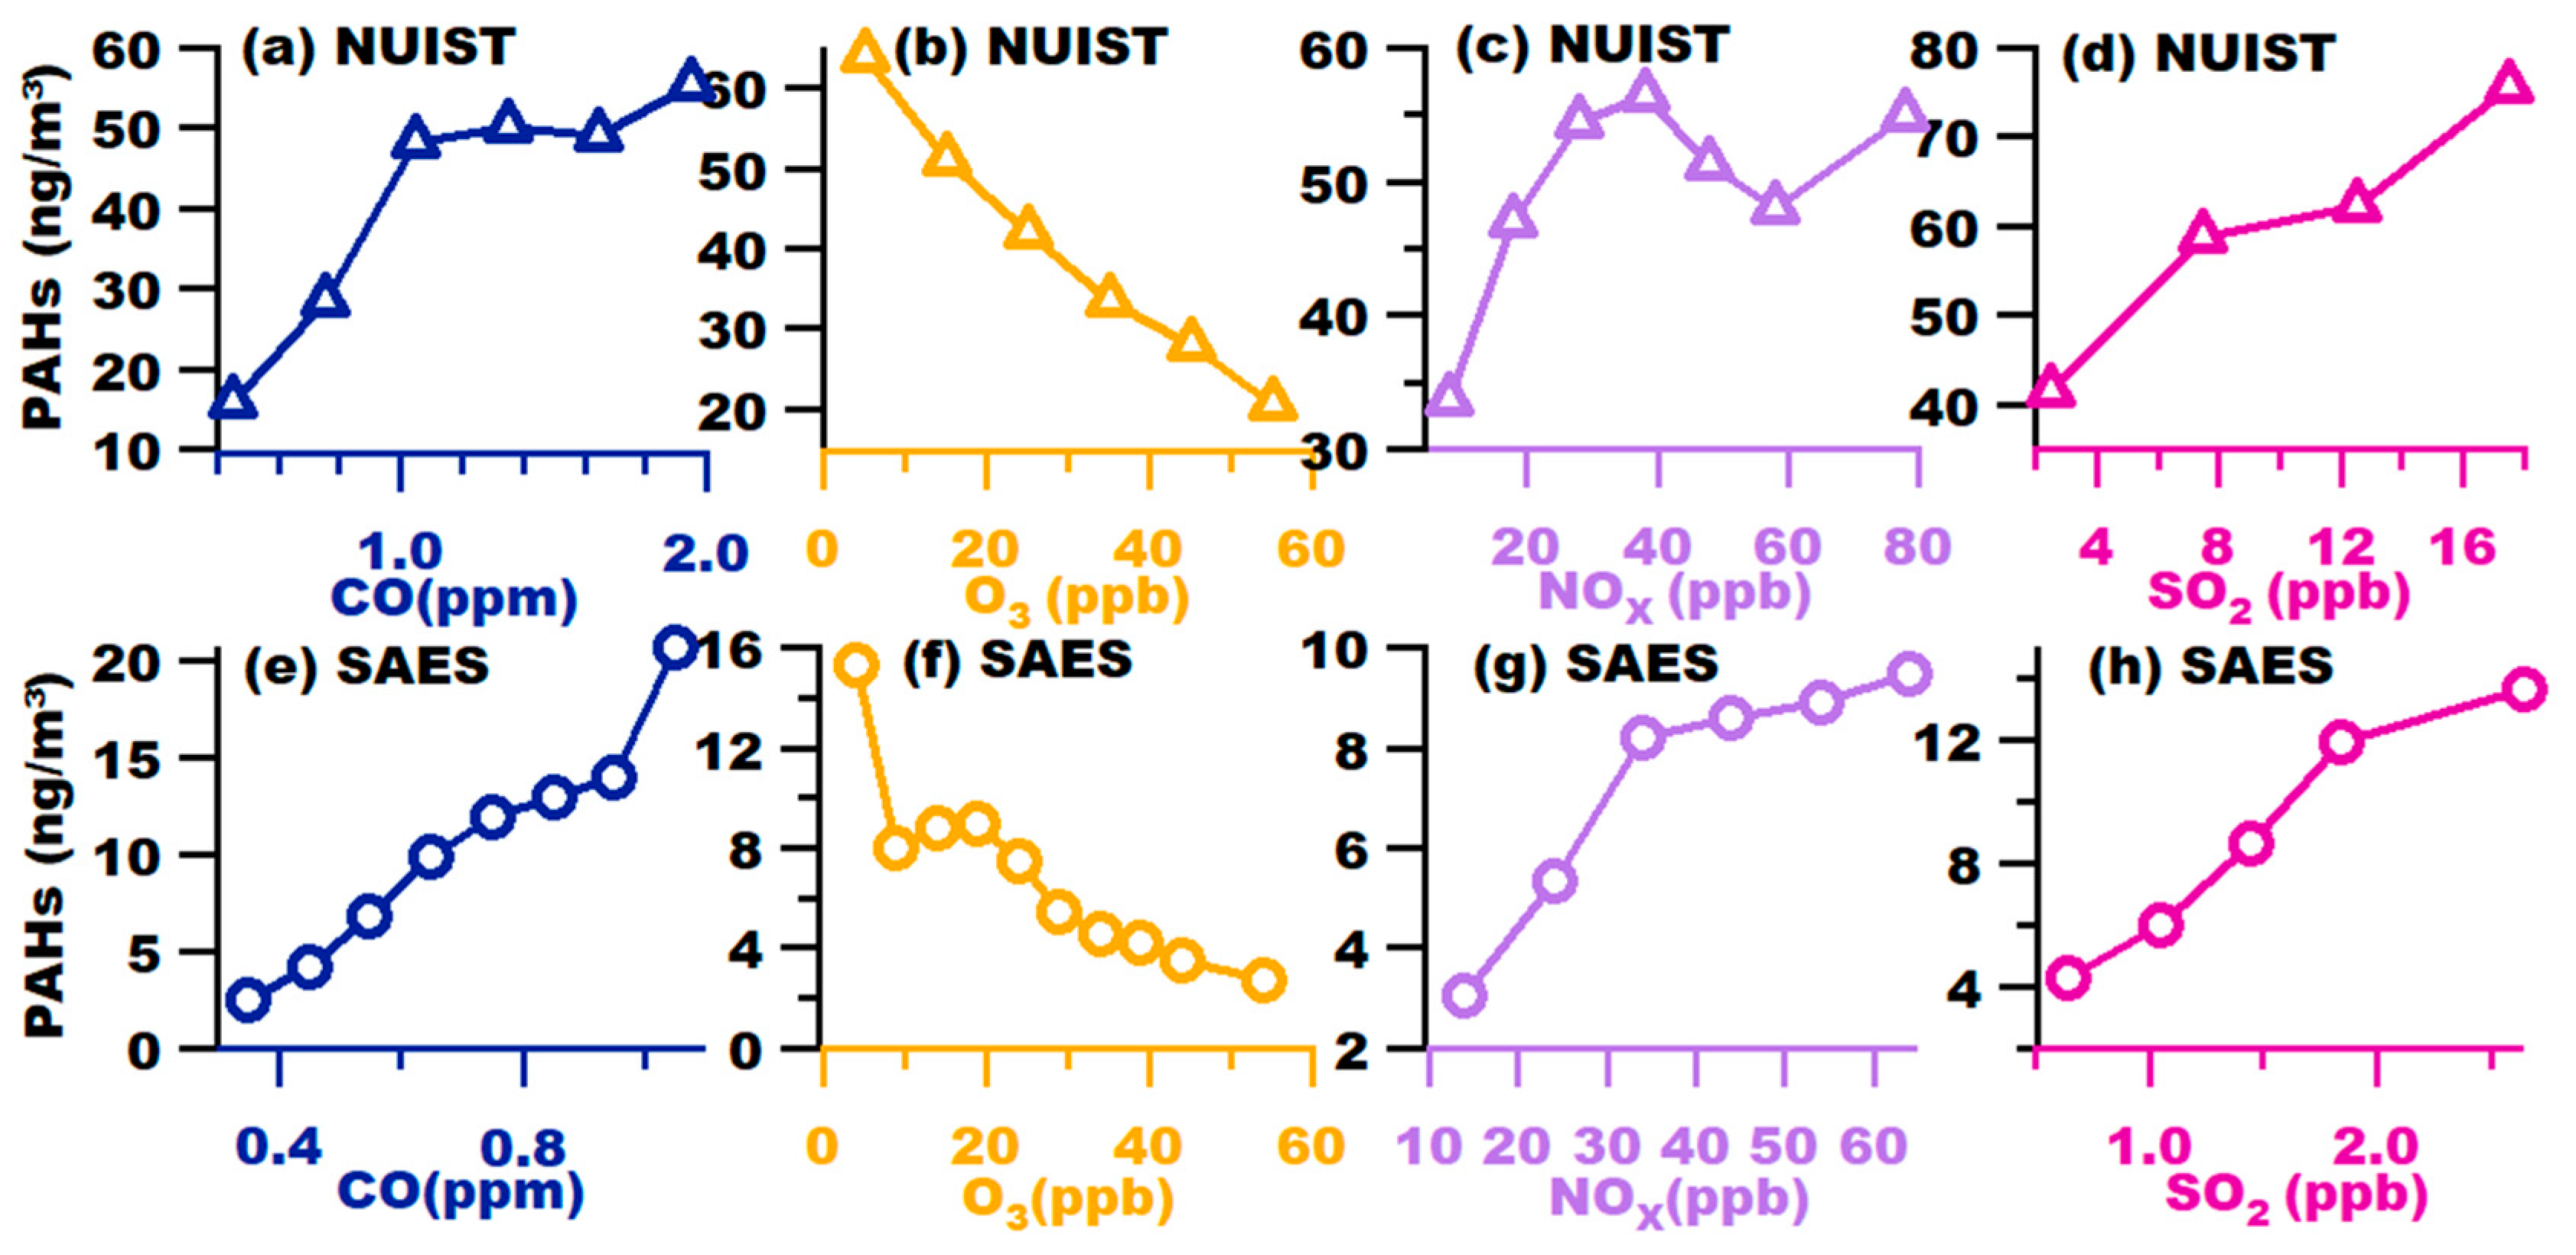
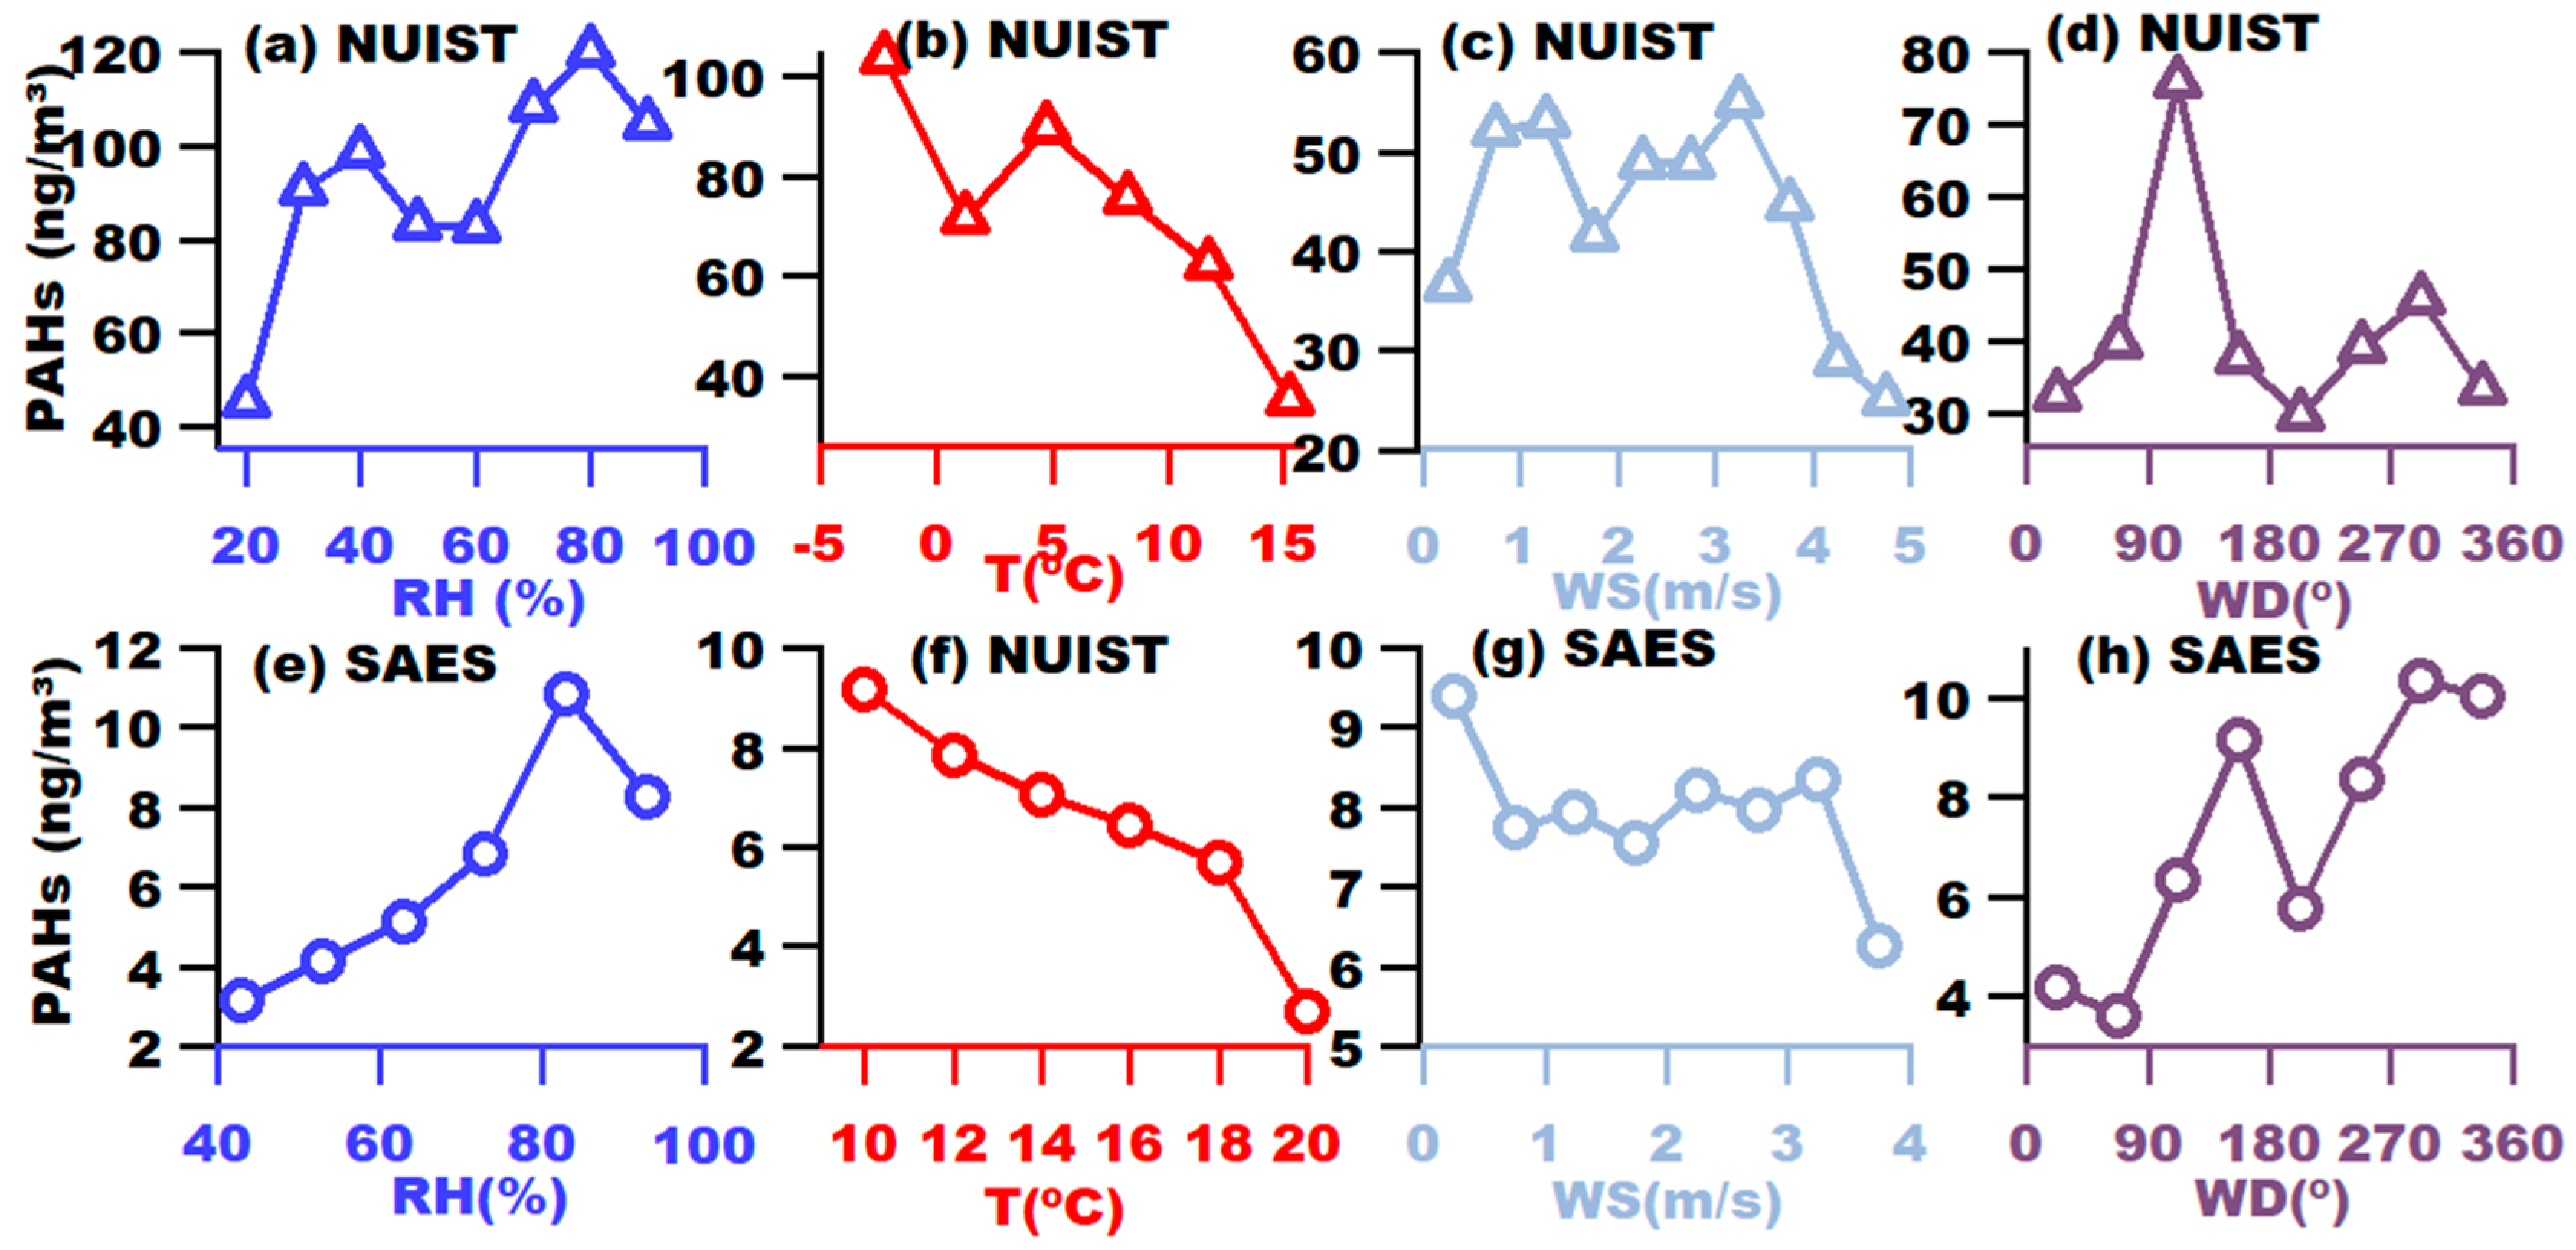
3.3. Relationships between PAHs and Other Factors

In general, the mass loading and variation of a certain species in ambient are controlled by an integrated effect from emissions, reactions, and meteorology. Therefore, we explored the relationships of PAH concentrations with primary or secondary species, including both particle-bound and gas-phase species, as well as the meteorological parameters.
Figure 7 presents the variations of PAH concentrations against different OA terms, including the oxidation state (OSc), mass concentrations of POA and SOA. OSc is defined as 2 × O/C-H/C [52], here O/C and H/C are oxygen-to-carbon and hydrogen-to-carbon atomic ratios. Generally, PAH concentrations decreased with the increase of OSc for both NUIST (except a small plateau between −1.15 and −0.95) and SAES. Since OSc can be treated as a metric of the aging or oxidation degree of OA, this result reflects the loss of PAHs upon atmospheric aging. On the contrary, PAHs had an obvious positive relationship with POA for both datasets (Figure 7b,f), verifying its primary origin. Furthermore, investigations on correlations between PAHs with individual POA factors (not shown here) revealed that PAHs in NUIST correlated the best with IOA, and PAHs in SEAS correlated tightest with rBC-rich OA. These results are in line with the pie charts shown in Figure 5 and Figure 6—that IOA and rBC-rich OA were dominant sources of PAHs in NUIST and SAES, respectively.
The relationships between PAHs and SOA factors, however, were a bit complex. In particular, the PAHs in NUIST even presented an increasing trend with SV-OOA (although not highly correlated). We think this positive correlation reflects the semi-volatile behavior of PAHs, similar to that of SV-OOA in NUIST, rather than an indication of secondary production of PAHs. NUIST PAHs did contain more low MW PAHs, which might partially explain this semi-volatile behavior. For SAES, in fact, the factor with relatively low oxidation degree (LO-OOA) had no clear semi-volatile behavior; therefore, the PAHs correlated negatively with it, as expected. For these highly oxygenated SOA factors, LV-OOA in NUIST and MO-OOA in SAES, very clear anti-correlations were observed between them with PAHs, suggesting again the primary not secondary origin of PAHs, as well as oxidation loss of PAHs, along with the formation of large amounts of SOA.
Figure 8 illustrates the relationships between PAHs with those criteria gaseous pollutants, including CO, NO2, SO2, and O3. Note that concentrations of CO, NO2, and SO2 in NUIST were all higher than those in SEAS; in particular, NUIST SO2 concentration was a few times higher than SAES SO2, indicating a more important role of industrial (likely coal combustion) emissions in NUIST. PAHs in both NUIST and SAES, in general, correlated positively with CO, NO2, and SO2, as these gases were also, in large part, from primary emission sources, as PAHs. Only the correlation between PAHs and NO2 in NUIST was less clear-cut, which was in fact also reasonable, considering that PAHs in NUIST were mainly from industry emissions, yet NO2 was mainly from traffic. On the other hand, PAH concentrations decreased continuously with the increases of O3 in both NUIST and SAES. Different from other gases, O3 is exclusively produced from photochemical reactions; therefore, this anti-relationship may suggest that PAHs were subject to photochemical oxidation, which impacted its atmospheric levels. Results in Figure 6 and Figure 7 together demonstrate the enhancement of the mass concentration of PAHs due to primary emissions, as well as the loss or sink of PAHs due to atmospheric oxidation reactions.
At last, we investigated impacts of meteorological parameters (relative humidity (RH), temperature (T), wind speed (WS), and wind direction (WD)) on PAH concentrations (as shown in Figure 9). First, it is interesting to observe that WS had no clear impact on PAH loadings at both sites. The dilution effect by wind speed was not significant unless there were strong winds (WS >3.5 m/s). For NUIST, PAHs concentration from air parcels (east to southeast) was the highest, coincident with the industry zone from that direction (Figure 1).Again, it demonstrates the dominance of industrial emissions to PAHs in NUIST. For SAES, except that PAHs concentration was quite low in air parcels from north to east, other air parcels all brought about relatively high loadings of PAHs, likely due to traffic activities from the freeway and residential area (Figure 1). Regarding the effects of temperature, PAH concentrations in both sites decreased against an increase in temperature, probably owing to two reasons: one is the evaporation loss of PAHs at higher temperatures; another is the oxidation loss (since periods with high temperatures, such as afternoons, often overlapped with periods with strong solar radiation, i.e., strong photochemical oxidation). In both sites, responses of PAH concentrations to RH changes were generally positive (especially in SAES), but there was a drop at very high RH (>90%) probably due to scavenging effects. The positive correlations were more likely owing to that high RH often occurring during a time (i.e., nighttime and early morning) when strong anthropogenic PAH emissions were exacerbated by low PBL heights.

4. Conclusions

In this work, for the first time, we applied a laser-only SP-AMS to investigate rBC-bound PAHs during the winter in suburban Nanjing, and during fall in urban Shanghai. Highly time-resolved data allowed us to characterize the mass spectra, diurnal patterns, sources of PAHs, and their correlations with other factors. Average rBC-bound PAHs concentration in Nanjing was 46.0 ng/m3, much higher than that determined in Shanghai (6.64 ng/m3). Nanjing PAHs were found to contain more low MW PAHs, while in Shanghai, high MW PAHs contribution was more significant. The diurnal pattern of PAHs concentration in Nanjing showed a clear morning peak and an overall high level throughout the nighttime, while Shanghai PAHs concentration presented bimodal distribution in early morning and evening, indicating a clear impact from traffic activities. Source apportionment on PAHs via a multi-linear regression method using PMF-resolved OA factors as inputs, showed that, indeed, traffic emissions were a major source of PAHs in Shanghai (70%), while industry emissions overwhelmingly dominated PAHs in Nanjing (80%). We further investigated the relationships between PAHs and other factors. PAHs presented overall positive relationships with POA and CO, NO2, and SO2, but negatively correlated with OSc, SOA factors, and O3, demonstrating enhancement of PAHs level in ambient, due to primary sources and oxidation loss from atmospheric aging. PAHs also decreased with an increase in temperature, again, reflecting possible evaporation and/or oxidation loss of PAHs. High PAHs concentrations often appeared under low T and high RH conditions, especially in Shanghai. Our findings here provide useful insights into the understanding of pollution levels, temporal variability, and the source and lifecycle of PAHs in representative atmospheric environments.

Author Contributions

Conceptualization, X.G.; Data curation, S.C., D.H., F.S., L.Q., M.Z., S.Z. and Y.M.; Formal analysis, S.C., R.L., Y.W., D.H., F.S., and J.W.; Investigation, X.G.; Methodology, R.L., Y.W., F.S. and J.W.; Project administration, X.G.; Resources, L.Q., M.Z., S.Z. and Y.M.; Supervision, X.G.; Writing—original draft, S.C.; Writing—review & editing, X.G. All authors have read and agreed to the published version of the manuscript.

Funding

This research was funded by the National Natural Science Foundation of China (grant number 21777073 and 21976093), the National Key R&D program of China (2018YFC0213802), and the Innovation and Entrepreneurship Training Program for College Students in Jiangsu Province (201810300095X).

Conflicts of Interest

The authors declare no conflict of interest.

References

  1. Ravindra, K.; Sokhi, R.; Vangrieken, R. Atmospheric polycyclic aromatic hydrocarbons: Source attribution, emission factors and regulation. Atmos. Environ. 2008, 42, 2895–2921. [Google Scholar] [CrossRef] [Green Version]
  2. Poulain, L.; Iinuma, Y.; Müller, K.; Birmili, W.; Weinhold, K.; Brüggemann, E.; Gnauk, T.; Hausmann, A.; Löschau, G.; Wiedensohler, A.; et al. Diurnal variations of ambient particulate wood burning emissions and their contribution to the concentration of polycyclic aromatic hydrocarbons (PAHs) in seiffen, germany. Atmos. Chem. Phys. 2011, 11, 12697–12713. [Google Scholar] [CrossRef] [Green Version]
  3. Abbas, I.; Badran, G.; Verdin, A.; Ledoux, F.; Roumié, M.; Courcot, D.; Garçon, G. Polycyclic aromatic hydrocarbon derivatives in airborne particulate matter: Sources, analysis and toxicity. Environ. Chem. Lett. 2018, 16, 439–475. [Google Scholar] [CrossRef]
  4. Elzein, A.; Dunmore, R.E.; Ward, M.W.; Hamilton, J.F.; Lewis, A.C. Variability of polycyclic aromatic hydrocarbons and their oxidative derivatives in wintertime beijing, china. Atmos. Chem. Phys. 2019, 19, 8741–8758. [Google Scholar] [CrossRef] [Green Version]
  5. Wang, Y.; Zhang, Q.; Zhang, Y.; Zhao, H.; Tan, F.; Wu, X.; Chen, J. Source apportionment of polycyclic aromatic hydrocarbons (PAHs) in the air of dalian, china: Correlations with six criteria air pollutants and meteorological conditions. Chemosphere 2019, 216, 516–523. [Google Scholar] [CrossRef]
  6. Harrison, R.M.; Smith, D.J.T.; Luhana, L. Source apportionment of atmospheric polycyclic aromatic hydrocarbons collected from an urban location in birmingham, U.K. Environ. Sci. Technol. 1996, 30, 825–832. [Google Scholar] [CrossRef]
  7. Nisbet, I.C.; LaGoy, P.K. Toxic equivalency factors (TEFs) for polycyclic aromatic hydrocarbons (PAHs). Regul. Toxicol. Pharmacol. 1992, 16, 290–300. [Google Scholar] [CrossRef]
  8. Bostrom, C.-E.; Gerde, P.; Hanberg, A.; Jernstrom, B.; Johansson, C.; Kyrklund, T.; Rannug, A.; Tornqvist, M.; Victorin, K.; Westerholm, R. Cancer risk assessment, indicators, and guidelines for polycyclic aromatic hydrocarbons in the ambient air. Environ. Health Perspect. 2002, 110 (Suppl. 3), 451–488. [Google Scholar] [CrossRef] [Green Version]
  9. Bi, C.; Chen, Y.; Zhao, Z.; Li, Q.; Zhou, Q.; Ye, Z.; Ge, X. Characteristics, sources and health risks of toxic species (pcdd/fs, pahs and heavy metals) in pm2.5 during fall and winter in an industrial area. Chemosphere 2020, 238, 124620. [Google Scholar] [CrossRef]
  10. Han, F.; Guo, H.; Hu, J.; Zhang, J.; Ying, Q.; Zhang, H. Sources and health risks of ambient polycyclic aromatic hydrocarbons in china. Sci. Total Environ. 2020, 698, 134229. [Google Scholar] [CrossRef]
  11. Wang, W.; Jariyasopit, N.; Schrlau, J.; Jia, Y.; Tao, S.; Yu, T.W.; Dashwood, R.H.; Zhang, W.; Wang, X.; Simonich, S.L. Concentration and photochemistry of pahs, npahs, and opahs and toxicity of pm2.5 during the beijing olympic games. Environ. Sci. Technol. 2011, 45, 6887–6895. [Google Scholar] [CrossRef] [PubMed] [Green Version]
  12. Song, M.-K.; Song, M.; Choi, H.-S.; Kim, Y.-J.; Park, Y.-K.; Ryu, J.-C. Identification of molecular signatures predicting the carcinogenicity of polycyclic aromatic hydrocarbons (PAHs). Toxicol. Lett. 2012, 212, 18–28. [Google Scholar] [CrossRef] [PubMed]
  13. Kim, K.H.; Jahan, S.A.; Kabir, E.; Brown, R.J. A review of airborne polycyclic aromatic hydrocarbons (PAHs) and their human health effects. Environ. Int. 2013, 60, 71–80. [Google Scholar] [CrossRef] [PubMed]
  14. Garrido, A.; Jiménez-Guerrero, P.; Ratola, N. Levels, trends and health concerns of atmospheric pahs in europe. Atmos. Environ. 2014, 99, 474–484. [Google Scholar] [CrossRef]
  15. Niu, X.; Ho, S.S.H.; Ho, K.F.; Huang, Y.; Sun, J.; Wang, Q.; Zhou, Y.; Zhao, Z.; Cao, J. Atmospheric levels and cytotoxicity of polycyclic aromatic hydrocarbons and oxygenated-pahs in pm2.5 in the beijing-tianjin-hebei region. Environ. Pollut. 2017, 231, 1075–1084. [Google Scholar] [CrossRef]
  16. Walgraeve, C.; Chantara, S.; Sopajaree, K.; De Wispelaere, P.; Demeestere, K.; Van Langenhove, H. Quantification of pahs and oxy-pahs on airborne particulate matter in chiang mai, thailand, using gas chromatography high resolution mass spectrometry. Atmos. Environ. 2015, 107, 262–272. [Google Scholar] [CrossRef]
  17. Polidori, A.; Hu, S.; Biswas, S.; Delfino, R.J.; Sioutas, C. Real-time characterization of particle-bound polycyclic aromatic hydrocarbons in ambient aerosols and from motor-vehicle exhaust. Atmos. Chem. Phys. 2008, 8, 1277–1291. [Google Scholar] [CrossRef] [Green Version]
  18. Pratt, K.A.; Prather, K.A. Mass spectrometry of atmospheric aerosols--recent developments and applications. Part i: Off-line mass spectrometry techniques. Mass Spectrom. Rev. 2012, 31, 1–16. [Google Scholar] [CrossRef]
  19. Marr, L.C.; Grogan, L.A.; Wöhrnschimmel, H.; Molina, L.T.; Molina, M.J.; Smith, T.J.; Garshick, E. Vehicle traffic as a source of particulate polycyclic aromatic hydrocarbon exposure in the mexico city metropolitan area. Environ. Sci. Technol. 2004, 38, 2584–2592. [Google Scholar] [CrossRef] [Green Version]
  20. Dzepina, K.; Arey, J.; Marr, L.C.; Worsnop, D.R.; Salcedo, D.; Zhang, Q.; Onasch, T.B.; Molina, L.T.; Molina, M.J.; Jimenez, J.L. Detection of particle-phase polycyclic aromatic hydrocarbons in mexico city using an aerosol mass spectrometer. Int. J. Mass Spectrom. 2007, 263, 152–170. [Google Scholar] [CrossRef]
  21. Ge, X.; Setyan, A.; Sun, Y.; Zhang, Q. Primary and secondary organic aerosols in fresno, california during wintertime: Results from high resolution aerosol mass spectrometry. J. Geophys. Res. Atmos. 2012, 117. [Google Scholar] [CrossRef]
  22. Eriksson, A.C.; Nordin, E.Z.; Nystrom, R.; Pettersson, E.; Swietlicki, E.; Bergvall, C.; Westerholm, R.; Boman, C.; Pagels, J.H. Particulate pah emissions from residential biomass combustion: Time-resolved analysis with aerosol mass spectrometry. Environ. Sci. Technol. 2014, 48, 7143–7150. [Google Scholar] [CrossRef] [PubMed]
  23. Ye, Z.; Liu, J.; Gu, A.; Feng, F.; Liu, Y.; Bi, C.; Xu, J.; Li, L.; Chen, H.; Chen, Y.; et al. Chemical characterization of fine particular matter in changzhou, china and source apportionment with offline aerosol mass spectrometry. Atmos. Chem. Phys. 2017, 2017, 2573–2592. [Google Scholar] [CrossRef] [Green Version]
  24. Marr, L.C.; Dzepina, K.; Jimenez, J.L.; Reisen, F.; Bethel, H.L.; Arey, J.; Gaffney, J.S.; Marley, N.A.; Molina, L.T.; Molina, M.J. Sources and transformations of particle-bound polycyclic aromatic hydrocarbons in mexico city. Atmos. Chem. Phys. 2006, 6, 1733–1745. [Google Scholar] [CrossRef] [Green Version]
  25. Zelenyuk, A.; Imre, D.; Beranek, J.; Abramson, E.; Wilson, J.; Shrivastava, M. Synergy between secondary organic aerosols and long-range transport of polycyclic aromatic hydrocarbons. Environ. Sci. Technol. 2012, 46, 12459–12466. [Google Scholar] [CrossRef]
  26. Xu, J.; Zhang, Q.; Chen, M.; Ge, X.; Ren, J.; Qin, D. Chemical composition, sources, and processes of urban aerosols during summertime in northwest china: Insights from high-resolution aerosol mass spectrometry. Atmos. Chem. Phys. 2014, 14, 12593–12611. [Google Scholar] [CrossRef] [Green Version]
  27. Bruns, E.A.; Krapf, M.; Orasche, J.; Huang, Y.; Zimmermann, R.; Drinovec, L.; Močnik, G.; El-Haddad, I.; Slowik, J.G.; Dommen, J.; et al. Characterization of primary and secondary wood combustion products generated under different burner loads. Atmos. Chem. Phys. 2015, 15, 2825–2841. [Google Scholar] [CrossRef] [Green Version]
  28. Malmborg, V.B.; Eriksson, A.C.; Shen, M.; Nilsson, P.; Gallo, Y.; Waldheim, B.; Martinsson, J.; Andersson, O.; Pagels, J. Evolution of in-cylinder diesel engine soot and emission characteristics investigated with online aerosol mass spectrometry. Environ. Sci. Technol. 2017, 51, 1876–1885. [Google Scholar] [CrossRef] [Green Version]
  29. Johansson, K.O.; Head-Gordon, M.P.; Schrader, P.E.; Wilson, K.R.; Michelsen, H.A. Resonance-stabilized hydrocarbon-radical chain reactions may explain soot inception and growth. Science 2018, 361, 997–1000. [Google Scholar] [CrossRef] [Green Version]
  30. Wang, H. Formation of nascent soot and other condensed-phase materials in flames. Proc. Combust. Inst. 2011, 33, 41–67. [Google Scholar] [CrossRef]
  31. Nielsen, I.E.; Eriksson, A.C.; Lindgren, R.; Martinsson, J.; Nyström, R.; Nordin, E.Z.; Sadiktsis, I.; Boman, C.; Nøjgaard, J.K.; Pagels, J. Time-resolved analysis of particle emissions from residential biomass combustion – emissions of refractory black carbon, pahs and organic tracers. Atmos. Environ. 2017, 165, 179–190. [Google Scholar] [CrossRef]
  32. Fernández, P.; Grimalt, J.O.; Vilanova, R.M. Atmospheric gas-particle partitioning of polycyclic aromatic hydrocarbons in high mountain regions of europe. Environ. Sci. Technol. 2002, 36, 1162–1168. [Google Scholar] [CrossRef] [PubMed]
  33. Shen, G.; Wang, W.; Yang, Y.; Ding, J.; Xue, M.; Min, Y.; Zhu, C.; Shen, H.; Li, W.; Wang, B.; et al. Emissions of pahs from indoor crop residue burning in a typical rural stove: Emission factors, size distributions, and gas-particle partitioning. Environ. Sci. Technol. 2011, 45, 1206–1212. [Google Scholar] [CrossRef] [PubMed] [Green Version]
  34. Lv, Y.; Li, X.; Xu, T.T.; Cheng, T.T.; Yang, X.; Chen, J.M.; Iinuma, Y.; Herrmann, H. Size distributions of polycyclic aromatic hydrocarbons in urban atmosphere: Sorption mechanism and source contributions to respiratory deposition. Atmos. Chem. Phys. 2016, 16, 2971–2983. [Google Scholar] [CrossRef] [Green Version]
  35. Ma, W.-L.; Zhu, F.-J.; Liu, L.-Y.; Jia, H.-L.; Yang, M.; Li, Y.-F. Pahs in chinese atmosphere: Gas/particle partitioning. Sci. Total Environ. 2019, 693, 133623. [Google Scholar] [CrossRef]
  36. Ye, Z.; Li, Q.; Liu, J.; Luo, S.; Zhou, Q.; Bi, C.; Ma, S.; Chen, Y.; Chen, H.; Li, L.; et al. Investigation of submicron aerosol characteristics in changzhou, china: Composition, source, and comparison with co-collected pm2.5. Chemosphere 2017, 183, 176–185. [Google Scholar] [CrossRef]
  37. Zhou, S.; Hwang, B.C.H.; Lakey, P.S.J.; Zuend, A.; Abbatt, J.P.D.; Shiraiwa, M. Multiphase reactivity of polycyclic aromatic hydrocarbons is driven by phase separation and diffusion limitations. Proc. Natl. Acad. Sci. USA 2019, 116, 11658–11663. [Google Scholar] [CrossRef] [Green Version]
  38. Bond, T.C.; Doherty, S.J.; Fahey, D.W.; Forster, P.M.; Berntsen, T.; DeAngelo, B.J.; Flanner, M.G.; Ghan, S.; Kärcher, B.; Koch, D.; et al. Bounding the role of black carbon in the climate system: A scientific assessment. J. Geophys. Res. Atmos. 2013, 118, 5380–5552. [Google Scholar] [CrossRef]
  39. Onasch, T.B.; Trimborn, A.; Fortner, E.C.; Jayne, J.T.; Kok, G.L.; Williams, L.R.; Davidovits, P.; Worsnop, D.R. Soot particle aerosol mass spectrometer: Development, validation, and initial application. Aerosol Sci. Technol. 2012, 46, 804–817. [Google Scholar] [CrossRef]
  40. Wang, J.; Zhang, Q.; Chen, M.; Collier, S.; Zhou, S.; Ge, X.; Xu, J.; Shi, J.; Xie, C.; Hu, J.; et al. First chemical characterization of refractory black carbon aerosols and associated coatings over the tibetan plateau (4730 m a.S.L). Environ. Sci. Technol. 2017, 51, 14072–14082. [Google Scholar] [CrossRef]
  41. Wang, J.; Liu, D.; Ge, X.; Wu, Y.; Shen, F.; Chen, M.; Zhao, J.; Xie, C.; Wang, Q.; Xu, W.; et al. Characterization of black carbon-containing fine particles in beijing during wintertime. Atmos. Chem. Phys. 2019, 19, 447–458. [Google Scholar] [CrossRef] [Green Version]
  42. Paatero, P.; Tapper, U. Positive matrix factorization: A non-negative factor model with optimal utilization of error estimates of data values. Environmetrics 1994, 5, 111–126. [Google Scholar] [CrossRef]
  43. Ulbrich, I.M.; Canagaratna, M.R.; Zhang, Q.; Worsnop, D.R.; Jimenez, J.L. Interpretation of organic components from positive matrix factorization of aerosol mass spectrometric data. Atmos. Chem. Phys. 2009, 9, 2891–2918. [Google Scholar] [CrossRef] [Green Version]
  44. Zhang, Q.; Jimenez, J.; Canagaratna, M.; Ulbrich, I.; Ng, N.; Worsnop, D.; Sun, Y. Understanding atmospheric organic aerosols via factor analysis of aerosol mass spectrometry: A review. Anal. Bioanal. Chem. 2011, 401, 3045–3067. [Google Scholar] [CrossRef] [Green Version]
  45. Wu, Y.; Liu, D.; Wang, J.; Shen, F.; Chen, Y.; Cui, S.; Ge, S.; Wu, Y.; Chen, M.; Ge, X. Characterization of size-resolved hygroscopicity of black carbon-containing particle in urban environment. Environ. Sci. Technol. 2020. [Google Scholar] [CrossRef]
  46. Cui, S.; Gao, J.; Shen, F.; Wang, J.; Huang, D.; Ge, X. Chemical characteristics of submicron black carbon-containing aerosols in shanghai. Atmos. Chem. Phys. (under review).
  47. Wang, J.; Onasch, T.B.; Ge, X.; Collier, S.; Zhang, Q.; Sun, Y.; Yu, H.; Chen, M.; Prévôt, A.S.H.; Worsnop, D.R. Observation of fullerene soot in eastern china. Environ. Sci. Technol. Lett. 2016, 3, 121–126. [Google Scholar] [CrossRef]
  48. Liu, D.; Allan, J.D.; Young, D.E.; Coe, H.; Beddows, D.; Fleming, Z.L.; Flynn, M.J.; Gallagher, M.W.; Harrison, R.M.; Lee, J.; et al. Size distribution, mixing state and source apportionment of black carbon aerosol in london during wintertime. Atmos. Chem. Phys. 2014, 14, 10061–10084. [Google Scholar] [CrossRef] [Green Version]
  49. Haque, M.M.; Kawamura, K.; Deshmukh, D.K.; Fang, C.; Song, W.; Mengying, B.; Zhang, Y.-L. Characterization of organic aerosols from a chinese megacity during winter: Predominance of fossil fuel combustion. Atmos. Chem. Phys. 2019, 19, 5147–5164. [Google Scholar] [CrossRef] [Green Version]
  50. Wang, Q.; Liu, M.; Yu, Y.; Li, Y. Characterization and source apportionment of pm2.5-bound polycyclic aromatic hydrocarbons from shanghai city, china. Environ. Pollut. 2016, 218, 118–128. [Google Scholar] [CrossRef]
  51. Canagaratna, M.R.; Jimenez, J.L.; Kroll, J.H.; Chen, Q.; Kessler, S.H.; Massoli, P.; Hildebrandt Ruiz, L.; Fortner, E.; Williams, L.R.; Wilson, K.R.; et al. Elemental ratio measurements of organic compounds using aerosol mass spectrometry: Characterization, improved calibration, and implications. Atmos. Chem. Phys. 2015, 15, 253–272. [Google Scholar] [CrossRef] [Green Version]
  52. Kroll, J.H.; Donahue, N.M.; Jimenez, J.L.; Kessler, S.H.; Canagaratna, M.R.; Wilson, K.R.; Altieri, K.E.; Mazzoleni, L.R.; Wozniak, A.S.; Bluhm, H.; et al. Carbon oxidation state as a metric for describing the chemistry of atmospheric organic aerosol. Nat. Chem. 2011, 3, 133–139. [Google Scholar] [CrossRef] [PubMed]
Figure 1. Field measurement sites (Nanjing University of Information Science and Technology—NUIST; Shanghai Academy of Environmental Sciences—SAES) and surrounding areas.
Atmosphere 11 00202 g001
Figure 2. Time series of refractory black carbon (rBC) and rBC-bound polycyclic aromatic hydrocarbons (PAHs) in Nanjing University of Information Science and Technology (NUIST) (a) and in Shanghai Academy of Environmental Sciences (SAES) (c), and normalized average mass spectrum of PAHs in NUIST (b) and in SAES (d) (PAH fragments are classified into three groups; pie charts show mass contributions of the three groups of PAHs).
Atmosphere 11 00202 g002
Figure 3. Diurnal patterns of rBC, rBC-bound PAHs, and the mass ratios of PAHs to rBC in NUIST (a) and SAES (b).
Atmosphere 11 00202 g003
Figure 4. High-resolution mass spectra of the positive matrix factorization (PMF)-resolved factor profiles (classified by six different ion families; elemental ratios were calculated based on Canagaratna et al. [51]) (a), and their corresponding time series in SAES (b).
Atmosphere 11 00202 g004
Figure 5. Scatter plots of measured and re-constructed rBC (a) and PAHs concentrations (b), and pie charts of mass contributions of different factors to the total primary organic aerosol (POA) (c), and relative contributions of these factors to rBC (d) and PAHs (e) in NUIST.
Atmosphere 11 00202 g005
Figure 6. Scatter plots of measured and re-constructed rBC (a) and PAHs concentrations (b), and pie charts of mass contributions of different factors to the total primary organic aerosol (POA) (c), and relative contributions of these factors to rBC (d) and PAHs (e) in SAES.
Atmosphere 11 00202 g006
Figure 7. Variations of PAH concentrations versus the oxidation states (OSc), POA, semi-volatile oxygenated OA (SV-OOA) or less oxidized oxygenated OA (LO-OOA), and low-volatility oxygenated OA (LV-OOA) or more oxidized oxygenated OA (MO-OOA) concentrations: (ad) NUIST; (eh) SAES.
Atmosphere 11 00202 g007
Figure 8. Variations of PAH concentrations versus CO, O3, NO2, and SO2 concentrations: (ad) NUIST; (eh) SAES.
Atmosphere 11 00202 g008
Figure 9. Variations of PAHs concentrations versus relative humidity (RH), temperature (T), wind speed (WS), and wind direction (WD): (ad) NUIST; (eh) SAES.
Atmosphere 11 00202 g009

