Article

The Influences of Tropical Volcanic Eruptions with Different Magnitudes on Persistent Droughts over Eastern China

1
Key Laboratory for Virtual Geographic Environment, Ministry of Education, State Key Laboratory Cultivation Base of Geographical Environment Evolution of Jiangsu Province, Jiangsu Center for Collaborative Innovation in Geographical Information Resource Development and Application, School of Geography Science, Nanjing Normal University, Nanjing 210023, China
2
Open Studio for the Simulation of Ocean-Climate-Isotope, Qingdao National Laboratory for Marine Science and Technology, Qingdao 266237, China
3
Climate System Research Center, Department of Geosciences, University of Massachusetts, Amherst, MA 01003, USA
4
State Key Laboratory of Loess and Quaternary Geology, Institute of Earth Environment, CAS, Xi’an 710061, China
5
Department of Geography, The Ohio State University, Columbus, OH 43210, USA
6
Jiangsu Provincial Key Laboratory for Numerical Simulation of Large Scale Complex Systems, School of Mathematical Science, Nanjing Normal University, Nanjing 210023, China
*
Author to whom correspondence should be addressed.
Submission received: 19 January 2020 / Revised: 12 February 2020 / Accepted: 15 February 2020 / Published: 18 February 2020
(This article belongs to the Special Issue Atmospheric Hazards)

Abstract

:
In this study, the influences on persistent droughts over Eastern China from tropical volcanic eruptions with three categories of magnitudes, i.e., 25 Tg, 50 Tg, and 100 Tg, were investigated through three groups of volcanic sensitivity experiments based on the Community Earth System Model (CESM). The results showed that, the 25 Tg tropical volcanic eruptions are too weak to significantly influence the regional precipitation changes over Eastern China, while the 50 Tg tropical volcanic eruptions can strongly intensify droughts and prolong the drought conditions for about five years. Both the extension and intensification of the drought conditions induced by 100 Tg tropical volcanic eruption are the largest among the three sensitivity experiments. These drought conditions are mainly caused by the weakened East Asia Summer Monsoon (EASM), and their extension and intensification depend on the strength of the volcanic eruptions. The intensities of weakened EASMs after volcanic eruptions are associated with the distinct ocean–land thermal contrast after eruptions. The ocean–land thermal contrast is the largest after the 100 Tg tropical volcanic eruptions, while it is much weaker after the 25 Tg volcanic eruptions. The durations of drought extensions are determined by the recovery rates of the West Pacific Subtropical High (WPSH), which are associated with the magnitudes of the volcanic eruptions.

Graphical Abstract

1. Introduction

Volcanic eruption is a major external forcing that affects different aspects of regional climate changes over the world by injecting plenty of sulfate volcanic aerosol into the stratosphere and reducing the solar radiation arriving at the surface [1]. Since volcanic eruptions cast substantial effects on regional climate changes at different spatiotemporal scales and fundamentally affect the development of human communities, great efforts have been devoted to investigating the influences of volcanic eruptions on regional climate changes [2]. Many studies have confirmed that volcanic activities can produce global-scale cooling in the short term [3,4,5] and trigger a long-term cooling in the Arctic through the positive feedback of ice and snow cover [6]. The initiation of the Little Ice Age (LIA) was also found to be associated with volcanic eruptions and sustained due to the feedback between the sea ice and ocean [7].
The impacts of volcanic eruptions on regional temperature and precipitation changes have attracted much attention recently [8]. Both reconstructed data and model simulations demonstrated that, on a global scale, volcanic eruptions can lead to rainfall deficit in summer monsoon regions over the world [9], with the largest precipitation decreases occurring in tropical areas [10]. On a regional scale, Northern Hemisphere volcanic eruptions are more likely to reduce Northern Hemispheric monsoon precipitation than equatorial and southern monsoon rainfall [11]. Large volcanic eruptions in the past millennium triggered anomalous dry conditions in Asia [12,13], but it was relatively wetter over the southeast part while drier in the central part [12]. In Europe, strong volcanic eruptions induced an aridity in the central part, while relative wetter conditions existed in the northern part [14]. Some studies also found that volcano-induced droughts usually persist longer over the ocean than the land [13].
Eastern China is a typical monsoon domain, which is severely impacted by extreme drought events [15,16]. Some studies found that many drought events in the world are triggered primarily by internal variability of climate system [17,18,19]. Meanwhile, external forcings such as strong volcanic eruptions can also cast significant effects on the droughts over the Eastern China [2]. For example, the Ming Dynasty Mega Drought [20,21] was a typical drought triggered by internal variability and enhanced by the volcanic eruption at Mount Parker in 1641 [2,22]. The mechanisms behind the volcano-related droughts can be explained directly by the retreat of the Eastern Asian summer monsoon (EASM) [23,24,25] through the reduced ocean–land thermal contrast after volcanic eruptions [8,24]. Moreover, many studies also highlighted that strong volcanic eruptions can influence the evolution of drought in Eastern China [26], through triggering increased occurrences of El Nino-like states during the years of eruptions, and La Nina-like states in the second years after eruptions [27,28,29]. On a decadal time scale, strong volcanic eruptions can induce negative PDO-like (Pacific Decadal Oscillation) phases [30], as well as the negative AMO-like (Atlantic Multidecadal Oscillation) states [25,31], and then influence the precipitation changes over Eastern China [32,33].
Moreover, previous studies demonstrated that the linear combination of volcanic forcing and drought events triggered by internal variability over Eastern China may intensify and extend the drought conditions for about 3–4 years, and the duration and intensity of droughts depend on the volcanic eruptions occurring at different drought phases [34]. However, the evolution of droughts driven by volcanic eruptions with different magnitudes remains unclear. For example, do the volcanic eruptions with different magnitudes have different influences on the droughts over Eastern China triggered by internal variability? Is there any threshold of volcanic eruption magnitude that could prolong and strengthen the droughts, and what are the corresponding physical mechanisms?
Therefore, in this study, to further understand the interactions between internal variability and volcanic forcing with divergent magnitudes (i.e., 25 Tg, 50 Tg, and 100 Tg), three groups of volcanic sensitivity experiments were performed based on the Community Earth System Model (CESM). In each of the experiments, the volcanic forcing of 25 Tg, 50 Tg, and 100 Tg was implemented to 10 drought events selected from the CESM control run (CTRL). The extensions and evolution of the droughts induced by the volcanic eruptions with different magnitudes were then analyzed, and the corresponding mechanisms were investigated as well. This study will help to provide insights to the better understanding of the combined effects of internal variability and external forcing, and improve future projections of climate changes and corresponding adaptations.

2. Data and Methods

2.1. Data and Experiment Design

To investigate the influences on droughts from the volcanic eruptions with different magnitudes, three groups of volcanic sensitivity experiments with magnitudes of 25 Tg, 50 Tg and 100 Tg were performed based on the Community Earth System Model 1.0.3 (CESM 1.0.3) version T31_g37 which is from the National Center for Atmospheric Research (NCAR) in American in 2010. According to previous studies, CESM can precisely simulate the regional climate changes over Eastern China in the past millennium [35]. The simulated monthly data in this study has a ~3.75 resolution for atmosphere and land components. The volcanic forcing used to drive the sensitivity experiments is derived from the reconstructed ice-core based aerosol concentrations in the last 1500 years [36], which is used as the only external forcing of the volcanic sensitivity experiments.
In this study, firstly, we ran a 2400-year control experiment based on the initial condition of 1850, with the first 400 years as spinning up. Ten initial conditions were selected from the last 2000 years of the control run. Then, 10 control experiments (CTRLs) with a length of 50 years were performed through CESM, using the 10 selected initial conditions, respectively. In each of the 10 CTRLs, one drought case persisting nearly five years was selected, and finally 10 drought cases triggered by internal climate variability were chosen. In this study, only 10 CTRLs and 10 drought cases were used because of the computational cost. Subsequently, the ice-core based Volcanic Index 2 reconstructed by Gao et al. [36] was used as the only volcanic forcing to drive the model. The 25 Tg, 50 Tg, and 100 Tg volcanic eruptions were uniformly imposed onto the last years of the 10 droughts, respectively. In our previous studies, volcanic eruptions occurring in different drought phases had different impacts on the droughts. Volcanic eruptions occurring in the late phase of a drought can significantly intensify the dry conditions, while middle and early phase eruptions have relatively smaller effects on the droughts [22]. Therefore, to acquire the most significant results, volcanic aerosols were imposed on the last years of the droughts. Both CTRLs and volcanic sensitivity experiments were run in parallel with the same initial conditions. The Supposed Epoch Analysis on the three groups of sensitivity experiments was calculated, in which a window centered on the year of volcanic eruption (year-0) with 10 years before and after the eruptions was demonstrated.
In this paper, the reconstructed Palmer Drought Severity Index (PDSI) spanning from 1300 to 2005 [20] was also used to compare the results from the sensitivity experiments. The PDSI is derived from tree rings and covers the area of eastern Asia (61.25° E–143.75° E, −8.75° S–56.25° N) with a resolution of 2.5 degrees.

2.2. Definition of a Persistent Drought and the Studied Area

The definitions of persistent drought events vary from different studies. For example, Meehl et al. [37] defined a persistent drought event as negative precipitation anomalies lasting for more than 20 years after an 11-year moving-average. Stevenson et al. [18] defined a persistent drought event as precipitation anomalies persisting more than 15 years. In this study, we define a persistent drought event as negative precipitation anomalies persisting at least five consecutive years, with precipitation anomaly of at least one year larger than one time the standard deviation. In this study, Eastern China is selected as the study region (105–120° E, 32–40° N), following Zheng et al [38].

3. Results

3.1. The Spatio-Temporal Changes of Precipitation after Volcanic Eruptions with Different Magnitudes

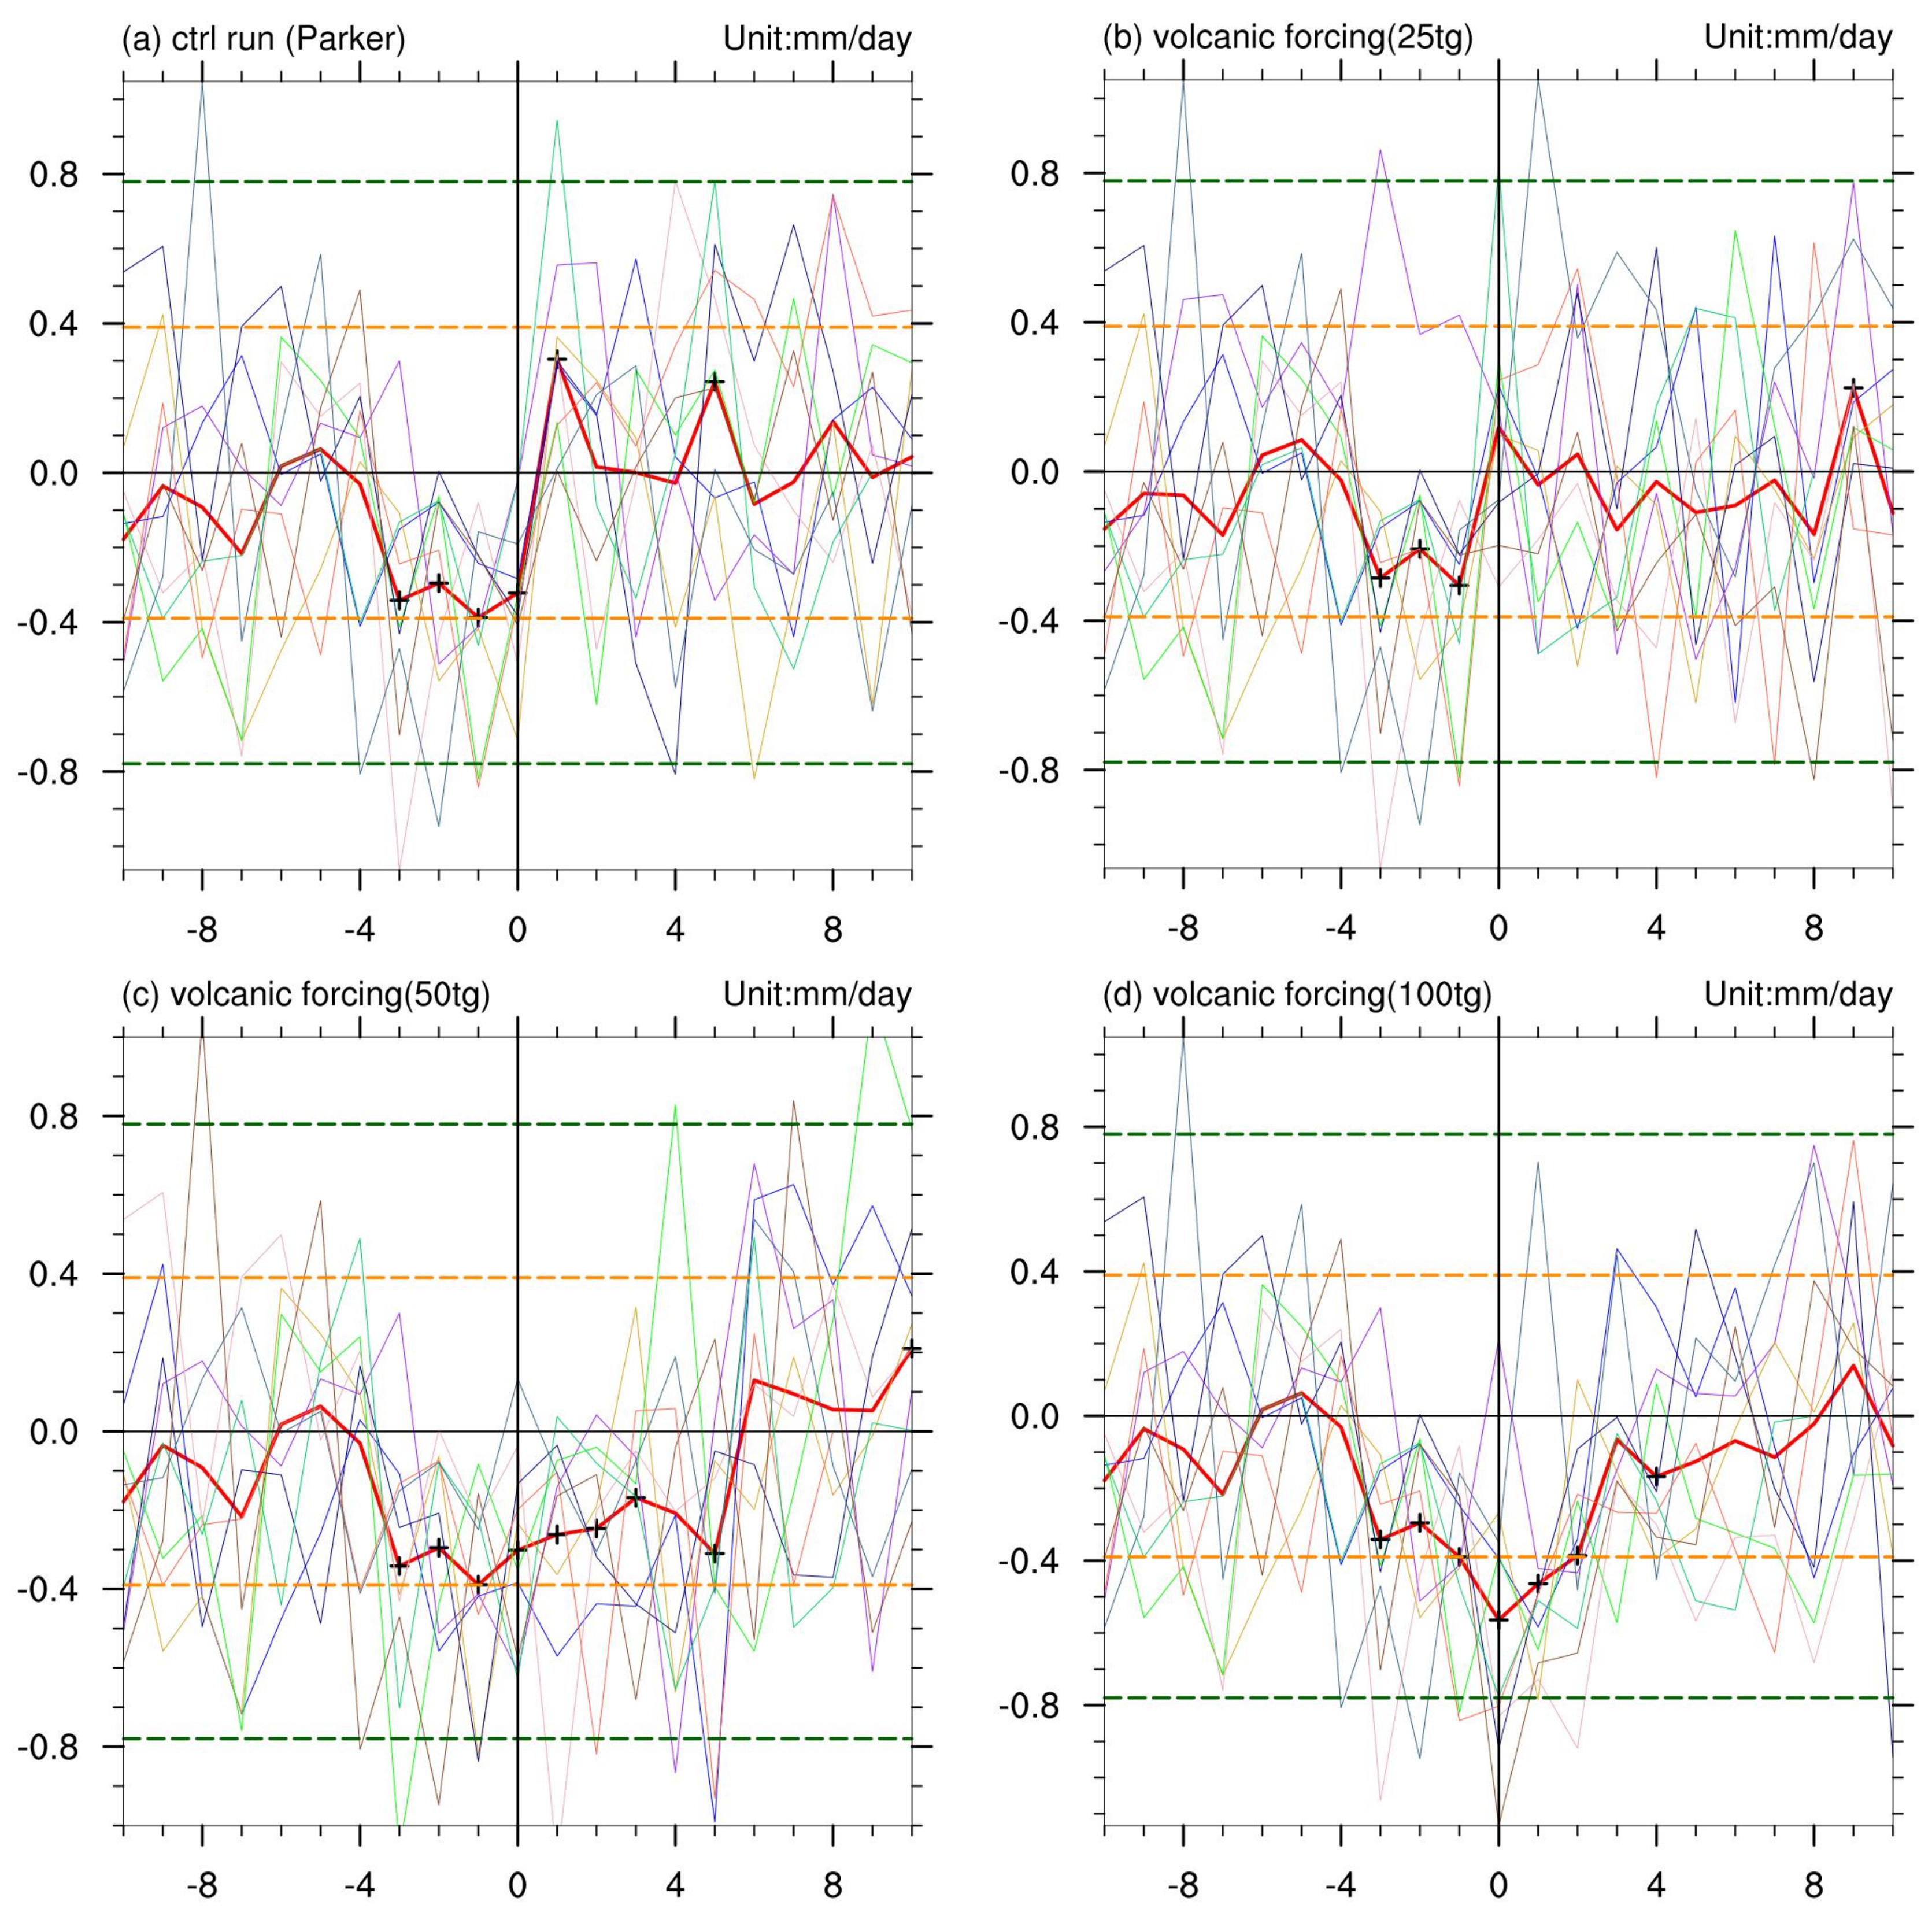
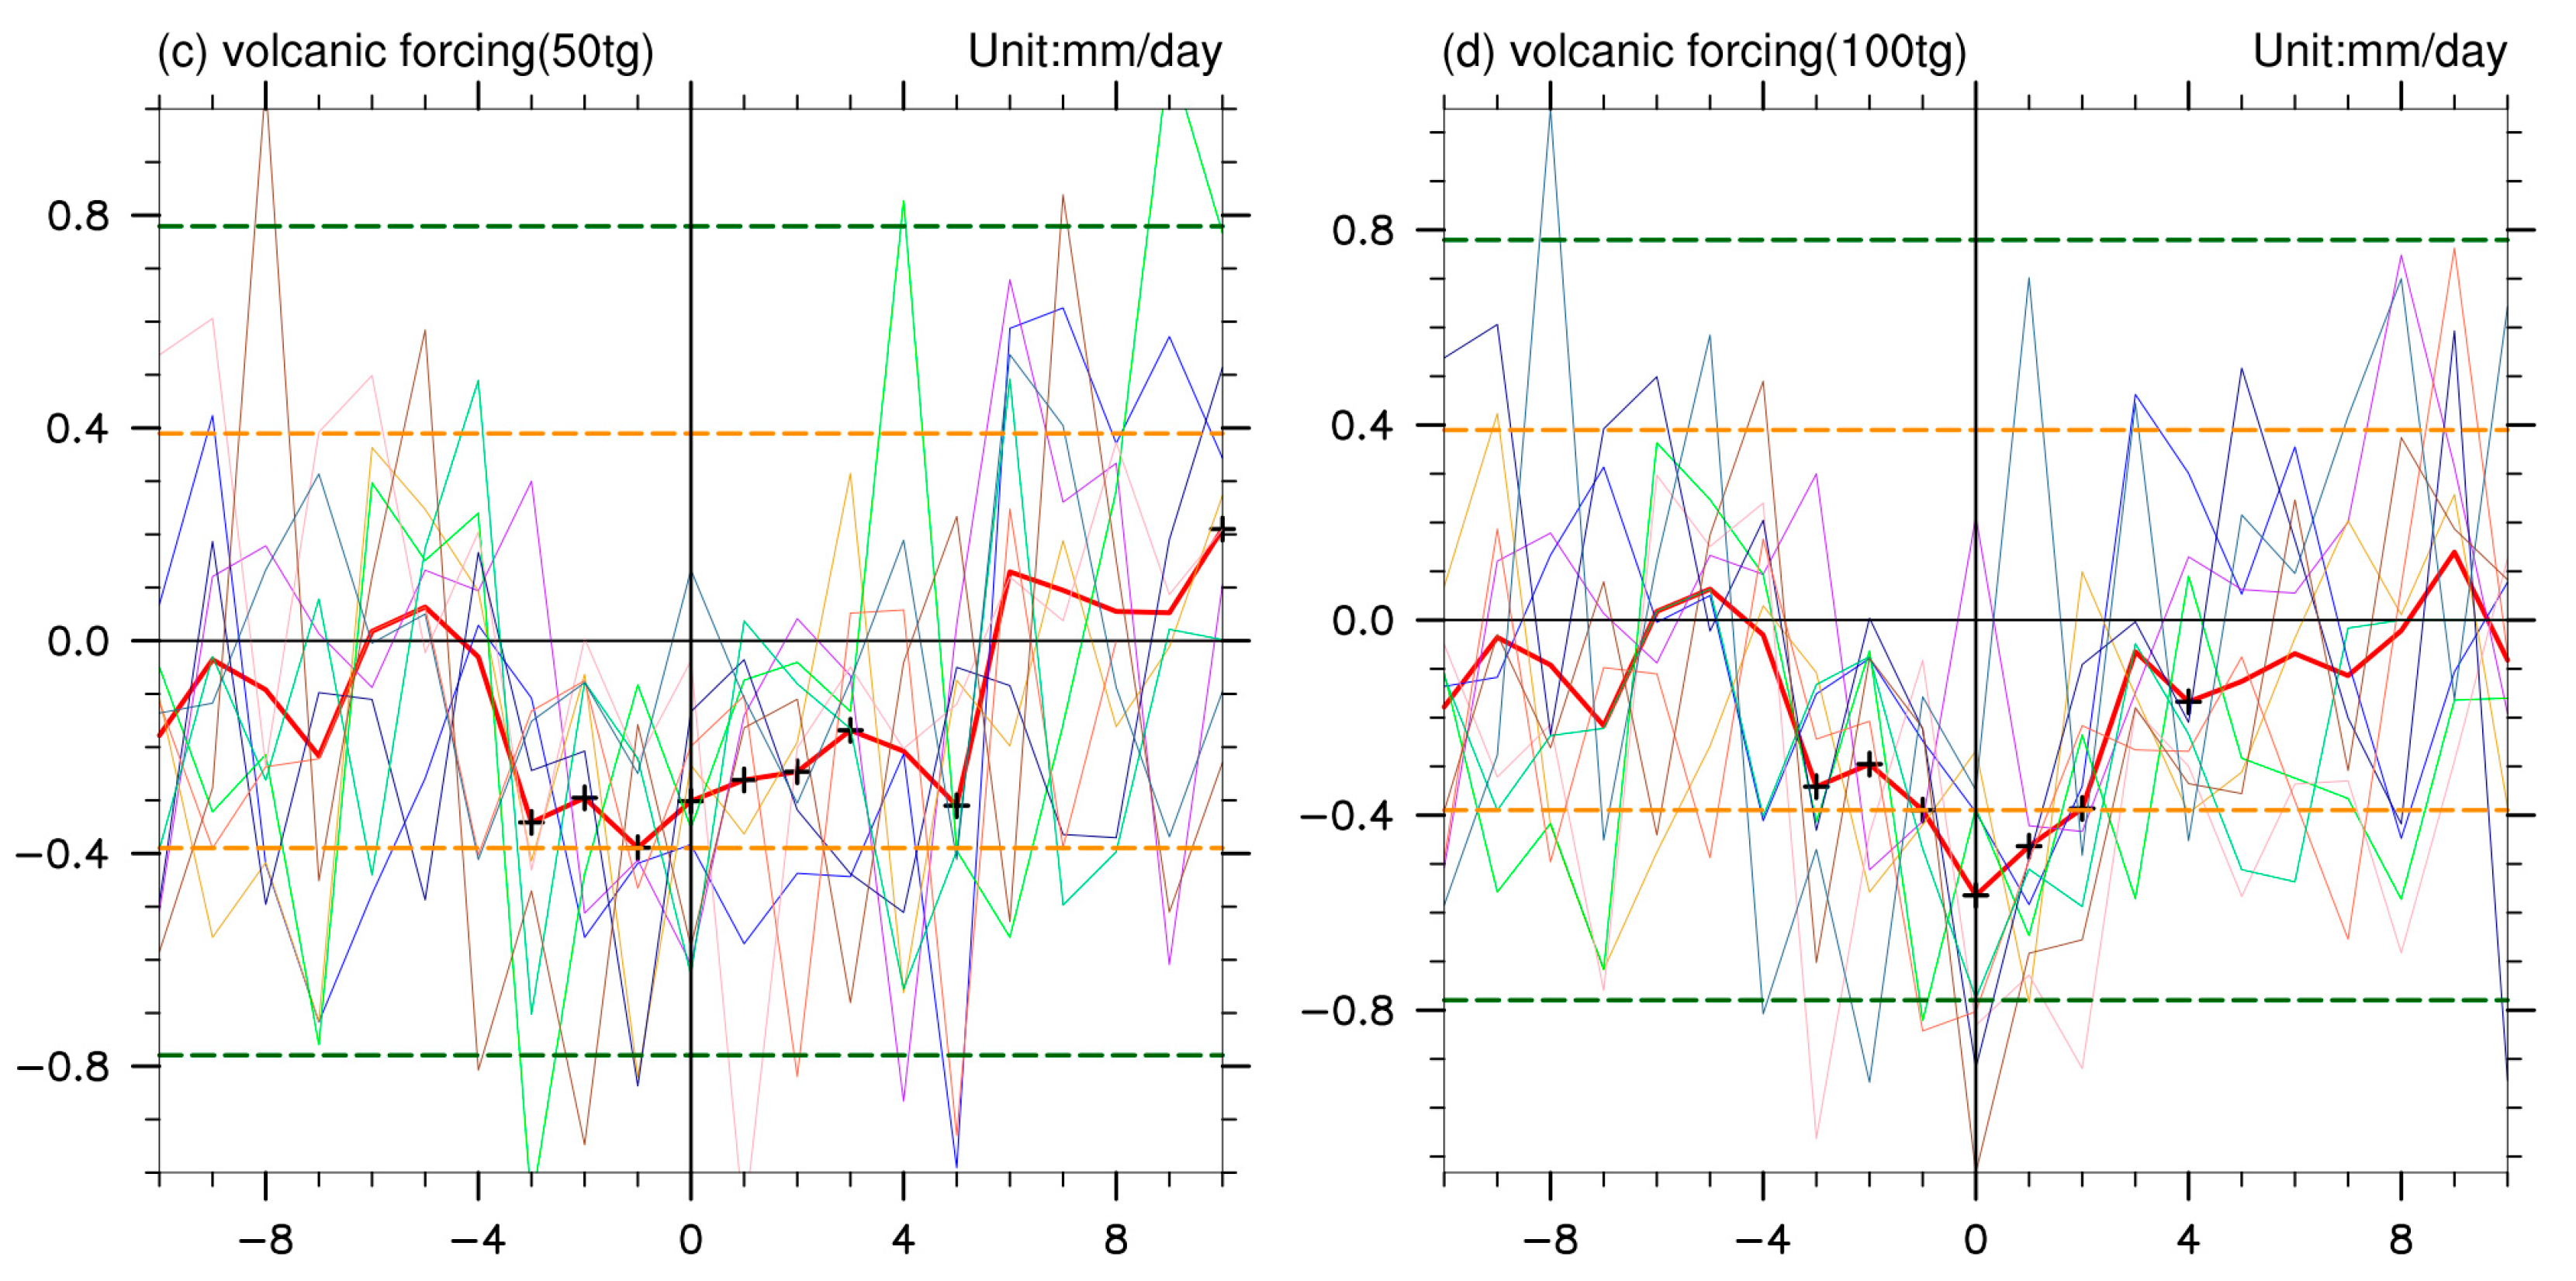
3.1.1. The Evolution of Precipitation Changes after Volcanic Eruptions

The precipitation changes after volcanic eruptions with three categories of magnitudes were firstly compared (Figure 1). In the CTRL, the mean precipitation anomaly over Eastern China from three years before the eruption (year-3) to the year of volcanic eruptions (year-0) was –0.26 mm/day, larger than the 0.5 standard deviation (Figure 1a). During the first two years after 25 Tg volcanic eruptions, there existed nearly no significant precipitation decreases, and the mean magnitude of the insignificant negative precipitation anomalies after the third year was really small (~–0.06 mm/day, Figure 1b). In each of the 10 cases, extended drought conditions with precipitation anomalies lower than 1 standard deviation occurred in only 4 out of 10 cases, indicating that the responses of precipitation changes to 25 Tg volcanic eruptions were insignificant.
After 50 Tg volcanic eruptions, droughts significantly persisted for five more years after the volcanic eruptions (Figure 1c). At the year-0, the magnitudes of drought in sensitivity experiments were close to that in the CTRL. The mean precipitation anomaly from year-0 to year-5 was about –0.25mm/day, significant at p < 0.05, based on a Student t-test. Therefore, the 50 Tg volcanic eruptions significantly intensified and extended the droughts.
In the 100 Tg volcanic sensitivity experiments, the droughts were prolonged by eight more years, with the prominent precipitation anomalies occurring at year-0 to year-2 and year-4 (p < 0.05) (Figure 1d). The drought magnitude at year-0 was –0.56mm/day, larger than that in the CTRL in the same year. Besides, the mean precipitation anomaly after the volcanic eruptions (year-0 to year-5) was –0.3 mm/day, lower than the –1 standard deviation. Droughts after the 100 Tg volcanic eruptions were the most severe, compared with the other two experiments.
To compare the effects of the three categories of volcanic eruptions quantitatively here, a Student-t test was applied to the precipitation changes of the volcano-induced droughts (years 0–3) in the three groups of sensitivity experiments. The results showed that precipitation changes following the 25 Tg volcanic eruptions were significantly smaller than those after 50 Tg eruptions (p < 0.01). At the same time, the differences between the effects of the 50 Tg and 100 Tg volcanic eruptions were significant as well (p < 0.05). The findings demonstrate that the effects of volcanic eruptions with magnitudes of 25 Tg, 50 Tg, and 100 Tg are significantly different, with more severe precipitation decreases after larger volcanic eruptions. Volcanic eruptions of 25 Tg can hardly trigger drought conditions after volcanic eruptions, while volcanic activities with magnitudes above 50 Tg can significantly intensify and extend droughts.
Comparing the results of the three groups of sensitivity experiments, it was obviously found that volcanic eruptions cannot intensify a natural drought when the magnitude of volcanic eruption is smaller than 25 Tg. The larger the magnitudes of volcanic eruptions are, the more severe and longer the droughts will be afterwards. Moreover, the intensity of volcano-induced drought significantly increases with the magnitudes of volcanic eruptions based on linear regression (Figure 2a) (r = 0.40, p < 0.05).

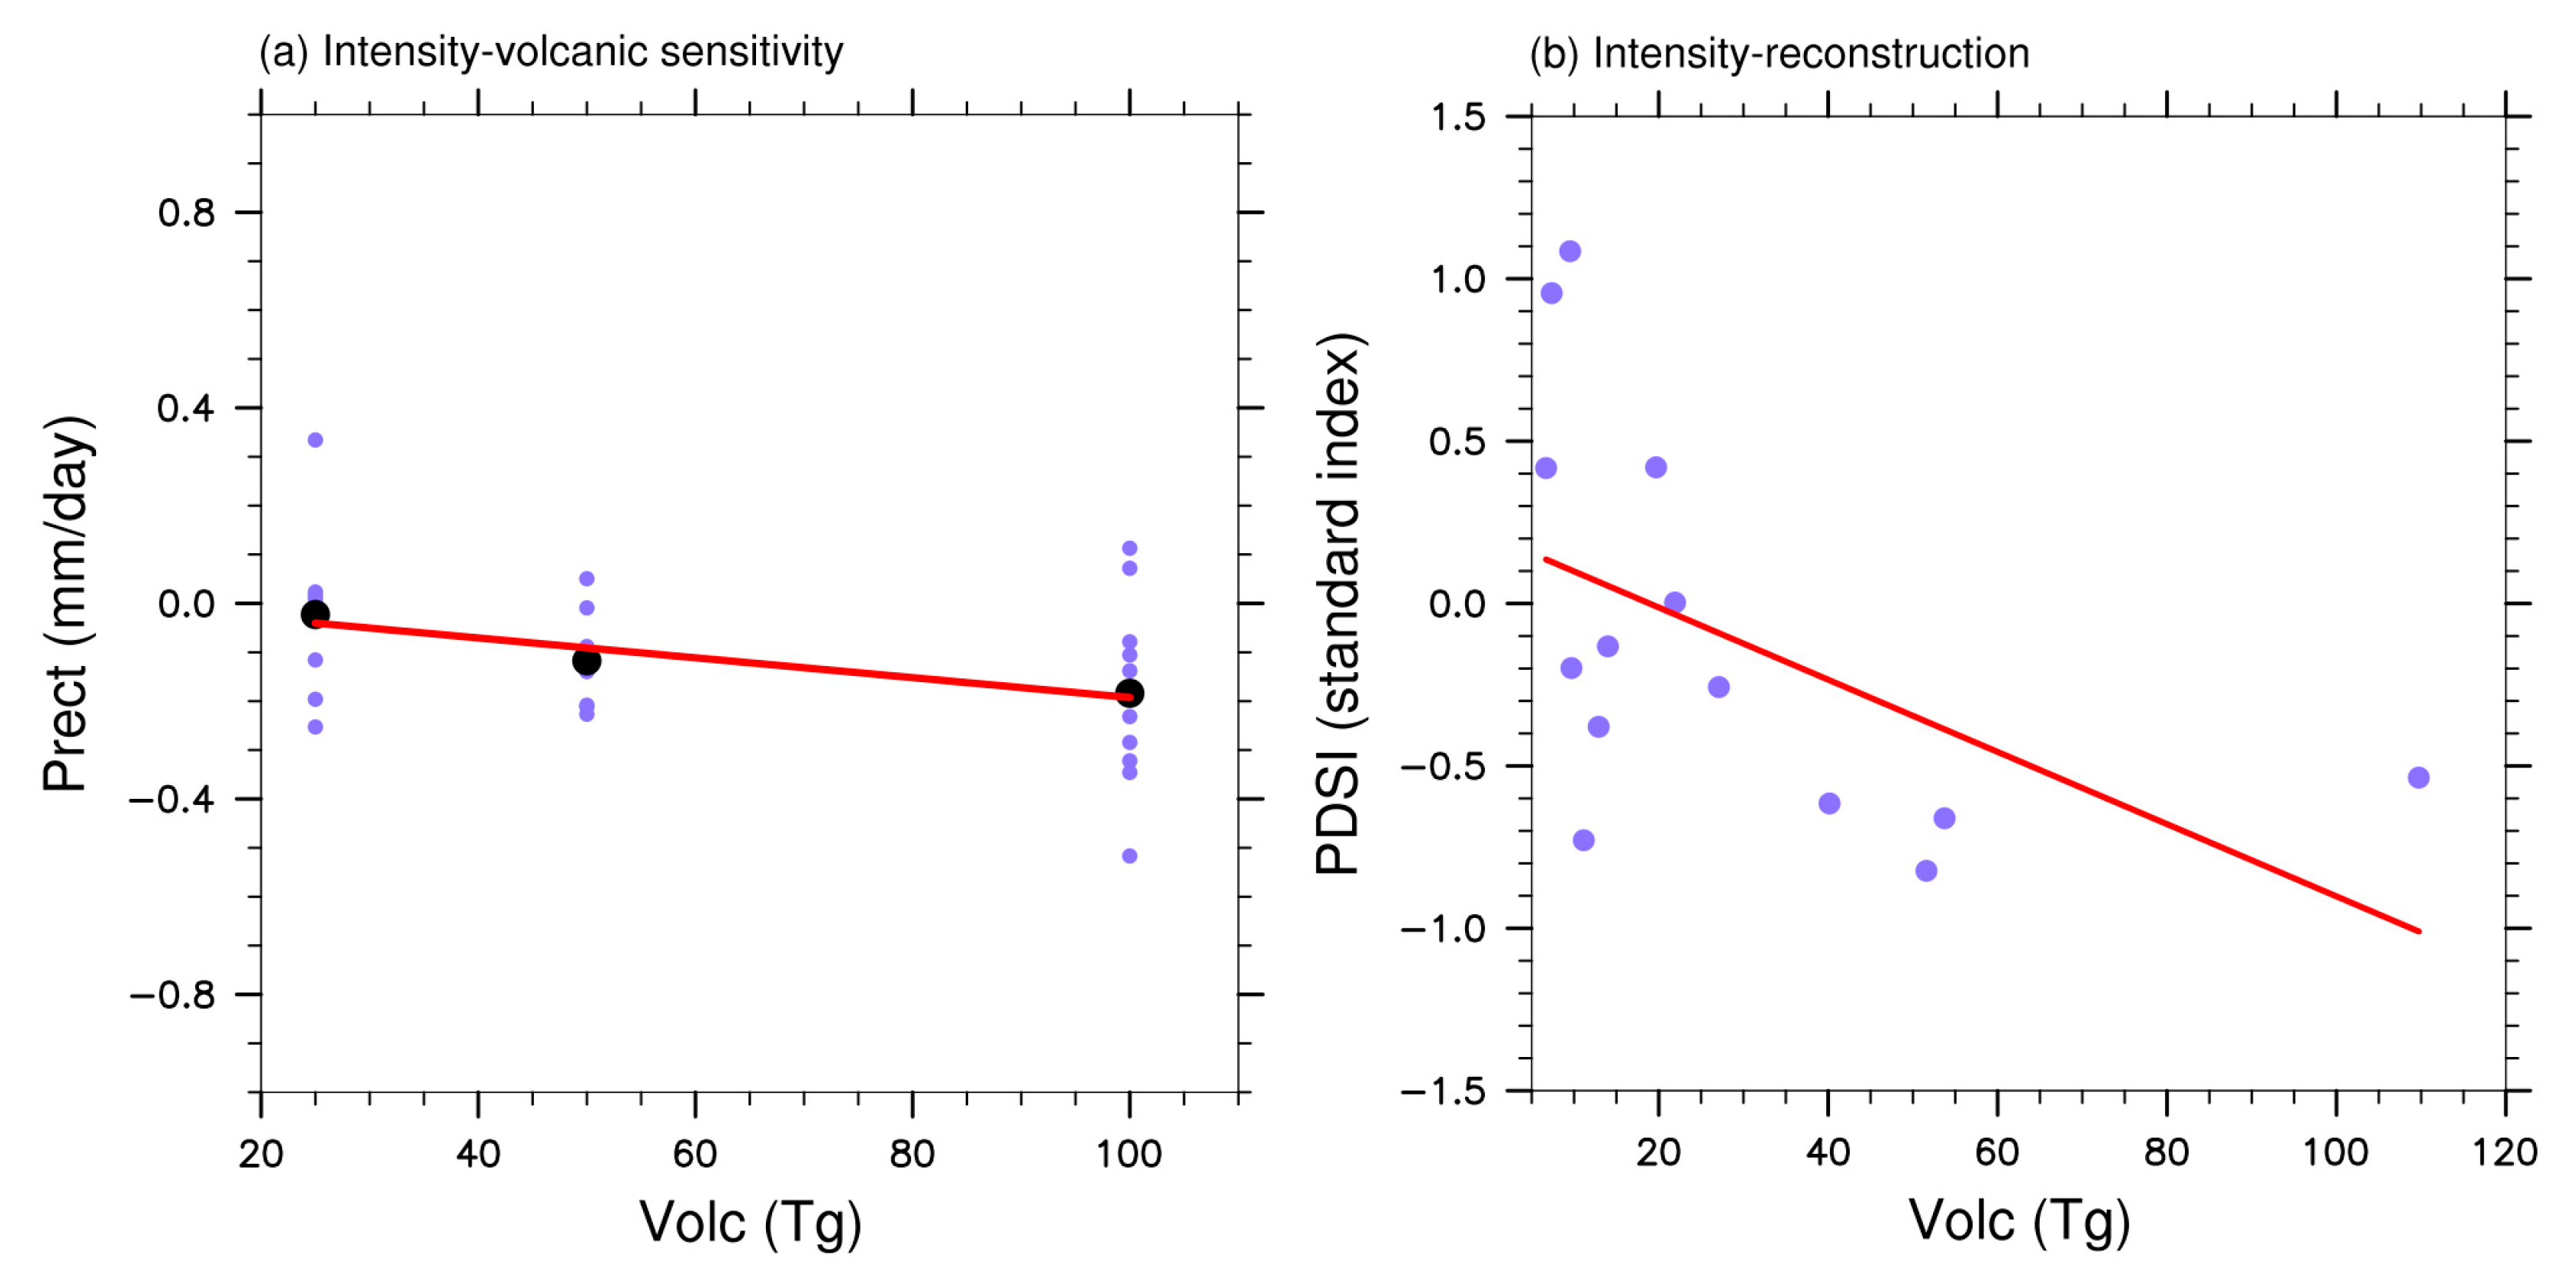
3.1.2. The Evolution of the Reconstructed PDSI Changes after Volcanic Eruptions

To compare the model simulations with reconstructed results, the evolution of the droughts from the reconstructed PDSI [20] coinciding with volcanic eruptions with different magnitudes during the period 1300–2000 were analyzed (Figure 3). Firstly, 14 drought events, in which drought persisted several years before volcanic eruptions, were selected. Among these 14 cases, there were nine volcanic eruptions with magnitudes smaller than 25 Tg (volcanic eruptions in 1459, 1328, 1982, 1761, 1925, 1416, 1593, 1480, 1796), two volcanic eruptions with magnitudes between 25 and 50 Tg (volcanic eruptions in 1835 and 1693), two volcanic eruptions with magnitudes between 50 and 100 Tg (volcanic eruptions in 1809 and 1641), and only one volcanic eruption larger than 100 Tg (the volcanic eruption in 1815). The ensemble means of the droughts coinciding with the four categories of volcanic eruptions were calculated, respectively. The results indicated that volcanic eruptions less than 25 Tg can hardly induce precipitation decreases in Eastern China. Volcanic eruptions between 25 and 50 Tg can prolong droughts for two years. When the magnitudes of volcanic eruptions are larger than 50 Tg and smaller than 100 Tg, the volcano-related droughts persist several years after eruptions, with a rebound in the third year. When the magnitude of volcanic eruption is larger than 100 Tg, drought is extended for four more years, and both the persistence and intensity of the drought are the most severe in the four groups of reconstructed results. The scatter plot of the drought intensity and the magnitudes of volcanic eruptions (Figure 2b) also shows that the severity of drought significantly increases with the magnitudes of volcanic eruptions linearly (r = 0.51, p < 0.05). This is consistent with the simulated results (Figure 2a).

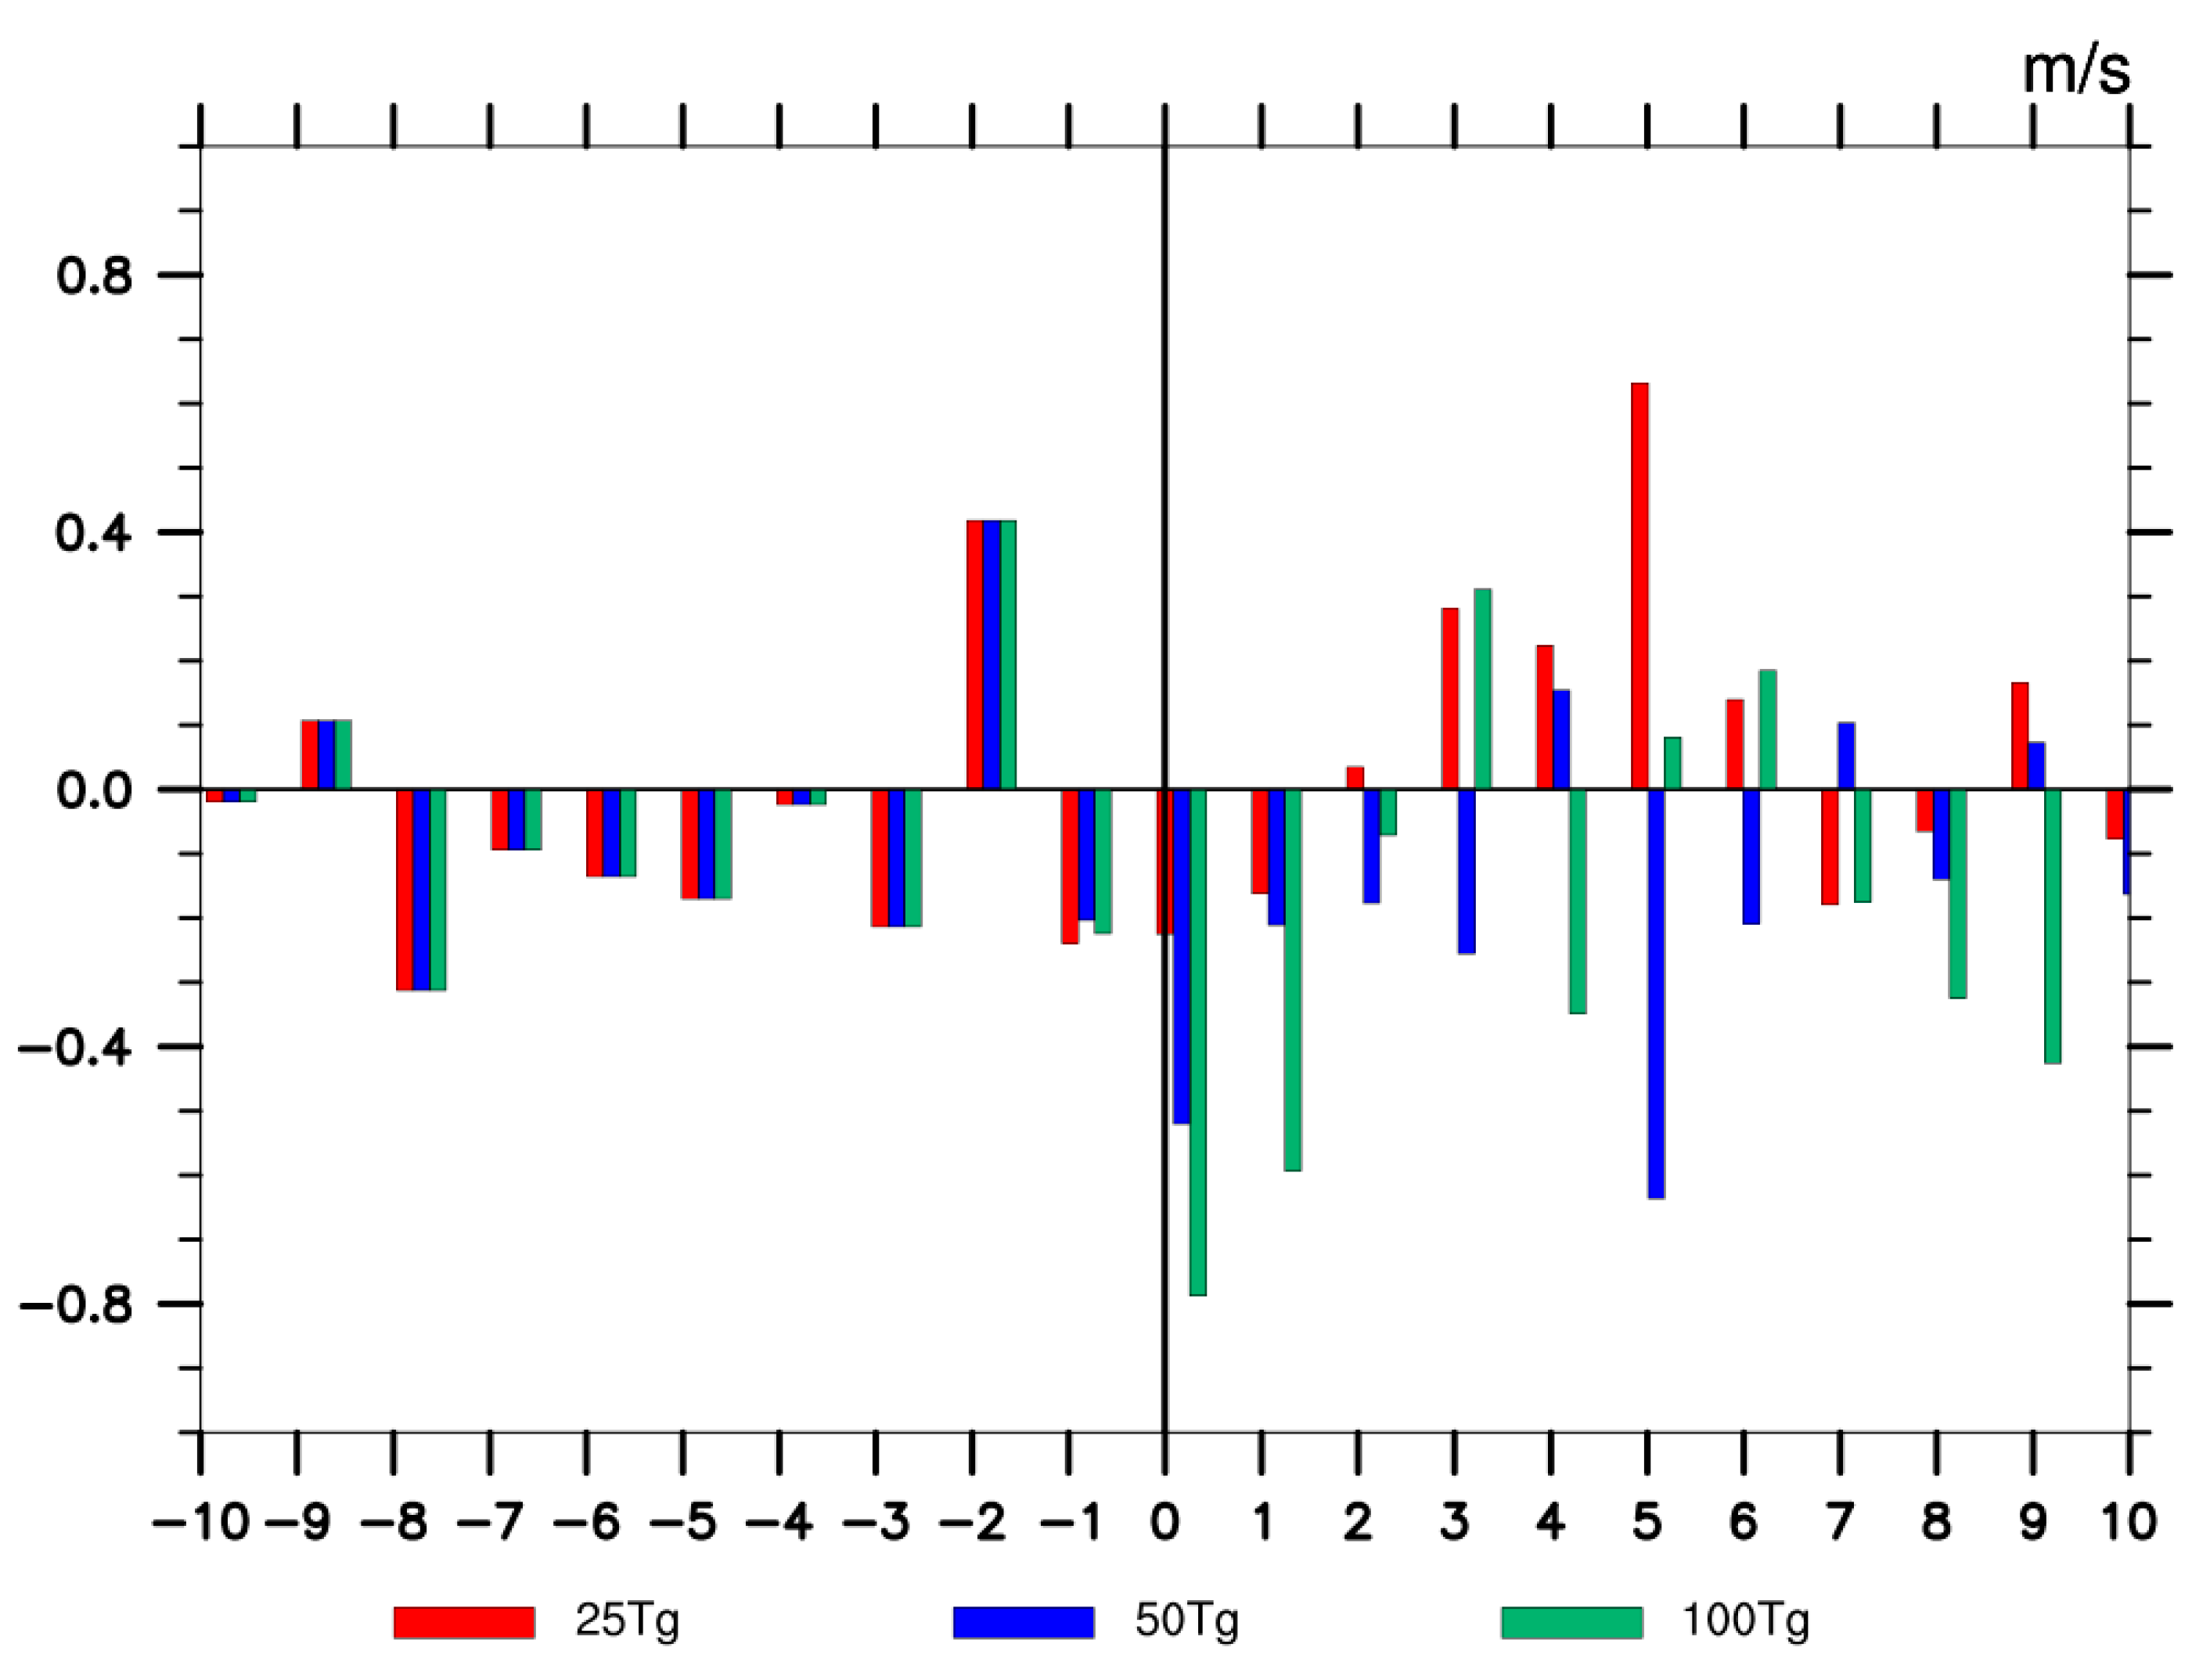
3.1.3. The Evolution of the Large-Scale Circulations after Volcanic Eruptions

In the three groups of sensitivity experiments, the precipitation changes over Eastern China exhibited a typical “southern-flooding-and-northern-drought” pattern during the drought years after volcanic eruptions (Figure S1). Among all of the three groups of experiments, volcanic eruptions induced increased sea level pressure (SLP) anomalies over Eastern China, accompanied by strong northwest wind anomalies (Figures S2–S4). The weakening of EASM (Figure 4) after volcanic eruptions was a key driver to the precipitation deficit over Eastern China. Here, we defined the EASM index (EASMI) in Eastern China as the meridional velocity anomalies (unit: m/s) at 850 hPa averaged over 25–45° N, 105–120° E.
By comparing the three groups of sensitivity experiments, it was found that the intensity of EASM weakening was the largest after 100 Tg volcanic eruptions, while the smallest was after the 25 Tg ones (Figure 4). The 25 Tg volcanic eruptions led to EASM weakening for just two years (year-0 to year-1), the persistent time of which was the shortest among the three sensitivity experiments. Also, in the first two years after the 25 Tg volcanic eruptions, the northern wind anomalies were very weak and only occurred over the north part of Eastern China, with southern wind anomalies still prevailing in the southern part. This resulted in insignificant monsoon precipitation decreases (Figures S2–S4). At the same time, the 50 Tg and 100 Tg volcanic sensitivity experiments demonstrated that the northwest wind prevailed and the EASM weakening was sustained three and four years, respectively, after volcanic eruptions, and did not rebound until the 4th and 5th year (Figure 4), due to the anticyclone anomalies in the southeastern coast of China (Figures S3 and S4). The intensity of the EASM weakening was strongly associated with the SLP gradients between Eastern China and the surrounding oceans (Figure 5), which were stronger with the increased volcanic eruption magnitudes. This was consistent with the precipitation changes after volcanic eruptions with different magnitudes (Figure 1).

3.2. Mechanisms behind the Evolution of Drought after Volcanic Eruptions with Different Magnitudes

3.2.1. Direct Influences of the Volcanic Eruptions on Droughts

To further explore the influences from volcanic eruptions on the EASM, we analyzed the anomalous surface temperature and SLP over the ocean and land in the three groups of sensitivity experiments. The results showed that the surface temperature decreased rapidly over both ocean and land, with faster rates of temperature decreases over the land than the ocean due to the different thermal capacities (Figure 5a–c). The magnitudes of temperature differences between land and sea increased with the magnitudes of volcanic eruptions (i.e., ~0.27 °C after the 25 Tg volcanic eruptions, ~0.6 °C after the 50 Tg volcanic eruptions, and ~1.24 °C after the 100 Tg volcanic eruptions), and reached the largest in the eruption years (Figure 5a–c).
The distinct thermal contrast between land and ocean induced SLP ingredients (Figure 5d–f), and thus contributed to precipitation deficit over Eastern China. It was discovered that the largest SLP difference between the land and the ocean was ~0.23 hPa after 25 Tg volcanic eruptions, ~0.54 hPa after 50 Tg volcanic eruptions (about twice the difference after the 25 Tg volcanic eruptions), and ~0.88 hPa after 100 Tg volcanic eruptions (about four times the difference after the 25 Tg volcanic eruptions). The SLP differences increased nearly linearly with the magnitudes of volcanic eruptions. Therefore, the intensities of EASM weakening also increased with the magnitudes of volcanic eruptions due to the variations of surface temperature, along with the changes of SLP.
Moreover, the increased land–sea SLP gradient only persisted for one year in all three groups of sensitivity experiments, and the increased land–sea temperature gradient persisted for one year, two years, and one year, respectively (Figure 5d–f). These indicated that the direct influences from volcanic eruptions with different magnitudes mainly impacted the intensities of drought, but had small influences on the duration of drought.

3.2.2. Indirect Influences of the Volcanic Eruptions on Droughts

In this section, the changes of the Sea Surface Temperature Anomalies (SSTA) and the West Pacific Subtropical High (WPSH) after volcanic eruptions with the three categories of volcanic magnitudes are explored, to deeply understand the indirect influences of volcanic eruptions with different magnitudes on the droughts. Here, we used the 5820 hPa contour to represent the climatological strength of WPSH. Among all of the three groups of sensitivity experiments, the WPSH weakened and retreated to the east immediately after eruptions, with the global SSTA decreased and EASM weakened (Figure 6a–c). Several years after the volcanic eruptions, the WPSH recovered and extended back to the west, with the SSTA along the eastern coast of China becoming warmer (Figure 6a–c). The variations of the WPSH were highly correlated with the precipitation changes (Figure 6a–c), demonstrating that volcanic eruptions can indirectly influence the persistence of droughts over Eastern China through influencing the recovery rates of the WPSH.
After the 25 Tg volcanic eruptions, the magnitudes of the WPSH weakening and the eastward retreat were the smallest, and the recovery rate of the WPSH was the fastest (Figure 6a, Figure S5a–h). It took three years for the WPSH to return to normal, and the negative SSTA in the eastern coast of China (Figure 6a), which was the smallest in all three groups of experiments (~–0.27 °C for the mean across three years after eruptions), persisted for three years as well. Moreover, there existed no significant positive correlations between the WPSH changes and precipitation changes, indicating that the magnitudes of volcanic eruptions were too small to induce significant WPSH changes.
In the 50 Tg volcanic eruption experiment, the WPSH retreated on the eruption year and recovered in the sixth year after volcanic eruptions, with the weakened WPSH persisting for five years (Figure 6b and Figure S6a–h). The corresponding SSTA along the eastern coast of China significantly decreased for five years, and the magnitudes of SSTA were about –0.44 °C, averaged across five years after eruptions (Figure 6b). The changes of the SSTA, WPSH, and precipitation were consistent, with significant positive correlation coefficients among them.
In the sensitivity experiment of 100 Tg volcanic eruptions, the WPSH returned to normal in the seventh year after the volcanic eruptions, and the weakening of WPSH persisted for six years (Figure 6c and Figure S7a–h). The corresponding negative SSTA along the eastern coastal areas of China persisted for seven years as well, with significant SSTA appearing in the first five years after eruptions. The magnitude of SSTA were about –0.66 °C averaged across the first four years of the eruptions (Figure 6c), which was larger than the results in the 50 Tg volcanic eruption experiments.
In brief, the intensity of the WPSH weakening and its recovery rates were different after volcanic eruptions with different magnitudes, and thus led to different durations of the droughts. Larger volcanic eruptions usually result in larger WPSH retreats and slower recovery rates, and thus contribute to the longer persistence of the drought conditions, and vice versa.

4. Conclusions and Discussions

In this study, the influences of volcanic eruptions with three categories of magnitudes on persistent droughts over Eastern China were investigated and the corresponding physical mechanisms were then explored. Major conclusions are summarized as follows: Firstly, after the volcanic eruptions with a magnitude of 25 Tg, the responses of regional precipitation to the volcanism were insignificant. A drought triggered by internal climate variability can be prolonged and intensified if the magnitude of volcanic eruptions reaches 50 Tg and above. The drought was strong and persisted for nearly five years after the 50 Tg volcanic eruption. After 100 Tg volcanic eruptions, the drought became much more severe and persisted eight more years. Both the persistence and intensities of extended droughts increased along with the magnitudes of volcanic eruptions.
The extended droughts over Eastern China after the volcanic eruptions can be explained by the weakening of the EASM. The intensity of extended droughts was influenced by the differences of temperature anomalies as well as SLP anomalies over the land and the ocean due to the differences between the land–sea thermal capacity. After volcanic eruptions with larger magnitudes, the intensified land–sea thermal contrast directly led to faster and larger cooling over the land than the ocean, which subsequently caused higher SLP and weaker EASM, and thus led to more severe drought events in Eastern China. Moreover, the duration of extended droughts after volcanic eruptions was significantly affected by the recovery rates of WPSH. The slower recovery rates of WPSH following larger volcanic eruptions contributed to longer persistence of the extended droughts, and vice versa.
In this study, due to computational costs, only three groups of volcanic sensitivity experiments with magnitudes of 25 Tg, 50 Tg, and 100 Tg were performed. As a consequence, the results did not cover the full range of the influences from volcanic eruptions with all different magnitudes. In the future, more groups of volcanic sensitivity experiments with different magnitudes and also more drought cases in each group will be helpful to improve the findings of current study.
Another potential limitation of this study was the discrepancy of regional precipitation responses to the volcanic eruptions between the proxy reconstructions and model simulations, which was discussed in many previous studies [12]. The potential reasons for this discrepancy include complexities of regional hydroclimate systems [39], inabilities of GCMs and corresponding implemented volcanic forcing to fully represent the real impacts of volcanic eruptions [12,24]. Moreover, the influence of volcanic eruptions with different magnitudes occurring in the middle and early phases of a drought can be an interesting topic worthy of further studies in the future.
This paper, although it has some limitations, clearly demonstrates that volcanic eruptions that occur in the late phase of a drought can prolong and intensify the drought when their magnitudes are larger than 50 Tg. The severity of drought increases linearly with the magnitudes of volcanic eruptions. These findings, to some extent, can improve the understanding of the interactions between internal climate variability and volcanic eruptions, and also provide scientific basis for further studies.

Supplementary Materials

The following are available online at https://0-www-mdpi-com.brum.beds.ac.uk/2073-4433/11/2/210/s1, Figure S1: (a)–(b) The ensemble mean anomalies of annual (May to September) precipitation (unit: mm/day) at the first two years of the volcanic eruption in the volcanic sensitivity experiments with the magnitudes of 25Tg. (c)–(d) and (e)–(f) are similar to (a)–(b) but in volcanic sensitivity experiments with the magnitudes of 50Tg and 100Tg, respectively. Figure S2: (a)–(h) The ensemble mean anomalies of the summer (May to September) Sea Level Pressure (SLP, unit: hPa) and 850-hPa wind field (unit: m/s) 7 years after the volcanic eruption in the 25Tg volcanic sensitivity experiments. Figure S3: (a)–(h) The ensemble mean anomalies of the summer (May to September) Sea Level Pressure (SLP, unit: hPa) and 850-hPa wind field (unit: m/s) 7 years after the volcanic eruption in the 50Tg volcanic sensitivity experiments. Figure S4: (a)–(h) The ensemble mean anomalies of the summer (May to September) Sea Level Pressure (SLP, unit: hPa) and 850-hPa wind field (unit: m/s) 7 years after the volcanic eruption in the 100Tg volcanic sensitivity experiments. Figure S5: (a)–(h) The ensemble mean global summer (May to September) Sea Surface Temperature Anomaly (SSTA) (unit: °C) 7 years after the 25Tg volcanic sensitivity experiments. The dots denote areas with confidence levels exceeding 95%. The yellow arrows are the anomalies of summer (May to September) 850-hPa wind (unit: m/s). The red lines are the 500-hPa Geopotential Height contour line (unit: gpm). The blue line is the climatology of the 500-hPa Geopotential Height. Year 0 is the eruption year. Figure S6: (a)–(h) The ensemble mean global summer (May to September) Sea Surface Temperature Anomaly (SSTA) (unit: °C) 7 years after the 50Tg volcanic sensitivity experiments. The dots denote areas with confidence levels exceeding 95%. The yellow arrows are the anomalies of summer (May to September) 850-hPa wind (unit: m/s). The red lines are the 500-hPa Geopotential Height contour line (unit: gpm). The blue line is the climatology of the 500-hPa Geopotential Height. Figure S7: (a)–(h) The ensemble mean global summer (May to September) Sea Surface Temperature Anomaly (SSTA) (unit: °C) 7 years after the 100Tg volcanic sensitivity experiments. The dots denote areas with confidence levels exceeding 95%. The yellow arrows are the anomalies of summer (May to September) 850-hPa wind (unit: m/s). The red lines are the 500-hPa Geopotential Height contour line (unit: gpm). The blue line is the climatology of the 500-hPa Geopotential Height. Figure S8: The correlation coefficients between the summer (MJJAS) precipitation over the Eastern China and SST in the control experiment. The stippling indicate the correlation coefficients are significant at 95% level. The region in black rectangle is 123° E–150° E, 15° N–30° N.

Author Contributions

All authors have read and agreed to the published version of the manuscript. Conceptualization, K.C. and L.N.; methodology, K.C., L.N. and W.S.; software, L.N. and J.L.; validation, K.C., L.N., Z.L., J.L., W.S., M.Y., B.L., Y.Q. and J.X.; formal analysis, K.C., L.N. and W.S.; investigation, K.C. and L.N.; resources, L.N., J.L.; data curation, L.N., J.L. and M.Y.; writing-original draft preparation, K.C., L.N. and W.S.; writing-review and editing, all; visualization, K.C. and L.N.; supervision, L.N., Z.L. and J.L.; project administration, L.N. and J.L.; funding acquisition, L.N. and J.L.

Funding

This research was funded by “National Basic Research Program of China”, grant number 2016YFA0600401; “the National Natural Science Foundation of China”, grant numbers 41971021, 41420104002, 41671197, and 41631175; “Open Funds of State Key Laboratory of Loess and Quaternary Geology, Institute of Earth Environment, Chinese Academy of Sciences”, grant number SKLLQG1820.

Acknowledgments

This study was jointly supported by the National Basic Research Program of China (Grant No. 2016YFA0600401), the National Natural Science Foundation of China (Grant Nos. 41971021, 41420104002, 41671197, and 41631175), Open Funds of State Key Laboratory of Loess and Quaternary Geology, Institute of Earth Environment, Chinese Academy of Sciences (SKLLQG1820). The reconstructed volcanic aerosol was kindly provided by Chaochao Gao. The reconstructed Palmer Drought Severity Index was kindly provided by Edward R. Cook.

Conflicts of Interest

The authors declare no conflicts of interest.

References

  1. Robock, A. Volcanic eruptions and climate. Rev. Geophys. 2000, 38, 191–219. [Google Scholar] [CrossRef]
  2. Shen, C.; Wang, W.C.; Hao, Z.; Gong, W. Exceptional drought events over eastern China during the last five centuries. Clim. Chang. 2007, 85, 453–471. [Google Scholar] [CrossRef]
  3. Sear, C.B.; Kelly, P.M.; Jones, P.D.; Goodess, C.M. Global surface-temperature responses to major volcanic eruptions. Nature 1987, 330, 365–367. [Google Scholar] [CrossRef]
  4. Mann, M.E.; Bradley, R.S.; Hughes, M.K. Global-scale temperature patterns and climate forcing over the past six centuries. Nature 1998, 392, 779–787. [Google Scholar] [CrossRef]
  5. Sigl, M.; Winstrup, M.; McConnell, J.R.; Welten, K.C.; Plunkett, G.; Ludlow, F.; Büntgen, U.; Caffee, M.; Chellman, N.; Dahl-Jensen, D.; et al. Timing and climate forcing of volcanic eruptions for the past 2,500 years. Nature 2015, 523, 543–549. [Google Scholar] [CrossRef] [PubMed] [Green Version]
  6. Slawinska, J.; Robock, A. Impact of Volcanic Eruptions on Decadal to Centennial Fluctuations of Arctic Sea Ice Extent during the Last Millennium and on Initiation of the Little Ice Age. J. Clim. 2018, 31, 2145–2167. [Google Scholar] [CrossRef]
  7. Miller, G.H.; Geirsdóttir, Á.; Zhong, Y.; Larsen, D.J.; Otto-Bliesner, B.L.; Holland, M.M.; Bailey, D.A.; Kurt, A.; Refsnider, K.A.; Lehman, S.J.; et al. Abrupt onset of the Little Ice Age triggered by volcanism and sustained by sea-ice/ocean feedbacks. Geophys. Res. Lett. 2012, 39, 2. [Google Scholar] [CrossRef] [Green Version]
  8. Joseph, R.; Zeng, N. Seasonally Modulated Tropical Drought Induced by Volcanic Aerosol. J. Clim. 2011, 24, 2045–2060. [Google Scholar] [CrossRef]
  9. Schneider, D.P.; Ammann, C.M.; Otto-Bliesner, B.L.; Kaufman, D.S. Climate response to large, high-latitude and low-latitude volcanic eruptions in the Community Climate System Model. J. Geophys. Res. 2009, 114, D15. [Google Scholar] [CrossRef]
  10. Iles, C.E.; Hegerl, G.C. The global precipitation response to volcanic eruptions in the CMIP5 models. Environ. Res. Lett. 2014, 9, 104012. [Google Scholar] [CrossRef]
  11. Liu, F.; Chai, J.; Wang, B.; Liu, J.; Zhang, X.; Wang, Z. Global monsoon precipitation responses to large volcanic eruptions. Sci. Rep. 2016, 6, 1–11. [Google Scholar] [CrossRef] [PubMed] [Green Version]
  12. Anchukaitis, K.J.; Buckley, B.M.; Cook, E.R.; Cook, B.I.; D’Arrigo, R.D.; Ammann, C.M. Influence of volcanic eruptions on the climate of the Asian monsoon region. Geophys. Res. Lett. 2010, 37, L22703. [Google Scholar] [CrossRef]
  13. Iles, C.E.; Hegerl, G.C.; Schurer, A.P.; Zhang, X. The effect of volcanic eruptions on global precipitation. Journal of Geophysical Research. Atmospheres 2013, 118, 8770–8786. [Google Scholar]
  14. Fischer, E.M.; Luterbacher, J.; Zorita, E.; Tett, S.F.B.; Casty, C.; Wanner, H. European climate response to tropical volcanic eruptions over the last half millennium. Geophys. Res. Lett. 2007, 34. [Google Scholar] [CrossRef] [Green Version]
  15. Peng, Y.; Shen, C.; Cheng, H.; Xu, Y. Modeling of severe persistent droughts over eastern China during the last millennium. Clim. Past 2013, 9, 6345–6373. [Google Scholar] [CrossRef]
  16. Zheng, J.; Hao, Z.; Fang, X.; Ge, Q. Several characteristics of extreme climate events during past 2000 years in China. Prog. Deography 2014, 33, 3–12. [Google Scholar]
  17. Ault, T.R.; Cole, J.E.; Overpeck, J.T.; Pederson, G.T.; Meko, D.M. Assessing the Risk of Persistent Drought Using Climate Model Simulations and Paleoclimate Data. J. Clim. 2014, 27, 7529–7549. [Google Scholar] [CrossRef] [Green Version]
  18. Stevenson, S.; Timmermann, A.; Chikamoto, Y.; Langford, S.; DiNezio, P. Stochastically Generated North American Megadroughts. J. Clim. 2015, 28, 1865–1880. [Google Scholar] [CrossRef]
  19. Ning, L.; Liu, J.; Wang, B.; Chen, K.; Yan, M.; Jin, C.; Wang, Q. Variability and Mechanisms of Megadroughts over eastern China During the Last Millennium: A Model Study. Atmosphere 2018, 9, 7. [Google Scholar] [CrossRef] [Green Version]
  20. Cook, E.R.; Anchukaitis, K.J.; Buckley, B.M.; D’Arrigo, R.D.; Jacoby, G.C.; Wright, W.E. Asian monsoon failure and megadrought during the last millennium. Science 2010, 328, 486–489. [Google Scholar] [CrossRef] [Green Version]
  21. Zheng, J.; Xiao, L.; Fang, X.; Hao, Z.; Ge, Q.; Li, B. How climate change impacted the collapse of the Ming dynasty. Clim. Chang. 2014, 127, 169–182. [Google Scholar] [CrossRef]
  22. Chen, K.F.; Ning, L.; Liu, Z.Y.; Liu, J.; Yan, M.; Sun, W.Y.; Yuan, L.W.; Lv, G.N.; Li, L.H.; Jin, C.H.; et al. One Drought and One Volcanic Eruption Influenced the History of China: Ming Dynasty Megadrought. manuscript in preparation.
  23. Fan, F.; Mann, M.E.; Ammann, C.M. Understanding Changes in the Asian Summer Monsoon over the Past Millennium Insights from a Long-Term Coupled Model Simulation. J. Clim. 2009, 22, 1736–1748. [Google Scholar] [CrossRef] [Green Version]
  24. Man, W.; Zhou, T.; Jungclaus, J.H. Effects of Large Volcanic Eruptions on Global Summer Climate and East Asian Monsoon Changes during the Last Millennium: Analysis of MPI-ESM Simulations. J. Clim. 2014, 27, 7394–7409. [Google Scholar] [CrossRef]
  25. Ning, L.; Liu, J.; Sun, W. Influences of volcano eruptions on Asian Summer Monsoon over the last 110 years. Sc.i Rep. 2017, 7, 42626. [Google Scholar] [CrossRef] [PubMed] [Green Version]
  26. Huang, R.; Chen, J.; Lin, W.; Lin, Z. Characteristics, processes, and causes of the spatio-temporal variabilities of the East Asian monsoon system. Adances Atmos. Sci. 2013, 30, 541. [Google Scholar] [CrossRef] [Green Version]
  27. Adams, J.B.; Mann, M.E.; Ammann, C.M. Proxy evidence for an El Nin˜ o-like response to volcanic forcing. Nature 2003, 426, 271–274. [Google Scholar]
  28. Stevenson, S.; Otto-Bliesner, B.; Fasullo, J.; Brady, E. El Niño Like” Hydroclimate Responses to Last Millennium Volcanic Eruptions. J. Clim. 2016, 29, 2907–2921. [Google Scholar] [CrossRef]
  29. Sun, W.; Liu, J.; Wang, B.; Chen, D.; Liu, F.; Wang, Z.; Ning, L.; Chen, M. A “La Niña-like” state occurring in the second year after large tropical volcanic eruptions during the past 1500 years. Clim. Dyn. 2018, 52, 7495–7509. [Google Scholar] [CrossRef] [Green Version]
  30. Wang, T.; Otterå, O.H.; Gao, Y.; Wang, H. The response of the North Pacific Decadal Variability to strong tropical volcanic eruptions. Clim. Dyn. 2012, 39, 2917–2936. [Google Scholar] [CrossRef]
  31. Knudsen, M.F.; Jacobsen, B.H.; Seidenkrantz, M.S.; Olsen, J. Evidence for external forcing of the Atlantic Multidecadal Oscillation since termination of the Little Ice Age. Nat. Commun. 2014, 5, 1–8. [Google Scholar] [CrossRef] [Green Version]
  32. Stevenson, S.; Overpeck, F.J.T.; Fasullo, B.J.; Coats, S.; Parsons, L.; Otto-Bliesner, B.; Ault, T.; Loope, G.; Cole, J. Climate Variability, Volcanic Forcing, and Last Millennium Hydroclimate Extremes. J. Clim. 2018, 31, 4309–4327. [Google Scholar] [CrossRef]
  33. Ning, L.; Chen, K.F.; Liu, J.; Liu, Z.Y.; Yan, M.; Sun, W.Y.; Jin, C.H.; Shi, Z.G. How do the volcanic eruptions influence the decadal megadrought over eastern China? J. Clim. 2020. under review. [Google Scholar]
  34. Chen, K.F.; Ning, L.; Liu, Z.Y.; Liu, J.; Yan, M.; Sun, W.Y.; Jin, C.H.; Shi, Z.G. How do tropical volcanic eruptions in different drought phases influence droughts in eastern China? manuscript in preparation.
  35. Wang, Z.; Liu, J. Modeling study on the characteristics and mechanisms of global typical warm periods over the 2000 years. Quantanary Sci. 2014, 34, 1136–1145. [Google Scholar]
  36. Gao, C.; Robock, A.; Ammann, C. Volcanic forcing of climate over the past 1500 years: An improved ice core-based index for climate models. J. Geophys. Res. 2008, 113, D23. [Google Scholar] [CrossRef] [Green Version]
  37. Meehl, G.A.; Hu, A. Megadroughts in the Indian Monsoon Region and Southwest North America and a Mechanism for Associated Multidecadal Pacific Sea Surface Temperature Anomalies. J. Clim. 2006, 19, 1605–1623. [Google Scholar] [CrossRef]
  38. Zheng, J.; Wang, C.W.; Ge, Q.; Man, Z.; Zhang, P. Precipitation Variability and Extreme Events in East Asia. Terr. Atmos. Ocean. 2006, 17, 579–592. [Google Scholar] [CrossRef] [Green Version]
  39. Rao, M.P.; Cook, B.I.; Cook, E.R.; D’Arrigo, R.D.; Krusic, P.J.; Anchukaitis, K.J.; LeGrande, A.N.; Buckley, B.M.; Davi, N.K.; Leland, C.; et al. European and Mediterranean hydroclimate responses to tropical volcanic forcing over the last millennium. Geophys. Res. Lett. 2017, 44, 5104–5112. [Google Scholar] [CrossRef] [Green Version]
Figure 1. The superposed epoch analysis (SEA) of the annual mean precipitation anomalies (unit: mm/day) from the control experiments (a) and volcanic sensitivity experiments of the 25 Tg (b), 50 Tg (c), and 100 Tg (d) volcanic eruptions. The symbol “+” indicates that the anomalies are significant at 95% level based on the Student t-test. The orange and green dash lines indicate the ±1 and ±2 standard deviations, respectively.
Atmosphere 11 00210 g001aAtmosphere 11 00210 g001b
Figure 2. (a) The scatter plots of the changes of volcano-induced drought intensity and the magnitudes of volcanic eruptions in the three groups of sensitivity experiments (purple dots), and corresponding ensemble means of drought intensity after 25 Tg, 50 Tg, and 100 Tg volcanic eruptions (black dots). The X-axis represents the magnitudes of volcano eruptions (Tg), and the Y-axis represents the average precipitation anomalies (unit: mm/day) after volcanic eruptions (years 0–9). The red line is the linear regression between the volcano-induced drought intensity and magnitudes of volcanic eruptions. (b) is similar to (a), but for the results of the reconstructed PDSI after volcanic eruptions.
Atmosphere 11 00210 g002
Figure 3. The ensemble means of the reconstructed Palmer Drought Severity Index (PDSI) coinciding with volcanic eruptions during the period 1300–2005 with magnitudes less than 25 Tg (a), between 25 and 50 Tg (b), between 50 and 100 Tg (c), and larger than 100 Tg (d). The green and orange dash lines indicate the ±1 and ±2 standard deviations, respectively. The yellow bars indicate the years of drought after volcanic eruptions.
Atmosphere 11 00210 g003
Figure 4. Changes of the Eastern Asian summer monsoon index (EASMI) before and after the years of volcanic eruptions with magnitudes of 25 Tg (red), 50 Tg (blue), and 100 Tg (green), respectively.
Atmosphere 11 00210 g004
Figure 5. (a)–(c) The summer (May–September) surface temperature (unit: °C) in the year of volcanic eruptions with magnitudes of 25 Tg, 50 Tg and 100 Tg, respectively. (d)–(f) The regional mean surface temperature (SAT; green dashed line; unit: °C) over Eastern China (20–50° N, 90–120° E), the surface temperature (SST; green solid line; unit: °C) over China’s eastern coastal area (20–50° N, 120–150° E), the sea level pressure (SLP) anomalies over Eastern China (blue solid line; unit: hPa) and surrounding oceans (blue dashed line; unit: hPa) in the volcanic sensitivity experiment with magnitudes of 25 Tg, 50 Tg and 100 Tg, respectively. The pink shaded area covers the time period when land-SLP is higher than the ocean-SLP after a volcanic eruption. The yellow shaded area covers the time period when decreases of the SAT are larger than decreases of the SST; * indicates that the result is significant based on the Student t-test.
Atmosphere 11 00210 g005aAtmosphere 11 00210 g005b
Figure 6. (a)–(c) The superposed echo analyses of precipitation anomalies (bar, left y-axis, unit: mm/day) in Eastern China, summer SST anomalies over the northwestern Pacific key region (123° E–150° E, 15° N–30° N; black line, right y-axis, unit: °C; Figure S8), variations of WPSH’s west ridge point (pink asterisk), grid number anomaly that is covered by WPSH (yellow line) from the volcanic forcing sensitivity experiments with volcanic eruptions of 25 Tg, 50 Tg and 100 Tg, respectively.
Atmosphere 11 00210 g006

