The Global Distribution of Cirrus Clouds Reflectance Based on MODIS Level-3 Data


1
School of Environmental Science and Optoelectronic Technology, University of Science and Technology of China, Hefei 230026, China
2
Key Laboratory of Atmospheric Optics, Anhui Institute of Optics and Fine Mechanics, Chinese Academy of Sciences, Hefei 230031, China
3
Sate Key Laboratory of Space Weather, Chinese Academy of Sciences, Beijing 100190, China
4
Institute of Electrical & Information Engineering, Anhui University of Science and Technology, Huainan 232001, China
*
Authors to whom correspondence should be addressed.
Atmosphere 2020, 11(2), 219; https://0-doi-org.brum.beds.ac.uk/10.3390/atmos11020219
Submission received: 7 February 2020
/
Revised: 15 February 2020
/
Accepted: 18 February 2020
/
Published: 21 February 2020
(This article belongs to the Section Atmospheric Techniques, Instruments, and Modeling)
Abstract
:Cirrus clouds are crucially important to weather, climate and earth energy balance studies. The distribution of cirrus reflectance with latitude and season is an interesting topic in atmospheric sciences. The monthly mean Level-3 MODIS cirrus reflectance is used to analyze the global distribution of cirrus clouds, which covers a period from 1 March 2000 to 28 February 2018. The latitude, from 90° S to 90° N, is divided into 36 latitude zones with 5° interval. Data in each latitude zone are analyzed. The research results show that the slopes of cirrus reflectance variation in the Northern and Southern Hemisphere are −1.253 × 10⁻⁴/year and –1.297 × 10⁻⁴/year, respectively. The yearly-average cirrus reflectance reveals strong negative correlation with time in the Northern Hemisphere, i.e., the correlation coefficient is −0.761. Then the statistical analysis of cirrus reflectance is performed in different seasons, the results show that cirrus reflectance varies obviously with seasonal change. Additionally, for the [30°, 90°] latitude regions, cirrus reflectance reaches the minimum in summer and the maximum in winter in the Southern and Northern Hemisphere.
1. Introduction
Cirrus clouds are composed of various sizes and shapes of non-spherical ice crystal particles, distributed in a height range of 5–20 km. Cirrus clouds have attracted considerable interest because of their impact on the Earth’s radiation budget and weather changes [1,2,3,4]. On the one hand, cirrus clouds cool the atmosphere by scattering or reflecting solar radiation that reaches the surface and the atmosphere. On the other hand, cirrus clouds absorb long-wave radiation emitted from the surface and the atmosphere, heating the atmosphere [5,6]. However, their overall effect on earth atmospheric radiative energy budget is not yet fully quantified. The uncertainty of the overall effect arises mainly from the numerous interactions and feedbacks between dynamical, microphysical and radiative processes affecting cirrus clouds, which are poorly understood and poorly constrained by available data [7,8,9,10,11].
With the development of sensing technology, cirrus clouds are detectable not only from ground-based and space-shuttle-borne Lidar measurements, but also from satellite and aircraft measurements. Numerous measurements have been performed to survey the distribution of cirrus clouds in recent years. Ice cloud occurrence frequency varies depending not only on regions and seasons, but also on the types of ice clouds as defined by optical depth values [12]. CALIPSO data taken over 2 years is analyzed for the years 2008 and 2013, it shows that the occurrence frequency of these relatively thick cirrus clouds exhibits a strong seasonal dependence in the high latitudes, with the occurrence frequency during Arctic winter being at least twice that of any other season [13,14]. The maximum-occurrence frequency of top-layer cirrus clouds is up to 70% near the tropics over the 100°–180° E longitude band and the maximum of cirrus top-altitude occurrence frequency of approximately 11% is at 16 km in the tropics [15,16]. The global cirrus cloud radiative forcing distributions at the top of the atmosphere are calculated by using the cloud microphysical parameters derived from AVHRR nighttime data, indicates that cirrus clouds warm the atmosphere, and in particular produce a large warming effect in the tropics [17]. During 1998–2013, analyzing tropical cirrus clouds, observed using a ground-based lidar located at Gadanki (13.5° N, 79.2° E), India, finds that the geometrical thickness of cirrus clouds is higher during monsoon season, the top and base heights of cirrus clouds increased by 0.56 km and 0.41 km, respectively [18].
In the past decades, a number of investigations have focused on macrophysical and microphysical properties of cirrus clouds, including the distribution of the cirrus optical thickness and effective radius, the cirrus clouds top and base heights, the cirrus occurrence frequency. For example, seasonal properties of cirrus clouds in the United Arab Emirates and adjoining regions by geostationary satellite data are analyzed [19]. Cloud top heights are retrieved for the period from 1 January 2003 to 7 April 2012 using height-resolved limb spectra measured by the SCanning Imaging Absorption SpectroMeter for Atmospheric CHartographY (SCIAMACHY) on board ENVISAT (ENVIronmental SATellite) [20]. Cirrus reflectance and other parameters in MODerate Resolution Imaging Spectroradiometer (MODIS) level-3 data are used to compute the occurrence frequency and spatial distribution of optical thickness of tropical cirrus clouds for the entire two-year period and for the summer and winter seasons [21]. However, few researchers use more than ten-year database to research seasonal & latitudinal distribution of global cirrus reflectance.
Cirrus reflectance is very important for quantifying the effect of cirrus clouds on the earth’s radiation budget. In this paper, we use MODIS level-3 data to analysis global distribution of cirrus clouds from 2000 to 2018, in order to investigate the variation of cirrus reflectance. Section 2 describes the methodology of processing and analyzing cirrus clouds data. Section 3 shows variation of cirrus reflectance with latitude and time. The discussions and brief conclusions concluding remarks are given in Section 4 and Section 5.
2. Methodology
2.1. Data Source
The MODIS on the Terra and Aqua Earth Observing System (EOS) platforms is designed for studies of atmosphere, land, and ocean [22,23]. MODIS with 36 spectral bands (0.4–14.4 µm) provides the capability for globally retrieving cloud properties using passive solar reflectance and infrared techniques [24]. Cloud types, cloud-top properties, optical and microphysical properties are included in MODIS Level-2 and Level-3 cloud products. The Level-3 products are statistically derived from the four Level-2 data products, i.e., aerosol, water vapor, cloud, and atmospheric profile. The MODIS Level-3 products are aggregated to a 1°equal-angle grid, which means the MODIS Atmosphere L3 output grid is always 360 pixels in longitude and 180 pixels in latitude. The Level-3 grid cell indexed (1,1) in the SDS (Scientific Data Set) is located at the upper left corner of the map and corresponds to a grid box with boundaries of 89° to 90° N latitude and 179° to 180° W longitude.
In the MODIS inversion algorithm, ice cloud is determined by the bi-spectral IR method. Cloud phase is inferred from the brightness temperature difference (BTD) between the 8.5 and 11 µm brightness temperature (BTD [8.5–11]) as well as the 11 µm brightness temperature. For ocean, when BT [11] is less 238 K, or BTD [8.5–11] is larger than 0.5 K, cloud phase is ice; for land, when BT [11] is less 238 K, or BTD [8.5–11] is less 1.1 K, the cloud phase is ice. This paper mainly focuses on the statistical analysis of cirrus reflectance, based on the version 6 (V6) MODIS Level-3 monthly products from 1 March 2000 to 28 February 2018. The cirrus reflectance in MODIS is retrieved by using channels near 0.66 and 1.375 µm [25,26]. The atmosphere-earth system can be viewed as being composed of three layers: the water vapor layer above cirrus, cirrus, virtual surface layer which contains low-level water clouds, aerosols, water vapor and surface. Since the 1.375 µm is the strong absorption band of water vapor, and since a substantial amount of water vapor is within the virtual surface, the upwelling radiation reflected by the surface is essentially absorbed by water vapor below the cirrus clouds, no upwelling reflected radiance from the earth’s surface reaches the satellite. When the cirrus clouds present, the solar radiation scattered by these clouds can be received by the sensor [27].
2.2. The Methods of Data Processing
In the following analysis, we take 1 March 2000 to 28 February 2001 as 2000, 1 March 2001 to 28 February 2002 as 2001, etc., 1 March 2017 to 28 February 2018 as 2017. There are 360 × 180 × 12 × 18 grid points in the MODIS data, the annual-mean (seasonal and inter-annual) values during 2000–2017 are calculated by all available samples within each latitude zone. In order to investigate the seasonal trend of cirrus reflectance, we define four seasons based on mid-latitude region for Northern Hemisphere (or Southern Hemisphere) as: Spring (or Autumn for Southern Hemisphere) from March to May, Summer (or Winter for Southern Hemisphere) from June to August, Autumn (or Spring for Southern Hemisphere) from September to November, and Winter (or Summer for Southern Hemisphere) from December to February in next year.
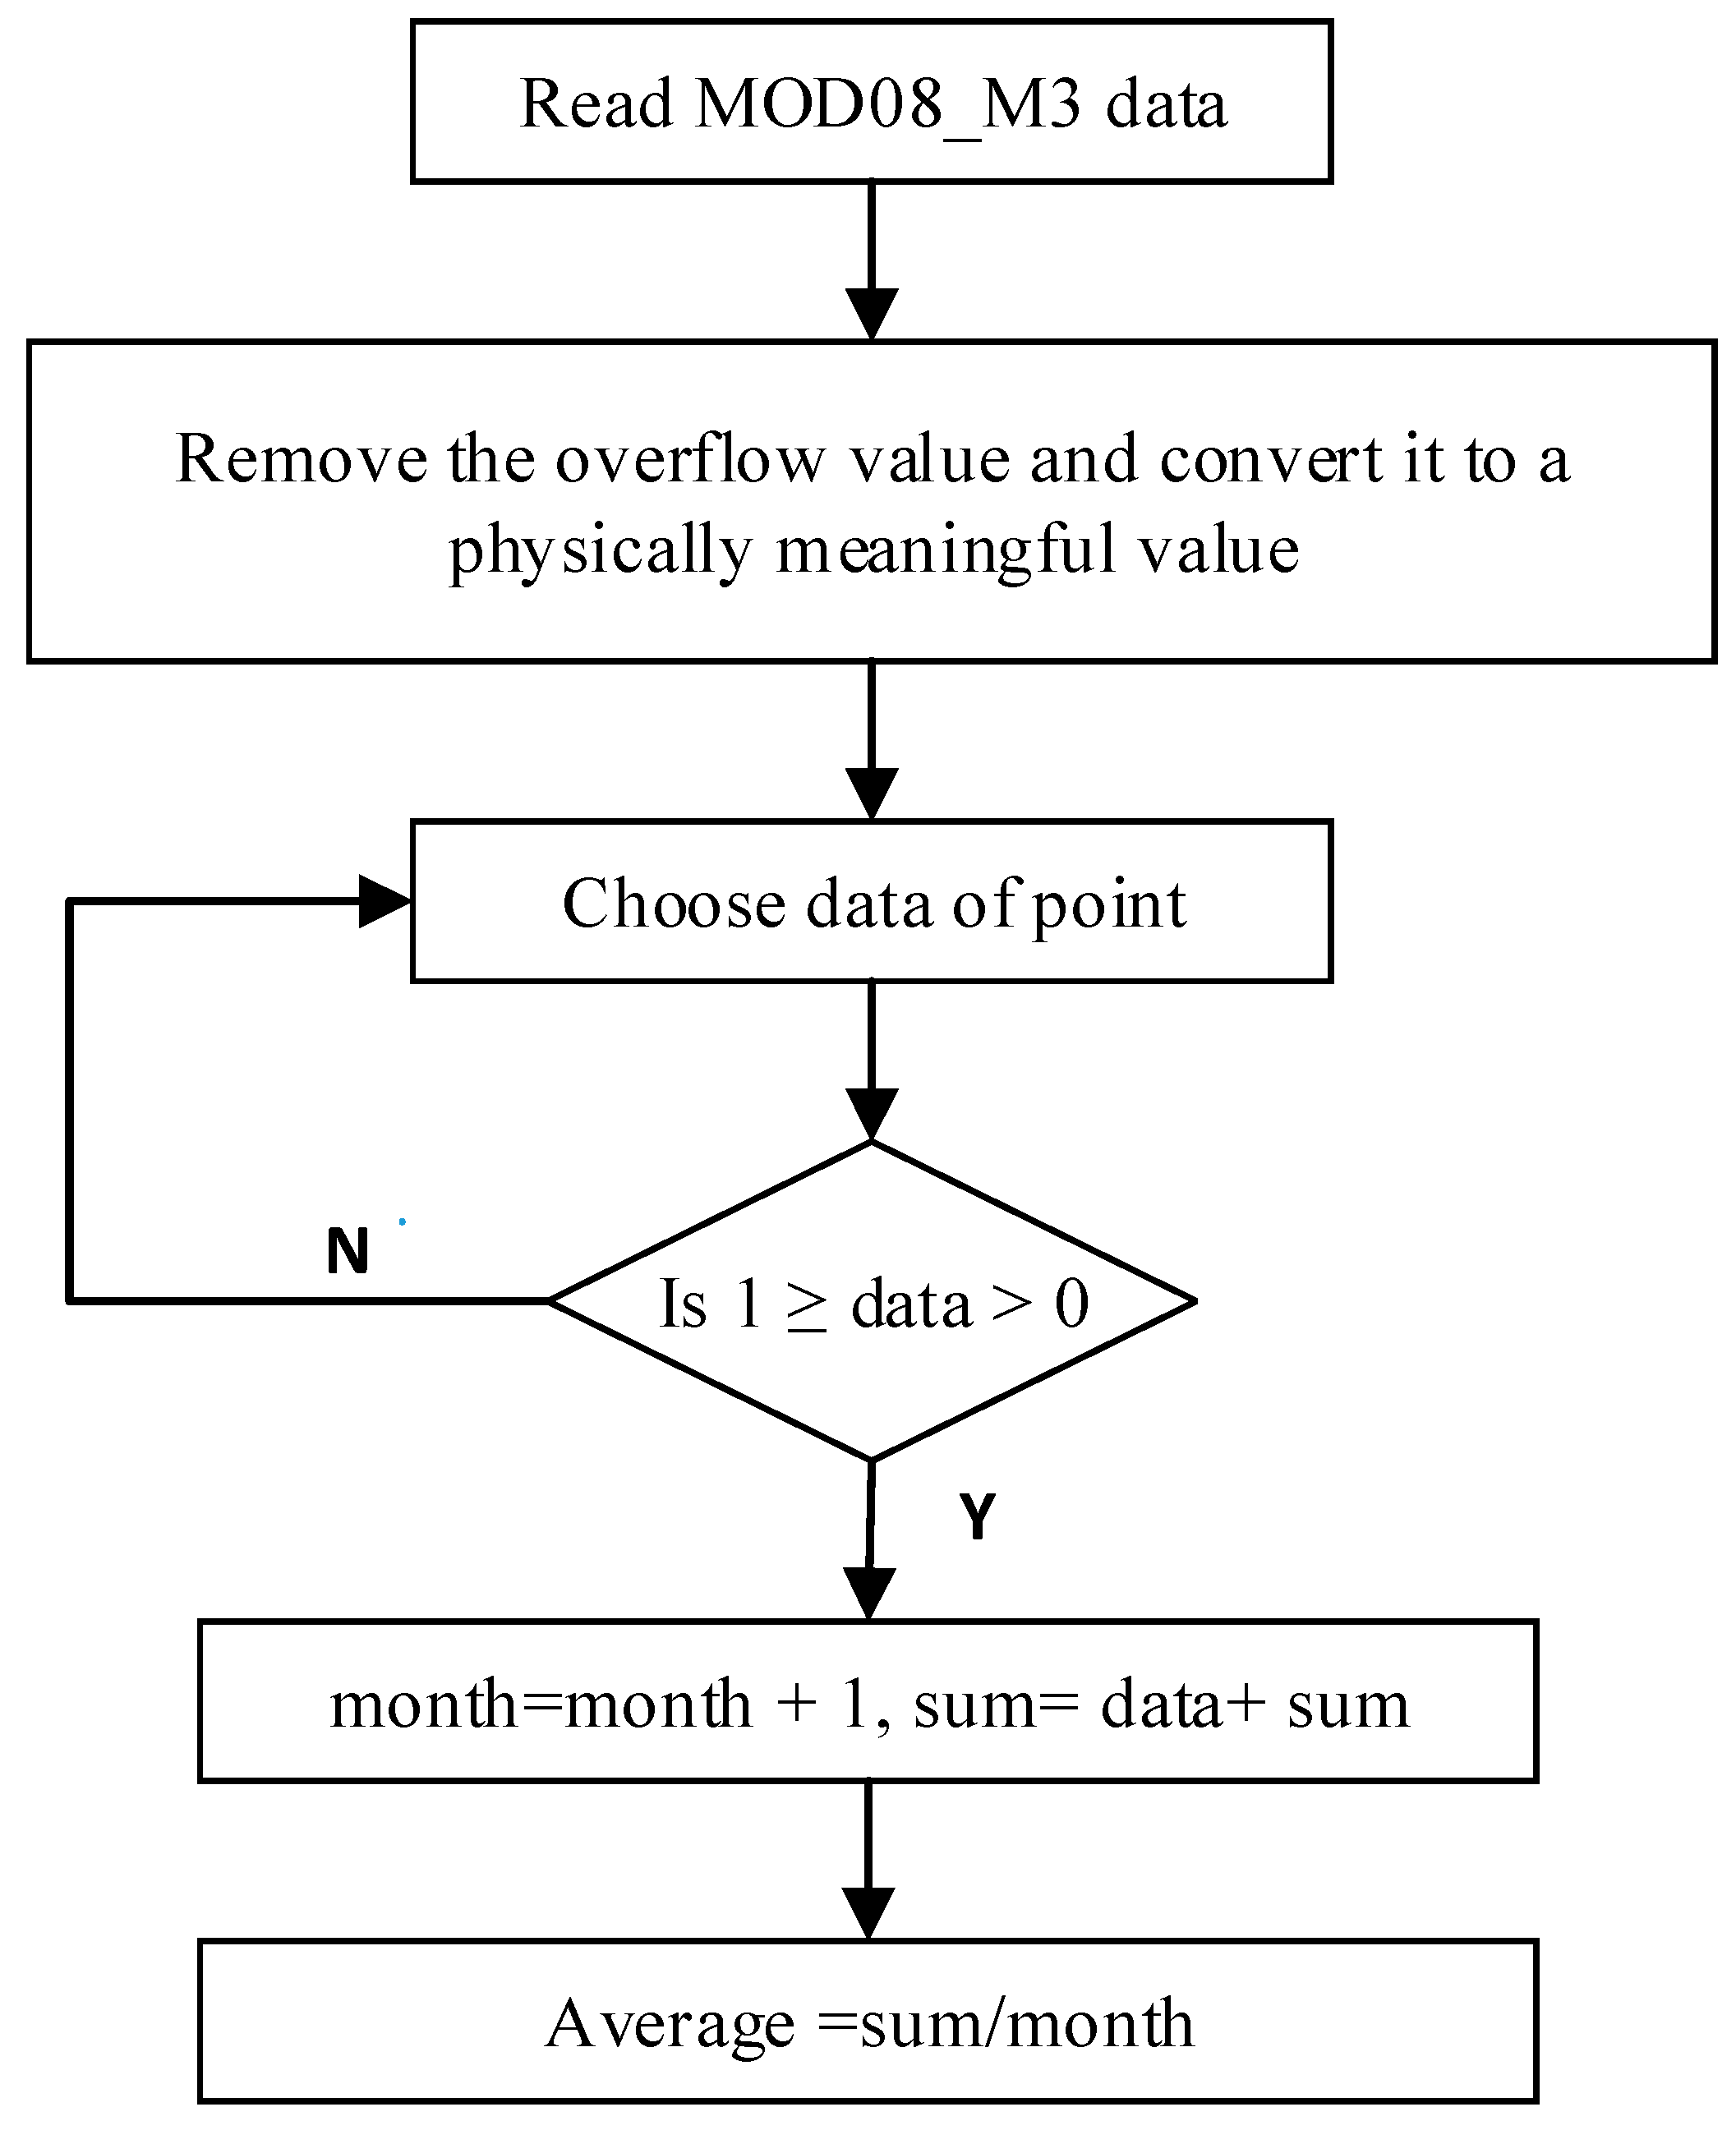
We perform the quality control for the data following the flow chart shown in Figure 1. We read data from the MODIS Level-3 monthly products, as well as the corresponding valid range and scale factor, then remove the meaningless data based on the valid range and convert it to a meaningful cirrus reflectance. If the cirrus reflectance is in the range of 0~1, the value of month equals the month plus one and sum equals sum plus the data. Finally, we can get the average cirrus reflectance. According to Figure 1, cirrus reflectance corresponding to latitude, longitude, and time can be obtained for analyzing the distribution and variation of global cirrus clouds.
After quality control for cirrus clouds, the 12,784,191 effective samples are carried out. To eliminate the possible abnormal samples and increase the statistical significance, it is necessary to remove the possible abnormal values for the physical properties of cirrus clouds. The cloud top temperature is used as a final check, pixels with values less 267.5 K are set to ice. In our analysis, we use cloud top temperature in the MOD08 to get rid of the possible abnormal cirrus clouds samples.
In order to study the global distribution of cirrus clouds, analysis is conducted on the fixed latitude levels. The latitude ranges, from 90° S to 90° N, are divided into 36 latitudinal grids with 5° interval. The latitude ranges of 80° N~90° N and 80° S~90° S are treated as the polar regions. No winter data are present because of polar nights in the polar region. Therefore, only the data of three seasons, i.e., spring, summer and autumn, are counted in the polar region. In statistics, the Pearson correlation coefficient (PCC), also referred to as Pearson’s R, is also used which is a measure of the linear correlation between two variables X and Y. According to the Cauchy-Schwarz inequality, it has a value between +1 and –1, where ±1 is total positive/negative linear correlation, 0 is no linear correlation [28].
3. Global Cirrus Patterns
3.1. Global Distribution of Cirrus Reflectance
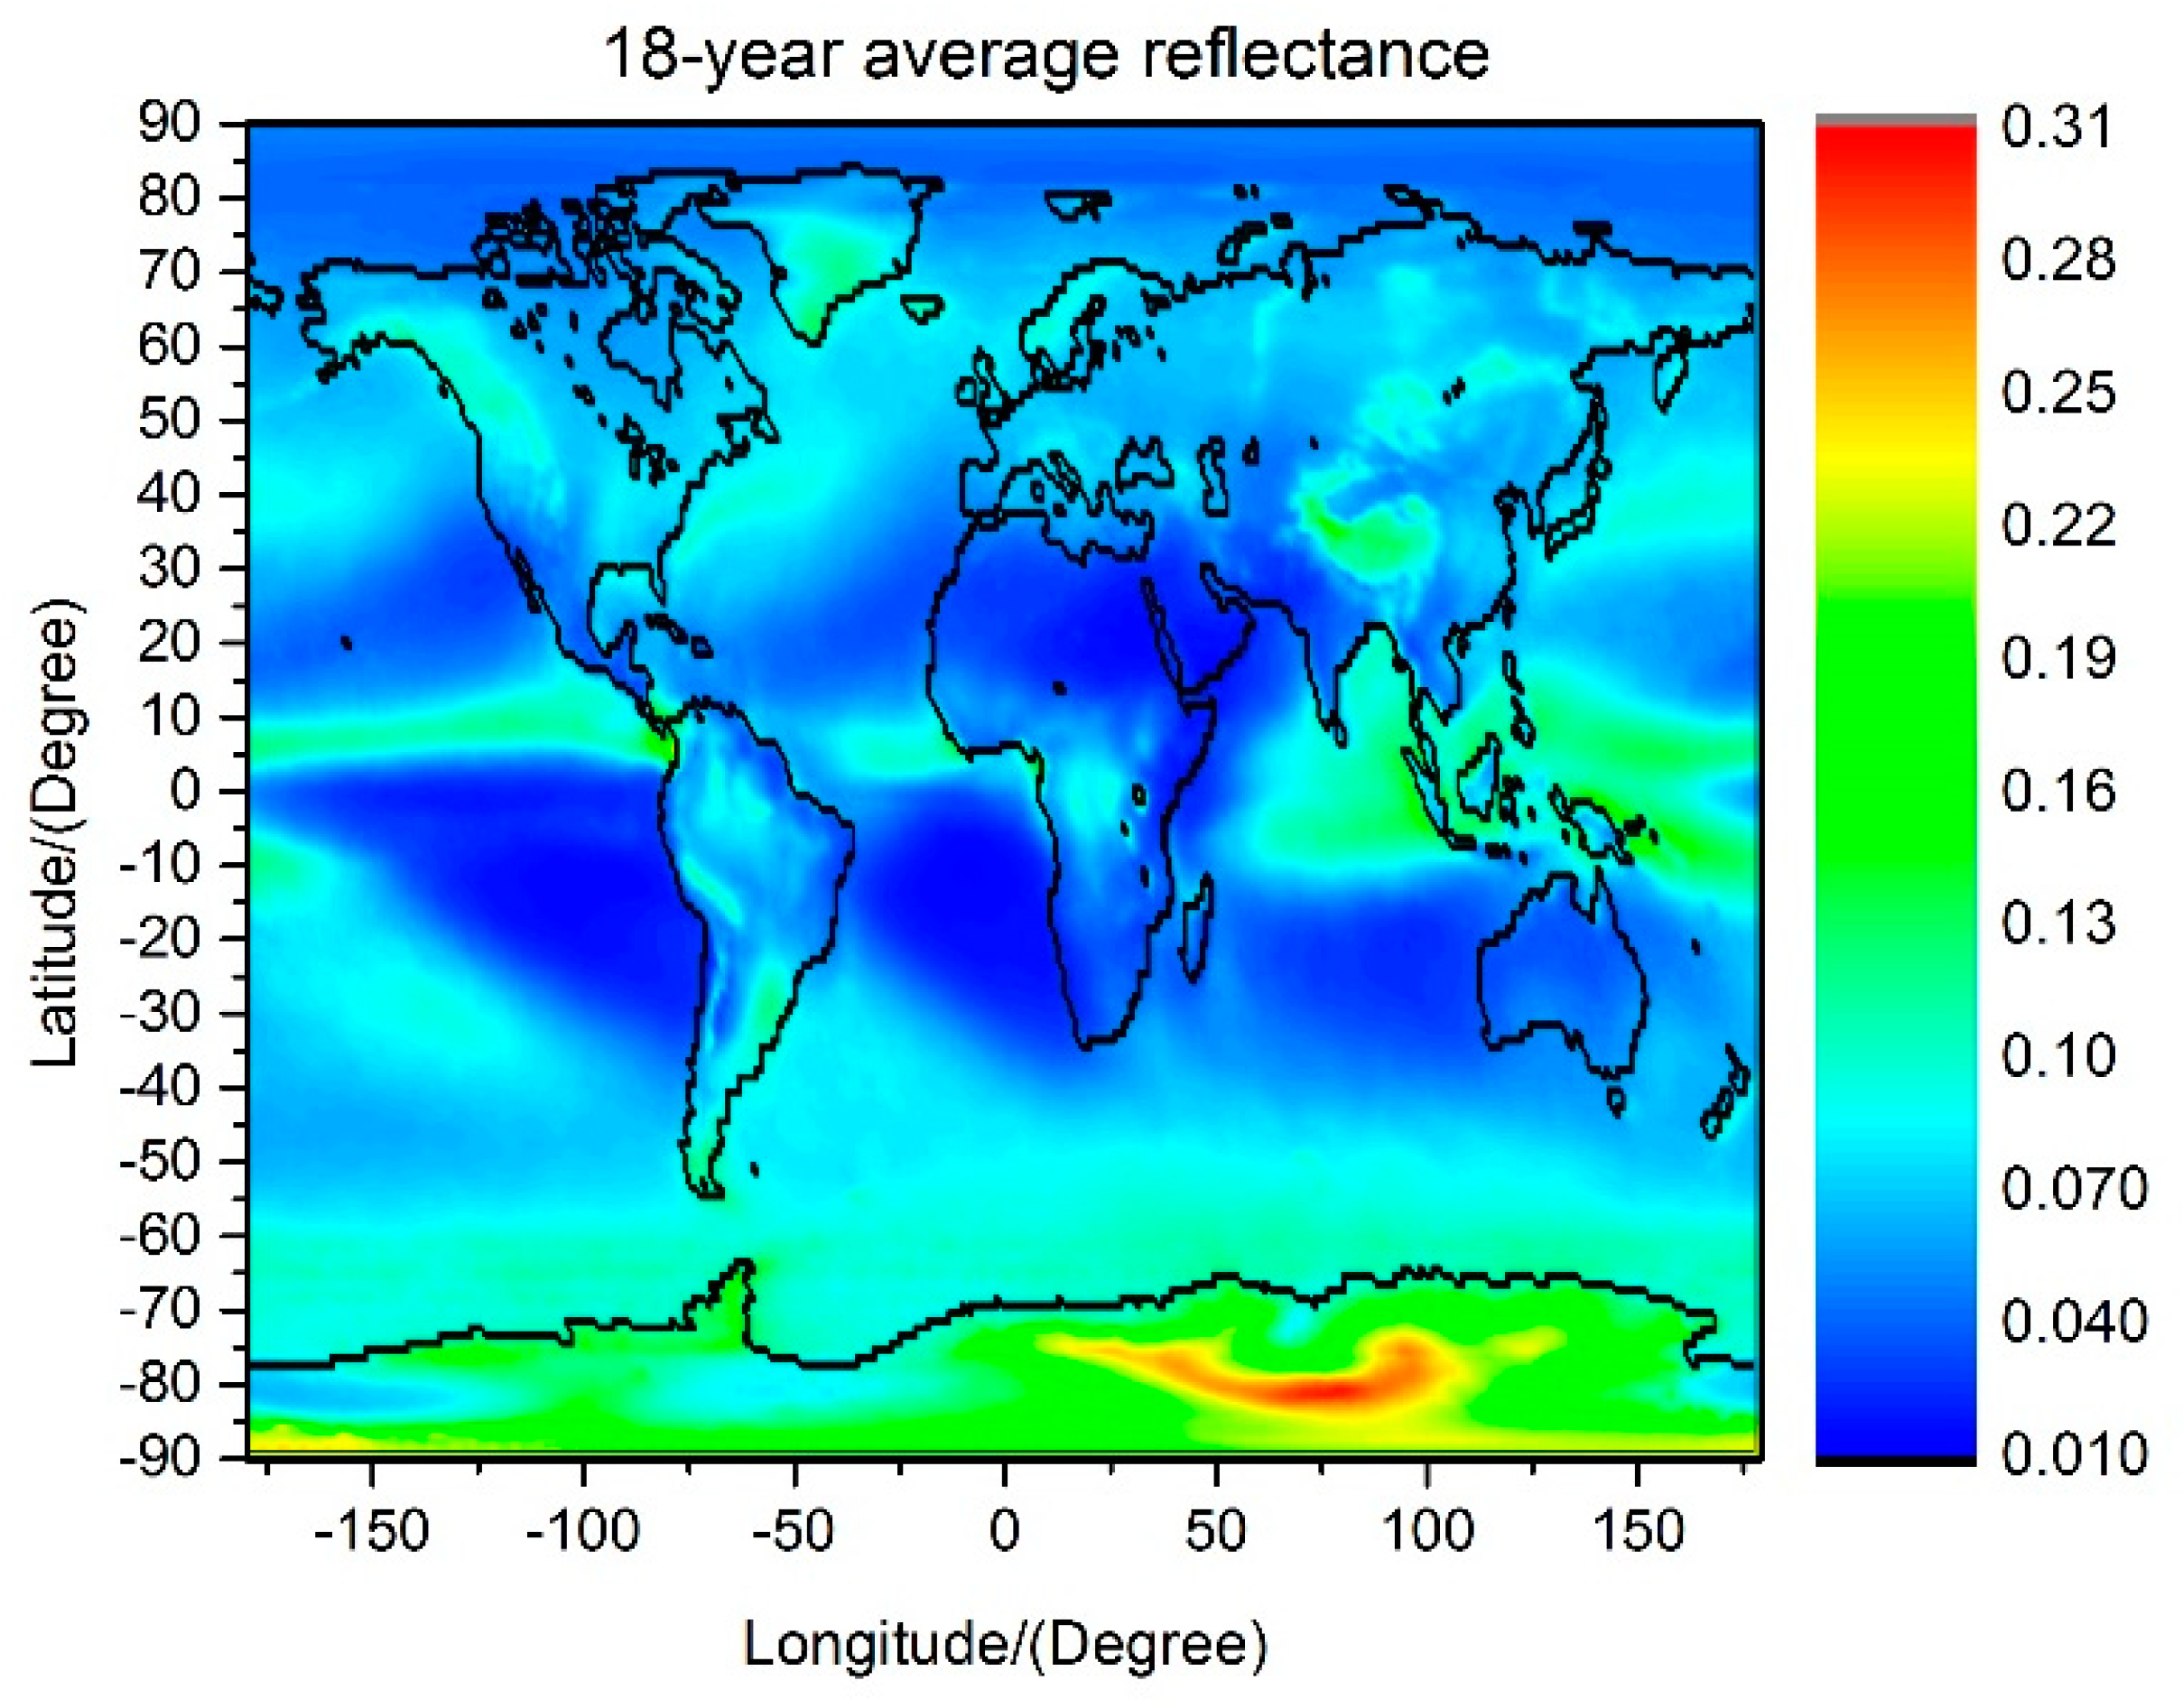
The global distribution of the 18-year average cirrus reflectance is shown in Figure 2. It can be seen that the 18-year average cirrus reflectance in the Northern and Southern Hemisphere is not completely symmetrical. Overall, cirrus reflectance decreases firstly and then increases from the equator to 70°latitude. But for the same latitude zone in each Hemisphere, the variation of cirrus reflectance with longitude is different. For the mid-latitude region, the 18-year average cirrus reflectance varies obviously with longitude in the Northern Hemisphere, but varies gently with longitude in the Southern Hemisphere. Perhaps this phenomenon has related to modulation of land-sea distribution, the continental plate is larger in the Northern Hemisphere than the Southern Hemisphere except the polar circle. In the Northern Hemisphere, the land and sea are staggered at the same latitude, which leads to different types of underlying surfaces. While the Southern Hemisphere is dominated by ocean, there are only one or two types of underlying surfaces. The formation of cirrus is related to the water vapor content in the atmosphere, the water vapor content varies greatly on different underlying surfaces and latitudes, which may lead to the different variations of the cirrus reflectance with longitude between two Hemispheres. For example, the cirrus reflectance over the Tibetan Plateau is larger than other at the [25° N, 40° N] latitude regions in Figure 2, which indicates that the cirrus reflectance may be also affected by the surface condition [29]. For the high latitude region, the cirrus reflectance in the Southern Hemisphere is obviously larger than the Northern Hemisphere, this phenomenon may be caused by the polar stratospheric clouds (see Section 5 for details). There is higher cirrus reflectance near the tropics over 80°–150° E longitude band, which may be associated with deep convective activities in the Intertropical Convergence Zone(ITCZ) [13]. Comparison with the frequency of clouds above 6km in Figure 3 [30], the cirrus reflectance is partially correlated with frequency of high cloud, but they are not linear. Because the cirrus reflectance is partly determined by cirrus optical thickness and effective particle size, and partly determined by the frequency of high cloud.
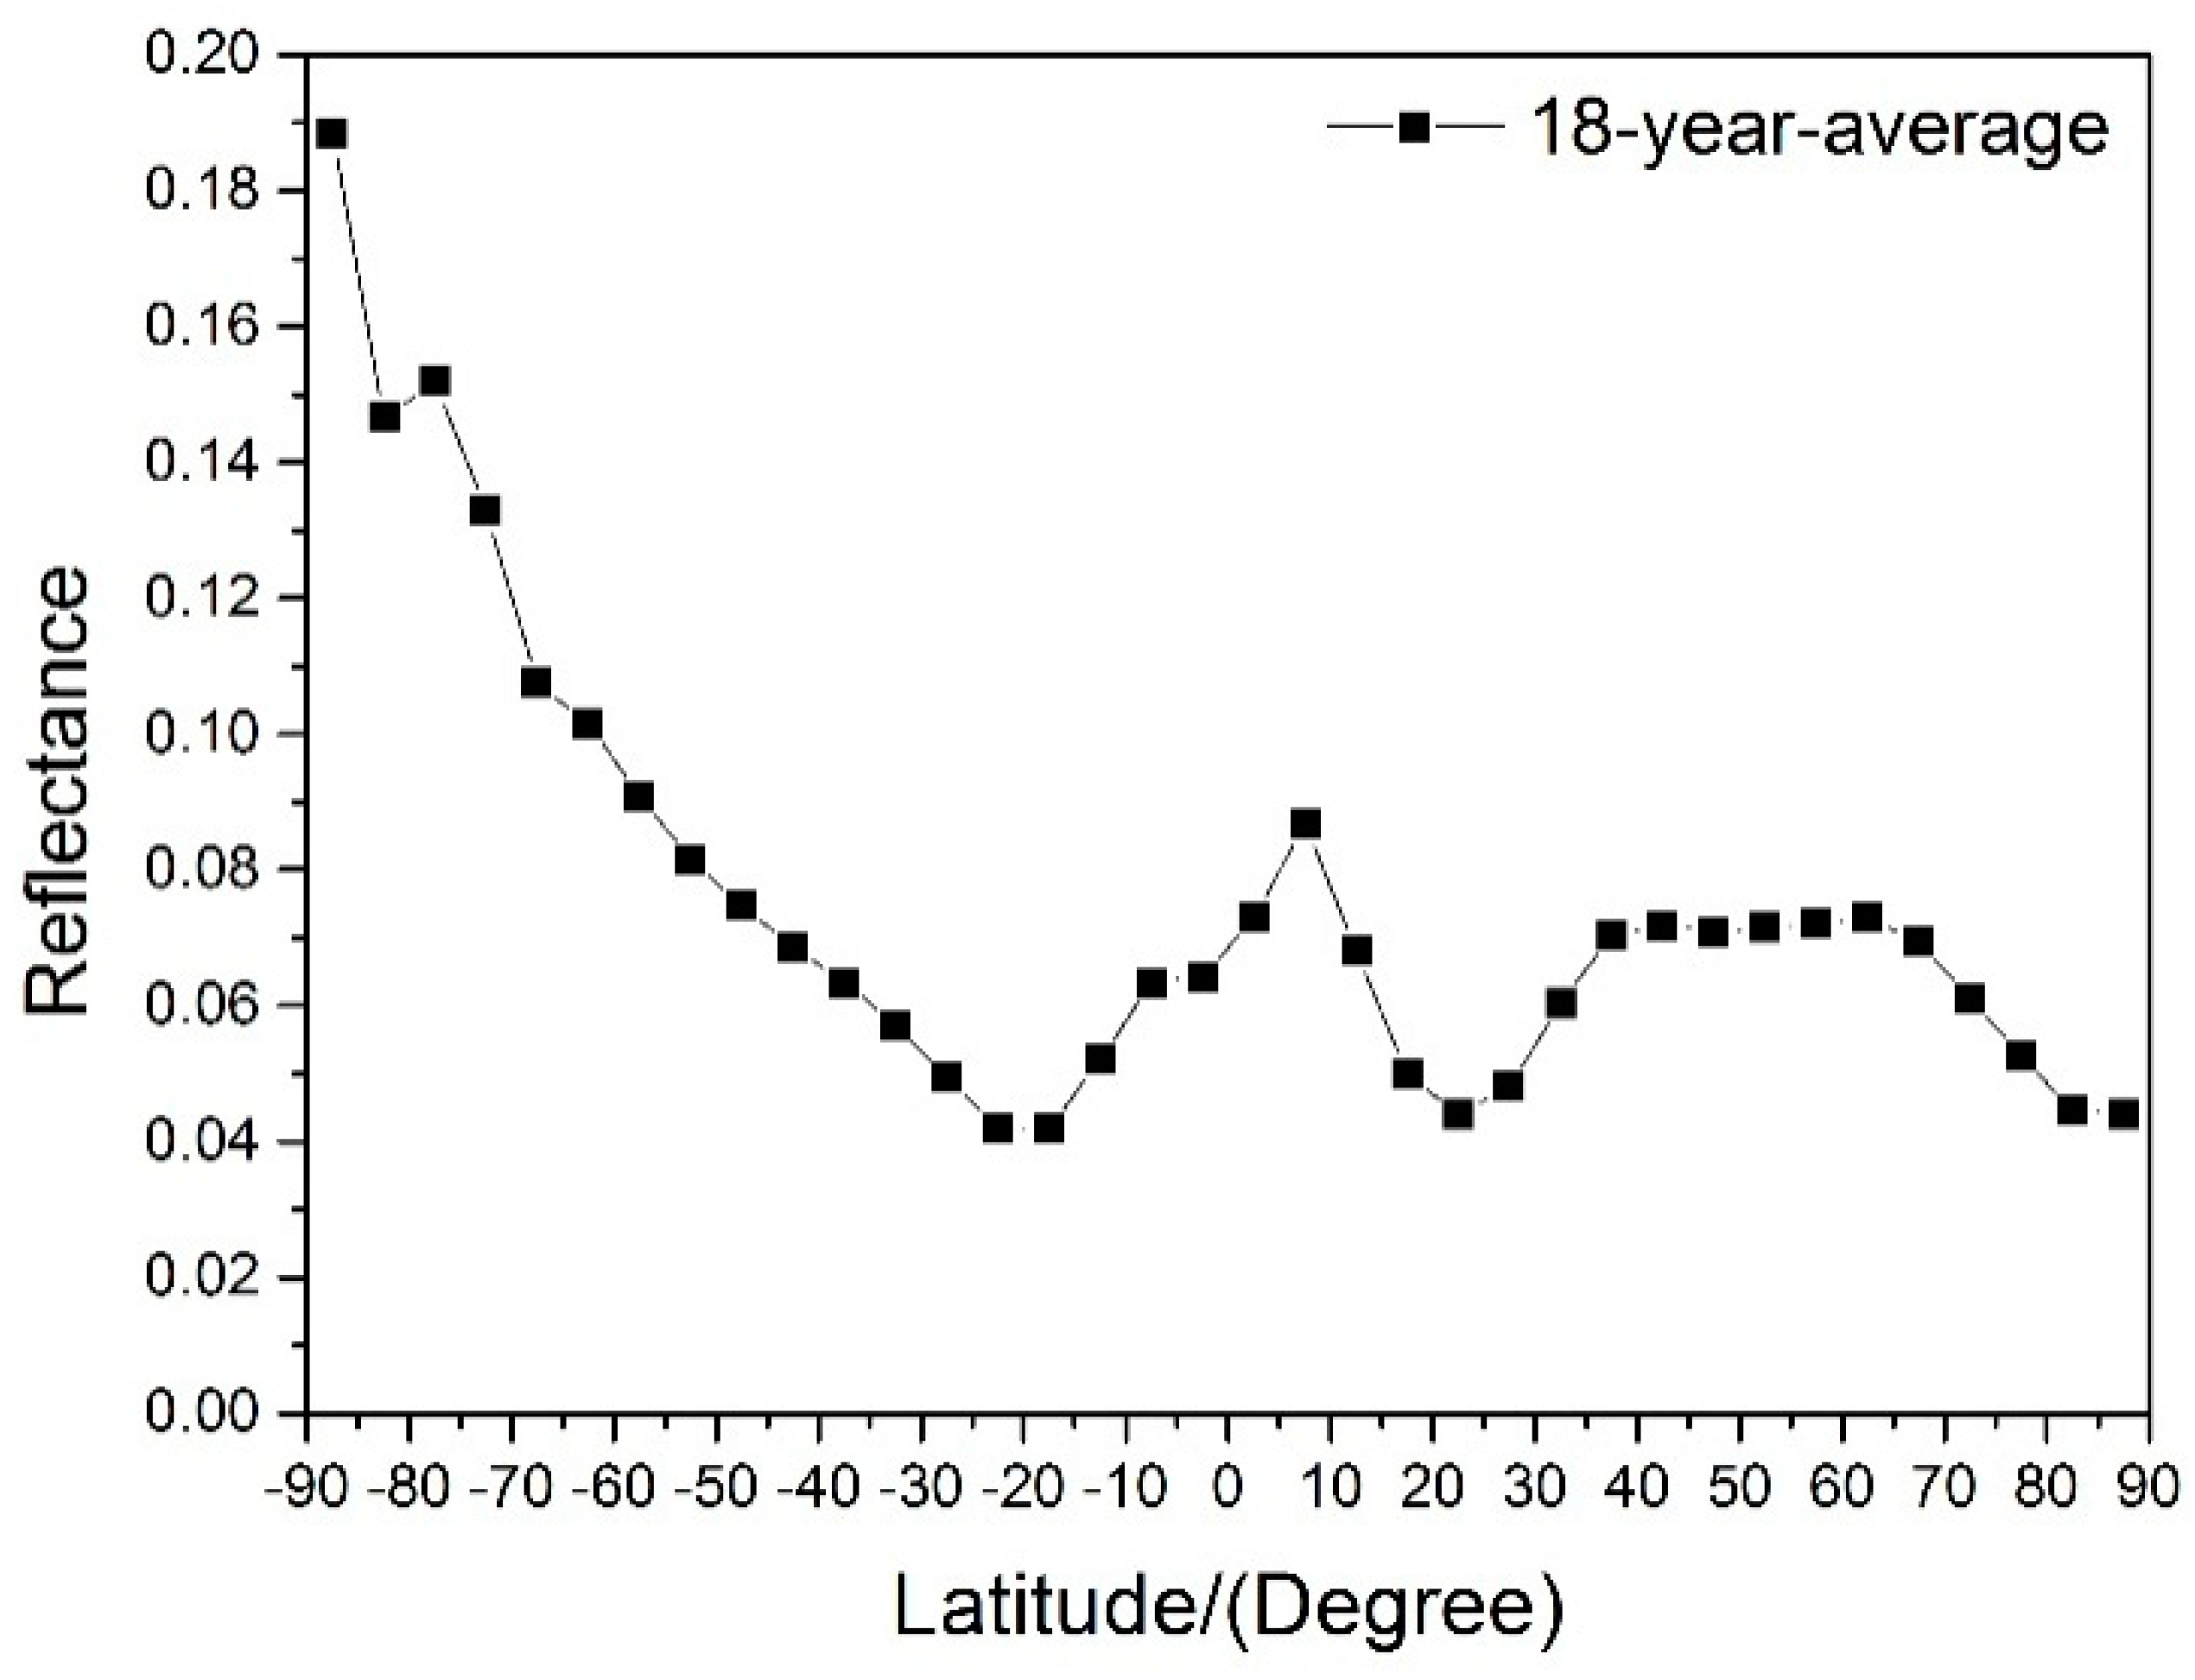
It can be seen from Figure 2 that the 18-year average cirrus reflectance varies more significantly with latitude. Thus, we perform statistical analysis on the variation of them with latitude. The latitude regions from 90 °S to 90 °N are divided into 36 latitude zones with the interval of 5°, negative values represent the Southern Hemisphere and positive values represent the Northern Hemisphere in this paper. Figure 3 shows the average values of cirrus reflectance from 2000 to 2017 at each latitude zone. The 18-year average cirrus reflectance decreases with latitude from the equator and the minimum is presented at around 20 °S region, then increases with latitude in the Southern Hemisphere until to the South Pole. For the Northern Hemisphere, two minimums of cirrus clouds reflectance are presented in the regions around 22.5 °N and the North Pole, respectively. The cirrus reflectance is smoother in the Northern Hemisphere than that in the Southern Hemisphere for the regions where the latitude is larger than 45°. Cirrus reflectance variation patterns in this figure is very different from a similar plot (Figure 6 of Liou paper) presented [31]. Different latitude grids divided lead to different latitudinal and seasonal variation of cirrus reflectance at the mid- and low-latitude regions.
3.2. The Temporal Variation of Cirrus Clouds from 2000 to 2017
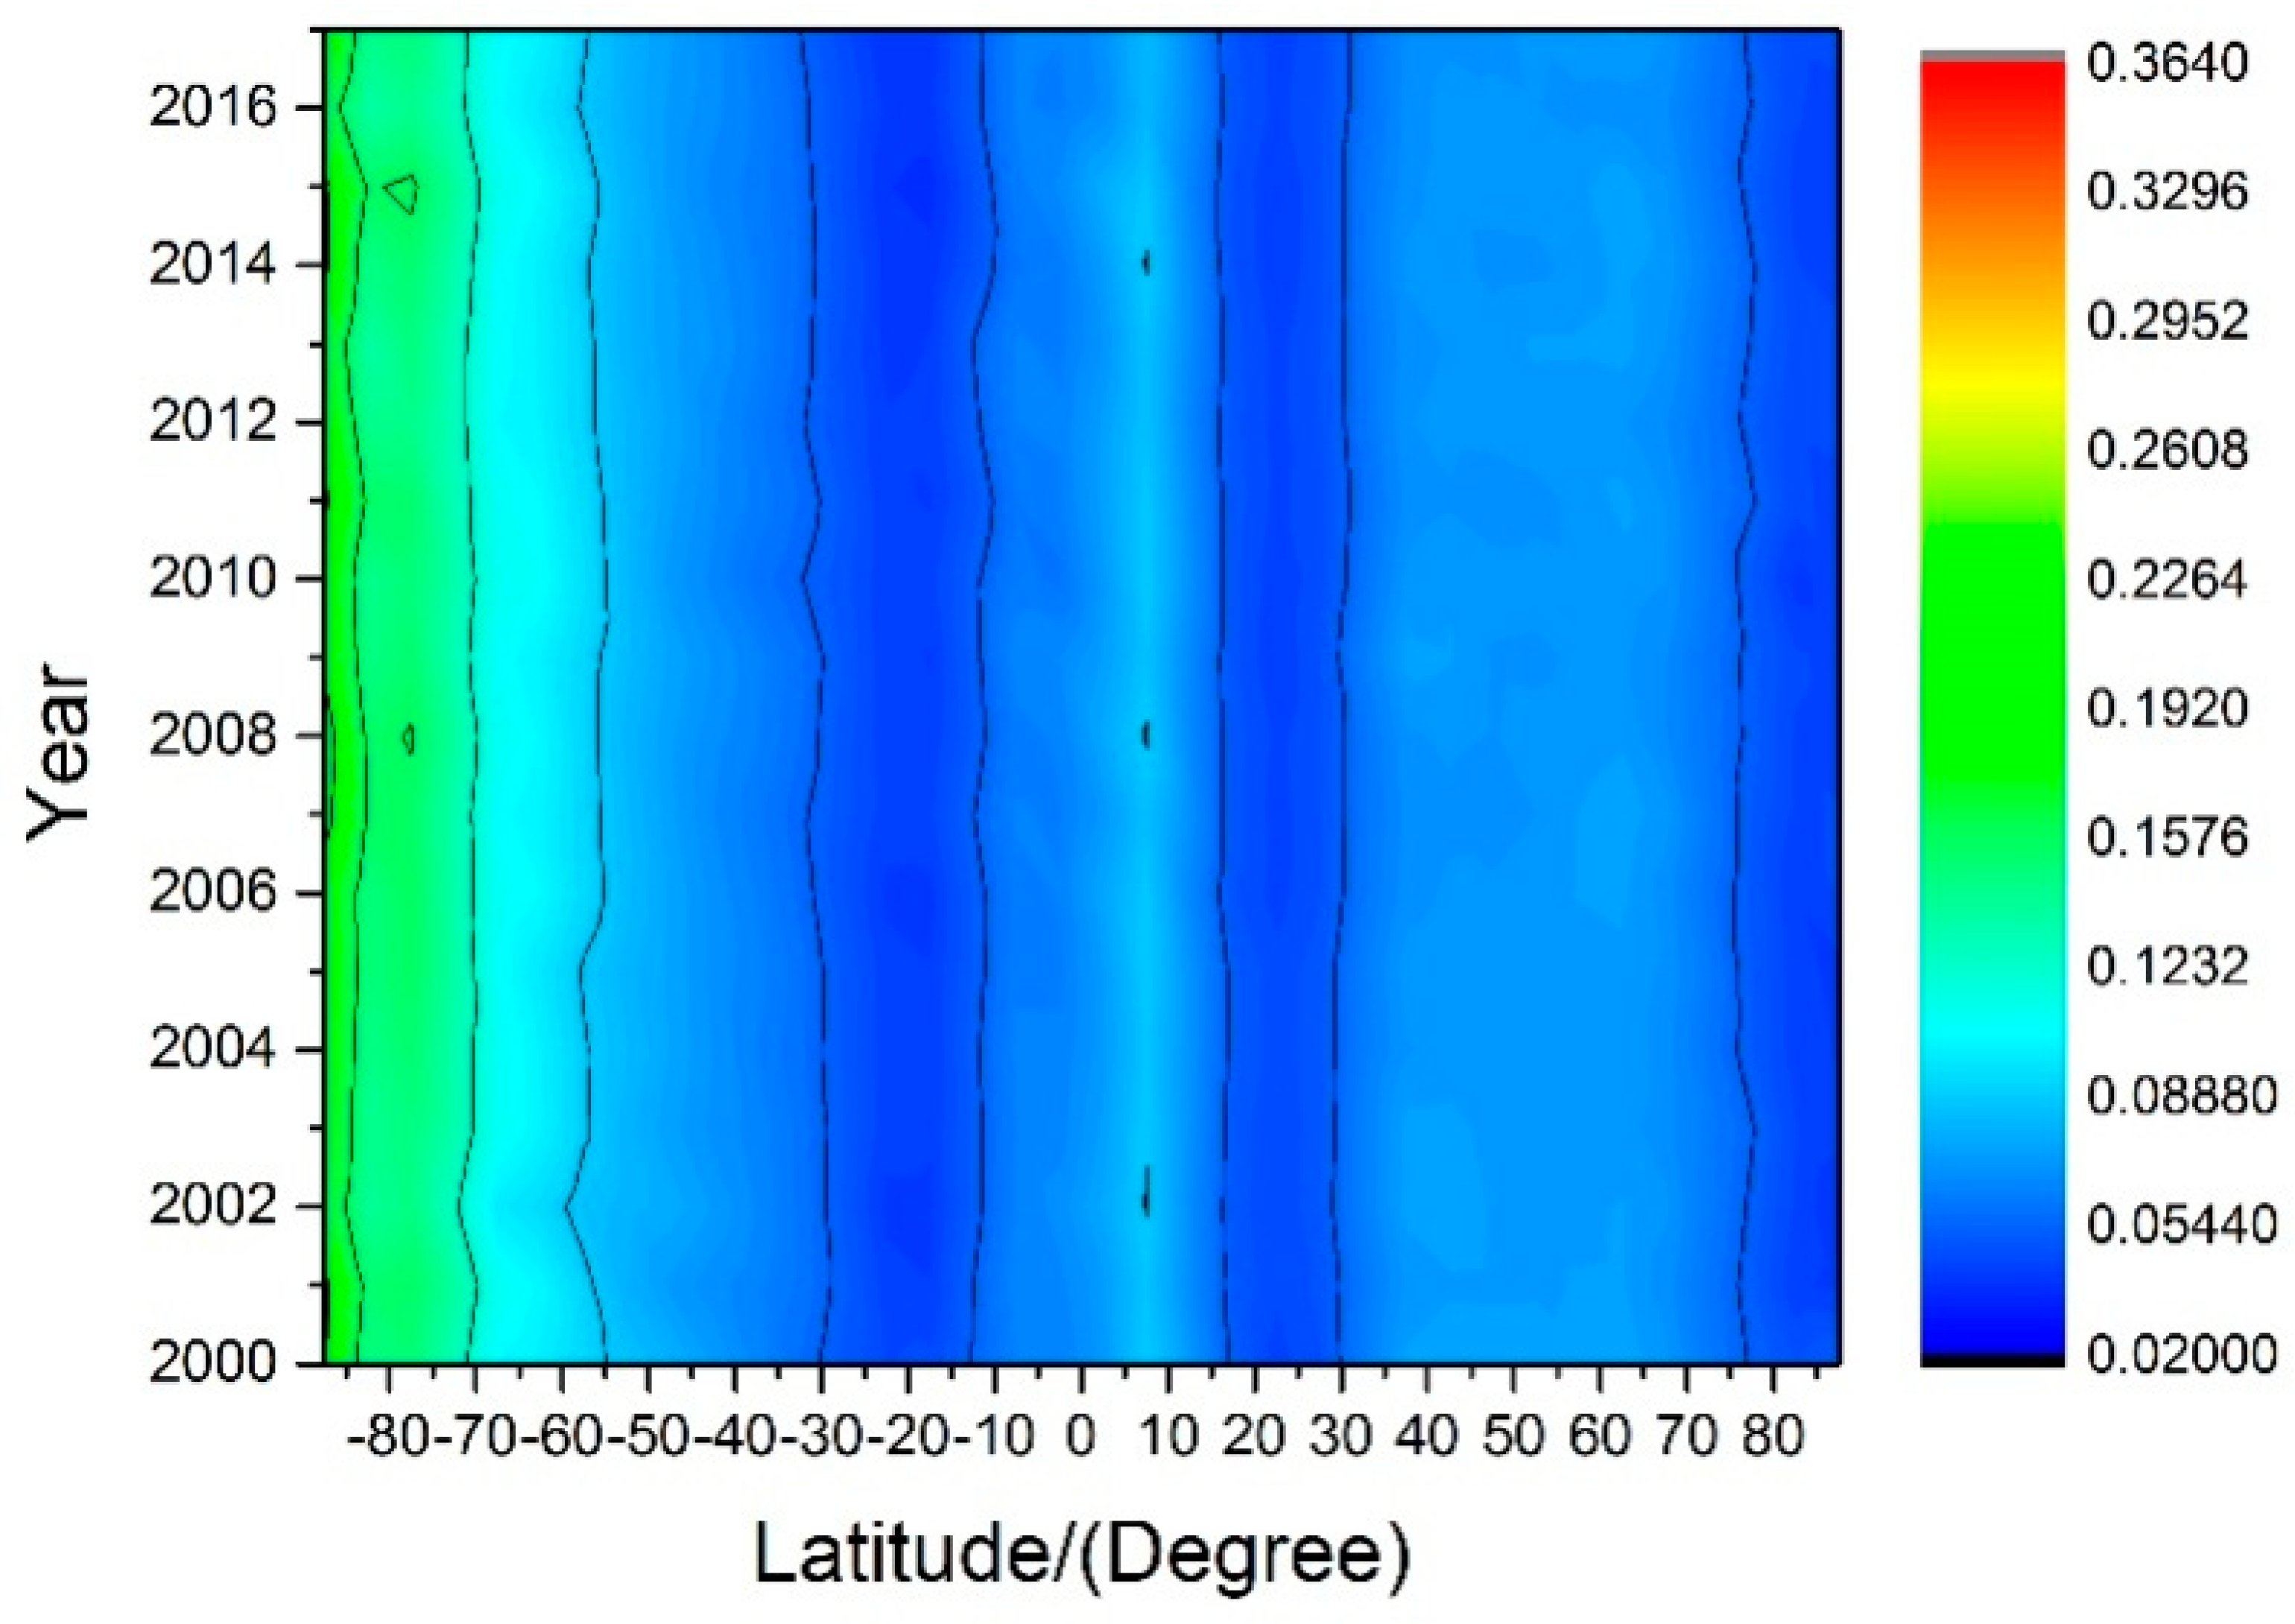
The yearly-average cirrus reflectance is statistically analyzed based on the latitude change in Figure 4. The yearly-average cirrus reflectance varies small with time for the fixed latitude zone, especially for the mid-latitude and low-latitude zones. This phenomenon illustrates annual trend of cirrus reflectance is not obvious and difficult to discriminate from larger yearly differences, so the cooling effects of cirrus clouds vary small with different years. Figure 4 also shows that the yearly-average cirrus reflectance in the Southern Hemisphere varies rapidly with latitude, especially at the high latitude regions. For the regions where the latitude is greater than 50°, the yearly-average cirrus reflectance in the Southern Hemisphere is significantly larger than the Northern Hemisphere. For the mid-latitude and tropics, the yearly-average cirrus reflectance can be regarded as symmetrical about 5 °N, decreases firstly and then increases from the central axis to the sides.
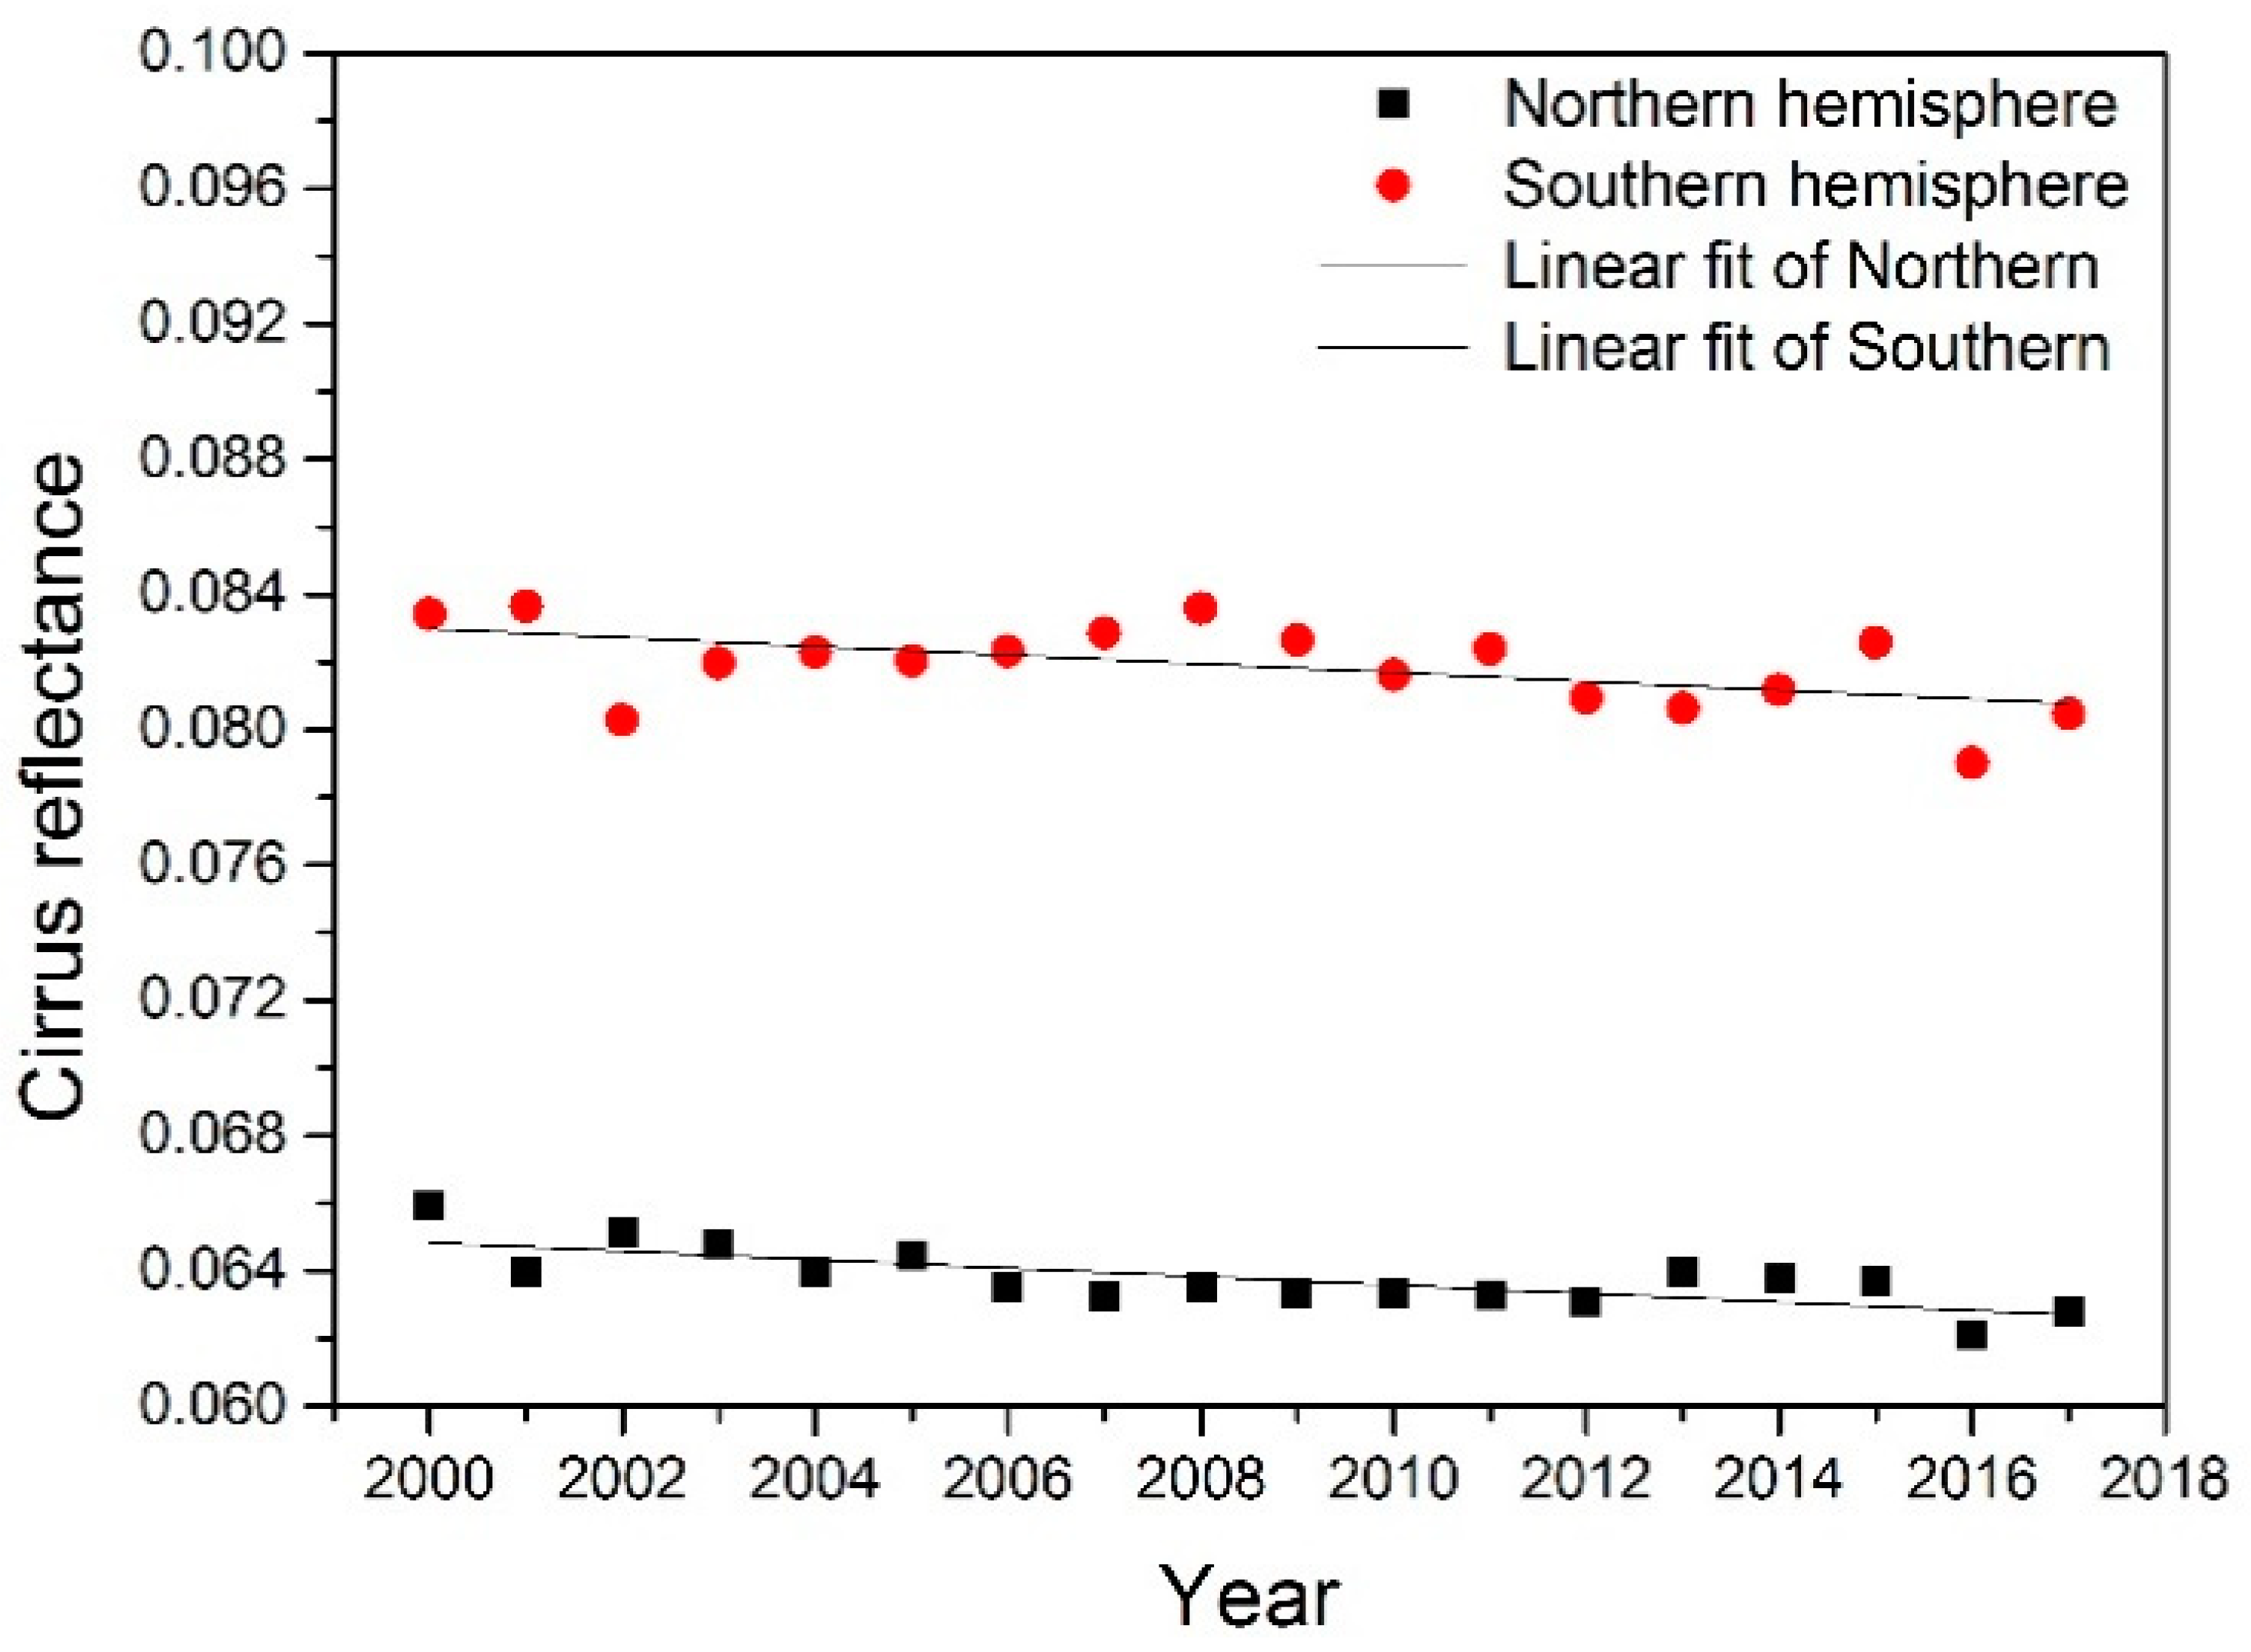
In order to analyze the variation of the cirrus reflectance, statistical analysis based on the 18 years data for each Hemisphere is performed. In this paper, a linear fitting method is used to analyze the trend of cirrus reflectance over time. As shown in Figure 5, the yearly-average cirrus reflectance in the Southern Hemisphere is significantly larger than in the Northern Hemisphere. There is a slightly decreasing tendency for the yearly-average cirrus reflectance at each Hemisphere, the slopes of cirrus reflectance variation in the Northern and Southern Hemisphere are −1.253 × 10⁻⁴ and −1.297 × 10⁻⁴/year, or around −0.19% and −0.16%/year, respectively. The Pearson’s R of cirrus reflectance in the Northern Hemisphere is −0.761, which means the yearly-average cirrus reflectance has a negative correlation with time. However, Pearson’s R in the Southern Hemisphere is −0.551. Figure 5 implies that the global solar radiation reflected by cirrus clouds may have a decreasing trend. In order to confirm the trend, more research on long-term observation of cirrus clouds based on satellite data and lidar is needed in the future.
3.3. Seasonal Variation of Cirrus Clouds During 2000–2017
The seasonal variation of cirrus clouds is studied in this subsection. In order to analyze the variation of cirrus reflectance with the different seasons (Sprint, Summer, Autumn and Winter, see Section 2.2 for details). The variation of the average cirrus reflectance with latitude is analyzed in different seasons.
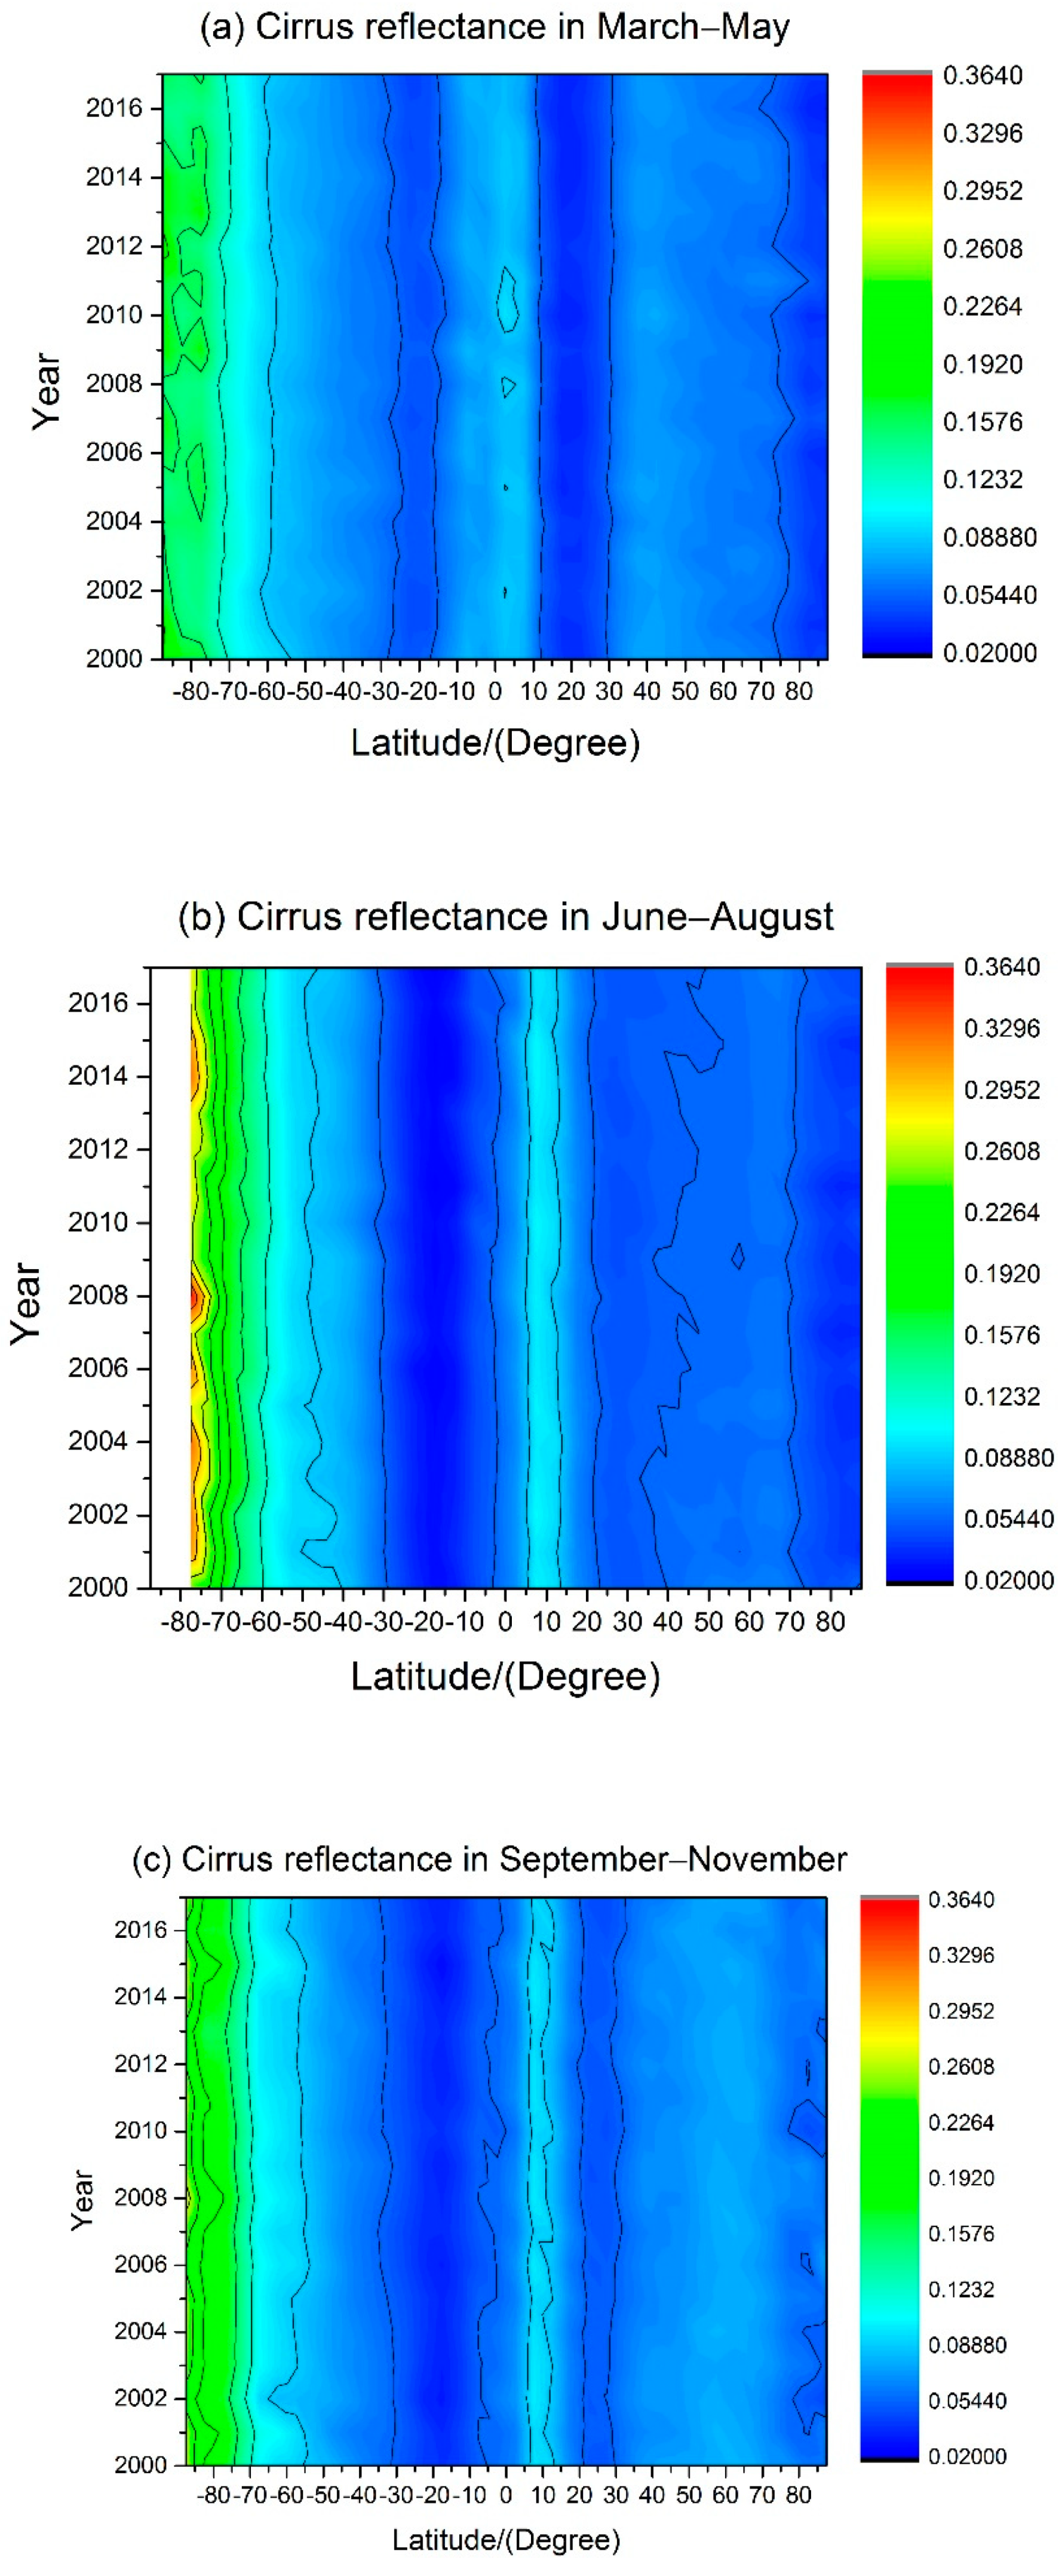
Figure 6 shows that the seasonal-average cirrus reflectance varies with latitude from 2000 to 2017. It can be seen from Figure 6a that the average cirrus reflectance from March to May can be regarded as symmetrical about 3 °N in the mid-latitude and low-latitude regions, decreases firstly and then increases from the central axis to the sides. The minimums occur near 20 °N in the Northern Hemisphere, and near 25 °S in the Southern Hemisphere, respectively, and the minimum value in the Northern Hemisphere is smaller than the Southern Hemisphere. However, at the high-latitude regions, the seasonal-average cirrus reflectance in the Southern Hemisphere increases gradually, but decreases in the Northern Hemisphere. In Figure 6, (c) is similar to (a), but for the average cirrus reflectance from September to November, the central axis in the mid-latitude and low-latitude regions is located at around 8 °N. There is no data for Figure 6b,d in the [80 °S, 90 °S], [80 °N, 90 °N] regions, respectively, because of the Polar nights or very short sunshine time. Figure 6b shows that the average cirrus reflectance varies with latitude from June to August. From 10 °N to 75 °S, the cirrus reflectance decreases firstly and then increases. The minimum value is near the 15 °S, but from 10 °N to 90 °N, the variation of seasonal-average cirrus reflectance is gentle, especially for the mid-latitude regions, the cirrus reflectance varies very slowly. Figure 6d describes that the average cirrus reflectance from December to February is symmetrical about 7.5 °S at the mid-latitude and tropical regions, and there is a tendency to decrease from the center to both sides. As shown in Figure 6, there is a large latitudinal movement of cirrus reflectance with the changing season, which is in agreement with previous [12,13]. For the mid- and high-latitude regions, the cirrus reflectance reaches the maximum in winter whether the Southern Hemisphere or the Northern Hemisphere, i.e., Southern Hemisphere: June–August, Northern Hemisphere: December–February, and varies with latitude larger in the Southern Hemisphere than in the Northern Hemisphere.
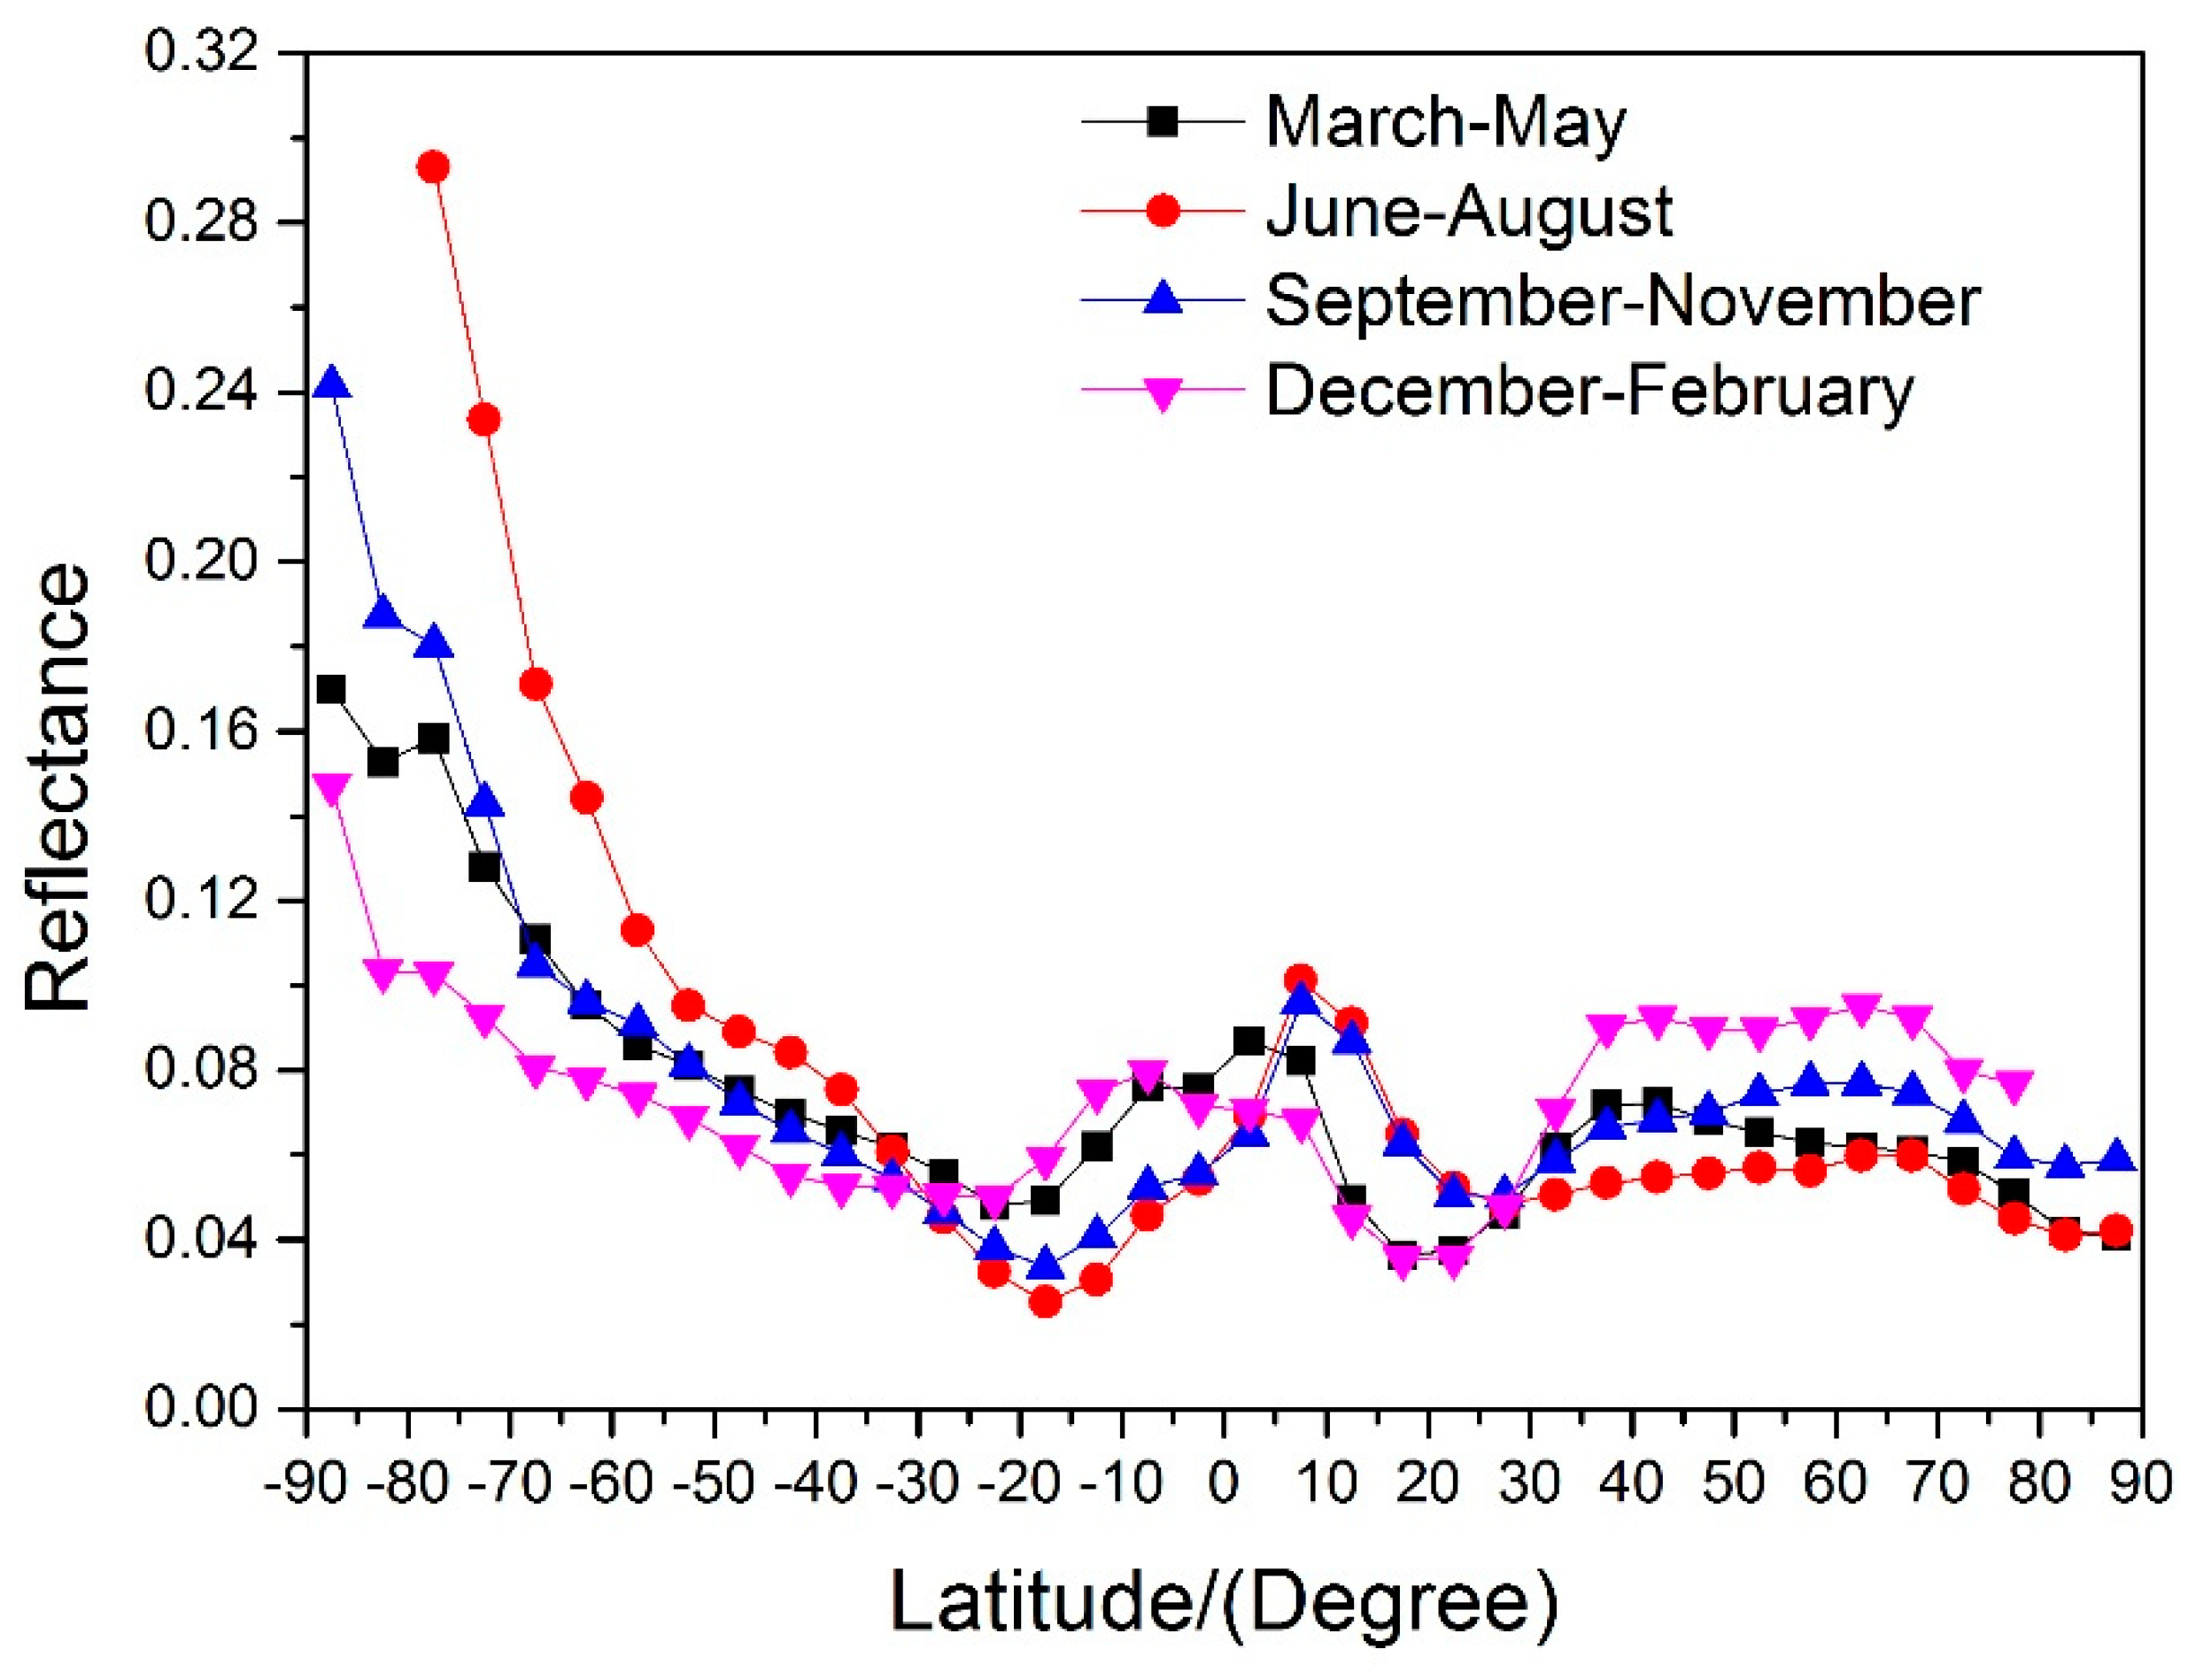
Figure 7 displays the seasonal distribution of the 18-year average cirrus reflectance with latitude. For the mid- and high-latitude regions in the Northern Hemisphere, the 18-year average cirrus reflectance reaches a maximum in December–February, and a minimum in June–August. In the Southern Hemisphere, the average cirrus reflectance reaches the maximum in June–August and reaches the minimum in December–February, that is, the 18-year average cirrus reflectance reaches its maximum in winter and reaches the minimum in summer. The results are strongly supported by the findings in Mitchell et al. [13,14]. It is related to the formation principle of cirrus that cirrus reflectance varies with the changing season. As well known, cirrus clouds are composed of ice crystals of different shapes, and the formation of ice crystals is greatly determined by temperature. In winter of the Northern Hemisphere, the lower atmospheric temperature is more conducive to the formation of ice crystals, which results in the cirrus reflectance and cirrus coverage reaching the maximum for the whole year. In the tropical region, the trend of cirrus reflectance is opposite with it in other regions.
4. Discussion
For the high latitude regions, the cirrus reflectance increases with latitude in Southern Hemisphere, while decreases with latitude in the Northern Hemisphere. It might be the present of Polar stratospheric clouds (PSCs) in the Antarctic. PSCs generally form at very low temperature, e.g., below −78 ℃, can be classified as different types according to their physical state and chemical composition [32]. As we know, temperature below -88 ℃ in the Antarctic, which frequently cause type II PSCs. But such low temperature are very rare in the Arctic, which result in Type II PSCs that are rare observed [33]. The higher reflectance in Southern Hemisphere may also result from the high reflectance and altitude of Antarctica (about 3 km). Water vapor mass in the atmospheric column over Antarctica and Greenland is minimal and may not be sufficient to completely absorb radiation at this wavelength. Moreover, these surfaces reflect sunlight very efficiently. Anyway, the cirrus reflectance difference between North and South Hemisphere is worthy of further investigations.
5. Conclusions
The cirrus reflectance can be used to calculate the attenuated solar radiation reflected by thin cirrus clouds, so the study distribution of cirrus reflectance has great impacts on improving estimating global energy budgets. In this paper, the MOD08 monthly data sets from March 2000 to February 2018, was used to analyze the distribution of the cirrus reflectance with the annual and seasonal variations. From the above analysis, major conclusions are made as follows:
The global distribution of the yearly-average cirrus reflectance is almost symmetrical at 5° N in the mid- and low latitude regions. From the central axis to ±60° latitude, the reflectance of cirrus clouds decreases firstly and then increases with latitude. The yearly-average cirrus reflectance varies with latitude more rapidly in the Southern hemisphere than that in the Northern Hemisphere, and the average cirrus reflectance near the Antarctic Circle is much larger than near the Arctic Circle.
The global yearly-average cirrus reflectance has a slightly decreasing tendency from 2000 to 2017, and the decrease rate is around −0.16%~ −0.19%. The yearly-average cirrus reflectance has a correlation with time, the correlated coefficient of Pearson’s R in the Northern Hemisphere is −0.761.
The cirrus reflectance also has a seasonal variation. For the mid- and high latitude regions, the average cirrus reflectance reaches the maximum in the winter and reach the minimum in the summer in both the Southern Hemisphere and the Northern Hemisphere. Cirrus reflectance varies more slowly with latitude in the Northern Hemisphere.
It should be point out that some effects will influence the reflectance at 1.38 μm channel, such as low water vapor effect, land altitude (affecting column water vapor amount), mixed phase clouds effects, variations of solar radiation etc. The quantitative analsyses of these effects to cirrus clouds reflectance are worthy of further investigations. Anyway, thoroughly investigating the difference in cirrus reflectance between the North Hemisphere and South Hemisphere is meaning and interesting.
Author Contributions
Data curation, F.Z. and C.T.; funding acquisition, C.T. and C.D.; investigation, F.Z. and X.W.; supervision, H.W.; writing—original draft, F.Z.; writing—review & editing, C.D. and H.W. All authors have read and agreed to the published version of the manuscript.
Funding
This research was funded by the (1) State Key Development Program for Basic Research of China (Grant number 2019YF0706004), (2) Strategic Priority Research Program of the Chinese Academy of Sciences (Grant number XDA17010104), (3) Project Supported by the Specialized Research Fund for State Key Laboratories (Grant number 201909), (4) Natural Science Research Project of Anhui Universities of China (Grant number KJ2019A0103)
Acknowledgments
We are grateful to the NASA Goddard Earth Science Distributed Active Archive Center(GES DAAC) for providing the MODIS Level-3 product data sets. All MOD08 monthly data sets are downloaded from the website: https://ladsweb.modaps.eosdis.nasa.gov/.
Conflicts of Interest
The authors declare no conflict of interest.
References
- Baran, A.J. From the single-scattering properties of ice crystals to climate prediction: A way forward. Atmos. Res. 2012, 112, 45–69. [Google Scholar] [CrossRef]
- Yang, P.; Liou, K.N.; Bi, L.; Liu, C.; Yi, B.; Baum, B.A. On the radiative properties of ice clouds: Light scattering, remote sensing, and radiation parameterization. Adv. Atmos. Sci. 2015, 32, 32–63. [Google Scholar] [CrossRef]
- Liou, K.-N.; Yang, P. Light Scattering by Ice Crystals: Fundamentals and Applications, 1st ed.; Cambridge University Press: Cambridge, UK, 2016; pp. 14–55. [Google Scholar]
- McFarquhar, G.M.; Heymsfield, A.J.; Spinhirne, J.; Hart, B. Thin and subvisual tropopause tropical cirrus: Observations and radiative impacts. J. Atmos. Sci. 2000, 57, 1841–1853. [Google Scholar] [CrossRef]
- Mason, B.J. The role of clouds in the radiative balance of the atmosphere and their effects on climate. Contemp. Phys. 2002, 43, 1–11. [Google Scholar] [CrossRef]
- Li, Y.; Zhang, C.; Li, F. Influence of thin cirrus clouds on the short-wave infrared satellite observation of atmospheric CO2. Optik 2019. [Google Scholar] [CrossRef]
- Kärcher, B.; Burkhardt, U. A cirrus cloud scheme for general circulation models. Q. J. R. Meteorol. Soc. 2008, 134, 1439–1461. [Google Scholar] [CrossRef] [Green Version]
- Ou, S.C.; Liou, K.N. Ice microphysics and climatic temperature feedback. Atmos. Res. 1995, 35, 127–138. [Google Scholar] [CrossRef]
- Tang, G.; Panetta, R.L.; Yang, P.; Kattawar, G.W.; Zhai, P.W. Effects of ice crystal surface roughness and air bubble inclusions on cirrus cloud radiative properties from remote sensing perspective. J. Quant. Spectrosc. Radiat. Transf. 2017, 195, 119–131. [Google Scholar] [CrossRef] [Green Version]
- Starr, D.O.; Cox, S.K. Cirrus clouds. Part ii: Numerical experiments on the formation and maintenance of cirrus. J. Atmos. Sci. 1985, 42, 2682–2694. [Google Scholar] [CrossRef] [Green Version]
- Ansmann, A.; Mamouri, R.; Bühl, J.; Seifert, P.; Engelmann, R.; Hofer, J.; Nisantzi, A.; Atkinson, J.D.; Kanji, Z.A.; Sierau, B.; et al. Ice-nucleating particle versus ice crystal number concentrationin altocumulus and cirrus layers embedded in Saharan dust:a closure study. Atmos. Chem. Phys. 2019, 19, 15087–15115. [Google Scholar] [CrossRef] [Green Version]
- Hong, Y.; Liu, G. The Characteristics of Ice Cloud Properties Derived from CloudSat and CALIPSO Measurements. J. Clim. 2015, 28, 3880–3901. [Google Scholar] [CrossRef]
- Mitchell, D.L.; Garnier, A.; Pelon, J.; Erfani, E. CALIPSO (IIR–CALIOP) retrievals of cirrus cloud ice-particle concentrations. Atmos. Chem. Phys. 2018, 18, 17325–17354. [Google Scholar] [CrossRef] [PubMed] [Green Version]
- Mitchell, D.L.; Garnier, A.; Avery, M.; Erfani, E. CALIPSO observations of the dependence of homo- and heterogeneous ice nucleation in cirrus clouds on latitude, season and surface condition. Atmos. Chem. Phys. Discuss. 2016, 1062, 1–60. [Google Scholar] [CrossRef] [Green Version]
- Nazaryan, H.; McCormick, M.P.; Menzel, W.P. Global characterization of cirrus clouds using CALIPSO data. J. Geophys. Res. Atmos. 2008, 113, 1–12. [Google Scholar] [CrossRef]
- Sassen, K.; Wang, Z.; Liu, D. Global distribution of cirrus clouds from CloudSat/Cloud-aerosol lidar and infrared pathfinder satellite observations (CALIPSO) measurements. J. Geophys. Res. Atmos. 2008, 113, 1–13. [Google Scholar] [CrossRef]
- Katagiri, S.; Sekiguchi, M.; Hayasaka, T.; Nakajima, T. Cirrus cloud radiative forcing at the top of atmosphere using the nighttime global distribution with the microphysical parameters derived from AVHRR. Am. Inst. Phys. 2013, 1531, 704–707. [Google Scholar]
- Pandit, A.K.; Gadhavi, H.; Ratnam, M.V.; Jayaraman, A.; Raghunath, K.; Rao, S.V.B. Characteristics of cirrus clouds and tropical tropopause layer: Seasonal variation and long-term trends. J. Atmos. Sol.-Terr. Phys. 2014, 121, 248–256. [Google Scholar] [CrossRef]
- Kumar, K.N.; Suzuki, K. Assessment of seasonal cloud properties in the United Arab Emirates and adjoining regions from geostationary satellite data. Remote Sens. Environ. 2019, 228, 90–104. [Google Scholar] [CrossRef]
- Eichmann, K.U.; Lelli, L.; von Savigny, C.; Sembhi, H.; Burrows, J.P. Global cloud top height retrieval using SCIAMACHY limb spectra: Model studies and first results. Atmos. Meas. Tech. Discuss. 2015, 8, 8295–8352. [Google Scholar] [CrossRef]
- Meyer, K.; Yang, P.; Gao, B.C.; Wiscombe, W. Characteristics of tropical cirrus cloud optical thickness fields using MODIS level-3 data. Proc. SPIE 2004, 5652, 231–238. [Google Scholar]
- King, M.D.; Menzel, W.P.; Kaufman, Y.J.; Tanré, D.; Gao, B.C.; Platnick, S.; Ackerman, S.A.; Remer, L.A.; Pincus, R.; Hubanks, P.A. Cloud and aerosol properties, precipitable water, and profiles of temperature and humidity from MODIS. IEEE Trans. Geosci. Remote Sens. 2003, 41, 442–458. [Google Scholar] [CrossRef] [Green Version]
- King, M.D.; Kaufman, Y.J.; Menzel, W.P.; Tanre, D. Cirrus Remote sensing of cloud, aerosol, and water vapor properties from the moderate resolution imaging spectrometer (MODIS). IEEE Trans. Geosci. Remote Sens. 2013, 30, 2–27. [Google Scholar] [CrossRef] [Green Version]
- Baum, B.A.; Platnick, S. Introduction to MODIS cloud products. In Earth Science Satellite Remote Sensing; Springer: Berlin/Heidelberg, Germany, 2006; pp. 74–91. [Google Scholar]
- Gao, B.; Yang, P.; Han, W.; Li, R.; Wiscombe, W. An algorithm using visible and 1.38-μm channels to retrieve cirrus cloud reflectance from aircraft and satellite data. IEEE Trans. Geosci. Remote Sens. 2002, 40, 1659–1668. [Google Scholar]
- Platnick, S.; King, M.D.; Ackerman, S.A.; Menzel, W.P.; Baum, B.A.; Riédi, J.C.; Frey, R.A. The MODIS cloud products: Algorithms and examples from terra. IEEE Trans. Geosci. Remote Sens. 2003, 41, 459–473. [Google Scholar] [CrossRef] [Green Version]
- Gao, B.C.; Kaufman, Y.J. Water vapor retrievals using moderate resolution imaging spectroradiometer (MODIS) near-infrared channels. J. Geophys. Res. 2003, 108, 4389. [Google Scholar] [CrossRef]
- Stigler, S.M. Francis galton’s account of the invention of correlation. Stat. Sci. 1989, 4, 73–79. [Google Scholar] [CrossRef]
- Gao, B.C.; Yang, P.; Guo, G.; Park, S.K.; Wiscombe, W.J.; Chen, B. Measurements of water vapor and high clouds over the Tibetan plateau with the terra MODIS instrument. IEEE Trans. Geosci. Remote Sens. 2003, 41, 895–900. [Google Scholar]
- Wylie, D.P. Eight years of high cloud statistics using HIRS. J. Clim. 1999, 12, 170–184. [Google Scholar] [CrossRef]
- Liou, K.N. Influence of cirrus clouds on weather and climate processes: A global perspective. Mon. Weather Rev. 1986, 114, 1167–1199. [Google Scholar] [CrossRef]
- Lowe, D.; Mackenzie, A.R. Polar stratospheric cloud microphysics and chemistry. J. Atmos. Sol.-Terr. Phys. 2008, 70, 13–40. [Google Scholar] [CrossRef] [Green Version]
- Maturilli, M.; Andreas, D. Polar stratospheric ice cloud above Spitsbergen. J. Geophys. Res. Atmos. 2006, 111, 1–12. [Google Scholar] [CrossRef]
Figure 1.
The flow chart of quality control for cirrus clouds data preprocesses: Obtain the effective samples.
Figure 1.
The flow chart of quality control for cirrus clouds data preprocesses: Obtain the effective samples.

Figure 2.
The 18-year average cirrus reflectance vs. latitude and longitude.

Figure 3.
The global average of cirrus reflectance.

Figure 4.
The variations of the yearly-average cirrus reflectance vs. latitude from 2000 to 2017.

Figure 5.
The hemispheric cirrus reflectance vs. year.

Figure 6.
The seasonal-average cirrus reflectance vs. latitude from 2000 to 2017. (a) March-May, (b) June-August, (c) September-November, (d) December-February. Note that there are no data for (b) and (d) in the [80 °S, 90 °S], [80 °N, 90 °N] regions, respectively, due to the Polar nights or very short sunshine time.


Figure 7.
The seasonal distribution of the 18-year average cirrus reflectance vs. latitude. Note that: due to the polar nights in the South and Arctic, data in the region [80°,90°] in winter and [−90°,−80°] in summer does not exist.
Figure 7.
The seasonal distribution of the 18-year average cirrus reflectance vs. latitude. Note that: due to the polar nights in the South and Arctic, data in the region [80°,90°] in winter and [−90°,−80°] in summer does not exist.

© 2020 by the authors. Licensee MDPI, Basel, Switzerland. This article is an open access article distributed under the terms and conditions of the Creative Commons Attribution (CC BY) license (http://creativecommons.org/licenses/by/4.0/).
Share and Cite
MDPI and ACS Style
Zhao, F.; Tang, C.; Dai, C.; Wu, X.; Wei, H. The Global Distribution of Cirrus Clouds Reflectance Based on MODIS Level-3 Data. Atmosphere 2020, 11, 219. https://0-doi-org.brum.beds.ac.uk/10.3390/atmos11020219
AMA Style
Zhao F, Tang C, Dai C, Wu X, Wei H. The Global Distribution of Cirrus Clouds Reflectance Based on MODIS Level-3 Data. Atmosphere. 2020; 11(2):219. https://0-doi-org.brum.beds.ac.uk/10.3390/atmos11020219
Chicago/Turabian StyleZhao, Fengmei, Chaoli Tang, Congming Dai, Xin Wu, and Heli Wei. 2020. "The Global Distribution of Cirrus Clouds Reflectance Based on MODIS Level-3 Data" Atmosphere 11, no. 2: 219. https://0-doi-org.brum.beds.ac.uk/10.3390/atmos11020219
Note that from the first issue of 2016, this journal uses article numbers instead of page numbers. See further details here.