Article

Submicron and Ultrafine Particles in Downtown Rome: How the Different Euro Engines Have Influenced Their Behavior for Two Decades

by
Gaetano Settimo
1,*,
Maria Eleonora Soggiu
1,
Marco Inglessis
1,
Maurizio Manigrasso
2 and
Pasquale Avino
3,*
1
Italian Institute of Health, viale Regina Elena 299, I-00185 Rome, Italy
2
Department of Technological Innovations, National Institute for Insurance against Accidents at Work INAIL, via Roberto Ferruzzi 38, I-00143 Rome, Italy
3
Department of Agriculture, Environmental and Food Sciences, University of Molise, via F. De Sanctis, I-86100 Campobasso, Italy
*
Authors to whom correspondence should be addressed.
Submission received: 7 July 2020 / Revised: 15 August 2020 / Accepted: 17 August 2020 / Published: 24 August 2020
(This article belongs to the Special Issue Exposure Assessment of Air Pollution)

Abstract

:
Today, submicron particles are recognized as the new target in environmental sciences and human health issues as well. Their level in urban air is strongly affected by anthropogenic sources, i.e., domestic heating and autovehicular traffic, but the availability of large datasets represents a limit in the knowledge both of the behavior and of the relative levels. This paper would like to highlight the role of these two anthropogenic sources in a big city such as Rome in the particle formation/removal processes in the range 18–750 nm using a Scanning Mobility Particle Analyser (SMPS). The investigation starts from data collected in the previous decade (2010) and analyzes the role played by different Euro (0–6) engines on the particle levels as well as the responsibility of different biomass burning in this issue. Furthermore, a chemometric approach (Cluster Analysis, CA, and Principal Component Analysis, PCA) has allowed the identification of three different clusters, strongly dependent on the accumulation and nucleation modes of the Ultrafine Particles. On the other hand, the PCA demonstrated a scatter distribution in December larger than that in October, justified by the different sources present in these periods.

1. Introduction

Atmospheric aerosols are a complex mixture of small and large particles, both emitted directly into the atmosphere and produced during the gas-to-particle conversion processes; their sources can be both natural and anthropogenic. Ambient aerosols generally include those with a diameter between 0.01 and 100 µm: particles between 2.5 and 10 µm are defined as coarse particles, and particles between 2.5 and 0.1 µm, as fine particles, whereas particles between 10 and 100 nm, generally formed by the products of the crystallization of supersaturated vapors (SO2, NH3, NOX and combustion products), are called ultrafine particles (UFPs) [1]. In 2002, Pope et al. [2] observed that 10 μg m−3 increments of PM2.5 were associated with increased risks of all-cause, cardiopulmonary and lung cancer mortality, respectively, by about 4%, 6% and 8% in metropolitan areas in the United States. The most recent experimental evidence has provided results that indicate how exposure to ultrafine particles of secondary origin in indoor and outdoor environments (diesel exhausts, welding fumes and ultrafine particles in urban air) is responsible for adverse health effects [3,4,5,6]. Although the mechanisms of biological action are not yet sufficiently known, the health and environmental data collected on airborne particles in living environments have provided indications on the characteristics that can influence toxicity and the dose–response relationship. Experimental animal studies have shown that doses of insoluble ultrafine particles are more powerful than larger particles with similar composition in the induction of lung inflammation, tissue damage and lung cancer [7,8]. In light of these studies, the International Agency for Research on Cancer (IARC) has classified the following risk agents as human carcinogens (group 1, i.e., the agent is carcinogenic to humans: there is sufficient evidence of carcinogenicity in humans): exhaust fumes from diesel engines [9], welding fumes [10] and particulates in urban air (outdoor pollution) [11].
In previous studies, the PM10 sampled during an urban 40 min-walking trial was proved to be formed by more than 90% of PM1 [12,13], as well as PM2.5 being demonstrated to be completely misleading as an indicator of fine mode aerosols [14,15]. PM1 rather than PM2.5 should be preferred to represent anthropogenic pollution [16,17]. It should be kept in mind that the separation between fine and coarse aerosols can be below 1 μm, so PM1 can also be influenced by natural sources of coarse aerosol [18]. For this aim, a methodology based on highly time-resolved measurements managed to prove that there is a region where the tails of the coarse and fine modes may overlap to some extent: the PM is dominated neither by anthropogenic sources (fine PM, essentially) nor by natural sources (coarse PM, essentially). Natural radioactivity measurements allow the discernment of local from remote contributions [19]. This approach can be considered a diagnostic tool, helping the source apportionment studies to identify the contribution of local and remote PM pollution sources as well as to define the size range in which the contribution of remote pollution sources operates.
The authors would like also to underline that the European Union started to regulate the acceptable limits for the exhaust emissions of new vehicles with Euro categories in 1992 (Euro 1). At the beginning of 2001, Euro 3 engines were mounted in any vehicle [20], as they were at the beginning of 2003 in motorcycles (specifically two- and three-wheel motor vehicles) [21]. From 1 January 2006, the Euro 4 engines replaced the Euro 3 ones until 2009 [22], when Euro 5 engines were mounted in light passenger and commercial vehicles [23].
At the end of 1999, at the Italian Institute of Health’s (IIH) Pilot Station, the total number of ultrafine particles started to be measured [24]: this represents the longest historical series for this pollutant in downtown Rome. Recently, this information was improved by studying the size fractions from 15 to 20 µm. This occurrence has allowed to complete the scenario and draw significant considerations regarding the sources affecting the urban atmosphere of Rome. Particularly, this paper would like to highlight the comparison of two decades of measurements, the evolution of such measurements, and an understanding of how anthropogenic sources strongly present in the area impact the relative fractions.

2. Experiments

The particle number concentration (PNC) was measured with mod. 3022A (TSI, Shoreview, MN, USA) condensation particle counters (CPC). This type of counter can monitor particles larger than 20 nm in diameter but still have a 50% counting efficiency at 7 nm. The sampling lines were stainless-steel tubing, 2.5 m long and with an inner diameter of 4 mm. The inlet reached 1 m out from the outside wall of the container in which the instrument was placed. The quality of the data given by the CPC was determined by the factory calibration and operation procedures provided by the manufacturer.
The mod. 3938 Scanning Mobility Particle Analyser (SMPS, TSI) is a nanoparticle sizer capable of measuring the size distribution of airborne submicron particles [25]. It combines electrical mobility sizing with single-particle counting to deliver nanoparticle concentrations in discrete size channels. Our SMPS model 3938 is composed of a mod. 3082 Electrostatic Classifier (TSI), a 3088 soft X-ray Neutralizer, a mod. 3081 long Differential Mobility Analyzer (DMA), an MD-700 series large diameter NafionTM tubing dryer, and a sampling system for atmospheric aerosols mod. 3772200 (TSI). Furthermore, it is coupled with an Aerodynamic Particle Sizer (APS, mod. 3321, TSI) in order to perform continuous measurements in the range of 10 to 20 μm with an uncertainty approximately <2%.

3. Results

Ultrafine particles were intensely determined in downtown Rome from October 2019 to January 2020. This period is basically characterized by a meteorological variability (October–November) and by stability conditions (December and January) [26,27]; the whole period is influenced by intense auto-vehicular traffic, whereas domestic heating comes on in mid-November. These occurrences heavily affect the levels and the behavior of the submicron particles in different ways. Table 1 reports the hourly particle levels in the range 18–750 nm along with the relative data of the whole period for each channel.
The particle numbers range between 3752 and 279,466 cm−3 over an hour with an average value of 73,761 and a variability of measurements, expressed as the coefficient of variation (cv%), of 74.6%. More interesting are the percentiles reported, particularly the 95% percentile (194,283 cm−3), meaning that 95% of the measurements are below this level. The table also reports the particle number for each channel. This could be evidence of differential behavior between the Ultrafine Particles (UFPs, particles below 100 nm) and the submicron particles: the variability is around 75% for the UFPs, whereas it reaches almost 99% around 178 nm and ranges between 91 and 99% in the particle size range from 133 and 750 nm. Preliminarily, this occurrence evidences the presence of two different behaviors. The first one regards the UFPs, i.e., particles both in nucleation mode (~3–25 nm) and in the Aitken nuclei range (~25–90 nm): these particles are both freshly emitted in atmosphere [28] and/or obtained by coagulation/condensation processes or directly emitted from combustion sources. The second behavior regards particles in the accumulation mode, i.e., 133–750 nm: the cv% values, higher than the previous ones, suggesting an important reactivity of such fractions (formation processes) [29,30].
Table 2 shows the Pearson’s correlation between two channels in the range 23–750 nm. The strongest correlations above 0.7 are highlighted in italics. Two different situations can be identified: the correlations are very good for contiguous channels below 100 nm (i.e., between 17.8 and 75.0 nm), as well as similar behavior being found for size fractions above 133 nm (i.e., between 133 and 562.2 nm). This occurrence might suggest the presence of two different groups of data, like two different “clusters”.
Finally, the linear correlation between the smallest size fraction (17.8 nm) and each other size fraction among all the measurements was investigated for confirming the possible presence of different clusters in the whole dataset. Table 3 summarizes the daily and weekly data such as the slope (m) and intercept ® along with the correlations and the p-values. The correlation is very good in the range 20–100 nm, whereas it decreases for the higher size fractions.

4. Discussion

4.1. Contribution of the Different Anthropogenic Sources

Briefly, the authors would like to summarize the previous decade measurements: Table 4 shows the particle number concentration (PNC) data observed during the previous decade (2000–2010) both at the IIH building and at the Botanical Garden in Rome. The PNC data are related to the mean of the 24 h average concentrations: this is one of the longest time-series of measurements performed in Rome regarding this issue.
The relative PNC trend is almost regular (Figure 1): the maximum levels are reached during the wintertime (December–March), whereas the minimum levels are reached during summertime (June–September), according to both the activity of different anthropogenic sources and the seasonal meteorological conditions (e.g., different solar irradiation, temperature, etc.) [19]. Particularly, until June 2003, the mean value is 45,600 ± 24,700 cm−3 per 24 h, reaching up to 150,000 cm−3 per 24 h; after this period and for the rest of decade (i.e., from June 2003 to the end of 2010), it decreases down to 28,010 ± 15,256 cm−3, with a maximum concentration of 95,157 cm−3. This decreasing trend could be ascribed to the technological evolution of engines (Euro 3, Euro 4, etc.) during the entire period. From the analysis of the database of the Automobile Club d’Italia (ACI) [31], it can be observed that in the Municipality of Rome—where a total of 2,426,263 vehicles and, in particular, 1,941,964 cars—circulated at the end of 2002, about 81% of autovehicles were registered by December 31st 2000, i.e., before the enforcement of the directive about the Euro 3 engine. The use of the Euro 3 engine, mandated by the EU in 2001, took effect in 2003. On the other hand, it should be reported that the introduction of Euro 4 engines in 2006 or Euro 5 in 2009 produced no effects on the PNC levels, as evidenced in Figure 1, where the particles show a similar qualitative and quantitative trend from 2006 to 2010. Furthermore, Figure 1 shows the effects of engines with different Euro technology on the particulate matter over a long period. Once again, the authors would like to underline that these values represent the mean daily concentration levels reached in terms of PNC over the entire decade.
Starting from these daily averages, a more complete study has been set up for understanding the particle number concentration as well as the behavior of the different size fractions. The authors focused their attention on the period between October 2019 to January 2020 for two main reasons: (1) this is a long period with highly variable meteorological conditions, both favorable and unfavorable to the air pollution dispersion [25,26]; (2) after the 15th of November, the domestic heating is switched on in residential buildings (residential indoors). This means that after the middle of November, the anthropogenic sources are basically vehicular traffic and domestic heating, whereas in the previous period, the vehicular traffic is the main one. This latter consideration is important because, in our hypothesis, it will strongly affect the particle behavior in the two periods.
The nucleation and condensation processes are responsible for the formation of particles at the exit from the exhaust pipe: the concentration of exhaust number particles is closely related to the air–fuel equivalence ratio, Φ, i.e., the ratio of the engine fuel–air ratio to the chemically correct fuel–air ratio [32]. Numerical concentrations for diesel engines decrease with increasing Φ. At low temperatures, i.e., at the engine starting, the exhaust temperature is lower, the unburnt fuel is oxidized less effectively, and, after being cooled, it can nucleate to form large concentrations in the nucleation mode [33]. The nucleation of semi-volatile gases to produce new particles is a process in competition with the condensation of these gases on the surface of particles [34,35,36].
A first confirmation of this hypothesis could be drawn from Figure 2, where the submicron particle trends in October (a) and in December (b) are reported. As can be seen, the levels reached in the two periods are very different. On the other hand, the more interesting fact is that the behavior seems qualitatively similar. This occurrence is the basis for a preliminary chemometric approach for the overall period that will be shown below.
Comparing the data reported in Figure 1 and Figure 2, the particle number concentration seems to be higher in 2019 with respect to the levels determined at the end of the previous decade. The introduction of Euro 5 and Euro 6 should have helped in the way of submicron particle reduction. This is partially true. The average particle levels are 54,563 ± 29,408 and 93,222 ± 62,972 cm−3 in the October–November and December–January periods, respectively. They are somewhat higher that those reported in the second half of the previous decade; the database of the autovehicles in the Municipality of Rome can explain such levels. First, among the main European countries, Italy is the one with the highest density of cars in circulation (621.2 per 1000 inhabitants): particularly, Rome, with a rate of 71 cars per 100 inhabitants, is at the top both compared to other Italian cities (Milan, 57; Naples, 56) and compared to other European capitals (Paris, 45; Barcelona, 41; London, 36; Berlin, 35; Madrid, 32). Furthermore, at the end of 2017 (the last available official census), 3,467,579 autovehicles among cars, trucks, buses and motorcycles circulated in Rome, of which 47% were Euro 0 (12%), Euro 1 (5%), Euro 2 (11%) and Euro 3 (19%), a very old set of cars. Finally, 40% of the autovehicles are diesel, whereas the percentage of vehicles powered by an electric-hybrid engine is still irrelevant. All these data largely justify the “apparent” high levels reported in Figure 2.
Following these preliminary considerations, the authors focused their attention on finding out a possible different contribution of the anthropogenic sources before and after November the 15th, i.e., when it is allowed by Italian law to turn on the domestic heating in Rome (especially in institutional buildings [37]).
Figure 3 shows typical daily behaviors of particle number concentration levels in the range 18–750 nm during workdays (from Monday to Friday) and weekends (Saturday and Sunday) in October (Figure 3a) and December (Figure 3b).
The differences between the typical daily trends of the two periods are evident both in qualitative and quantitative terms. First, in October (Figure 3a), during the nighttime, the PNC level of the workday graph is around 40,000 cm−3/hour, and it increases up to 80,000 cm−3/hour during the first hours of the day (6–7 a.m.); the profile shows another peak in the evening (6–7 p.m.) in correspondence to the vehicular traffic peak. On the contrary, the PNC profile during the weekend is different: it shows high levels in the night (probably due to vehicular traffic) and low levels during the daylight because of the large buildings of the area (University and Public Health Institute) being closed (i.e., low presence of traffic). Over these considerations, the meteorological conditions, i.e., stability and instability conditions, as well as the dynamics of the boundary layer, play an important role [38]. The peak between 11 a.m. and 1 p.m. could be due to the presence of activities related to the visiting hours of a large cemetery close to the sampling site. Later, the PNC level goes down until 8–9 p.m., when it increases again to over 80,000 cm−3/hour due to the establishment of the atmospheric stability conditions. The profiles in December (Figure 3b) are very different due to the presence of domestic heating over the vehicular traffic. This additional source is relevant during the nighttime of the workdays: at midnight, the PNC level is around 100,000 cm−3. This value decreases during the first hours of the day and increases again when the traffic starts and the domestic heating is turned on. During the day, the profile shows two main peaks, one in the morning (6–10 a.m.) and one in the evening (4–7 p.m.), caused by the contemporary presence of the two sources and the atmospheric stability conditions of these hours in Rome during the cold period [39]. In fact, during winter, the window of solar irradiation, which favors the mixing of atmospheric pollutants, is narrow as reported in the literature [40].
The relative profiles of each month were analyzed. Figure 4 shows the typical daily trends of the size fractions between 18 and 750 nm in the four different months in downtown Rome. The different trends in the four months are evident. October and November show similar trends from a qualitative point of view. The levels are slightly different: the reason could be the different solar irradiation window in the two periods and the high rainfall of the last November. In October, the light window is larger than that in November and the diurnal atmospheric stability conditions are longer than those in November considering the same emission sources. The behavior of each particle size fraction shows a typical trend of an anthropized area: a large peak during the daylight and a second, less-marked peak during the evening, i.e., at the end of the activities. In November, the situation is similar, but the solar irradiation window is narrower, which means that the instability conditions start later in the morning (around 8 a.m.) and finish early in the evening (around 5 p.m.). The meteorological conditions in December and January are similar; the atmospheric stability/instability conditions play a fundamental role, especially during the night. In fact, the highest levels observed during the nighttime are due to the contemporary presence of high emissions of anthropogenic sources and the atmospheric stability conditions.
The anthropogenic source contribution can be better highlighted by analyzing the behavior of the single size fractions. Figure 5 shows the daily UFP profiles during the workday and weekend in October (Figure 5a,b, respectively) and December (Figure 5c,d, respectively). The profiles are different, both qualitatively and quantitatively. In October, the hourly workday trend is characterized by low levels during the nighttime, specifically below 10,000 cm−3/hour between midnight and 5 a.m. for each fraction when the boundary layer is lower as well as the traffic, and two peaks during the daylight. Each fraction ranges between 5000 and 15,000 cm−3/hour in the morning, i.e., when the boundary layer goes up and atmospheric stability conditions are established with high emissions of anthropogenic sources.
A second maximum peak can be detected in the evening between 6 and 8 p.m. in correspondence with the second traffic peak. It is worth mentioning the high correlation between neighboring fractions of particles, ranging from 0.83 between 75.0 and 100.0 nm and 0.95 between 17.8 and 23.7 nm. On the other hand, during the daytime of the weekend profiles in October, the highest UFP levels are observed between 12 and 2 p.m., suggesting a greater contribution from the photo-oxidation of Volatile Organic Compounds (VOCs) than from autovehicular traffic [41,42,43]. Higher concentrations are observed in the nocturnal hours, specifically between 7 p.m. and 3 a.m, because of the reduction of the vehicular traffic emissions, which overcomes the decrease in the atmospheric mixing height. In December, the situation is complicated by the presence of the second anthropogenic source, i.e., domestic heating, which is relevant in the nighttime when the boundary layer goes down: in this case, the highest UFP levels start at 5 p.m. and last until 5 a.m.
It is worth noting the presence of a marked peak at around 1–4 p.m. This is mainly due to the particles in the nucleation mode (17.8 nm), whereas it tends to disappear with an increase in the size fraction. The fractions above 31.6 nm do not show any peak at that time. The presence of a huge air conditioner close to the sampling point justifies it. This source is significant in October, whereas it does not give any relevant contribution during the December period, when the peak is not detected during the hourly workday trend or, at least, the source has a particle emission lower than that of the other affecting the area. On the other hand, in December, the particle profile shows very high concentrations during the nighttime in both situations (workday and weekend), with levels ranging between 5000 and 20,000 cm−3/hour during the night until the first hour of the day and concentrations below 10,000 cm−3/hour, for each fraction, from 11 a.m. to 4 p.m., i.e., in correspondence with the maximum height of the boundary layer. The high levels reached during the nighttime are mainly due to the occurrence of accumulation and coalescence processes because of the presence of lower particle emissions. The particle behaviors in the October and December weekends are quite interesting. Although the profiles are quite similar from a qualitative point of view, they are quantitatively different. In both cases, the profiles are positively affected by the absence or, at least, reduction of the vehicular traffic, but in December, this advantage is partially canceled by the presence of domestic heating with different biomasses burning; the fractions at 75 and 100 nm each reach about 30,000 cm−3.

4.2. Chemometric Approach

Table 5 shows a graphical representation of a typical week by means of cluster analysis (CA) applied to the overall data from October to January. It is interesting to note the presence of three well-defined clusters, represented by different colors, and how they are distributed over the entire week.
Looking at the Table 5, two different situations can be observed; during the weekend (Saturday and Sunday), two different clusters are evident: cluster #3 (blue color) groups the data collected during the daylight, from 3 a.m. to 6 p.m., whereas cluster #2 (red color) groups the data collected from 7 p.m. to 2 a.m. (during the night). On Monday, a third cluster can be detected for all the workdays. In the investigated area, a large presence of human activities is present such as the largest university in Europe (University of Rome “La Sapienza”, 112,564 students and 8000 administrative staff in 2018), some clinical hospitals and the Italian Institute of Health; consequently, a high presence of vehicular traffic is recorded during workdays. Even if this analysis is carried out over the entire period from October to January, that is, in different weather periods and for different lifestyles, the results confirm the different behavior of the anthropogenic sources from Monday to Friday. Each cluster has been further analyzed; it is possible to observe that the two principal components, Component 1 and Component 2, justify almost 97% of the entire dataset. Particularly, Component 1 represents the particles in the accumulation mode (particles in the range above 75 nm), whereas Component 2 represents the particles in the nucleation mode (particles between 17.8 and 75 nm). It is interesting to note that cluster #3 is almost along Component 2, meaning continuous generation processes and the limited presence of aging particles. On the other hand, cluster #3 displays a different behavior; the Sunday, Saturday and, partially, Monday data are mainly correlated with Component 2, showing the situation just described for cluster #1. The data collected during the central hours of the days of the week (e.g., 9 a.m. to 5 p.m. on Monday) appear to be better related to the accumulation processes, i.e., processes involving particles above 237 nm. Cluster #2 shows an intermediate profile; also in this case, 96% of the data are verified by the two mail components.
On the other hand, CA applied to overall the data was performed to understand what fraction size was mainly relevant for the whole period; Figure 6 shows the dendrogram related to this analysis. The data are grouped into two different clusters: cluster #1 is formed by size fractions below 100.0 nm, i.e., Ultrafine Particles (UFPs), whereas cluster #2 is formed by the fraction above 100.0 nm. This is another confirmation of the importance of the generation processes that take place in large urban areas [44].
Figure 7 shows the Principal Component Analysis (PCA) applied to two typical weeks in October (a) and December (b), affected by different anthropogenic sources. A different distribution of the data can be detected. In Figure 7a, the 95% confidence ellipse is narrower than the same reported in Figure 7b, highlighting a similar source for all the particles. Furthermore, it is still confirmed that the particles in the range between 17.8 and 42.2 nm are highly correlated with Component #2, whereas particles above 42.2 nm are anti-correlated with Component #2. The data reported in Figure 7b, i.e., for a typical week in December, show a large variance due to the presence of different anthropogenic sources involved in the particle formation. In fact, first should be considered the high presence of vehicles equipped with diesel engines, specifically buses, trucks and coaches, which are a strong component in Rome [31]. On the other hand, in this period, there is also the domestic heating that uses different biomass combustion with different relative burning emissions [45,46,47,48,49,50].

5. Conclusions

The circulation of cars is one of the main causes of atmospheric pollution, due to the modification of the air caused by the gas, fine dust and fume emissions, which are extremely harmful to human health, especially in urban air [51]. This paper focused the attention on how the different Euro engines affected the levels and behaviors of submicron and ultrafine particles across two decades. A long data series has been compared with very recent data in terms of different particle size fractions. The possibility of simultaneously analyzing different size fractions has allowed the discrimination between contributions coming from autovehicular emissions and domestic heating. In fact, this second contribution plays a fundamental role, especially in November–January, unlike the first, which is relevant in other periods. Furthermore, the different biomass burning emissions used in Rome make the situation even more complicated. Furthermore, the authors highlighted the different UFP levels and behaviors during weekdays and weekends in relation both to the meteorological conditions in different seasons and to the emission rates.
Even if the introduction of more inflexible regulation has allowed, over time, a significant improvement of the air quality compared to that in past decades, dangerous polluting emissions continue to be traced mainly to cars. In the near future, cars with combustion engines are unlikely to disappear from European roads. To minimize their impact on air quality, continuous improvements are being made to engines in modern vehicles. With the Euro 6 standard, more pressing limits are established to reduce even more drastically the number of particles emitted into the atmosphere. On the other hand, despite the negative perception by the public, diesel technology has significantly evolved in recent years to limit pollutants in the air and reduce CO2 emissions. In fact, the less-polluting modern diesel cars combine low consumption with UFP emissions close to zero (and low nitrogen oxide emissions).
Although these regulations have been decisive for the reduction of air pollution in cities with high traffic levels, reduced thanks to more controlled circulation flows, they have not been sufficient to reduce harmful emissions deriving from other causes but always related to vehicles. If it is true, in fact, that automobile exhaust gases are one of the main sources of urban pollution, there are some variables or other polluting sources connected to cars that are often underestimated. Recent studies attribute almost 50% of the air pollution caused by road traffic to the condition of the vehicle, with particular reference to brake wear but also to the wear of the road surface and the particles raised by the road upon the passage of vehicles.
These data are fundamental because they were recorded just before COVID-19’s arrival and the following lockdown period; they can be considered the levels in highly polluted urban air to be compared with a background situation to be expected during the lockdown.

Author Contributions

Conceptualization, G.S. and M.E.S.; methodology, G.S. and P.A.; software, M.M.; validation, M.I. and M.E.S.; formal analysis, M.I.; investigation, G.S.; resources, M.M.; data curation, M.I. and M.M.; writing—original draft preparation, P.A.; writing—review and editing, G.S., M.E.S., M.I. and M.M.; supervision, P.A.; project administration, M.E.S.; funding acquisition, G.S. All authors have read and agreed to the published version of the manuscript.

Funding

This research received no external funding.

Acknowledgments

The authors would like to thank Ivan Notardonato for his helpful suggestions in the chemometric approach.

Conflicts of Interest

The authors declare no conflict of interest.

References

  1. Oberdörster, G.; Utell, M.J. Ultrafine particles in the urban air: To the respiratory tract-Ang beyond? Environ. Health Persp. 2002, 110, A440–A441. [Google Scholar] [CrossRef]
  2. Pope, C.A.; Burnett, R.T.; Thun, M.J.; Calle, E.E.; Krewski, D.; Ito, K.; Thurston, G.D. Lung cancer, cardiopulmonary mortality, and long-term exposure to fine particulate air pollution. JAMA 2002, 287, 1132–1141. [Google Scholar] [CrossRef] [PubMed] [Green Version]
  3. Oberdörster, G.; Sharp, Z.; Atudorei, V.; Elder, A.; Gelein, R.; Kreyling, W.; Cox, C. Translocation of inhaled ultrafine particles to the brain. Inhal. Toxicol. 2004, 16, 437–445. [Google Scholar] [CrossRef] [PubMed]
  4. Nway, N.C.; Fujitani, Y.; Hirano, S.; Mar, O.; Win-Shwe, T.T. Role of TLR4 in olfactory-based spatial learning activity of neonatal mice after developmental exposure to diesel exhaust origin secondary organic aerosol. Neurotoxicology 2017, 63, 155–165. [Google Scholar] [CrossRef]
  5. Tobías, A.; Rivas, I.; Reche, C.; Alastuey, A.; Rodríguez, S.; Fernández-Camacho, R.; Sánchez de la Campa, A.M.; de la Rosa, J.; Sunyer, J.; Querol, X. Short-term effects of ultrafine particles on daily mortality by primary vehicle exhaust versus secondary origin in three Spanish cities. Environ. Int. 2018, 111, 144–151. [Google Scholar] [CrossRef]
  6. Manigrasso, M.; Costabile, F.; Liberto, L.D.; Gobbi, G.P.; Gualtieri, M.; Zanini, G.; Avino, P. Size resolved aerosol respiratory doses in a Mediterranean urban area: From PM10 to ultrafine particles. Environ. Int. 2020, 141, 105714. [Google Scholar] [CrossRef]
  7. Gualtieri, M.; Grollino, M.G.; Consales, C.; Costabile, F.; Manigrasso, M.; Avino, P.; Aufderheide, M.; Cordelli, E.; Di Liberto, L.; Petralia, E.; et al. Is it the time to study air pollution effects under environmental conditions? A case study to support the shift of in vitro toxicology from the bench to the field. Chemosphere 2018, 207, 552–564. [Google Scholar] [CrossRef]
  8. Longhin, E.M.; Mantecca, P.; Gualtieri, M. Fifteen years of airborne particulates in vitro toxicology in milano: Lessons and perspectives learned. Int. J. Mol. Sci. 2020, 21, 2489. [Google Scholar] [CrossRef] [Green Version]
  9. IARC. Diesel and Gasoline Engine Exhausts and Some Nitroarenes; International Agency for Research on Cancer: Lyon, France, 2014; Monographs on the Evaluation of Carcinogenic Risks to Humans Volume 105. [Google Scholar]
  10. IARC. Welding, Molybdenum Trioxide, and Indium Tin Oxide; International Agency for Research on Cancer: Lyon, France, 2018; Monographs on the Evaluation of Carcinogenic Risks to Humans Volume 118. [Google Scholar]
  11. IARC. Outdoor Air Pollution; International Agency for Research on Cancer: Lyon, France, 2015; Monographs on the Evaluation of Carcinogenic Risks to Humans Volume 109. [Google Scholar]
  12. Manigrasso, M.; Natale, C.; Vitali, M.; Protano, C.; Avino, P. Pedestrians in traffic environments: Ultrafine particle respiratory doses. Int. J. Environ. Res. Public Health 2017, 14, 288. [Google Scholar] [CrossRef] [Green Version]
  13. Manigrasso, M.; Protano, C.; Martellucci, S.; Mattei, V.; Vitali, M.; Avino, P. Evaluation of the submicron particles distribution between mountain and urban site: Contribution of the transportation for defining environmental and human health issues. Int. J. Environ. Res. Public Health 2019, 16, 1339. [Google Scholar] [CrossRef] [Green Version]
  14. Febo, A.; Guglielmi, F.; Manigrasso, M.; Ciambottini, V.; Avino, P. Local air pollution and long–range mass transport of atmospheric particulate matter: A comparative study of the temporal evolution of the aerosol size fractions. Atmos. Pollut. Res. 2010, 1, 141–146. [Google Scholar] [CrossRef] [Green Version]
  15. Manigrasso, M.; Febo, A.; Guglielmi, F.; Ciambottini, V.; Avino, P. Relevance of aerosol size spectrum analysis as support to qualitative source apportionment studies. Environ. Pollut. 2012, 170, 43–51. [Google Scholar] [CrossRef] [PubMed]
  16. Lu, X.; Chen, Y.; Huang, Y.; Lin, C.; Li, Z.; Fung, J.C.H.; Lau, A.K.H. Differences in concentration and source apportionment of PM 2.5 between 2006 and 2015 over the PRD region in southern China. Sci. Total Environ. 2019, 673, 708–718. [Google Scholar] [CrossRef] [PubMed]
  17. Li, J.; Han, X.; Jin, M.; Zhang, X.; Wang, S. Globally analysing spatiotemporal trends of anthropogenic PM2.5 concentration and population’s PM2.5 exposure from 1998 to 2016. Environ. Int. 2019, 128, 46–62. [Google Scholar] [CrossRef] [PubMed]
  18. Ďurčanská, D.; Jandačka, D. Chemical composition of PM10, PM2.5, PM1 and influence of meteorological conditions on them in Zilina selfgoverning region, Slovakia. Solid State Phenom. 2016, 244, 171–181. [Google Scholar]
  19. Avino, P.; Brocco, D.; Lepore, L.; Pareti, S. Interpretation of atmospheric pollution phenomena in relationship with the vertical atmospheric remixing by means of natural radioactivity measurements (radon) of particulate matter. Ann. Chim. Rome 2003, 93, 589–594. [Google Scholar]
  20. European Union. Directive 98/69/EC of the European Parliament and of the Council of 13 October 1998 Relating to Measures to be Taken against Air Pollution by Emissions from Motor Vehicles and Amending Council Directive 70/220/EEC. Available online: https://eur-lex.europa.eu/legal-content/EN/ALL/?uri=CELEX:31998L0069 (accessed on 16 April 2020).
  21. European Union. Directive 2002/51/EC of the European Parliament and of the Council of 19 July 2002 on the Reduction of the Level of Pollutant Emissions from Two- and Three-Wheel Motor Vehicles and Amending Directive 97/24/EC. Available online: https://eur-lex.europa.eu/legal-content/EN/ALL/?uri=CELEX:32002L0051 (accessed on 16 April 2020).
  22. European Union. Directive 2002/80/EC of 3 October 2002 Adapting to Technical Progress Council Directive 70/220/EEC Relating to Measures to Be Taken against Air Pollution by Emissions from Motor Vehicles. Available online: https://eur-lex.europa.eu/legal-content/EN/TXT/?uri=CELEX%3A32002L0080 (accessed on 16 April 2020).
  23. European Union. Regulation (EC) No 715/2007 of the European Parliament and of the Council of 20 June 2007 on Type Approval of Motor Vehicles with Respect to Emissions from Light Passenger and Commercial Vehicles (Euro 5 and Euro 6) and on Access to Vehicle Repair and Maintenance Information. Available online: https://eur-lex.europa.eu/legal-content/EN/ALL/?uri=CELEX:32007R0715 (accessed on 16 April 2020).
  24. Marconi, A.; Cattani, G.; Cusano, M.; Ferdinandi, M.; Inglessis, M.; Viviano, G.; Settimo, G.; Forastiere, F. Two-years of fine and ultrafine particles measurements in Rome, Italy. J. Toxicol. Env. Health A 2007, 70, 213–221. [Google Scholar] [CrossRef]
  25. Pushpawela, B.; Jayaratne, R.; Morawska, L. Differentiating between particle formation and growth events in an urban environment. Atmos. Chem. Phys. 2018, 18, 11171–11183. [Google Scholar] [CrossRef] [Green Version]
  26. Perrino, C.; Catrambone, M.; Pietrodangelo, A. Influence of atmospheric stability on the mass concentration and chemical composition of atmospheric particles: A case study in Rome, Italy. Environ. Int. 2008, 34, 621–628. [Google Scholar] [CrossRef]
  27. Avino, P.; Manigrasso, M.; Cuomo, F. Natural radioactivity as an easy and quick parameter for describing the dynamic of the Planetary Boundary Layer. RSC Adv. 2015, 5, 57538–57549. [Google Scholar] [CrossRef]
  28. Charron, A.; Birmili, W.; Harrison, R.M. Fingerprinting particle origins according to their size distribution at a UK rural site. J. Geophys. Res. Atmos. 2008, 113, D07202. [Google Scholar] [CrossRef]
  29. Agus, E.L.; Young, D.T.; Lingard, J.J.N.; Smalley, R.J.; Tate, J.E.; Goodman, P.S.; Tomlin, A.S. Factors influencing particle number concentrations, size distributions and modal parameters at a roof-level and roadside site in Leicester, UK. Sci. Total Environ. 2007, 386, 65–82. [Google Scholar] [CrossRef] [PubMed]
  30. Kumar, P.; Fennell, P.; Symonds, J.; Britter, R. Treatment of losses of ultrafine aerosol particles in long sampling tubes during ambient measurements. Atmos. Environ. 2008, 42, 8819–8826. [Google Scholar] [CrossRef] [Green Version]
  31. Automobile Club d’Italia. Consistency of the Italian Vehicle Fleet at 31/12/2002. Available online: http://www.aci.it/laci/studi-e-ricerche/dati-e-statistiche/autoritratto/autoritratto-2002.html (accessed on 16 April 2020).
  32. 32 Kittelson, D.B. Engines and nanoparticles: A review. J. Aerosol Sci. 1998, 29, 575–588. [Google Scholar] [CrossRef]
  33. Avino, P.; Casciardi, S.; Fanizza, C.; Manigrasso, M. Deep investigation of ultrafine particles in urban air. Aerosol Air Qual. Res. 2011, 11, 654–663. [Google Scholar] [CrossRef] [Green Version]
  34. Woo, K.; Chen, S.D.R.; Pui, D.Y.H.; Mcmurry, P.H. Measurement of Atlanta aerosol size distributions: Observations of ultrafine particle events. Aerosol Sci. Technol. 2001, 34, 75–87. [Google Scholar] [CrossRef]
  35. Shi, J.P.; Evans, D.E.; Khan, A.A.; Harrison, R.M. Sources and concentration of nanoparticles (<10 nm diameter) in the urban atmosphere. Atmos. Environ. 2001, 25, 1193–1202. [Google Scholar] [CrossRef]
  36. Hamed, A.; Joutsensaari, J.; Mikkonen, S.; Sogacheva, L.; Dal Maso, M.; Kulmala, M.; Cavalli, F.; Fuzzi, S.; Facchini, M.C.; Decesari, S.; et al. Nucleation and growth of new particles in Po Valley, Italy. Atmos. Chem. Phys. 2007, 7, 355–376. [Google Scholar] [CrossRef] [Green Version]
  37. Settimo, G.; Manigrasso, M.; Avino, P. Indoor air quality: A focus on the European legislation and state-of-the-art research in Italy. Atmosphere 2020, 11, 370. [Google Scholar] [CrossRef] [Green Version]
  38. Vecchi, R.; Piziali, F.A.; Valli, G.; Favaron, M.; Bernardoni, V. Radon-based estimates of equivalent mixing layer heights: A long-term assessment. Atmos. Environ. 2019, 197, 150–158. [Google Scholar] [CrossRef]
  39. Salzano, R.; Pasini, A.; Casasanta, G.; Cacciani, M.; Perrino, C. Quantitative interpretation of air radon progeny fluctuations in terms of stability conditions in the atmospheric boundary layer. Bound. Layer Meteorol. 2016, 160, 529–550. [Google Scholar] [CrossRef]
  40. Salzano, R.; Pasini, A.; Ianniello, A.; Mazzola, M.; Traversi, R.; Udisti, R. High time-resolved radon progeny measurements in the Arctic region (Svalbard islands, Norway): Results and potentialities. Atmos. Chem. Phys. 2018, 18, 6959–6969. [Google Scholar] [CrossRef] [Green Version]
  41. Acker, K.; Febo, A.; Trick, S.; Perrino, C.; Bruno, P.; Wiesen, P.; Möller, D.; Wieprecht, W.; Auel, R.; Giusto, M.; et al. Nitrous acid in the urban area of Rome. Atmos. Environ. 2006, 40, 3123–3133. [Google Scholar] [CrossRef]
  42. Avino, P.; Manigrasso, M. Ten-year measurements of gaseous pollutants in urban air by an open-path analyzer. Atmos. Environ. 2008, 42, 4138–4148. [Google Scholar] [CrossRef]
  43. Costabile, F.; Alas, H.; Aufderheide, M.; Avino, P.; Amato, F.; Argentini, S.; Barnaba, F.; Berico, M.; Bernardoni, V.; Biondi, R.; et al. First results of the “Carbonaceous Aerosol in Rome and Environs (CARE)” experiment: Beyond current standards for PM10. Atmosphere 2017, 8, 249. [Google Scholar] [CrossRef] [Green Version]
  44. Kulmala, M.; Kerminen, V.M.; Petäjä, T.; Ding, A.J.; Wang, L. Atmospheric gas-to-particle conversion: Why NPF events are observed in megacities? Faraday Discuss. 2017, 200, 271–288. [Google Scholar] [CrossRef]
  45. Monod, A.; Sive, B.C.; Avino, P.; Chen, T.; Blake, D.R.; Rowland, R.F. Monoaromatic compounds in ambient air of various cities: A focus on correlations between the xylenes and ethylbenzene. Atmos. Environ. 2001, 35, 135–149. [Google Scholar] [CrossRef] [Green Version]
  46. Koppmann, R.; von Czapiewski, K.; Reid, J.S. A review of biomass burning emissions, part I: Gaseous emissions of carbon monoxide, methane, volatile organic compounds, and nitrogen containing compounds. Atmos. Chem. Phys. Discuss. 2005, 5, 10455–10516. [Google Scholar] [CrossRef] [Green Version]
  47. Manigrasso, M.; Avino, P. Fast evolution of urban ultrafine particles: Implications for deposition doses in the human respiratory system. Atmos. Environ. 2012, 51, 116–123. [Google Scholar] [CrossRef]
  48. Fanizza, C.; De Berardis, B.; Ietto, F.; Soggiu, M.E.; Schirò, R.; Inglessis, M.; Ferdinandi, M.; Incoronato, F. Analysis of major pollutants and physico-chemical characteristics of PM2.5 at an urban site in Rome. Sci. Total Environ. 2018, 616–617, 1457–1468. [Google Scholar] [CrossRef]
  49. Stabile, L.; Buonanno, G.; Avino, P.; Frattolillo, A.; Guerriero, E. Indoor exposure to particles emitted by biomass-burning heating systems and evaluation of dose and lung cancer risk received by population. Environ. Pollut. 2018, 235, 65–73. [Google Scholar] [CrossRef] [PubMed]
  50. Soggiu, M.E.; Inglessis, M.; Gagliardi, R.V.; Settimo, G.; Marsili, G.; Notardonato, I.; Avino, P. PM10 and PM2.5 qualitative source apportionment using selective wind direction sampling in a port-industrial area in Civitavecchia, Italy. Atmosphere 2020, 11, 94. [Google Scholar] [CrossRef] [Green Version]
  51. Manigrasso, M.; Vitali, M.; Protano, C.; Avino, P. Temporal evolution of ultrafine particles and of alveolar deposited surface area from main indoor combustion and non-combustion sources in a model room. Sci. Total Environ. 2017, 598, 1015–1026. [Google Scholar] [CrossRef] [PubMed]
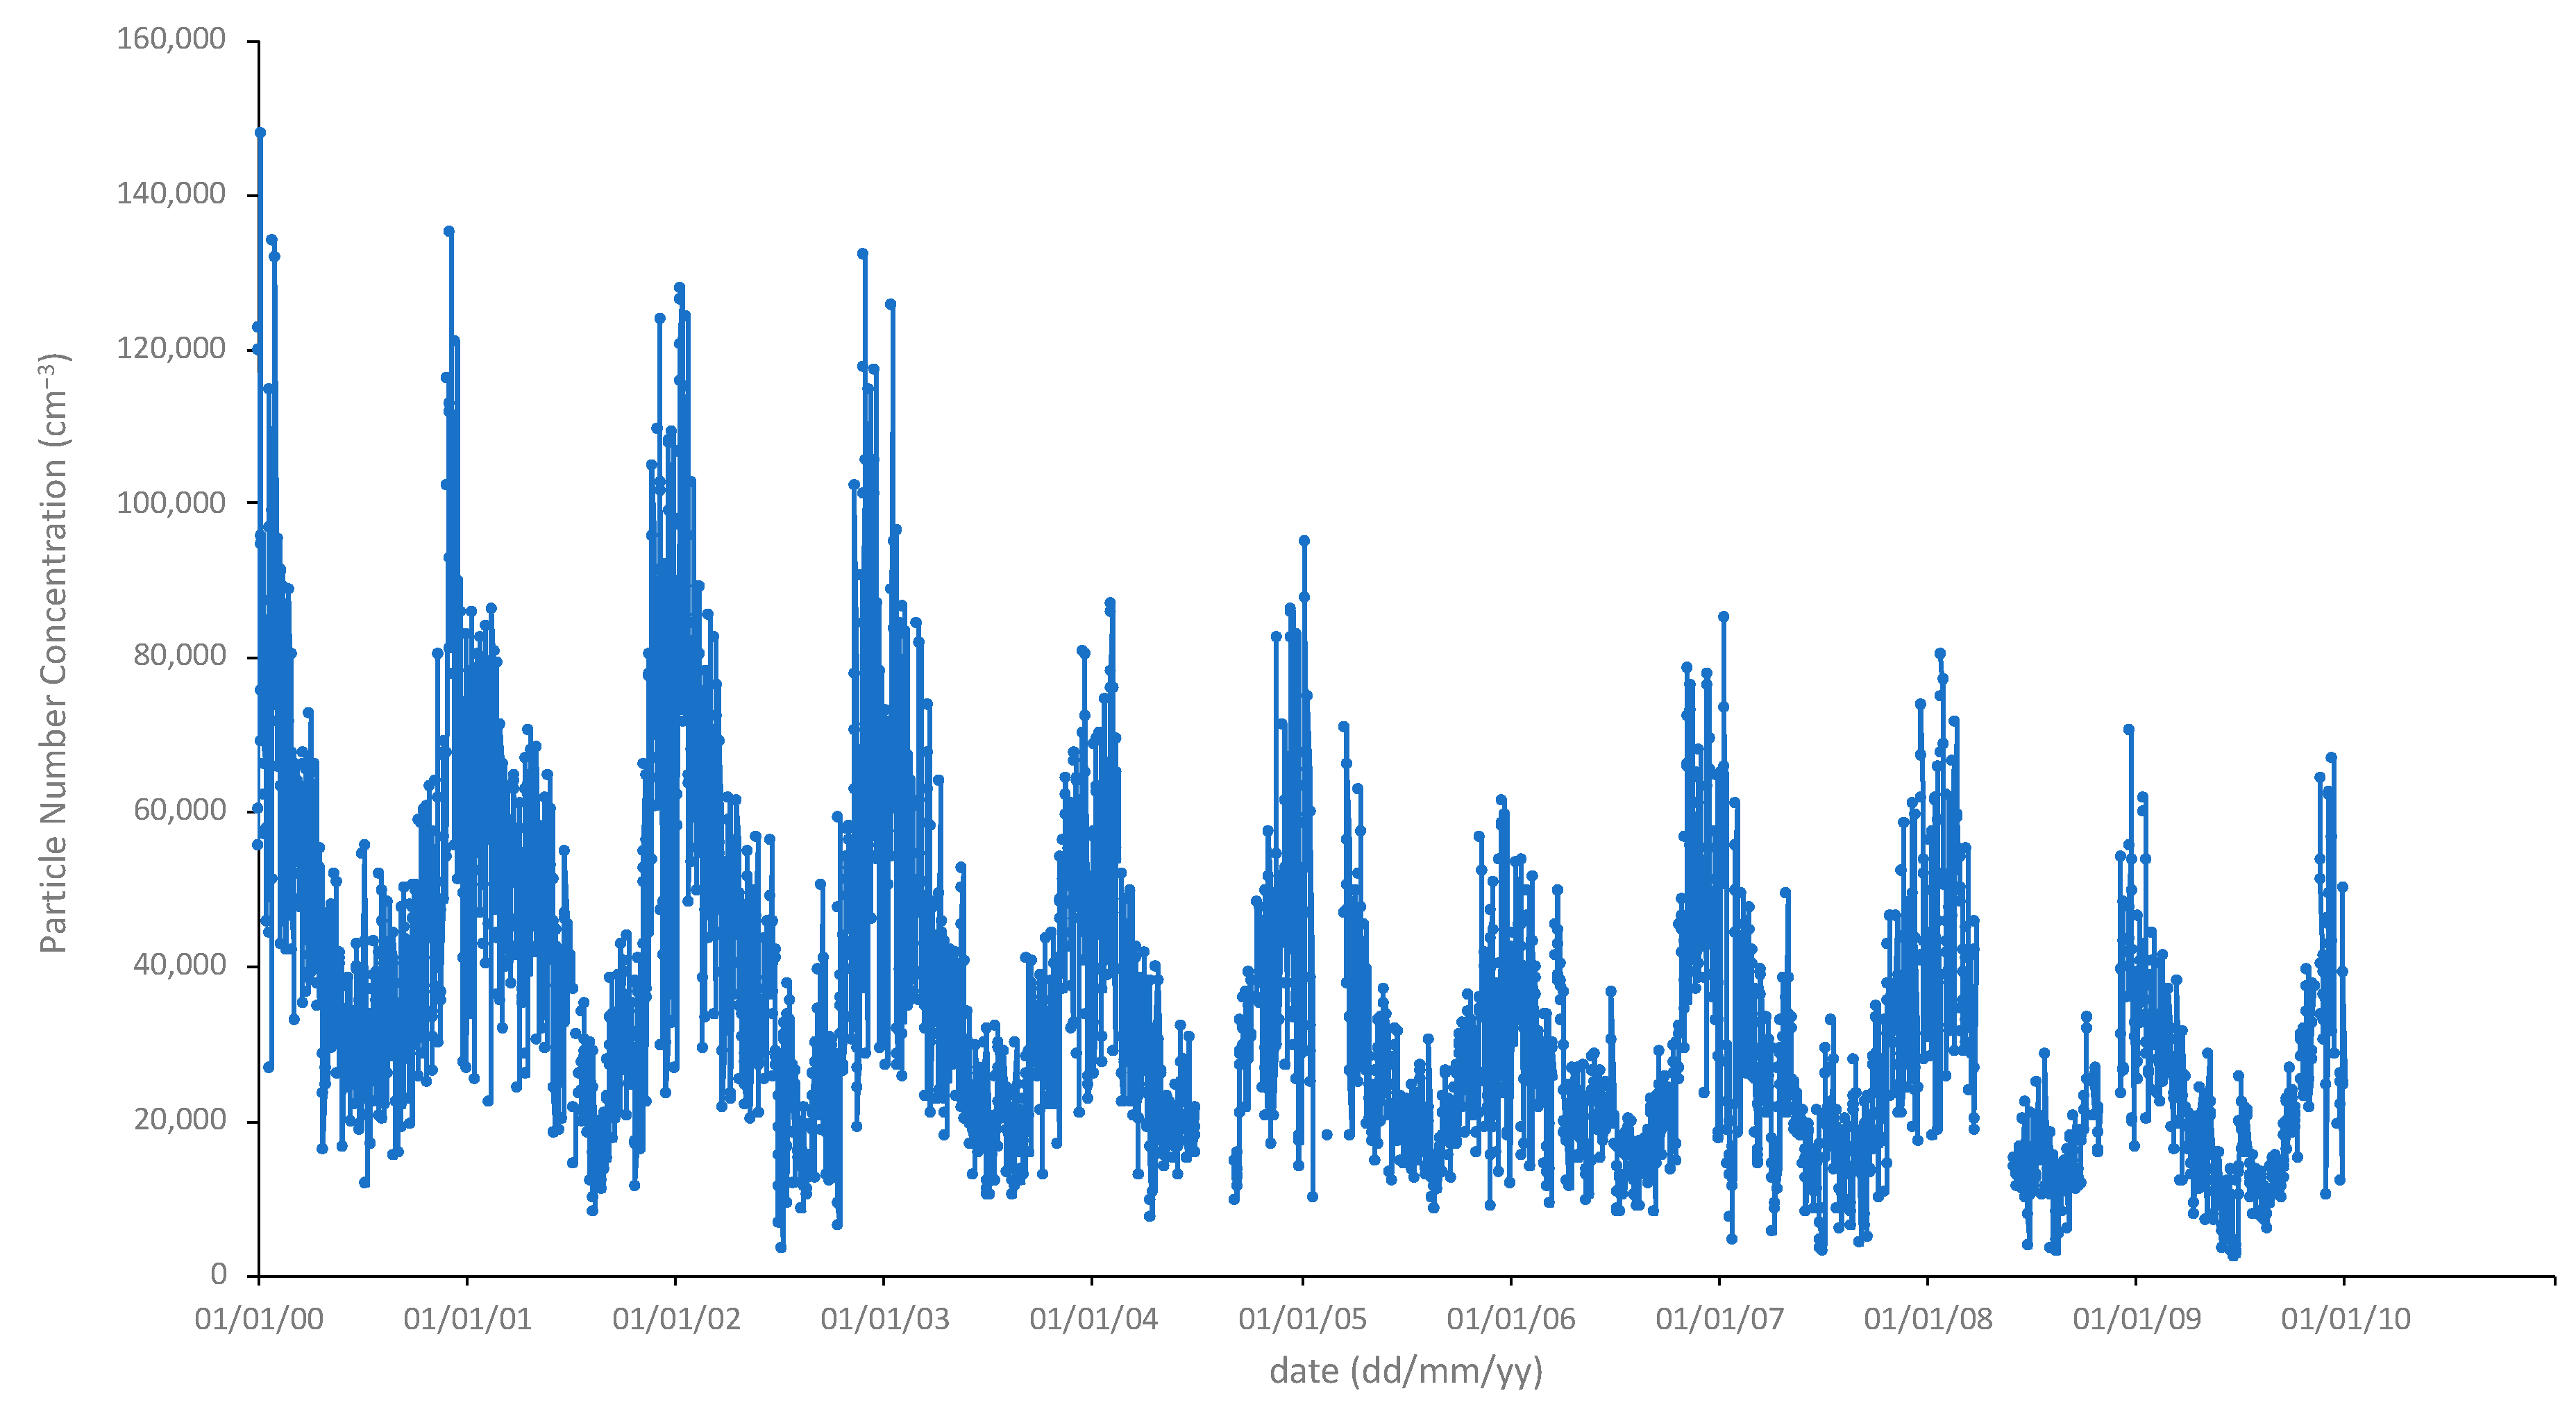
Figure 1. Particle number concentration (PNC) (cm−3) trend during the previous decade. Each point represents a daily value.
Atmosphere 11 00894 g001
Figure 2. Particle number concentration (PNC) (cm−3) in the range 18–750 nm in (a) October and in December (b). Each point represents an hourly value.
Atmosphere 11 00894 g002
Figure 3. Typical daily behavior of the particle number concentrations during the workday and weekend in (a) October and (b) December in downtown Rome.
Atmosphere 11 00894 g003
Figure 4. Daily behavior of the different fraction sizes in the range 18–750 nm over the whole investigated period (C1: 17.8 nm; C2: 23.7 nm; C3: 31.6 nm; C4: 42.2 nm; C5: 56.2 nm; C6: 75.0 nm; C7: 100.0 nm; C8: 133.4 nm; C9: 177.8 nm; C10: 237.1 nm; C11: 316.2 nm; C12: 422.7 nm; C13: 562.2 nm).
Atmosphere 11 00894 g004
Figure 5. Typical UFP trends during the workday (a,c) and weekend (b,d) in October and December, respectively.
Atmosphere 11 00894 g005
Figure 6. Cluster analysis related to the size fractions of a typical day over all the period.
Atmosphere 11 00894 g006
Figure 7. Principal Component Analysis (PCA) of a typical week in October (a) and December (b). Component 1: nucleation mode; Component 2: accumulation mode.
Atmosphere 11 00894 g007
Table 1. Particle levels (cm−3) in the range 18–750 nm (13 channels).
Sizes.d. 1Min–Maxcv% 275th perc. 390th perc. 395th perc. 3
Hourly73,761 ± 54,9243752–279,46674.6100,066150,699194,283
single channel (nm) during the whole period
17.83667 ± 2671217–23,30372.9487673418714
23.76833 ± 5186418–30,84575.9913513,66016,993
31.68186 ± 6162596–38,70875.310,53216,46820,836
42.29007 ± 6534398–40,04872.511,70018,46822,586
56.210,331 ± 8023277–56,95477.713,48021,35527,886
75.011,026 ± 9608248–56,95487.114,40923,80831,536
100.010,294 ± 9847276–56,55895.713,22724,37631,581
133.47499 ± 7402205–41,76298.7950318,80723,240
177.84224 ± 409597–26,55996.9538210,50013,393
237.11821 ± 171341–13,80294.1235942155625
316.2589 ± 54911–506093.279213311757
421.7158 ± 14513–132891.9212342445
562.341 ± 3411–29791.35282107
1 s.d.: standard deviation; 2 cv: coefficient of variation; 3 percentile.
Table 2. Pearson’s correlation among channels in the range 23–750 nm. In italics, the correlations > 0.7.
17.823.731.642.256.275.0100.0133.4177.8237.1316.2422.7562.2
10.9240.8590.7780.6540.5470.4780.4520.4580.4730.4880.5570.58117.8
10.9530.8340.6520.4990.4070.3710.3740.3960.4260.5140.56323.7
10.9350.7670.6080.5090.4650.4620.4820.5130.6010.64731.6
10.9090.7920.7000.6480.6340.6460.6700.7440.76742.2
10.9470.8860.8390.8150.8080.8100.8450.80856.2
10.9820.9510.9250.9060.8870.8820.79675.0
10.9900.9710.9450.9110.8760.756100.0
10.9920.9680.9260.8740.737133.4
10.9880.9500.8930.753177.8
10.9830.9320.812237.1
10.9720.854316.2
10.928422.7
1562.2
Table 3. Linear correlations between particles in the 17.8 nm-size fraction (x-axis) and particles in each other size fraction (y-axis) both during a typical day and during a typical week.
y-Axis (nm)DailyWeekly
Slope (m)Intercept (q)rpSlope (m)Intercept (q)rp
23.72.070−753.440.98686.75 × 10−1920.073−524.610.96145.98 × 10−91
31.62.401−612.940.95772.21 × 10−1323.628−458.990.92374.44 × 10−67
42.22.43489.180.87771.78 × 10−823.569404.290.85122.44 × 10−44
56.22.4081513.600.71967.38 × 10−522.9881969.400.70651.03 × 10−23
75.02.1583116.520.66913.70 × 10−321.1213356.920.66819.66 × 10−12
100.01.6164363.640.46352.25 × 10−216.8244184.430.47031.26 × 10−6
133.40.9873871.820.41324.47 × 10−210.8693540.810.42717.76 × 10−5
177.80.5302274.800.42423.88 × 10−20.5852087.400.43523.73 × 10−5
237.10.244920.930.46802.11 × 10−20.265853.220.47696.33 × 10−7
316.20.092249.600.43117.57 × 10−30.097236.190.43507.99 × 10−10
422.70.03335.860.35824.71 × 10−40.03240.620.44117.97 × 10−17
562.20.0093.610.43484.33 × 10−50.00954.590.41272.37 × 10−23
1 y = mx + q.
Table 4. Ultrafine particle (UFP) levels determined at two sites in Rome in the decade 2000–2010.
UFPss.d. 1Min–Maxcv%75th perc. 295th perc. 2
UFPs (IIH 3)36,395 ± 21,4953295–147,77759.147,25378,003
UFPs (park 4)24,600 ± 11,1001730–48,30045.133,900
1 standard deviation; 2 percentile; 3 Italian Institute of Health; 4 Botanical Garden in Rome (measurements performed between 2001 and 2003).
Table 5. Representation of the cluster analysis during the average week of the entire period (day-hour). The different colors represent the three clusters.
Week
SundayMondayTuesdayWednesdayThursdayFridaySaturday
sun-00mon-00tues-00wed-00thurs-00fri-00sat-00
sun-01mon-01tues-01wed-01thurs-01fri-01sat-01
sun-02mon-02tues-02wed-02thurs-02fri-02sat-02
sun-03mon-03tues-03wed-03thurs-03fri-03sat-03
sun-04mon-04tues-04wed-04thurs-04fri-04sat-04
sun-05mon-05tues-05wed-05thurs-05fri-05sat-05
sun-06mon-06tues-06wed-06thurs-06fri-06sat-06
sun-07mon-07tues-07wed-07thurs-07fri-07sat-07
sun-08mon-08tues-08wed-08thurs-08fri-08sat-08
sun-09mon-09tues-09wed-09thurs-09fri-09sat-09
sun-10mon-10tues-10wed-10thurs-10fri-10sat-10
sun-11mon-11tues-11wed-11thurs-11fri-11sat-11
sun-12mon-12tues-12wed-12thurs-12fri-12sat-12
sun-13mon-13tues-13wed-13thurs-13fri-13sat-13
sun-14mon-14tues-14wed-14thurs-14fri-14sat-14
sun-15mon-15tues-15wed-15thurs-15fri-15sat-15
sun-16mon-16tues-16wed-16thurs-16fri-16sat-16
sun-17mon-17tues-17wed-17thurs-17fri-17sat-17
sun-18mon-18tues-18wed-18thurs-18fri-18sat-18
sun-19mon-19tues-19wed-19thurs-19fri-19sat-19
sun-20mon-20tues-20wed-20thurs-20fri-20sat-20
sun-21mon-21tues-21wed-21thurs-21fri-21sat-21
sun-22mon-22tues-22wed-22thurs-22fri-22sat-22
sun-23mon-23tues-23wed-23thurs-23fri-23sat-23
1 cluster #1, yellow color; cluster #2, red color; cluster 3, blue color.

