Pollution Characteristics, Chemical Compositions, and Population Health Risks during the 2018 Winter Haze Episode in Jianghan Plain, Central China

 ,
,
Abstract
:
1. Introduction
2. Materials and Methods
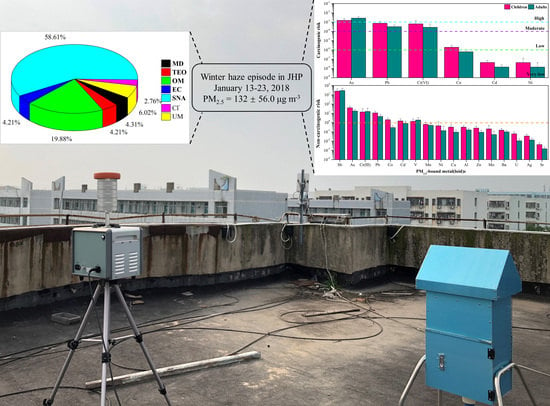
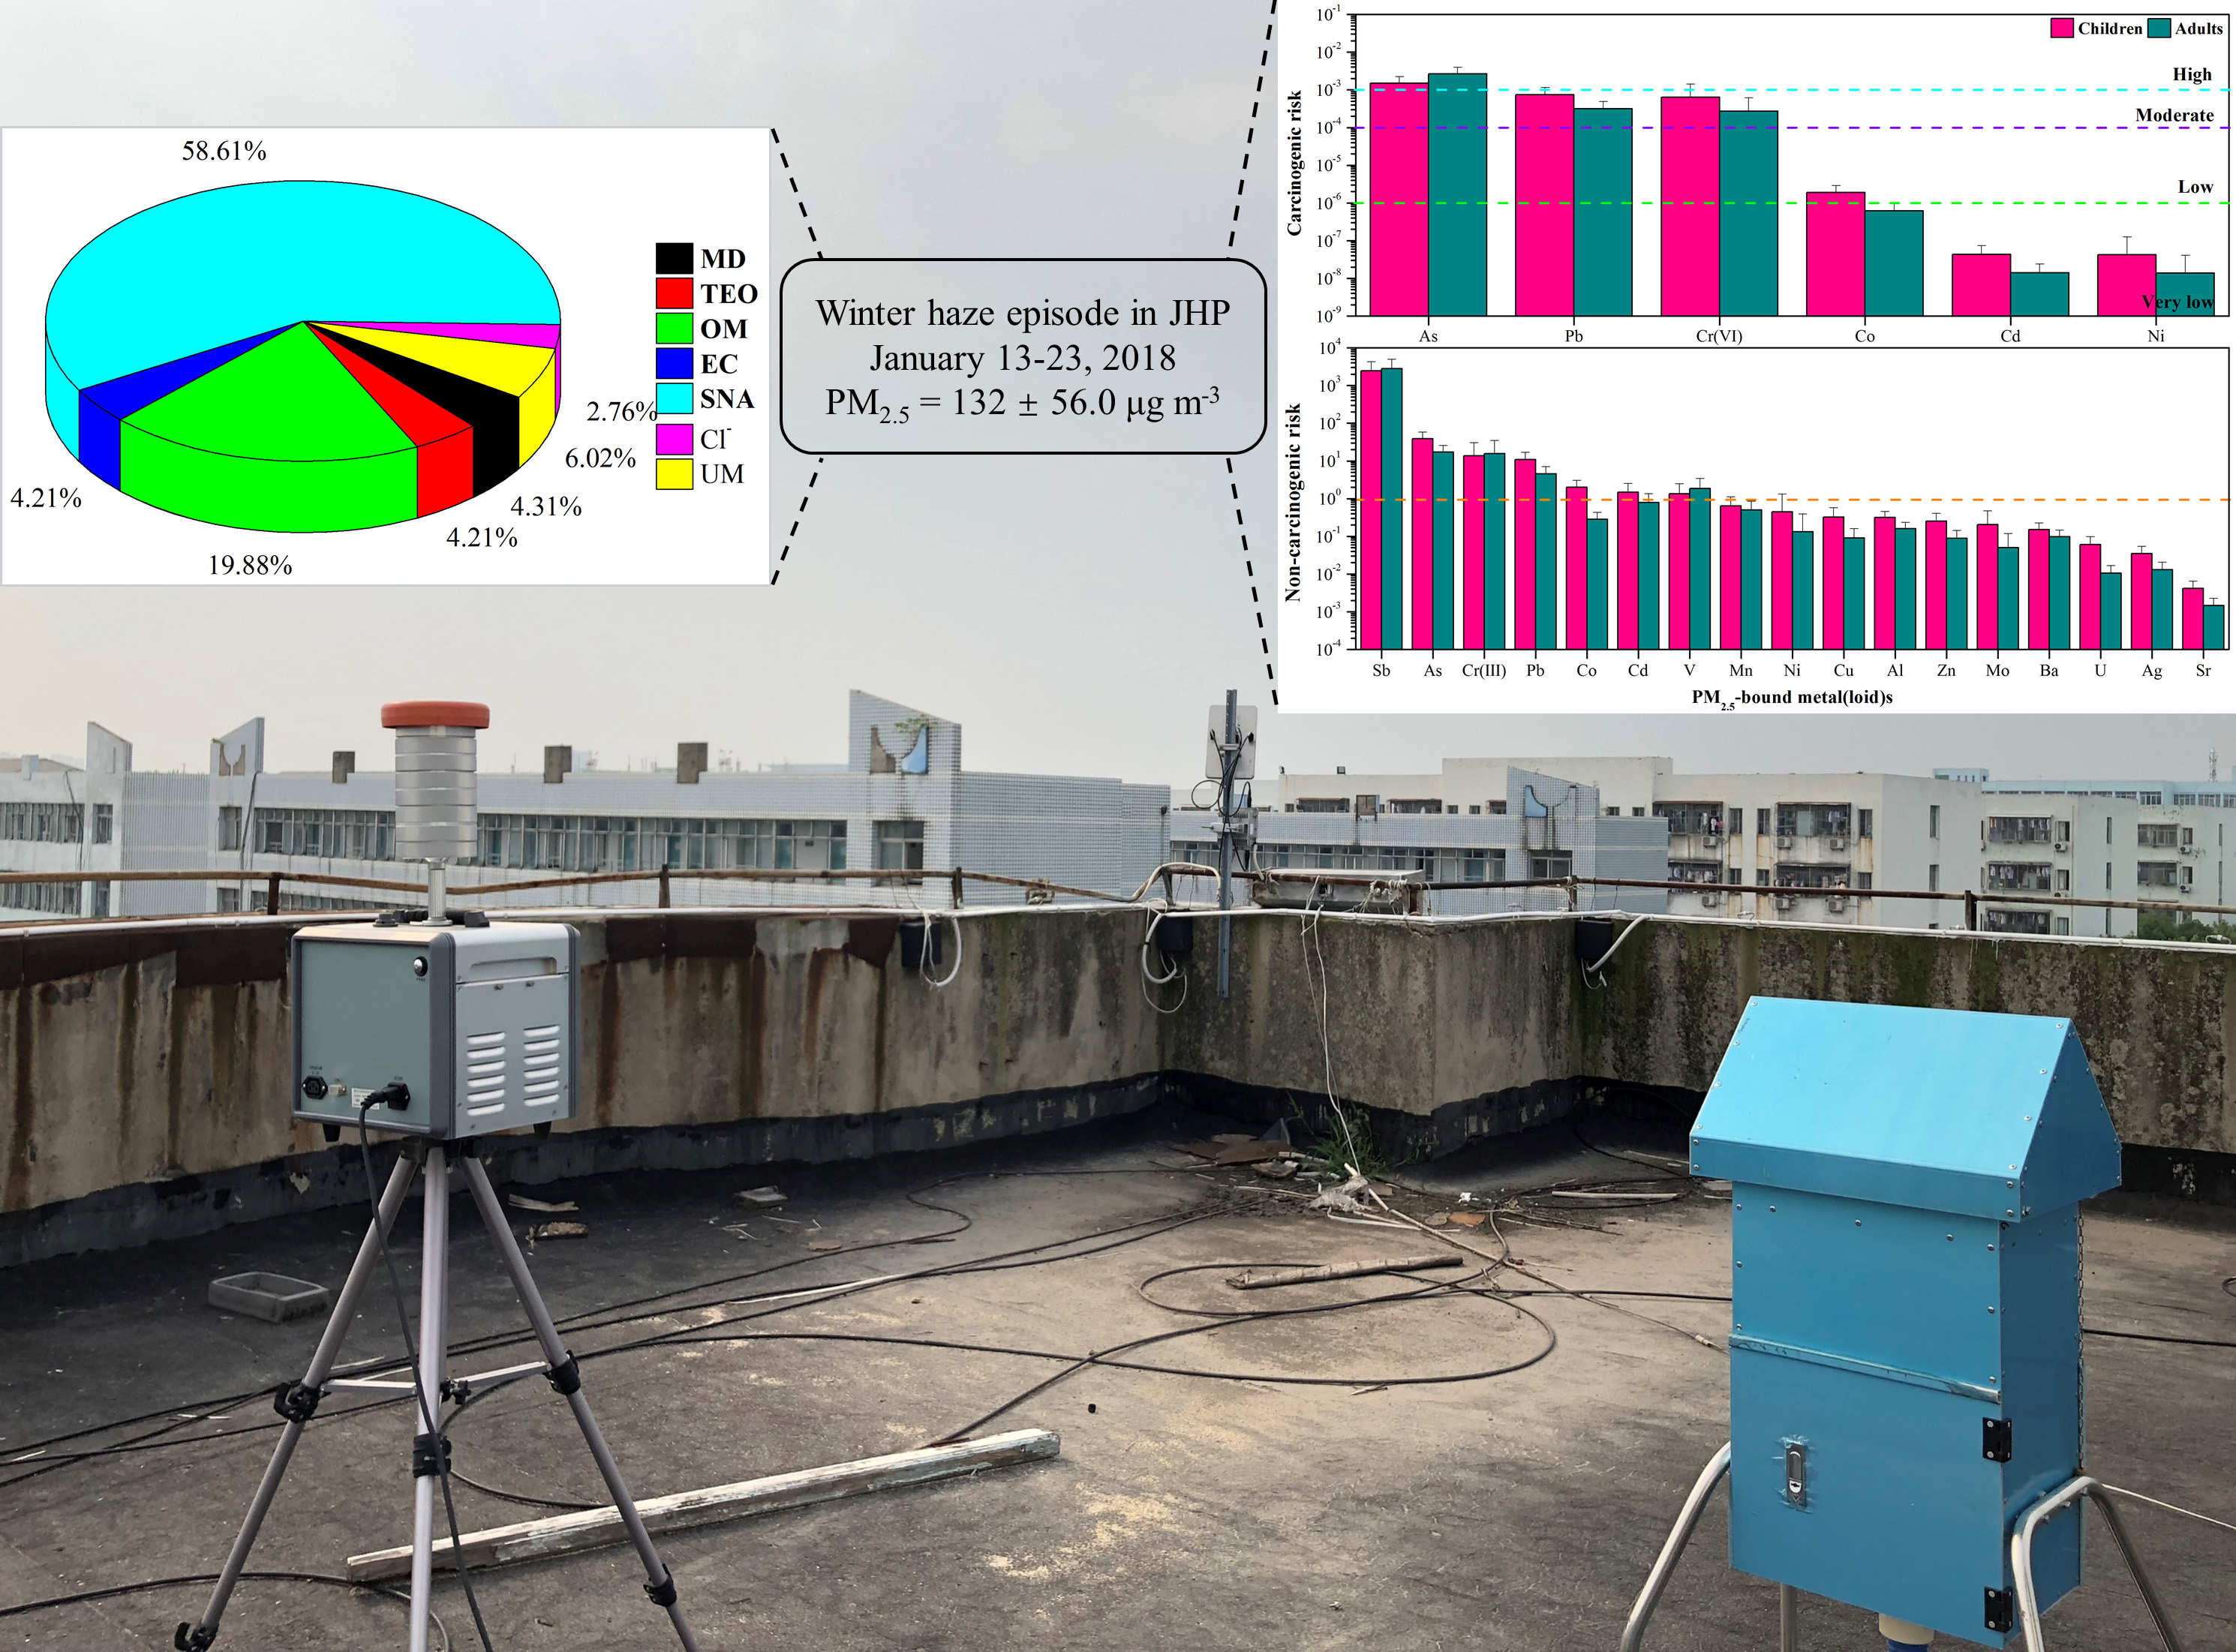
2.1. Field Sampling Campaign
2.2. Chemical Analysis
2.3. Data Analysis Methods
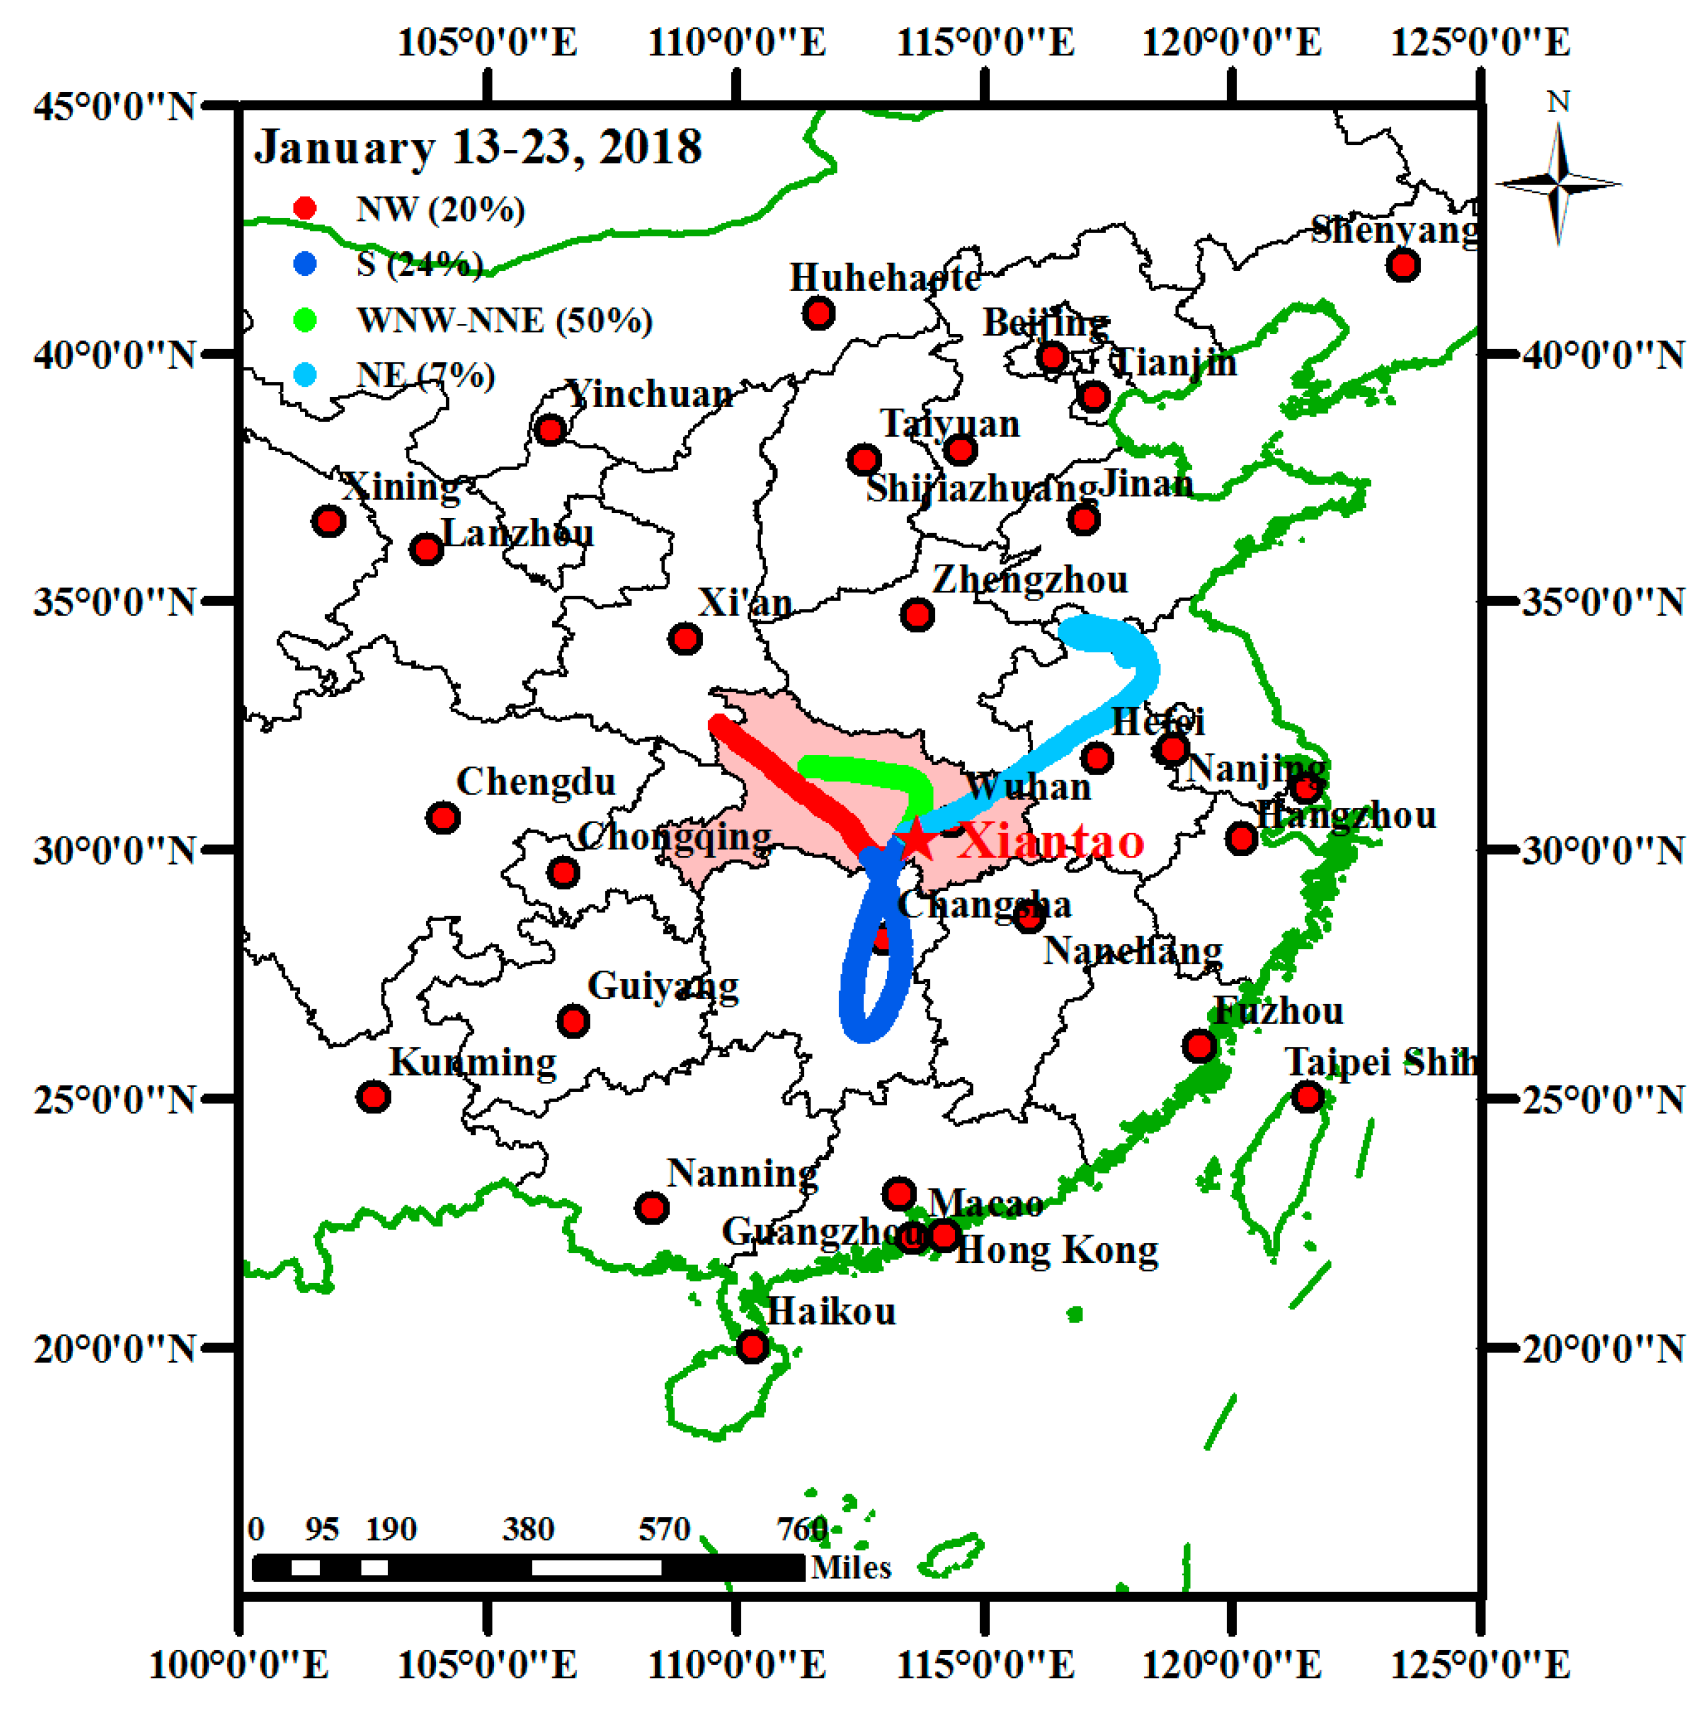
2.3.1. Meteorological Parameters, Trace Gases, and Air Mass Back Trajectory Analysis
2.3.2. Geo-Accumulation Index
2.3.3. Population Exposure Assessment Model
Population Exposure Dose
Population Health Carcinogenic and Non-Carcinogenic Risk
3. Results and Discussion
3.1. PM2.5 Mass Concentrations and Pollution Characteristics
3.2. Chemical Compositions
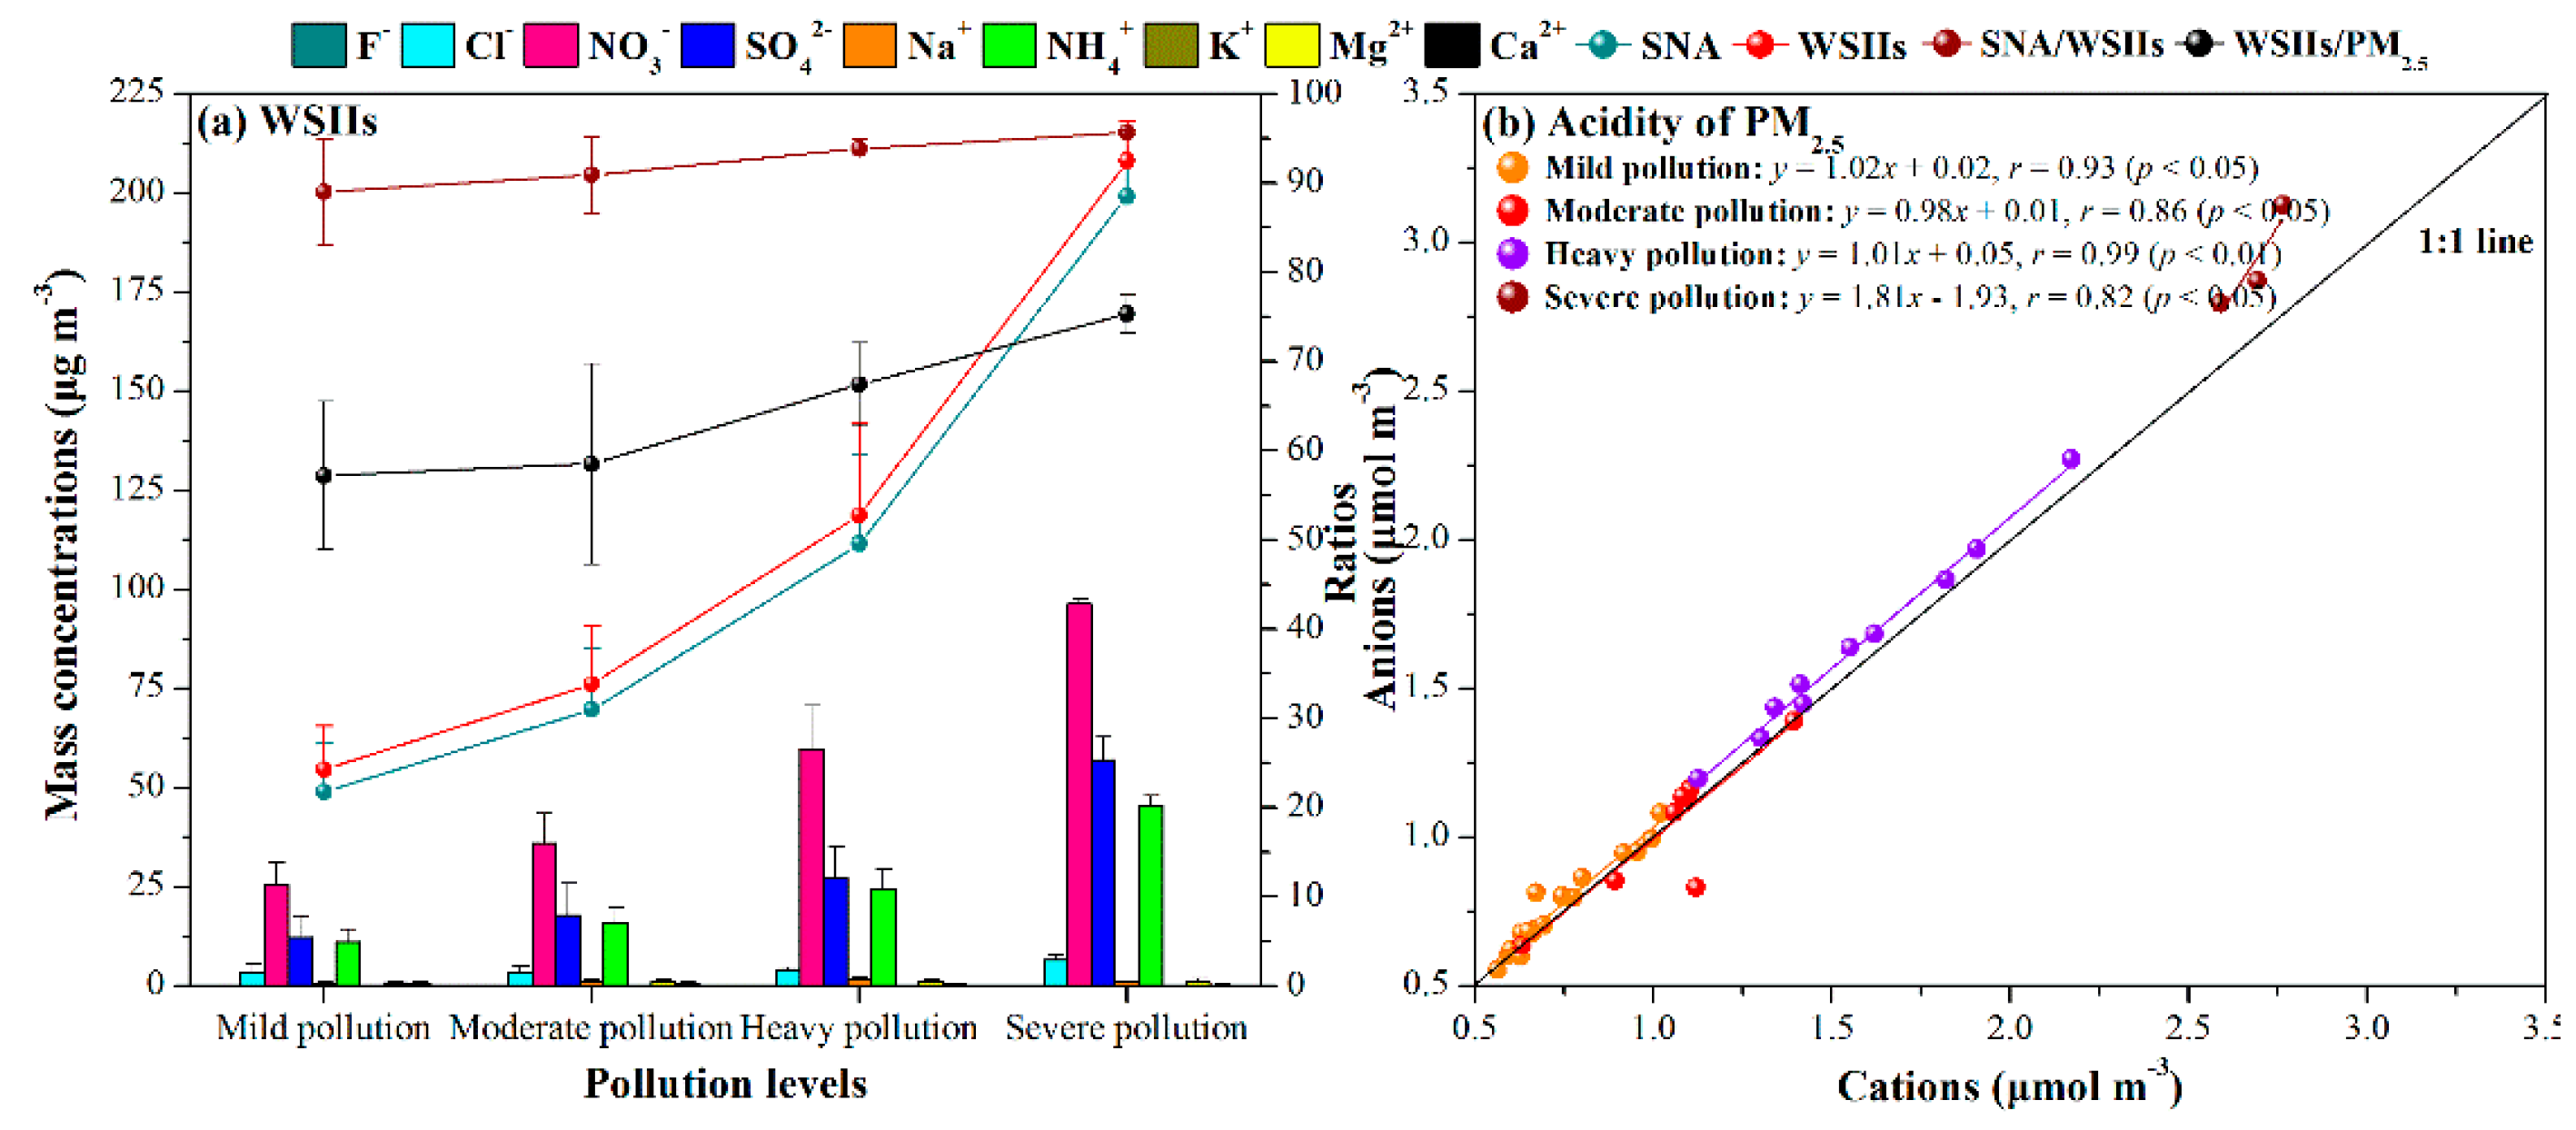
3.2.1. WSIIs
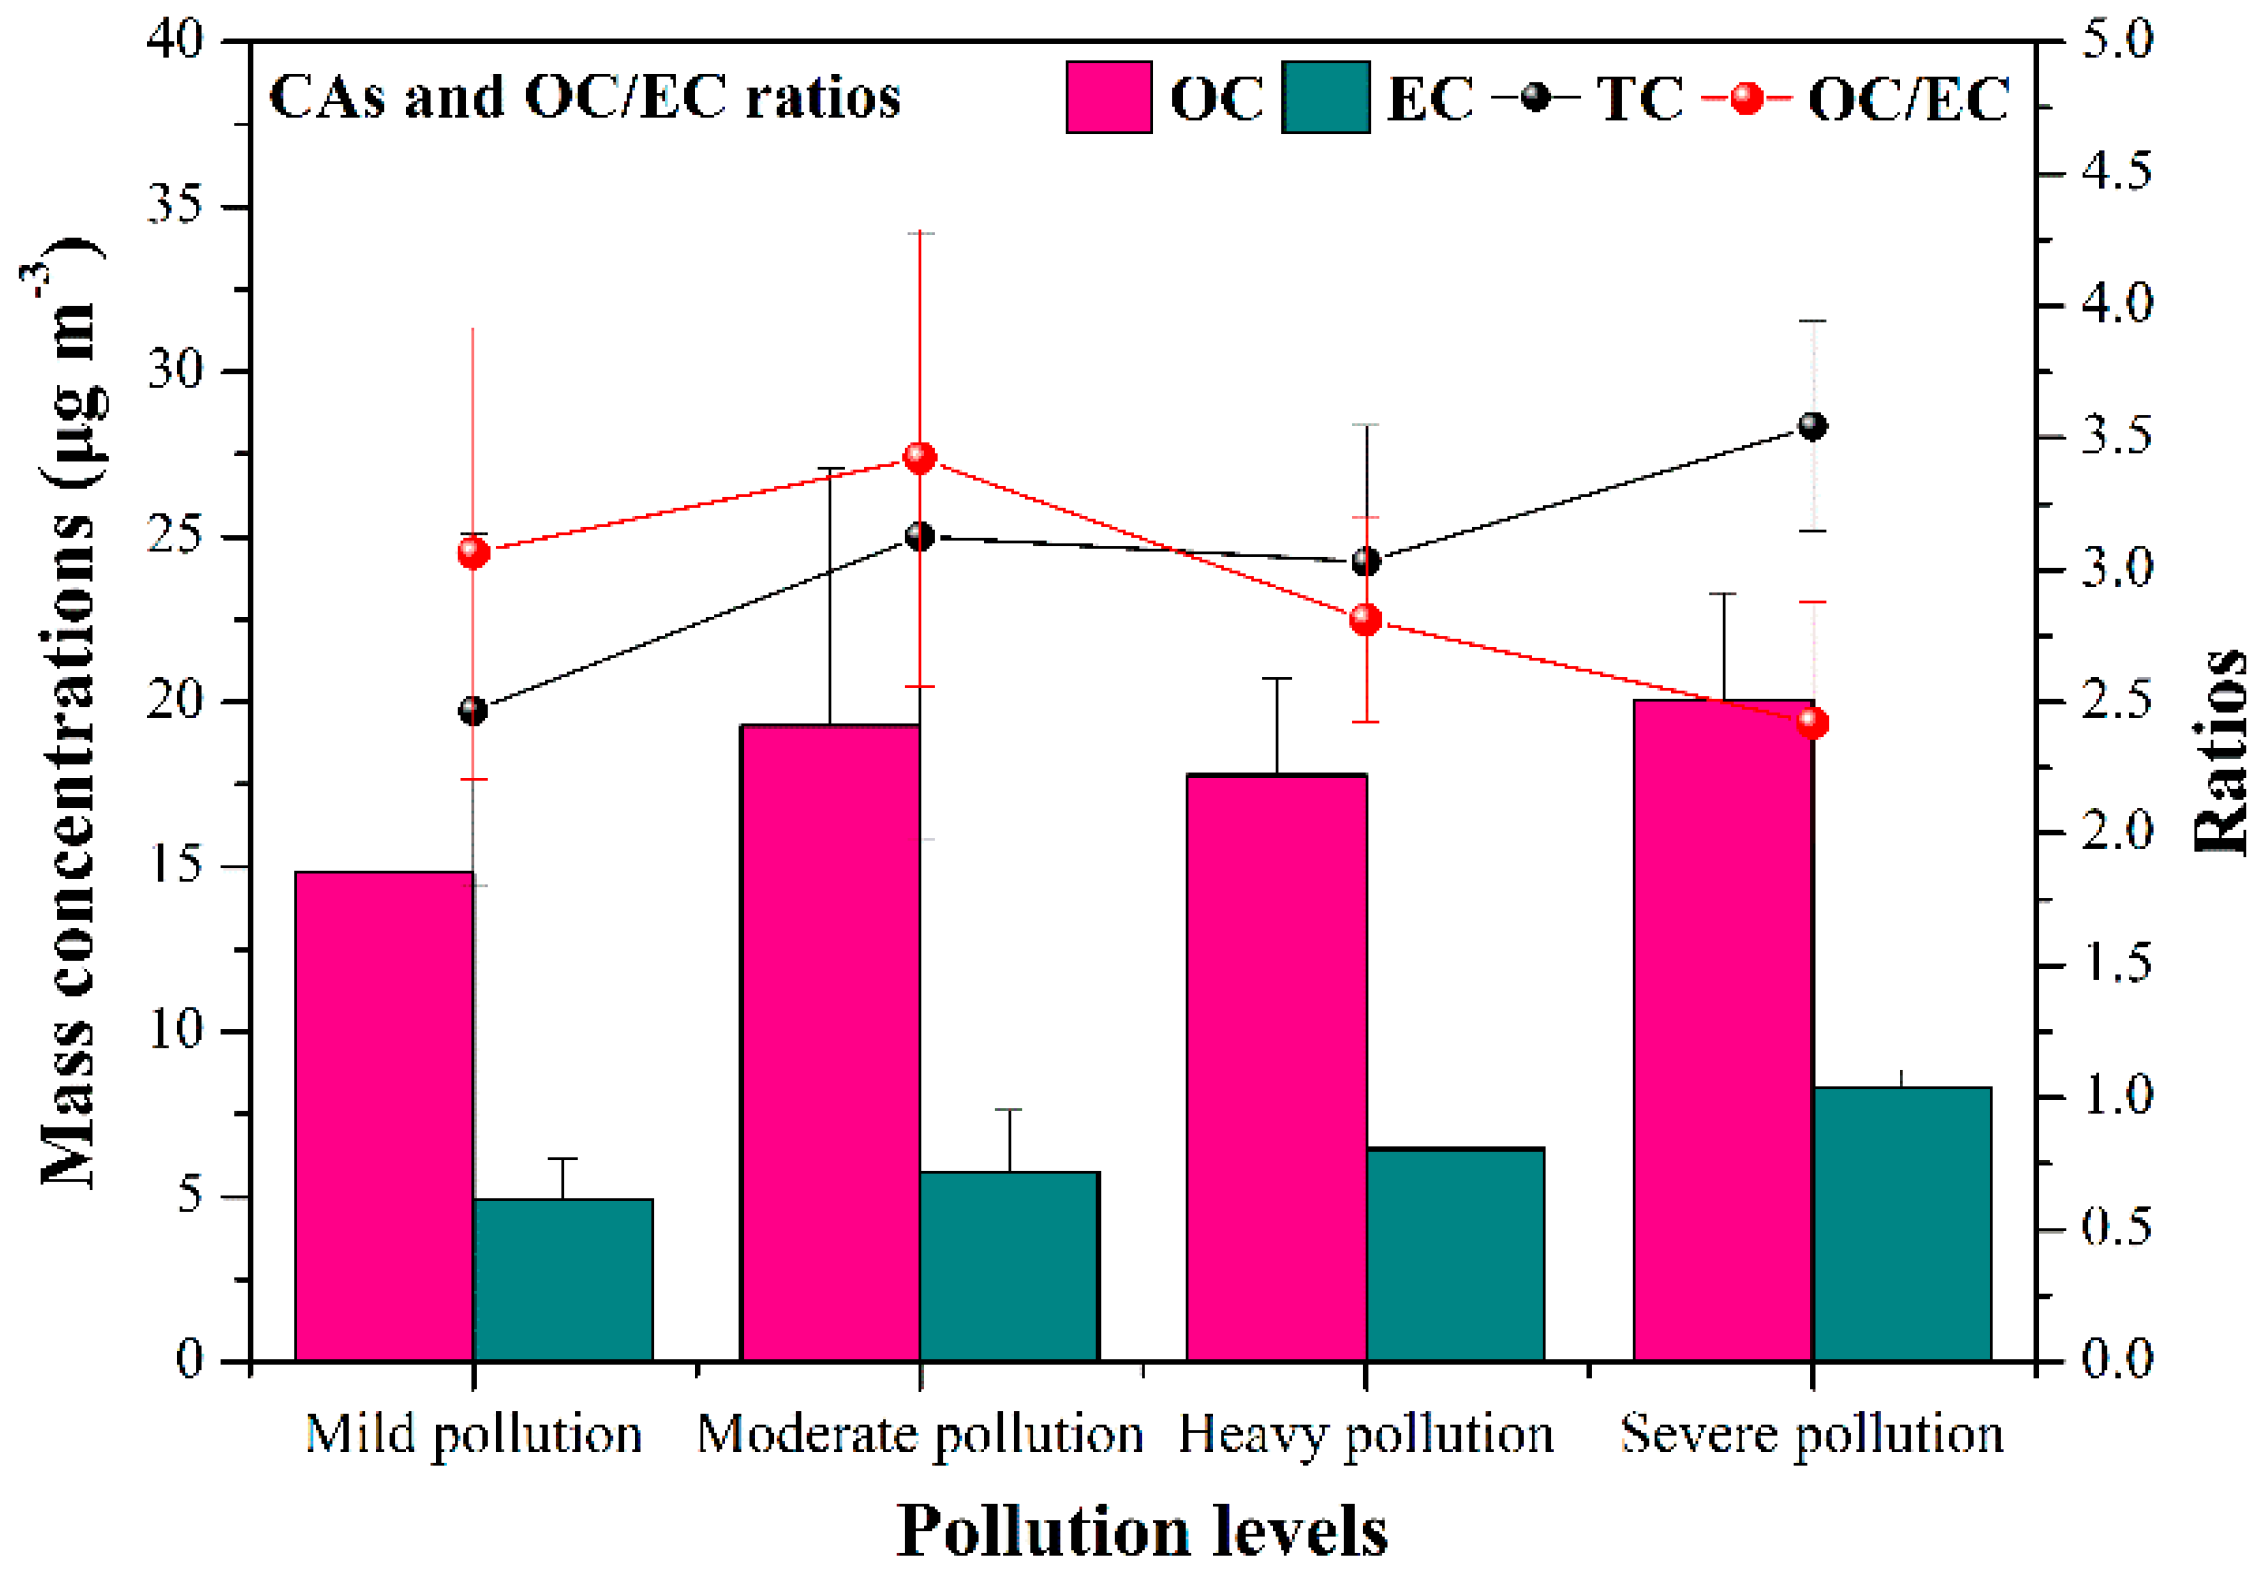
3.2.2. CAs
3.2.3. TE
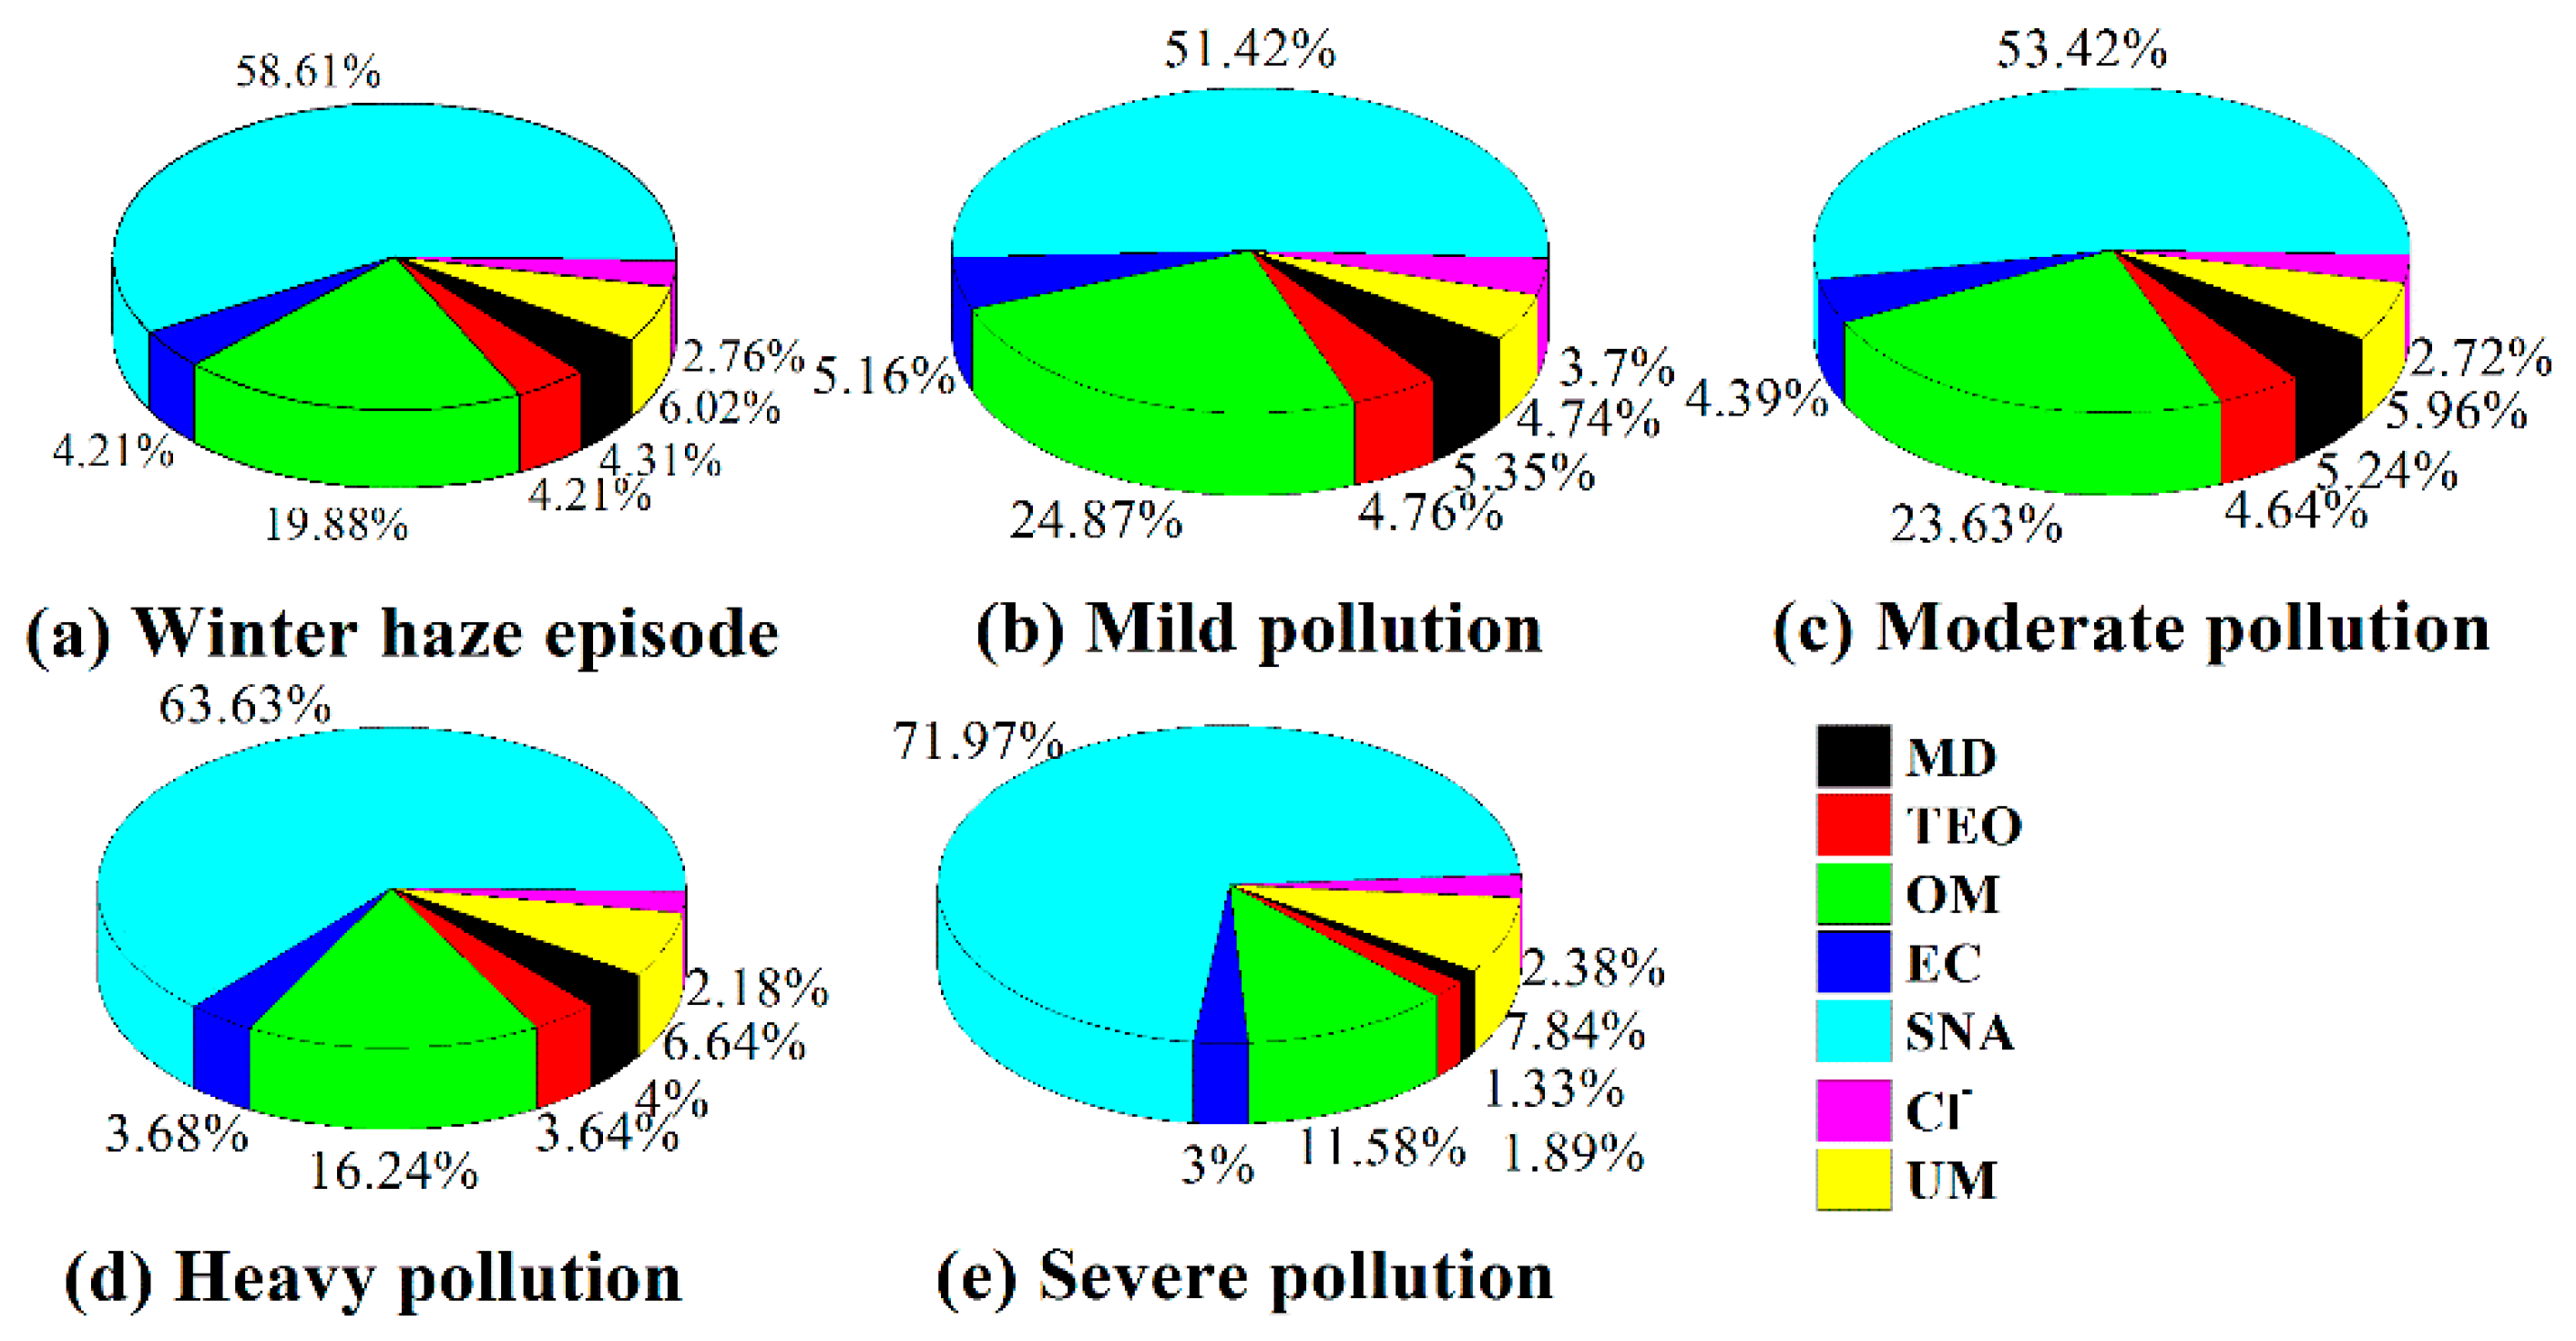
3.3. Chemical Mass Closure
3.4. Population Exposure Assessment
3.4.1. Population Exposure Dose
3.4.2. Population Health Risks
4. Conclusions
Supplementary Materials
Author Contributions
Funding
Acknowledgments
Conflicts of Interest
References
- Sun, Y.; Zhuang, G.; Tang, A.; Wang, Y.; An, Z. Chemical characteristics of PM2.5 and PM10 in haze-fog episodes in Beijing. Environ. Sci. Technol. 2006, 40, 3148–3155. [Google Scholar] [CrossRef] [PubMed]
- Fiore, A.M.; Naik, V.; Spracklen, D.V.; Steiner, A.; Unger, N.; Prather, M.; Bergmann, D.; Cameron-Smith, P.J.; Cionni, I.; Collins, W.J.; et al. Cationic polymers and their therapeutic potential. Chem. Soc. Rev. 2012, 41, 6663–6683. [Google Scholar] [CrossRef] [PubMed] [Green Version]
- Hamra, G.B.; Guha, N.; Cohen, A.; Laden, F.; Raaschou-Nielsen, O.; Samet, J.M.; Vineis, P.; Forastiere, F.; Saldiva, P.; Yorifuji, T.; et al. Outdoor particulate matter exposure and lung cancer: A systematic review and meta-analysis. Environ. Health Perspect. 2014, 122, 906–911. [Google Scholar] [CrossRef] [Green Version]
- Loomis, D.; Grosse, Y.; Lauby-Secretan, B.; El Ghissassi, F.; Bouvard, V.; Benbrahim-Tallaa, L.; Guha, N.; Baan, R.; Mattock, H.; Straif, K. The carcinogenicity of outdoor air pollution. Lancet Oncol. 2013, 14, 1262–1263. [Google Scholar] [CrossRef]
- Hu, X.; Zhang, Y.; Ding, Z.; Wang, T.; Lian, H.; Sun, Y.; Wu, J. Bioaccessibility and health risk of arsenic and heavy metals (Cd, Co, Cr, Cu, Ni, Pb, Zn and Mn) in TSP and PM2.5 in Nanjing, China. Atmos. Environ. 2012, 57, 146–152. [Google Scholar] [CrossRef]
- Zhang, R.; Wang, G.; Guo, S.; Zamora, M.L.; Ying, Q.; Lin, Y.; Wang, W.; Hu, M.; Wang, Y. Formation of Urban Fine Particulate Matter. Chem. Rev. 2015, 115, 3803–3855. [Google Scholar] [CrossRef]
- Cakmak, S.; Dales, R.; Kauri, L.M.; Mahmud, M.; Van Ryswyk, K.; Vanos, J.; Liu, L.; Kumarathasan, P.; Thomson, E.; Vincent, R.; et al. Metal composition of fine particulate air pollution and acute changes in cardiorespiratory physiology. Environ. Pollut. 2014, 189, 208–214. [Google Scholar] [CrossRef] [Green Version]
- Gavett, S.H.; Haykal-Coates, N.; Copeland, L.B.; Heinrich, J.; Gilmour, M.I. Metal composition of ambient PM2.5 influences severity of allergic airways disease in mice. Environ. Health Perspect. 2003, 111, 1471–1477. [Google Scholar] [CrossRef] [Green Version]
- Delfino, R.J.; Staimer, N.; Tjoa, T.; Gillen, D.L.; Polidori, A.; Arhami, M.; Kleinman, M.T.; Vaziri, N.D.; Longhurst, J.; Sioutas, C. Air pollution exposures and circulating biomarkers of effect in a susceptible population: Clues to potential causal component mixtures and mechanisms. Environ. Health Perspect. 2009, 117, 1232–1238. [Google Scholar] [CrossRef]
- Elser, M.; Huang, R.; Wolf, R.; Slowik, J.G.; Wang, Q.; Canonaco, F.; Li, G.; Bozzetti, C.; Daellenbach, K.R.; Huang, Y.; et al. New insights into PM2.5 chemical composition and sources in two major cities in China during extreme haze events using aerosol mass spectrometry. Atmos. Chem. Phys. 2016, 3207–3225. [Google Scholar] [CrossRef] [Green Version]
- Shen, R.; Liu, Z.; Chen, X.; Wang, Y.; Wang, L.; Liu, Y.; Li, X. Atmospheric levels, variations, sources and health risk of PM2.5-bound polycyclic aromatic hydrocarbons during winter over the North China Plain. Sci. Total Environ. 2019, 655, 581–590. [Google Scholar] [CrossRef] [PubMed]
- Xie, Y.; Liu, Z.; Wen, T.; Huang, X.; Liu, J.; Tang, G.; Yang, Y.; Li, X.; Shen, R.; Hu, B.; et al. Characteristics of chemical composition and seasonal variations of PM2.5 in Shijiazhuang, China: Impact of primary emissions and secondary formation. Sci. Total Environ. 2019, 677, 215–229. [Google Scholar] [CrossRef] [PubMed]
- Li, S.; Chang, M.; Li, H.; Cui, X.; Ma, L.Q. Chemosphere Chemical compositions and source apportionment of PM2.5 during clear and hazy days: Seasonal changes and impacts of Youth Olympic Games. Chemosphere 2020, 256, 127163. [Google Scholar] [CrossRef] [PubMed]
- Wei, N.; Xu, Z.; Wang, G.; Liu, W.; Zhouga, D.; Xiao, D.; Yao, J. Source apportionment of carbonaceous aerosols during haze days in Shanghai based on dual carbon isotopes. J. Radioanal. Nucl. Chem. 2019. [Google Scholar] [CrossRef]
- Qu, Y.; Gao, T.; Yang, C. Elemental characterization and source identification of the near-road PM2.5 using EDXRF in Chengdu, China. X-Ray Spectrom. 2019, 48, 232–241. [Google Scholar] [CrossRef]
- Wang, S.; Yin, S.; Zhang, R.; Yang, L.; Zhao, Q.; Zhang, L.; Yan, Q.; Jiang, N.; Tang, X. Insight into the formation of secondary inorganic aerosol based on high-time-resolution data during haze episodes and snowfall periods in Zhengzhou, China. Sci. Total Environ. 2019, 660, 47–56. [Google Scholar] [CrossRef]
- Liu, J.; Li, J.; Vonwiller, M.; Liu, D.; Cheng, H.; Shen, K.; Salazar, G.; Agrios, K.; Zhang, Y.; He, Q.; et al. The importance of non-fossil sources in carbonaceous aerosols in a megacity of central China during the 2013 winter haze episode: A source apportionment constrained by radiocarbon and organic tracers. Atmos. Environ. 2016, 144, 60–68. [Google Scholar] [CrossRef]
- Jiang, H.; Xiao, H.; Song, H.; Liu, J.; Wang, T.; Cheng, H.; Wang, Z. A long-lasting winter haze episode in Xiangyang, Central China: Pollution characteristics, chemical composition, and health risk assessment. Aerosol Air Qual. Res. 2020, 20. [Google Scholar] [CrossRef]
- Qu, C.; Xing, X.; Albanese, S.; Doherty, A.; Huang, H.; Lima, A.; Qi, S.; De Vivo, B. Spatial and seasonal variations of atmospheric organochlorine pesticides along the plain-mountain transect in central China: Regional source vs. long-range transport and air-soil exchange. Atmos. Environ. 2015, 122, 31–40. [Google Scholar] [CrossRef]
- Liu, R.; Ma, Z.; Liu, Y.; Shao, Y.; Zhao, W.; Bi, J. Spatiotemporal distributions of surface ozone levels in China from 2005 to 2017: A machine learning approach. Environ. Int. 2020, 142, 105823. [Google Scholar] [CrossRef]
- Liu, Q.; Baumgartner, J.; Zhang, Y.; Schauer, J.J. Source apportionment of Beijing air pollution during a severe winter haze event and associated pro-inflammatory responses in lung epithelial cells. Atmos. Environ. 2016, 126, 28–35. [Google Scholar] [CrossRef]
- Cheng, H.; Gong, W.; Wang, Z.; Zhang, F.; Wang, X.; Lvy, X.; Liu, J.; Fu, X.; Zhang, G. Ionic composition of submicron particles (PM1.0) during the long-lasting haze period in January 2013 in Wuhan, central China.pdf. J. Environ. Sci. 2014, 26, 810–817. [Google Scholar] [CrossRef]
- Zhang, F.; Cheng, H.R.; Wang, Z.W.; Lv, X.P.; Zhu, Z.M.; Zhang, G.; Wang, X.M. Fine particles (PM2.5) at a CAWNET background site in Central China: Chemical compositions, seasonal variations and regional pollution events. Atmos. Environ. 2014, 86, 193–202. [Google Scholar] [CrossRef]
- Zhang, F.; Wang, Z.W.; Cheng, H.R.; Lv, X.P.; Gong, W.; Wang, X.M.; Zhang, G. Seasonal variations and chemical characteristics of PM2.5 in Wuhan, Central China. Sci. Total Environ. 2015, 518, 97–105. [Google Scholar] [CrossRef] [PubMed]
- Lyu, X.-P.; Wang, Z.-W.; Cheng, H.-R.; Zhang, F.; Zhang, G.; Wang, X.-M.; Ling, Z.-H.; Wang, N. Chemical characteristics of submicron particulates (PM1.0) in Wuhan, Central China. Atmos. Res. 2015, 161, 169–178. [Google Scholar] [CrossRef]
- Cai, K.; Li, C.; Na, S. Spatial Distribution, Pollution Source, and Health Risk Assessment of Heavy Metals in Atmospheric Depositions: A Case Study from the Sustainable City of Shijiazhuang, China. Atmosphere 2019, 10, 222. [Google Scholar] [CrossRef] [Green Version]
- State Environmental Protection Bureau. Background Values of Soil Elements in China, 1st ed.; China Environmental Monitoring Station, Ed.; China Environmental Science Press: Beijing, China, 1990. [Google Scholar]
- Li, N.; Han, W.; Wei, X.; Shen, M.; Sun, S. Chemical characteristics and human health assessment of PM1 during the Chinese Spring Festival in Changchun, Northeast China. Atmos. Pollut. Res. 2019, 10, 1823–1831. [Google Scholar] [CrossRef]
- Massey, D.D.; Kulshrestha, A.; Taneja, A. Particulate matter concentrations and their related metal toxicity in rural residential environment of semi-arid region of India. Atmos. Environ. 2013, 67, 278–286. [Google Scholar] [CrossRef]
- US Environmental Protection Agency. Exposure Factors Handbook: 2011 Edition; US Environmental Protection Agency: Washington, DC, USA, 2011; EPA/600/R-090/052F. [Google Scholar]
- Wang, N.; Zhao, X.; Wang, J.; Yin, B.; Geng, C.; Niu, D. Chemical Composition of PM2.5 and Its Impact on Inhalation Health Risk Evaluation in a City with Light Industry in Central China. Atmosphere 2020, 11, 340. [Google Scholar] [CrossRef] [Green Version]
- Griselda, J.; Mar, R.; Antonio, A.; Guzman, E.; Guarnaccia, C.; Mart, S.; Lara, C.; Rangel, M.; Hern, G.; Lozada, C.; et al. Trace Metal Content and Health Risk Assessment of PM10 in an Urban Environment of León, Mexico. Atmosphere 2019, 10, 573. [Google Scholar] [CrossRef] [Green Version]
- International Agency for Research on Cancer. Agents Classified by the IARC Monographs; World Health Organization: Geneva, Switzerland, 2020; Volume 1-116. [Google Scholar]
- Roy, D.; Singh, G.; Seo, Y.C. Carcinogenic and non-carcinogenic risks from PM10- and PM2.5-Bound metals in a critically polluted coal mining area. Atmos. Pollut. Res. 2019, 10, 1964–1975. [Google Scholar] [CrossRef]
- Xue, H.; Liu, G.; Zhang, H.; Hu, R.; Wang, X. Similarities and differences in PM10 and PM2.5 concentrations, chemical compositions and sources in Hefei City, China. Chemosphere 2019, 220, 760–765. [Google Scholar] [CrossRef]
- Mao, Y.; Hu, T.; Shi, M.; Cheng, C.; Liu, W.; Zhang, J. PM2.5-bound PAHs during a winter haze episode in a typical mining city, central China: Characteristics, influencing parameters, and sources. Atmos. Pollut. Res. 2020, 11, 131–140. [Google Scholar] [CrossRef]
- Giorgiana Galon-Negru, A.; Iulian Olariu, R.; Arsene, C. Chemical characteristics of size-resolved atmospheric aerosols in Iasi, north-eastern Romania: Nitrogen-containing inorganic compounds control aerosol chemistry in the area. Atmos. Chem. Phys. 2018, 18, 5879–5904. [Google Scholar] [CrossRef] [Green Version]
- Akyüz, M.; Çabuk, H. Meteorological variations of PM2.5/PM10 concentrations and particle-associated polycyclic aromatic hydrocarbons in the atmospheric environment of Zonguldak, Turkey. J. Hazard. Mater. 2009, 170, 13–21. [Google Scholar] [CrossRef] [PubMed]
- Modaihsh, A.S.; Al-Barakah, F.N.; Nadeem, M.E.A.; Mahjoub, M.O. Spatial and Temporal Variations of the Particulate Matter in Riyadh City, Saudi Arabia. J. Environ. Prot. 2015, 6, 1293–1307. [Google Scholar] [CrossRef] [Green Version]
- Zhong, S.; Zhang, L.; Jiang, X.; Gao, P. Comparison of chemical composition and airborne bacterial community structure in PM2.5 during haze and non-haze days in the winter in Guilin, China. Sci. Total Environ. 2019, 655, 202–210. [Google Scholar] [CrossRef] [PubMed]
- Khanna, I.; Khare, M.; Gargava, P.; Khan, A.A. Effect of PM2.5 chemical constituents on atmospheric visibility impairment.pdf. J. Air Waste Manag. Assoc. 2018, 68, 430–437. [Google Scholar] [CrossRef] [Green Version]
- Chow, J.C.; Fujita, E.M.; Watson, J.G.; Lu, Z.; Lawson, D.R. Evaluation of Filter-based Aerosol Measurements During the 1987 Southern California Air Quality Study. Environ. Monit. Assess. 1994, 87, 49–80. [Google Scholar] [CrossRef]
- Wang, Y.; Zhuang, G.; Tang, A.; Yuan, H.; Sun, Y.; Chen, S.; Zheng, A. The ion chemistry and the source of PM2.5 aerosol in Beijing. Atmos. Environ. 2005, 39, 3771–3784. [Google Scholar] [CrossRef]
- Arimoto, R.; Duce, R.A.; Savoie, D.L.; Prospero, J.M.; Talbot, R.; Cullen, J.D.; Tomza, U.; Lewis, N.F.; Ray, B.J. Relationships among aerosol constituents from Asia and the North pacific during PEM-West A. J. Geophys. Res. 1996, 101, 2011–2023. [Google Scholar] [CrossRef]
- Yin, L.; Niu, Z.; Chen, X.; Chen, J.; Zhang, F.; Xu, L. Characteristics of water-soluble inorganic ions in PM2.5 and PM2.5–10 in the coastal urban agglomeration along the Western Taiwan Strait Region, China. Environ. Sci. Pollut. Res. 2014, 21, 5141–5156. [Google Scholar] [CrossRef] [PubMed]
- Yang, S.; Ma, Y.L.; Duan, F.K.; He, K.B.; Wang, L.T.; Wei, Z.; Zhu, L.D.; Ma, T.; Li, H.; Ye, S.Q. Characteristics and formation of typical winter haze in Handan, one of the most polluted cities in China. Sci. Total Environ. 2018, 613–614, 1367–1375. [Google Scholar] [CrossRef] [PubMed]
- Feng, J.; Yu, H.; Mi, K.; Su, X.; Li, Y.; Li, Q.; Sun, J. One year study of PM2.5 in Xinxiang city, North China: Seasonal characteristics, climate impact and source. Ecotoxicol. Environ. Saf. 2018, 154, 75–83. [Google Scholar] [CrossRef]
- Pachauri, T.; Satsangi, A.; Singla, V.; Lakhani, A.; Maharaj Kumari, K. Characteristics and sources of carbonaceous aerosols in PM2.5 during wintertime in Agra, India. Aerosol Air Qual. Res. 2013, 13, 977–991. [Google Scholar] [CrossRef] [Green Version]
- Bressi, M.; Sciare, J.; Ghersi, V.; Mihalopoulos, N.; Petit, J.-E.; Nicolas, J.B.; Moukhtar, S.; Rosso, A.; Féron, A.; Bonnaire, N.; et al. Sources and geographical origins of fine aerosols in Paris (France). Atmos. Chem. Phys. 2014, 14, 8813–8839. [Google Scholar] [CrossRef] [Green Version]
- Mamane, Y.; Perrino, C.; Yossef, O.; Catrambone, M. Source characterization of fine and coarse particles at the East Mediterranean coast. Atmos. Environ. 2008, 42, 6114–6130. [Google Scholar] [CrossRef]
- Zhang, R.; Jing, J.; Tao, J.; Hsu, S.-C.; Wang, G.; Cao, J.; Lee, C.S.L.; Zhu, L.; Chen, Z.; Zhao, Y.; et al. Chemical characterization and source apportionment of PM2.5 in Beijing: Seasonal perspective. Atmos. Chem. Phys. 2013, 13, 7053–7074. [Google Scholar] [CrossRef] [Green Version]
- Kong, S.F.; Li, L.; Li, X.X.; Yin, Y.; Chen, K.; Liu, D.T.; Yuan, L.; Zhang, Y.J.; Shan, Y.P.; Ji, Y.Q. The impacts of firework burning at the Chinese Spring Festival on air quality: Insights of tracers, source evolution and aging processes. Atmos. Chem. Phys. 2015, 15, 2167–2184. [Google Scholar] [CrossRef] [Green Version]
- Zheng, H.; Kong, S.; Wu, F.; Cheng, Y.; Niu, Z.; Zheng, S.; Yang, G.; Yao, L.; Yan, Q.; Wu, J.; et al. Intra-regional transport of black carbon between the south edge of the North China Plain and central China during winter haze episodes. Atmos. Chem. Phys. 2019, 19, 4499–4516. [Google Scholar] [CrossRef] [Green Version]
- Izhar, S.; Goel, A.; Chakraborty, A.; Gupta, T. Annual trends in occurrence of submicron particles in ambient air and health risk posed by particle bound metals. Chemosphere 2016, 146, 582–590. [Google Scholar] [CrossRef] [PubMed]


| Station (Country) | Site Type | Field Sampling Campaign | Mean ± Standard Deviation | References |
|---|---|---|---|---|
| Xiantao (China) | Urban | 13–23 January 2018 | 132 ± 56.0 | This Study |
| Zonguldak (Turkey) | Urban | Winter, 2007 | 37.3 | [38] |
| Xi’an (China) | Urban | 17–26 December 2013 | 537 ± 146 | [10] |
| Riyadh (Saudi Arabia) | Urban | January 2013 | 71.9 | [39] |
| Wuhan (China) | Urban | 9 January 2013–6 February 2013 | 160 ± 66.3 | [17] |
| Delhi (India) | Near-road | December 2013–January 2014 | 293 ± 36.7 | [41] |
| Nanjing (China) | Urban | Winter, 2014 | 112 ± 26.4 | [13] |
| Beijing (China) | Urban | 29 December 2014–27 January 2015 | 117 | [11] |
| Tianjin (China) | Urban | 124 | ||
| Iasi (Romania) | Urban | January 2016 | 23.4 ± 11.7 | [37] |
| Shijiazhuang (China) | Urban | 15 December 2015–14 January 2016 | 234 ± 140 | [12] |
| Hefei (China) | Industrial | October 2016–January2017 | 81.0 | [35] |
| Guilin (China) | Urban | 10–15 December 2016–4–7 January 2017 | 144 ± 28.5 | [40] |
| Shanghai (China) | Suburban | 2018 haze days | 92.9 ± 44.4 | [14] |
| Chengdu (China) | Near-road | Winter, 2018 | 113 ± 60.3 | [15] |
| Huangshi (China) | Industrial | 13–25 January 2018 | 98.3 | [36] |
| Zhengzhou (China) | Urban | 11–23 January 2018 | 188 ± 52.4 | [16] |
| Xiangyang (China) | Urban | 13–24 January 2018 | 169 ± 57.0 | [18] |
| PM2.5-Bound Metal(loid)s | Children | Adults | ||||||
|---|---|---|---|---|---|---|---|---|
| ADPEDIng * | ADPEDInh * | ADPEDDer * | ADPED | ADPEDIng * | ADPEDInh * | ADPEDDer * | ADPED | |
| Sb | 3.54 × 10⁻¹ | 2.60 × 10⁻⁵ | 1.24 × 10⁻² | 3.66 × 10⁻¹ | 3.79 × 10⁻² | 2.12 × 10⁻⁶ | 2.16 × 10⁻² | 5.96 × 10⁻² |
| Al | 2.24 × 10⁻¹ | 1.65 × 10⁻⁵ | 7.85 × 10⁻³ | 2.32 × 10⁻¹ | 2.40 × 10⁻² | 1.34 × 10⁻⁶ | 1.37 × 10⁻² | 3.78 × 10⁻² |
| Zn | 6.45 × 10⁻² | 4.74 × 10⁻⁶ | 2.26 × 10⁻³ | 6.67 × 10⁻² | 2.29 × 10⁻³ | 1.28 × 10⁻⁷ | 1.30 × 10⁻³ | 3.59 × 10⁻³ |
| Pb | 3.35 × 10⁻² | 2.46 × 10⁻⁶ | 1.17 × 10⁻³ | 3.47 × 10⁻² | 4.44 × 10⁻³ | 2.48 × 10⁻⁷ | 2.53 × 10⁻³ | 6.97 × 10⁻³ |
| Co | 3.22 × 10⁻² | 2.37 × 10⁻⁶ | 1.13 × 10⁻³ | 3.33 × 10⁻² | 3.86 × 10⁻³ | 2.15 × 10⁻⁷ | 2.20 × 10⁻³ | 6.05 × 10⁻³ |
| Cr | 1.74 × 10⁻² | 1.28 × 10⁻⁶ | 6.09 × 10⁻⁴ | 1.80 × 10⁻² | 2.72 × 10⁻³ | 1.52 × 10⁻⁷ | 1.55 × 10⁻³ | 4.27 × 10⁻³ |
| Mn | 1.41 × 10⁻² | 1.03 × 10⁻⁶ | 4.92 × 10⁻⁴ | 1.46 × 10⁻² | 1.51 × 10⁻³ | 8.42 × 10⁻⁸ | 8.59 × 10⁻⁴ | 2.36 × 10⁻³ |
| Cu | 1.16 × 10⁻² | 8.53 × 10⁻⁷ | 4.06 × 10⁻⁴ | 1.20 × 10⁻² | 1.24 × 10⁻³ | 6.95 × 10⁻⁸ | 7.09 × 10⁻⁴ | 1.95 × 10⁻³ |
| As | 1.00 × 10⁻² | 7.38 × 10⁻⁷ | 1.05 × 10⁻³ | 1.11 × 10⁻² | 1.33 × 10⁻³ | 7.43 × 10⁻⁸ | 2.27 × 10⁻³ | 3.60 × 10⁻³ |
| Ni | 8.66 × 10⁻³ | 6.37 × 10⁻⁷ | 3.03 × 10⁻⁴ | 8.96 × 10⁻³ | 1.15 × 10⁻³ | 6.41 × 10⁻⁸ | 6.54 × 10⁻⁴ | 1.80 × 10⁻³ |
| Ba | 6.95 × 10⁻³ | 5.11 × 10⁻⁷ | 2.43 × 10⁻⁴ | 7.20 × 10⁻³ | 3.03 × 10⁻⁴ | 1.69 × 10⁻⁸ | 1.72 × 10⁻⁴ | 4.75 × 10⁻⁴ |
| Sr | 2.11 × 10⁻³ | 1.55 × 10⁻⁷ | 7.38 × 10⁻⁵ | 2.18 × 10⁻³ | 2.26 × 10⁻⁴ | 1.26 × 10⁻⁸ | 1.29 × 10⁻⁴ | 3.55 × 10⁻⁴ |
| V | 2.08 × 10⁻³ | 1.53 × 10⁻⁷ | 7.29 × 10⁻⁵ | 2.16 × 10⁻³ | 2.23 × 10⁻⁴ | 1.25 × 10⁻⁸ | 1.27 × 10⁻⁴ | 3.51 × 10⁻⁴ |
| Cd | 1.19 × 10⁻³ | 8.75 × 10⁻⁸ | 4.17 × 10⁻⁶ | 1.19 × 10⁻³ | 1.58 × 10⁻⁴ | 8.82 × 10⁻⁹ | 8.99 × 10⁻⁶ | 1.67 × 10⁻⁴ |
| Mo | 9.30 × 10⁻⁴ | 6.84 × 10⁻⁸ | 3.26 × 10⁻⁵ | 9.63 × 10⁻⁴ | 9.97 × 10⁻⁵ | 5.57 × 10⁻⁹ | 5.68 × 10⁻⁵ | 1.56 × 10⁻⁴ |
| Ag | 1.47 × 10⁻⁴ | 1.08 × 10⁻⁸ | 5.13 × 10⁻⁶ | 1.52 × 10⁻⁴ | 1.57 × 10⁻⁵ | 8.78 × 10⁻¹⁰ | 8.96 × 10⁻⁶ | 2.47 × 10⁻⁵ |
| U | 3.52 × 10⁻⁵ | 2.59 × 10⁻⁹ | 1.23 × 10⁻⁶ | 3.64 × 10⁻⁵ | 3.77 × 10⁻⁶ | 2.11 × 10⁻¹⁰ | 2.15 × 10⁻⁶ | 5.92 × 10⁻⁶ |
© 2020 by the authors. Licensee MDPI, Basel, Switzerland. This article is an open access article distributed under the terms and conditions of the Creative Commons Attribution (CC BY) license (http://creativecommons.org/licenses/by/4.0/).
Share and Cite
Jiang, H.; Lei, X.; Xiao, H.; Chen, D.; Zeng, P.; Yang, X.; Wang, Z.; Cheng, H. Pollution Characteristics, Chemical Compositions, and Population Health Risks during the 2018 Winter Haze Episode in Jianghan Plain, Central China. Atmosphere 2020, 11, 954. https://0-doi-org.brum.beds.ac.uk/10.3390/atmos11090954
Jiang H, Lei X, Xiao H, Chen D, Zeng P, Yang X, Wang Z, Cheng H. Pollution Characteristics, Chemical Compositions, and Population Health Risks during the 2018 Winter Haze Episode in Jianghan Plain, Central China. Atmosphere. 2020; 11(9):954. https://0-doi-org.brum.beds.ac.uk/10.3390/atmos11090954
Chicago/Turabian StyleJiang, Huimeng, Xiaowei Lei, Han Xiao, Danhong Chen, Pei Zeng, Xingyun Yang, Zuwu Wang, and Hairong Cheng. 2020. "Pollution Characteristics, Chemical Compositions, and Population Health Risks during the 2018 Winter Haze Episode in Jianghan Plain, Central China" Atmosphere 11, no. 9: 954. https://0-doi-org.brum.beds.ac.uk/10.3390/atmos11090954