Article

Designing a Climate Service for Planning Climate Actions in Vulnerable Countries

1
Swedish Meteorological and Hydrological Institute (SMHI), 60176 Norrköping, Sweden
2
World Meteorological Organization (WMO), 1211 Geneva, Switzerland
3
INRAE, UR HYCAR, Université Paris-Saclay, 92160 Antony, France
*
Author to whom correspondence should be addressed.
Submission received: 10 December 2020 / Revised: 31 December 2020 / Accepted: 12 January 2021 / Published: 16 January 2021

Abstract

:
The next generation of climate services needs not only tailoring to specific user needs but to provide, in addition, access to key information in a usable way that satisfies the needs of different users’ profiles; especially web-based services. Here, we present the outcomes from developing such a new interactive prototype. The service provides data for robust climate analysis to underpin decision-making when planning measures to compensate for climate impact. The goal is to facilitate the communication on climate information between climate modelling communities and adaptation or mitigation initiatives from vulnerable countries that are applying for funds from the Green Climate Fund (GCF). A participatory process was ensured during four workshops in four pilot countries, with an audience of national and international experts. During this process it was made clear that in all countries there is a strong need for knowledge in climate science, while in most countries there was also an increasing need of capacity in hydrological modelling and water management. The active interaction during the workshops was found necessary to facilitate the dialogue between service developers and users. Understanding the users, transparency on potentials and limitations of climate services together with capacity development in climate science and methods were required components in the development of the service.

1. Introduction

Vulnerable countries already experience first-hand the adverse effect of climate change. To tackle the challenges, these countries need access to state-of-the-art climate information, tools with financial support, and investments. Among concerted efforts, high-income countries have agreed to jointly mobilise significant financial resources to address the pressing mitigation and adaptation needs of developing countries, directly linking to Sustainable Development Goals (SDG) 10 Reduce Inequality and specifically to target 10.b [1].
However, the implementation of the Paris Agreement [2] on climate adaptation and several other SDG such as 13, 2, 6, 14, and 15 (Climate action and other depending on it) demand easy access and readily available hydroclimate data on variability and change, information for assessments around the globe, and interpretation of the climate change signal when linked with societal impacts to create climate actions for a new climate resilience region; all these in especially data-sparse regions worldwide. The use of climate information is, however, still strongly limited by the difficulty in accessing information and interpreting or dealing with the large uncertainty in future climate change projections [3,4].
In an effort to overcome this limitation, the Green Climate Fund (GCF) established under the United Nations Framework Convention on Climate Change (UNFCCC), joint forces with the World Meteorological Organisation (WMO) to define a scientific framework for users of different expertise and background, to use when preparing GCF proposal in seeking climate finance funding. While implementing this framework, it became clear that for development towards a more climate resilient society, there is a need of quality assured information on future climate change impacts.
During the last decade, scientific, political, and public efforts to develop and implement climate services has led to substantial achievements, but yet the ambition to produce readily available data for practical implementations has not been fulfilled. Several models and frameworks to design and evaluate climate services have been proposed [5,6,7,8], and agendas were set up by governmental bodies, scientific, and intergovernmental organisations around the world. In parallel, international policy processes and mechanisms facilitated dissemination and use of knowledge to inform adaptation policies and practices, such as national adaptation plans [2]. Scientific studies have highlighted many barriers between producers and users of climate information [9,10]. A recent review by [11] concluded that to become more efficient, the domain of climate services needs to address two key matters. Firstly, the modes of production and use of context-relevant climate information needs to be adjusted to effectively transfer climate science and information to national and local communities (e.g., [12,13]). Secondly, we need an active evaluation of the effectiveness and legitimacy of this information in decision-making in order to design context-relevant climate services. This tailoring to specific user needs requests co-creation to be successful.
Current co-development (also referred to as co-production in [14]) of climate services requires data providers to understand the needs of many, simple to advanced users and use-cases, and merge or prioritise these demands to create the best possible service, balancing the guidance and training with that of technical tools. At the same time, and within the content of the GCF proposals, methods and tools are urgently requested for capacity development to strengthen the national and sub-national organisations in their project motivation and proposal writing procedures. The requested tools can be categorised as climate services tailored for proposal writing to the GCF, which is in line with recent suggestions of how to evolve climate services into knowledge-action systems [11,15].
We have developed a new interactive web-based prototype (https://climateinformation.org/) with primary role to provide access to climate information in vulnerable countries. This is a starting point for the stakeholders in these countries to defining a climate case, which is the basis for developing interventions and proposing investments under the finance of GCF. In our prototype, readily available climate indicators help to define future problems, assess climatic stressors, and analyse current and future risks. The platform provides climate information with global coverage as it was anticipated early on in this project that the platform should be accessible and useful to other countries other than the 4 pilot countries selected in this project. In order to make scientific information understood, we have engaged with users in translating scientific language into user-friendly key description and messages, while maintaining the rigour and quality of the information [4,10]. For this purpose, the platform was used during four workshops organised by WMO in four pilot countries to obtain data, tools, and knowledge on climate analysis for GCF proposals. International and local experts at the workshops in St. Lucia, the Democratic Republic of Congo, Cabo Verde, and Cambodia participated in a co-development process to explore their needs on data and knowledge, while they trained in using the platform and preparing a first version of a project proposal.
In this paper, we present the data production and the development process that followed when creating the Climate Information platform. The aim was to ensure that the causal links between climate and climate effects (global and regional), and between climate action and societal benefits, are fully grounded in the best available climate data and science [16]. We then discuss the lessons learnt from investigating users’ needs and platform experiences during the four workshops. Finally, we provide recommendations that are valuable not only for future development of this service but also for other hydro- and climate-based services.

2. Materials and Methods

The platform contains climate information produced following an extensive production chain; starting from climate model data and going through several refinement steps and tailoring, including the usage of observed data, before it is ready to be transferred to users and incorporated into decision-making. The technically and computationally demanding production chain is applied for the calculation of climate indicators. The use of indicators is an efficient way in making climate information accessible to users within a sector, as the indicators concentrate the outcome of the climate models into a smaller quantity that is sector relevant.

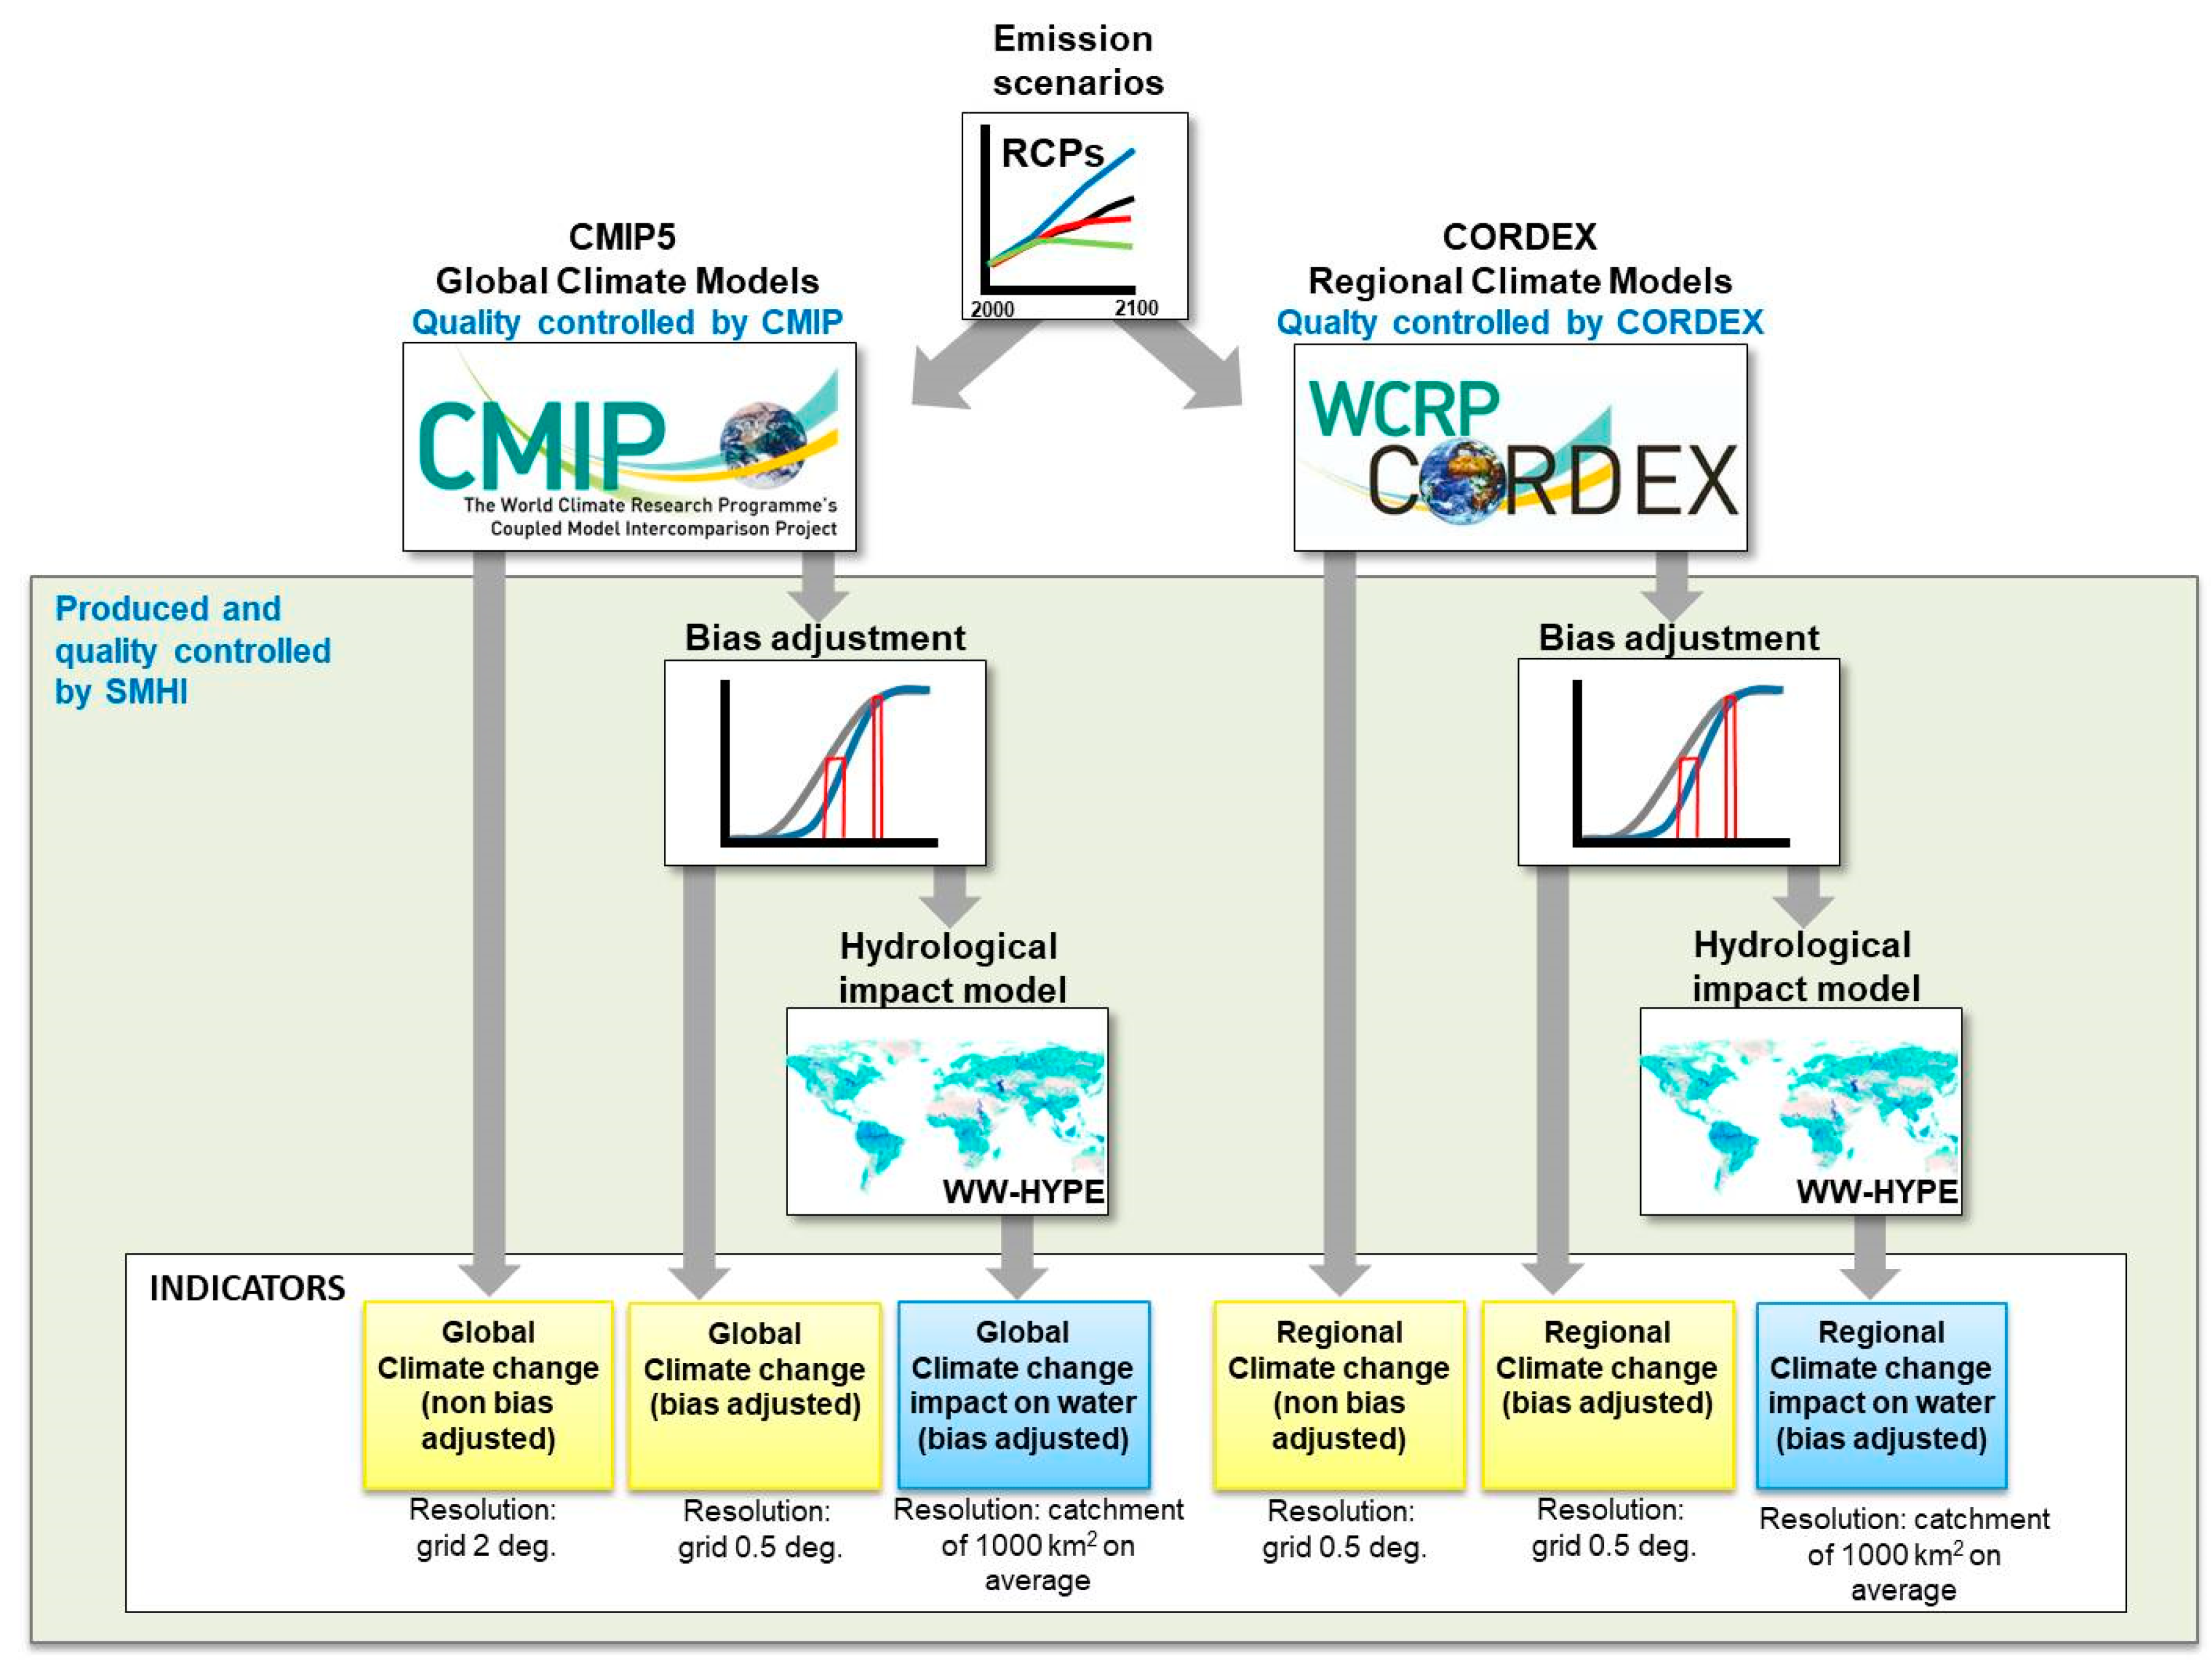
2.1. Data Production

A quality assured production chain which is frequently used in climatic services (including hydro services; [17]) was implemented to produce Climate Indicators (CI) and Water Indicators (WI) from Essential Climate Variables (ECV) available in the Climate Information platform (Figure 1). The production follows a rigorous quality assurance protocol developed in previous projects and adjusted to fit the current needs. Here, the production consists of: the pre-processing of daily precipitation, daily mean, maximum and minimum temperature from Global and Regional Climate models (GCM, RCM) from the Coupled Model Intercomparison Project (CMIP5, [18]) and the Coordinated Regional Downscaling Experiment (CORDEX, [19]), the calculation of CI at different grid resolution, the bias adjustment of climate variables and the recalculation of the indicators (0.5 degree), and finally the calculation of WI at a catchment scale using a global hydrological model. Specifically, the CIs are calculated from non-bias adjusted CMIP5 ensemble at 2 degrees and at 0.5 degrees from the bias adjusted ensemble. CI calculated from CORDEX ensembles are calculated at 0.5 degrees from non- and bias-adjusted ensembles, respectively.
The selection of CI and WI was agreed at an early stage of the development of the platform and was based on previous experience gathered from working with different user needs. The selection of climate models primarily serves the need of global coverage and the use of CORDEX domains and models. The use of the CORDEX data was a prerequisite in this development, making the platform, at least to our knowledge, the only web-based platform which provides CORDEX based CI for most of the CORDEX domains.
To facilitate both near future and far future assessments by the users, all indicators are calculated as absolute values for reference period (1981–2010), and as relative or absolute changes depending on the indicator for the 3 future periods (2011–2040, 2041–2070, 2071–2100). An ensemble of model results is provided for each CORDEX domain and for the CMIP5 ensemble, to indicate confidence in the estimates (mean, median, 25th, and 75th percentiles). All indicators are produced in two formats: NetCDF) and Excel with metadata linked to them.

2.1.1. Global and Regional Climate Models

The CORDEX data used here were available for ten different domains: Africa, Arctic, Australia, Central America, Eastern Asia, Europe, Mediterranean and North Africa, North America, South America, Western Asia; all at 44km original resolution. For each domain, a different number of models and the Representative Concentrations Pathways (RCP) scenarios were available. The full list of CORDEX models which we are processing is available in Appendix A.
The ensemble of CMIP5 models previously used in a Copernicus Climate Change Service Sectoral Information System (C3S SIS, [17]) was also used to provide a complete global coverage. The ensemble was modified to fit the current requests (different reference period (1981–2010), which differs from C3S (1971–2000)); the ensemble is also available in Appendix A.
All data and models underwent a number of quality checks before including them in this production. Although both Model Intercomparison projects (CMIP5 and CORDEX) follow quality assurance protocols, additional checks were required to meet the needs of the production chain of indicators. This is usually necessary when developing a climate service for a wide range of users, among them non-scientific users (e.g., [20]). The checks involved file format, data gaps, overlapping periods, missing values, units, data and domain dimension, metadata information, and calendar adjustments. Ranges checks also took place to identify unrealistic values. Small data gaps (few days) were handled by copying the preceding time step or data for the same days of year from the previous year. Expert judgement was used to disqualify models and scenarios with large number of unrealistic values or errors in the model experiment.

Bias Adjustment

Daily precipitation and temperature variables from both CMIP5 and CORDEX models were bias adjusted and downscaled to a 0.5-degree spatial resolution using the Distribution-Based Scaling method (DBS, [21]) with a global gridded reference dataset called Hydrological Global Forcing Data (HydroGFDv2.0) [22]. Bias adjusted variables from RCM are used to calculate the climate indicators at a 0.5-degree spatial resolution. The bias adjusted variables (precipitation and mean, maximum, and minimum temperature) are also used as forcing input for the global hydrological model World-Wide Hype (WW-HYPE, [23]) to calculate water related indicators at catchment resolution. The bias adjustment method, reference dataset and global hydrological model are developed by the Research Department of the Swedish Meteorological and Hydrological Institute (SMHI). Quality checks for this step involved statistics for climatological periods such as mean, median, minimum, maximum values over the full ensemble for every grid point. Statistics on missing values are used to identify scenarios where the bias adjustment did not work properly. The bias-correction method was adjusted in a way to minimise missing values in the bias-corrected data. The remaining missing values were very few and were not gap-filled for further processing. Additionally, inspecting the bias in variance proofed to be helpful to identify issues in the data. Bias adjustment with the DBS method requires post processing for temperature, where possible physical inconsistencies between mean, maximum, and minimum temperature were corrected. The domain-mean absolute errors of gridpoint-wise monthly mean biases for the reference period are summarised in Table 1. Generally, the DBS method reduces the biases substantially, although the remaining biases indicate limitations in the bias-correction such as constrained ranges for scaling factors to avoid very large multiplicative scaling factors, post-processing of temperature variables to maintain the intervariable physical constraints of minimum, mean, and maximum, or in general the fitting of assumed distributions to the daily data. Using bias-corrected data can mainly have an advantage if threshold dependent or strongly non-linear processes are going to be assessed, such as hydrological processes results presented in this paper. However, bias-correction is not suitable in all cases and such an evaluation is still the topic of current research (see [24]) for comprehensive critical perspective on bias-correction).

2.1.2. Climate Indicators

The Climate Indicators definitions are presented in Table 2 (for definitions see: [25,26]). Specifically, indicators are calculated from both raw (non-bias adjusted) and bias adjusted GCM and RCM daily precipitation and daily mean, maximum, and minimum temperature (Figure 1). The spatial resolution for indicators varies and is for raw GCM 2 degrees (about 200 km), and for indicators from raw RCM and bias adjusted RCM and GCM, the resolution is 0.5 degrees (about 50 km). To evaluate the ranges of the calculated CI from CORDEX, manual comparisons of CI calculated from the HydroGFD CI’s historical period (1981–2010) to the calculated CORDEX CI’s are performed. Experts check if the patterns are within a reasonable range. This test gives information on outliers and possible extreme values in need for further investigation.

2.1.3. Global Hydrological Modelling and Water Indicators

For the hydrological assessment and the calculation of WI, the global hydrological model World-Wide HYPE (WW-HYPE) was used [23]. WW-HYPE is a conceptual rainfall-runoff model that calculates water volume and fluxes for all continents except Antarctica. River basins are spatially divided into catchments, with a total of 130,000 catchments, at a median spatial resolution of 1000 km2 in WW-HYPE. The model is evaluated and calibrated towards 11,500 gauges of river discharge across the globe, though gauge density varies widely across regions and large areas are ungauged [27]. It is the second time that WW-HYPE was used for global hydrological assessment and it is the first time, to our knowledge, that a global hydrological model used CORDEX domains and data for global coverage of water indicators.
For assessment of hydrological variables, WW-HYPE was run for each of the CORDEX domains and ensemble separately. The CORDEX domains provided an extra difficulty for the hydrological assessment since river basins can cross CORDEX domain boundaries, leading to inconsistent forcing data over such basins. This was dealt with using the following quality check after the runs: If the upstream area of a river catchment or a river stream was located outside of the CORDEX domain boundaries, then this basin or stream was excluded from the simulations (grey areas in maps) and the user should use another domain. This applied for all the WI listed in Table 3. All WI were defined by SMHI hydrology experts and were chosen in this prototype since they are frequently used in hydrological assessments.
Qualitative assessment of validity of WW-HYPE outputs were performed through diagnostic map plots. The validity of spatial patterns in hydrological variables was assessed through visual inspection of mapped aggregates (averages, sums) of WW-HYPE output variables. Values of the model variables at selected spatial points, e.g., large river outlets, are semi-quantitatively assessed through comparison with expected ranges based on external data, e.g., observations or previous model results (runs with CMIP5, [17]), to make sure values are within a reasonable range.

2.2. Development of the Web-Based Platform

The Climate Information Platform was developed in incremental steps over the course of 1 year (Figure 2). The platform started from the contract phase with significant elements predefined, i.e., use of CORDEX 0.44 degrees climate simulations, climate and water indicators, pilot countries. The platform at this stage was created with CMIP5 climate and water indicators and a first design. The development phase consisted of 4 main updates of the platform that took place before and after each workshop at a pilot country. These updates included mainly the CORDEX ensembles and indicators available for the domain covering each pilot country and re-design of different sections of the platform. After the completion of the workshops another version of the platform was developed, this time producing and including ensembles and indicators for the remaining CORDEX domains providing a full global coverage. This version of the platform was commented by GCF and WMO and the current version of the prototype was reached.
The core of the development of the platform took place around 4 workshops in 4 pilot countries: St. Lucia (East Caribbean), Democratic Republic of Congo (Africa), Cabo Verde (Africa), and Cambodia (South East Asia). A fifth workshop in Paraguay was cancelled due to traveling restrictions caused by the COVID-19 pandemic. All workshops were organised by WMO with the contribution of SMHI, specialised partner organisations and WMO inter-governmentally appointed experts such as the Expert Team on Sector Specific Climate Indices (ET-SCI). A total number of 75 international experts had the possibility to participate in one or in all 4 workshops, depending on their area of expertise. National experts from each country or region participated in the designated workshop of their region, reaching in total 196 participants (Figure 3, Table 4). Each workshop had a duration of 5 full days (Monday to Friday) and was held under the organisation of WMO and the national authority of contact.
The goal of the workshops (Figure 3) was to bring together national, regional, and global experts from different disciplines, train users in climate information and science (climate analysis and bias adjustment, hydrological impact analysis), provide expert advice, and receive feedback for further platform developments. All presentations and activities were refined and improved as subsequent workshops were held, to better match the participant’s level of understanding and collect the feedback that was required. This set up was designed specially to accommodate the different types and nationalities of the users of the platform and the participants of the workshops.
Each workshop produced a set of climate action concepts that identified the climatic factors affecting priority socio-economic outcomes in the country; documented the recent past, present, and projected future conditions of specific climatic variables linked to those outcomes; and proposed climate actions that, if implemented, would lead to improved climate-related outcomes through a coherent and science-based chain of causality.
Several surveys, presentations and exercises were done during the workshops to collect user profiles and feedback, and educate participants about the rationale behind building the Climate Information platform. Special emphasis was put on climate services, their usefulness, climate models and different terminology, CORDEX model and data, climate indicators, climate information and tools (linking global to local data, bias adjustment), and to engage the users to use the online platform. We found it necessary to apply playful methods as quiz and entertaining outreach to create enough engagement for the users to get to know the platform and receive related feedback. The interactive sessions were formed as following:
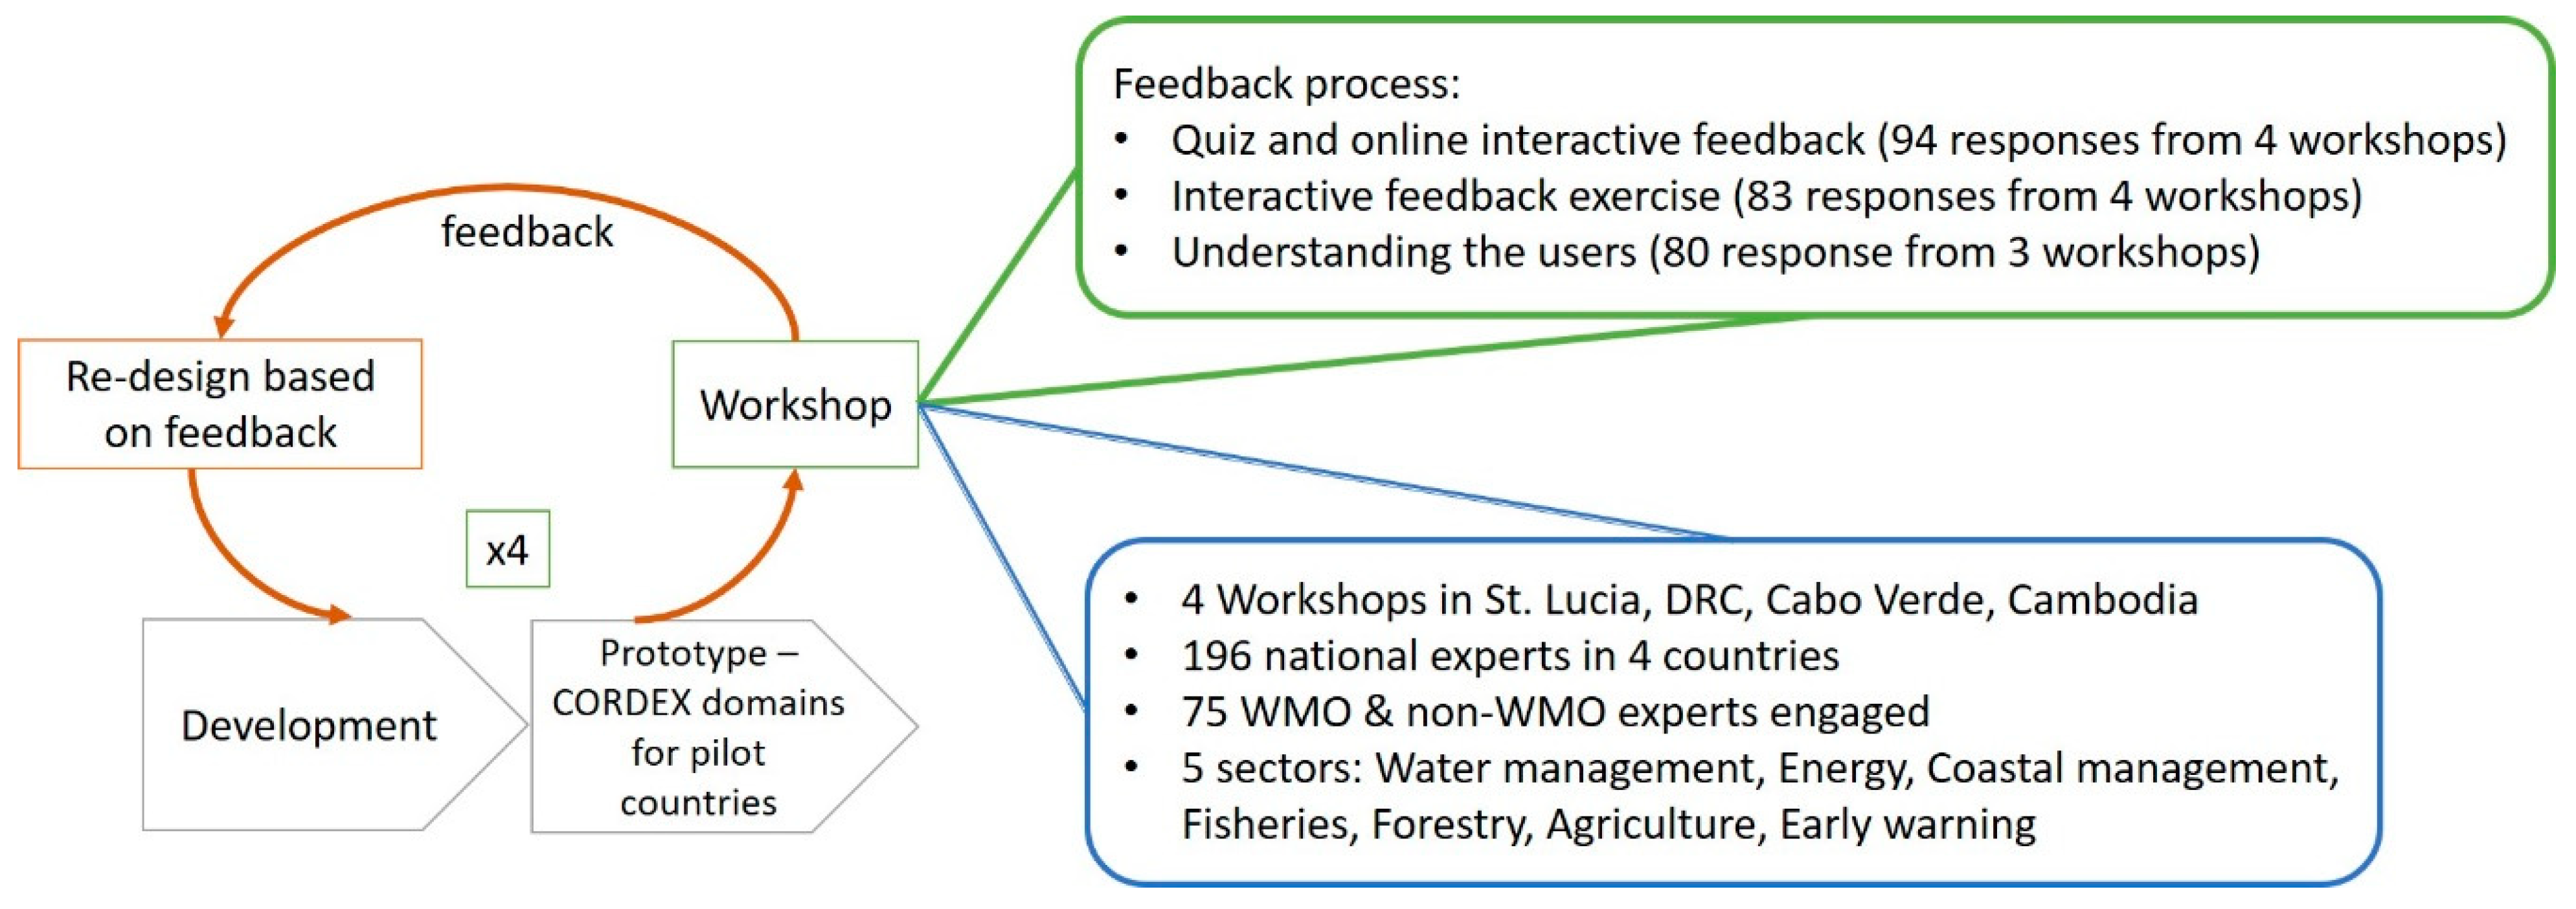
  • Quiz and online interactive exercise: This exercise began with a quiz, where workshop participants were divided into teams and given questions to encourage exploring the platform and finding relevant information. After the quiz, participants were asked to provide feedback in four categories; what they liked, what could be improved and how, what other climate science information do they want to see in the Knowledge Base, and what other web-based climate services have been used before.
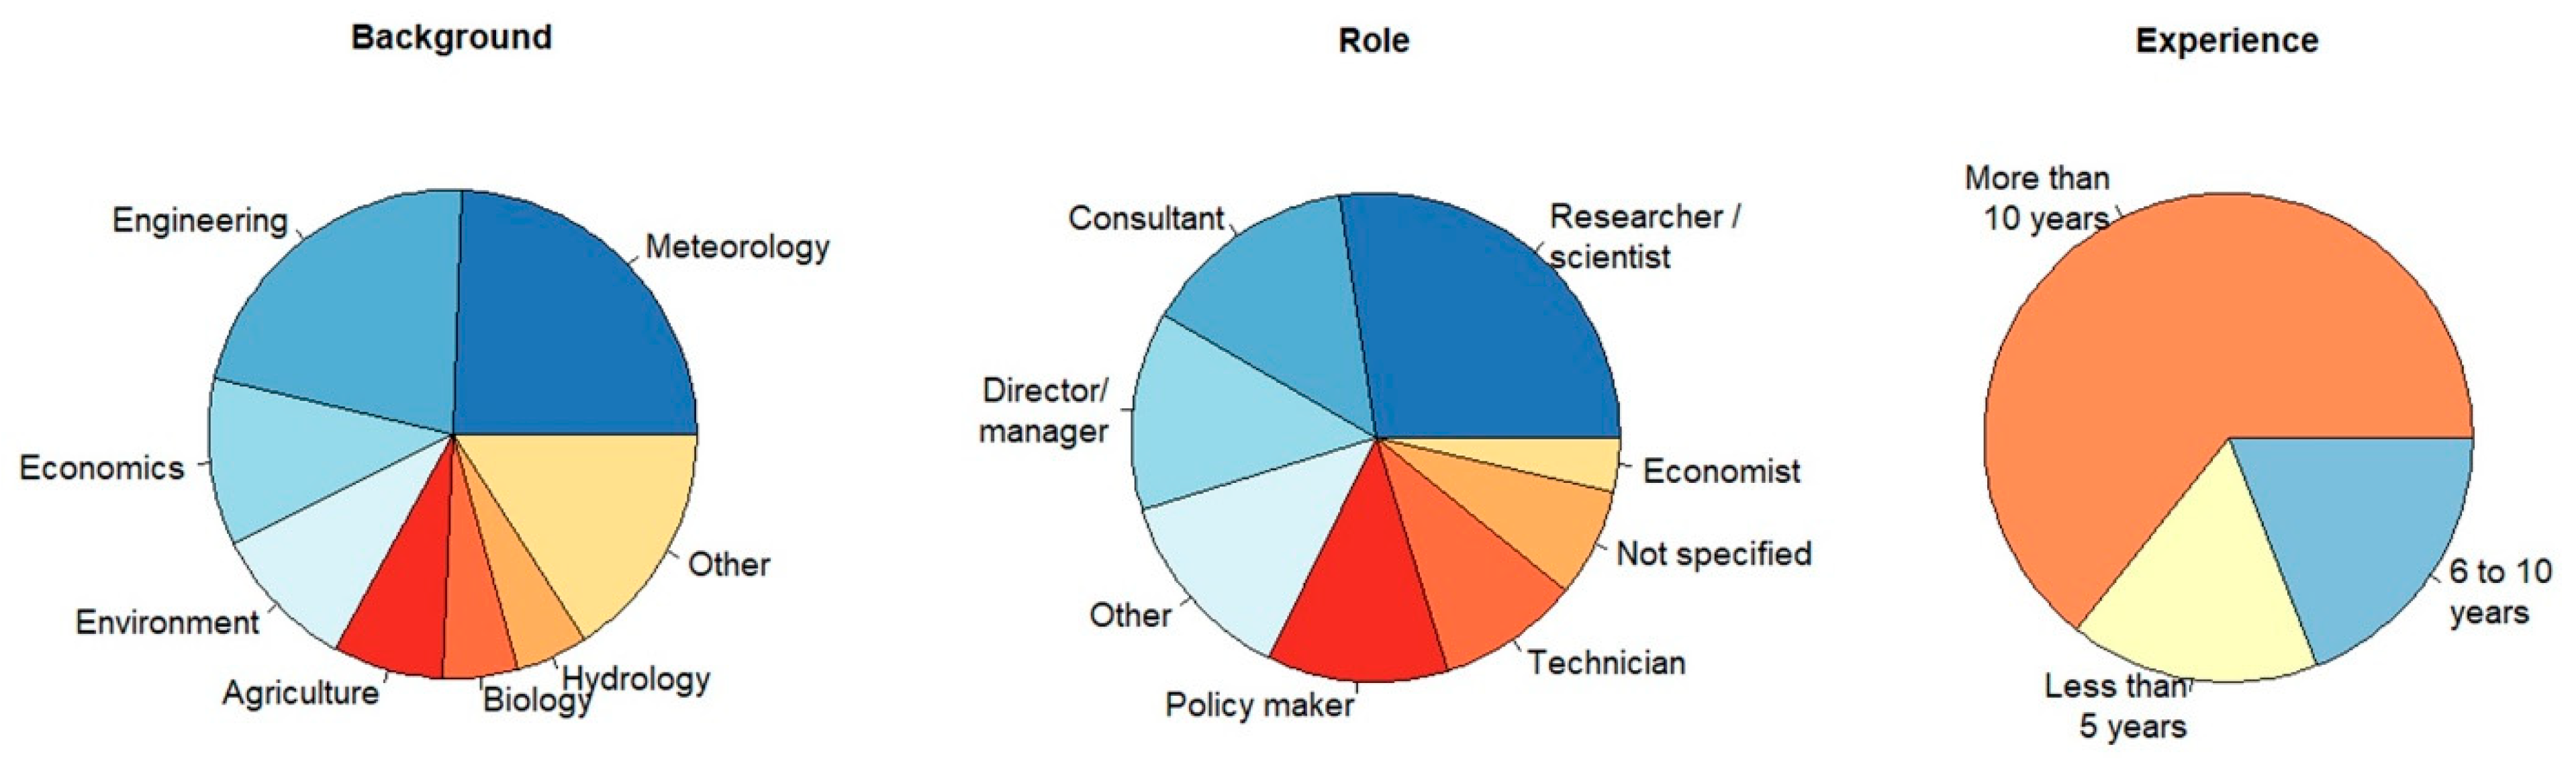
  • Interactive feedback exercise: In this feedback process, participants were asked about their understanding of climate change data and climate services. Specifically, in the feedback form, participants were asked to give their professional background, their current role and years of experience. Secondly, the participants were asked to provide input on:
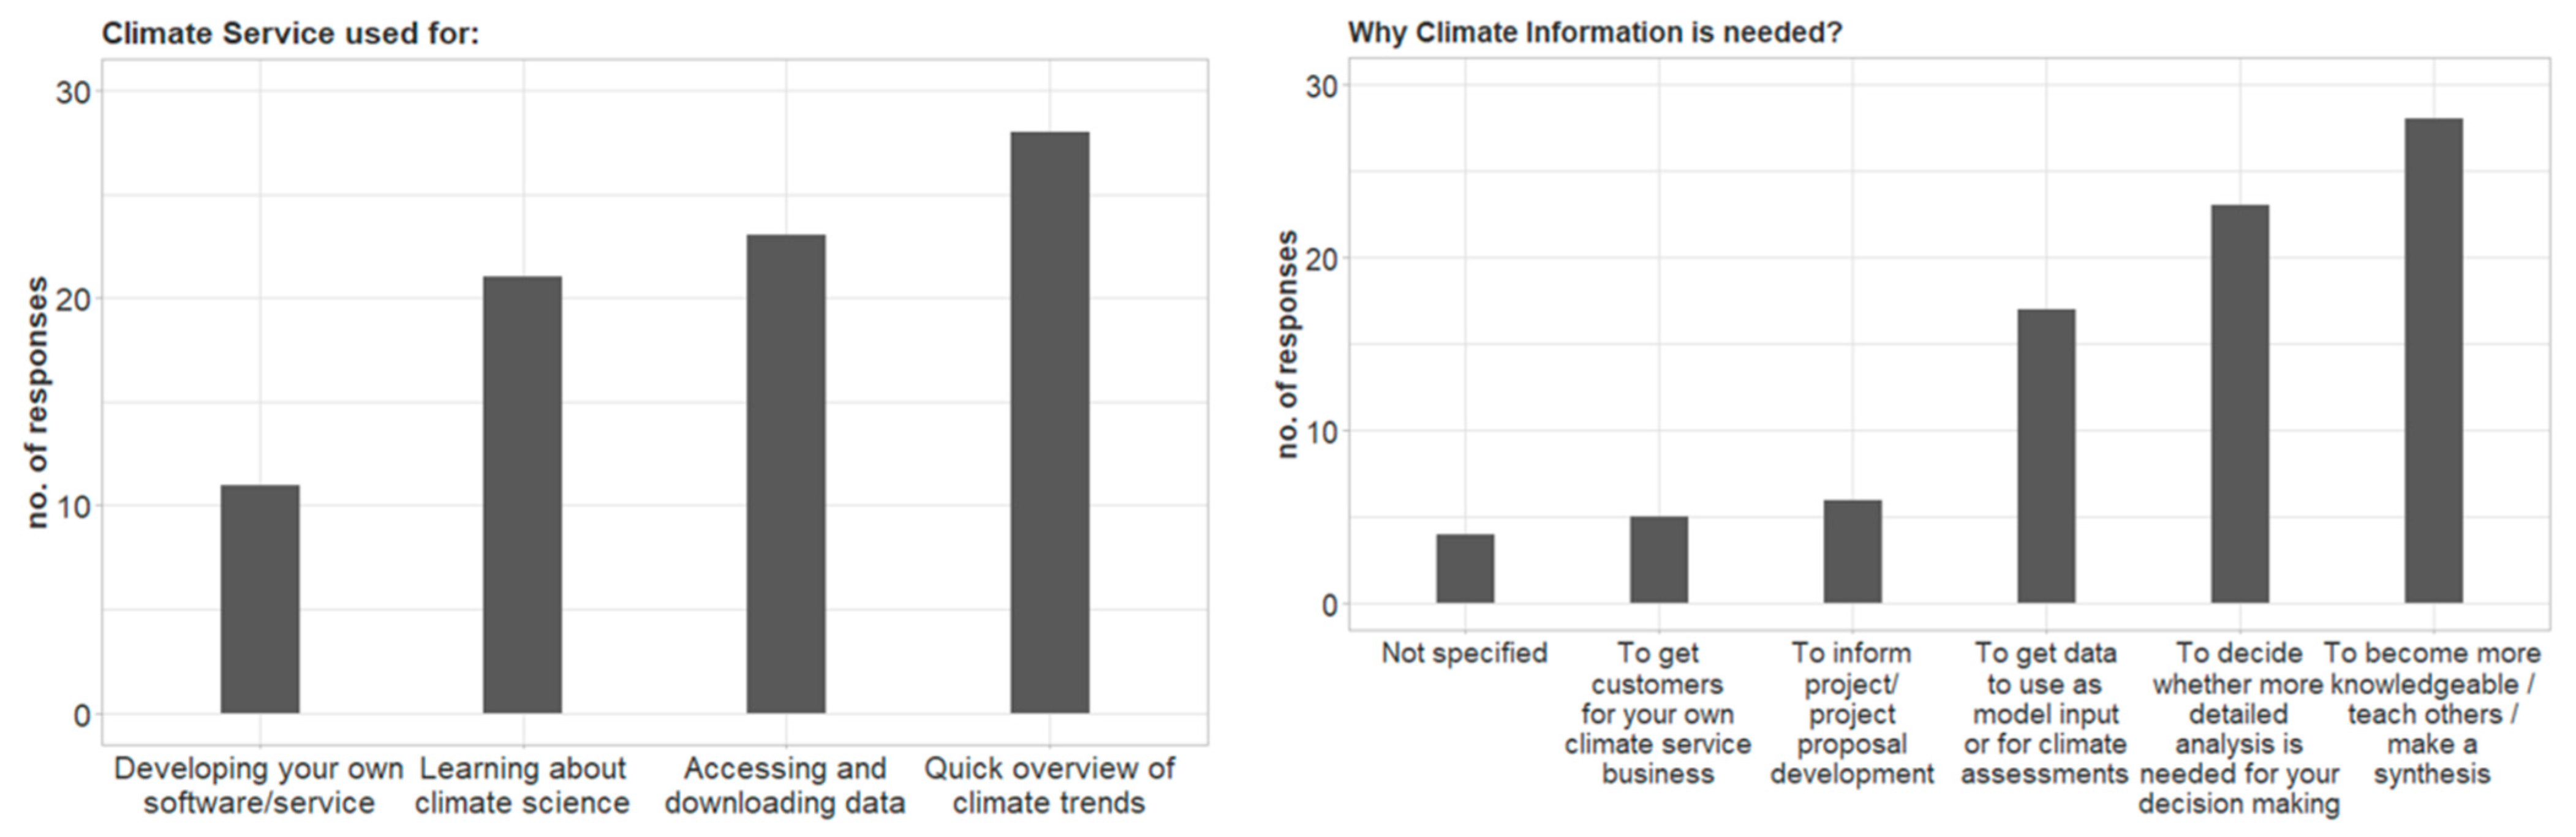
    Web-based climate services: why do they use a web-based climate service and for each purpose they need the information provided by the service;
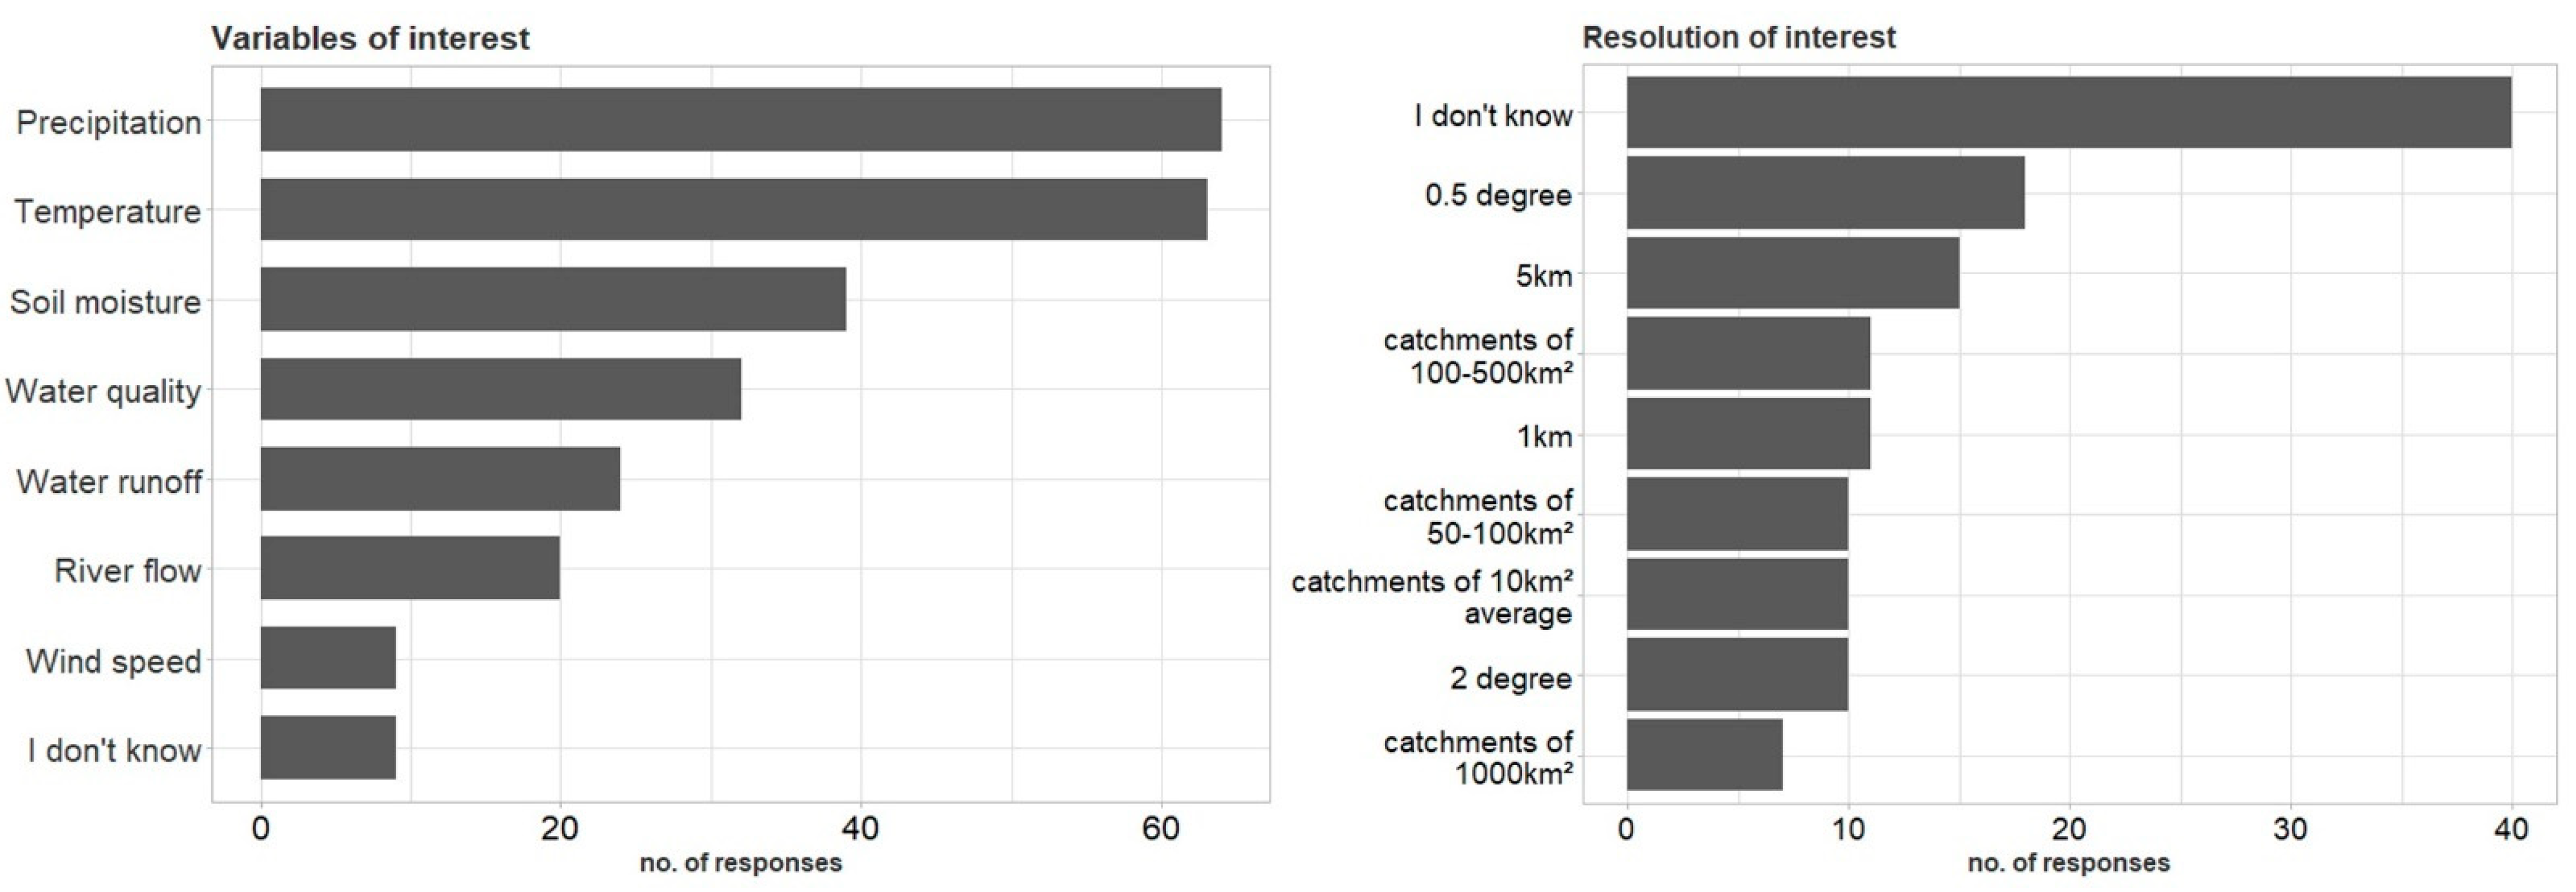
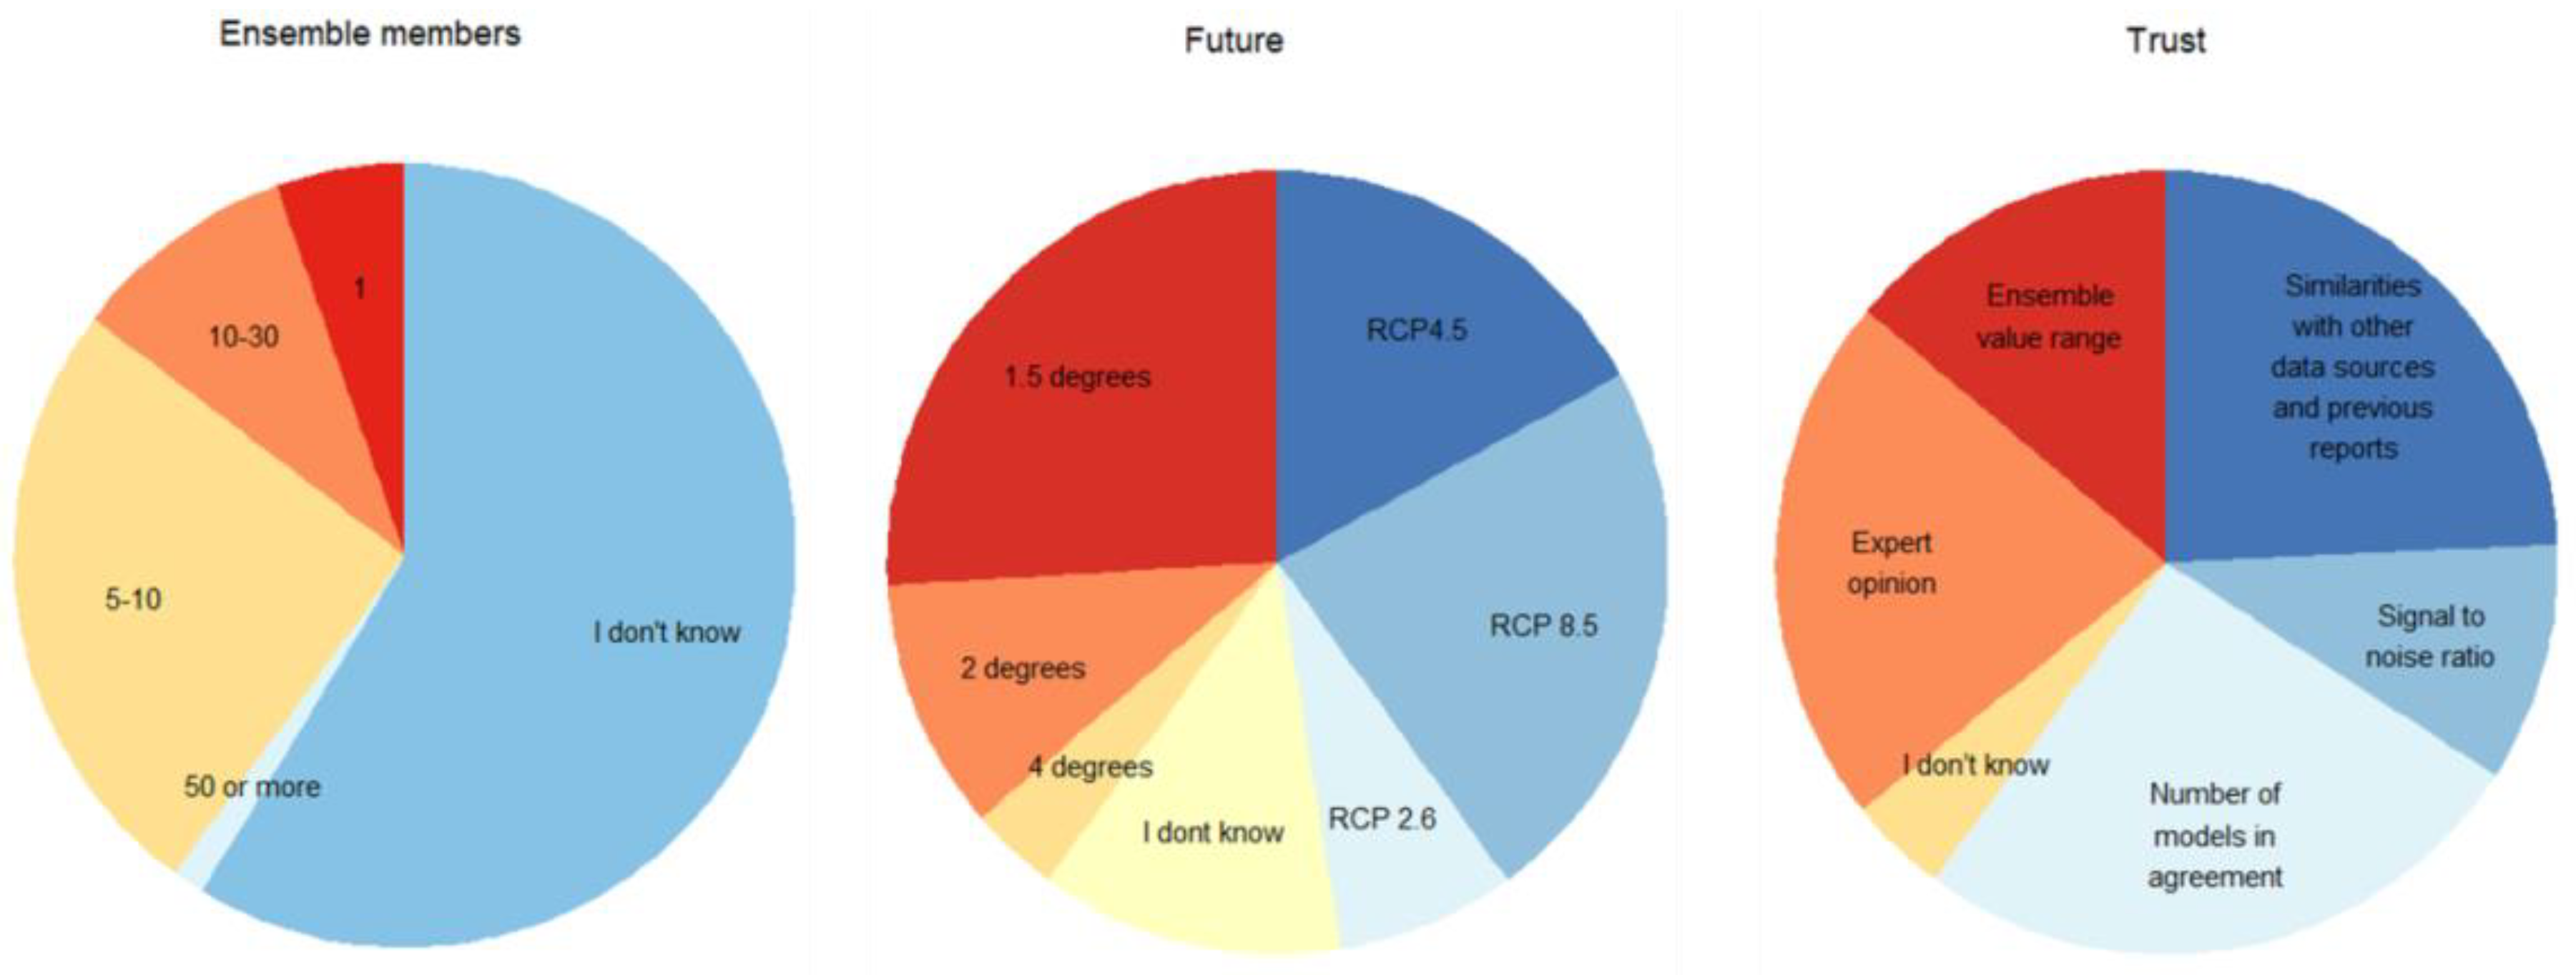
    Data, Information, and Confidence: What variables do they usually use, in which spatial resolution, how many ensemble members do they prefer to work with, what kind of future scenario are they most interested in, and what kind of information they need to trust climate data more.
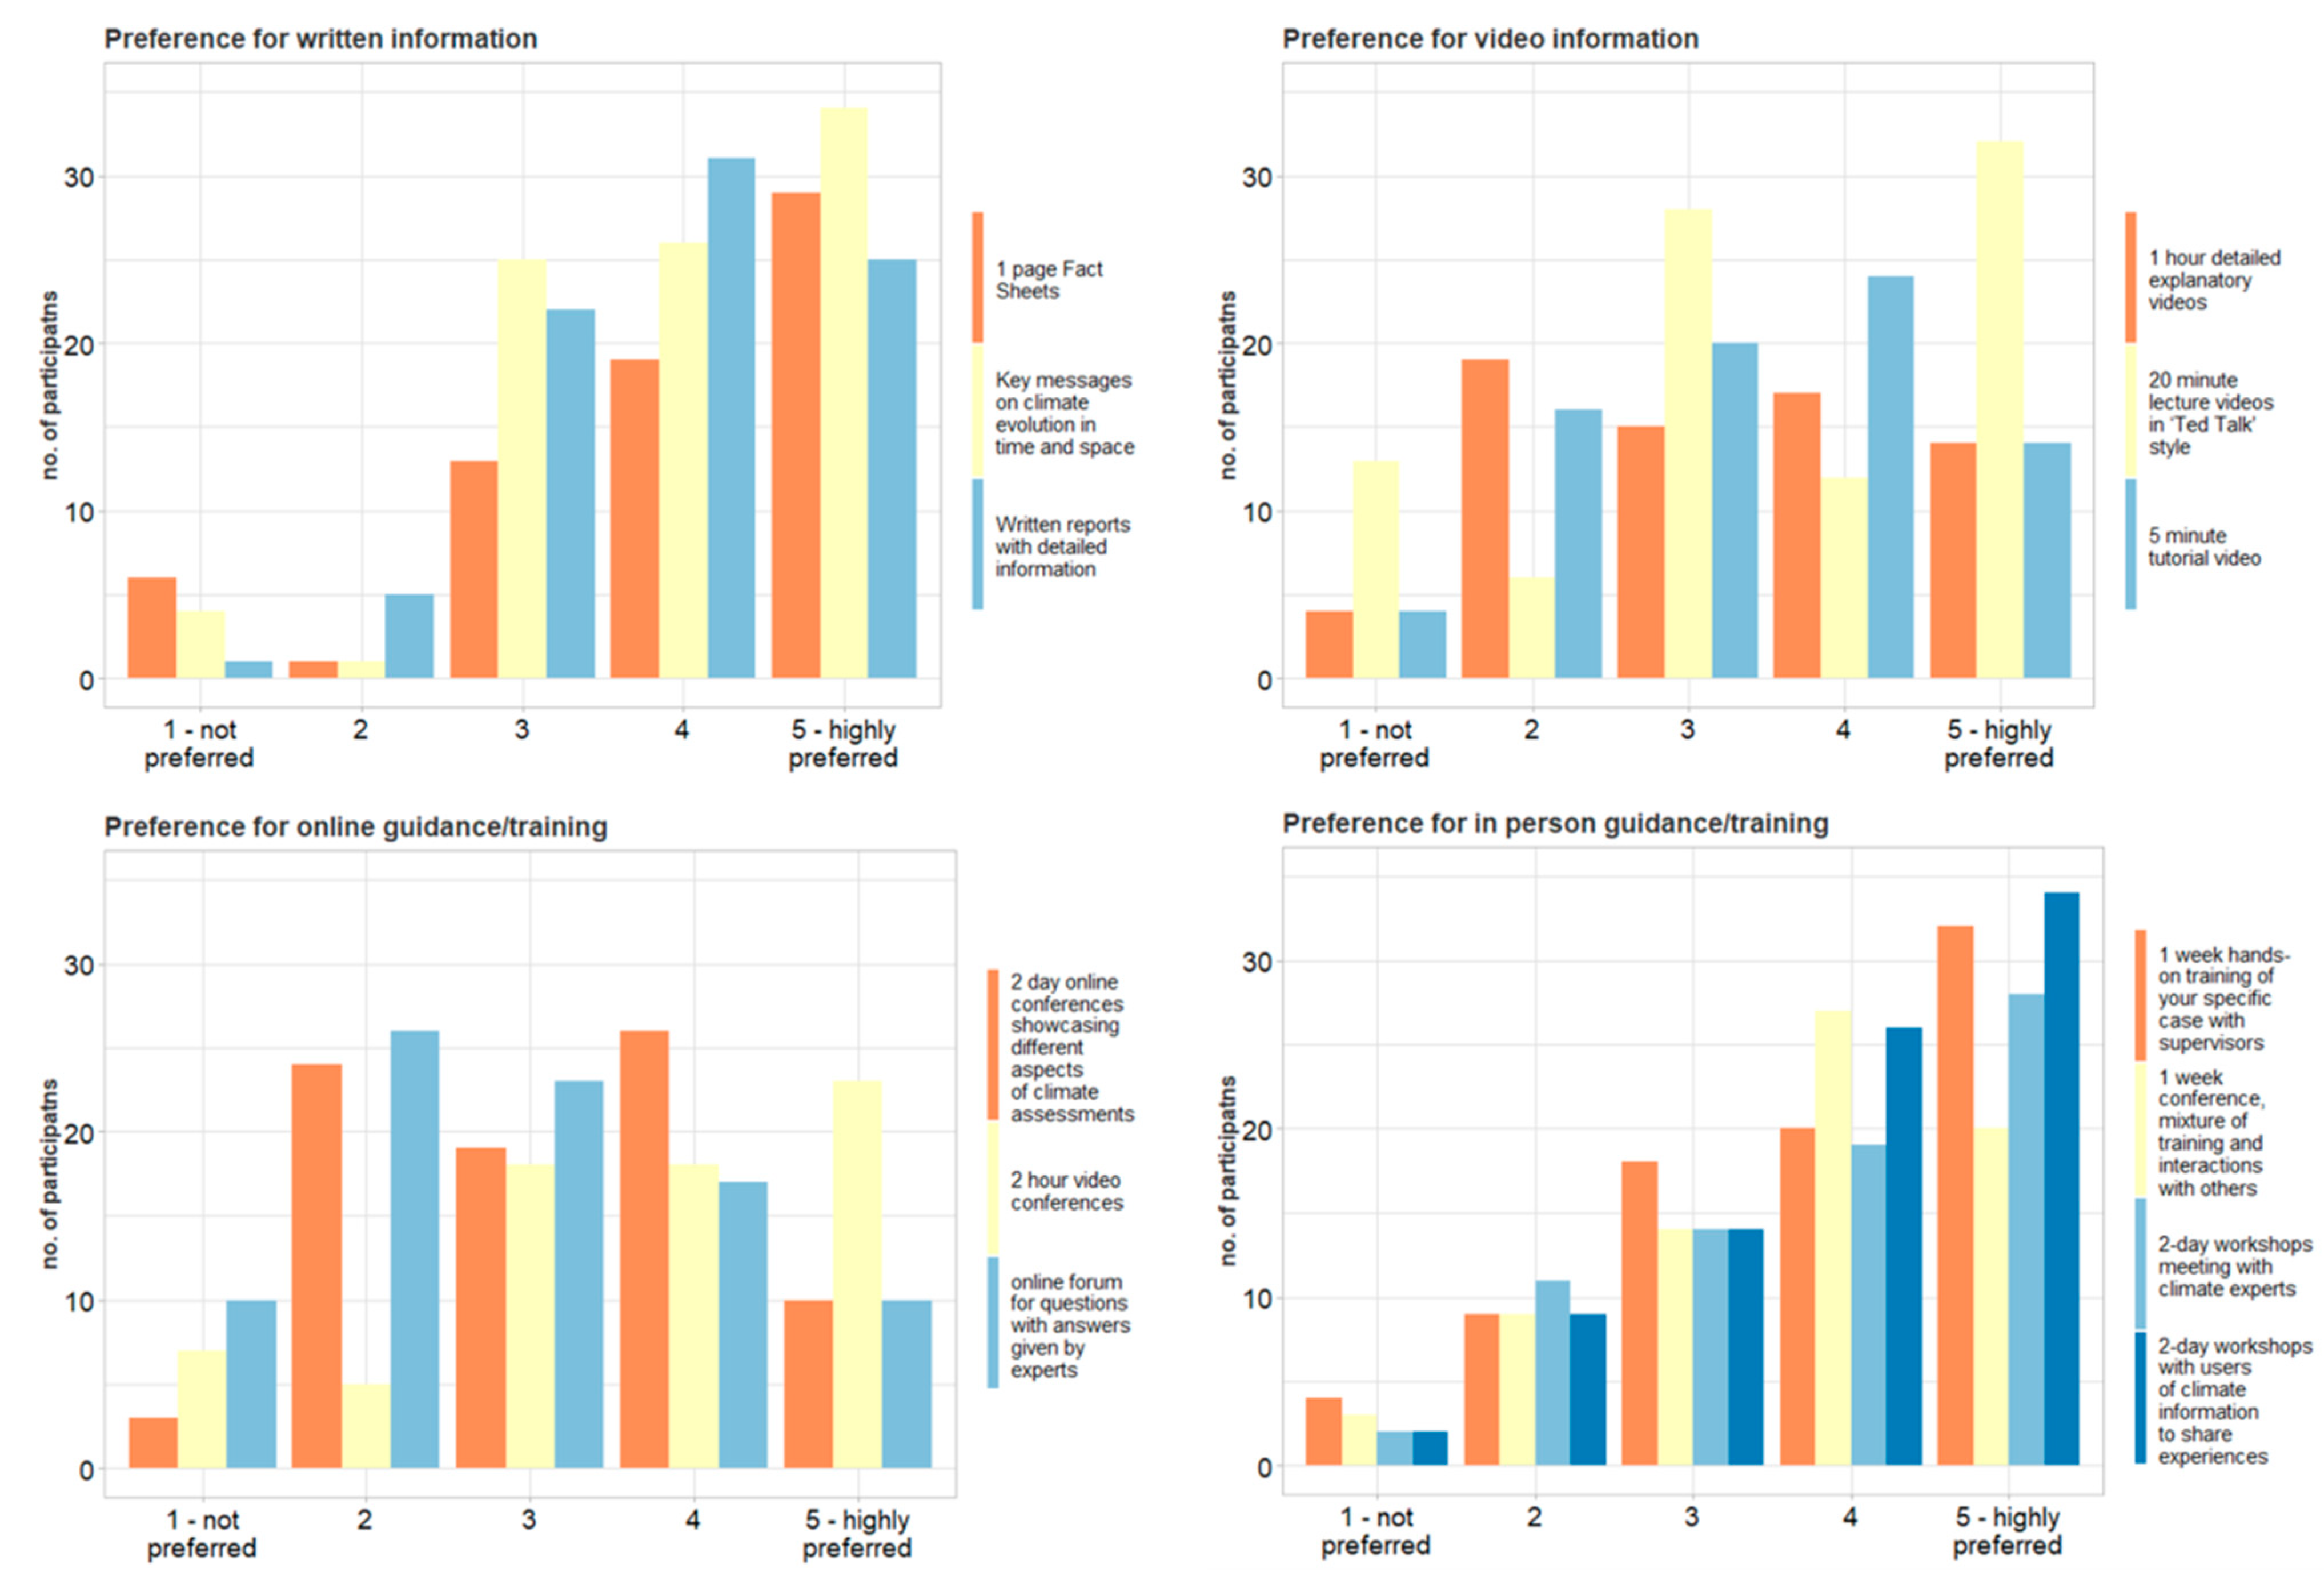
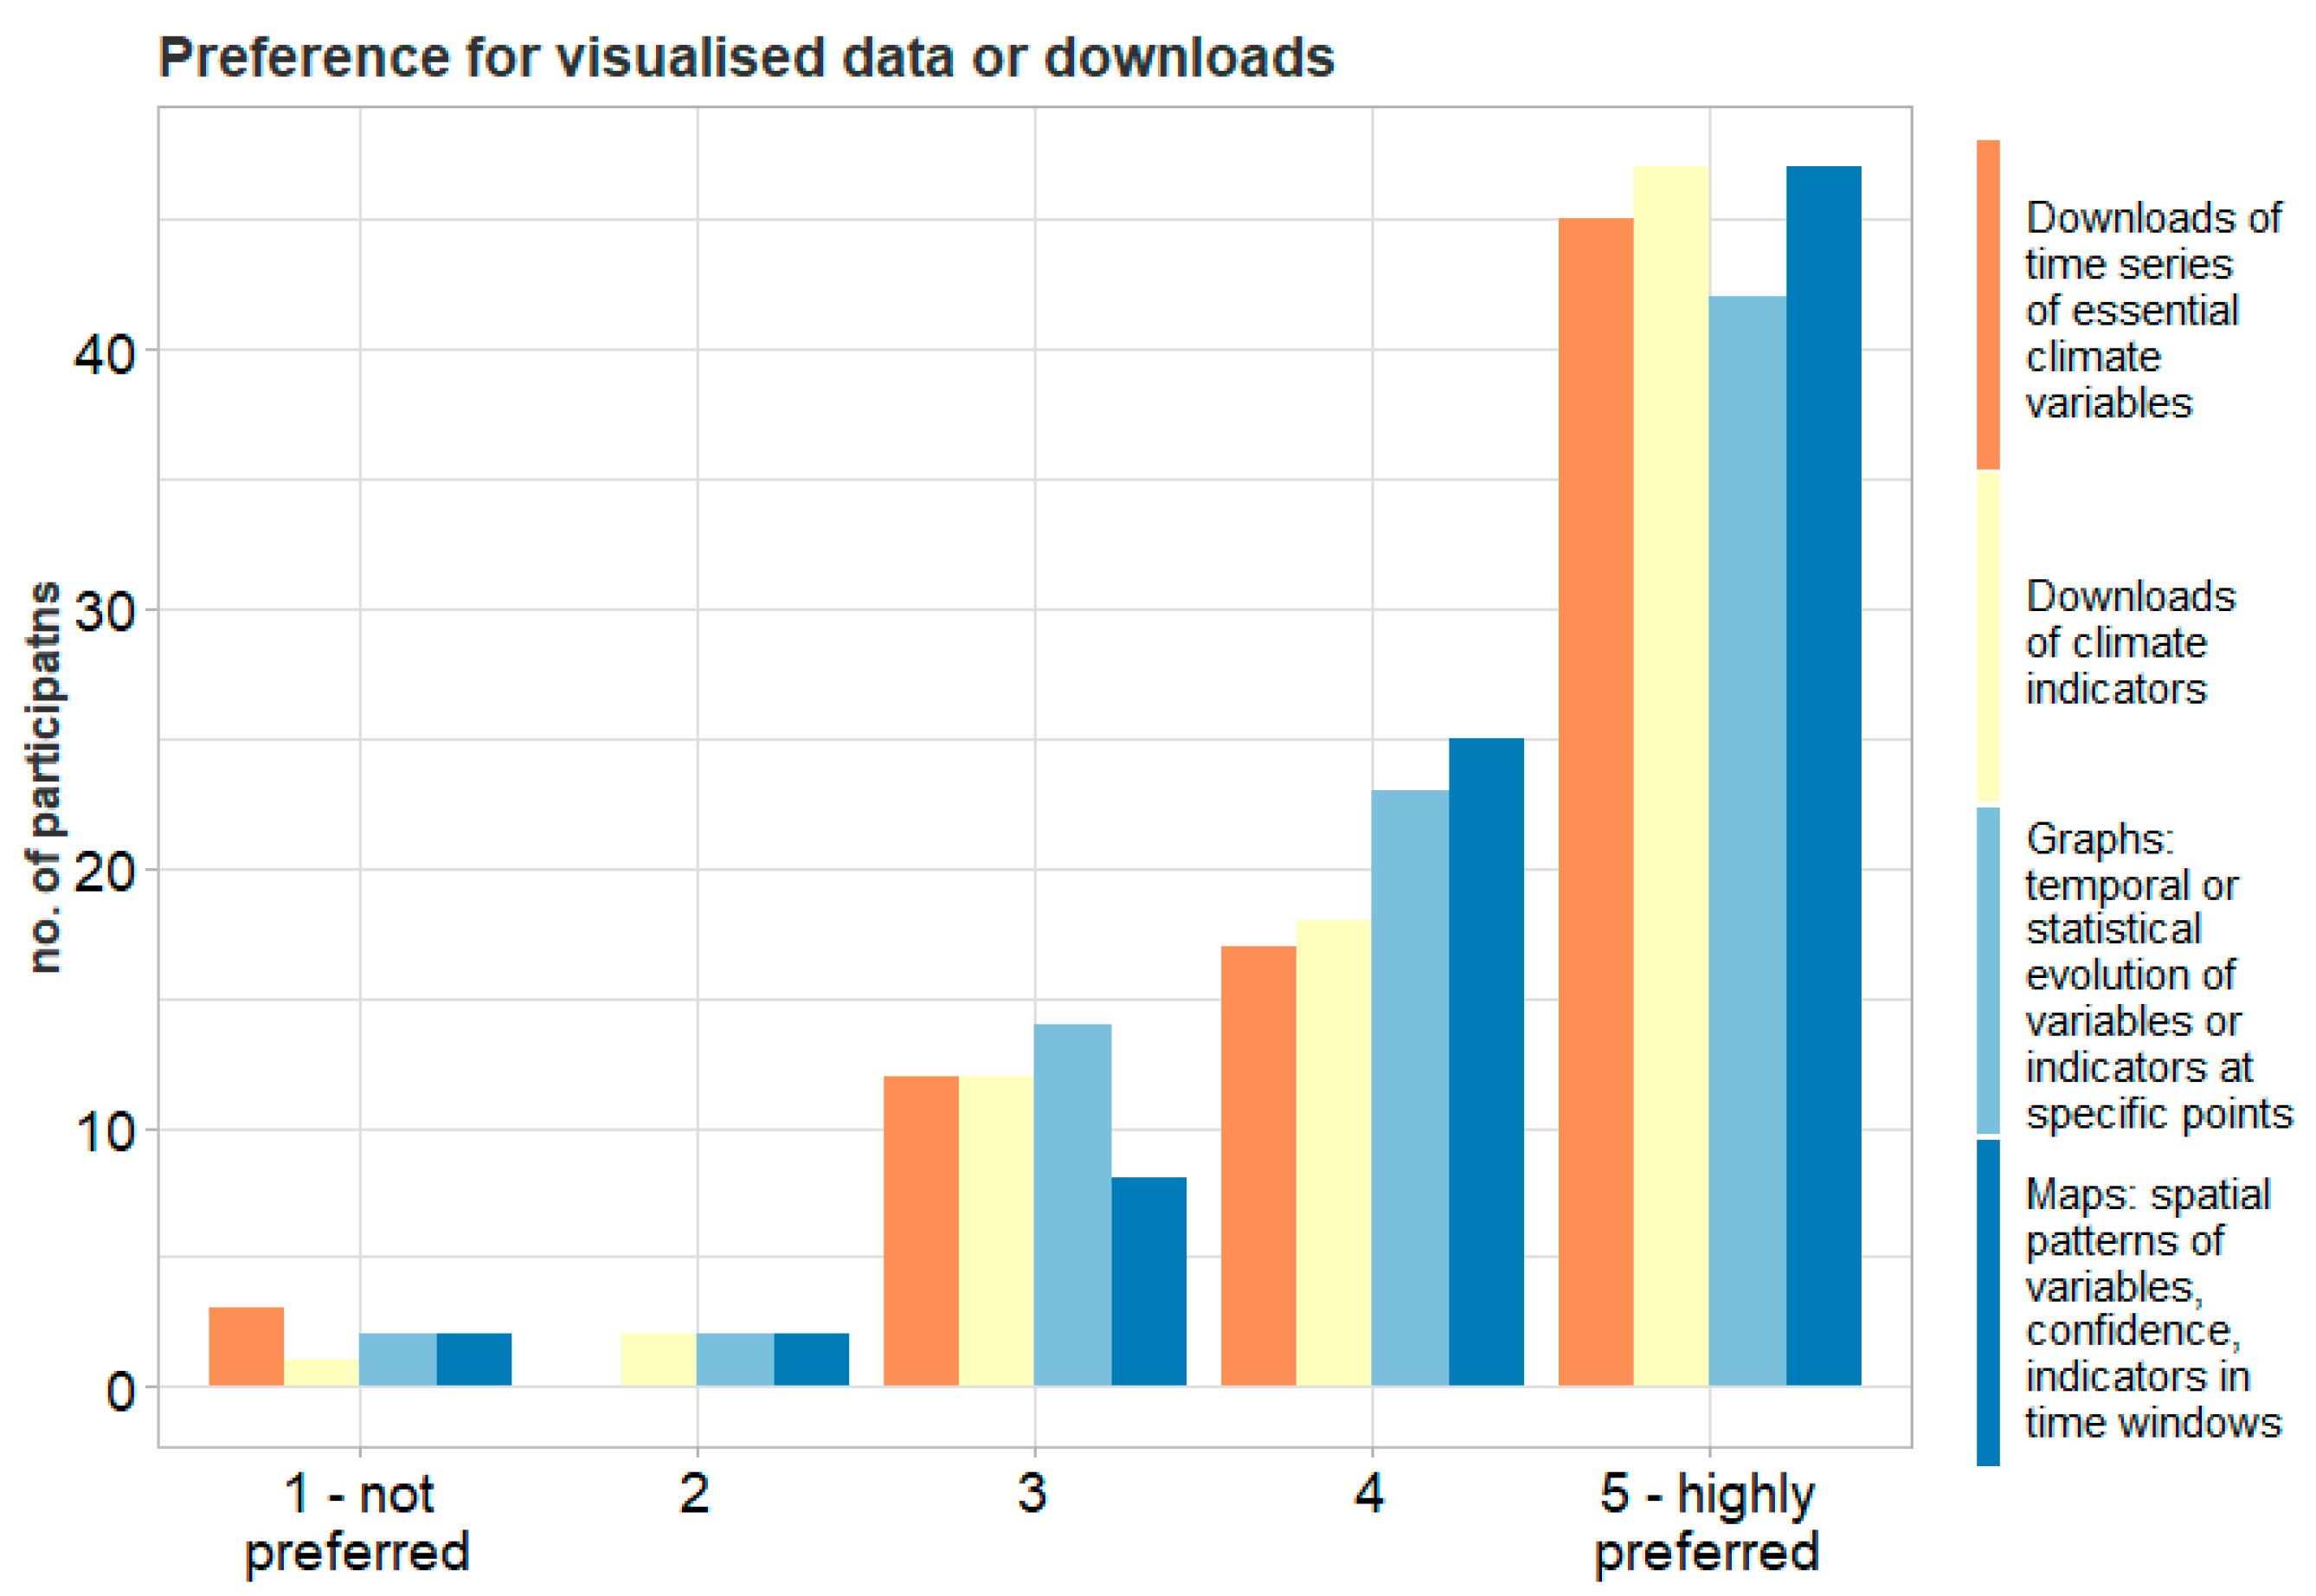
    Guidance: what kind of form they prefer to receive guidance for climate science and information (written, visual).
  • Understanding Users questionnaire: participants were asked about their roles and duties, insight, motivation, capacity, and support (in free text):
    Insight: what are the main obstacles for them to use climate change data and how to overcome them;
    Motivation: What are the main drivers, added value and goals for them in using climate change data?
    Capacity: What capacity do they think is needed to work with climate change data and adaptation? (main skills, methods, technology, and institutional collaborations);
    Support: What support would they need to use climate data in their climate science basis (education, training and guidance, FAQ, help desk, showcases)?

3. Results

3.1. The Climate Information Platform—Main Tools

There were two online tools developed in the prototype phase of the Climate Information; the Site-Specific Report (SSR) and the Data Access Platform (DAP). Each tool was designed to serve different users and their needs. The SSR target non-scientific audience who is looking for quick overviews of climatic change and want to have a ready-made analysis for a location. The DAP was designed for users with scientific expertise who want to make their own additional analysis having direct access to climate information and data. the content and design resulted from the feedback process that was implemented during the workshops, with the results presented here.

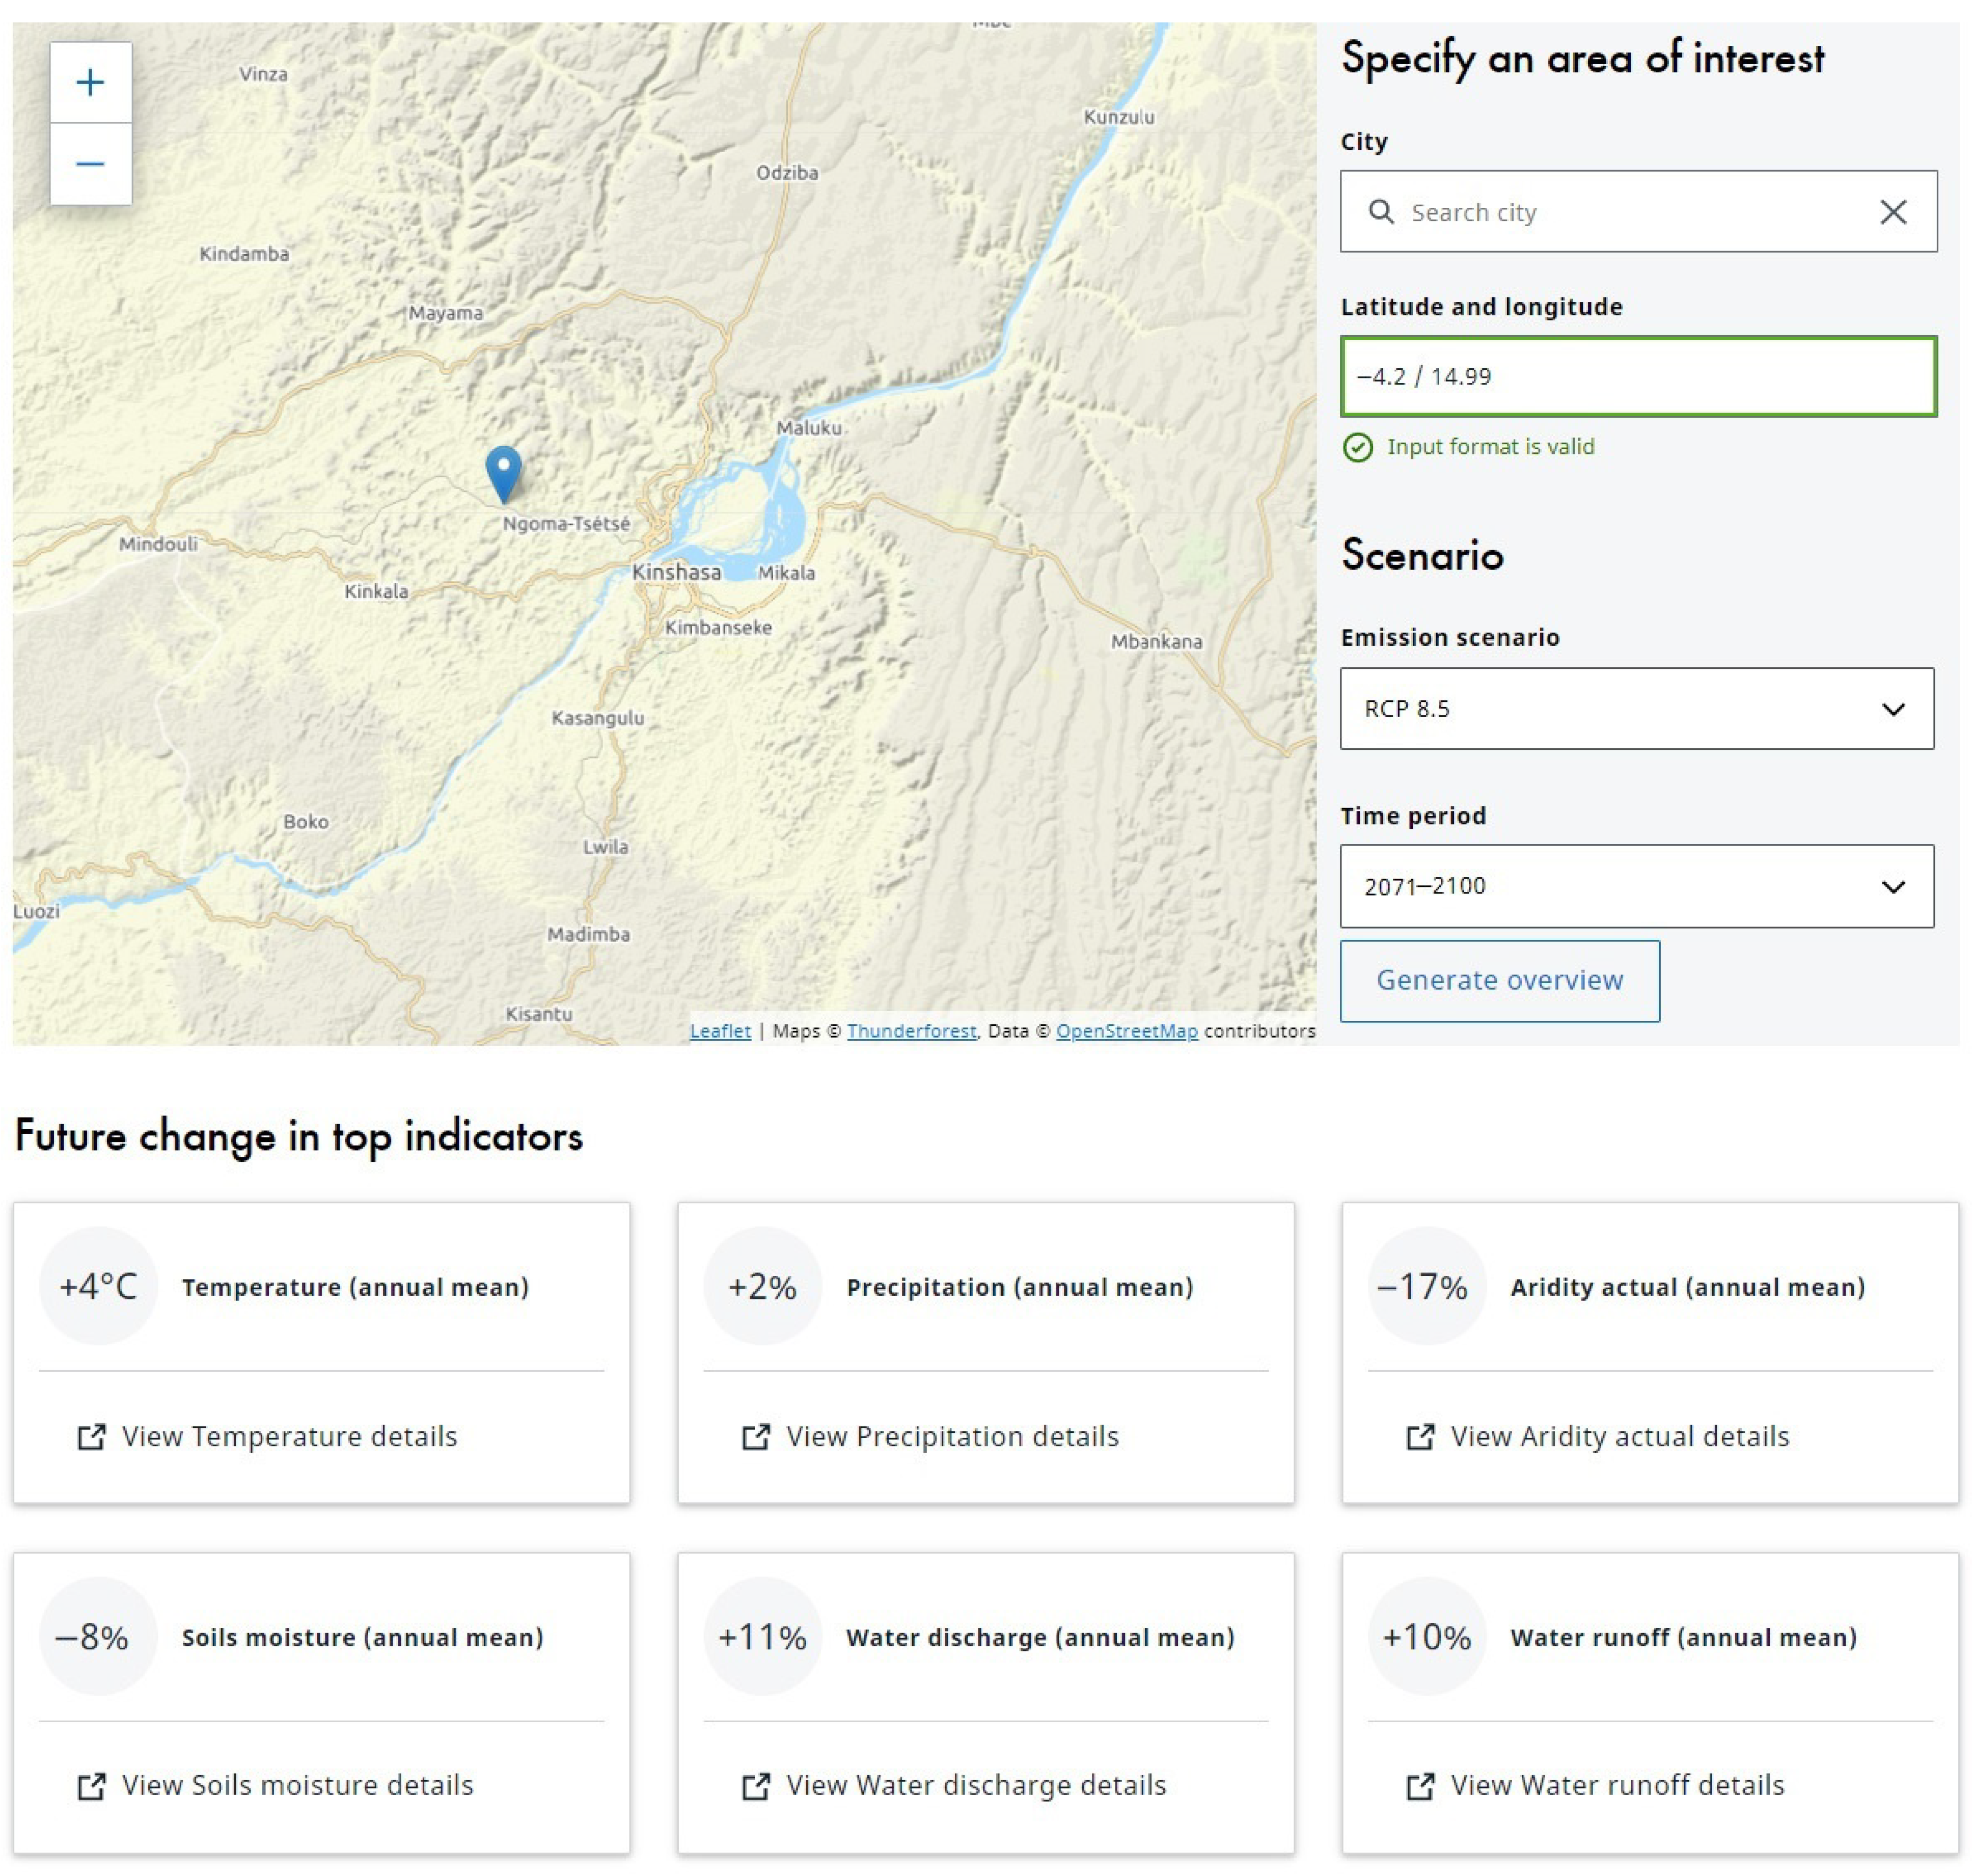
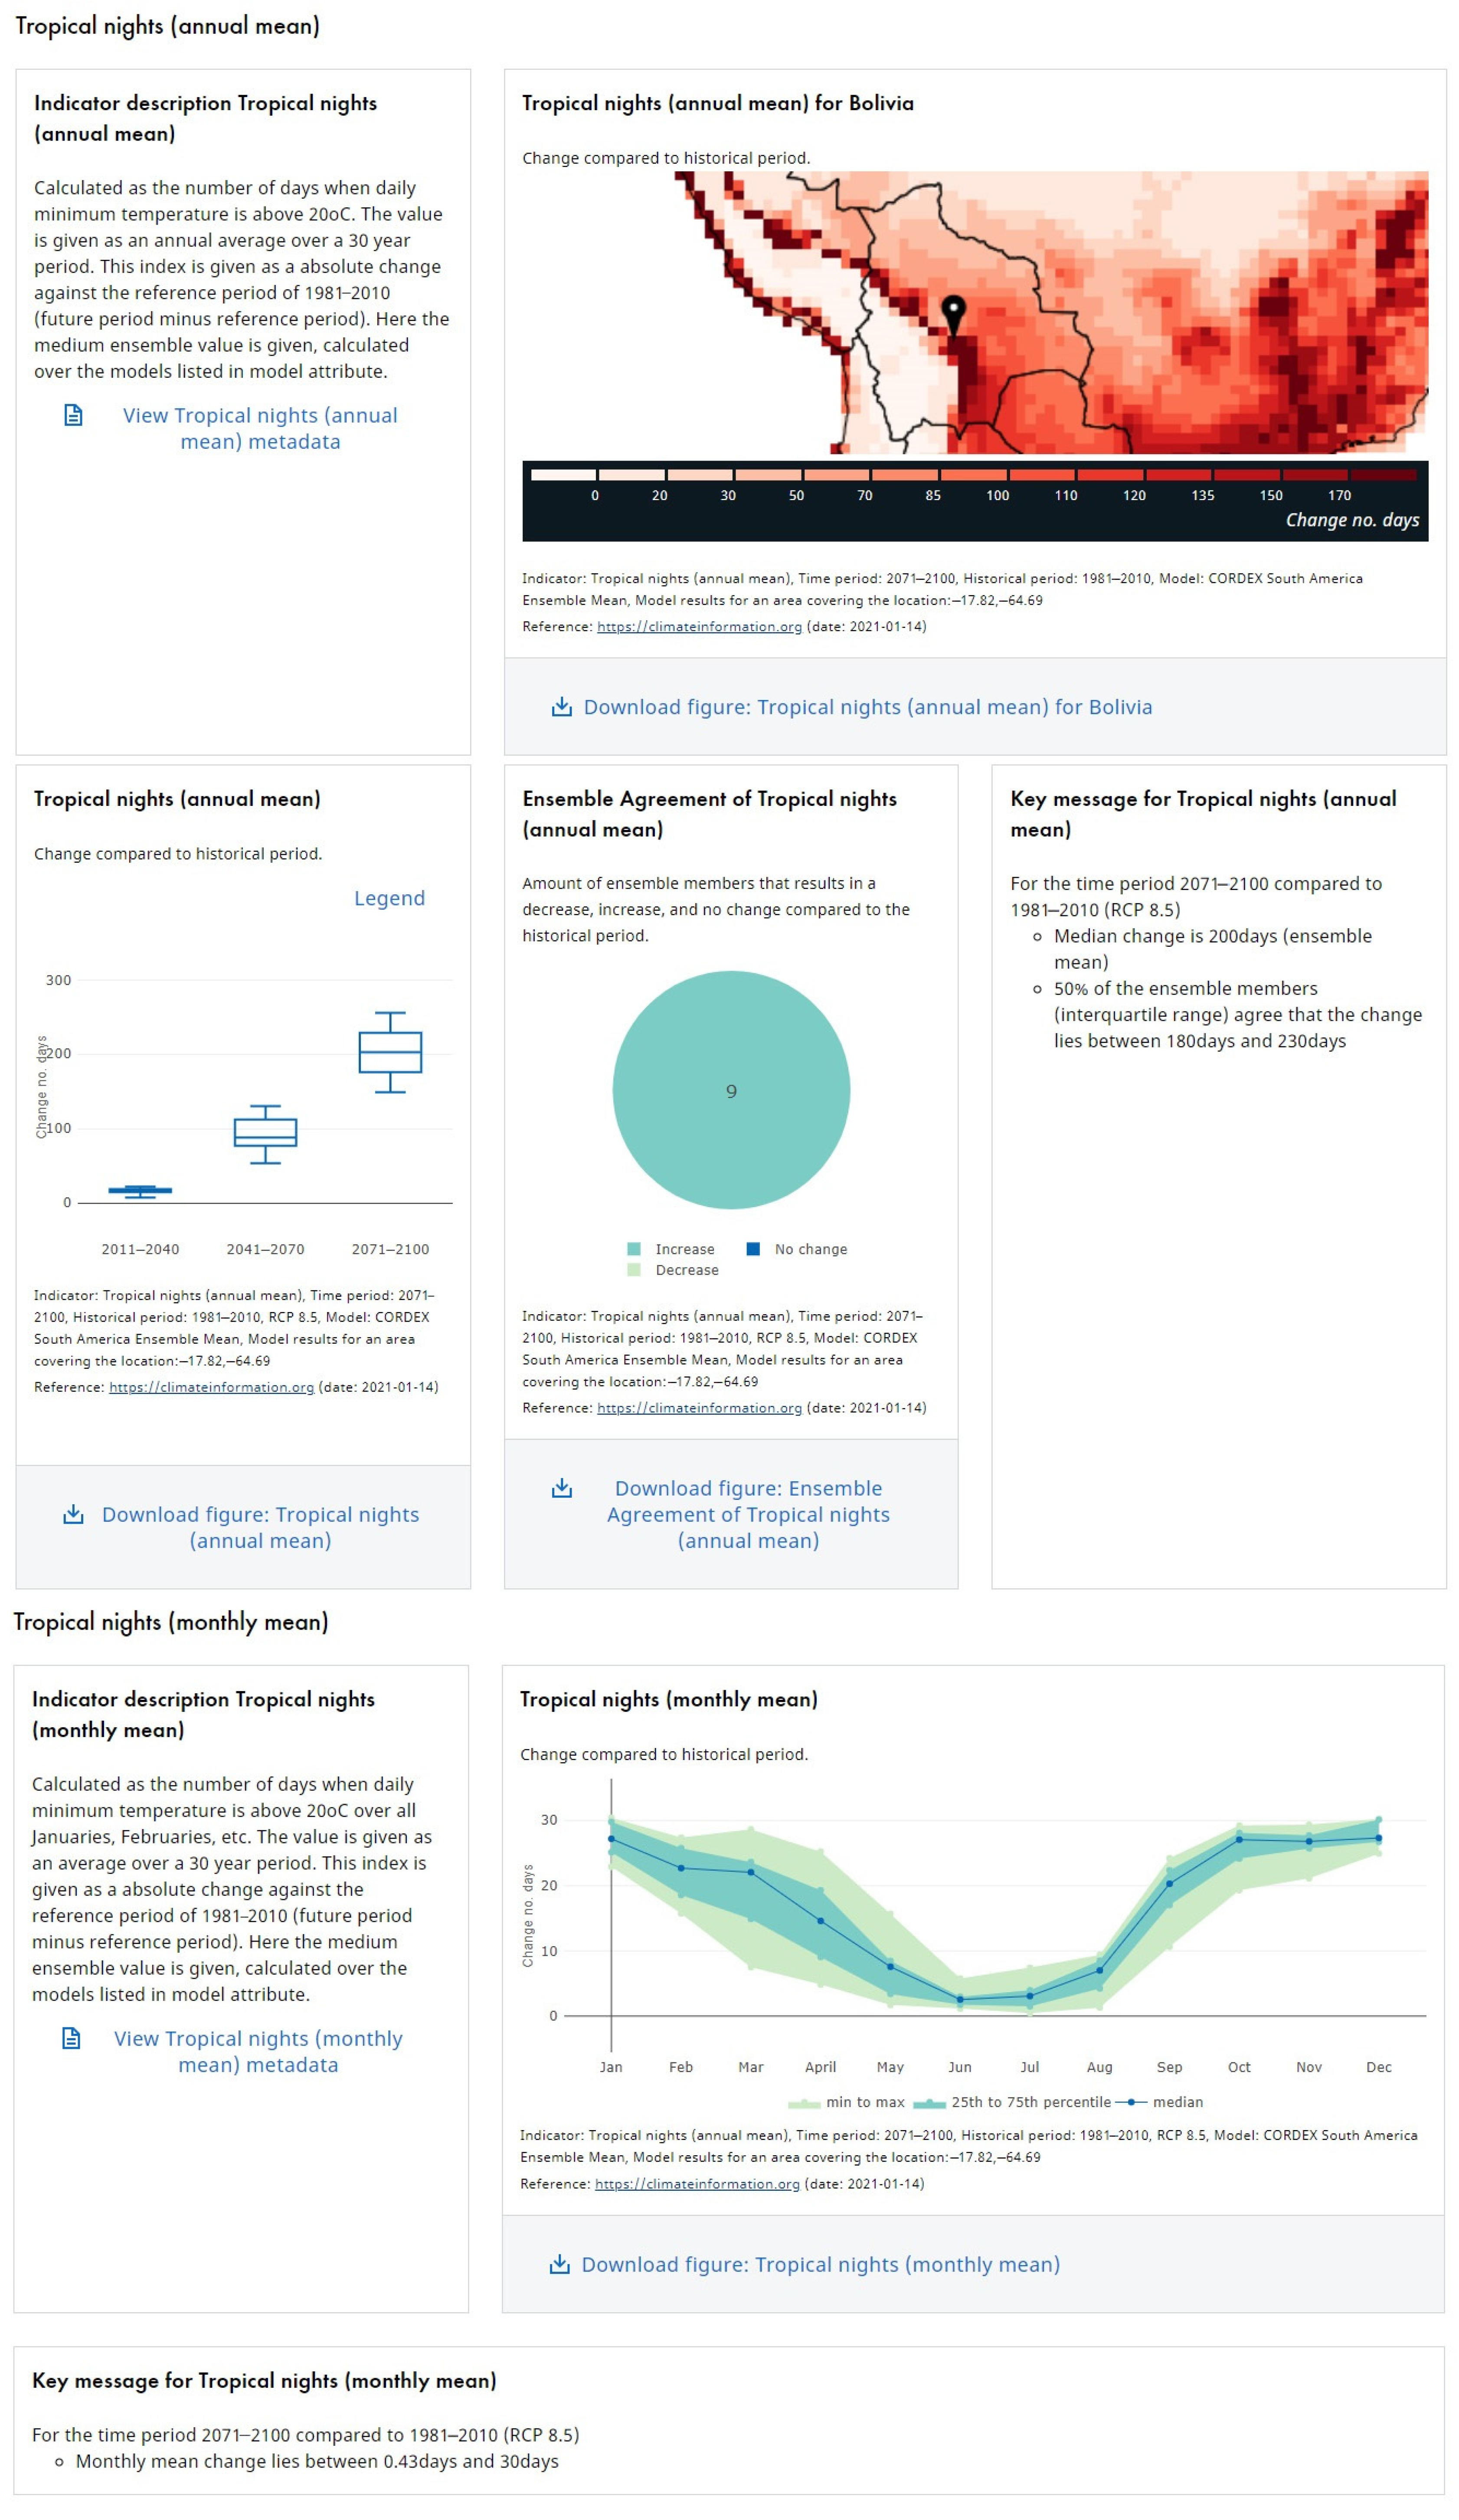
3.1.1. Site-Specific Report (SSR)

In the SSR, the user can select a location by filling in a city, coordinates (latitude, longitude) or click directly on the map. Further options are RCPs and future time periods (2011–2040, 2041–2070, and 2071–2100). When selections are made, an overview is generated using the best available climate models—CORDEX data are set as priority—depending on the selected location. When a location is not covered in the CORDEX data then CMIP5 data are used. Both CORDEX and CMIP5 data are bias adjusted as explained in the previous section. For the overlapping areas in the CORDEX domain, a priority is made to pre-select the domain with the higher number of models. The change in six top indicators (mean temperature, precipitation, aridity, soil moisture, and water discharge and water runoff) is listed at the top of the generated overview (Figure 4).
The users can then generate a quick overview, available in the dashboard, of the most important indicators in this region (Figure 5). Both annual mean and monthly mean for a 30-year future period of the selected indicator is presented in this view. All figures can be downloaded and used directly in the reports of the workshops or other reports. The dashboards in the SSR include:
For the annual mean of the indicator:
  • a short description of the indicator (annual mean) with a link to more details (metadata),
  • a map, covering the country or region of the selected point, showing annual mean of the indicator,
  • boxplots presenting the annual mean ensemble spread (median, 25–75 percentiles, and min–max) for the three time periods,
  • the ensemble agreement, i.e., how many models agree on the sign of change.
  • a key message of the indicator (annual mean)
The agreement on sign of change shows the number of models in an ensemble agreeing on a decrease, an increase or no change in the climate change signal of a particular indicator. The more models agreeing on the sign of change, the more robust the sign of change is. The user should be aware that small ensembles are less robust.
For the monthly mean of the indicator:
  • a short description of the indicator (monthly mean) with a link to more details (metadata),
  • a graph presenting monthly values (median, 25th—75th percentiles, and min–max)
  • a key message of the indicator (monthly mean).

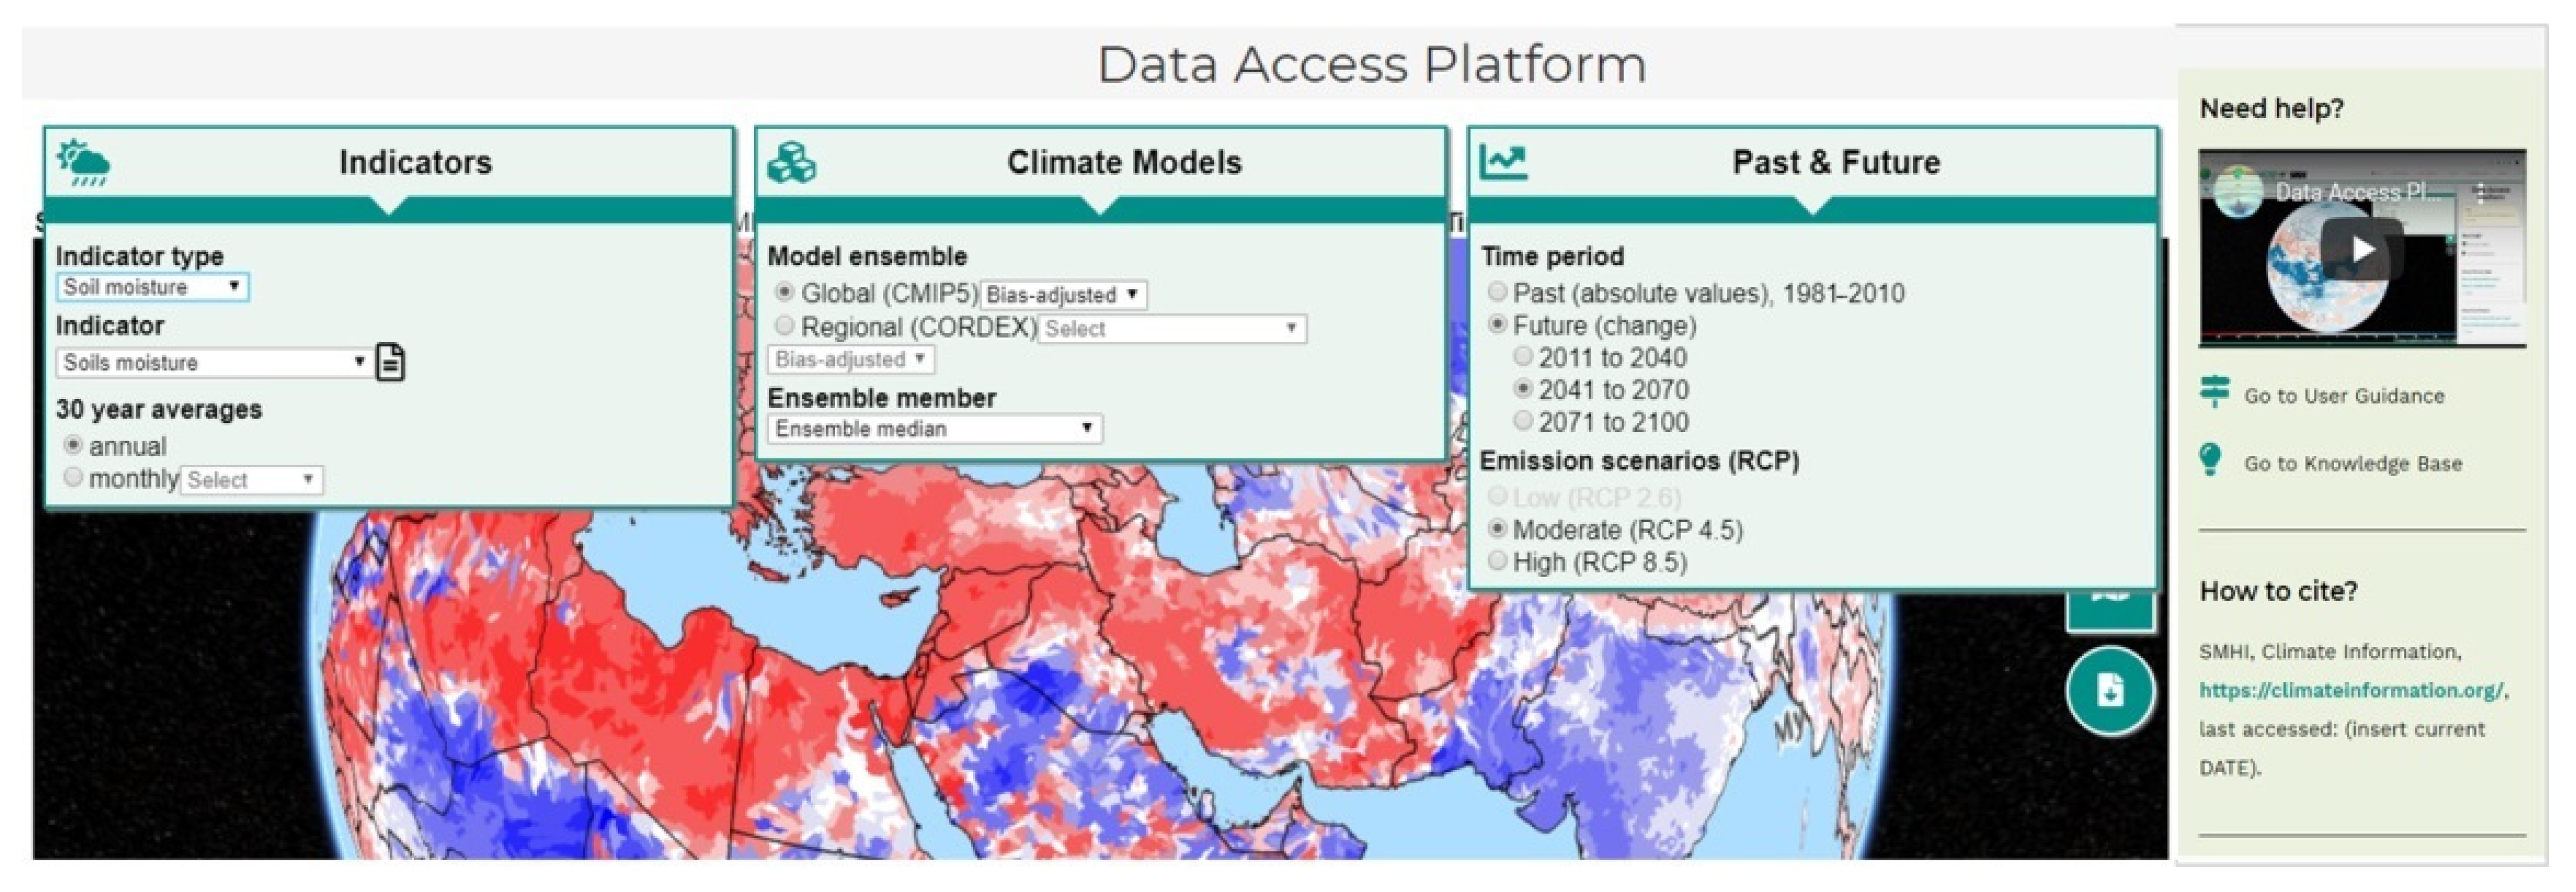
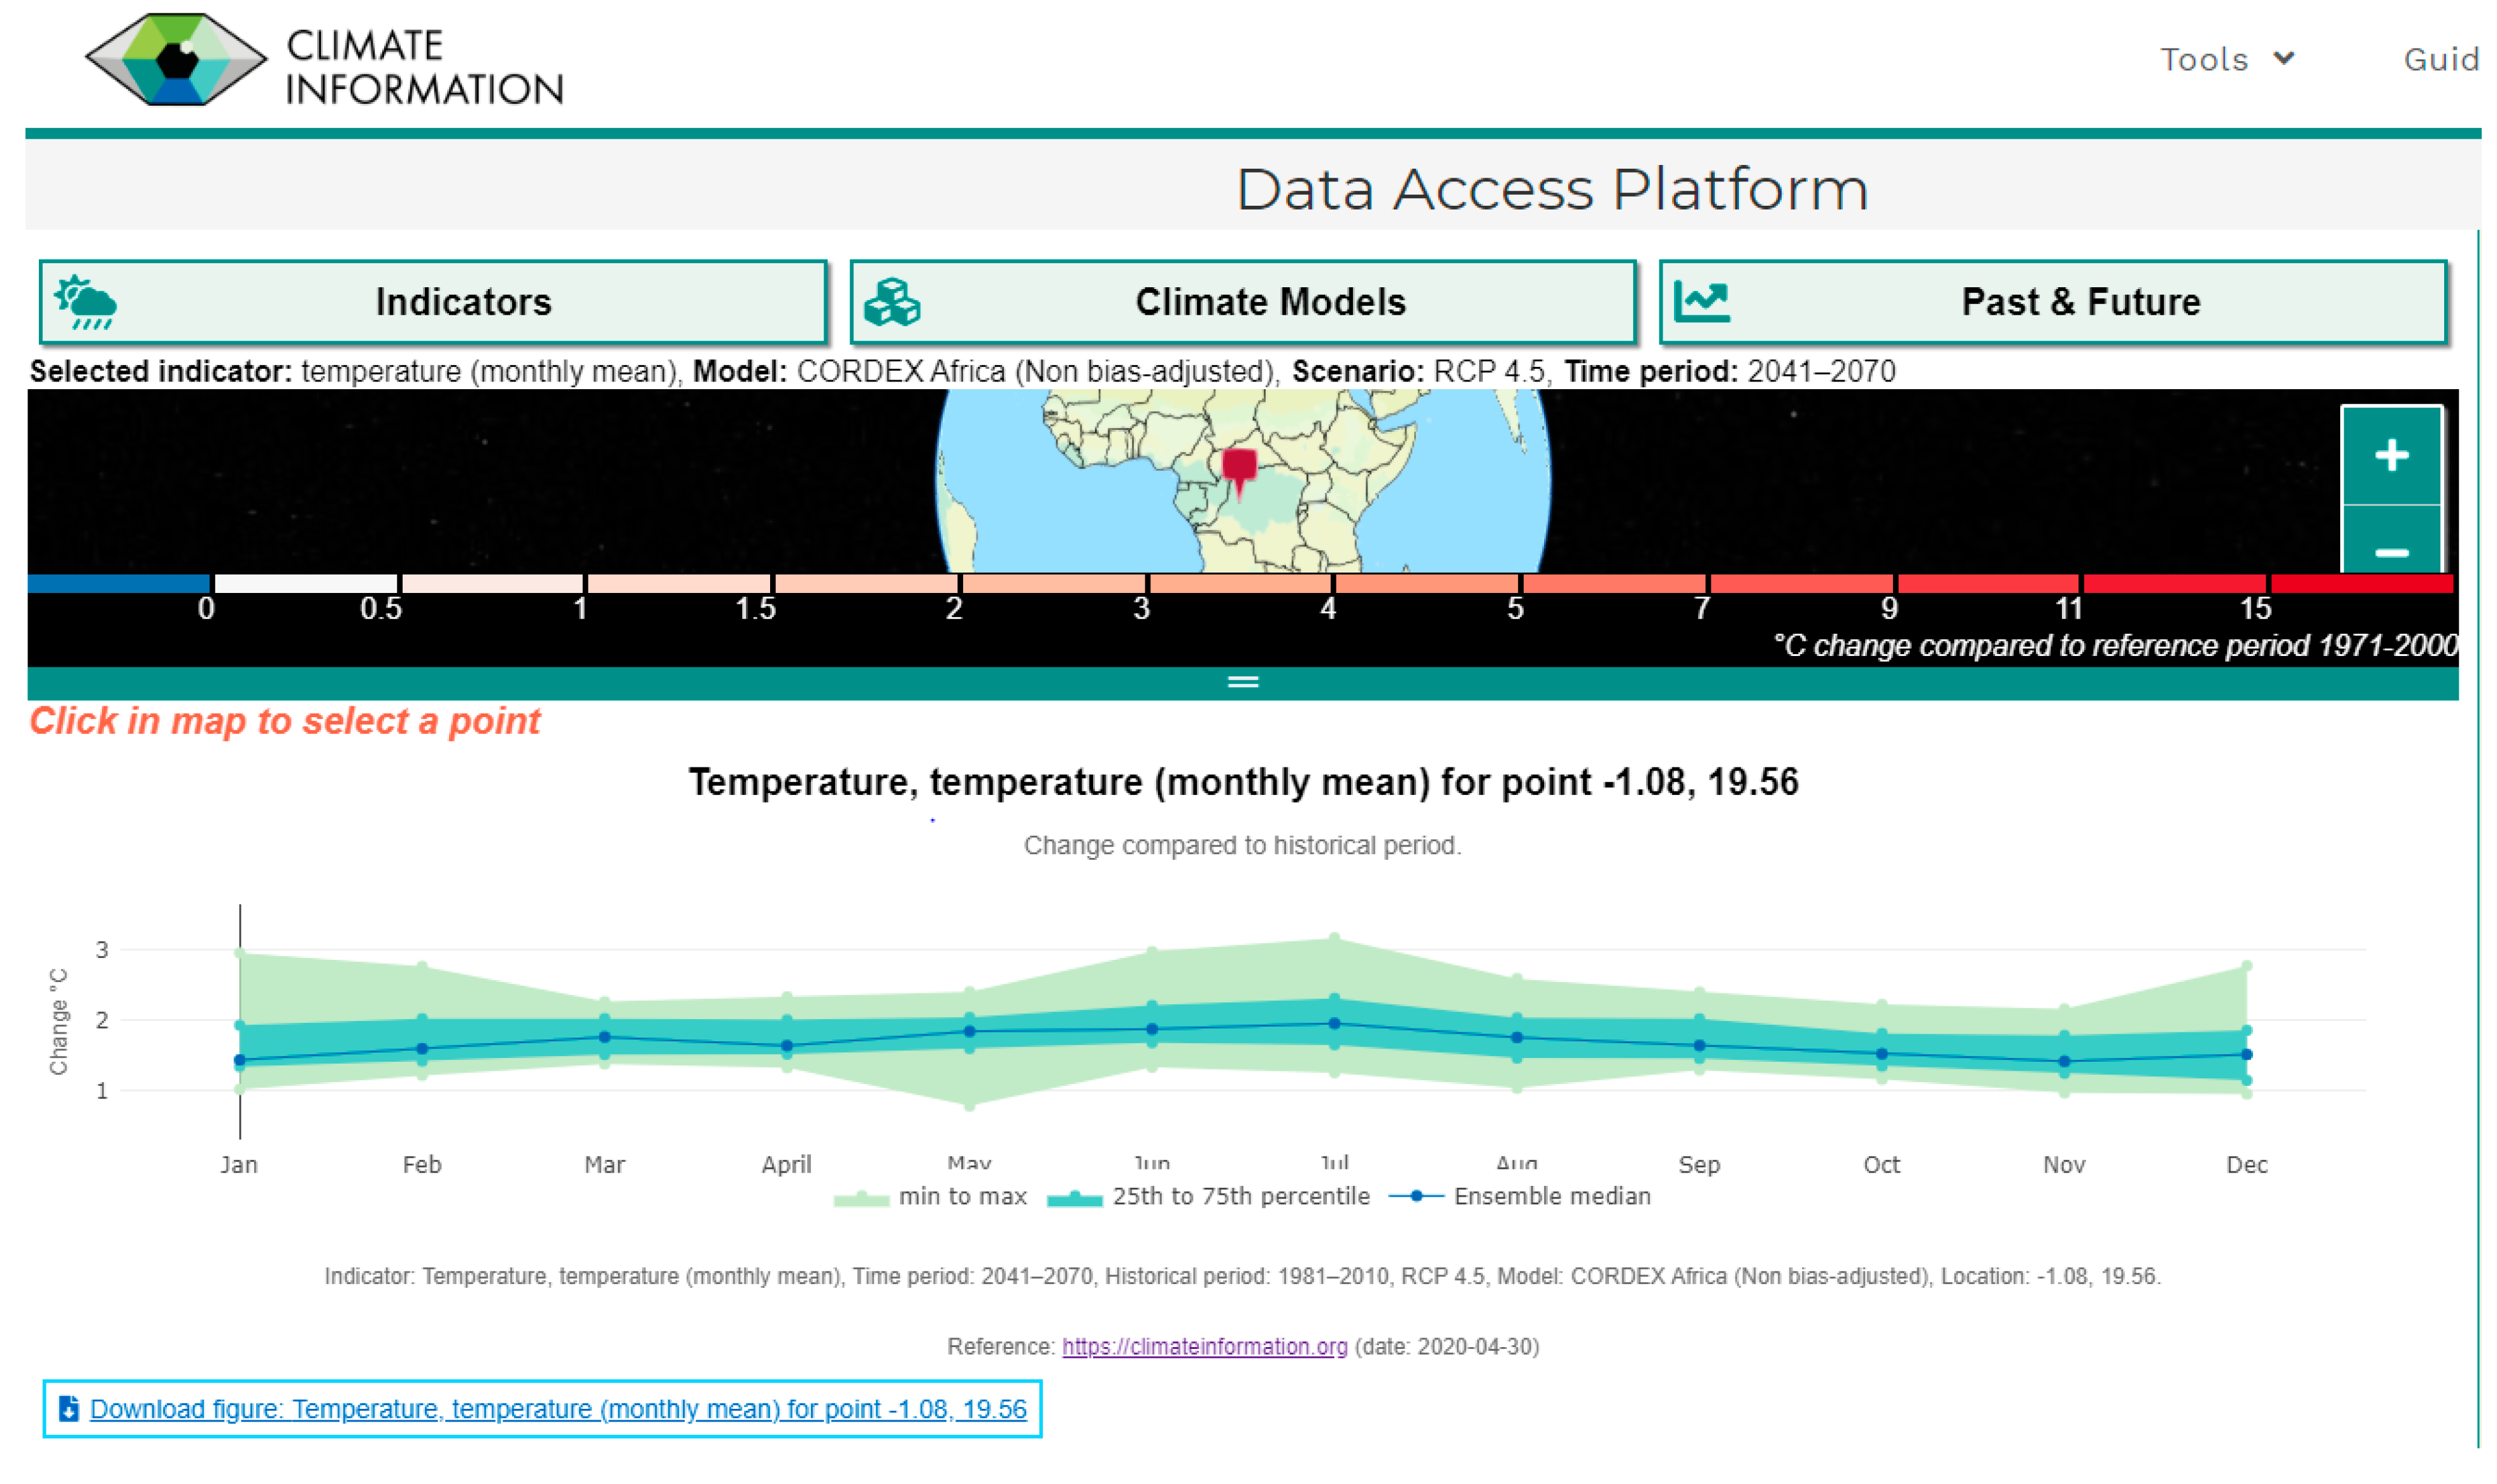
3.1.2. Data Access Platform

In the DAP (Figure 6) the user can make detailed selections for which data to visualise over the world. The right side of the DAP provides a short user guidance film and quick access to the User Guidance and Knowledge base pages. It also includes information about how to cite the data at https://climateinformation.org/.
There are three menu buttons available at the top: “Indicators”, “Climate Models”, and “Past & Future”. In the Indicator menu the user can select an indicator type and an indicator. It is possible to view 30-year averages as annual values or monthly values. In the climate model selection, the user can select between global models (CMIP5) and regional models (CORDEX, bias adjusted or not). Since this is a prototype, the menu of the DAP is currently under development and a future redesign of the menu should be expected. This will not however alter the way the data are presented in the DAP.
In summary, the CI and WI are available from CMIP5 and CORDEX data at global and regional level for a reference period and three future periods. The indicators in the historical period are shown in absolute values, while for the future periods the indicators are shown as changes with respect to the historical period (%, days, or °C, depending on the indicator). The user can select different RCP (2.6, 4.5, 8.5) depending on the availability of each domain. The CI are provided at global scale at 2-degree resolution using CMIP5 ensemble, at regional scale at 0.5-degree resolution (bias and not bias adjusted) using the CORDEX data for each domain. The WIs are provided at a catchment resolution using either the CORDEX or CMIP5 forcing data.
When a location is selected (by a click in the map) a graph is shown in the bottom of the application (Figure 7). Data for the selected point can be downloaded in NetCDF or Excel format. The graph can be downloaded as a PNG-file.

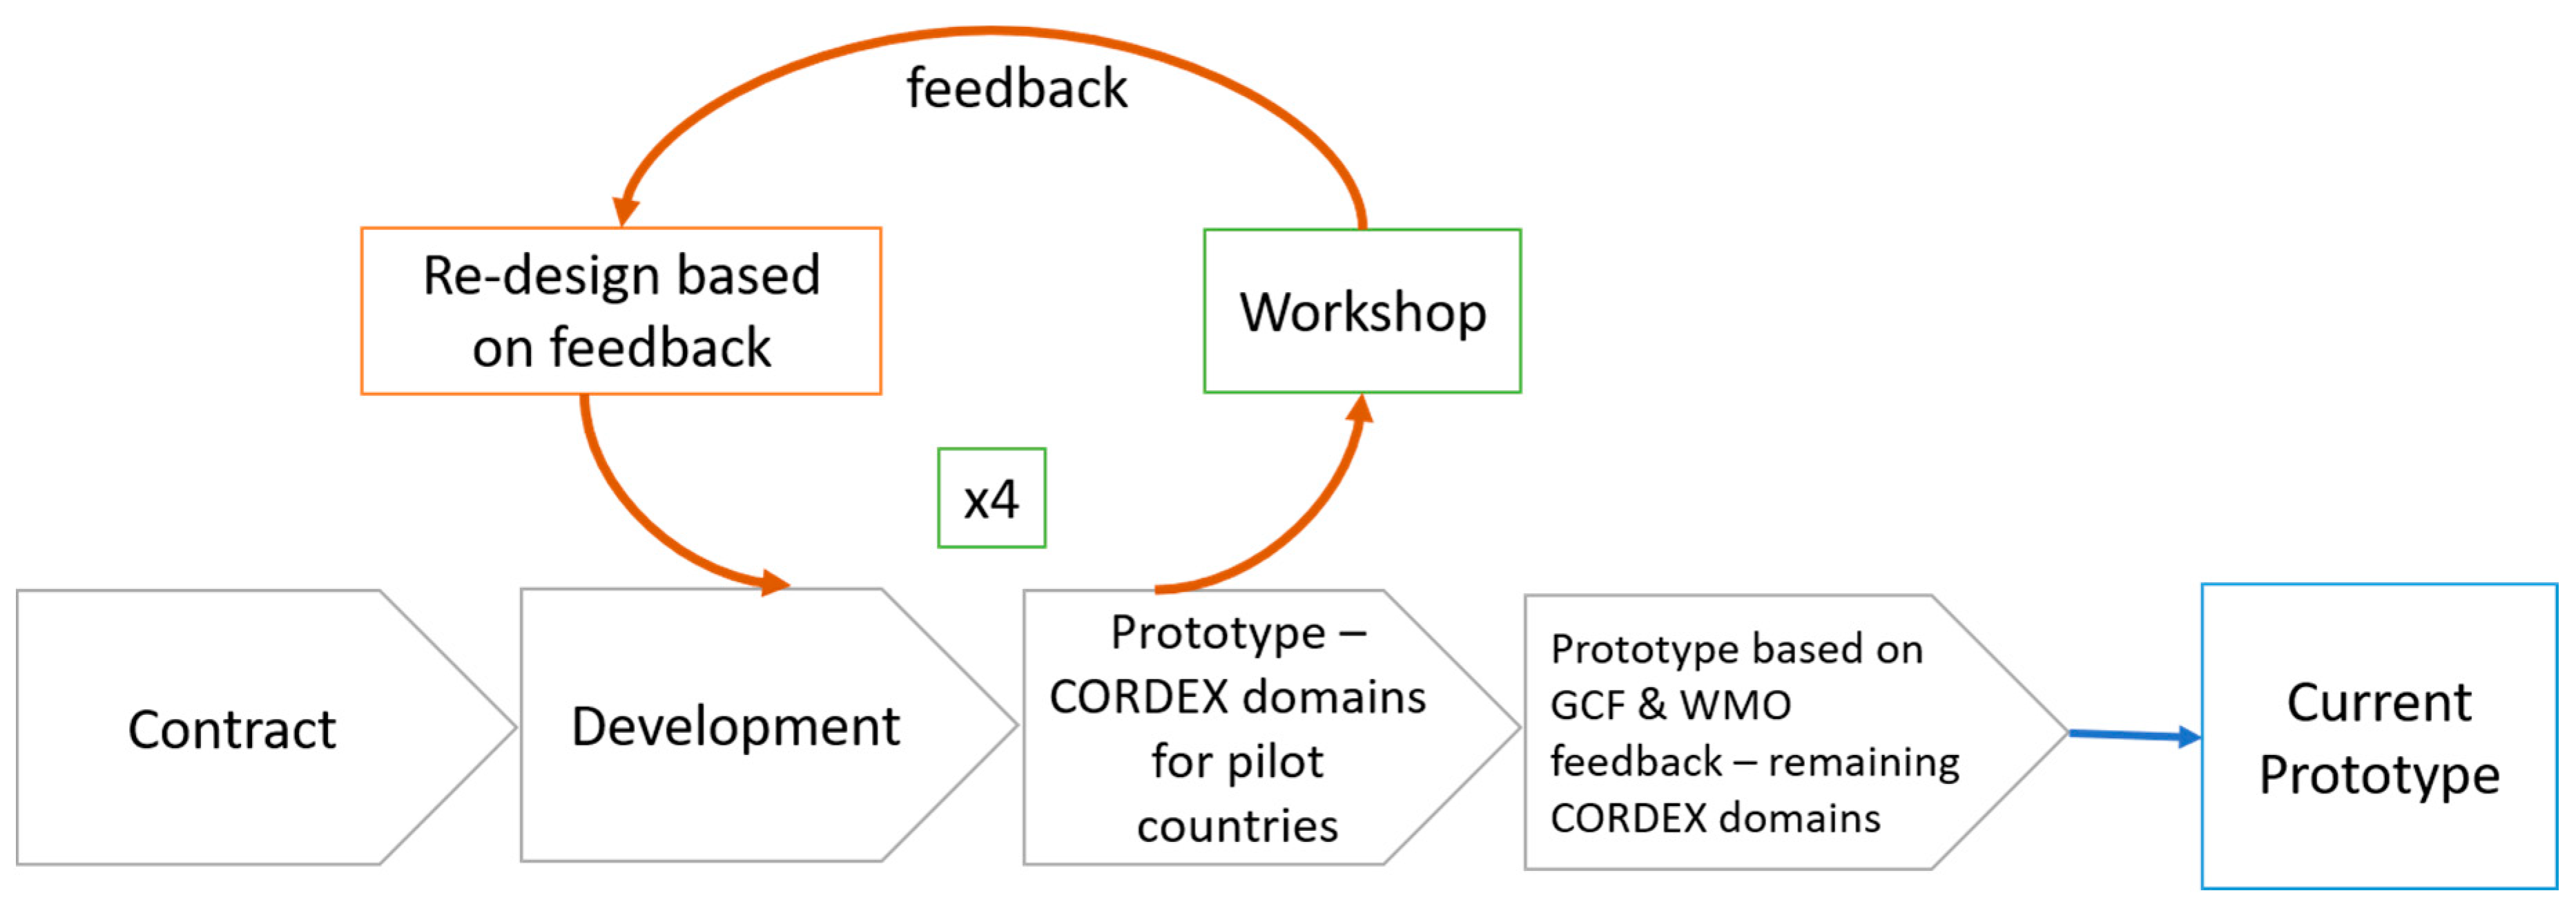
3.2. Development of the Climate Information Platform and Feedback Process

3.2.1. Quiz and Online Interactive Exercise

From the 4 workshops, 94 comments were received during the online interactive exercise (summarised in Appendix B). Overall, the participants of the workshops most often appreciated the user friendliness of the platform. The SSR tool that gives a summary on climate change for a region of interest was often appreciated, and specifically mentioned verbally during the workshops. Participants highlighted also the access to a wide range of climate data and ensembles over different periods. Further comments received regarding improvements in the platform were reviewed and while some of them were deemed too general or outside the scope of this project many of them were implemented, such as: making all figures in the SSR and DAP downloadable, creating filters in the SSR tool according to model agreement, extensive metadata information and enrichment of the Knowledge base of the platform. Users requests on all aspects of climate information, especially on higher resolution and additional variables and indicators were handed to WMO for further investigation and propose a way to be included in a future version of the platform.

3.2.2. Interactive Feedback Exercise

For the feedback questionnaire, 83 responses were received from all workshops (29 from St Lucia, 7 from DR Congo, 27 from Cape Verde, 20 from Cambodia). The indications from the two exercises presented here have guided, among other feedback received, the development of the SSR and DAP tools and enhanced their usability. The participants (users of the Climate Information) of the workshops mostly had a background in meteorology, followed by engineering and economics (Figure 8 left). The main current roles of the participants were researchers (27% of respondents) with policy makers and consultants also being very common (Figure 8 middle). The majority (64%) of workshop participants had more than 10 years of experience and these were mostly in researcher or consultant roles. Some users with no background in climatology and who are policy makers or managers are more interested in key messages and summaries such as the ones in the SSR tool. More technically advanced users (researchers or consultants) require or are more willing to use data that they can process themselves and include in their analysis. The DAP tool was designed for this purpose. To avoid potential misuse of the data, the Climate Information platform was equipped with user guidance up-front and also an extensive knowledge base with basic explanations of climate-science terminology and procedures.
Participants mostly use a climate service for a quick overview of climate trends, but many also want to access and download data and learn about climate science (Figure 9 left). Those that generally want the quick overviews also indicated that it was to become more knowledgeable, to teach others, or to make a synthesis (from raw data) (Figure 9 right). The main reasons climate information was needed were to decide if more detailed analysis was required, to become more knowledgeable, and to get data for their own impact model. Based on this user understanding, the SSR tool was then refined to provide clear information (metadata) regarding the indicators and to summarise key message regarding the future changes and confidence metrics. In the DAP tool a detailed graphical representation of the past and future changes was implemented presenting the full range of the ensemble with the median value and upper and lower quantiles.
Temperature and precipitation were the most commonly selected variables of interest, with soil moisture also often selected (Figure 10 left). The participants seem to know which variables were most important for their purpose. However, new indicators were not included the platform after this process at this stage since this was not possible to be implemented in this short contract. For instance, water quality related indicators require further model development to be produced at the global scale, which was not possible within the given time-frame or budget for service development.
Regarding preferred data resolutions, the participants were not in position to specify the resolution needed for their analysis (Figure 10 right). This originated from participants in St Lucia and Cambodia who selected ‘I don’t know’ for data resolution. Otherwise mostly higher resolutions (1 km, 5 km, and smaller catchments) were preferred, with very few selecting 2 degrees or catchments of 100 km2.
The majority of responses to number of ensemble members were “I don’t know” from all workshops, but those that did know, commonly chose 5–10 ensemble members (Figure 11 left). Very few respondents used an ensemble of 50 or more members. Overall, the future scenario of interest was most often 1.5 degrees, followed by RCP8.5 and RCP4.5 (Figure 11 middle). Participants most often selected similarities with other data sources and reports, expert opinion, and number of models in agreement to be what would make them trust climate data more. Very few selected that they did not know what would make them trust climate data more (Figure 11 right), which is a good sign and guided the development of the platform in how to use the different sources for judging robustness.
The participants had different preferences on how to best receive support and guidance and training within the different categories; written, video, in-person, online. The most highly rated within the written category was key messages; however the 1 page fact sheets and written reports were preferred (Figure 12 top left). The most highly preferred form of video information was the 5 min tutorial format. The other forms (20 min ‘ted talk’ style videos, or in-depth 1 h videos) were not really preferred (Figure 12 top right). The preferences for online and in person guidance information showed that in person guidance and training was more often preferred than online interactions in general. Preferred online interactions were an online forum, while not preferred interactions were 2 h video conferences and 2-day online video conferences showcasing climate assessments (Figure 12, bottom left). Almost all forms of in-person guidance and training were preferred, or highly preferred (Figure 12, bottom right). This gives opportunities for consultancy services linked to web-based platforms to meet the requests on capacity development and understanding in climate sciences.
Most users highly preferred all forms of visualised data, and rated maps, graphs, and download of time series or indicators very highly (Figure 13). As a result, both the SSR and DAP tool were improved to accommodate the needs in visualisation and download of data. In addition, further improvement for the download function is still ongoing and will allow the user to download a selected region, instead of point.

3.2.3. Understanding Users Questionnaire

For the free text exercise on Understanding the Users 80 responses were received in total from the three workshops (Democratic Republic of Congo excluded). The results are summarised and presented in Appendix C. A total of seven main types of users were identified based on the current role that the participants provided: Administrator (3 replies), Coordinator (15 replies), Meteorologist (7 replies), Policy makers or Government level role (16 replies), Scientist, Research or Data analysis role (23 replies), Technician or Technical role (13), and Other (3 replies). The participants in all workshops have a basic level of understanding climate change, its impacts and societal importance (e.g., under insight in most groups, Appendix B). Users are generally motivated by a desire to improve decision making processes for sustainable societies facing climate change. The technical group were specific about being motivated to using tools and data to understand climate change. Of the seven groups, four (coordinators, meteorologists, scientists, policy makers) mentioned that networks and institutional collaborations were needed to improve capacity. All groups want further support, education and guidance in climate change science. This resulted in platform development of the Guidance and Knowledge Base sections.
A significant effort was allocated to improve the Knowledge Base in the platform with respect to the results of the feedback exchange. The guidance available in the platform is design to educate the user in different steps required when using climate information and the tools in the platform. The Knowledge Base is being updated to incorporate even more FAQ that answer specific questions identified in the feedback process. Starting from which tool is more appropriate to use depending of different needs and skills, the user has then available a Knowledge Base in the form of FAQ, which is divided in the following sections:
  • Data variables: How to estimate local or regional climate change; What is a climate indicator; What is CMIP5 and CORDEX; What do different RCP mean, and what is a climate model and projections;
  • Data production and tailoring: Which methods was used to bias adjust global and regional climate variables; Global forcing data for hydrology; How to produce climate indicators; Why select an area for download of data instead of a single point; Problems discovered while processing the climate model data; Which quality controls are done when producing indicators; What is Statistical and Dynamical downscaling; Why is there a spread of values in the ensembles, Why use a model ensemble;
  • Confidence and Robustness: How to interpret ensemble value range; How to interpret agreement on signs of change; How to explore confidence in the data;
  • Climate Model Details: How to access daily time-series from climate models; What CORDEX Regional or CMIP5 Global models are available and which have been used.

4. Discussion

Access to data and instruments capable to include climate change in the decision-making process will be progressively important for a wide range of economic actors, such as insurers, cities, and investors, but also national authorities responsible to take mitigation or adaptation measures to tackle the impacts of climate change.
Recent research has shown, unsurprisingly, that the way stakeholders need and use climate information varies over regions and sectors [28]. This can pose a challenge in the development of climate services of global scale. At the same time when a larger number of localities gets mapped in global services, more sectors get covered, experience with climate-related decisions rises, and the knowledgeability of users grows [29].
Co-development on global scale for so many different users and sectors is not straightforward. In this paper, we present the development process of Climate Information platform and some main outcomes from the testing phase that took place in 4 workshops. Our results confirm the recommendations by [30], that scientific evidence should be guided by societal challenges. Limitations are visible in our process and, unavoidably, a balance is needed between the development of the service and the users’ needs, i.e., higher resolution climate information, the sectors of coastal management and fisheries required additional indicators, while further indicators and guidance on climate extremes and variability are needed in almost all sectors. Although we could not implement changes relating to the climate information available in the platform (out of the scope of this contract), we tried to improve the design and knowledge transfer through the platform and the workshops. All feedback gathered from the development of the service and the workshops are handed to WMO for further use and planning of the next phase of this platform.
During the development of the Climate Information service, specific selections had to be made to ensure that quality assured global and regional state-of-the-art data provided were appropriate not only for a range of different users but also for further use in local or socioeconomic assessments, which agrees with previous recommendations, e.g., [31,32,33]. We tried to provide transparency in this process by documenting it in a user-friendly way and with extensive guidance on how the data can be further used in impact assessment studies to avoid misapplication in downstream services as indicated in [34]. By providing transparency we acknowledge that research scientists face limitations related to knowledge transfer as climate information is often conditioned by climate models’ limitations, biases in the data, and skill of the hydrological models and confidence metrics which need further development [35,36]. This effort requires improvements from the developers’ side and demands additional training and education of the users. In the next version of the platform, we also need to find ways to improve and streamline the delivery of actionable information that will be important to the contribution to the climate service enterprise, as described by [37].
Geographically, economically, and socially vulnerable countries and communities cannot implement all types of adaptation since individuals not only act informed by scientific precepts, but also on the basis of crystallised cultural, political, social, and economic structures and relations. In many vulnerable countries, the national to local adaptation interventions have been tied only to available scientific evidence (mainly produced in the “global North” [38,39]) and technical capacity, and are often politically neutral responses to climate change. Thus, proposals submitted for international funding generally do not build upon, or tend to neglect, national science outputs and local, social impacts on communities, as was elaborated by [40,41]. We strongly believe that elaborated participatory processes, and an analysis of key governance mechanisms, are needed to build the capacity in the pilot countries to better understand the natural and anthropogenic drivers of climate variability and change and discerning how climate, in combination with the socioeconomic drivers of climate risk affects or could affect in the future, the socioeconomic or environmental outcomes of interest. Building capacities of national scientific infrastructures can increase the possibility for vulnerable countries to become “knowledge producers” and engage in international scientific efforts such as the Intergovernmental Panel on Climate Change (IPCC). At the same time, this enhances the applicability of climate research and scientific knowledge in policy and context-specific domains. This can subsequently lead to improved interventions at the national and local scale. Although this has not been the focus of our project at the time of implementation, it is an essential part of the WMO methodological approach and will be addressed in follow up efforts in the future.
The Climate Information prototype is still under development. A next step is needed for this information to be used into client-tailored climate services, including relevant impact-based data and forecasts and decision-making tools that the user can make use of. This necessitates a process of partnership-building, iterative dialogue, and feedback among providers and users of the service. A co-development process, is also needed as a future step where we can explore and dived into additional steps and analyses (e.g., defining and mapping the pre-existing knowledge background of the workshops’ participants; exploring and applying methodologies to merge different typologies of knowledges; shaping the climate science analyses to fit a variety of knowledge backgrounds, needs and perspectives; evaluation on mitigation and adaptation measures and policies). Many different factors influence the effectiveness of the application of climate services in decision-making and the ultimate benefits that flow to individual users and society as a whole from their use [42]. Co-development centred around knowledge is one of them. Studies from [43,44] confirm that critical sources of international climate finance have been mainly focused on financing activities with a strong emphasis on capacity building, often overlooking the importance of knowledge management and implementation of climate actions. The ultimate benefit from the use of climate services depends at least as much on the effectiveness of the climate service design and delivery process as it does on the inherent scientific quality of the information provides, hence user engagement and knowledge co-development is critical in the generation of climate services socioeconomic benefits.
The web-based platform presented here is meant for use in planning for climate adaptation and mitigation measures in vulnerable countries. The prototype serves as a tool between GCF, WMO, and stakeholders in regions that are in great need of access to state-of-the-art climate data and information using the latest regional climate models, allowing them equal access and opportunities in the global climate adaptation arena.
Globally available climate and water data and information, with funding and investments from suitable organisations is a combination needed to enable national stakeholders to take actions and tackle climate change impacts. At the same time capacity building and transfer of knowledge are required to train users on proper use of climate information. Although we present here an attempt to bridge the gap between access to data and knowledge and capacity, further significant research activities are required and should be prioritised by research and funding organisations.
Climate data are transformed into bespoke information and with provided knowledge and capacity; the climate services could support a science-based and forward-looking environment where climate becomes an essential variable in the decision-making process. Sharing the right information to the right audience can be an empowering tool, and we support the previous findings that climate services are such instruments when co-developed with users [7,45]. Effective interdisciplinary and cross-sectoral collaboration is an important prerequisite for the transformation of climate data and information into climate services, blending climate knowledge with sector-specific knowledge. Despite the growing evidence on the benefits their use generates [9,14,46,47], we follow the arguments that web-based services designed, especially at global scale, are required to have a virtual venue where usable science [9] is presented in a functional and friendly way. When information is disseminated in suitable formats to policy makers, scientists, media, and communities, the returns can be witnessed in science-informed decision-making, long-term planning, and an enhanced engagement of communities toward a more resilient and equitable future.
However, there are certain limitations to the interdisciplinary approach that cannot be overlooked, and we must provide scientific information that is useful and actionable by the stakeholders in the pilot countries. This does not end here, but it entails a frequent, sustained and iterative interaction between climate data providers and developers, knowledge purveyors such as the international experts and users (both local and international) in each of the countries. We need to ensure that climate-science information is contextual, credible, legitimate, and understood by the users, and helps to unpack the bio-physical and socioeconomic mechanisms that reproduce climate change vulnerability over time and space.

5. Conclusions

In this paper we present how the development process influenced the design of a new global web-based climate service platform (https://climateinformation.org/), which is meant to be used in planning for climate adaptation and mitigation measures in vulnerable countries. The platform was tested in 4 workshops and during our interaction with the users we learnt that:
  • There are different needs in each country on multiple levels. In the four workshops that were held the needs were not only different between the pilot countries but also between the sectors in each country. For instance, in St. Lucia and Cambodia there was a strong need for capacity building on bias adjustment and downscaling methods, while in DRC and Cabo Verde primarily data and basic information were needed, especially for the energy and agriculture sector. In all pilot countries there was a strong need for more general knowledge in climate science, while in most countries there was also an increasing need of capacity in hydrological modelling and water management.
  • The co-development process is not always institutionalised in vulnerable countries and the capacity level restricts national entities to only act via international intermediaries. The level of knowledge and capacity in climate and hydrological science in the pilot countries varied significantly, which was an important obstacle when establishing a direct access modality to support international, national, and sub-national organisations. It was difficult to identify a “one-size-fits-all” for the web platform and it thus resulted in providing different tools as the user groups were too broad. Our interactions with the users, which covers a small part of a co-development process, facilitated the dialogue between service developers and users. Understanding the users, transparency on potentials and limitations of climate services, and capacity development in climate science and methods were required components in the co-development process.
  • The web-based climate service was improved considerably through co-design and it changed continuously in an agile approach during the one-year project period. It was important to have a service up and running already from the start to get adequate user feedback, and thus, the co-development must start from an already existing product that can be transformed easily. When further designed to become user friendly, we managed to provide access to key information, in a usable way that satisfies the needs of different users’ profiles.

Author Contributions

Conceptualisation, C.P. and B.A.; Data curation, C.P., T.B., R.C., M.E., K.K., L.S.; Formal analysis, C.P., B.A., T.B., I.G., K.K., L.L., L.S.; Investigation, C.P., B.A., R.C., M.E., I.G., F.G., K.K., L.L., I.R., L.S., E.S.; Methodology, C.P., B.A., T.B., R.C., K.K.; Validation, C.P., B.A., T.B., R.C., M.E., I.G., F.G., L.L., I.R., L.S., E.S.; Visualisation, C.P., F.G.; Writing—original draft, C.P.; Writing—review and editing, C.P., B.A., T.B., R.C., M.E., I.G., K.K. and L.S. All authors have read and agreed to the published version of the manuscript.

Funding

This research was funded by the Green Climate Fund (GCF), the World Meteorological Organisation (WMO) and the World Climate Research Programme (WCRP).

Acknowledgments

The data presented in this study are openly available in https://climateinformation.org/ (climateinformation.org is developed by SMHI on behalf of WMO, WCRP and GCF). We acknowledge all the participants of the WMO workshops for their engagement during and after the workshops regarding the Climate Information platform.. We acknowledge the World Climate Research Programme’s Working Group on Coupled Modelling, which is responsible for CMIP and CORDEX, and we thank the climate modelling groups (listed in Appendix A of this paper) for producing and making available their model output. For CMIP the U.S. Department of Energy’s Program for Climate Model Diagnosis and Intercomparison provides coordinating support and led development of software infrastructure in partnership with the Global Organisation for Earth System Science Portals. Additionally, we acknowledge the CORDEX Project office and community, from which input data were used. We acknowledge the project AQUACLEW, which is part of ERA4CS, an ERA-NET initiated by JPI Climate, and funded by FORMAS (SE), DLR (DE), BMWFW (AT), IFD (DK), MINECO (ES), ANR(FR) with co-funding by the European Union (Grant 690462).

Conflicts of Interest

The authors declare no conflict of interest.

Appendix A

Complete list of CORDEX Regional models for each domain, with the GCM and RCM combination, the used realisation and for which RCP (2.6, 4.5, 8.5) they are available.
Table A1. AFRICA (AFR-44).
GCM RCMRealisationRCP4.5RCP8.5RCP2.6
CCCma-CanESM2CRCM5r1i1p1yesnono
CCCma-CanESM2RCA4r1i1p1yesyesno
CSIRO-QCCCE-CSIRO-Mk3-6-0RCA4r1i1p1yesyesno
ICHEC-EC-EARTHCCLM4-8-17r12i1p1yesyesno
ICHEC-EC-EARTHRACMO22Tr1i1p1yesyesno
ICHEC-EC-EARTHRACMO22Tr12i1p1nonoyes
ICHEC-EC-EARTHRCA4r12i1p1yesyesyes
ICHEC-EC-EARTHREMO2009r12i1p1yesyesyes
IPSL-IPSL-CM5A-LRREMO2009r1i1p1nonoyes
IPSL-IPSL-CM5A-MRRCA4r1i1p1yesyesno
MIROC-MIROC5RCA4r1i1p1yesyesyes
MIROC-MIROC5REMO2009r1i1p1noyesyes
MOHC-HadGEM2-ESCCLM4-8-17r1i1p1yesyesno
MOHC-HadGEM2-ESRACMO22Tr1i1p1yesyesyes
MOHC-HadGEM2-ESRCA4r1i1p1yesyesyes
MOHC-HadGEM2-ESREMO2009r1i1p1noyesyes
MPI-M-MPI-ESM-LRCCLM4-8-17r1i1p1yesyesno
MPI-M-MPI-ESM-LRCRCM5r1i1p1yesnono
MPI-M-MPI-ESM-LRRCA4r1i1p1yesyesyes
MPI-M-MPI-ESM-LRREMO2009r1i1p1yesyesyes
NCC-NorESM1-MRCA4r1i1p1yesyesyes
NOAA-GFDL-GFDL-ESM2MRCA4r1i1p1yesyesno
Table A2. Central America (CAM-44).
GCM RCMRealisationRCP4.5RCP8.5RCP2.6
CCCma-CanESM2RCA4r1i1p1noyesno
CSIRO-QCCCE-CSIRO-Mk3-6-0RCA4r1i1p1noyesno
ICHEC-EC-EARTHRCA4r12i1p1yesyesyes
IPSL-IPSL-CM5A-MRRCA4r1i1p1noyesno
MIROC-MIROC5RCA4r1i1p1noyesyes
MOHC-HadGEM2-ESRCA4r1i1p1yesyesyes
MPI-M-MPI-ESM-LRRCA4r1i1p1yesyesyes
NCC-NorESM1-MRCA4r1i1p1noyesyes
NOAA-GFDL-GFDL-ESM2MRCA4r1i1p1noyesno
Table A3. West Asia (WAS-44).
GCM RCM RealisationRCP4.5RCP8.5RCP2.6
CCCma-CanESM2RCA4r1i1p1yesyesno
CCCma-CanESM2RegCM4-4r1i1p1yesyesno
CSIRO-QCCCE-CSIRO-Mk3-6-0RCA4r1i1p1yesyesno
CSIRO-QCCCE-CSIRO-Mk3-6-0RegCM4-4r1i1p1yesyesno
ICHEC-EC-EARTHRCA4r12i1p1yesyesyes
IPSL-IPSL-CM5A-MRRCA4r1i1p1yesyesno
MIROC-MIROC5RCA4r1i1p1yesyesyes
MOHC-HadGEM2-ESRCA4r1i1p1yesyesyes
MPI-M-MPI-ESM-LRRCA4r1i1p1yesyesyes
MPI-M-MPI-ESM-LRREMO2009r1i1p1yesyesyes
MPI-M-MPI-ESM-MRRegCM4-4r1i1p1yesyesno
NCC-NorESM1-MRCA4r1i1p1yesyesyes
NOAA-GFDL-GFDL-ESM2MRegCM4-4r1i1p1yesyesno
NOAA-GFDL-GFDL-ESM2MRCA4r1i1p1yesyesno
Table A4. Artic (ARC-44).
GCM RCMRealisationRCP4.5RCP8.5RCP2.6
ICHEC-EC-EARTHRCA4-SNr12i1p1noyesno
ICHEC-EC-EARTHRCA4r12i1p1yesyesyes
MPI-M-MPI-ESM-LRRCA4r1i1p1yesyesno
MPI-M-MPI-ESM-LRRCA4-SNr1i1p1noyesno
MPI-M-MPI-ESM-LRRRCMr1i1p1noyesno
NCC-NorESM1-MRCA4r1i1p1yesyesno
Table A5. Australia (AUS-44).
GCM RCM RealisationRCP4.5RCP8.5RCP2.6
ICHEC-EC-EARTHCCLM4-8-17-CLM3-5r12i1p1yesyesno
MPI-M-MPI-ESM-LRCCLM4-8-17-CLM3-5r1i1p1yesyesno
Table A6. East Asia (EAS-44).
GCM RCMRealisationRCP4.5RCP8.5RCP2.6
ICHEC-EC-EARTHCCLM5-0-2r12i1p1yesyesno
MOHC-HadGEM2-ESCCLM5-0-2r1i1p1yesyesno
MPI-M-MPI-ESM-LRCCLM5-0-2r1i1p1yesyesno
Table A7. Europe (EUR-44).
GCM RCMRealisationRCP4.5RCP8.5RCP2.6
CCCma-CanESM2RCA4r1i1p1yesyesno
CSIRO-QCCCE-CSIRO-Mk3-6-0RCA4r1i1p1yesyesno
ICHEC-EC-EARTHCCLM5-0-6r12i1p1noyesno
ICHEC-EC-EARTHRACMO22Er1i1p1yesyesno
ICHEC-EC-EARTHRACMO22Er12i1p1nonoyes
ICHEC-EC-EARTHRCA4r12i1p1yesyesyes
IPSL-IPSL-CM5A-MRRCA4r1i1p1yesyesno
IPSL-IPSL-CM5A-MRWRF331Fr1i1p1yesyesno
MIROC-MIROC5CCLM5-0-6r1i1p1noyesno
MIROC-MIROC5RCA4r1i1p1yesyesyes
MOHC-HadGEM2-ESRACMO22Er1i1p1yesyesyes
MOHC-HadGEM2-ESRCA4r1i1p1yesyesyes
MPI-M-MPI-ESM-LRCCLM4-8-17r1i1p1yesyesno
MPI-M-MPI-ESM-LRCCLM5-0-6r1i1p1noyesno
MPI-M-MPI-ESM-LRRCA4r1i1p1yesyesyes
MPI-M-MPI-ESM-LRREMO2009r1i1p1yesyesyes
MPI-M-MPI-ESM-LRREMO2009r2i1p1yesyesyes
NCC-NorESM1-MRCA4r1i1p1yesyesyes
NOAA-GFDL-GFDL-ESM2MRCA4r1i1p1yesyesno
Table A8. Mediterranean and North Africa (MNA-44).
GCM RCMRealisationRCP4.5RCP8.5RCP2.6
ICHEC-EC-EARTHRCA4r12i1p1yesyesyes
NOAA-GFDL-GFDL-ESM2MRCA4r1i1p1yesyesno
Table A9. North America (NAM-44).
GCM RCMRealisationRCP4.5RCP8.5RCP2.6
CCCma-CanESM2CRCM5r1i1p1yesnono
CCCma-CanESM2RCA4r1i1p1yesyesno
ICHEC-EC-EARTHRCA4r12i1p1yesyesyes
MPI-M-MPI-ESM-LRCRCM5r1i1p1yesnono
Table A10. South America (SAM-44).
GCM RCM RealisationRCP4.5RCP8.5RCP2.6
CCCma-CanESM2RCA4r1i1p1yesyesno
CSIRO-QCCCE-CSIRO-Mk3-6-0RCA4r1i1p1yesyesno
ICHEC-EC-EARTHRCA4r12i1p1yesyesyes
IPSL-IPSL-CM5A-MRRCA4r1i1p1yesyesno
MIROC-MIROC5RCA4r1i1p1yesyesyes
MOHC-HadGEM2-ESRCA4r1i1p1yesyesyes
MPI-M-MPI-ESM-LRREMO2009r1i1p1yesnono
MPI-M-MPI-ESM-LRRCA4r1i1p1yesyesyes
NCC-NorESM1-MRCA4r1i1p1yesyesyes
NOAA-GFDL-GFDL-ESM2MRCA4r1i1p1yesyesno
Table A11. CMIP5 GCM ensemble used here.
InstituteGCM NameScenario
CSIRO-BOMACCESS1-0 rcp45, rcp85
CSIRO-BOMACCESS1-3 rcp45, rcp85
BNUBNU-ESM rcp45, rcp85
IPSLIPSL-CM5A-MR rcp45, rcp85
IPSLIPSL-CM5A-LR rcp45, rcp85
IPSLIPSL-CM5B-LR rcp45, rcp85
MPI-MMPI-ESM-MR rcp45, rcp85
MPI-MMPI-ESM-LR rcp45, rcp85
MOHCHadGEM2-ES rcp45, rcp85
MOHCHadGEM2-CC rcp45, rcp85
NCCNorESM1-M rcp45, rcp85
NOAA-GFDL GFDL-ESM2G rcp45, rcp85
GFDL-ESM2MGFDL-ESM2M rcp45, rcp85
NOAA-GFDLGFDL-CM3 rcp45, rcp85
CNRM-CERFACSCNRM-CM5rcp45, rcp85
INMINM-CM4rcp45, rcp85
BCCBCC-CSM1.1 rcp45, rcp85
BCCBCC-CSM1.1(m) rcp45, rcp85
ICHECEC-EARTH rcp45, rcp85

Appendix B

Table A12. Summary of what participants liked about www.climateinformation.org at each of the four workshops, in St Lucia, Democratic Republic of Congo, Cabo Verde, and Cambodia.
St Lucia, CaribbeanDR Congo, AfricaCabo Verde, AfricaCambodia, Asia
Simple and easy to use, aesthetically pleasing (13 comments)Easy access, user friendly platform with data and useful information (15 comments)User-friendliness of the platform/interface, with good layout, interactive information, data and documentation (10 comments)Easy access to lots of information, visualised maps and graphs, easy to download data (11 comments)
User friendly (11 comments)Wide range of useful data on climate projections and indicators (5 comments)Ability to make more detailed analyses, obtain plots (3 comments)User friendly design (3 comments)
Interactivity (7 comments) Simulations of scenarios and climate change for Cabo Verde (2 comments)Provides model ensembles and projections for different periods in this century (3 comments)
Good access to main guidance and other information for understanding climate science (4 comments) Access to new data in excel format (3 comments)Site-specific report is easy to use and you can search specific coordinates or names (4 comments)

Appendix C

Table A13. Summarised written feedback from ‘Understanding the users’ exercise.
Role and Duties (no. of respondents)InsightMotivationCapacitySupport
Administrator (3)Hoping for more data-driven decisions (based on accurate data) and capacity within the countryWant funding for projects, capacity development, understanding past and future climateKnowledge to select right tools and methodologies for climate data, analytical skillsSpecialised training needed, showcases, FAQ
Coordinators (15)There is a lack of scientific knowledge, practice, learning and skills, lack of data/data access/access to climate projections (available in paper form, not ratified) that are relevant for climate change assessments, need for more sophisticated computers.Motivation is to improve project rationale in environmental projects, and improve understanding, to use climate data in research, that decision making and sustainable development is based on past and future climate data as ‘business as usual’ will lead to more difficult problems.Need to build collaboration between institutes, combine databases, verify local/seasonal trends, the right tools to analyse climate data, to improve knowledge management capabilities. Need to have basic understanding climate data, be able to transform international information into relevant national information.Specialised education, training and guidance needed for using climate information, to build databases, to understand climate modelling, to conduct specialised studies. English language needed; collaboration with international experts. Remote assistance needed.
Meteorologist (7)Main obstacle is knowing how to organise and save data appropriately, process climate data and to observe conclusive climate change trends at stations. A challenge to use the right tools. Also difficult to identify challenges, build shared awareness in public audiences.Main driver is to better understand climate and future climate changes, conduct research, use science to drive policy. Climate change has devastating consequences, need to act now.Need to build technology and institutional collaboration, use known tools and methods that are adjusted for the region, gain expertise and data access, training in analysis and research.Showcases needed, training in how to access data, to use and understand new products as they become available. Training and guidance in climate change in general.
Policy makers/Government level roles (16)Main obstacle is data access/availability, analysis and interpretation of climate data. Specialised guidance and an information network could overcome these (in Cape Verde, Cambodia). Another main obstacle is use and interpretation of climate change for all different sectors. Climate change impacts need factual based discussion. There is a lack of finance and capacity development opportunities.Need to make decisions, research, add value to project assessments, improve political decisions for adaptation to climate change. Need new approaches to problem solving, need to protect the environment and create resilience for the future. Driven to write better proposals for GCF.Need institutional collaborations, coordinated platforms and systems for data sharing and management (with quality assurance). A holistic approach in departmental structure. Need qualified personnel, skills in interpreting climate change data, training in sustainability. Have an expert on UNFCCC roster of experts (Cabo Verde).Education and long term guidance, specifically in modelling, database management, training in using the platform are needed. Develop decision making abilities, continuous workshops, face-to-face training needed. Training in climate risks and uses, proposal writing and observation equipment (thermometers etc)
Scientist, Research, Scientific/Data analysis Role (23)Lack of meteo stations in some regions, low horizontal resolution in small island states, problems on downloading data from global climate models, lack of climate indicators, data quality, harmonization, linking available data to what is needed, lack of downscaling skills. Lack of understanding of climate change, impacts, bias, uncertainties and how to link this information to socio-economic data. No marine data. If climate services were delivered to society, could lead to shared awareness, better decision making. Want to understand climate projections to support decision making, do research, help society, get better understanding/planning of adaptation actions. Main driver is to analyse trends, form hypotheses, make data available (to public), understand the relationship between climate and oceanographic/marine data. Bridge the science and society communities. Need skills on understanding climate models, downscaling to small islands, bias adjustment, reanalysis. Need to fill in gaps in time series, more data access. Need new technologies, training in interpretation, institutional collaborations for expertise exchange. St Lucia have access to knowledge base, literature, software, data. Support to run climate models and store data needed, specific educations and guidance for understanding climate change, showcases to give examples. Training/education should be given periodically. Need training in R/Python, continued expert advice, training in downscaling methods
Technician, Technical Role (13)Lack of experience, local and hydrological data. Need for outputs to be translated into suitable format for non-technical stakeholders. Climate change will have a world-wide impact, raised awareness is needed. Need to overcome the challenge of connecting climate change data with all different sectors. Can be overcome using co-creating climate services with sector representatives and understanding of sectoral processesUsing climate data adds value to projects, need data (precipitation, water runoff, water quality, soil moisture) to provide sound basis for proposals. Motivated to use generated indicators later to check original assumptions. Want to know more about tools for climate change data, be the central agency to help collate required data. Motivated to contribute to decisions based on trusted climate science.ICT, Statistics, GIS, WRMA, Agriculture, basic level of understanding but need capacity for model choice, data inputs to generate useful outputs for proposals. Also need capacity in evaluating different datasets. Limited modelling experiences. Need understanding of climate change processes, links between global and local scales, and understand uncertainties.Education and guidance in modelling, examples of ‘how to’, data collections, using provided tools and methods. Both face-to-face and virtual interaction platforms needed. Develop regional capacity to learn and deliver, then extra-regional institutions provide support. Climate projection tools. Training in downscaling, bias adjustment and local climate assessments
Other—medical dr, trainee, not specified (3)Missing data, use platform for further comparisonsWant to improve the networks, cooperation between national and international institutions, know climate of the regionEverything is neededEducation and specialised guidance needed. Support can be provided through communities of practice, online forums, youtube tutorials so can develop water availability indices and models

References

  1. UN. Transforming Our World: The 2030 Agenda for Sustainable Development; A/RES/70/1; UN: New York, NY, USA, 2015. [Google Scholar]
  2. UNFCCC. The Paris Agreement to the United Nations Framework Convention on Climate Change; T.I.A.S. No. 16-1104; UNFCCC: Paris, France, 2015. [Google Scholar]
  3. Dessai, S.; Hulme, M.; Lempert, R.; Pielke, R. Climate prediction: A limit to adaptation. In Adapting to Climate Change: Thresholds, Values, Governance; Lorenzoni, I., Brien, K.L., Adger, W.N., Eds.; Cambridge University Press: Cambridge, UK, 2009; pp. 64–78. ISBN 978-0-521-76485-8. [Google Scholar]
  4. Otto, J.; Brown, C.; Buontempo, C.; Doblas, R.F.; Jacob, D.; Juckes, M.; Keup, T.E.; Kurnik, B.; Schulz, J.; Taylor, A.; et al. Uncertainty: Lessons Learned for Climate Services. Bull. Am. Meteorol. Soc. 2016, 97, ES265–ES269. [Google Scholar] [CrossRef] [Green Version]
  5. Hewitt, C.; Mason, S.; Walland, D. The Global Framework for Climate Services. Nat. Clim. Chang. 2012, 2, 831–832. [Google Scholar] [CrossRef] [Green Version]
  6. Hewitt, C.D.; Allis, E.; Mason, S.J.; Muth, M.; Pulwarty, R.; Shumake, G.J.; Bucher, A.; Brunet, M.; Fischer, A.M.; Hama, A.M.; et al. Making Society Climate Resilient: International Progress under the Global Framework for Climate Services. Bull. Am. Meteorol. Soc. 2020, 101, E237–E252. [Google Scholar] [CrossRef] [Green Version]
  7. Vaughan, C.; Dessai, S. Climate services for society: Origins, institutional arrangements, and design elements for an evaluation framework. WIREs Clim. Chang. 2014, 5, 587–603. [Google Scholar] [CrossRef] [PubMed]
  8. WMO. 2019 State of Climate Services Report; WMO: Geneva, Switzerland, 2019; ISBN 978-92-63-11242-2. [Google Scholar]
  9. Dilling, L.; Lemos, M.C. Creating usable science: Opportunities and constraints for climate knowledge use and their implications for science policy. Glob. Environ. Chang. 2011, 21, 680–689. [Google Scholar] [CrossRef]
  10. Nie, E.C. Delivering Climate Services: Organizational Strategies and Approaches for Producing Useful Climate-Science Information. Weather Clim. Soc. 2013, 5, 14–26. [Google Scholar] [CrossRef]
  11. Weichselgartner, J.; Arheimer, B. Evolving Climate Services into Knowledge–Action Systems. Weather Clim. Soc. 2019, 11, 385–399. [Google Scholar] [CrossRef] [Green Version]
  12. Maraun, D.; Widmann, M.; Gutiérrez, J.M.; Kotlarski, S.; Chandler, R.E.; Hertig, E.; Wibig, J.; Huth, R.; Wilcke, R.A.I. VALUE: A framework to validate downscaling approaches for climate change studies. Earths Future 2015, 3, 1–14. [Google Scholar] [CrossRef] [Green Version]
  13. Sweeney, C.F.; Jones, R.G.; Lee, R.W.; Rowell, D.P. Selecting CMIP5 GCMs for downscaling over multiple regions. Clim. Dyn. 2015, 44, 3237–3260. [Google Scholar] [CrossRef] [Green Version]
  14. WMO. Step-by-Step Guidelines for Establishing a National Framework for Climate Services; WMO- No. 1206; WMO: Geneva, Switzeralnd, 2018; ISBN 978-92-63-11206-4. [Google Scholar]
  15. Norström, A.V.; Cvitanovic, C.; Löf, M.F.; West, S.; Wyborn, C.; Balvanera, P.; Bednarek, A.T.; Bennett, E.M.; Biggs, R.; Bremond, A.; et al. Principles for knowledge co-production in sustainability research. Nat. Sustain. 2020, 3, 182–190. [Google Scholar] [CrossRef]
  16. Vincent, K.; Carter, S.; Steynor, A.; Visman, E.; Wågsæther, K.L. Addressing power imbalances in co-production. Nat. Clim. Change 2020, 10, 877–878. [Google Scholar] [CrossRef]
  17. Merks, J.; Photiadou, C.; Ludwig, F.; Arheimer, B. Comparison of open access global climate services for hydrological data. Hydrol. Sci. J. 2020, 1–17. [Google Scholar] [CrossRef]
  18. Taylor, K.E.; Stouffer, R.J.; Meehl, G.A. An Overview of CMIP5 and the Experiment Design. Bull. Am. Meteorol. Soc. 2012, 93, 485–498. [Google Scholar] [CrossRef] [Green Version]
  19. Jacob, D.; Petersen, J.; Eggert, B.; Alias, A.; Christensen, O.B.; Bouwer, L.M.; Braun, A.; Colette, A.; Déqué, M.; Georgievski, G.; et al. EURO-CORDEX: New high-resolution climate change projections for European impact research. Reg. Environ. Chang. 2014, 14, 563–578. [Google Scholar] [CrossRef]
  20. Hurk, B.; Hewitt, C.; Jacob, D.; Bessembinder, J.; Doblas, R.F.; Döscher, R. The match between climate services demands and Earth System Models supplies. Clim. Serv. 2018, 12, 59–63. [Google Scholar] [CrossRef]
  21. Yang, W.; Andréasson, J.; Phil, G.L.; Olsson, J.; Rosberg, J.; Wetterhall, F. Distribution-based scaling to improve usability of regional climate model projections for hydrological climate change impacts studies. Hydrol. Res. 2010, 41, 211–229. [Google Scholar] [CrossRef]
  22. Berg, P.; Donnelly, C.; Gustafsson, D. Near-real-time adjusted reanalysis forcing data for hydrology. Hydrol. Earth Syst. Sci. 2018, 22, 989–1000. [Google Scholar] [CrossRef] [Green Version]
  23. Arheimer, B.; Pimentel, R.; Isberg, K.; Crochemore, L.; Andersson, J.C.M.; Hasan, A.; Pineda, L. Global catchment modelling using World-Wide HYPE (WWH), open data, and stepwise parameter estimation. Hydrol. Earth Syst. Sci. 2020, 24, 535–559. [Google Scholar] [CrossRef] [Green Version]
  24. Maraun, D.; Shepherd, T.G.; Widmann, M.; Zappa, G.; Walton, D.; Gutiérrez, J.M.; Hagemann, S.; Richter, I.; Soares, P.M.M.; Hall, A.; et al. Towards process-informed bias correction of climate change simulations. Nat. Clim. Chang. 2017, 7, 764–773. [Google Scholar] [CrossRef] [Green Version]
  25. Zhang, X.; Alexander, L.; Hegerl, G.C.; Jones, P.; Tank, A.K.; Peterson, T.C.; Trewin, B.; Zwiers, F.W. Indices for monitoring changes in extremes based on daily temperature and precipitation data. WIREs Clim. Chang. 2011, 2, 851–870. [Google Scholar] [CrossRef]
  26. Sillmann, J.; Kharin, V.V.; Zhang, X.; Zwiers, F.W.; Bronaugh, D. Climate extremes indices in the CMIP5 multimodel ensemble: Part 1. Model evaluation in the present climate. J. Geophys. Res. Atmos. 2013, 118, 1716–1733. [Google Scholar] [CrossRef]
  27. Crochemore, L.; Isberg, K.; Pimentel, R.; Pineda, L.; Hasan, A.; Arheimer, B. Lessons learnt from checking the quality of openly accessible river flow data worldwide. Hydrol. Sci. J. 2020, 65, 699–711. [Google Scholar] [CrossRef] [Green Version]
  28. Clifford, K.R.; Travis, W.R.; Nordgren, L.T. A climate knowledges approach to climate services. Clim. Serv. 2020, 18. [Google Scholar] [CrossRef]
  29. Visscher, K.; Stegmaier, P.; Damm, A.; Hamaker, T.R.; Harjanne, A.; Giordano, R. Matching supply and demand: A typology of climate services. Clim. Serv. 2020, 17. [Google Scholar] [CrossRef]
  30. Mauser, W.; Klepper, G.; Rice, M.; Schmalzbauer, B.S.; Hackmann, H.; Leemans, R.; Moore, H. Transdisciplinary global change research: The co-creation of knowledge for sustainability. Curr. Opin. Environ. Sustain. 2013, 5, 420–431. [Google Scholar] [CrossRef] [Green Version]
  31. Ekström, M.; Grose, M.; Heady, C.; Turner, S.; Teng, J. The method of producing climate change datasets impacts the resulting policy guidance and chance of mal-adaptation. Clim. Serv. 2016, 4, 13–29. [Google Scholar] [CrossRef] [Green Version]
  32. Donnelly, C.; Ernst, K.; Arheimer, B. A comparison of hydrological climate services at different scales by users and scientists. Clim. Serv. 2018, 11, 24–35. [Google Scholar] [CrossRef]
  33. Nissan, H.; Goddard, L.; de Perez, E.C.; Furlow, J.; Baethgen, W.; Thomson, M.C.; Mason, S.J. On the use and misuse of climate change projections in international development. WIREs Clim. Change 2019, 10, e579. [Google Scholar] [CrossRef] [Green Version]
  34. Goldstein, A.; Turner, W.R.; Gladstone, J.; Hole, D.G. The private sector’s climate change risk and adaptation blind spots. Nat. Clim. Chang. 2019, 9, 18–25. [Google Scholar] [CrossRef]
  35. Meah, N. Climate uncertainty and policy making—what do policy makers want to know? Reg. Environ. Chang. 2019, 19, 1611–1621. [Google Scholar] [CrossRef]
  36. Vaughan, C.; Buja, L.; Kruczkiewicz, A.; Goddard, L. Identifying research priorities to advance climate services. Clim. Serv. 2016, 4, 65–74. [Google Scholar] [CrossRef] [Green Version]
  37. Karlsson, S.; Srebotnjak, T.; Gonzales, P. Understanding the North–South knowledge divide and its implications for policy: A quantitative analysis of the generation of scientific knowledge in the environmental sciences. Environ. Sci. Policy 2007, 10, 668–684. [Google Scholar] [CrossRef]
  38. Gupta, J. The North–South divide. In Research Handbook on Climate Governance; Edward Elgar Publishing: Cheltenham, UK, 2015. [Google Scholar]
  39. Kelman, I. No change from climate change: Vulnerability and small island developing states. Geogr. J. 2014, 180, 120–129. [Google Scholar] [CrossRef] [Green Version]
  40. Naess, L.O.; Newell, P.; Newsham, A.; Phillips, J.; Quan, J.; Tanner, T. Climate policy meets national development contexts: Insights from Kenya and Mozambique. Glob. Environ. Chang. 2015, 35, 534–544. [Google Scholar] [CrossRef] [Green Version]
  41. WMO. Valuing weather and climate: Economic Assessment of Meteorological and Hydrological Services; WMO-N°. 1153; WMO: Geneva, Switzerland, 2015; ISBN 978-92-63-11153-1. [Google Scholar]
  42. Richards, M. A Review of The Effectiveness Of Developing Country Participation. In The Climate Change Convention Negotiations; Overseas Development Institute: London, UK, 2001; Volume 41. [Google Scholar]
  43. Biagini, B.; Bierbaum, R.; Stults, M.; Dobardzic, S.; Neeley, S.M. A typology of adaptation actions: A global look at climate adaptation actions financed through the Global Environment Facility. Glob. Environ. Chang. 2014, 25, 97–108. [Google Scholar] [CrossRef] [Green Version]
  44. Bremer, S.; Wardekker, A.; Dessai, S.; Sobolowski, S.; Slaattelid, R.; Sluijs, J. Toward a multi-faceted conception of co-production of climate services. Clim. Serv. 2019, 13, 42–50. [Google Scholar] [CrossRef]
  45. Boukalová, Z.; Těšitel, J.; KřIVÁNEK, Z. The contribution of climate services to sustainable wine production in san juan, Argentina. WIT Trans. Ecol. Environ. 2017, 221, 23–32. [Google Scholar] [CrossRef] [Green Version]
  46. Damm, A.; Köberl, J.; Stegmaier, P.; Jiménez Alonso, E.; Harjanne, A. The market for climate services in the tourism sector – An analysis of Austrian stakeholders’ perceptions. Clim. Serv. 2019. [Google Scholar] [CrossRef]
  47. Cortekar, J.; Bender, S.; Brune, M.; Groth, M. Why climate change adaptation in cities needs customised and flexible climate services. Clim. Serv. 2016, 4, 42–51. [Google Scholar] [CrossRef] [Green Version]
Figure 1. Production chain for Climate indicators (CI) and Water Indicators (WI) available in the platform for the globe and the priority domains covering the pilot countries. Yellow boxes indicated the production for the CI, while blue boxes indicate production for the WI.
Atmosphere 12 00121 g001
Figure 2. Development process of Climate Information platform.
Atmosphere 12 00121 g002
Figure 3. Information for Workshops: 4 workshops with the total number of participants (national and international experts) and the sectors discussed in each workshop (in blue); Feedback process during the workshops and number of responses collected (in green).
Atmosphere 12 00121 g003
Figure 4. Site-specific report (SSR tool) with location and scenario selection. An overview of future change in top indicators is generated for the selected location (www.climateinformation.org).
Atmosphere 12 00121 g004
Figure 5. Indicator dashboard in the Site-specific report (annual and monthly mean) with metadata and key messages (www.climateinformation.org).
Atmosphere 12 00121 g005
Figure 6. The Data Access Platform (DAP tool) with the menu system for the available indicators from CMIP5 and CORDEX ensembles for absolute values for the reference period (1981–2010) and future changes (www.climateinformation.org).
Atmosphere 12 00121 g006
Figure 7. Graph with mean temperature monthly changes for RCP4.5 for period 2041–2070 (www.climateinformation.org).
Atmosphere 12 00121 g007
Figure 8. The composition of the respondents to the feedback loop survey from workshops held in St Lucia, Democratic Republic of Congo, Cabo Verde and Cambodia. Left: The professional background of the respondent, middle: the role that they currently work in, and right: the years of experience that the participants had.
Atmosphere 12 00121 g008
Figure 9. The use and need of climate services and information from the four workshops (total number of responses: 83). Left: for which purpose a climate service is used for in the first instance and right: why information from the climate service is needed.
Atmosphere 12 00121 g009
Figure 10. The variables* of interest and preferred data resolutions for the four workshop participants (total number of responses: 83). Left: Main variables of most interest selected (*there were other assorted variables suggested here, but this figure shows those that were of interest to 5 or more participants) and right: the data resolution that the participants preferred to work with.
Atmosphere 12 00121 g010
Figure 11. The proportions of workshop participants for preferred number of ensemble members (left), the future that they were most interested in (middle) and what would make them trust climate data more (right).
Atmosphere 12 00121 g011
Figure 12. The preferences of the four workshop participants for different forms of guidance and support. Top row left: written climate data information and right: visualised climate data information. Bottom row left: online and right: in person guidance.
Atmosphere 12 00121 g012
Figure 13. The preferences of the workshops’ participants for different forms guidance in terms of video tutorial formats.
Atmosphere 12 00121 g013
Table 1. Domain specific bias summary. The listed numbers are the ensemble mean absolute biases of the gridpoint-wise mean monthly biases calculated as model minus reference data in the full reference period (1981–2010). The last column indicates the number of projections in each domain (N).
Precipitation
(mm/d)
Daily Mean Temp.
(°C)
Daily Min. Temp.
(°C)
Daily Max. Temp.
(°C)
N
Uncorr.Corr.Uncorr.Corr.Uncorr.Corr.Uncorr.Corr.
AFR-441.110.121.540.112.000.121.540.1354
ARC-440.400.022.370.152.580.192.390.2211
AUS-444.000.071.390.041.330.041.570.044
CAM-442.020.361.520.051.510.051.750.0621
EAS-444.140.271.800.061.810.072.050.0810
EUR-440.560.203.440.193.880.243.410.2251
MNA-441.140.252.180.083.230.081.780.107
NAM-440.800.062.180.122.460.162.090.179
SAM-441.590.101.520.051.870.051.570.0627
WAS-441.900.142.240.073.040.082.060.0938
Table 2. Temperature and Precipitation related Climate Indicators as they are calculated in the production chain using as input climate projections (CMIP5 or CORDEX).
Main Variable UsedDefinitions (Mean of Average, Unit)
PrecipitationPrecipitation (mm/day): Calculated as the mean annual and monthly values of daily precipitation averaged over a 30-year period.
Longest dry spells (no. of days): Calculated as the maximum number of consecutive dry days (daily precipitation < 1 mm) over a 30-year period.
Number of dry spells (no. of days): Calculated as the number of dry periods for more than 5 days for a 30 year period.
Mean TemperatureTemperature (°C): Calculated as the mean annual and monthly values of daily mean temperature (at 2 m height) averaged over a 30 year period.
Heating degree (°C): Calculated as the annual and monthly sum of 17 °C minus daily mean temperature (at 2 m height) when it is below 17C averaged over a 30-year period. Zero values indicate no heating degree.
Maximum TemperatureMaximum temperature (°C): Calculated as the maximum annual and monthly values of daily maximum temperature (at 2 m height) averaged over a 30-year period.
Minimum TemperatureMinimum temperature (°C): Calculated as the minimum annual and monthly values of daily minimum temperature (at 2 m height) averaged over a 30-year period.
Frost days (no. of days): Calculated as the number of days per year and month when daily minimum temperature (at 2 m height) is below 0 °C, averaged over a 30-year period.
Tropical nights (no. of days): Calculated as the annual and monthly number of days when daily minimum temperature (at 2 m height) is above 20 °C, averaged over a 30-year period.
Table 3. Water related indicators calculated using the WW-HYPE model and forcing bias adjusted ECV from CMIP5 or CORDEX, available in the Climate Information platform.
Main Variable UsedDefinitions (Unit)
Water runoffWater runoff (mm): Defined as the local runoff over land areas. Calculated as the annual and monthly water runoff, averaged over a 30 year period.
Water dischargeWater discharge (m3/s): Defined as the simulated outflow from a subcatchment. Calculated as the annual and monthly discharge, averaged over a 30 year period.
Flow recurrence (m3/s): Calculated as the daily maximum river flows that correspond to return periods of 2, 5, 10, 20, and 50 year, using a Gumbel distribution, for a 30 year period.
Maximum water discharge (m3/s): Calculated as the annual daily maximum discharge averaged over a 30 year period.
Min water discharge (m3/s): Calculated as the annual daily minimum discharge averaged over a 30 year period.
No. of days below annual minimum discharge (no. of days): Calculated as the annual number of days below annual minimum discharge (threshold calculated from reference period) averaged over a 30 year period.
Soil moistureSoil moisture (-): Defined as the soil moisture in the root zone as fraction of the water content volume and depends on the soil type (land use). Calculated as the annual value, averaged over a 30 year period. The indicator is nondimensional.
AridityActual Aridity: Defined as the ratio between actual evapotranspiration and precipitation. Calculated as the annual value, averaged over a 30 year period. The indicator is nondimensional.
Potential Aridity: Defined as the ratio between potential evapotranspiration and precipitation. Calculated as the annual value, averaged over a 30 year period. The indicator is nondimensional.
PrecipitationWetness potential (mm/day): Defined as the difference between precipitation and potential evapotranspiration. Calculated as the monthly mean averaged over a 30 year period.
Effective precipitation (mm/day): Defined as the difference between precipitation and actual evapotranspiration. Calculated as the monthly mean averaged over a 30 year period.
Water temperatureWater temperature (°C): Defined as the in-stream water temperature. Calculated as the monthly mean averaged over a 30 year period.
Table 4. Number of experts (national and international experts) that participated in each workshop.
Pilot CountriesNo. of National ExpertsNo. of International Experts
St. Lucia 4119
Democratic Republic of Congo5715
Cabo Verde4613
Cambodia5228
Total19675
Publisher’s Note: MDPI stays neutral with regard to jurisdictional claims in published maps and institutional affiliations.

