Article

Method for Preparation of a Candidate Reference Material of PM10 and PM2.5 Airborne Particulate Filters Loaded with Incineration Ash-Inter Comparison Results for Metal Concentrations

by
Alexandre Bescond
1,*,
Caroline Oster
1,
Paola Fisicaro
1,
Sharon Goddard
2,*,
Paul Quincey
2,
Lamprini-Areti Tsakanika
3,
Theopisti Lymperopoulou
3 and
Maria Ochsenkuehn-Petropoulou
3,*
1
Laboratoire National de Métrologie et des Essais (LNE), 75724 Paris, France
2
National Physical Laboratory (NPL), Hampton Road, Teddington, Middlesex TW11 0LW, UK
3
School of Chemical Engineering, Heroon Polytechniou 9, Zografou Campus, National Technical University of Athens (NTUA), 15780 Athens, Greece
*
Authors to whom correspondence should be addressed.
Submission received: 5 November 2020 / Revised: 18 December 2020 / Accepted: 19 December 2020 / Published: 5 January 2021
(This article belongs to the Special Issue Exposure Assessment of Air Pollution)

Abstract

:
Air pollution is an important issue that can have significant implications for human health. Consequently, air quality control is matter of great interest, and the ΕU has established strict legislation with respect to public health protection. A work package of the EMPIR project AEROMET focused on the investigation of traceable validated methods for chemical composition of airborne particulate matter (PM), including heavy metals. Incineration ash typically contains quantities of heavy and toxic metals in excess of the limits imposed for airborne PM, so it provides a candidate source for a Standard Reference Material (SRM). In this work, a method for loading incinerator ash (PM10 and PM2.5 fractions) on quartz filters with a good reproducibility and homogeneity was developed. An intercomparison exercise involving three separate laboratories was conducted for the elemental analysis of the prepared candidate reference material. The filters were treated by acid digestion and analyzed by Inductively Coupled Plasma–Mass Spectrometry (ICP-MS) according to the European standard EN 14902:2005. Eleven elements, including the regulated metals (As, Cd, Ni and Pb), were determined using different ICP-MS instruments and standardization methods. Data evaluation showed a good agreement between the results, with deviations below 10–15%. The development of a Standard Reference Material seems auspicious.

1. Introduction

An estimated 4.2 million deaths are attributed to exposure to ambient air pollution every year [1]. Studies have shown the harmful nature of exposure to heavy metals in particular [1,2,3]. The EU has implemented Air Quality Directives 2008/50/EC [4] and 2004/107/EC [5] that mandate the monitoring of metals in ambient air and specify limit and target annual average airborne concentration values with which member states must demonstrate compliance for nickel (Ni), arsenic (As), cadmium (Cd) and lead (Pb). It is therefore critical to be able to make accurate, traceable measurements to monitor the levels of metals in the ambient air to understand the pollution landscape and assess the impact of air quality improvement measures. A work package of the recent EMPIR project AEROMET [6] focused on the investigation of traceable validated methods for chemical composition of airborne particulate matter (PM), including heavy metals.
One aspect of obtaining high quality measurements is the analysis of Certified or Standard Reference Materials (CRMs or SRMs). Such materials are selected to be as similar as possible in terms of the matrix and composition to the real-world samples they are chosen to represent. When the CRM/SRM is processed by an analytical method, the result can be considered representative of what the same method would achieve from an analysis of a real sample. An analysis of representative reference materials (RMs) is an important part of method validation, because good recoveries give increased confidence in the results generated.
There are several RMs of airborne PM containing significant concentrations of metals available (e.g., NIST 1648a and NIES no. 28). However, airborne PM samples are usually collected on filter media, and very few RMs include the filter component. Previously, NIST 2783 (air particulate on filter media) was used; this is currently unavailable from NIST. A lack of RMs incorporating the sampling filter means that sample digestion procedures may not be adequately assessed for extraction efficiency, and interferences introduced by the filter material may not be accounted for.
Municipal solid waste (MSW) treatment includes several operations, such as recycling, composting, landfilling and incineration [7]. Waste incineration technology was introduced in China in the late 1980s but has increased significantly since then. Waste incineration in Europe has also grown within recent years, with the amount of MSW incinerated in the EU reaching 64 million tons in 2015 [8].
Incineration is an increasingly adopted waste management technique due to the benefit of reducing the volume and weight of waste. Incinerators have been characterized as stationary sources of toxic air pollutant, because they generate by-products such as bottom ash, fly ash and air pollution gases, which are considered hazardous [9]. The exhaust gases from waste incineration may contain harmful substances, including particulate matter, dioxins and furans, acid gases volatile chlorinated organic compounds and polycyclic aromatic compounds. Operation conditions of the incinerators have been also been correlated with the emission of heavy metals already present in the waste fed into the incinerator. Metals are not destroyed during combustion but are distributed among the bottom ash, fly ash and released gases. Mercury, for example, is volatile, so most of it is vaporized in the combustion chamber. Lead and cadmium are distributed between the bottom ash and fly ash, depend on the operating conditions [10].
Incinerator ash was used for the preparation of the candidate RM, because it shares many characteristics with airborne PM, including particle size and composition. The chemical compositions of the raw materials were shown to be sufficiently stable, homogeneous and representative of the atmospheric particles typically collected on filters. The concentration of metals was comparable with the limit/target values specified in the European Directives on air quality monitoring without the need of spiking with the target analytes. Additionally, the quantity of raw material available was sufficiently large to ensure a continued supply over several years [11].
For the determination of trace level metals in air quality samples and the composition of fly ash, inductively coupled plasma mass spectrometry (ICP-MS) has been the industry standard since its development in the 1980s. The majority of elements on the period table can be measured down to parts per billion (µg kg−1) and, in some cases, parts per trillion (ng kg−1) concentrations in liquid samples [12]. Solid samples are typically subject to a dilution factor; once this is accounted for, the sensitivity for solid samples is still typically in the mg/kg range. The European standard EN 14902 [13] specifies ICP-MS as the reference method to determine metals in PM10 sampled from the ambient air after the appropriate digestion of the loaded filters prior to the ICP-MS analysis. There are many studies supporting the use of ICP-MS and the related optical emission spectroscopy technique (ICP-OES) for the elemental composition of airborne PM and fly ash [14,15,16,17,18,19].
In the present study, the sample preparation of the incinerator ash on the filter for the ICP-MS analysis required the conversion to a liquid matrix by acid microwave digestion. Heating acidifying the samples in closed vessel systems is a fast, efficient method for preparing environmental samples for a metals analysis that is today considered routine [20]. Acid digestion may refer to aqua regia extraction of the soluble portion of the elements [21] or microwave-assisted digestion with a nitric acid (HNO3), hydrochloric (HCl) and hydrofluoric (HF) acid mixture for the subsequent determination of the elements [22].
Furthermore, the quality of the blank filter is an important factor in the measurement method. If the blank filter contains significant levels of the target metals, this will result in over-reporting of those metals in the airborne PM sample on the filter. This problem is particularly apparent on some filters for nickel, zinc, chromium and iron. In 2003, as part of the missions of the Central Air Quality Laboratory in France, comparative tests were carried out for different types of filters and for different sampling rates (10 L min−1 or 16.7 L min−1) and made it possible to decide on the advantage of favoring higher flow rates and selecting filters with lower metal contents (Pall QAT-UP) [23]. Thus, it was also shown that the quality of these quartz filters is relatively homogeneous in the same production batch and that the variations from one batch to another remain much lower than the French urban average values for weekly samples.
The intercomparison involved three participating laboratories: LNE in France, NPL in the UK and NTUA in Greece. NPL is the UK’s National Metrology Institute [24] and the current operator of the UK Metals Monitoring Network on behalf of the Environment Agency and the UK governmental Department for Environment, Food and Rural Affairs (Defra) [25]. This is the regulatory air quality monitoring network that discharges the majority of the UK’s obligation under the Air Quality Directives [4,5] relating to the monitoring of the mass concentrations of nickel, arsenic, cadmium and lead in the PM10 phase of ambient air [26]. LNE is the French National Metrology Institute. It has several CMCs on the BIPM KCDB for inorganic analyses and gas analyses. LNE is also member of the French consortium for air quality monitoring (Laboratoire centrale pour la surveillance de la qualité de l’air). NTUA is the oldest (founded in 1836) and most prestigious educational institution of Greece in the field of technology [27] and is represented in the AEROMET project by the Lab of Analytical Chemistry of the School of Chemical Engineering [28]. The lab has significant experience in the field of analytical and environmental chemistry—in particular, in aerosol characterization and the quantification of toxic trace elements.
LNE prepared the sample filters and dispatched them to NPL and NTUA for analysis. LNE also analyzed the filters themselves. Each laboratory used validated microwave programs and ICP-MS methods that varied slightly from each other but all met the requirements of EN14902 [13]. Different microwave and ICP-MS instruments were used.

2. Experiments

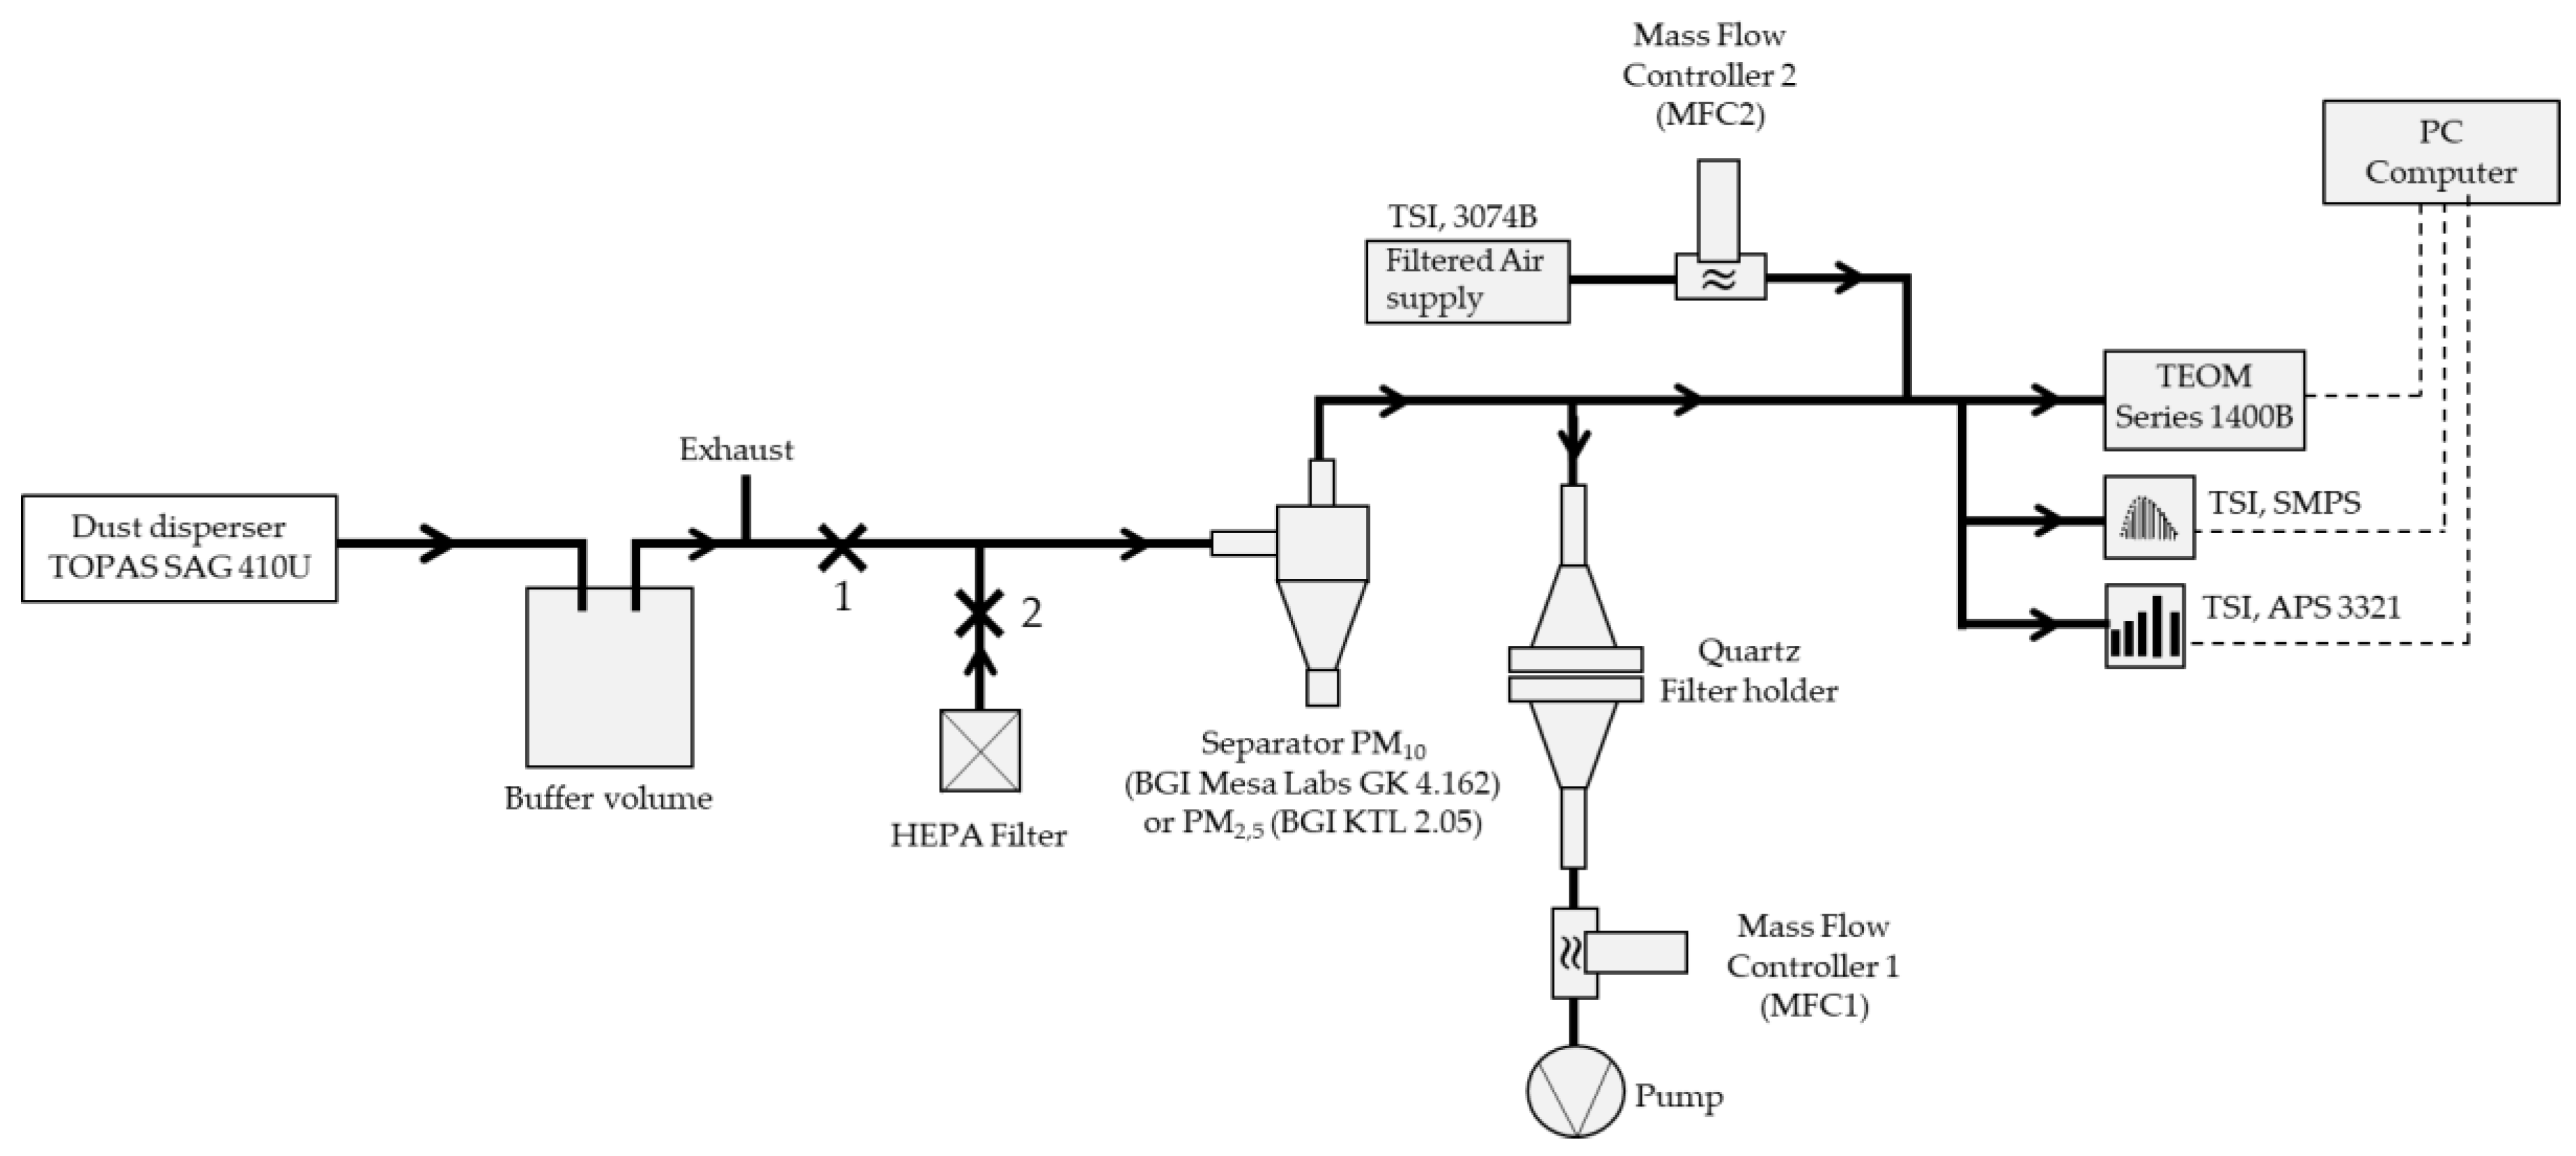
2.1. Experimental Set-up for Loading Filters

To carry out this study, a powder from a waste incineration plant was used according to previous work for the development of a Certified Reference Material [11]. The experimental set-up for sampling the incinerator ash onto filters is presented in Figure 1. With an aerosol disperser (Model SAG 410/U, TOPAS, Dresden, Germany), the resuspension of this powder was achieved. Its principle lies in the controlled deposition of the powder on a rotating ring.
The powder is contained in a reservoir. An endless screw allows the mechanical delivery of this powder to an area where it falls by gravity onto the rotating ring. A venturi nozzle located above this ring allows the suction of the aerosol.
After its generation, the aerosol is routed to a buffer volume, thus making it less dependent on a variation in mass during generation. The aerosol then reaches the PM10 or PM2.5 separator with a cut-off diameter d50 at 10 μm for 3.0 L min−1 and 2.5 µm for 4.0 L min−1, respectively, and described elsewhere [29]. During loading on a filter, clip 2 is installed, and clip 1 is removed. The aerosol is then routed to a Tapered Element Oscillating Microbalance (TEOM 1400A, Rupprecht & Patashnick, Waltham, MA, USA, with an aerosol flow rate at 3.0 L min−1) [30] to monitor the particulate mass concentration. During a filter loading with a PM10 separator, we stop the filter pump when the Total Mass measured by the TEOM reaches the value of 500 µg. This value led to an approximate mass of 2.5 mg on a filter. For the PM2.5 separator, which needs a flow rate of 4.0 L min−1, we keep a five times higher mass load of the quartz filter with a modification of the flow rate setpoint for MFC1 and MFC2 (Figure 1). This experimental approach enabled us to avoid a filter with a mass that deviates from the target value of 2.5 mg.
Furthermore, size distribution was performed during an experimental campaign for PM2.5 and PM10 collection using scanning mobility particle sizer spectrometer, SMPS (TSI, DMA 3082 + CPC 3775, Shoreview, MN, USA, with an aerosol flow rate at 0.3 L min−1), and aerodynamic particle sizer spectrometer (TSI, APS 3321, Shoreview, MN, USA, with an aerosol flow rate at 5.0 L min−1). The HEPA filter allows a sampling without particles for the SMPS, APS, and TEOM devices and for the filter holder. For this configuration, clip 2 is removed, and clip 1 is installed. This zeroing procedure avoids particles in quartz filter when the flow rate is not stabilized. After this stabilization, the aerosol loading filter procedure can be started, as explained above.
For the sampling and the installation of the filters, a filter holder equipped with quartz filters of the QAT-UP Pall type was used. This type of filter was used, because the metal residues are ten times less than the detection limit recommended by the standard EN14902 [13]. Filter weighing was performed using a Mettler Toledo balance, model AX205DR. The filters were weighed using the double-weighing method. This method is a method of measurement by substitution, in which the mass of the deposited aerosol is determined by direct comparison with a standard using the Mettler Toledo balance. Two sets of filters were sent to the partners for analysis, the first set loaded with PM10 and the second set with PM2.5.
The comparison scheme used is that of Borda’s method [31] repeated in reverse order. It is carried out with four weighings obtained by placing them successively on the weighing plate:
  • The standard: mass value M T 1 obtained with the balance.
  • The mass: mass value M E 1 obtained with the balance.
  • The mass: mass value M E 2 obtained with the balance.
  • The standard: mass value M T 2 obtained with the balance.
The result is therefore given by the following equation:
Δ M = M E 1 + M E 2 M T 1 M T 2 2 ,
The ΔΜ value refers to the mass relative to the weighing standard. This method makes it possible to remove any drift in the balance indications during weighing on the condition that this drift is linear and where the indications are read regularly over time. It was repeated without aerosol and with the collected aerosol.
Figure 2 presents the SMPS and APS size distributions between 0.01 µm and 16 µm for the PM10 and PM2.5 separators. Figure 2a presents the SMPS size distribution with data acquisition for 20 min, which corresponded to one filter-loading duration. The standard deviation shows that a good generation stability during filter loading concerning the number and modal size was achieved. A median size diameter equal to Dmedian = 280.1 nm ± 2.0 nm and Dmedian = 270.9 nm ± 1.9 nm was obtained for the PM10 and PM2.5 separators, respectively. It is showed that we have small differences between PM10 and PM2.5 experimental for SMPS measurements.
Figure 2b shows the APS size distribution obtained for 20 min. The left and right vertical axes corresponded to the PM10 and PM2.5 separators, respectively. The relative standard deviation obtained during the period was between 8% and 16%. This figure showed that most of our aerosol is composed of particles smaller than 10 µm. The PM2.5 separator removed a high fraction of particles compared to the PM10 separator. For Da = 1.59 µm, the particles number N is 23 times greater for PM10 than PM2.5, comparing the size distribution values.
To conclude, this experimental set-up for PM10 and PM2.5 aerosol loaded on quartz filter shows an aerosol size distribution with a great stability during generation.

2.2. Experimental Protocol for ICP–MS Analysis

2.2.1. PM2.5 and PM10—Filter Preparation and Digestion Methods

All the filters used for PM2.5 and PM10 samplings were preconditioned and pre-weighed under controlled conditions. They were also post-conditioned and post-weighed to calculate the filter concentration according to the standard EN 12341 [32].
LNE proposed to analyze the quartz filters loaded in industrial ashes materials according to the two digestion methods planned by the EN14902 [13]:
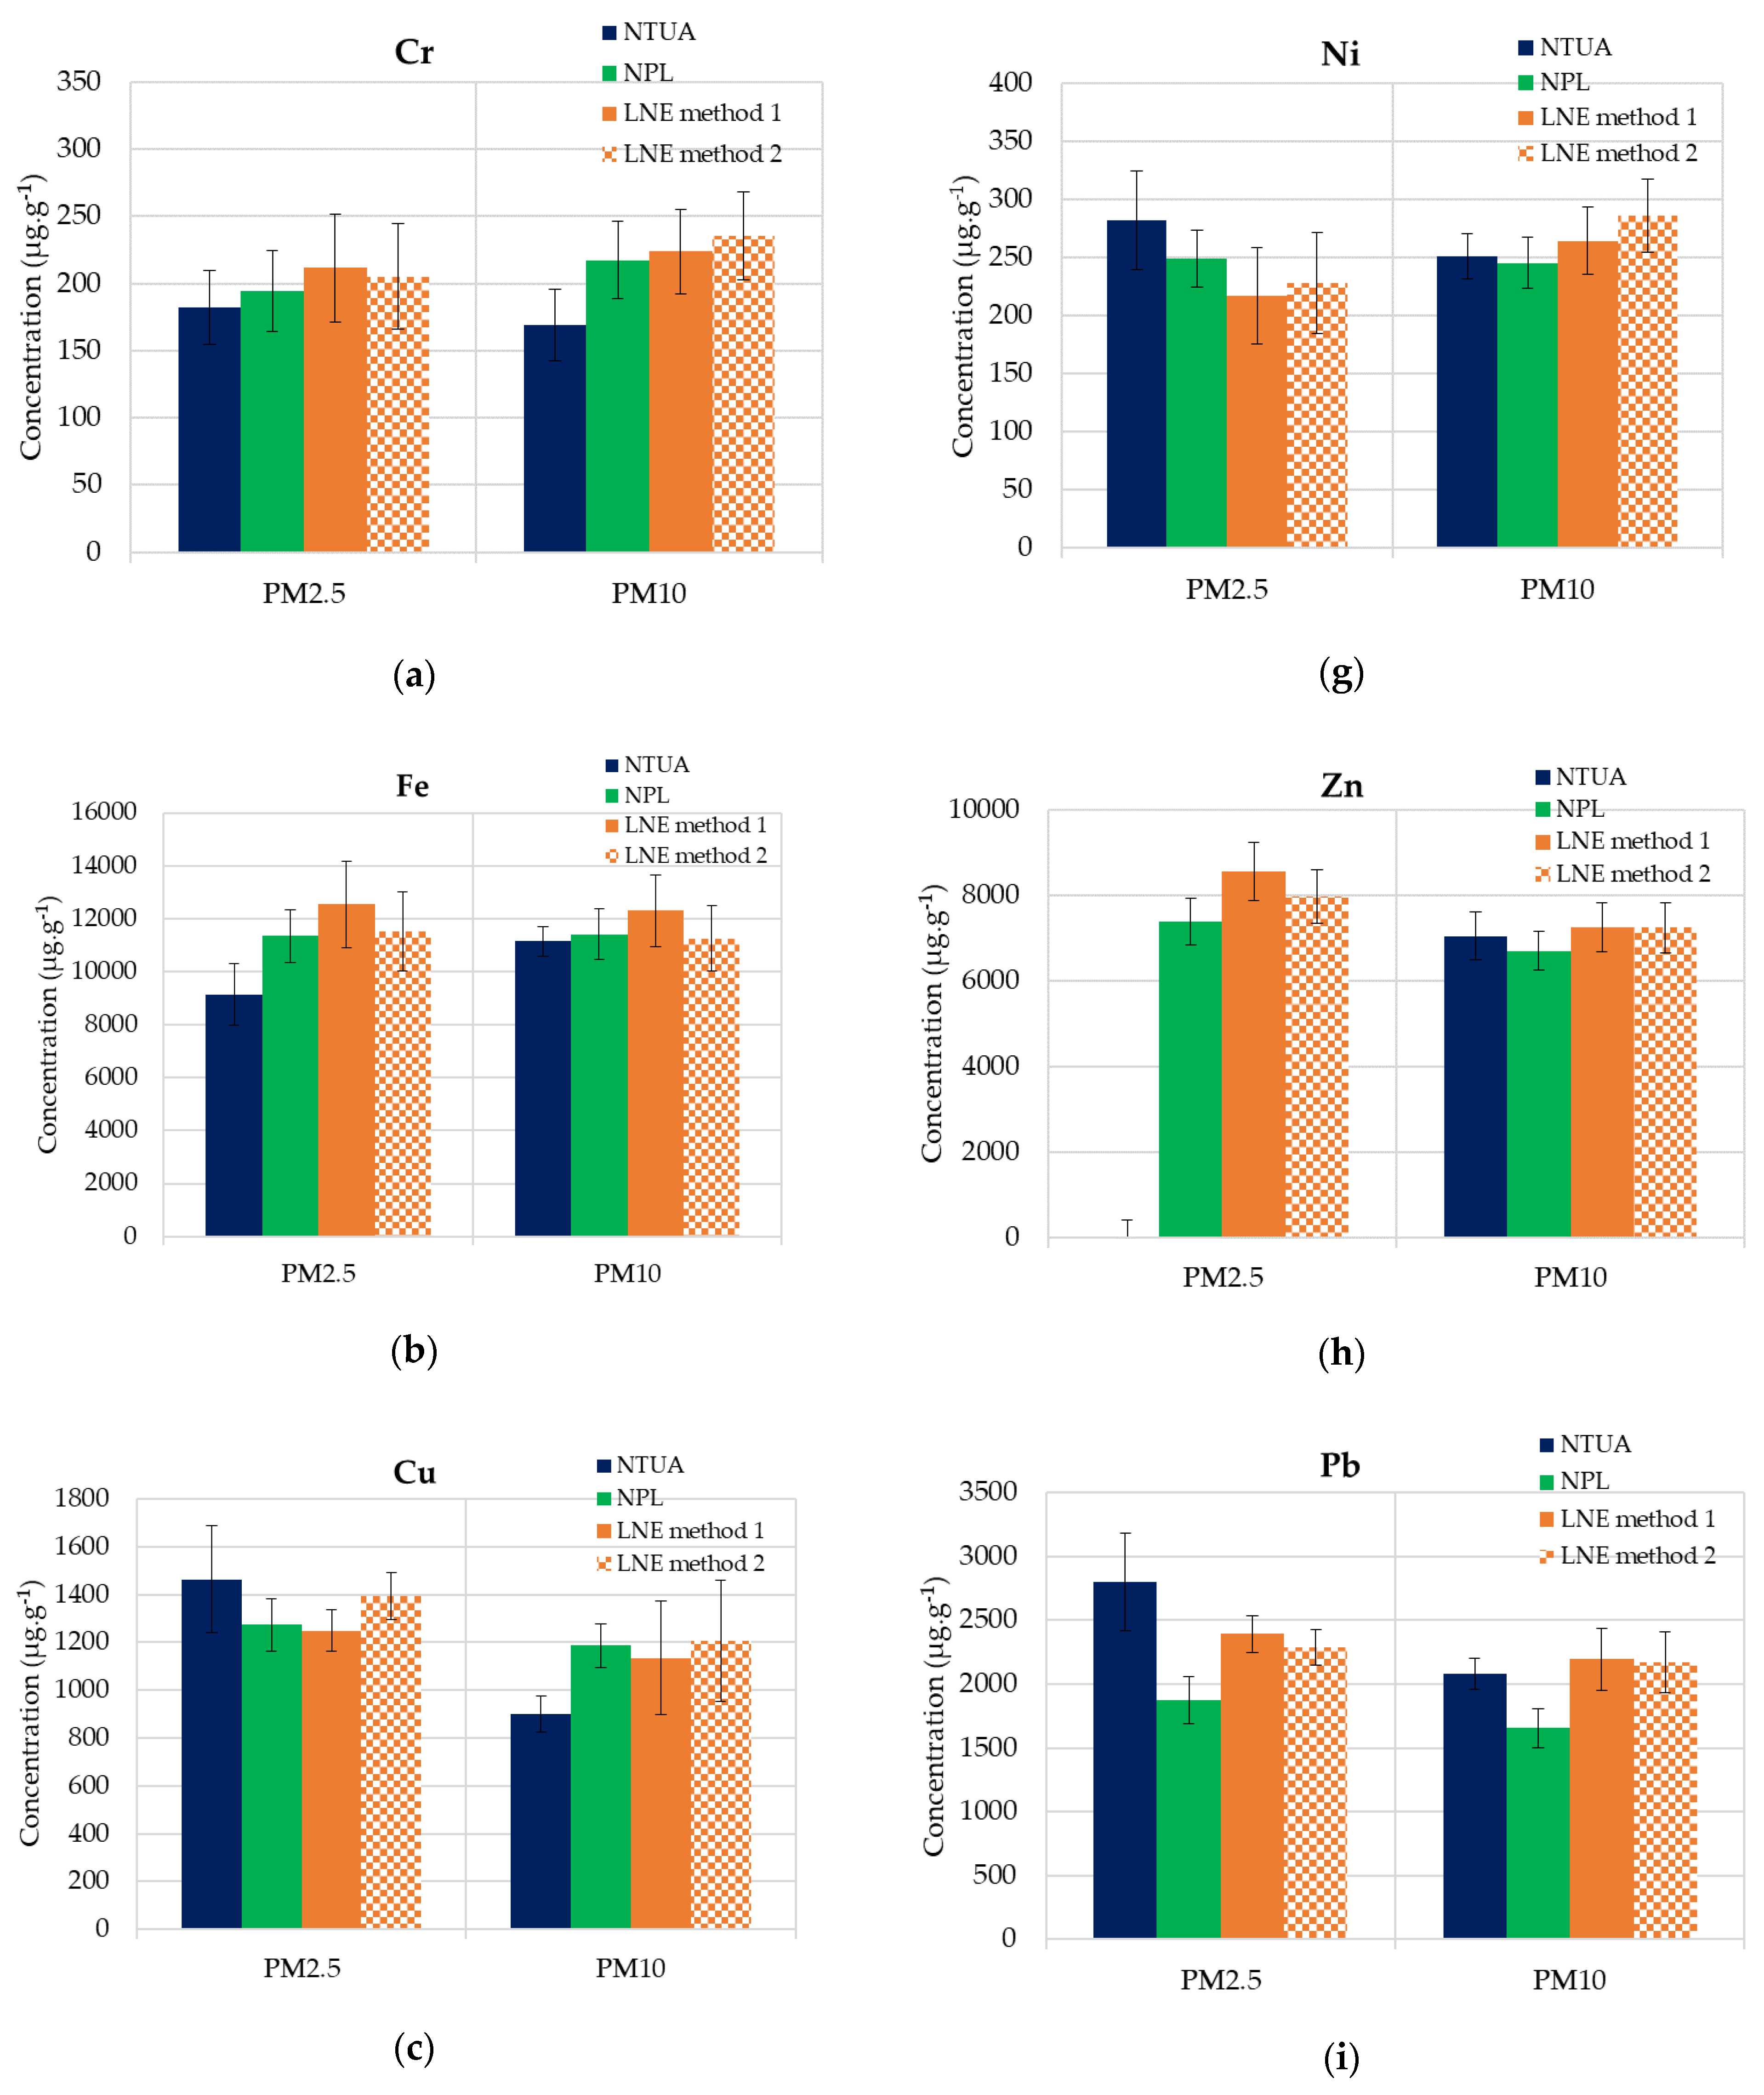
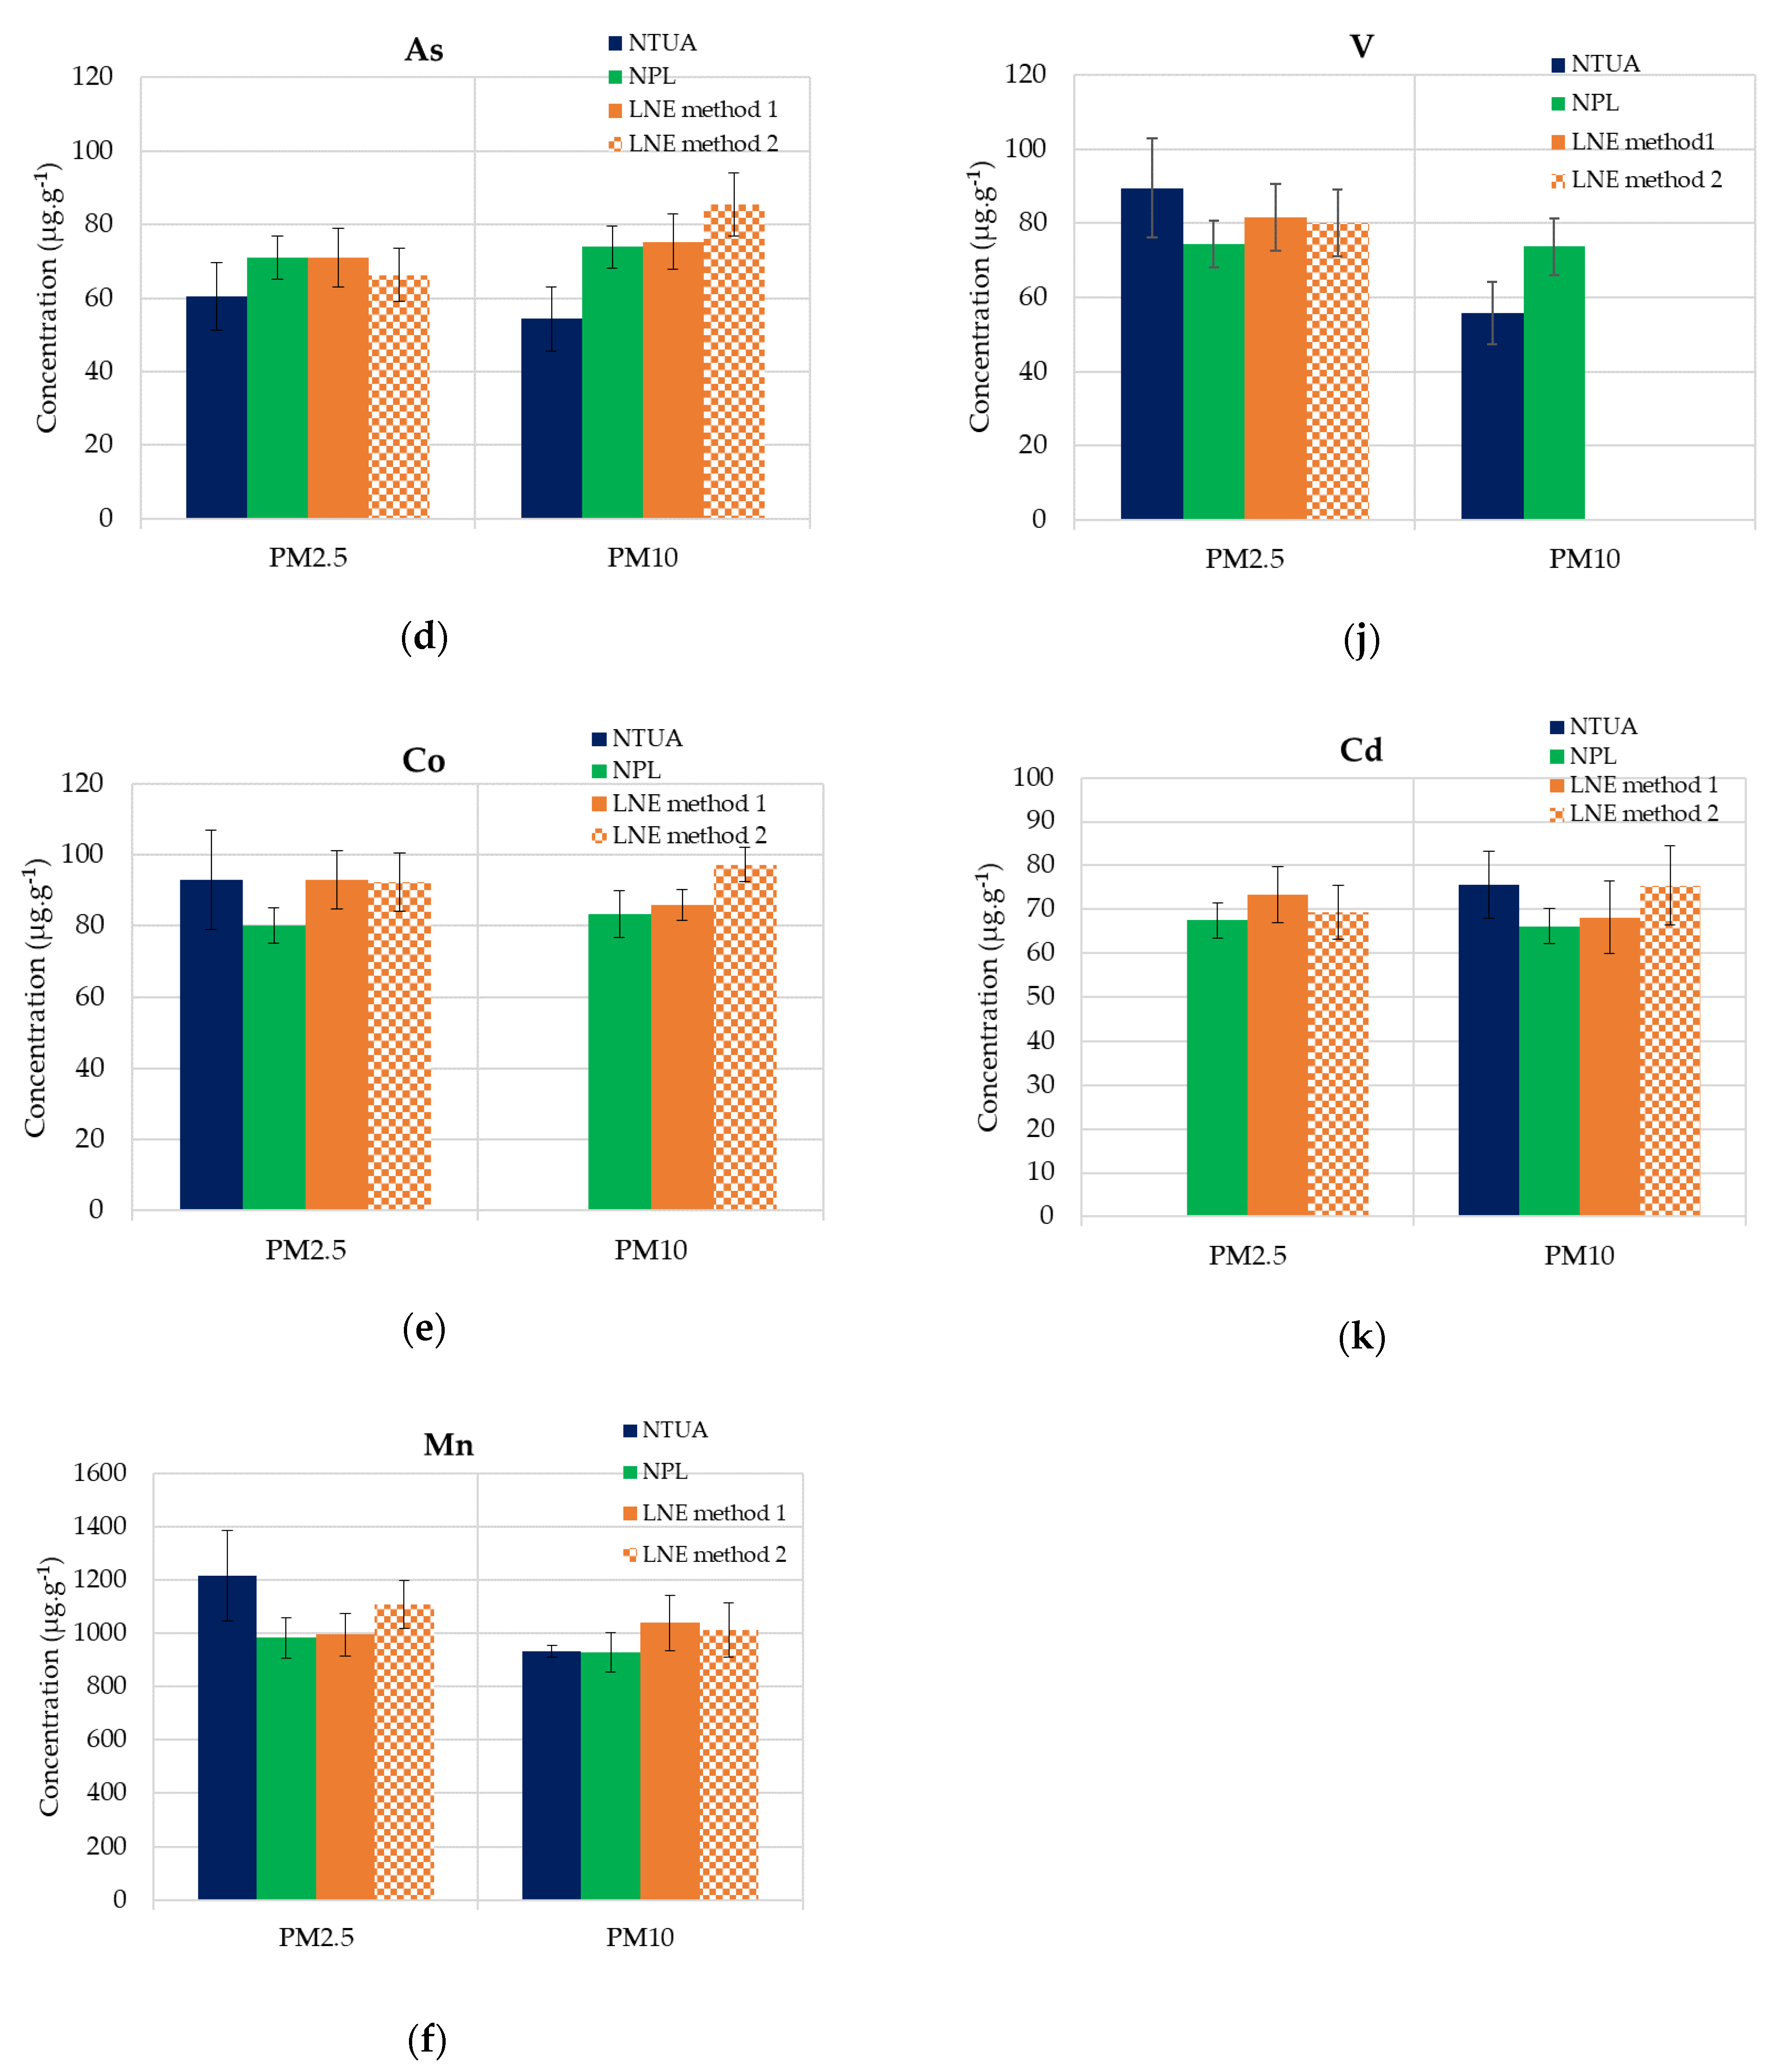
  • Method 1: Total digestion of the filter and the ash particles deposited with hydrofluoric acid (HF) (~40%), nitric acid (HNO3) (~70%) and hydrogen peroxide (H2O2) (~30%). This protocol leads to a complete dissolution of the filter.
  • Method 2: Total digestion of the ash particles deposited with HNO3 (~70%) + H2O2 (~30%). The filter is not dissolved with this protocol.
LNE digested the entire filters as supplied without taking any subsamples. Digestion of the filter samples was performed with a microwave high-pressure reactor applying the same program for each digestion method (Table 1).
After cooling the digested filter, solutions were diluted to 50 mL with ultrapure water. In the case of total digestion in HF medium, a certified reference material (CRM) BCR-038 fly ash with a composition similar to the industrial ashes deposited on the filter was used to validate the digestion and quantification protocols.
The NPL took half-filter subsamples using clean ceramic scissors. The filter portions were digested using a protocol based on the standard EN 14902 [13] in a mixture of 2 mL H2O2 (~30%) and 8 mL HNO3 (~70%). The microwave program used was a ramp-to-power program achieving 220 °C (Table 2).
After digestion, the solutions were cooled down and diluted to 50 mL with ultrapure water. The filter material was not dissolved, so was removed by filtration. The final mass of the solution was recorded.
NTUA followed a microwave digestion with a mixture of 7 mL HNO3 (supra-pure 65%, MERCK KGa, Darmstadt, Germany) and 2 mL H2O2 (30%, Sigma Aldrich, St. Louis, MO, USA) using the temperature/time program according to the EN14902 [13] (ramp 20 min to 220 °C, hold at 220 °C for 25 min and cool down for 30 min at ambient temperature). For the ICP-MS analysis with two different instruments, the digested filters are quantitatively transferred to 25 or 50-mL volumetric flasks and filled up with ultrapure water.

2.2.2. ICP-MS Instrumentation

NPL performed the ICP-MS analysis on an Agilent 8900 ICP-QQQ-MS (Supplied by Agilent Technologies, Santa Clara, CA, USA). For the calibration, up to 6 gravimetrically prepared calibration standards (acid matrix matched to the samples) were used. Analyte responses were normalized against an appropriate internal standard element (Sc for V and Cr; In for Mn, Fe, Cu, Zn and Cd; Y for Ni and As and Bi for Pb). The single quad method used Kinetic Energy Discrimination (KED) Helium (He) mode for Fe. No gas (no interference removal) for all other analytes. NPL regularly prepares CRMs, e.g., NIST 1648a (urban PM) and NIES no. 28 (urban aerosols), to validate their digestion and analysis methods. On the same analysis run as the intercomparison samples, NPL also analyzed a QC solution containing the analytes of interest prepared from independent metal stocks from the calibration standards to verify their accuracy.
LNE performed an initial analysis on a Thermo Element HR-ICP-MS (Supplied by Thermo Scientific, Waltham, MA, USA) to verify the absence of interferences in the medium (MR) for Mn, Fe, Cu, Zn, Cr, Co and Ni and high (HR) for the As resolution modes on the first series of PM10 filters digested according to method 1.
A survey was initially performed in KED He mode using a Thermo ICAPQ ICP-MS (Supplied by Thermo Scientific, Waltham, MA, USA). The KED mode showed the presence of calcium (Ca) interferences in high concentrations (Ca40 O16 interfering on Fe56 and Ca44 O16 interfering on Ni60). In addition, the oxide formation was limited to <2%. The survey also showed the absence of Sc, In, Y, Ge and Ir, which are suggested by EN14902 [13] as the internal standard. However, a significant amount of Bi was found. For the calibration, up to 5 gravimetrically prepared calibration standards were used. No internal standards were used. However, the recovery ratio was evaluated using the BCR-038 and satisfied the EN14902 [13] requirements. This CRM was chosen because of its strong similarity with the study samples.
The isotopic composition of Pb was also evaluated with NIST SRM 981 due to the natural high variability. Standard solutions with isotopic composition similar to the sample were used. It was observed that the Pb204 isotope was interfered by Hg204 present in the sample, and therefore, Pb204 was not used for the quantification. The sum of Pb206, Pb207 and Pb208 was used as recommended in the EN14902 [13].
The NTUA analysis was performed on an Agilent 7700 ICP-MS (Supplied by Agilent Technologies, Santa Clara, CA, USA) with He mode, where an external calibration curve was generated for all analytes. A second ICP-MS instrument Thermo ICAP QC (Supplied by Thermo Scientific, Waltham, MA, USA) was also used with internal standardization (Sc for V and Mn; Ge for Cr, Ni, Cu and As; In for Cd and Ir for Pb) and external calibration. For method validation (for both instruments), NTUA analyzed two certified reference materials, NIST 2583 and NIST 2584 (both trace elements in Indoor Dust), under similar analysis conditions and sample preparation procedures. A very good agreement with the certified values was achieved for all the elements investigated.

2.2.3. Uncertainty Budget

LNE and NPL supplied full expanded uncertainties (k = 2) calculated in accordance with the guide to the expression of uncertainty in measurements [33]. NTUA uncertainties were based on the standard deviation of three sample replicates.

3. Results

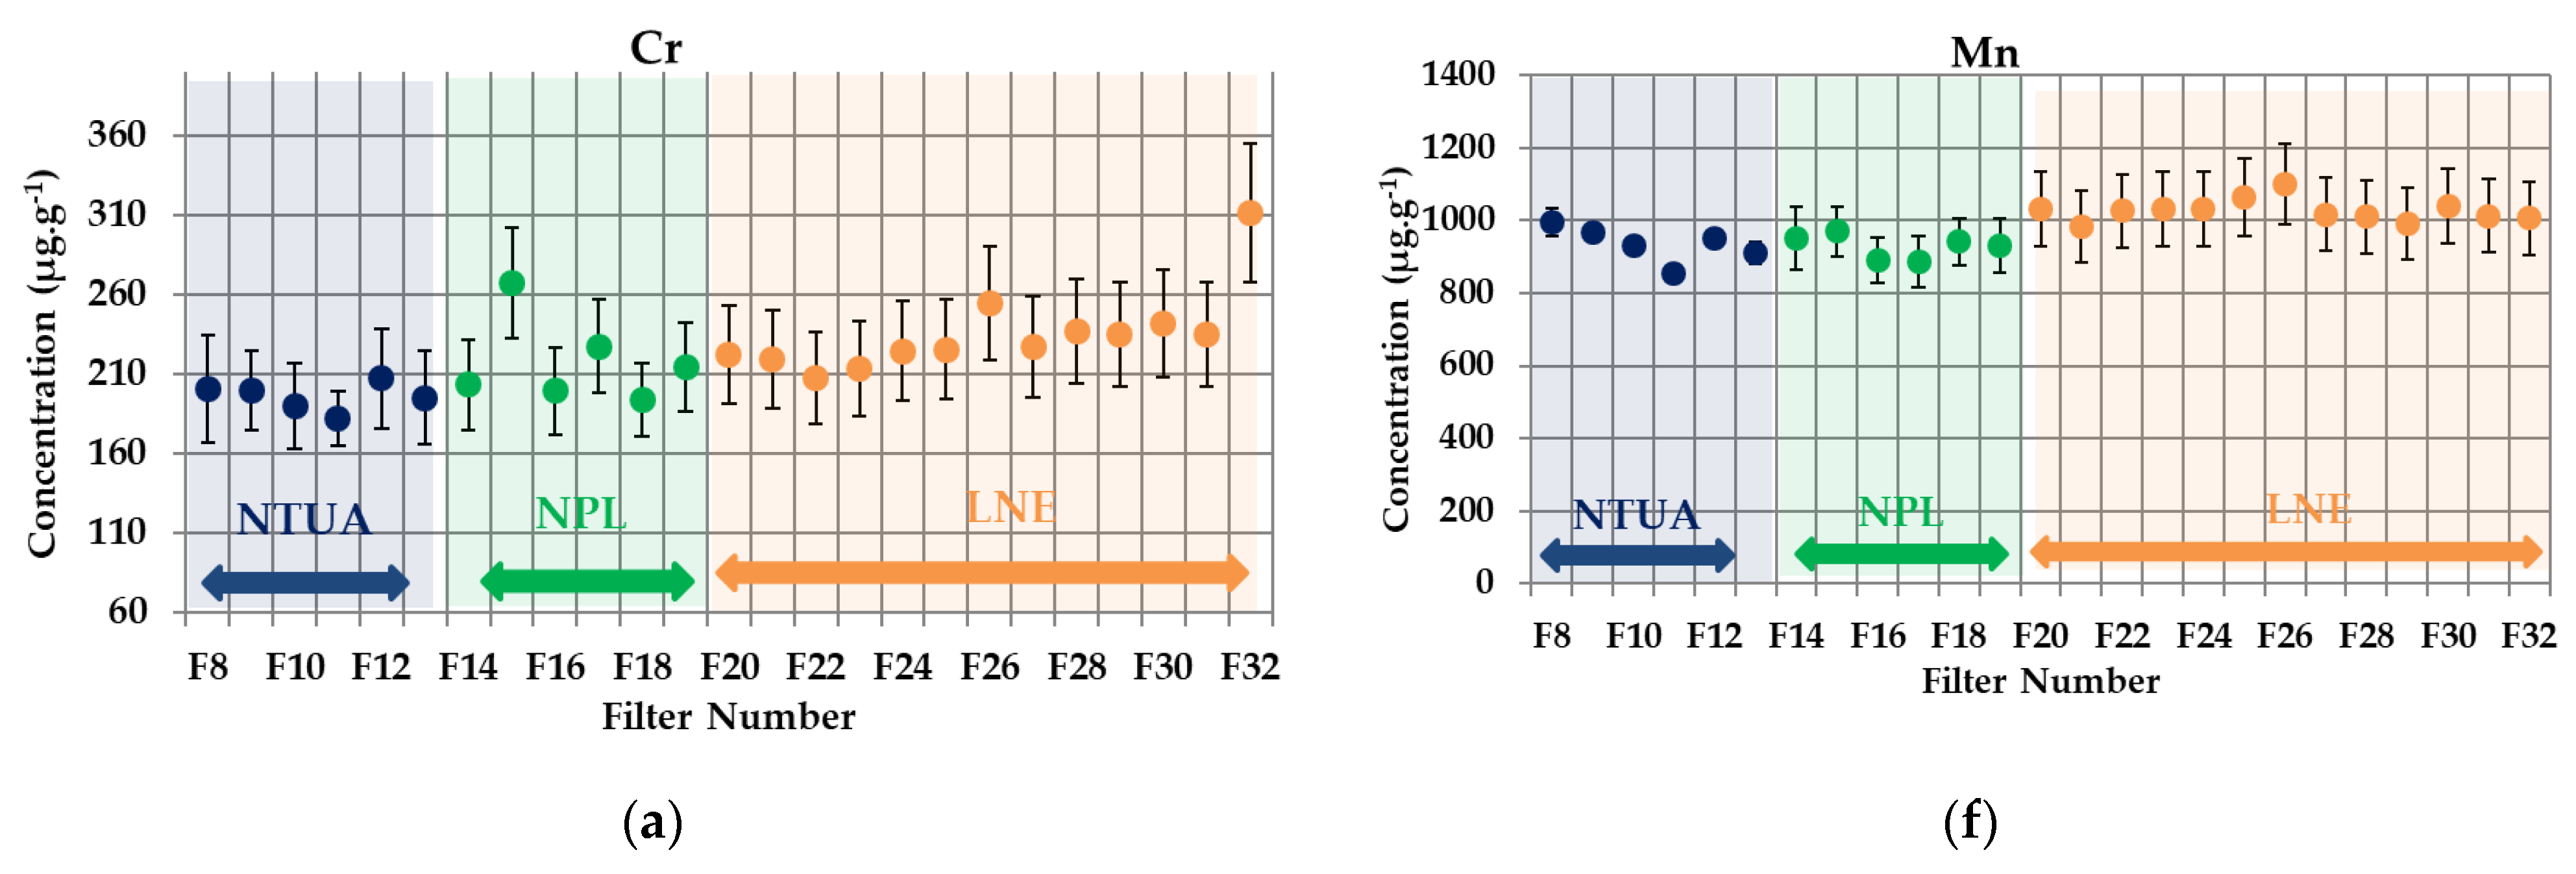
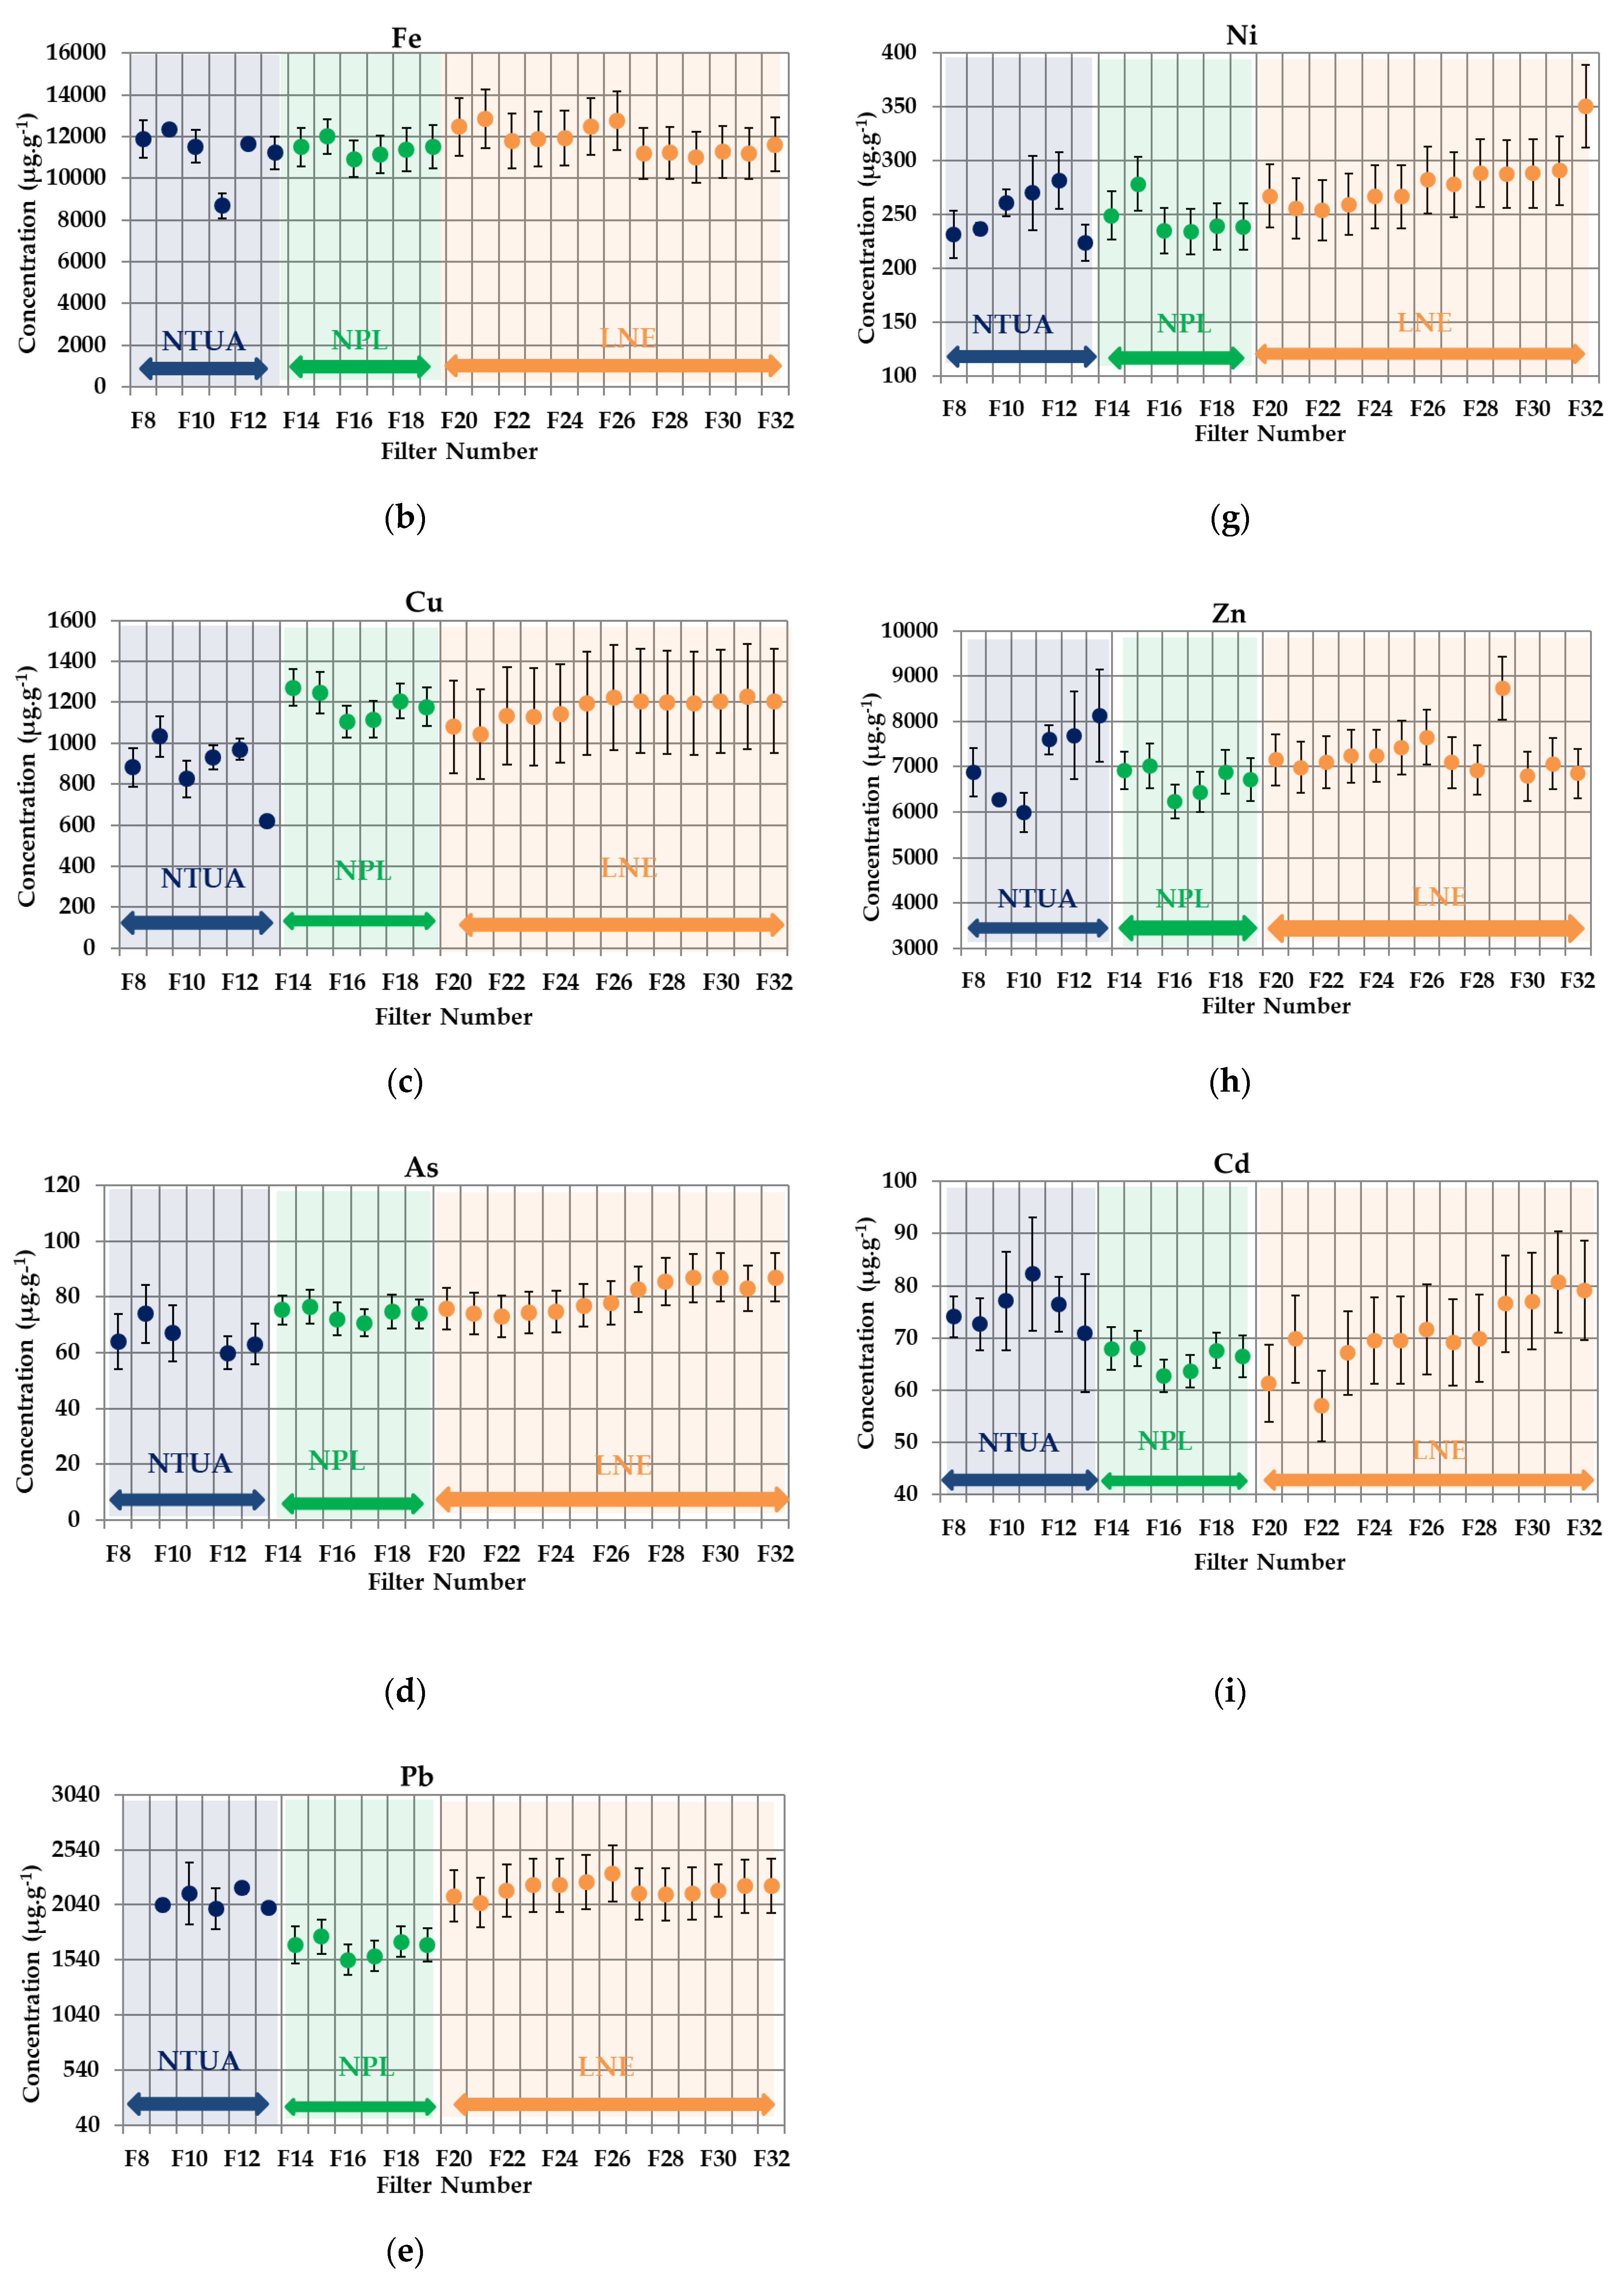
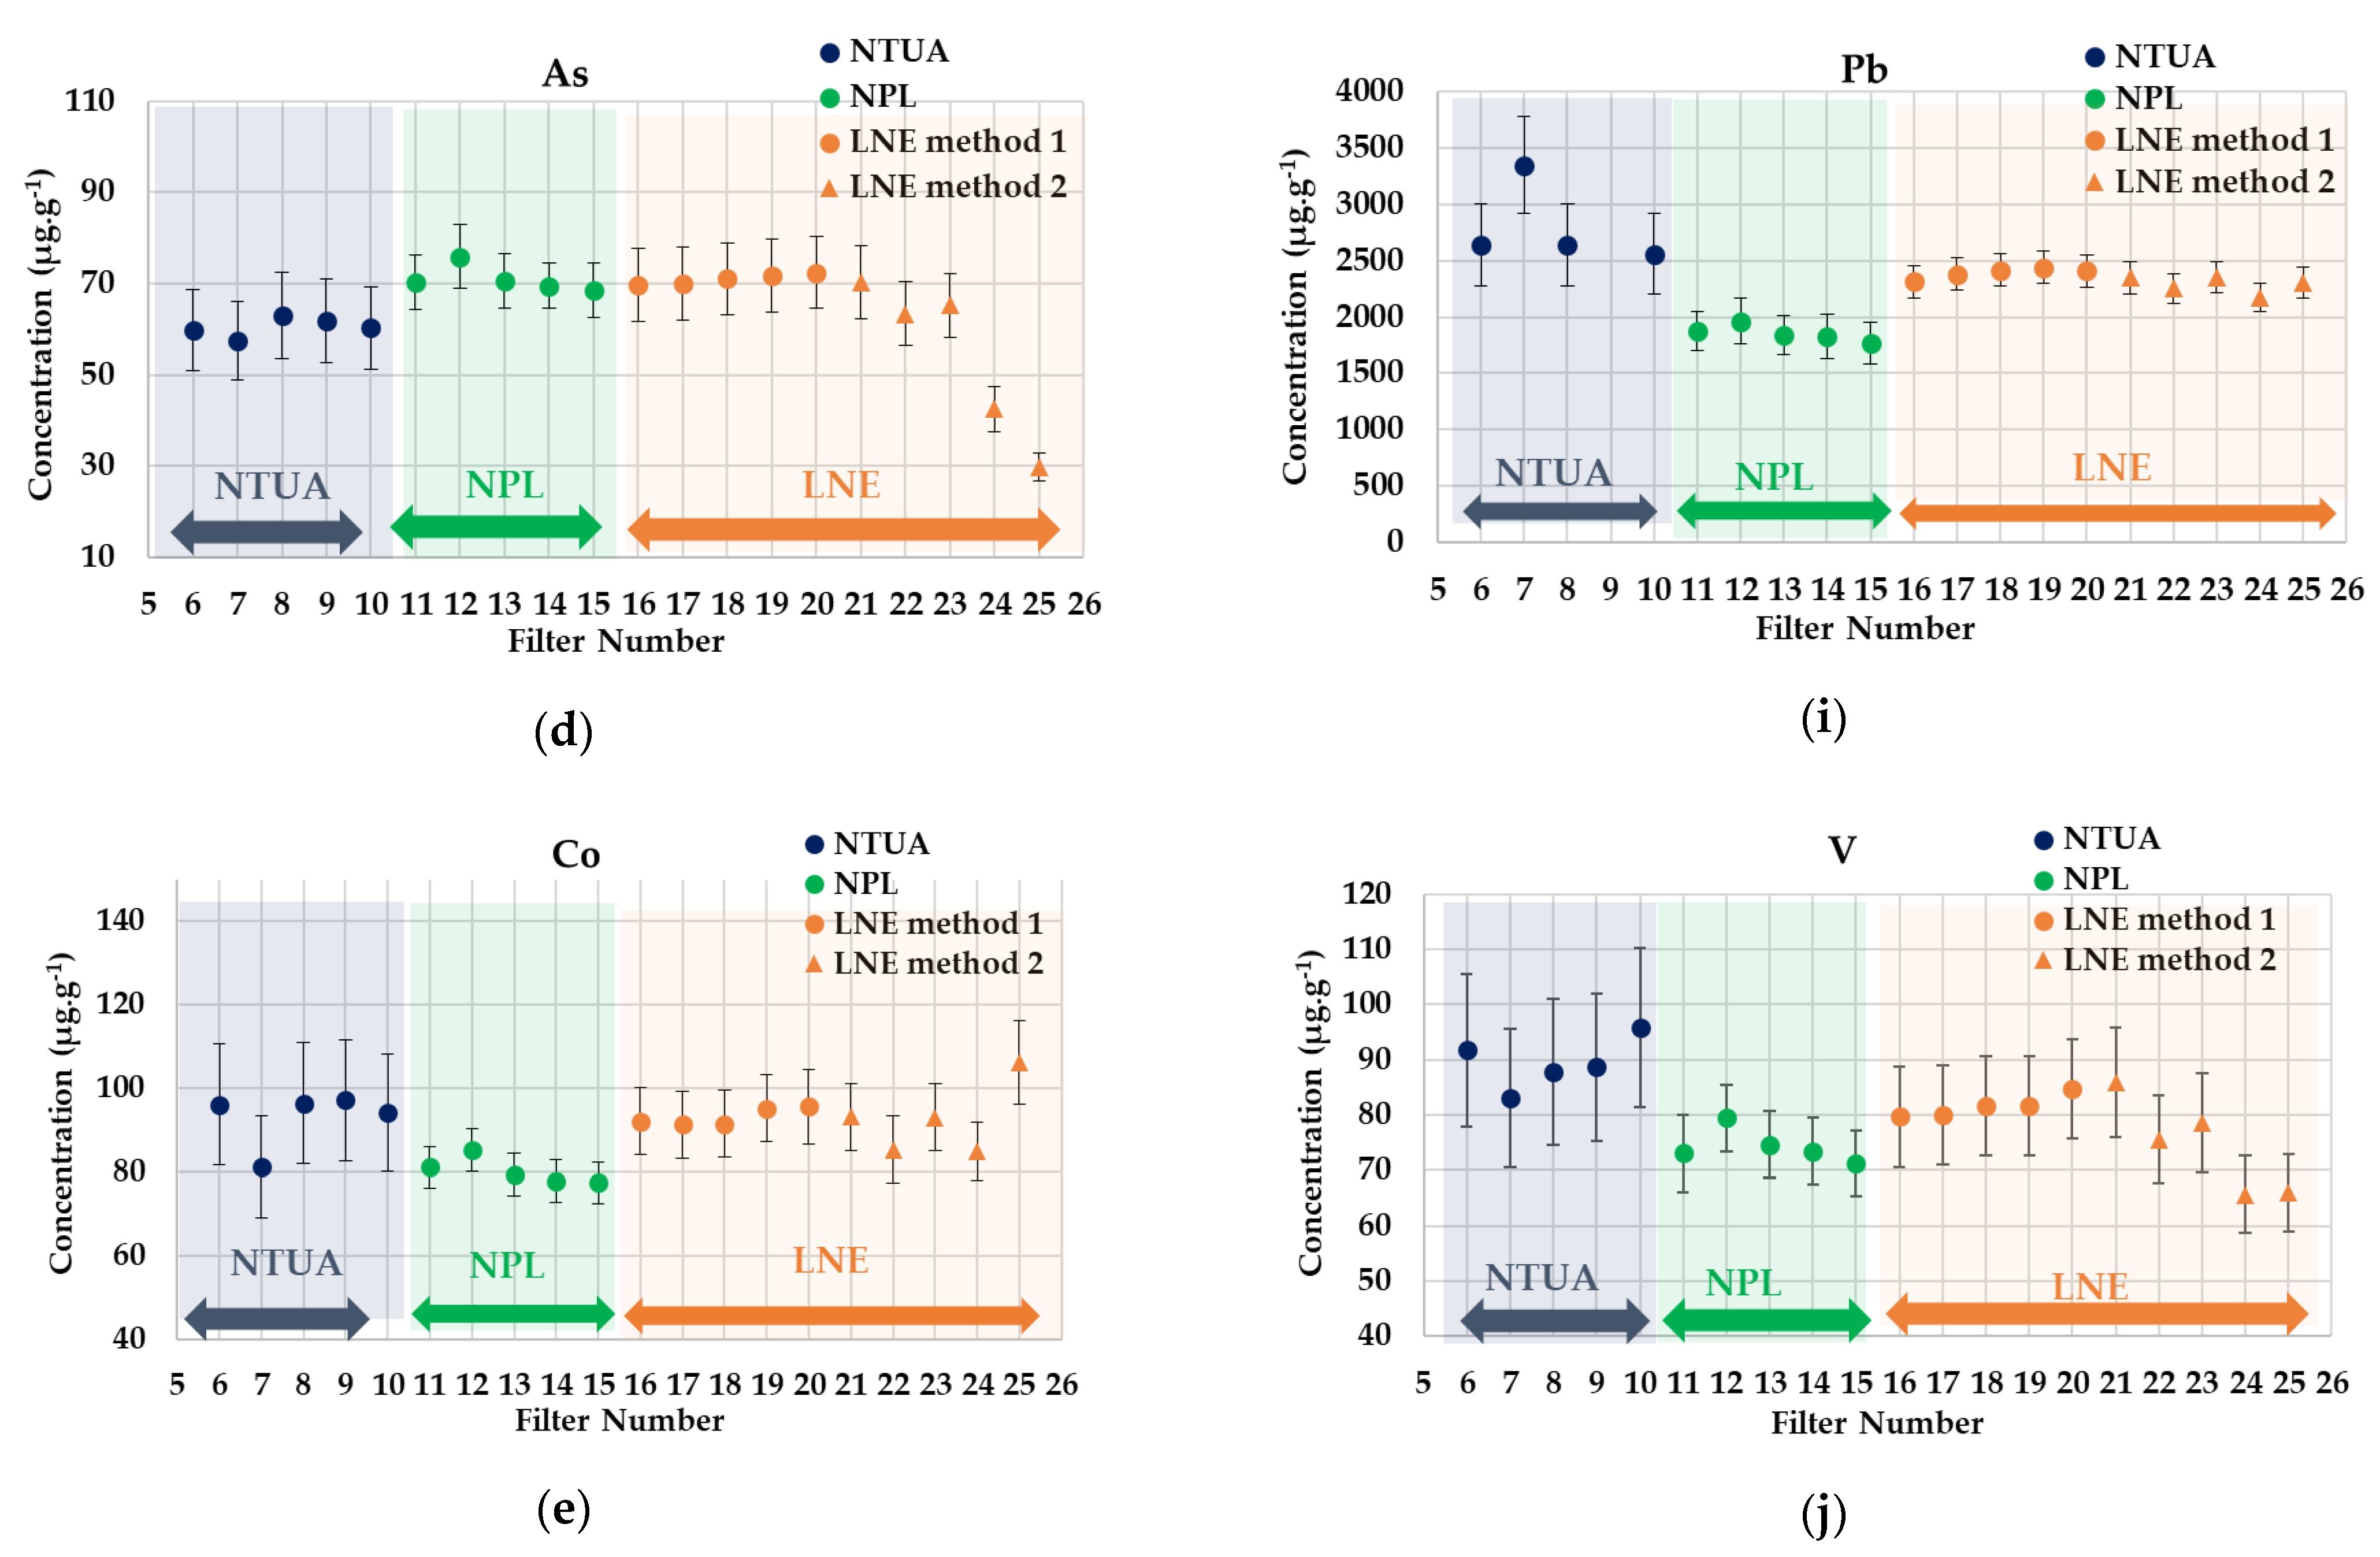
3.1. PM10 and PM2.5 ICP-MS Intercomparison Results

In this paragraph, the results of the V, Co, Cr, Mn, Fe, Cu, Ni, Zn, As, Cd and Pb mass concentrations are expressed as the average value divided by the mass deposited on filters (see Appendix A), and expanded uncertainties for the different filters are reported for the PM10 and PM2.5 size fractions.
In Figure 3a–i, the PM10 results and the uncertainties provided by each partner are plotted. The filter blank subtraction is included.
The global RSD for all metals are below 20% (see Appendix B). Especially for Mn, Fe, Ni, Zn and Cd, the RSD values are below 10%. These results show that a good reproducibility of filters loading was achieved. In Figure 4a–j, the PM2.5 mass concentrations of the metals divided by mass deposited on the filters and the uncertainties provided by each partner are plotted. The filter blank subtraction is included.
A good agreement was observed for most of the elements analyzed between the laboratories involved, and the global RSD for all metals in the PM2.5 particulates are also below 20%, as by the PM10 aerosols (see Appendix B). Some outliers found by the values were identified and isolated.
Additionally, considering the obtained data, it was concluded that the filter-loading method developed by LNE is generally well under control, achieving homogeneity of the deposit on the filters, as confirmed by the comparison with the results provided by the NPL, where only a half of the PM2.5 filters were digested.

3.2. Comparison of the Chemical Compositions for PM10 and PM2.5

The mean value of the mass concentrations of V, Cr, Mn, Fe, Cu, Ni, Zn, As, Cd, Co and Pb (expressed as the average value divided by mass deposited on filters and expanded uncertainties) for PM2.5 and PM10 are reported. Figure 5a–k illustrates the data for each element.
It is observed that the chemical compositions of the PM10 particles compared to those of PM2.5 are not significantly different in this industrial ash material, which is generally the case in atmospheric samples. In Table 3, the analyzed metal averages, the standard deviations and RSDs in PM2.5 and PM10 are presented.
A maximum RSD of 20%, which includes the deviation of loading individual filter samples, the digestion procedures, the variations in laboratory instrumentation, methods and analysts, confirms a very good repeatability of the whole procedure applied.

4. Discussion

The candidate reference material presents a comparable composition with airborne PM samples (PM10 and PM2.5) [18,34,35,36] and can therefore be defined as a suitable reference material for field campaigns of heavy metals analyses.
Overall, the intercomparison results show good agreement between the measurements from the different laboratories. This confirms that the preparation procedure for the candidate incinerator ash on the filter reference materials generally provided a stable set of samples with homogenous deposit loading, and the laboratory methods were all consistent with each other and the requirements of the EN14902 [13].
Automation of the developed test bench for filter loading could reduce the uncertainty between operators and reduce uncertainties between filter masses below 5%.
All three laboratories used microwave preparation and ICP-MS methods that were in accordance with the EN 14902 [13], so this minimizes potential variations from these sources.
The temperatures and pressures achieved with the different microwave programs were very comparable. The most likely source of potential variation from microwave digestion was the acid matrix. LNE compared the two digestion methods allowable in EN 14902 [13]:
  • Method 1: Total digestion of the filter and the ash particles deposited with HF (~40%), HNO3 (~70%) and H2O2 (~30%).
  • Method 2: Total digestion of the ash particles deposited with HNO3 (~70%) and H2O2 (~30%). The filter is not dissolved in the process.
NPL and NTUA both used method 2 (no HF). The inclusion of HF is usually considered necessary to digest samples with a high siliceous content [37]. The filters used to collect the incinerator ash were made of quartz, so they did not dissolve in the matrix without HF. Incinerator ash also typically contains a significant proportion of silicon [38]. However, there was no evidence of higher metal recoveries from the samples digested with HF. This suggests that either the silicon content of the incinerator ash was very low or the other metals were successfully extracted without full dissolution of the PM deposit. Moreover, these results also show that the choice of this material is suitable for the application of the EN14902 standard [13] using both digestion methods, even though laboratories preferably apply method 2. The representativeness of this material with respect to the elements present in the airborne matter was also demonstrated.
To discuss potential variations in the results from ICP-MS methods, it is first necessary to give an operational overview of the instrumentation. In a basic ICP-MS system, liquid samples are fed into a nebulizer where they are converted to an aerosol spray. The aerosol passes into argon plasma, where it is dried and broken down to its constituent elements, which are then ionized. The ion stream is focused through size-selective cones and an ion lens; then, it is directed into the mass filter quadrupole. Here, the ions are sorted according to their mass/charge (m/z) ratio and released into the detector [12].
One issue the user must be aware of with this technique is its vulnerability to spectral interferences. To mitigate most common interferences, most current ICP-MS systems include a collision/reaction cell located in front of the quadrupole. The cell enables the introduction of gases that either filter out polyatomic interferences by kinetic energy discrimination or react with analytes or the interfering element [12]. Reaction gases can either remove the interference from the analyte channel or move the analyte to a non interfered channel. The use of cell gases does result in a reduced signal loss [12], so should only be used at calibrated flow rates when interferences are present.
All the laboratories in the current intercomparison utilized helium as a collision gas (KED He mode) in their ICP-MS methods to minimize the various known or potential interferences. NPL only used the KED He mode for the determination of iron (Fe) due to the significant interference of Ar40O16+ formed from the plasma gas and sample matrix. LNE and NTUA used the KED He mode for the determination of all analytes reported. Considering that NPL used no interference removal for all analytes except Fe, their results were, in most cases, in agreement with those of the other laboratories. If the significant levels of the interferences were present, it would be expected that the NPL results would be higher than those of the other laboratories. The lead results from the NPL were slightly lower (just outside the uncertainty bars) than those of the NTUA and LNE (see Figure 5i). The NPL method is optimized for airborne UK PM samples, and bismuth (Bi) is used as the internal standard for lead, because it is not present in the UK Metals Network samples. However, the investigations of the LNE showed that bismuth was present in the incinerator ash samples. As the lead response was rationed against the bismuth response, this resulted in the lead results being slightly under-reported by the NPL.
For quantification, all three laboratories generated external calibration curves from which the sample concentrations were interpolated. The NTUA and NPL also normalized analyte responses against the internal standard elements chosen to demonstrate the comparable signal sensitivity of the analytes to changes in the analysis conditions, e.g., plasma temperature. This is generally very effective at reducing signal drift over the course of the analysis run [39].
The LNE validated their analysis methods by achieving good recoveries of an established CRM, BCR-038 (fly ash). The NPL regularly prepares CRMs representative of airborne PM, e.g., NIST 1648a (urban PM) and NIES no. 28 (urban aerosols), to validate their digestion and analysis methods. On the same analysis run as the intercomparison samples, the NPL also analyzed a QC solution containing the analytes of interest prepared from independent metal stocks from the calibration standards to verify their accuracy. The NTUA validated their methods by analyzing two certified reference materials, NIST 2583 and NIST 2584 (both trace elements in Indoor Dust), under similar analysis conditions and sample preparation procedures. A very good agreement with the certified values was achieved for all the elements investigated.
In summary, all three laboratories used validated, generally comparable methods that were in accordance with the EN 14902 [13], which gives confidence in the results produced.
A further improvement to consider for the ICP-MS methods is isotope dilution. For ICP-MS determination, the signal for any given analyte is measured at one isotopic mass (usually the most naturally abundant). Most elements have more than one stable, naturally occurring isotope, and the relative abundance of those isotopes to each other is constant. By spiking the sample with a certified enriched solution of a secondary isotope, e.g., 50Cr for the target species 52Cr, the change in the isotope ratio 50Cr/52Cr induced by the spike provides an accurate estimate of the element concentration [40]. However, the availability of certified enriched standard solutions must be ascertained.
Lead uncertainties were relatively small in proportion to the concentrations measured. Lead was the heaviest element analyzed in the intercomparison. As such, lead is the least prone to signal loss in the transmission through the ICP-MS [41], so it is usually among the most repeatable of the elements, which results in lower uncertainties. Conversely, the vanadium and chromium uncertainties were relatively high, and they were the lightest elements analyzed.

5. Conclusions

Τhe candidate reference material was analyzed for 11 elements, including the regulated ones (As, Cd, Ni and Pb). The results confirmed the satisfactory performance of the novel preparation method and integrating chemical compositions. The process method used to load quartz filters with PM10 and PM2.5 is encouraging. A good homogeneity of the deposited aerosol and a good reproducibility over time was achieved.
The ICP-MS analysis showed a good agreement between all laboratories, with a relative expanded deviation below 20%. The blank filter effect was not so critical for all the elements, except for chromium. According to the data, no significant difference between the digestion method with HF employed by the LNE and the common one with HNO3/H2O2 usually employed was found; even some outliers were identified and isolated in the case of the PM2.5 analysis.
The development of a Standard Reference Material (SRM) seems auspicious. Further improvements are in progress concerning aerosol loading, while the ICP-MS analysis could potentially be improved with isotope dilution.

Author Contributions

This work was performed by the members of the Laboratoire National de Métrologie et des Essais, LNE (A.B., C.O. and P.F.); National Physical Laboratory, NPL (S.G. and P.Q.) and National Technical University of Athens, NTUA (M.O.-P., L.-A.T. and T.L.). Paper review, drafting and editing and experiments on the filter, A.B.; investigation and elemental analysis, data preparation and reporting and paper review, C.O. and P.F.; elemental analysis, data preparation and reporting, paper review and drafting and editing, S.G.; paper review and supervising of the corresponding work package of the AEROMET project, P.Q.; elemental analysis, data preparation and reporting, paper review and drafting and editing, L.-A.T. and T.L. and writing, editing, corrections/review of the draft paper and supervising of the analytical work of NTUA, M.O.-P. All authors have read and agreed to the published version of the manuscript.

Funding

This research was funded by the European Community’s EURAMET EMPIR Program, AEROMET, under Grant Agreement number 16ENV07.

Acknowledgments

The research leading to these results was performed within the ΑΕRΟΜΕΤ I and AEROMET II projects and received funding from the European Community’s EURAMET EMPIR Programs under Grant Agreements no. 16ENV07 and no.19ENV08, respectively.

Conflicts of Interest

The authors declare no conflict of interest. The results of this work were derived in the context of the AEROMET project [6], and the decision to be published was a matter of collective agreement among the partners of the project consortium. This publication is in accordance with the terms of the AEROMET Grant Agreement No. 16ENV07 with the funding authority (EU/EASME). Finally, the funding sponsors had no role in the design of the study; in the collection, analyses or interpretation of data or in the writing of the manuscript.

Appendix A

Table A1 presents the particulate mass load obtained on each filter during this intercomparison. It is observed that the RSD values are below 8% during this experimental campaign for the loading filter.
Table A1. Particulate mass load on the filters for all laboratories during this intercomparison.
LNENPLNTUA
PM10PM2.5PM10PM2.5PM10PM2.5
PM on Filters (mg)PM on Filters (mg)PM on Filters (mg)PM on Filters (mg)PM on Filters (mg) PM on Filters (mg)
F203.03F162.59F142.82F112.51F82.39F62.46
F213.17F172.52F152.32F122.6F92.61F72.48
F222.74F182.49F162.85F132.41F102.23F82.55
F232.26F192.60F172.70F142.46F112.26F92.48
F242.68F202.57F182.50F152.44F122.34F102.58
F252.95F212.53F192.70 F132.31
F262.78F222.58
F272.74F232.56
F282.77F242.54
F292.77F252.58
F302.65
F312.60
F322.80
Average mass (mg) 2.77 2.55 2.65 2.49 2.36 2.51
STD (mg) 0.22 0.04 0.20 0.07 0.14 0.05
RSD (%) 7.88% 1.38% 7.67% 2.93% 5.81% 2.09%

Appendix B

Table A2 summarizes the mass concentration of each metal obtained by all participants for the PM10 filters. The RSD are below 15%.
Table A2. Metals concentrations (in µg·g−1 of deposited materials) and % relative standard deviation between all participants for all metals for PM10.
VCrMnFeNiCuZnCoAsCdPb
NTUA digestion
HNO3
+
H2O2
F857.0200.9994.411,872.0231.7881.06875.5 64.074.0
F968.0200.0965.512,324.7236.51032.06280.8 74.072.62042.6
F1054.0190.0930.411,523.7260.8826.05990.0 67.077.12141.6
F1151.0182.0854.08676.0269.8930.07597.8 82.22003.8
F1259.0207.0952.911,652.7281.5970.07687.2 60.076.52191.1
F1378.8195.0911.811,215.8223.7620.08133.3 63.070.92010.1
NPL digestion HNO3
+
H2O2
F1479.0203.1950.611,507.0248.71272.26912.586.475.467.91680.1
F1576.4267.4970.011,994.9278.01246.77023.383.776.668.01751.5
F1673.0199.2889.210,918.4235.01104.46238.781.772.162.81539.0
F1768.7227.3887.111,132.5233.81116.36441.080.170.863.61576.6
F1870.8193.5941.811,374.2238.71205.76880.082.574.967.61704.9
F1974.2214.3932.211,513.2238.51177.46714.785.473.966.51673.8
LNE digestion
HNO3
+
HF
+
H2O2
F20 222.01030.812,459.4266.81080.07150.886.475.961.42121.0
F21 219.2982.812,854.8255.51044.46984.383.674.069.82060.0
F22 207.51026.011,788.6254.11133.57098.982.073.157.02171.3
F23 213.51031.311,870.3259.31129.07230.786.774.567.12217.2
F24 224.61032.111,935.8266.51144.97244.386.274.969.52217.1
F25 225.51064.412,478.6266.61194.67424.087.777.069.62244.4
F26 254.61100.812,752.1281.91223.77652.789.377.971.62322.2
LNE digestion HNO3
+
H2O2
F27 227.41017.711,201.1277.61206.27088.994.482.769.22139.6
F28 236.71010.011,221.8288.11201.46926.496.985.569.92136.0
F29 235.0992.110,995.4287.51195.58730.596.986.876.52141.8
F30 241.81040.511,257.7288.01202.96788.998.187.077.02169.4
F31 235.01013.511,195.4290.71227.47063.398.283.180.72210.1
F32 311.01007.311,619.7350.51206.06847.999.387.179.22212.1
Average (µg g−1) 67.5221.3981.211,573.4264.41102.87080.388.775.570.72028.2
Standard Deviation
(µg g−1)
9.827.859.7810.827.3154.5589.26.47.46.2235.0
RSD (%) 14.612.66.17.010.314.08.37.39.88.811.6
Table A3 summarizes the mass concentration of each metal obtained by all participants for the PM2.5 filters. The RSD values are below 20%.
Table A3. Metals concentrations (in µg·g−1 of deposited materials) and % relative standard deviation between all participants for PM2.5.
VCrMnFeNiCuZnCoAsCdPb
NTUAdigestion HNO3
+
H2O2
F691.8130.81469.69381.33400.61404.6 96.159.8 2639.6
F783.1223.81112.98338.1337.31270.4 81.257.4 3348.2
F887.8243.51280.58891.1247.01450.7 96.463.1 2638.6
F988.7119.81256.38842.4239.61541.2 97.161.8
F1095.9193.11362.210,169.5305.51649.8 94.160.3 2561.8
NPLdigestion HNO3
+
H2O2
F1173.1183.6980.011,289.8298.71276.17605.581.170.468.61875.2
F1279.5227.71036.812,296.2263.51337.47751.185.275.971.91959.8
F1374.7197.4974.711,062.0234.31261.37348.779.470.766.51836.1
F1473.5180.3967.611,183.0224.81235.87093.977.969.566.21829.3
F1571.3181.4954.410,867.9223.31254.77127.177.468.664.21771.2
LNEdigestion HNO3
+
HF
+
H2O2
F1679.7221.1993.212,463.1220.51226.98476.592.169.770.02311.7
F1780.0183.81000.612,806.2208.31223.09355.891.370.070.92379.4
F1881.7211.0982.312,507.0222.21220.38236.491.471.071.82416.7
F1981.6212.21006.712,396.4215.11267.88949.495.271.777.12442.1
F2084.8229.4995.121,498.9219.31303.77808.995.572.577.12407.7
LNEdigestion HNO3
+
H2O2
F2186.0250.31123.313,276.6235.71476.48316.593.270.271.92350.2
F2275.6167.81081.811,462.5204.81406.17745.285.363.464.32252.6
F2378.6197.41151.412,558.7237.81401.08292.893.065.368.02352.3
F2465.7135.21047.78773.5201.11299.08033.984.942.563.52173.4
F2566.0159.41138.86865.2262.51387.97471.8106.229.778.52306.2
Average (µg g−1) 81.5197.51056.111,031.4242.21344.77974.289.067.369.92308.0
Standard deviation (µg g−1) 6.835.098.31603.436.7117.8643.97.05.24.2371.5
RSD (%) 8.317.79.314.515.28.88.17.97.76.016.1

References

  1. World Health Organization. Health Topics: Air Pollution: Ambient Air Pollution. Available online: https://www.who.int/health-topics/air-pollution#tab=tab_2 (accessed on 21 October 2020).
  2. World Health Organization. IARC Monograph: Lead and Lead Compounds; IARC: Lyon, France, 2006. [Google Scholar]
  3. World Health Organization. IARC Monograph: Cadmium and Cadmium Compounds; IARC: Lyon, France, 2012. [Google Scholar]
  4. European Commission Council. Directive 2008/50/EC of the European Parliament and of the Council of 21 May 2008 on ambient air quality and cleaner air for Europe. Off. J. Eur. Union 2008, L152_1, 1–44. [Google Scholar]
  5. European Commission Council. Directive 2004/107/EC of the European Parliament and of the Council of 15 December 2004 relating to arsenic, cadmium, mercury, nickel and polycyclic aromatic hydrocarbons in ambient air. Off. J. Eur. Union 2005, L023_3, 3–16. [Google Scholar]
  6. EMPIR AEROMET Project. Available online: www.aerometproject.com (accessed on 21 October 2020).
  7. Kothari, R.; Tyagi, V.V.; Pathak, A. Waste-to energy: A way from renewable energy sources to sustainable development. Renew. Sustain. Energy Rev. 2010, 14, 3164–3170. [Google Scholar] [CrossRef]
  8. Scarlat, N.; Fahl, F.; Dallemand, J.-F. Status and Opportunities for Energy Recovery from Municipal Solid Waste in Europe. Waste Biomass Valorization 2019, 10, 2425–2444. [Google Scholar] [CrossRef] [Green Version]
  9. Phua, Z.; Giannis, A.; Dong, Z.; Grzegorz, L.; Wun Jern, N. Characteristics of incineration ash for sustainable treatment and reutilization. Environ. Sci. Pollut. Res. 2019, 26, 16974–16997. [Google Scholar] [CrossRef] [PubMed]
  10. The National Research Council (US) Committee on Health Effects of Waste Incineration. Waste Incineration & Public Health; Executive Summary; National Academies Press: Washington, DC, USA, 2000. Available online: https://www.ncbi.nlm.nih.gov/books/NBK233633/ (accessed on 21 October 2020).
  11. Oster, C.; Labarraque, G.; Fisicaro, P. Certification of a reference material of metal content in atmospheric particles deposited on filters. Anal. Bioanal. Chem. 2015, 407, 3035–3043. [Google Scholar] [CrossRef] [PubMed]
  12. Technical Note: The 30-Minute Guide to ICP-MS; PerkinElmer, Inc.: Shelton, CT, USA, 2017.
  13. European Committee for Standardization. BS EN 14902:2005 Ambient Air Quality—Standard Method for the Measurement of Pb, Cd, As and Ni in the PM10 Fraction of Suspended Particulate Matter; European Committee for Standardization (CEN): Brussels, Belgium, 2005. [Google Scholar]
  14. Bogush, A.; Stegemann, J.A.; Wood, I.; Roy, A. Element composition and mineralogical characterisation of air pollution control residue from UK energy-from-waste facilities. Waste Manag. 2015, 36, 119–129. [Google Scholar] [CrossRef] [PubMed] [Green Version]
  15. Ochsenkühn-Petropoulou, M.; Ochsenkühn, K.M. Comparison of inductively coupled plasma-atomic emission spectrometry, anodic stripping voltammetry and instrumental neutron-activation analysis for the determination of heavy metals in airborne particulate matter. Fresenius J. Anal. Chem. 2001, 369, 629–632. [Google Scholar] [CrossRef] [PubMed]
  16. Ochsenkühn, K.M.; Ochsenkühn-Petropoulou, M. Heavy metals in airborne particulate matter in an industrial area in Attica, Greece and their possible sources. Fresenius Environ. Bull. 2008, 17, 455–462. [Google Scholar]
  17. Zosima, A.; Tsakanika, L.-A.; Ochsenkühn-Petropoulou, M. Particulate matter emissions, and metals and toxic elements in airborne particulates emitted from biomass combustion: The importance of biomass type and combustion conditions. J. Environ. Sci. Health Part A 2017, 52, 497–506. [Google Scholar] [CrossRef] [PubMed]
  18. Goddard, S.L.; Williams, K.R.; Robins, C.; Butterfield, D.M.; Brown, R.J.C. Concentration trends of metals in ambient air in the UK: A review. Environ. Monit. Assess. 2019, 191, 683. [Google Scholar] [CrossRef] [PubMed]
  19. Goddard, S.L.; Brown, R.J.C.; Ghatora, B.K. Determination of beryllium concentrations in UK ambient air. Atmos. Environ. 2016, 147, 320–329. [Google Scholar] [CrossRef]
  20. Sandroni, V.; Smith, C.M.; Donovan, A. Microwave digestion of sediment, soils and urban particulate matter for trace metal analysis. Talanta 2003, 60, 715–723. [Google Scholar] [CrossRef]
  21. European Committee for Standardization. BS EN 13657:2002 Characterization of Waste. Digestion for Subsequent Determination of Aqua Regia Soluble Portion of Elements; European Committee for Standardization (CEN): Brussels, Belgium, 2002. [Google Scholar]
  22. European Committee for Standardization. BS EN 13656:2002 Characterization of Waste—Microwave Assisted Digestion with Hydrofluoric (HF), Nitric (HNO3), and Hydrochloric (HCl) Acid Mixture for Subsequent Determination of Elements; European Committee for Standardization (CEN): Brussels, Belgium, 2002. [Google Scholar]
  23. Robache, A.; Mathe, F.; Galloo, J.-C. Prelevement et Analyse Desmetaux Dans Les Particules en Suspension Dans L’air Ambiant. LCSQA. 2003. Available online: https://www.lcsqa.org/system/files/Etude2.pdf (accessed on 21 October 2020).
  24. National Physical Laboratory. Available online: https://www.npl.co.uk/ (accessed on 22 October 2020).
  25. Defra UK-Air. Available online: https://uk-air.defra.gov.uk/networks/network-info?view=metals (accessed on 22 October 2020).
  26. Goddard, S.L.; Brown, R.J.C.; Butterfield, D.M.; McGhee, E.A.; Robins, C.; Brown, A.S.; Beccaceci, S.; Lilley, A.; Bradshaw, C.; Brennan, S. Annual Report for 2014 on the UK Heavy Metals Monitoring Network; Queen’s Printer and Controller of HMSO: London, UK, 2015. [Google Scholar]
  27. National Technical University of Athens. Available online: https://www.ntua.gr (accessed on 22 October 2020).
  28. School of Chemical Engineering. Available online: https://chemeng.ntua.gr (accessed on 22 October 2020).
  29. Görner, P.; Simon, X.; Boivin, A.; Bau, S. Sampling efficiency and performance of selected thoracic aerosol samplers. In Annals of Work Exposures and Health; Oxford University Press: Oxford, UK, 2017; Volume 61, pp. 784–796. [Google Scholar]
  30. Patashnick, H.; Rupprect, E. Continuous PM-10 measurements using the Tapered Element Oscillating Microbalance. J. Air Waste Manag. Assoc. 1991, 41, 1079–1083. [Google Scholar] [CrossRef]
  31. Chisholm, H.W. On the Science of Weighing and Measuring, and the Standards of Weight and Measure. Nature 1873, 9, 47–49. [Google Scholar] [CrossRef] [Green Version]
  32. European Committee for Standardization. BS EN 12341:2014 Ambient Air—Standard Gravimetric Measurement Method for the Determination of the PM10 or PM2.5 Mass Concentration of Suspended Particulate Matter; European Committee for Standardization (CEN): Brussels, Belgium, 2014. [Google Scholar]
  33. JCGM 100:2008, Evaluation of Measurement Data—Guide to the Expression of Uncertainty in Measurement. 2008. Available online: https://ncc.nesdis.noaa.gov/documents/documentation/JCGM_100_2008_E.pdf (accessed on 21 October 2020).
  34. Abdul-Wahab, S.A. Source Characterization of Atmospheric Heavy Metals in Industrial/Residential Areas: A Case Study in Oman. J. Air Waste Manag. Assoc. 2004, 54, 425–431. [Google Scholar] [CrossRef] [PubMed] [Green Version]
  35. Abiye, O.E.; Obioh, I.B.; Ezeh, G.C.; Alfa, A.; Ojo, E.O.; Ganiyu, A.K. Receptor modeling of atmospheric aerosols in Federal Capital Territory (FCT), Nigeria. Ife J. Sci. 2014, 16, 107–119. [Google Scholar]
  36. Khodeir, M.; Shamy, M.; Alghamdi, M.; Zhong, M.; Sun, H.; Costa, M.; Chen, L.C.; Maciejczyk, P. Source apportionment and elemental composition of PM2.5 and PM10 in Jeddah City, Saudi Arabia. Atmos. Pollut. Res. 2012, 3, 331–340. [Google Scholar] [CrossRef] [Green Version]
  37. Method 3052 Microwave Assisted Acid Digestion of Siliceous and Organically Based Matrices; EPA: 1996. Available online: https://www.epa.gov/sites/production/files/2015-12/documents/3052.pdf (accessed on 21 October 2020).
  38. Mohamedzein, E.-A.; Al-Aghbari, Y. The Use of Municipal Solid Waste Incinerator Ash to Stabilize Dune Sands. Geotech. Geol. Eng. 2012, 30, 1335–1344. [Google Scholar] [CrossRef]
  39. Gaines, P. Trace Analysis Guide: Part 16; Inorganic Ventures Inc.: Christiansburg, VA, USA. Available online: https://www.inorganicventures.com/trace-analysis-guide/icp-ms-measurement (accessed on 16 October 2020).
  40. Miller-Ihli, N.J. Chapter 13 Chromium. In Hazardous Metals in the Environment, 1st ed.; Stoeppler, M., Ed.; Elsevier Science: Amsterdam, The Netherlands, 1992; Volume 12, pp. 373–404. [Google Scholar]
  41. Andrén, H.; Rodushkin, I.; Stenberg, A.; Malinovsky, D.; Baxter, D.C. Sources of mass bias and isotope ratio variation in multi-collector ICP-MS: Optimization of instrumental parameters based on experimental observations. JAAS 2004, 19, 1217–1224. [Google Scholar] [CrossRef]
Figure 1. Experimental set-up for particulate matter (PM)10 and PM2.5 particulate filters loaded with incineration ash.
Atmosphere 12 00067 g001
Figure 2. Size distribution of aerosol obtained with the scanning mobility particle sizer spectrometer (SMPS) and aerodynamic particle sizer spectrometer (APS) devices. (a) Size distribution of the aerosol obtained with SMPS expressed in terms of the mobility diameter Dm (µm). (b) Size distribution of the aerosol obtained with APS expressed in terms of the aerodynamic diameter Da (µm).
Atmosphere 12 00067 g002
Figure 3. Inductively Coupled Plasma–Mass Spectrometry (ICP-MS) intercomparison results for particulate matter PM10-loaded filters. (a) Cr, (b) Fe, (c) Cu, (d) As, (e) Pb, (f) Mn, (g) Ni, (h) Zn and (i) Cd.
Atmosphere 12 00067 g003aAtmosphere 12 00067 g003b
Figure 4. ICP-MS intercomparison results for PM2.5-loaded filters. (a) Cr, (b) Fe, (c) Cu, (d) As, (e) Co, (f) Mn, (g) Ni, (h) Zn, (i) Pb and (j) V.
Atmosphere 12 00067 g004aAtmosphere 12 00067 g004b
Figure 5. ICP-MS results (mean values of each lab) for PM2.5 and PM10-loaded filters and mean uncertainties. (a) Cr, (b) Fe, (c) Cu, (d) As, (e) Co, (f) Mn, (g) Ni, (h) Zn, (i) Pb, (j) V and (k) Cd.
Atmosphere 12 00067 g005aAtmosphere 12 00067 g005b
Table 1. Digestion method for LNE.
Nrt (min)E (W)T (°C)
1201200180
2101200230
3151200230
Table 2. Digestion method for the NPL.
Ramp Time (min)Power (W)Hold Time (min)
20120025
Table 3. All average, standard deviation and RSD values for particulate matter PM10 and PM2.5 for all metals.
AnalytesPM10
Average (µg g−1)
Standard
Deviation (µg g−1)
RSD (%)PM10 (ng/Filter)PM2.5
Average (µg g−1)
Standard
Deviation (µg g−1)
RSD (%)PM2.5 (ng/Filter)
V67.59.814.6%163.381.56.88.3%202.9
Cr221.327.812.6%568.7197.535.017.7%557.4
Mn981.259.76.1%2593.91056.198.39.3%2792.9
Fe11,573.4810.87.0%30,590.411,031.41603.414.5%28,848.4
Ni264.427.310.3%698.8242.236.715.2%1088.5
Cu1102.8154.514.0%2895.91344.7117.88.8%3486.3
Zn7080.3589.28.3%18,652.77974.2643.98.1%18,835.9
Co88.76.47.3%242.189.07.07.9%234.7
As75.57.49.8%190.167.35.27.7%164.5
Cd70.76.28.8%186.169.94.26.0%177.4
Pb2028.2235.011.6%5516.02308.0371.516.1%6249.5
Publisher’s Note: MDPI stays neutral with regard to jurisdictional claims in published maps and institutional affiliations.

