
Equivalent Black Carbon Aerosol Properties and Their Relationship with the Heating Season in Urban Environments


1
College of Geoscience and Surveying Engineering, China University of Mining & Technology, Beijing 100083, China
2
Guangxi Colleges and Universities Key Laboratory of Unmanned Aerial Vehicle (UAV) Remote Sensing, Guilin University of Aerospace Technology, Guilin 541004, China
3
Guangxi Zhuang Autonomous Region Eco-Environmental Monitoring Centre, Nanning 530028, China
*
Author to whom correspondence should be addressed.
Atmosphere 2021, 12(10), 1314; https://0-doi-org.brum.beds.ac.uk/10.3390/atmos12101314
Submission received: 19 July 2021
/
Revised: 29 September 2021
/
Accepted: 5 October 2021
/
Published: 8 October 2021
(This article belongs to the Special Issue Black Carbon Aerosol Monitoring and Its Radiative Forcing Effects)
Abstract
:Black carbon (BC) aerosols have a considerable impact on humans because they not only cause environmental pollution and reduce visibility but also harm human health. During the heating season in northern China, a large amount of coal is burned for heating, producing a large amount of BC. There are few studies on BC properties during the heating season. In this paper, BC is measured optically, so it is referred to as equivalent black carbon (EBC). This paper investigated EBC properties in depth during the heating and nonheating seasons of a typical urban environment in China with two years of EBC measurements. The results show that: (1) EBC aerosol concentrations during the heating season were significantly higher than those during the nonheating season. (2) The main sources of EBC aerosols throughout the year are liquid sources. During the heating season, solid sources (coal and biomass combustion) are dominant. (3) The proportion of brown carbon (BrC) produced by biomass energy during the heating season is greater than that during the nonheating season. (4) The resulting backward trajectory indicates that a large portion of the high EBC aerosol concentration sources originate from northern and northwestern China. Our results reveal that the characteristics and sources of EBC in the urban environment of northern China vary widely, suggesting that different measures should be taken to reduce BC aerosol concentrations during heating and nonheating seasons.
1. Introduction
Atmospheric aerosols are generally referred to as solid and liquid particulate matter suspended in the atmosphere, which constitute a crucial atmospheric component along with atmospheric molecules. Aerosols play an important role in the environment and even global climate change by directly absorbing and scattering incident solar radiation. Meanwhile, they can also indirectly affect climate conditions by participating in the water cycle as condensation nuclei, thereby influencing precipitation. From an environmental health perspective, aerosol particles can affect air quality and reduce visibility, introducing adverse effects to human health. Among aerosol particles of different sizes, fine particulate matter can be inhaled into the respiratory system, increasing the possibility of respiratory diseases [1].
Among the different kinds of aerosols, Black carbon (BC) aerosols are especially important considering their strong absorption ability over a wide range of wavelengths, which causes strong heating effects at the surface [2]. BC are an important kind of carbonaceous aerosol produced by the incomplete combustion of carbonaceous materials [3]. By strongly absorbing visible light and emitting infrared radiation, BC has the potential to strongly warm the environment near the surface, which has been identified as an important factor causing global warming along with [4]. In terms of human health, the inhalation of black carbon aerosols has greatly increased the incidence of cancer and other diseases, thus endangering human health [5]. Furthermore, considering that the surface of BC is porous, toxic materials may exist at the surface, causing BC to become poisonous and harmful [6]. Inhaling BC may even increase the risk of cancer or cardiovascular disease [5,7].
Due the importance of BC in the environment, climate and health, various studies have been conducted. Gong et al. [8] measured BC concentrations in Wuhan, China, and discovered strong relationships between BC aerosols and particulate matter. Atmospheric carbonaceous concentration measurements at several sites in Mexico revealed a strong correlation between black carbon and CO concentrations at urban sites, with greater values measured at urban sites than at suburban sites or high altitude sites [9]. Lizhong et al. [10] analyzed BC concentration measurements in Xi’an and found that meteorological conditions were crucial to BC mitigation. Rajeevan et al. [11] further investigated BC concentrations and meteorological conditions with the HYbrid Single Particle Lagrangian Integrated Trajectory model (HYSPLIT) to analyze the effects of long-distance transportation on local pollution. In addition to local monitoring, some studies have tried to extract BC radiative forcing effects. For example, [12] found that BC contributed more than 84% of the total aerosol radiative forcing in Karachi, Pakistan. By mixing with other aerosols (such as sulfate aerosols), the mass absorption cross section of BC could increase 2–3 times, causing even stronger radiative forcing effects [13]. Therefore, it is important to reduce BC concentrations, especially by reducing emissions, by employing methods such as improving energy efficiency with cleaner technology [14].
In addition to the correlations between BC and other pollutants [9,15], BC is also considered to be affected by local emissions, especially the combustion of carbonaceous materials such as coal and gasoline [3]. China has a long history of burning coal or firewood for heating, and inadequate combustion during heating produces a large number of BC and other pollutants. The air pollution index of Beijing in 2005 and 2006 during the winter was found to be correlated with boosted amounts of coal consumption [15]. The total suspended particulates (TSP) north of the Huaihe River (geographically northern China) is 55% higher than that south of the Huaihe River, and air pollution has reduced the life expectancy of residents north of the Huaihe River by 5.5 years [16]. Therefore, it is of great significance to deeply investigate the properties and sources of BC considering the impacts of heating and nonheating seasons.
In this study, based on two years of measurements of EBC concentrations and atmospheric pollutants, the characteristics and impacts of the heating season are investigated. The main purposes are (1) to compare temporal variation patterns and characteristics of EBC in the urban environment and (2) to evaluate the potential sources of EBC during heating and nonheating seasons. The remainder of this paper is organized as follows: Section 2 introduces the data and methods, and Section 3 presents some of the experimental results for EBC. Section 4 discusses the possible reasons of changes in EBC concentrations and sources, and finally, a summary is given in Section 5.
2. Materials and Methods
2.1. Study Region
Xuzhou (33°43′ N–34°58′ N, 116°22′ E–118°40′ E) is an important industrial city in East China with a total area of 11,258km2 [17], as shown in Figure 1. At the end of 2018, the permanent population was approximately 8.8 million, and the GDP in 2018 was 675.52 billion yuan. It is located in northwestern Jiangsu Province in the southeastern part of the North China Plain and the northern part of the Yangtze River Delta. The terrain is dominated by plains, where many national highways and arterial railways intersect and the Beijing–Hangzhou Grand Canal passes through, offering convenient transportation, making it an important transportation junction. In addition, Xuzhou is well developed with heavy industries and the coal industry. It is an important coal producing area in China and a power base in East China. Furthermore, it is also the junction of the Yangtze River Delta Economic Zone in the south, the Bohai Economic Rim in the north, and the coastal economic belt in the east, making it easily affected by atmospheric pollution transported from these places.
2.2. Data Collection and Processing
In this study, EBC concentrations were collected by an aethalometer (Model AE-42 of Magee Scientific, Berkeley, CA, USA) at 5-min intervals with a sampling flow of 2 LPM. In this study, measurements at 7 bands (370, 470, 520, 590, 660, and 950 nm) are collected and analyzed to investigate the EBC properties in Xuzhou. The attenuation of light is linearly related to the EBC in the deposited sample. The optical attenuation of the light (ATN) is defined as Equation (1):
where is the light intensity through the original filter or the blank portion of the filter, and I is the light intensity through the portion of the filter with EBC deposits. Based on the property that the absorption of light by EBC is inversely proportional to the wavelength of the light used, at a specific wavelength, ATN is the product of the wavelength and mass deposition of EBC.
where is the mass deposit of equivalent black carbon, and is the mass absorption cross section (7.77 m2/g for 880 nm, 18.47 m2/g for 370 nm) of equivalent black carbon at wavelength λ. Thus, the positive relationship between the increase in ATN and the increase in EBC mass deposition between two continuous measurements can be obtained.
where is the increase in ATN, i is the measurement number, and is the increase in the EBC mass deposit. Therefore, the average concentration of the atmospheric environment between these two continuous measurements could be calculated as follows:
where is the concentration of equivalent black carbon, S is the area of the sample, F is the flow rate, and is the sample interval.
EBC concentrations are calculated through the absorption of incident light, as demonstrated by Chen et al. [18]. The sampling film used in the aethalometer has strong scattering effects, which disturb the absorption calculation, thereby introducing some errors. Therefore, the measurements of the raw aethalometer need to be corrected [19].
whereis the concentration corrected of equivalent black carbon, is the original concentration of equivalent black carbon, and are the corrected absorption coefficient and uncorrected absorption coefficient, respectively, and k is the coefficient for correction of the scattering artifact. ATN is the optical attention of the light. In this research, 651 daily data points were collected for this study.
The coefficient k could be calculated by the last measurement of a spot that is equal to the first measurement of the next spot when the spot change takes place as follows:
According to Equations (5) and (6), the coefficient k of the filter can be calculated by:
By calculating the correct coefficient k for filter spot, the corrected EBC concentrations could be obtained.
In addition to 880 nm measurements, this study also utilizes other band measurements to investigate the potential liquid or solid sources of EBC. The relationship between the light absorption characteristics of aerosols and the wavelength is as follows:
where is the correlation between the measurements of different wavelengths, is the wavelength, and is a constant. is the optical absorption coefficient of EBC at wavelength . By assuming that liquid (such as traffic sources) and solid fuel (such as coal and biomass combustion) contributed to the total optical absorption, babs(λ) could be expressed as follows:
where and are the absorption coefficients of liquid-sourced and solid-sourced EBCs, respectively. The relationship between and should meet the following equations:
where and are the wavelength relationships defined in Equation (9) for liquid and solid fuels, respectively. In this paper, we choose = 1.0 and = 2.2 [20]. The mass EBC concentrations of the liquid and solid sources could be obtained.
Gaseous pollutant and particulate matter data come from the National Urban Air Quality Real-time Publishing Platform (http://106.37.208.233:20035/, accessed on 4 October 2021) published by the China Environmental Monitoring Station, which includes the concentrations of 6 major pollutant (PM2.5, PM10, O3, SO2, NO2 and CO) in real-time monitoring data. We obtain real-time data for 1-h intervals from 1 May 2014 to 1 August 2016. There are seven air quality monitoring stations in Xuzhou, including the district government of Gulou and the new village of Huanghe in the northwest, Taoyuan Road and the Academy of Agricultural Sciences in the northeast, Huaita city in the middle, Xincheng District in the southeast, and Tongshan District Admission Office in the southernmost region. This paper selects the Huaita monitoring station closest to China University of Mining and Technology to obtain real-time data at 1-h intervals from 1 2014 to 1 August 2016, to analyze the correlation between equivalent black carbon and gaseous pollutants in Xuzhou.
2.3. Analyzing Methods
The Pearson correlation coefficient is a statistical indicator that calculates the correlation between two groups of random variables and is used to quantify the correlation between two groups of variables. Assuming the two random variables of and , the formula for calculating the Pearson correlation coefficient r is as follows:
where and represent the sample mean of random variables and . The range of Pearson’s correlation coefficient is [−1, 1]. When it is greater than 0, it means that two variables are positively correlated; when it is less than 0, it means that two variables are negatively correlated; and when it is equal to 0, it means that two variables are uncorrelated. The absolute value of the Pearson correlation coefficient is directly proportional to the correlation. According to its size, it can be divided into the following categories: 0.8–1.0 (very strong correlation), 0.6–0.8 (strong correlation), 0.4–0.6 (medium degree correlation), 0.2–0.4 (weak correlation), and 0.0–0.2 (very weak correlation or no correlation) [21].
To analyze the long-distance transportation of EBCs, the potential source contribution function (PSCF) model [22] is used in this study. The model treats the pollution contribution of each area to the receptor point as a ratio of the pollution trajectory to the residence time of all trajectories in the passing area and is widely used in analyzing the source of atmospheric pollutants.
3. Results
3.1. EBC Variation Trends
The 880 nm band is commonly used to measure standard EBC concentrations, which could be defined as the output EBC concentrations as brown carbon absorption contributes little. Concentrations measured at shorter wavelengths are usually larger than 880 nm band concentrations due to brown carbon absorption. The introduction of measurements at shorter wavelengths may represent the light absorbing effects of brown carbon [23]. In this study, the daily average of the derived EBC concentrations at seven wavelengths is shown in Figure 2. Considering representativeness, this study selected daily measurements with at least 16 h of data. In total, 651 effective daily measurements of EBC concentrations were obtained. Taking 880 nm as the standard EBC measurement, from May 2014 to July 2016, the daily maximum EBC was 11.50 × 10³ ng/, the minimum was 0.02 × 10³ ng/, and the average concentration was 2.44 × 10³ ng/. Among these seven bands, the peak value of 370 nm was noticeably higher than that of the other bands. The variation trends of all seven wavelengths are similar, with relatively low and stable values in the summer and autumn and rapid increases in the winter and spring.
The measured monthly average EBC are shown in Figure 3. Considering the representativeness and statistical significance, only the months with at least 15 effective days are selected to calculate the monthly average concentration. Therefore, there is a lack of average data for 5 months: December 2014, January 2015, November 2015, December 2015 and May 2016. The EBC concentrations in the winter were higher than those in the other three seasons, while the concentrations in the autumn were higher than those in the spring and summer. Within a year, from 20 November to 10 March is considered the heating season, and the rest are considered the nonheating season.
3.2. Correlation between Multichannel EBC and Atmospheric Pollutants
The correlations between EBC concentrations at 880 nm and major atmospheric pollutants are shown in Figure 4. Pearson’s correlation analysis was used to calculate the correlation coefficients of EBC concentrations and six air pollutants. Excluding O3, EBC is positively correlated with other air pollutants, and the correlation is significant when the confidence is 0.01. O3 is negatively correlated with EBC concentrations and other pollutants, indicating that O3 increases and decreases. The three air pollutants with the highest correlation between equivalent black carbon are PM2.5, PM10 and CO, with correlation coefficients of 0.561, 0.512, and 0.491, respectively. Although the proportion of EBC in particles is usually less than 10% [24], it will age as the coating shell thickens, providing a place for the formation of secondary aerosols. The correlations of multichannel EBC concentrations with atmospheric pollutants are shown in Table 1. PM2.5, PM10, SO2, and NO2 show slowly decreasing correlations with EBC concentrations as the wavelength increases from 470 nm to 950 nm. The correlations between these pollutants and 470 nm EBC concentrations are highest. For O3 and CO, the absolute values of the correlations decrease as the wavelength increases, with the highest correlation occurring at 950 nm.
3.3. Correlation between Multichannel EBC and Atmospheric Pollutants
EBC is closely related to fuel combustion. In the northernmost cities of China, winter heating (mainly from mid-November to mid-March next year) is traditionally characterized by a large amount of coal combustion, which induces a large amount of EBC emissions and significant air pollution. During the research period, heating days and nonheating days accounted for 548 and 103 days, respectively. EBC concentrations throughout the heating season, nonheating season and whole research period are shown in Figure 5. The average EBC concentrations during the heating period are generally greater than those during the nonheating period, but there is no significant difference in the lowest value. Taking 880 nm as an example, the average difference between heating and nonheating seasons is approximately 1.32 × 10³ ng/. There were also spectral differences between the heating and nonheating seasons, and the difference was largest at 370 nm (1.79 × 10³ ng/) and gradually decreased to 1.31 × 10³ ng/ at 950 nm, suggesting that brown carbon aerosols could not be ignored.
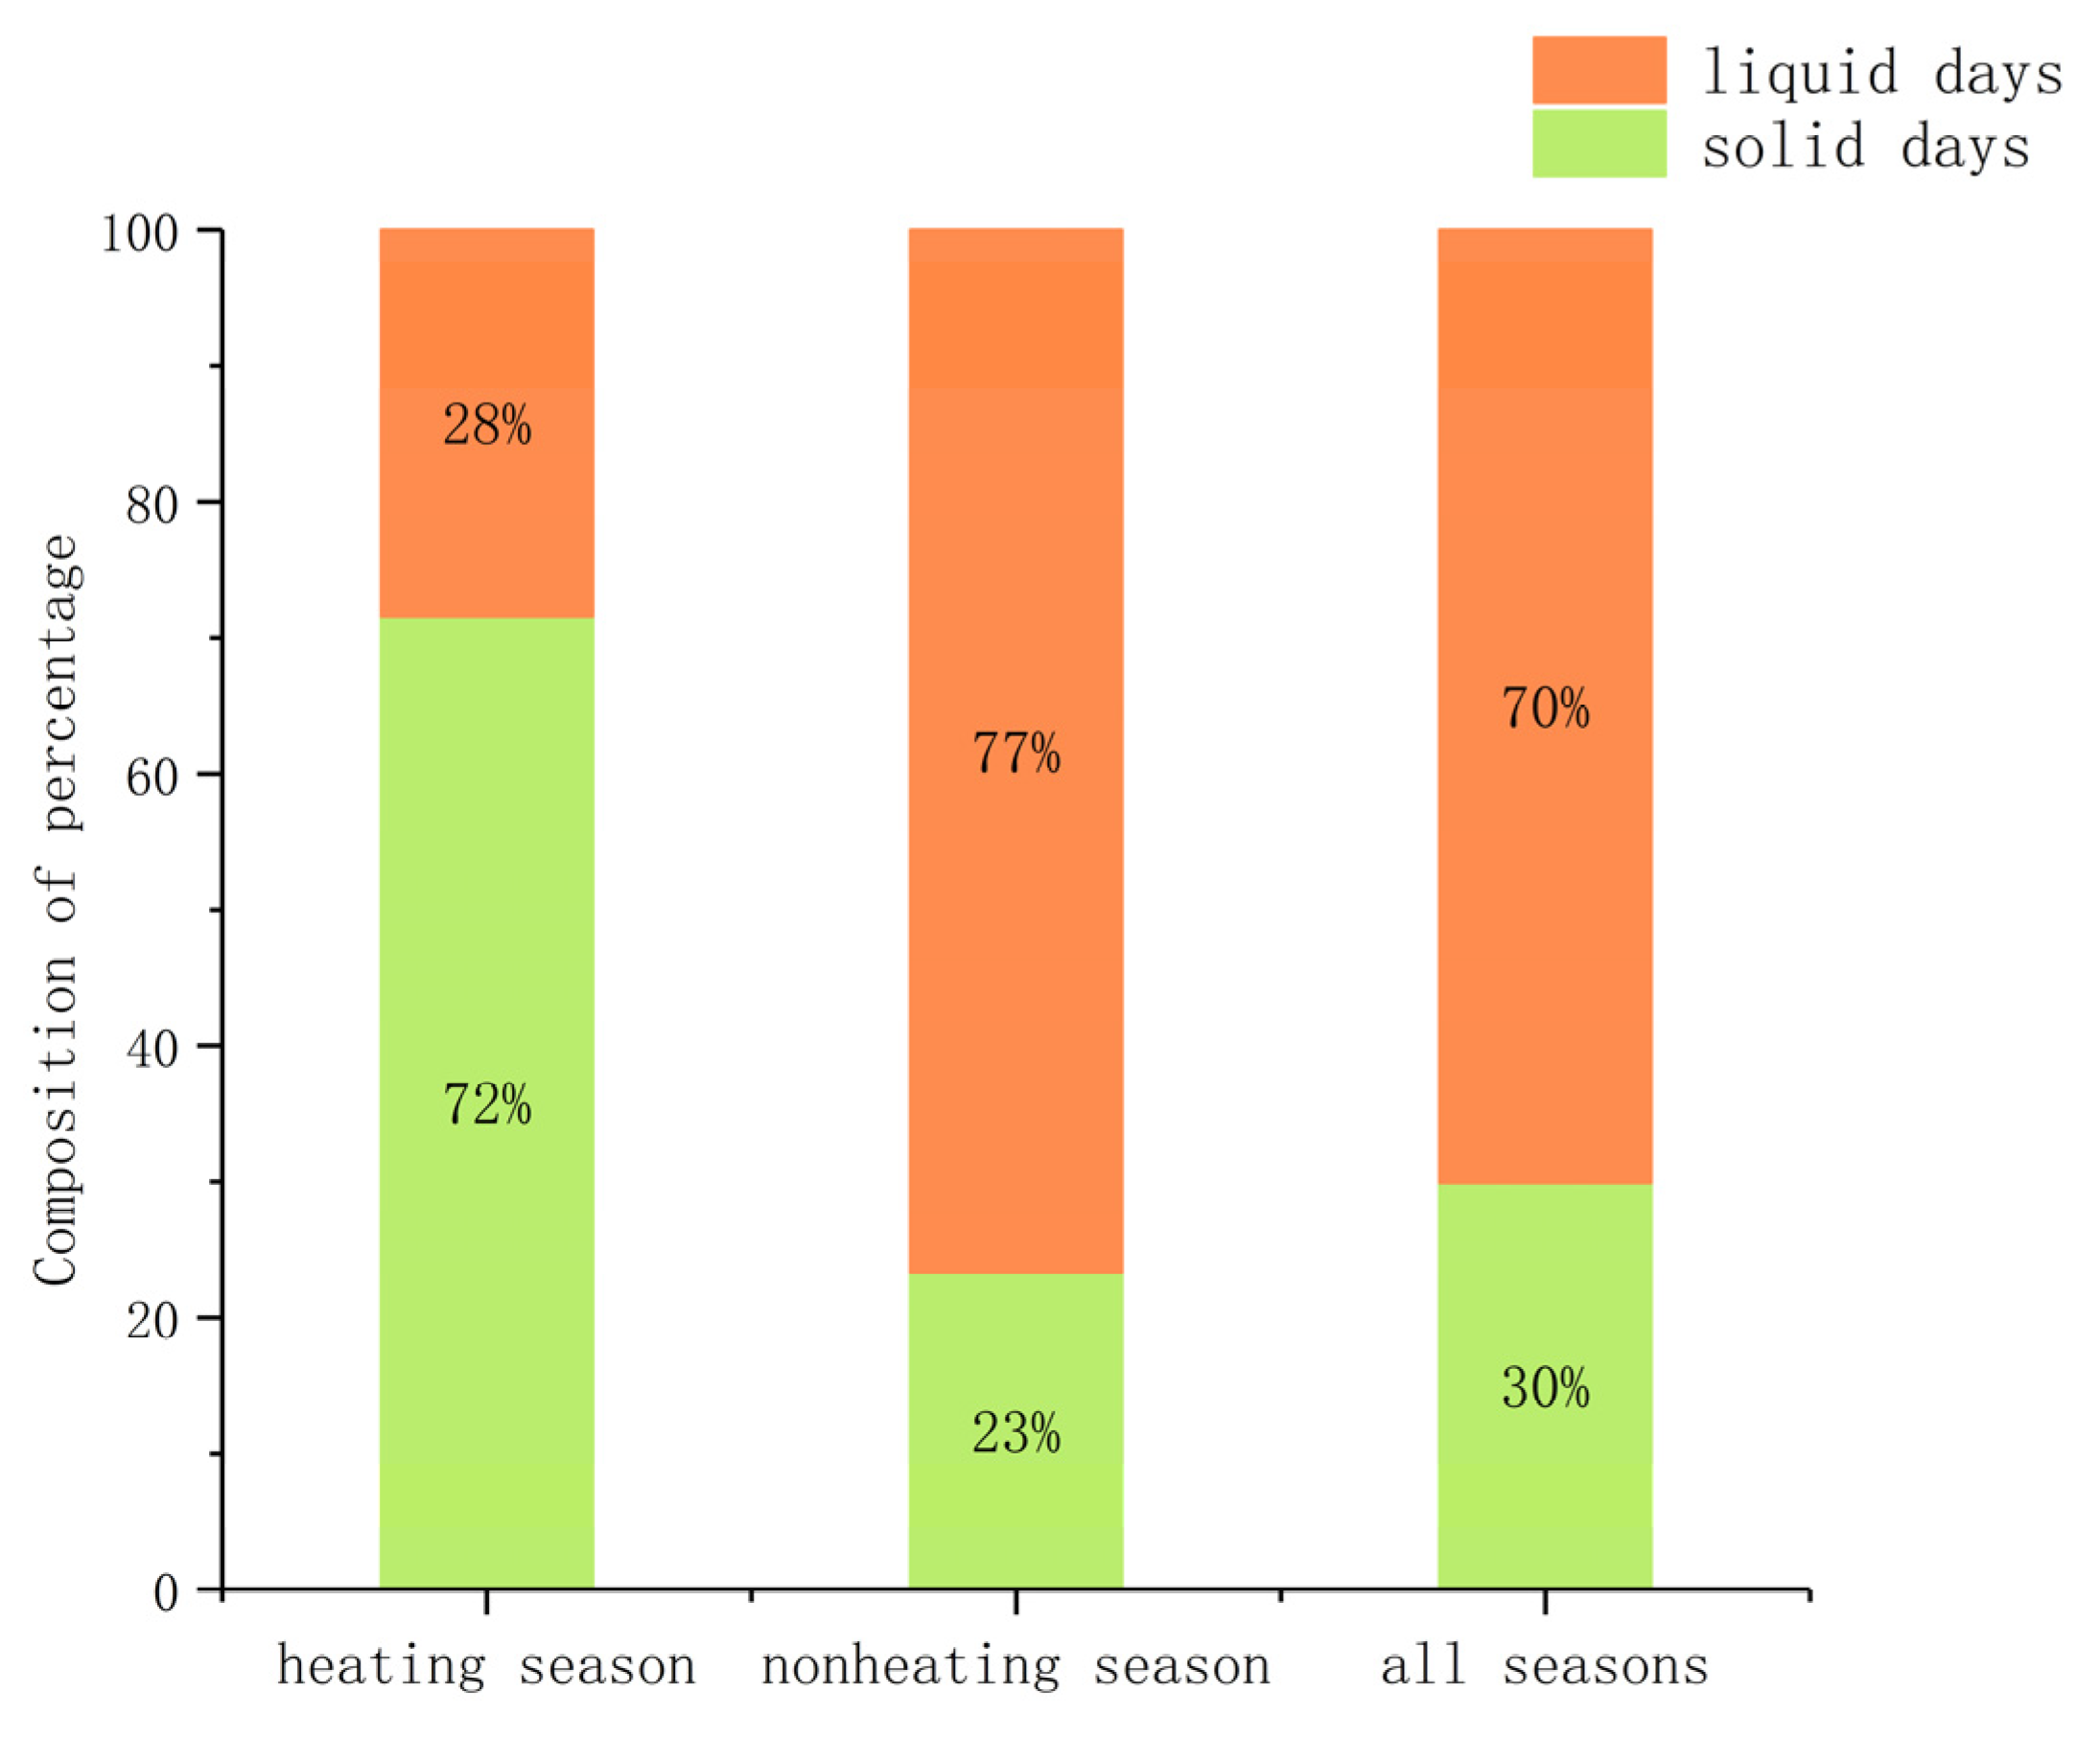
3.4. Liquid/Solid Source Analysis and Implications for Brown Carbon
With spectral EBC concentration differences, Equations (8)–(10) could be utilized to divide EBC concentrations into liquid sources (such as gasoline) and solid sources (such as coal). In this study, daily average liquid and solid EBC concentrations were calculated. Each day is categorized as a liquid day (liquid source dominates) or a solid day (solid source dominates), as shown in Figure 6. For the whole research period, liquid source days accounted for 70%, suggesting that EBCs in Xuzhou mainly derived from liquid fuel combustion. During the nonheating season, liquid source days accounted for 77%. Seventy-two percent of heating days were solid source days, suggesting that the coal combustion for heating on these days largely changed the source of EBC.
In this paper, ρ(EBC370) is measured EBC concentrations at 370 nm band, and ρ(EBC880) is the corresponding value at 880 nm band. ρ(EBC370) should theoretically be greater than ρ(EBC880), as brown carbon aerosol is more absorbing at shorter. Based on this characteristic, ρ(EBC370)/ρ(EBC880) can indicate the seasonal influence of brown carbon to a certain extent [25]. The difference between ρ(EBC370)/ρ(EBC880) for the heating season and nonheating season in Xuzhou during the research period is shown in Table 2. The average value for the heating season is 1.106, and the average value for the nonheating season is 1.071. This shows that the proportion of brown carbon in EBC during the heating season is significantly higher than that during the nonheating season, and the maximum value and standard deviation of the heating season are significantly greater than those for the nonheating season, indicating that brown carbon aerosols constitute a larger proportion during the heating season but are unstable.
3.5. Analysis of Contribution of Potential Sources
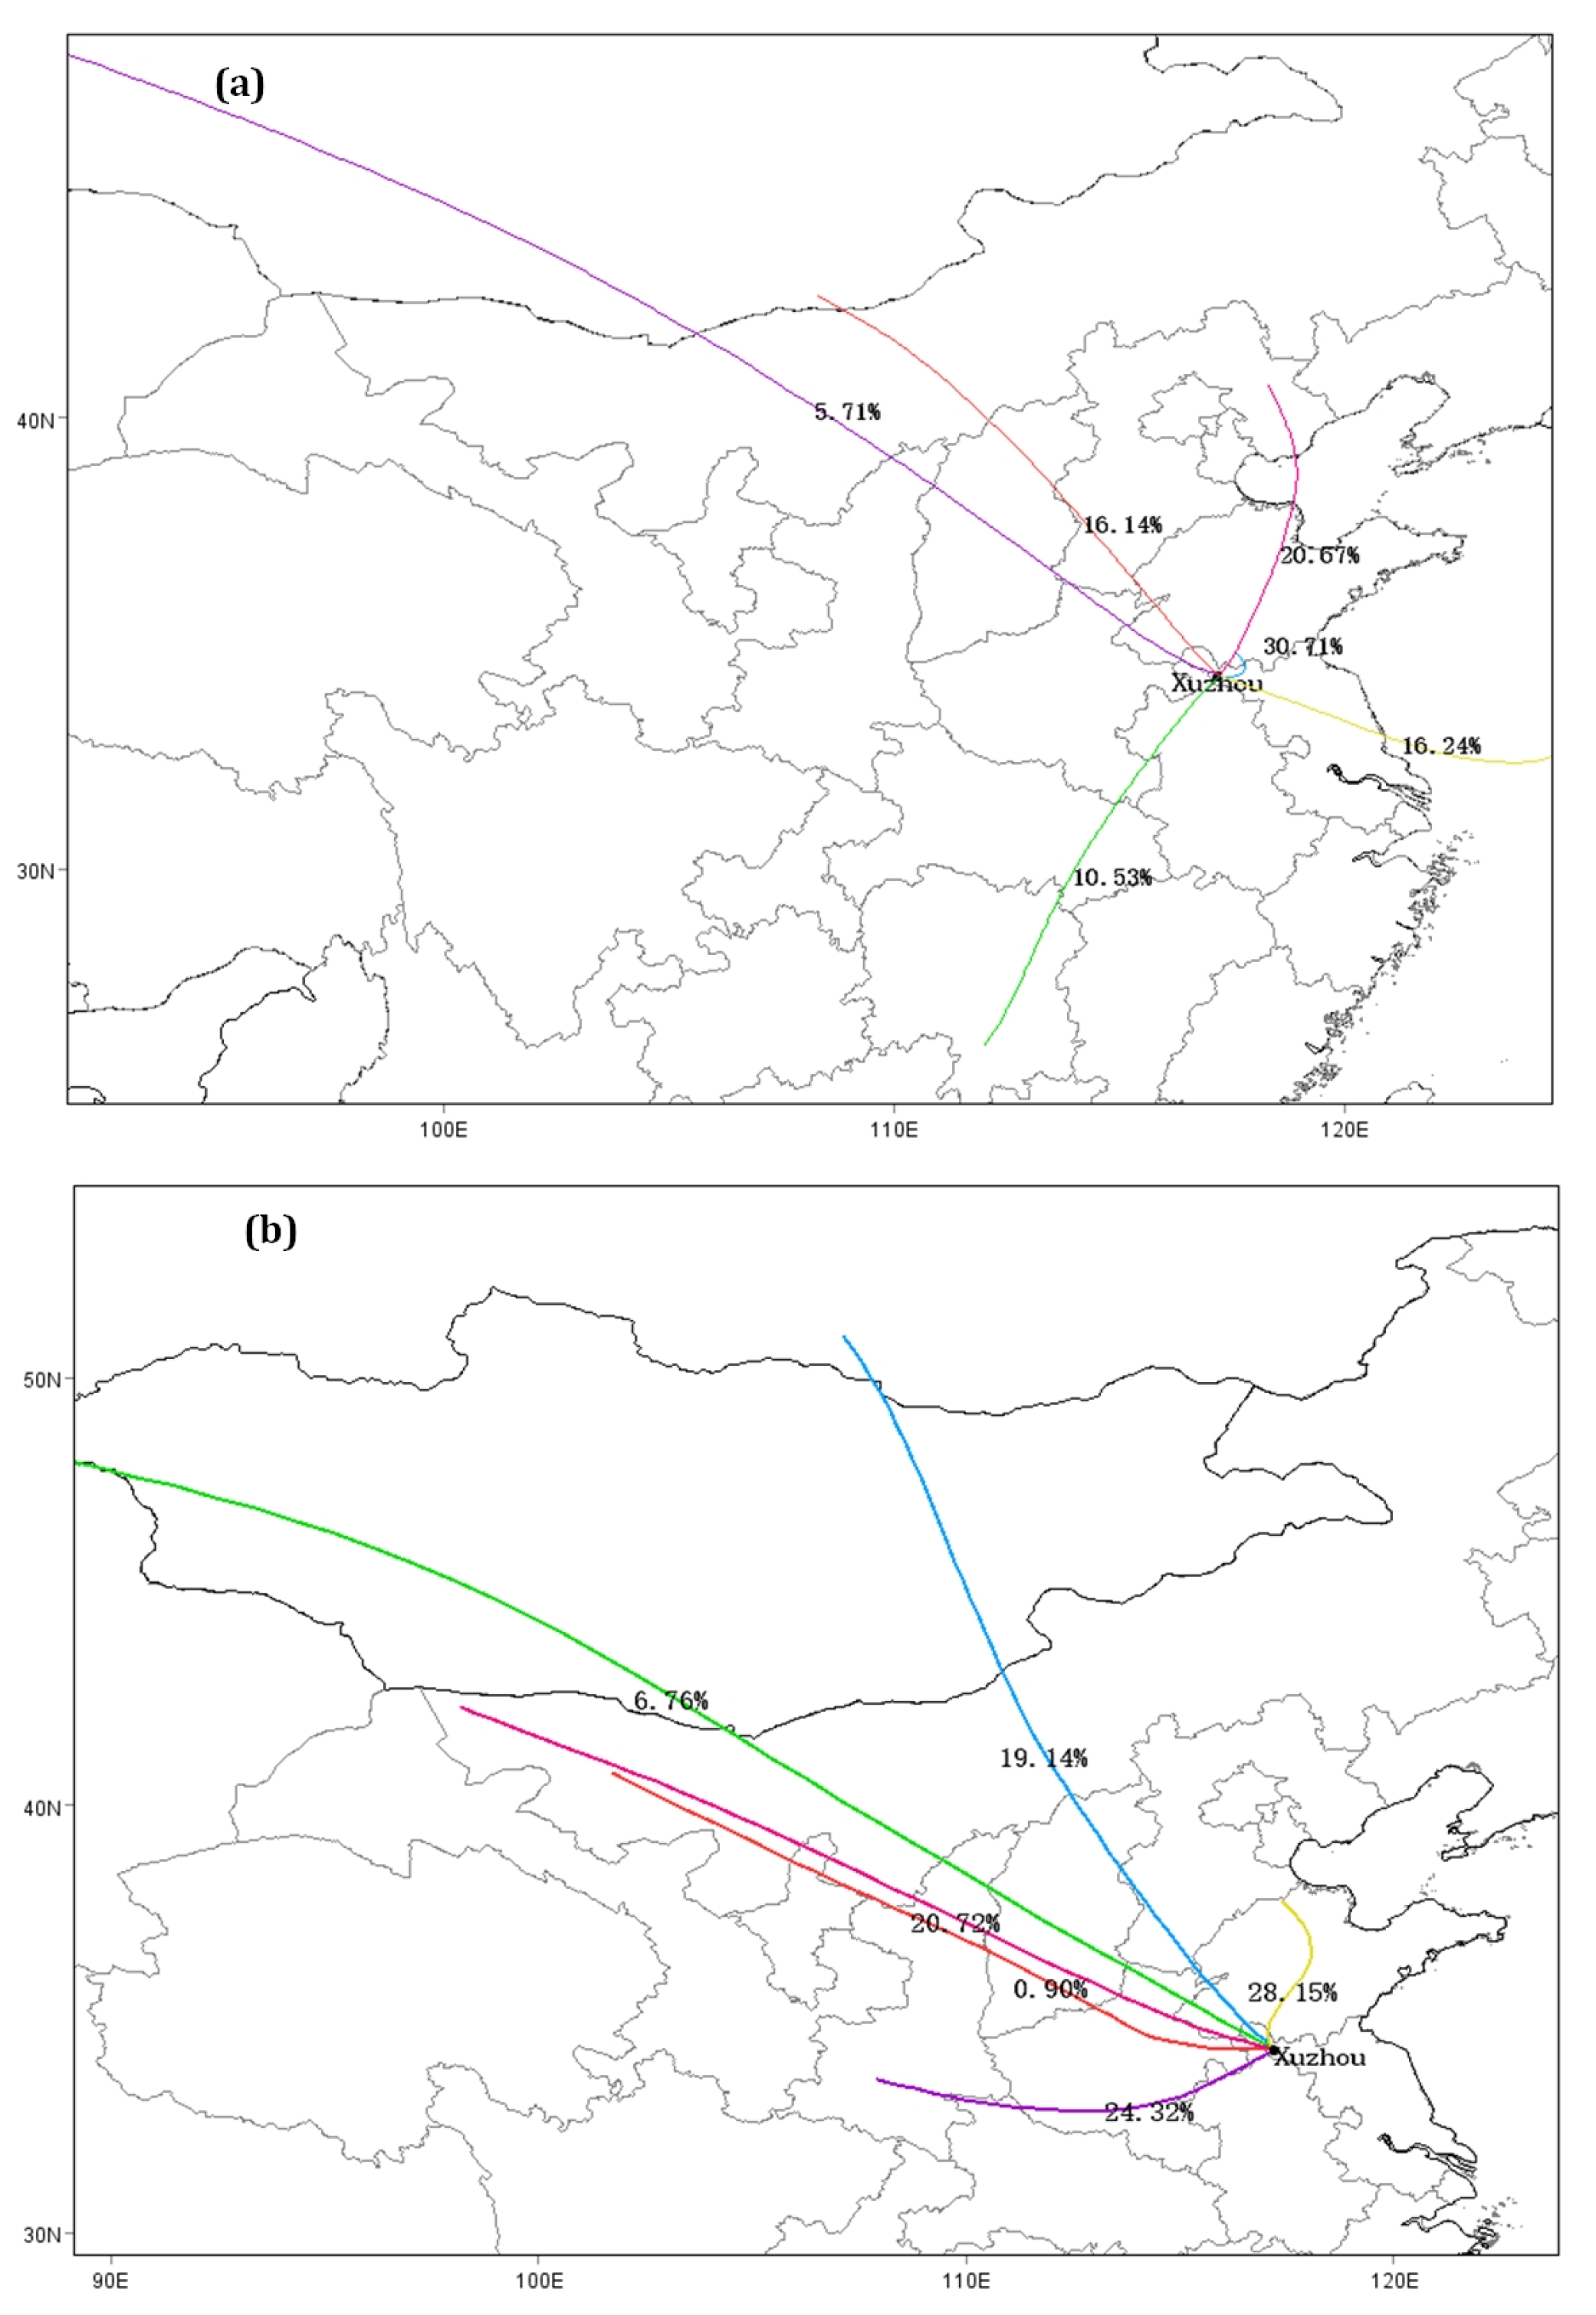
To identify the source of potential air pollutants, the mixed single-particle Lagrangian integrated trajectory (HYSPLIT) model developed by the Air Resources Laboratory (ARL) was used to analyze the hourly average EBC concentrations above 3.00 × 10³ ng/ after 48 h. To analyze the backward trajectory, the HYSPLIT model is driven by rasterized meteorological data (Global Data Assimilation System; GDAS1). Figure 7 shows the clustering results of the 48-h retreat trajectory reaching Xuzhou above 1500 m. Figure 7a shows the 6 clustering sources of EBC during the heating season. There were 4 clusters in the northwest (19.14%, 6.76%, 20.72%, and 0.90%) and 1 cluster in the north (28.15%). There was also a cluster in the southwest (24.32%). In addition to 24.32% of the southwestern sources, the remaining 75.68% of the sources are from the northwestern region of Xuzhou.
Figure 7b shows the 6 cluster sources of EBC in the nonheating season, 4 in the north (5.71%, 16.14%, 20.67%, 30.71%) and 2 in the south (10.53%, 16.24%), centered on Xuzhou. The trajectory is radially distributed. A total of 73.23% of the pollution sources came from the northern region, and 26.77% of the pollution sources came from the southern region of Xuzhou. Xuzhou belongs to the monsoon climate zone and experiences northwest winds and northeast winds in the spring and winter and southeast winds and southwest winds in the summer and autumn. Owing to the influence of the monsoon in the air on EBC transportation, the north wind of the heating season is mixed with EBC transportation in Xuzhou. In addition, the northwestern region supplies the main EBC contribution; the EBC contribution of the nonheating season mainly comes from the surrounding area compared with the heating season. Air quality is more closely related to the observed concentrations. These trajectories indicate that central China, the Beijing–Tianjin–Hebei region and the Yangtze River Delta region are the main potential sources of the Xuzhou EBC.
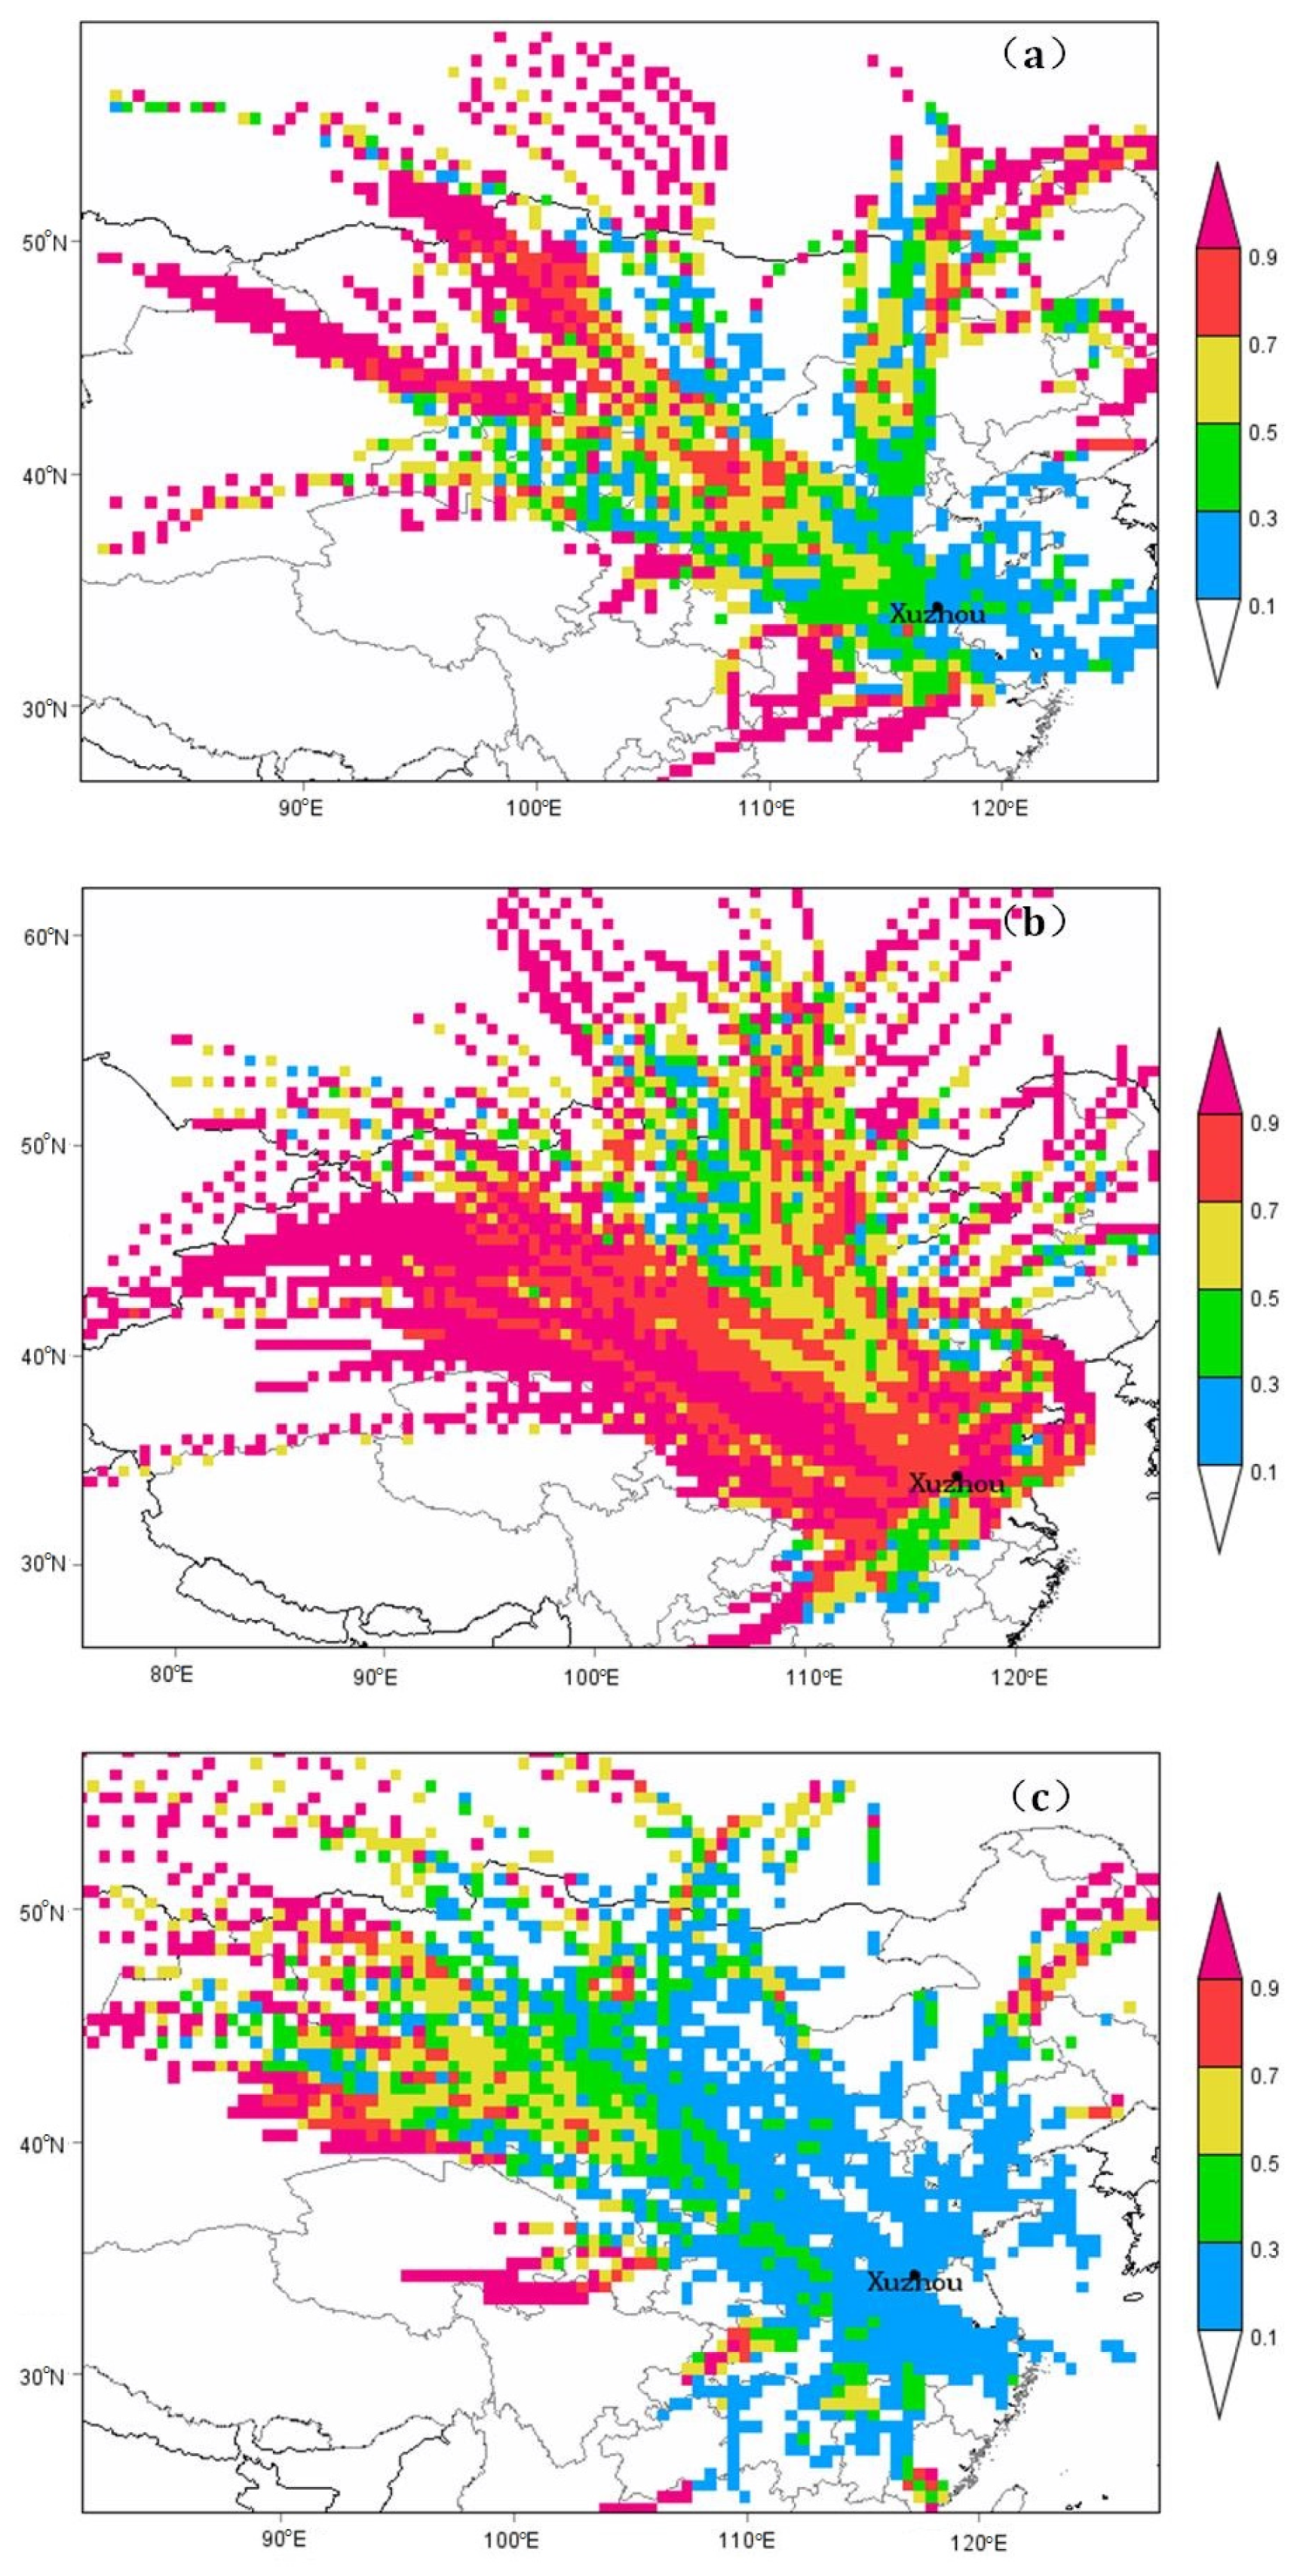
Figure 8 shows the PSCF graph generated by the hourly contribution data, which constitutes the 50th percentile of the whole year (Figure 8a, the heating season (Figure 8b), and the nonheating season (Figure 8c). Only back trajectories with hourly EBC concentrations larger than 3.00 × 10³ ng/ are included. The area is divided into a grid cell array of 0.5°× 0.5°. The source of EBC in Xuzhou is concentrated in northwest and central China, including western Shandong, southern Hebei, northern Henan Province, southern Shanxi Province, northern Shaanxi Province and western Inner Mongolia. During the heating season, the frequency of pollution is higher, and the northwest and central areas are the main sources of pollution. The EBC emissions in these areas are high, which contributes to the measured EBC during the heating season in Xuzhou. During the nonheating season, the overall pollution frequency dropped significantly, and the source was evenly distributed throughout Xuzhou.
4. Discussion
4.1. Reasons of Changes in EBC Concentrations during the Heating and Nonheating Seasons
The highest EBC concentration observed in Xuzhou in 2015 occurred on 15 February, and the daily average concentration at 880 nm reached 1.15 × 10³ ng/m³; these dates were near the traditional Chinese New Year when many fireworks are set off. For example, the hourly monitoring data of the Fuzhou Atmospheric Super Monitoring Station during the 2017 and 2018 Spring Festivals found that during fireworks displays, the EBC concentration increased rapidly, reaching a maximum of 7.00 × 10³ ng/m³, which is 3.5 times the average for February of that year [26]. The hourly Marga data of the Panyu atmospheric composition station in Guangzhou during the 2012 Spring Festival found that during the discharge period, the mass concentration of equivalent black carbon increased significantly, especially at 20:00 on 23 January, which was the evening of New Year’s Day. The maximum value reached 2.43 μg/m³, the concentration increased by 72.34%, and then the concentration decreased with reductions in the mass concentration of particulate matter [27]. By comparing the air quality changes between the prohibited and nonprohibited areas of fireworks in 2018 and the polluted and nonpolluted periods during the Spring Festival of 2018, the average daily EBC concentration during the polluted period was 20.40 μg/, the daily average concentration during the nonpolluted period was 11.01 μg/, and the daily average concentration during the polluted period was 85.2% higher than that in the nonpolluted period. High concentrations mainly occurred during the partial period from New Year’s Eve to the second day [28] of Chinese New Year. The Tianjin Environmental Monitoring Center continuously monitors the concentration of gaseous pollutants in the ambient air using online monitoring instruments. The results of the comparison between the fireworks period and the normal period show that the peak period of fireworks (19 February 0:00), OC, and EC hour concentration showed clear peaks (respectively: 15.68, 2.96 μg/), which were 2.00 and 1.37 times the average concentration of the previous hour, respectively [29]. These studies suggested that the release of fireworks over a short period of time will cause the EBC concentration in the atmosphere to rise rapidly.
Moreover, northern China has the characteristics of a low amount of precipitation, a dry climate, a low temperature, and inactive atmospheric convection during this season, which are not conducive to the diffusion of pollutants in the air, resulting in an increase in the EBC concentration. However, strong winds that are common in winter and spring may also help mitigate EBC concentrations. In the summer, solar radiation is strong, the humidity is high, the temperature is high, the atmospheric boundary layer is thick, and atmospheric convection is strong, making diffusion of atmospheric pollutants easy [30,31]. During this period, the EBC concentration fluctuated greatly.
During the nonheating season, high EBC concentrations are concentrated between April and June. June is the wheat harvest season in Xuzhou, and wheat straw burning is a common activity for farmers. During Xuzhou’s summer grain harvest, wheat is the main crop. In 2014, Xuzhou produced 359.41 thousand hectares of summer grain and 349.16 thousand hectares of wheat, which accounted for 97.15% of the total during the same period. Incomplete combustion of wheat straw produces pollutants such as equivalent black carbon [32]. The Chinese government has added a straw burning ban to the “Law of the People’s Republic of China on the Prevention and Control of Atmospheric Pollution”, which stipulates that the people’s governments of provinces, autonomous regions, and municipalities directly under the central government shall demarcate areas that prohibit the open burning of straws, fallen leaves, and other substances that cause dust pollution.
In general, pollution sources in the heating season are mainly from the north, while in the nonheating season, they originate from around Xuzhou. This result is similar to the contamination transmission pathway in its neighborhood. In Weifang, not far from Xuzhou, the PM2.5 PSCF and CWT results show that the seasonal transport path of PM2.5 varies greatly: in the winter, spring, and autumn, northwest and north directions airflow dominate; in contrast, in the summer, the southeast direction dominates and has dispersion characteristics [33]. A study in Nanjing, also in Jiangsu, used the potential source contribution function WPSCF to analyze the source distribution of pollutants in Nanjing in different seasons, and the results indicated that winter pollution was dominated by the northeast and northwest directions, i.e., the contribution of northern Jiangsu and northern Anhui was significant [34].
4.2. Reasons of EBC Sources during the Heating and Nonheating Seasons
Liquid fuel comes mostly from diesel and gasoline, which are the main fuel types used by motor vehicles. The transportation industry is the largest consumers of diesel [14], gasoline and kerosene and is also considered to be the main reason why liquid sources in EBC dominate throughout the year [35]. Xuzhou is a comprehensive transportation hub in China where many major highway lines intersect. According to the Xuzhou Bureau of Statistics, at the end of 2016, Xuzhou had a total of 1.367 million motor vehicles with a transportation volume of 378.96 million tons. Over a relatively long period of time, EBC aerosols generated by vehicle transportation accounted for the primary source.
Most solid fuels come from the burning of coal and biomass. In China, farmers generally burn agricultural wastes such as straw, wheat straw, and corn straw. The emissions resulting from the open burning of biomass account for approximately 7% of China’s total equivalent black carbon emissions [36]. During the heating season, Xuzhou, as an important coal production base in East China, has great output and consumption. According to the Xuzhou Bureau of Statistics, the annual output reached 13.42 million tons in 2016, and the comprehensive consumption was 23.48 million tons of standard coal, of which 7.42 million tons of standard coal was consumed by thermal production and supply, accounting for 20.84% of the annual consumption. Xuzhou’s comprehensive consumption in 2015 was 23.52 million tons of standard coal, and thermal production and supply consumed 7.69 million tons of standard coal, accounting for 32.64% of the annual consumption. Thermal central heating is only used in the autumn and winter. On the one hand, urban collective heating requires thermal power stations that burn a large amount of coal as a heat source. On the other hand, people in unheated areas or rural areas burn straw and wood in addition to coal for heating, resulting in solid sources that occupy the main position of EBC sources during the heating season. Another study noted that the unit size of more than 150 power plants is >100 MW, and 200 cement plants and 10 large steel plants are located along northwestern Anhui [37]. This area is consistent with the backward clustering shown in Figure 8a, showing the orientation of the source concentration.
4.3. Difference between EBC and BrC in the Heating and Nonheating Seasons
In this paper, the proportion of brown carbon in EBC was significantly higher in the heating season than in the nonheating season, which is consistent with the findings in northern Chinese cities. In the study in Beijing, the average annual abundance of BrC was 0.82 ± 0.44 μg/m3. The concentration reached a peak of 2.31 ± 0.44 μg/m3 in the winter, followed by autumn, spring and summer. Meanwhile, the absorption of BrC/EBC at the wavelength range of 350–850 nm was highest in the winter (21.78 ± 3.56%), followed by autumn (11.53 ± 5.29%), spring (6.38 ± 4.06%) and summer (4.26 ± 2.57%). Seasonal variation in BrC concentration and absorption proportion was consistent with heating time [38]. This feature varies widely in terms of heating or not. A study of the seasonal occurrence frequencies of different aerosol models in 3 regions of China found that Beijing and Lanzhou, which have a heating tradition, have a much higher frequency of BrC occurrence in autumn and winter than in spring and summer, while Taihu Lake in southern Jiangsu has a lower occurrence probability, as shown in Table 3 [39].
5. Conclusions
This study used two years of EBC concentration measurements at seven wavelengths in an urban area in Xuzhou, China. We found that the EBC concentrations in Xuzhou during the heating season were significantly higher than those during the nonheating season, and the brown carbon content during the heating season was higher than that during the nonheating season. In terms of the source of EBC, our study shows that the source during the heating season is mainly coal and biomass used for heating. The sources of aerosols during the nonheating season mainly consist of petroleum and other liquid sources used for transportation. During the period of high EBC concentrations, the heating season was mainly concentrated during the Chinese Spring Festival, and the nonheating season was concentrated during periods of low rainfall.
Backward trajectory analysis shows that during the heating season, the vast majority of EBC concentrations are derived from northern and northwestern winds. The results show that the provinces to the north are the main source of EBC in Xuzhou. The potential source contribution function (PSCF) model obtains similar results as the backward trajectory analysis. The majority of the heating season pollution comes from the north, and the sources of the nonheating season are evenly distributed from the area surrounding Xuzhou. Therefore, these results indicate that EBC emissions during the heating season in northern China, including those of Xuzhou, are high and that there is a risk that pollutants will diffuse into low-concentration areas within the atmosphere. While controlling EBC emissions and suppressing pollution sources, attention should be given to the diffusion of pollution sources.
Author Contributions
Writing, visualization, formal analysis, G.S.; methodology, W.C.; conceptualization, H.Z.; supervision, S.S.; validation, Y.W. All authors have read and agreed to the published version of the manuscript.
Funding
This research was funded by the National Natural Science Foundation of China (grant number 41701391) and Key Research and Development Program of Guangxi (AB18050014).
Institutional Review Board Statement
Not applicable.
Informed Consent Statement
Not applicable.
Data Availability Statement
Data sharing is not applicable.
Conflicts of Interest
The authors declare no conflict of interest.
References
- Chi, R.; Li, H.; Wang, Q.; Zhai, Q.; Wang, D.; Wu, M.; Liu, Q.; Wu, S.; Ma, Q.; Deng, F.; et al. Association of emergency room visits for respiratory diseases with sources of ambient PM2.5. J. Environ. Sci. 2019, 86, 154–163. [Google Scholar] [CrossRef]
- Petzold, A.; Ogren, J.A.; Fiebig, M.; Laj, P.; Li, S.-M.; Baltensperger, U.; Holzer-Popp, T.; Kinne, S.; Pappalardo, G.; Sugimoto, N.; et al. Recommendations for reporting "black carbon" measurements. Atmos. Chem. Phys. Discuss. 2013, 13, 8365–8379. [Google Scholar] [CrossRef] [Green Version]
- Ran, L.; Deng, Z.; Wang, P.; Xia, X. Black carbon and wavelength-dependent aerosol absorption in the North China Plain based on two-year aethalometer measurements. Atmos. Environ. 2016, 142, 132–144. [Google Scholar] [CrossRef]
- Zhang, X.; Ming, J.; Li, Z.; Wang, F.; Zhang, G. The online measured black carbon aerosol and source orientations in the Nam Co region, Tibet. Environ. Sci. Pollut. Res. 2017, 24, 25021–25033. [Google Scholar] [CrossRef] [Green Version]
- Lai, C.-H.; Lin, C.-H.; Liao, C.-C. Respiratory deposition and health risk of inhalation of particle-bound heavy metals in the carbon black feeding area of a tire manufacturer. Air Qual. Atmos. Heal. 2017, 10, 1281–1289. [Google Scholar] [CrossRef]
- Laeremans, M.; Dons, E.; Avila-Palencia, I.; Carrasco-Turigas, G.; Orjuela-Mendoza, J.P.; Anaya-Boig, E.; Cole-Hunter, T.; DE Nazelle, A.; Nieuwenhuijsen, M.; Standaert, A.; et al. Black Carbon Reduces the Beneficial Effect of Physical Activity on Lung Function. Med. Sci. Sports Exerc. 2018, 50, 1875–1881. [Google Scholar] [CrossRef] [Green Version]
- Louwies, T.; Nawrot, T.; Cox, B.; Dons, E.; Penders, J.; Provost, E.; Panis, L.I.; De Boever, P. Blood pressure changes in association with black carbon exposure in a panel of healthy adults are independent of retinal microcirculation. Environ. Int. 2015, 75, 81–86. [Google Scholar] [CrossRef] [PubMed]
- Gong, W.; Zhang, T.; Zhu, Z.; Ma, Y.; Ma, X.; Wang, W. Characteristics of PM1.0, PM2.5, and PM10, and Their Relation to Black Carbon in Wuhan, Central China. Atmosphere 2015, 6, 1377–1387. [Google Scholar] [CrossRef] [Green Version]
- Peralta, O.; Ortínez-Alvarez, A.; Basaldud, R.; Santiago, N.; Alvarez-Ospina, H.; de la Cruz, K.; Barrera, V.; Espinosa, M.D.L.L.; Saavedra, I.; Castro, T.; et al. Atmospheric black carbon concentrations in Mexico. Atmos. Res. 2019, 230, 230. [Google Scholar] [CrossRef]
- Lizhong, L.; Yuxiang, W.; Yuan, Y.; Jing, H.; Wentao, L.; Zelong, H. Concentration Characteristics and the Correlations of Black Carbon Aerosols with Meteorological Factctors and Conventional Pollutants in Xi’an. Environ. Monit. China 2016, 32, 45–50. [Google Scholar]
- Rajeevan, K.; Sumesh, R.; Resmi, E.; Unnikrishnan, C. An observational study on the variation of black carbon aerosol and source identification over a tropical station in south India. Atmos. Pollut. Res. 2019, 10, 30–44. [Google Scholar] [CrossRef]
- Bibi, S.; Alam, K.; Chishtie, F.; Bibi, H.; Rahman, S. Observations of black carbon aerosols characteristics over an urban environment: Radiative forcing and related implications. Sci. Total. Environ. 2017, 603-604, 319–329. [Google Scholar] [CrossRef]
- Cui, X.; Wang, X.; Yang, L.; Chen, B.; Chen, J.; Andersson, A. Gustafsson, Örjan Radiative absorption enhancement from coatings on black carbon aerosols. Sci. Total. Environ. 2016, 551-552, 51–56. [Google Scholar] [CrossRef] [PubMed]
- Fang, D.; Yang, J. Drivers and critical supply chain paths of black carbon emission: A structural path decomposition. J. Environ. Manag. 2021, 278, 111514. [Google Scholar] [CrossRef]
- Guo, J.; Chen, J. Research on Seasonal Changes of Air Pollution in Beijing and Suggestions for Pollution Control. Ecol. Environ. Sci. 2009, 18, 952–956. [Google Scholar]
- Chen, Y.; Ebenstein, A.; Greenstone, M.; Li, H. Evidence on the impact of sustained exposure to air pollution on life expectancy from China’s Huai River policy. Proc. Natl. Acad. Sci. USA 2013, 110, 32. [Google Scholar] [CrossRef] [PubMed]
- Qin, K.; Wu, L.; Wong, M.S.; Letu, H.; Hu, M.; Lang, H.; Sheng, S.; Teng, J.; Xiao, X.; Yuan, L. Trans-boundary aerosol transport during a winter haze episode in China revealed by ground-based Lidar and CALIPSO satellite. Atmos. Environ. 2016, 141, 20–29. [Google Scholar] [CrossRef] [Green Version]
- Chen, W.; Tian, H.; Zhao, H.; Kai, Q. Multichannel characteristics of absorbing aerosols in Xuzhou and implication of black carbon. Sci. Total. Environ. 2020, 714. [Google Scholar] [CrossRef]
- Zhou, B.; Wang, Q.; Zhou, Q.; Zhang, Z.; Wang, G.; Fang, N.; Li, M.; Cao, J. Seasonal Characteristics of Black Carbon Aerosol and its Potential Source Regions in Baoji, China. Aerosol Air Qual. Res. 2018, 18, 397–406. [Google Scholar] [CrossRef]
- Jing, A.; Zhu, B.; Wang, H.; Yu, X.; An, J.; Kang, H. Source apportionment of black carbon in different seasons in the northern suburb of Nanjing, China. Atmos. Environ. 2019, 201, 190–200. [Google Scholar] [CrossRef]
- Jianyong, Z.; Ran, G.; Jun, H.; Yang, Z. Application Comparison of Grey Correlation Degree and Pearson Correlation Coefficient. J. Chifeng Univ. (Nat. Sci. Ed.) 2014, 30, 1–2. [Google Scholar]
- Salmabadi, H.; Khalidy, R.; Saeedi, M. Transport routes and potential source regions of the Middle Eastern dust over Ahvaz during 2005–2017. Atmos. Res. 2020, 241, 104947. [Google Scholar] [CrossRef]
- Kaskaoutis, D.; Grivas, G.; Stavroulas, I.; Bougiatioti, A.; Liakakou, E.; Dumka, U.; Gerasopoulos, E.; Mihalopoulos, N. Apportionment of black and brown carbon spectral absorption sources in the urban environment of Athens, Greece, during winter. Sci. Total. Environ. 2021, 801, 149739. [Google Scholar] [CrossRef] [PubMed]
- Chen, W.; Tian, H.; Qin, K. Black Carbon Aerosol in the Industrial City of Xuzhou, China: Temporal Characteristics and Source Appointment. Aerosol Air Qual. Res. 2019, 19, 794–811. [Google Scholar] [CrossRef] [Green Version]
- Zhang, Y.; Zhi, G.; Tian, C.; Li, S.; Sun, J.; Zhang, Y.; Yang, T. Study of the Details of Aerosol Carbon Measurements in Autumn and Winter in Beijing. Res. Environ. Sci. 2017, 30, 1184–1192. [Google Scholar]
- Hu, Q.; Chen, X.; Zhang, F.; Li, S.; Sheng, S. Effects of Fireworks on the Composition of PM2.5 in Fuzhou. Environ. Sci. Technol. 2019, 42, 223–231. [Google Scholar]
- Ma, Y.; Wu, D.; Liu, J. The characteristics of PM–(2.5) and its water soluble ions during Spring Festival in PRD in 2012. Chin. Environ. Sci. 2016, 36, 2890–2895. [Google Scholar]
- Wang, W.; Weikangyin; Zhang, X.; Guo, Y.; Sun, Y.; Bai, J.; Yang, L.; Sun, W. Influence of buring fireworks on air quality during the Spring Festival of 2018 in Yinchuan. Environ. Sci. 2019, 38, 2018–2026. [Google Scholar]
- Yang, Z.-W.; Wu, L.; Yuan, J.; Li, F.-H.; Yuan, Y.; Mao, H.-J. Effect of fireworks on the air quality during the Spring Festival of 2015 in Tianjin City. Chin. Environ. Sci. 2017, 37, 69–75. [Google Scholar]
- Tiwari, S.; Tunved, P.; Hopke, P.K.; Srivastava, A.; Bisht, D.; Pandey, A. Observations of ambient trace gas and PM 10 concentrations at Patna, Central Ganga Basin during 2013–2014: The influence of meteorological variables on atmospheric pollutants. Atmos. Res. 2016, 180, 138–149. [Google Scholar] [CrossRef]
- Aslam, A.; Ibrahim, M.; Shahid, I.; Mahmood, A.; Irshad, M.K.; Yamin, M.; Ghazala; Tariq, M.; Shamshiri, R.R. Pollution Characteristics of Particulate Matter (PM2.5 and PM10) and Constituent Carbonaceous Aerosols in a South Asian Future Megacity. Appl. Sci. 2020, 10, 8864. [Google Scholar] [CrossRef]
- Zhou, Y.; Xing, X.; Lang, J.; Chen, D.; Cheng, S.; Wei, L.; Wei, X.; Liu, C. A comprehensive biomass burning emission inventory with high spatial and temporal resolution in China. Atmos. Chem. Phys. Discuss. 2017, 17, 2839–2864. [Google Scholar] [CrossRef] [Green Version]
- Li, C.; Dai, Z.; Liu, X.; Wu, P. Transport Pathways and Potential Source Region Contributions of PM2.5 in Weifang: Seasonal Variations. Appl. Sci. 2020, 10, 2835. [Google Scholar] [CrossRef] [Green Version]
- Ren, B.; Xie, P.; Xu, J.; Li, A.; Tian, X.; Hu, Z.; Huang, Y.; Li, X.; Zhang, Q.; Ren, H.; et al. Use of the PSCF method to analyze the variations of potential sources and transports of NO2, SO2, and HCHO observed by MAX-DOAS in Nanjing, China during 2019. Sci. Total. Environ. 2021, 782, 146865. [Google Scholar] [CrossRef]
- Song, W.; He, K.; Lei, Y. Black carbon emissions from on-road vehicles in China, 1990–2030. Atmos. Environ. 2012, 51, 320–328. [Google Scholar] [CrossRef]
- Cao, G.; Zhang, X.-Y.; Zheng, F. Inventory of black carbon and organic carbon emissions from China. Atmos. Environ. 2006, 40, 6516–6527. [Google Scholar] [CrossRef]
- Lei, Y.; Zhang, Q.; He, K.B.; Streets, D.G. Primary anthropogenic aerosol emission trends for China, 1990–2005. Atmos. Chem. Phys. Discuss. 2011, 11, 931–954. [Google Scholar] [CrossRef] [Green Version]
- Wang, L.; Jin, W.; Sun, J.; Zhi, G.; Li, Z.; Zhang, Y.; Guo, S.; He, J.; Zhao, C. Seasonal features of brown carbon in northern China: Implications for BrC emission control. Atmos. Res. 2021, 257, 105610. [Google Scholar] [CrossRef]
- Fan, Y.; Sun, X.; Huang, H.; Ti, R.; Liu, X. The primary aerosol models and distribution characteristics over China based on the AERONET data. J. Quant. Spectrosc. Radiat. Transf. 2021, 275, 107888. [Google Scholar] [CrossRef]
Figure 1.
Location of the study area, an industrial city in central China: Xuzhou.

Figure 2.
Daily variations in EBC in Xuzhou from May 2014 to July 2016. To ensure the representativeness of the daily average, only daily measurements with more than 16 hourly means are selected.
Figure 2.
Daily variations in EBC in Xuzhou from May 2014 to July 2016. To ensure the representativeness of the daily average, only daily measurements with more than 16 hourly means are selected.

Figure 3.
Comparison of EBC concentrations between the heating season and nonheating season. To ensure the representativeness of the daily average, only the months with at least 15 effective days are selected.
Figure 3.
Comparison of EBC concentrations between the heating season and nonheating season. To ensure the representativeness of the daily average, only the months with at least 15 effective days are selected.

Figure 4.
Correlation analysis of equivalent black carbon and atmospheric pollutants.

Figure 5.
EBC concentrations in seven bands during the heating season, nonheating season, and entire year. The line in the box is the median mass concentration for each season. The upper and lower lines of the box represent the 1st and 3rd quartiles. The upper and lower whiskers represent values of 99% and 1%, respectively. The asterisks above the top line and below the bottom line are the maximum and minimum values.

Figure 6.
Liquid and solid source analysis for the heating season, nonheating season and whole year.
Figure 6.
Liquid and solid source analysis for the heating season, nonheating season and whole year.

Figure 7.
Cluster analysis of 48-h backward air mass trajectories arriving at Xuzhou at 1500 m above the ground every 6 h: (a) the heating season; (b) the nonheating season.
Figure 7.
Cluster analysis of 48-h backward air mass trajectories arriving at Xuzhou at 1500 m above the ground every 6 h: (a) the heating season; (b) the nonheating season.

Figure 8.
PSCF maps of EBC in Xuzhou for the (a) entire year, (b) heating season, and (c) nonheating season. Only back trajectories with hourly EBC concentrations larger than 3.00 × 10³ ng/ were included.
Figure 8.
PSCF maps of EBC in Xuzhou for the (a) entire year, (b) heating season, and (c) nonheating season. Only back trajectories with hourly EBC concentrations larger than 3.00 × 10³ ng/ were included.


Table 1.
Pearson correlation coefficient of multichannel EBC and atmospheric pollutants.
| 7-Wavelength EBC | CO | PM2.5 | PM10 | SO2 | NO2 | O3 |
|---|---|---|---|---|---|---|
| EBC370 | 0.451 ** | 0.572 ** | 0.524 ** | 0.208 ** | 0.383 ** | −0.191 ** |
| EBC470 | 0.482 ** | 0.577 ** | 0.530 ** | 0.217 ** | 0.388 ** | −0.194 ** |
| EBC520 | 0.487 ** | 0.574 ** | 0.527 ** | 0.214 ** | 0.385 ** | −0.195 ** |
| EBC590 | 0.489 ** | 0.571 ** | 0.522 ** | 0.211 ** | 0.383 ** | −0.197 ** |
| EBC660 | 0.490 ** | 0.568 ** | 0.520 ** | 0.209 ** | 0.380 ** | −0.197 ** |
| EBC880 | 0.491 ** | 0.561 ** | 0.512 ** | 0.202 ** | 0.376 ** | −0.200 ** |
| EBC950 | 0.489 ** | 0.555 ** | 0.507 ** | 0.197 ** | 0.373 ** | −0.200 ** |
Note: ** means that the correlation is significant at the level of α = 0.01 (two-sided).
Table 2.
Statistics of ρ(EBC370)/ρ(EBC880).
| Season | Minimum | Maximum | Average | Standard Deviation |
|---|---|---|---|---|
| Heating season | 0.177 | 1.838 | 1.106 | 0.277 |
| Nonheating season | 0.533 | 1.026 | 1.071 | 0.262 |
Table 3.
Proportion of BrC in EBC in different cities.
| Study Zone | Spring | Summer | Autumn | Winter |
|---|---|---|---|---|
| Beijing | 23% | 13% | 24% | 35% |
| Taihu | 7% | 3% | 13% | 16% |
| Lanzhou | 2% | 5% | 23% | 20% |
Publisher’s Note: MDPI stays neutral with regard to jurisdictional claims in published maps and institutional affiliations. |
© 2021 by the authors. Licensee MDPI, Basel, Switzerland. This article is an open access article distributed under the terms and conditions of the Creative Commons Attribution (CC BY) license (https://creativecommons.org/licenses/by/4.0/).
Share and Cite
MDPI and ACS Style
Chen, W.; Song, G.; Zhao, H.; Sun, S.; Wu, Y. Equivalent Black Carbon Aerosol Properties and Their Relationship with the Heating Season in Urban Environments. Atmosphere 2021, 12, 1314. https://0-doi-org.brum.beds.ac.uk/10.3390/atmos12101314
AMA Style
Chen W, Song G, Zhao H, Sun S, Wu Y. Equivalent Black Carbon Aerosol Properties and Their Relationship with the Heating Season in Urban Environments. Atmosphere. 2021; 12(10):1314. https://0-doi-org.brum.beds.ac.uk/10.3390/atmos12101314
Chicago/Turabian StyleChen, Wei, Ge Song, Haimeng Zhao, Shanlin Sun, and Yi Wu. 2021. "Equivalent Black Carbon Aerosol Properties and Their Relationship with the Heating Season in Urban Environments" Atmosphere 12, no. 10: 1314. https://0-doi-org.brum.beds.ac.uk/10.3390/atmos12101314
Note that from the first issue of 2016, this journal uses article numbers instead of page numbers. See further details here.