
Quantitative Precipitation Forecasting Using an Improved Probability-Matching Method and Its Application to a Typhoon Event


Abstract
:1. Introduction
2. Data and Methods
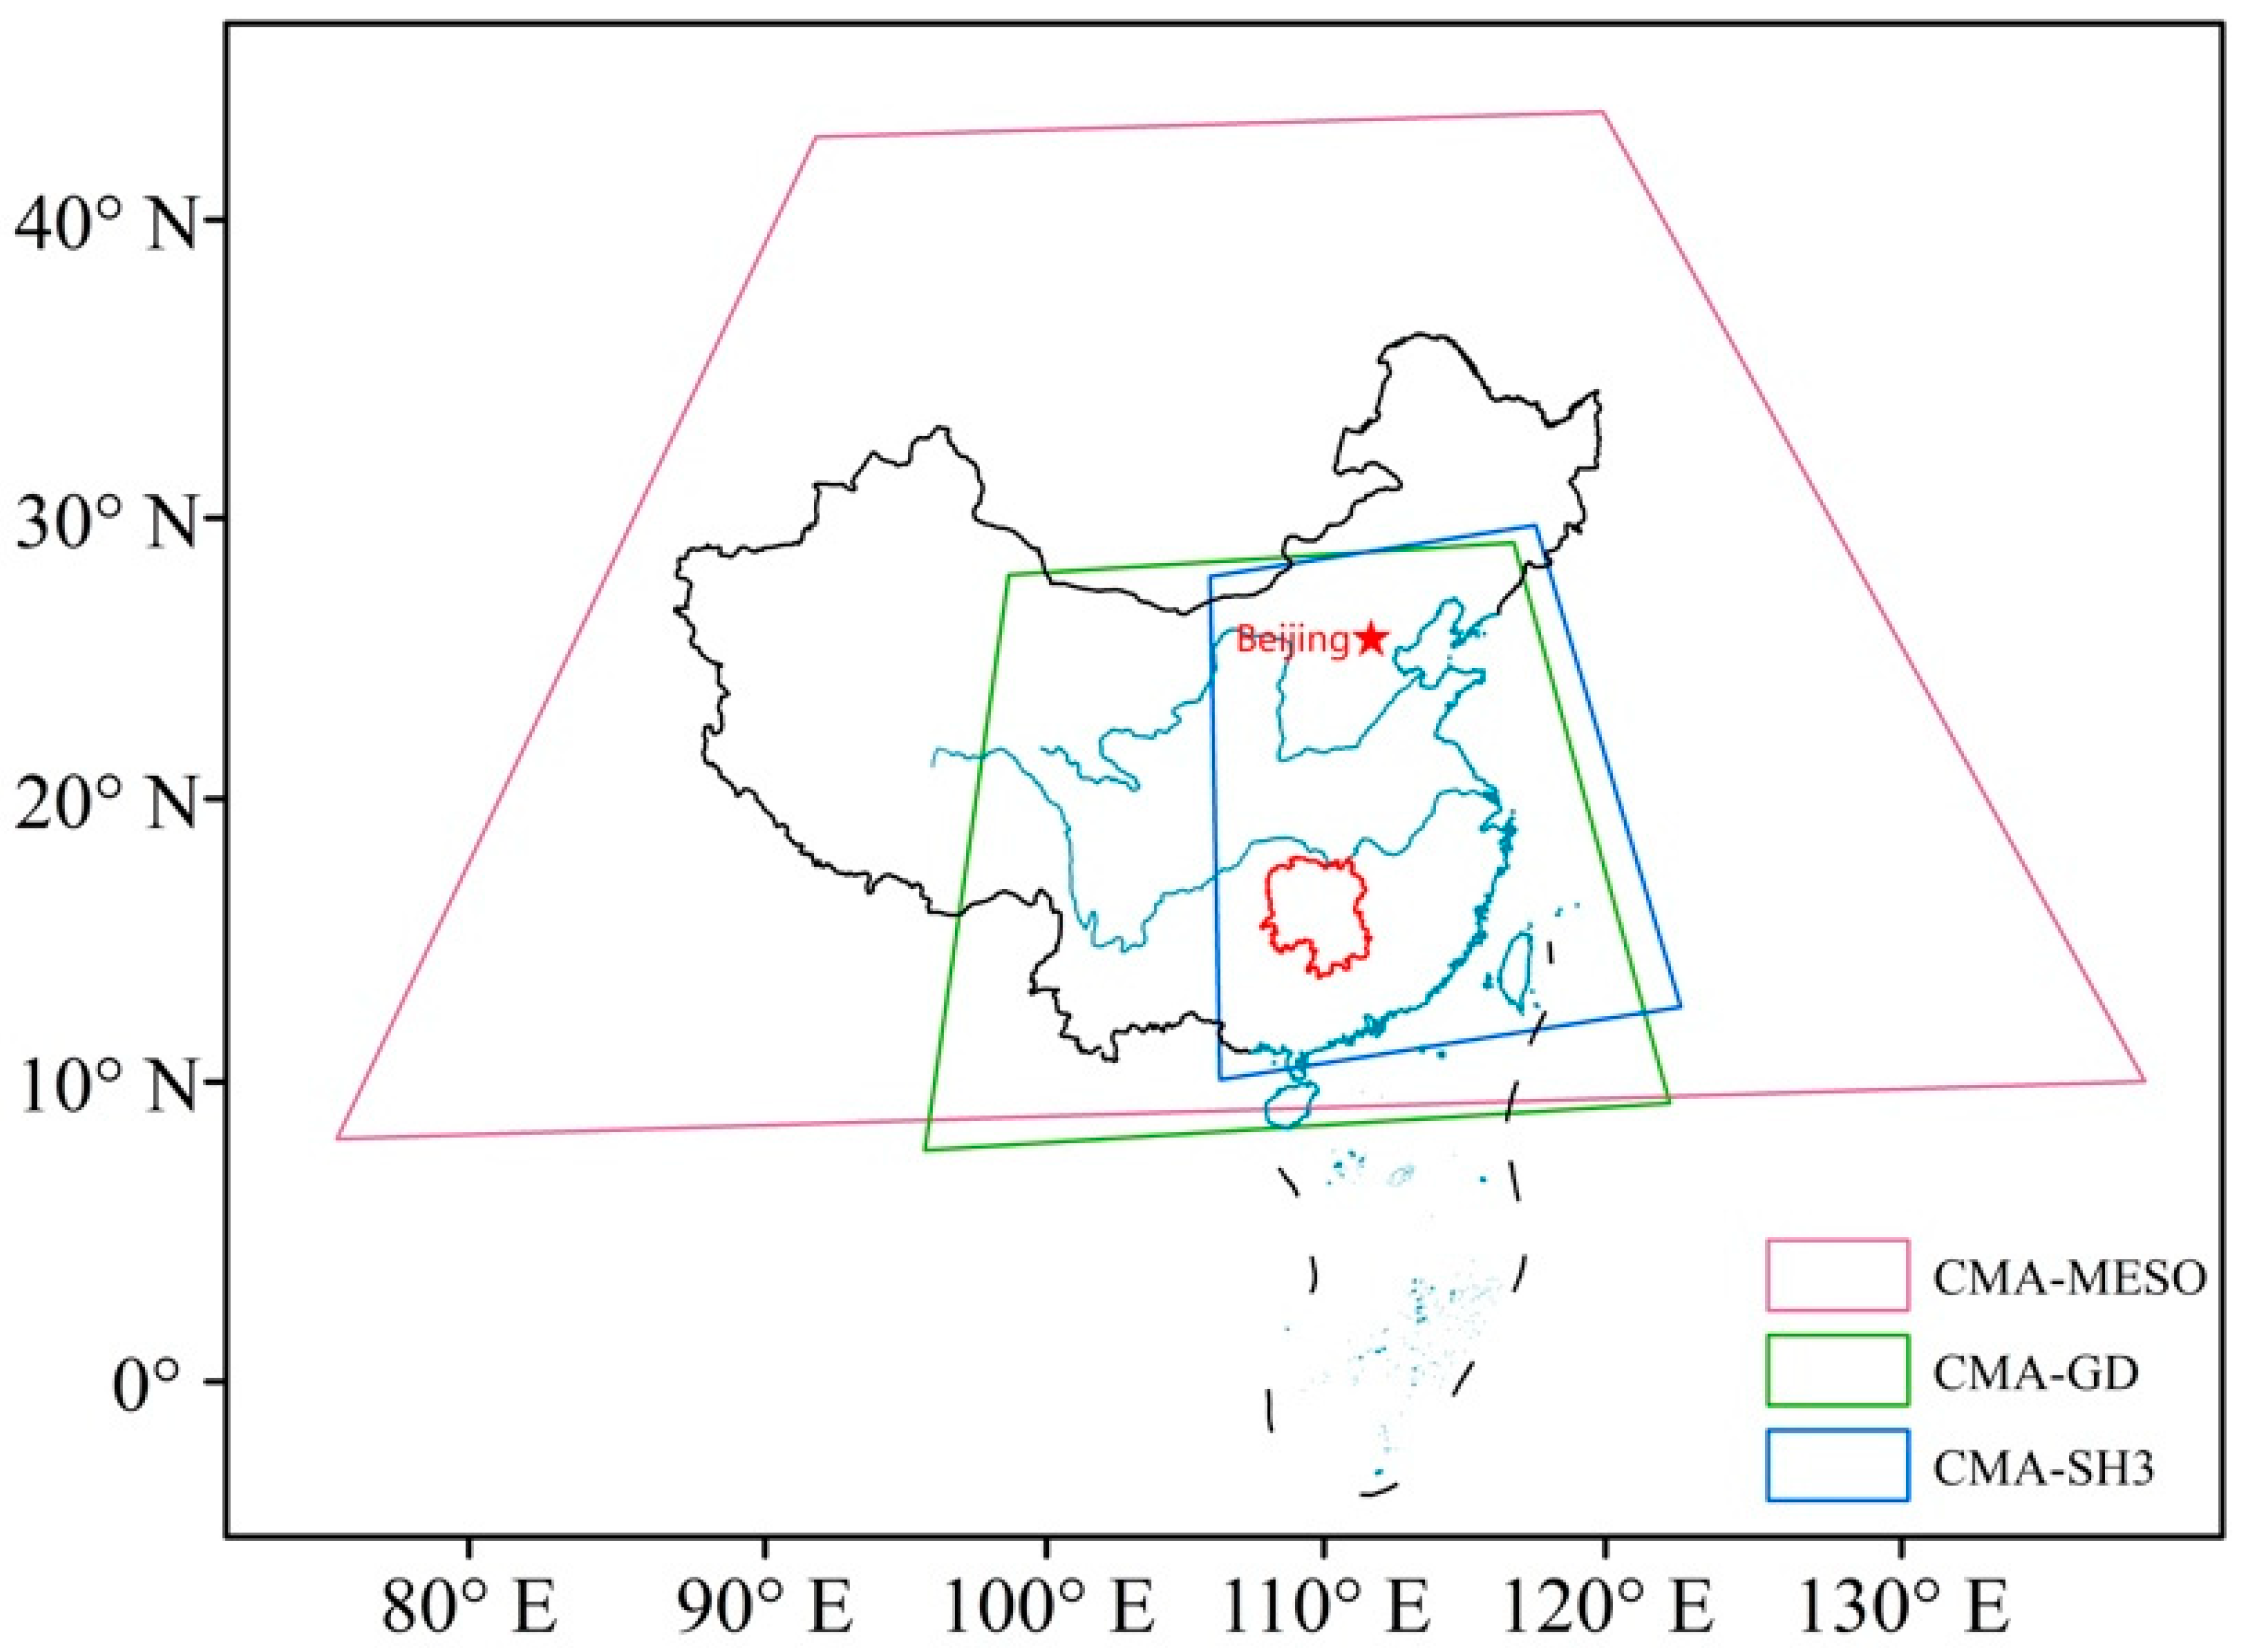
2.1. Data
2.2. Method
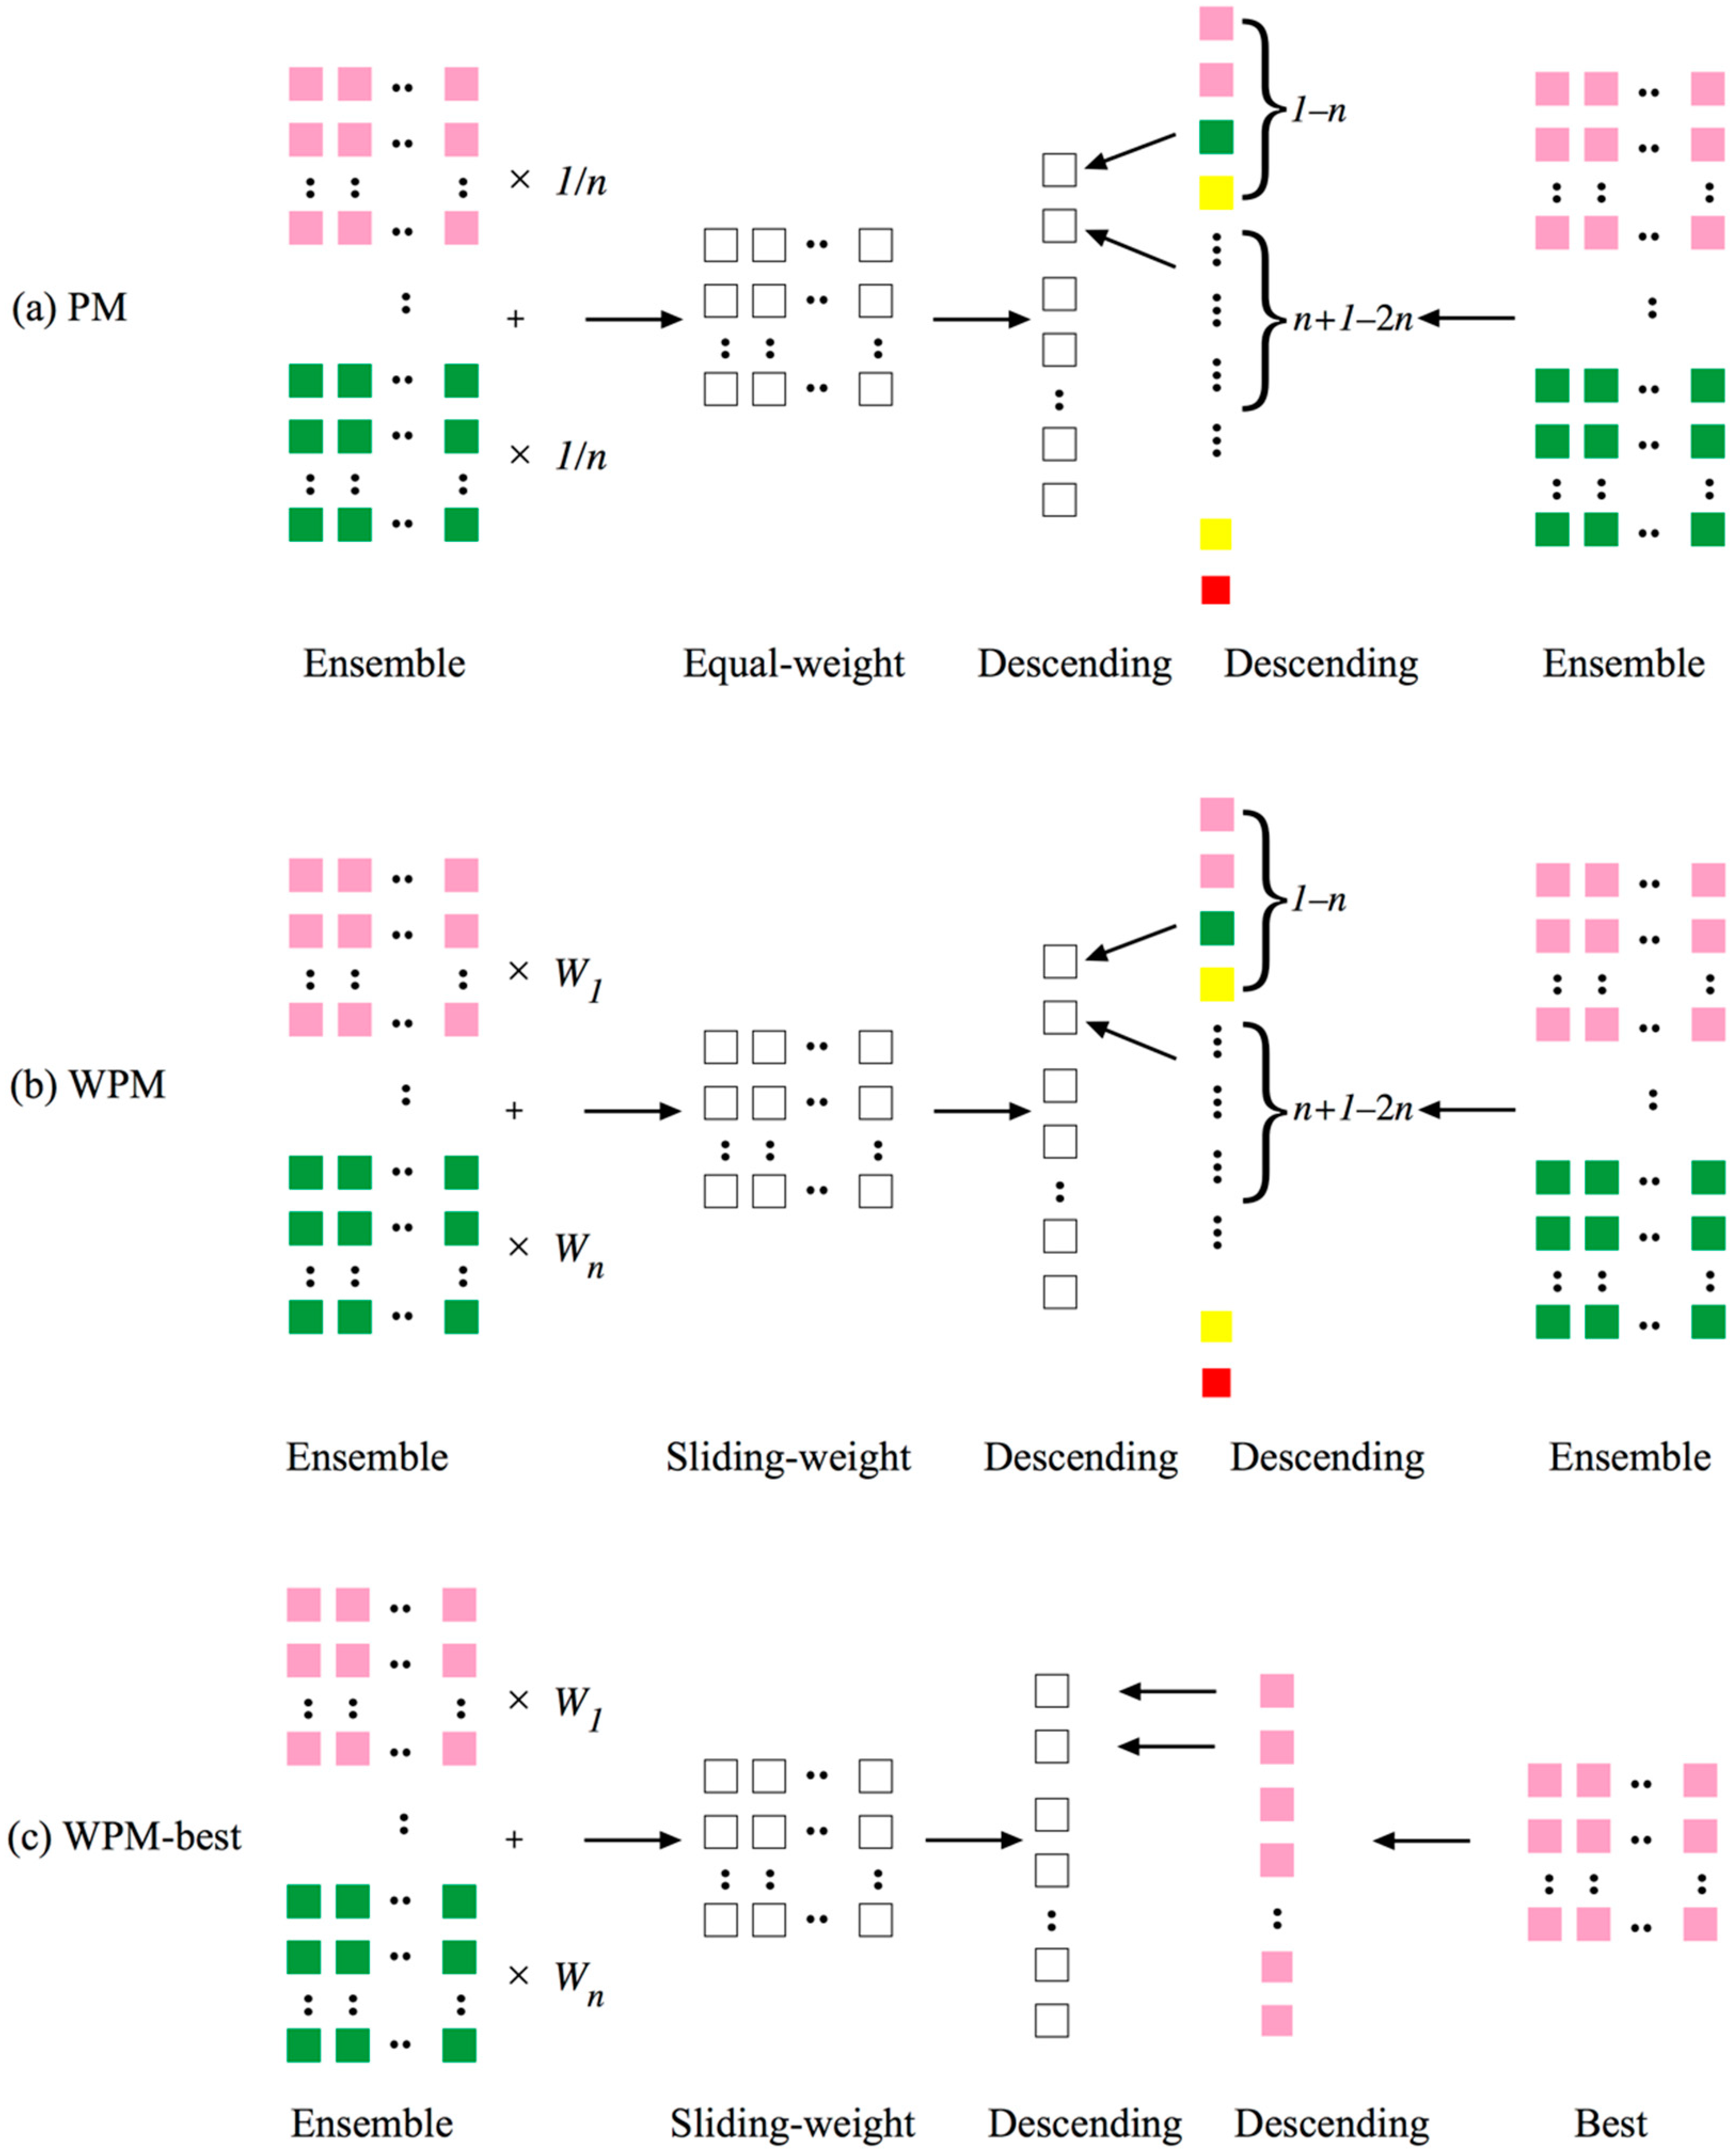
2.2.1. Generating Multi-Model Ensemble Members
2.2.2. WPM Method and Sensitivity Experiments
2.2.3. Verification
3. Results
3.1. Analysis of Multi-Model Hourly QPF
3.2. Analysis of Ensemble Members
3.3. Results of Sensitivity Experiments
3.4. Case Study of Typhoon Mekkhala (2020)
4. Conclusions
- (1)
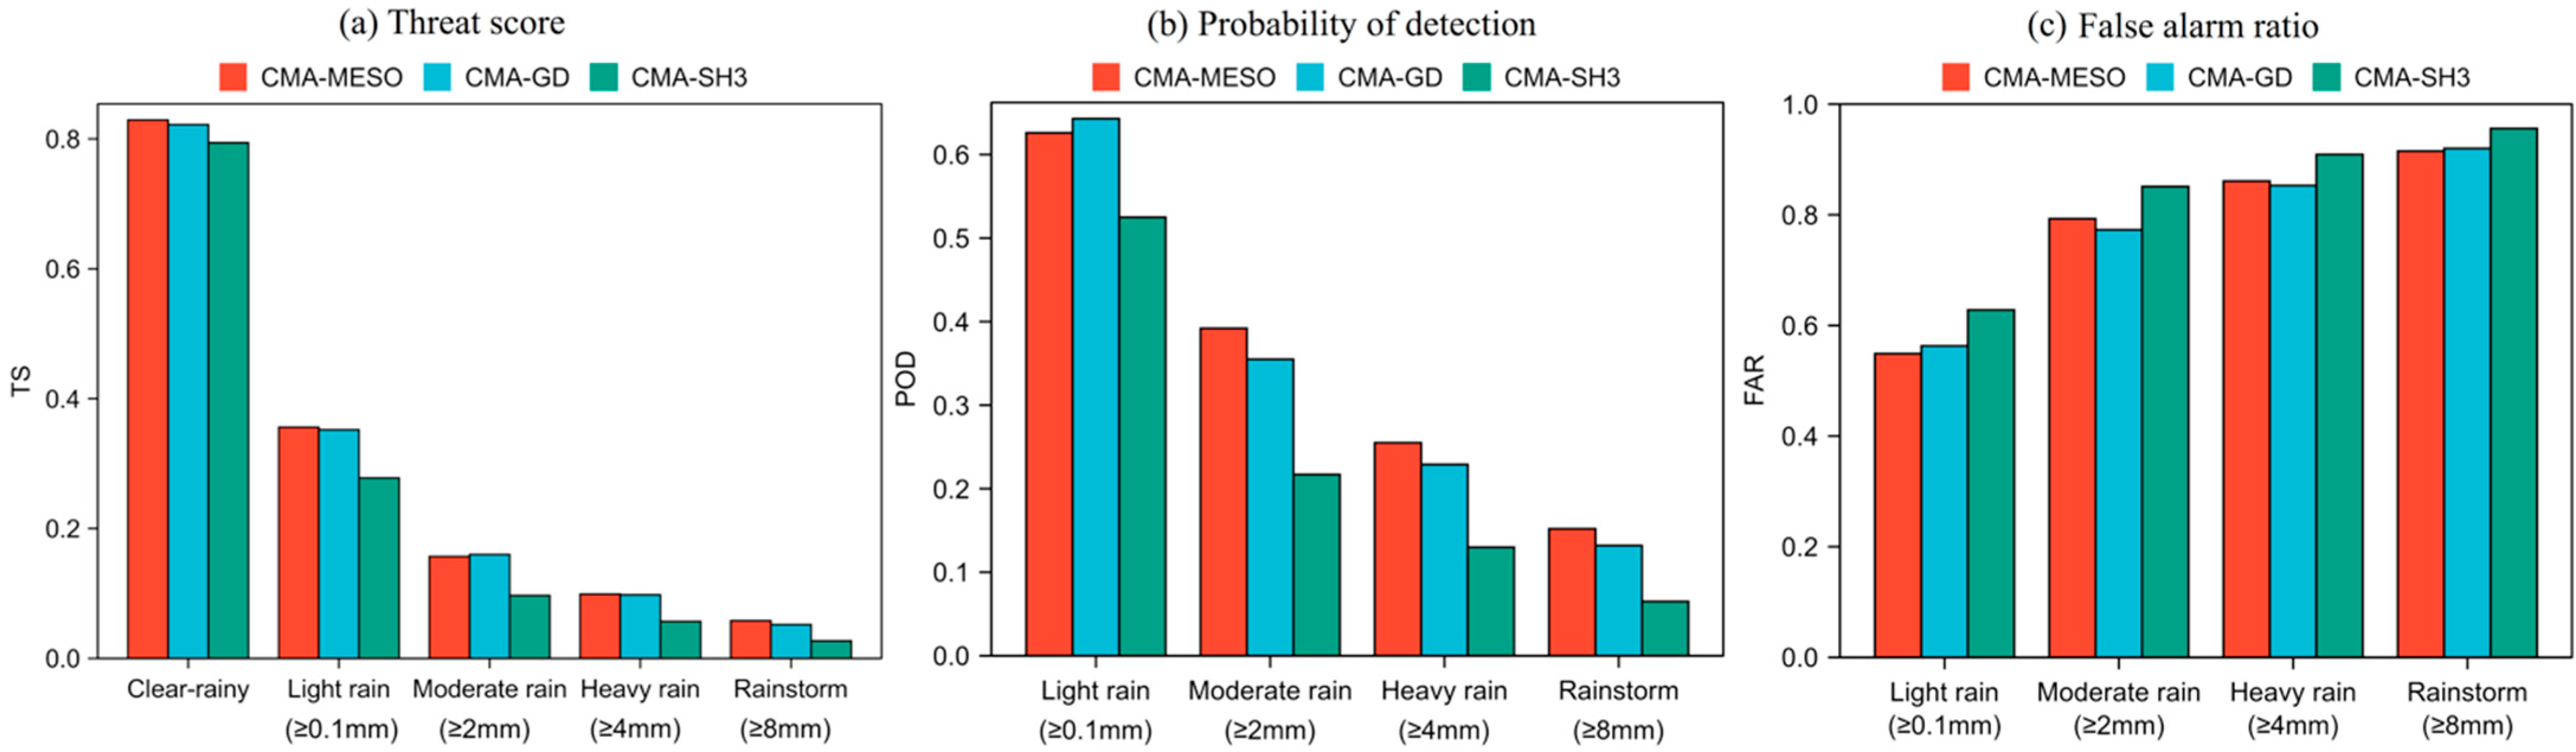
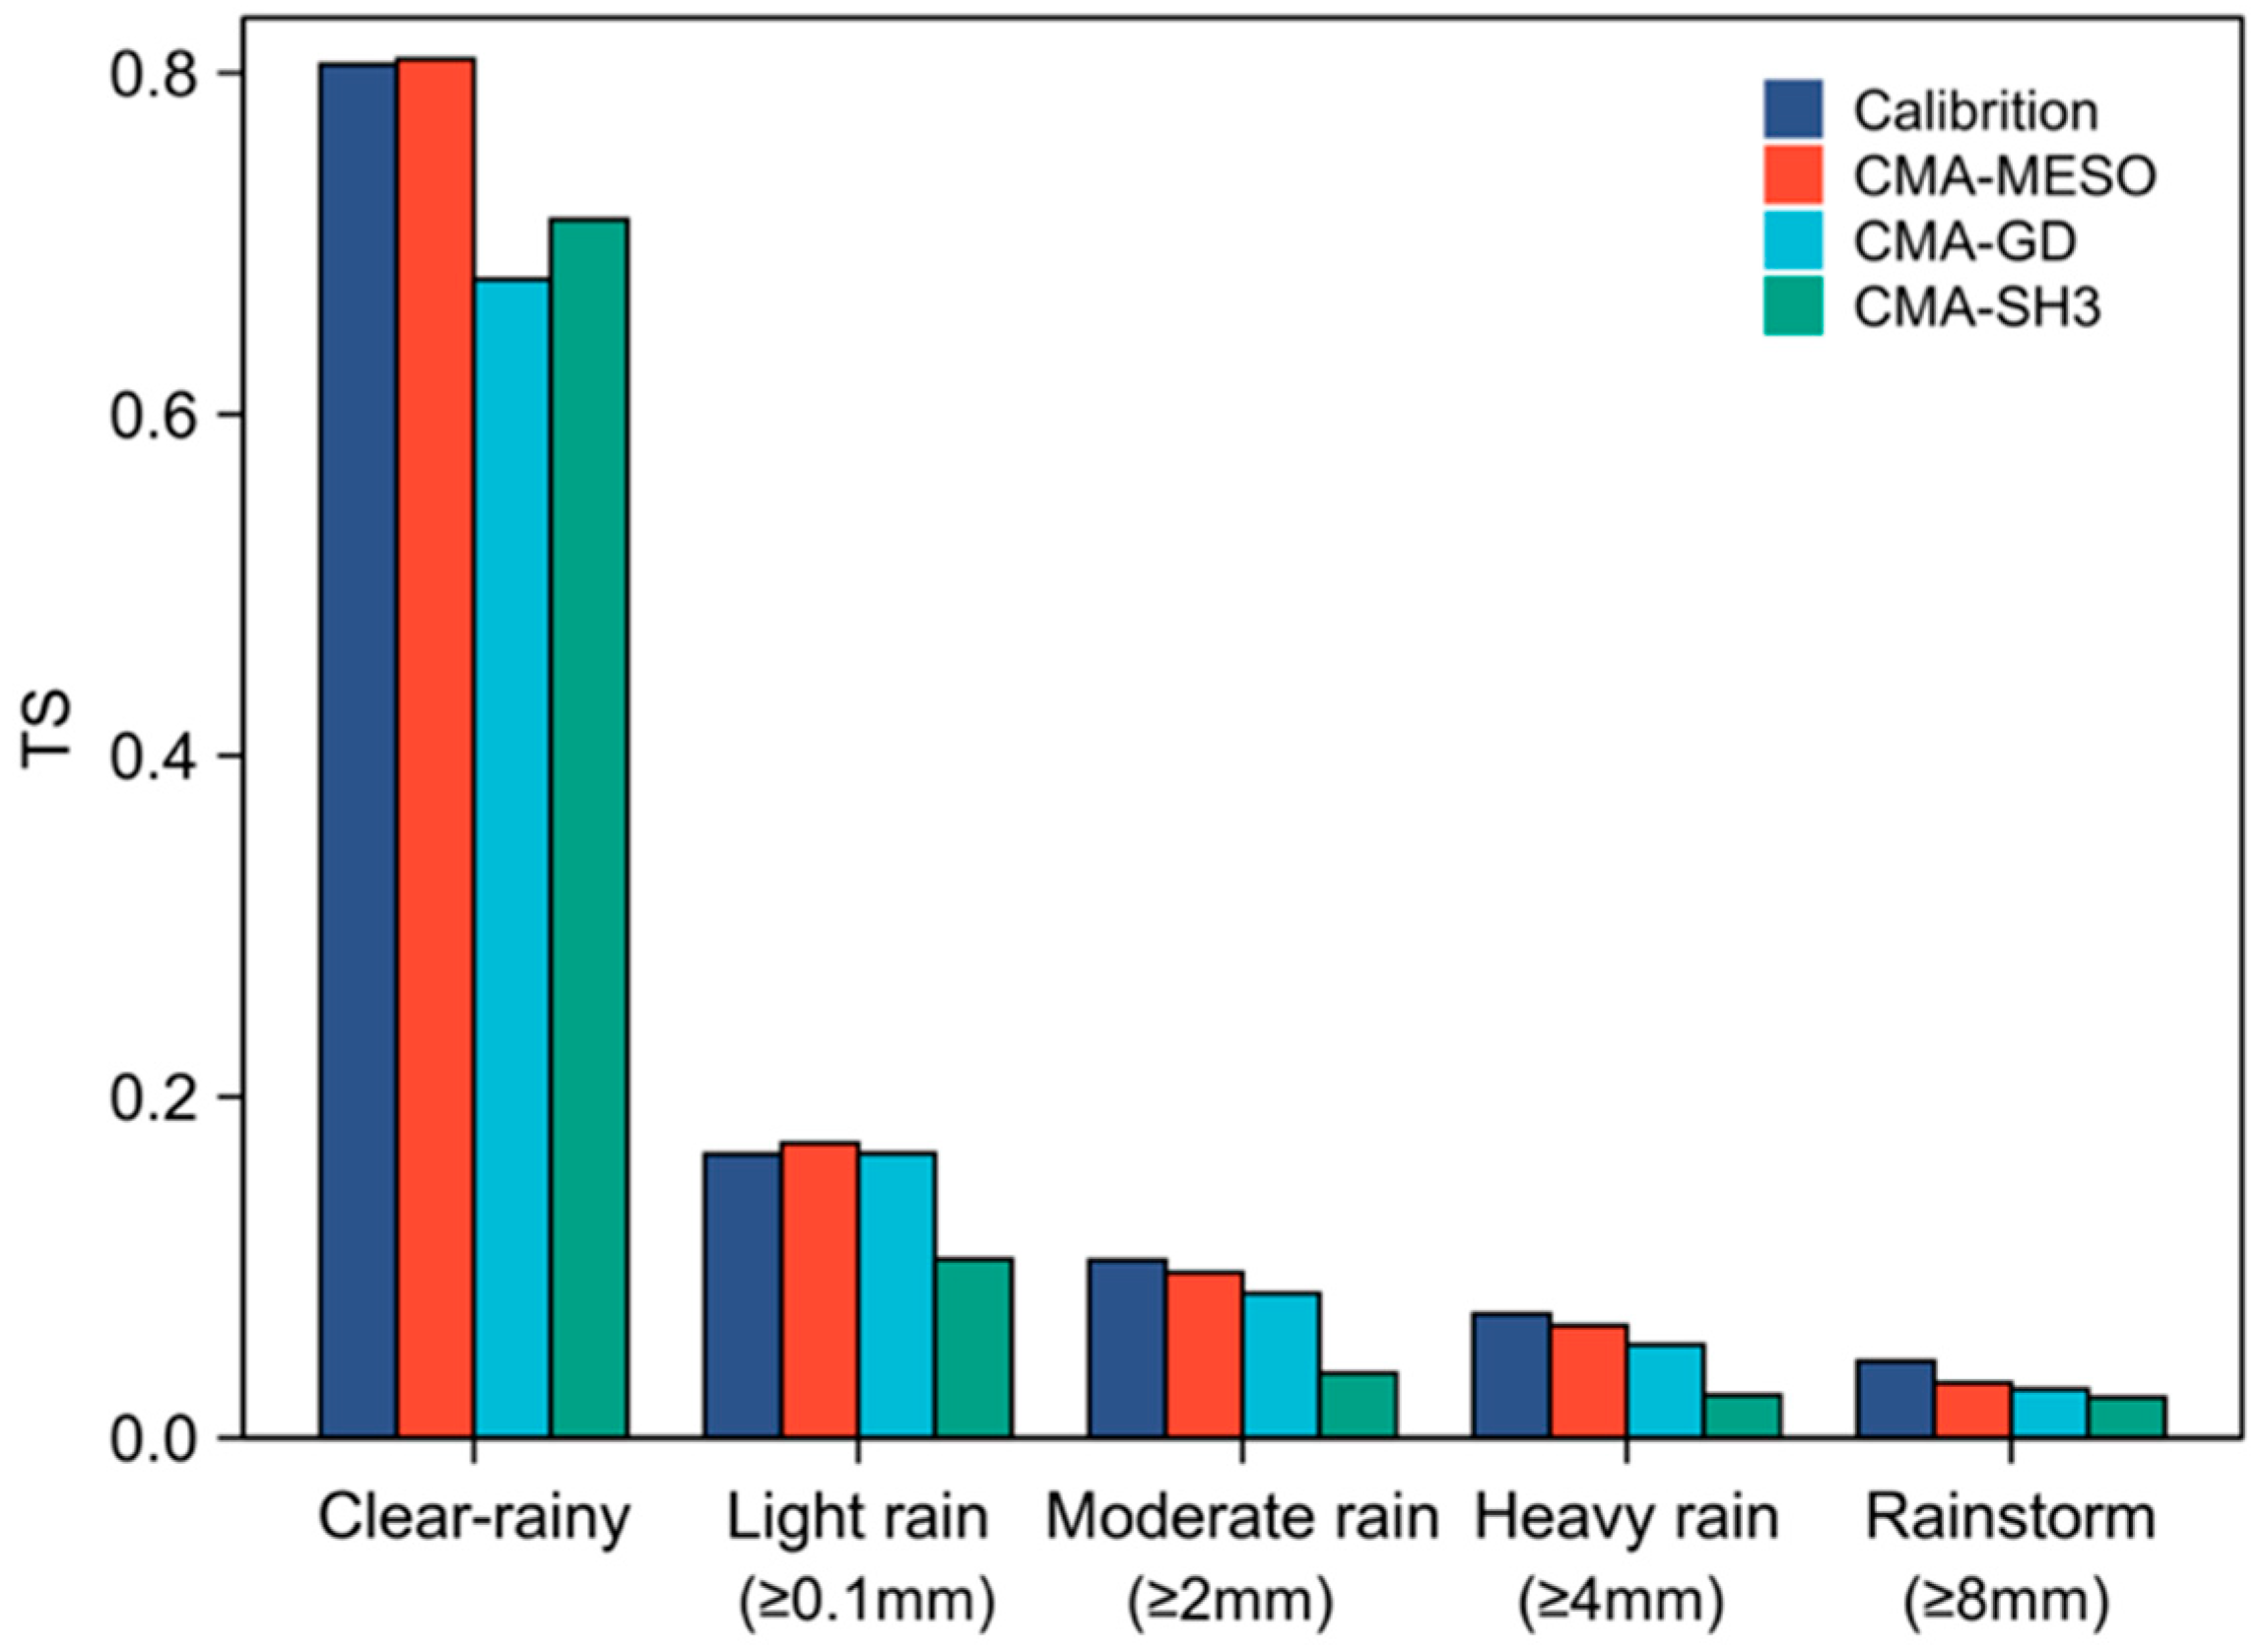
- In non-rainstorm forecasts, CMA-MESO and CMA-GD have similar forecast capabilities. In rainstorm forecasts, CMA-MESO has a notable advantage over CMA-GD and CMA-SH3, with the TS increasing to 0.052 (CMA-GD) from 0.058 (CMA-MESO), representing an 11.5% growth. Additionally, among the nine ensemble members, CMA-MESO showed the highest accuracy for the rainstorm forecast, with a reliable performance in the non-rainstorm forecast. Thus, this was selected as a key factor for the sensitivity experiment.
- (2)
- Compared with traditional equal-weight PM, the WPM improves the different grades of QPF, obtaining an optimal rainfall pattern using WMA, with a rainstorm threat score skill of 0.051 to 0.056, an increase of 9.8%. On this basis, the WPM-best method, which uses an optimal rainfall intensity than WPM, furtherly improves precipitation forecasts. The higher the precipitation grade, the more significant the improvement. The TS in the rainstorm forecast further increases to 0.062.
- (3)
- The sensitivity experiments show that there is no need to select models before using the WPM-best method, because WPM-best can give a very low weight to the less-skillful model in a more objective way. However, this method has no effect on a single model with extra post-processed FM and OTS members, because both FM and OTS can only improve intensity, not distribution. The performance of WPM-best improves with longer valid forecast periods.
- (4)
- The results of the case analysis of typhoon “Mekkhala” (2020) show that CMA-MESO has the highest forecast TS among the three high-resolution models, and the WPM-best method furtherly improves the rainstorm forecast by 39.2% compared with CMA-MESO.
Author Contributions
Funding
Institutional Review Board Statement
Informed Consent Statement
Data Availability Statement
Acknowledgments
Conflicts of Interest
References
- Novak, D.R.; Bailey, C.; Brill, K.F.; Burke, P.; Hogsett, W.A.; Rausch, R.; Schichtel, M. Precipitation and temperature forecast performance at the weather prediction center. Weather Forecast. 2014, 29, 489–504. [Google Scholar] [CrossRef] [Green Version]
- Hamill, T.; Scheuerer, M.; Bates, G. Analog probabilistic precipitation forecasts using GEFS reforecasts and climatology-calibrated precipitation analyses. Mon. Weather Rev. 2015, 143, 3300–3309. [Google Scholar] [CrossRef] [Green Version]
- Dai, K.; Zhu, Y.J.; Bi, B.G. The review of statistical post-process technologies for quantitative precipitation forecast of ensemble prediction system. Acta Meteorol. Sin. 2018, 76, 493–510. [Google Scholar]
- Ruth, D.P.; Glahn, B.; Dagastaro, V.; Gilbert, K. The performance of MOS in the digital age. Weather Forecast. 2008, 24, 504–519. [Google Scholar] [CrossRef]
- Charba, J.P.; Samplatsky, F.G. High-resolution GFS-based MOS quantitative precipitation forecasts on a 4-km grid. Mon. Weather Rev. 2011, 139, 39–68. [Google Scholar] [CrossRef]
- Cannon, A.J.; Sobie, S.R.; Murdock, T.Q. Bias correction of GCM precipitation by quantile mapping: How well do methods preserve changes in quantiles and extremes? J. Clim. 2015, 28, 6938–6959. [Google Scholar] [CrossRef]
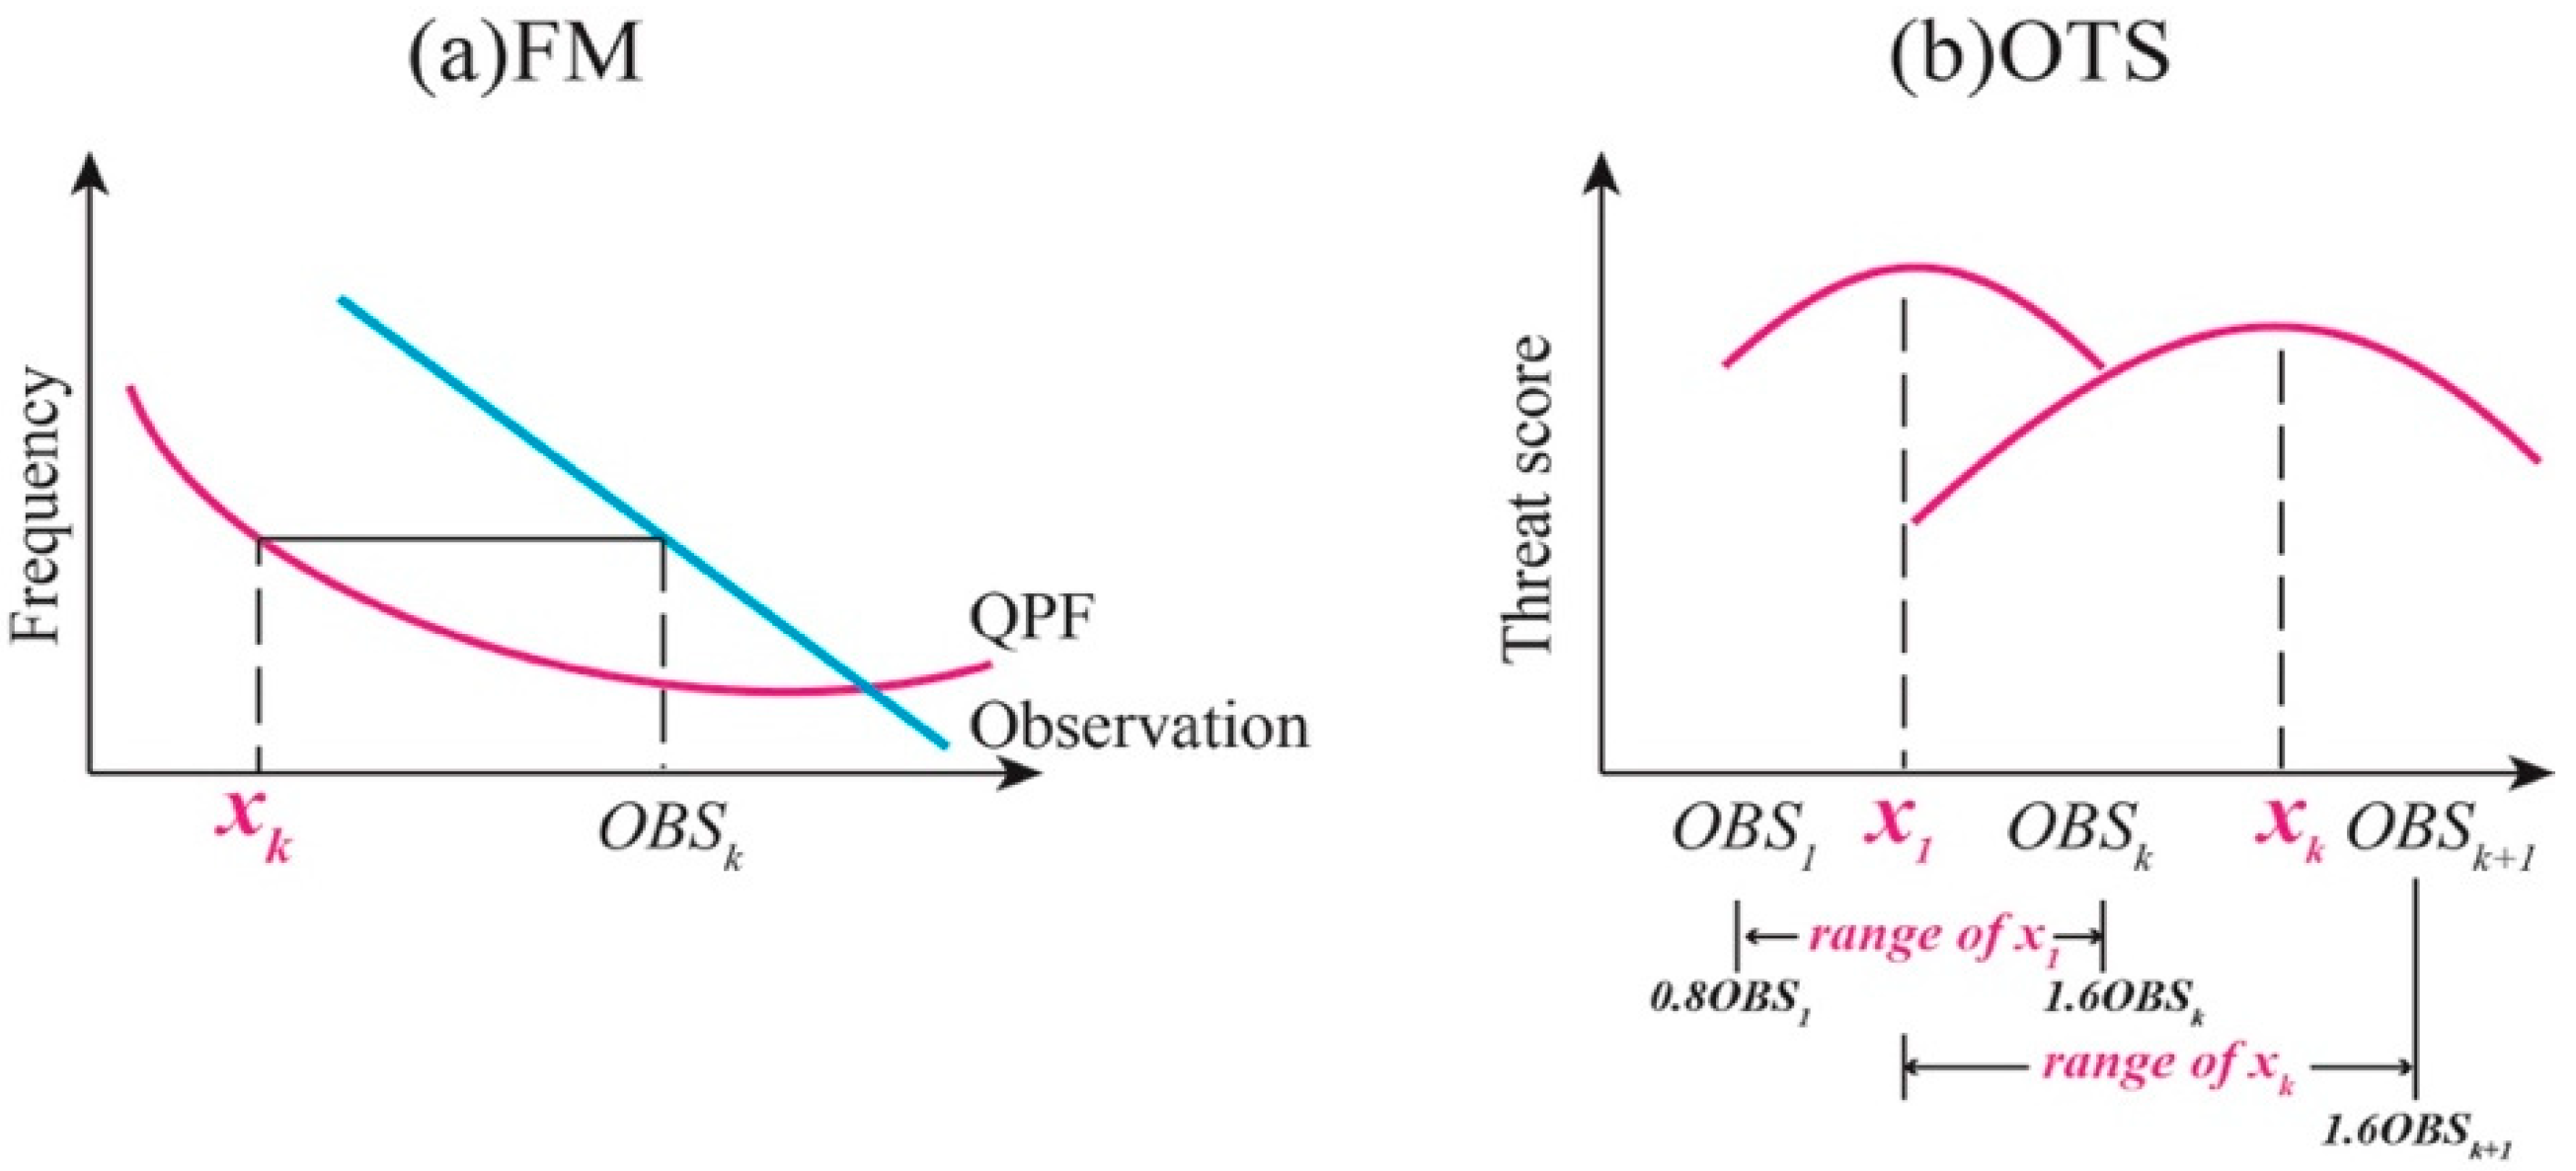
- Zhu, Y.J.; Luo, Y. Precipitation calibration based on the frequency-matching Method. Weather Forecast. 2015, 30, 1109–1124. [Google Scholar] [CrossRef]
- Wu, Q.S.; Han, M.; Liu, M.; Chen, F.J. A comparison of optimal-score-based correction algorithms of model precipitation prediction. J. Appl. Meteorol. Sci. 2017, 28, 306–317. [Google Scholar]
- Delle Monache, L.; Nipen, T.; Liu, Y.; Roux, G.; Stull, R. Kalman filter and analog schemes to postprocess Numerical Weather Predictions. Mon. Weather Rev. 2011, 139, 3554–3570. [Google Scholar] [CrossRef] [Green Version]
- Du, J.; Zhou, B. A dynamical performance-ranking method for predicting individual ensemble member performance and its application to ensemble averaging. Mon. Weather Rev. 2011, 139, 3284–3303. [Google Scholar] [CrossRef]
- Du, Y.G.; Qi, L.B.; Cao, X.G. Selective ensemble-mean technique for tropical cyclone track forecast by using time-lagged ensemble and multi-center ensemble in the western North Pacific. Q. J. R. Meteorol. Soc. 2016, 142, 2452–2462. [Google Scholar] [CrossRef]
- Primo, C.; Ferro, C.A.T.; Jolliffe, I.T.; Stephenson, D.B. Calibration of probabilistic forecasts of binary events. Mon. Weather Rev. 2009, 137, 1142–1149. [Google Scholar] [CrossRef]
- Messner, J.W.; Mayr, G.J. Probabilistic Forecasts Using Analogs in the Idealized Lorenz96 Setting. Mon. Weather Rev. 2010, 139, 1960–1971. [Google Scholar] [CrossRef]
- Qi, L.B.; Yu, H.; Chen, P.Y. Selective ensemble-mean technique for tropical cyclone track forecast by using ensemble prediction systems. Q. J. R. Meteorol. Soc. 2014, 140, 805–813. [Google Scholar] [CrossRef]
- Park, Y.Y.; Buizza, R.; Leutbecher, M. TIGGE: Preliminary Results on Comparing and Combining Ensembles. Q. J. R. Meteorol. Soc. 2008, 134, 2029–2050. [Google Scholar] [CrossRef]
- Bentzien, S.; Friederichs, P. Generating and calibrating probabilistic quantitative precipitation forecasts from the high-resolution NWP model Cos-MO-DE. Weather Forecast. 2012, 27, 998–1002. [Google Scholar] [CrossRef]
- Ebert, E.E. Ability of a poor man’s ensemble to predict the probability and distribution of precipitation. Mon. Weather Rev. 2001, 129, 2461–2480. [Google Scholar] [CrossRef]
- Clark, A.J.; Weiss, S.J.; Kain, J.S.; Jirak, I.L.; Coniglio, M.; Melick, C.J.; Siewer, C.; Sobash, R.A.; Marsh, R.T.; Dean, A.R.; et al. An Overview of the 2010 Hazardous Weather Testbed Experimental Forecast Program Spring Experiment. Bull. Am. Meteorol. Soc. 2012, 93, 55–74. [Google Scholar] [CrossRef]
- Fang, X.; Kuo, Y.H. Improving ensemble-based quantitative precipitation forecasts for topography-enhanced typhoon heavy rainfall over Taiwan with a modified probability-matching technique. Mon. Weather Rev. 2013, 141, 3908–3932. [Google Scholar] [CrossRef] [Green Version]


| Name | Output Resolution | Duration | Operation/UTC | Organization |
|---|---|---|---|---|
| CMA-MESO | 3 km, 1 h | 36 h | 00/03/06/09/12/15/18/21 | China Meteorological Administration |
| CMA-GD | 3 km, 1 h | 96 h | 00/12 | Guangdong Meteorological Service |
| CMA-SH3 | 3 km, 1 h | 24 h | Per hour | Shanghai Meteorological Service |
| Ensemble Members | Description | Training Window |
|---|---|---|
| CMA-MESO | Classic CMA-MESO QPF | None |
| CMA-MESO-FM | QPF magnitude adjusted based on FM | Past 60 days |
| CMA-MESO-OTS | QPF magnitude adjusted based on optimal TS | Past 60 days |
| CMA-GD | Classic CMA-GD QPF | None |
| CMA-GD-FM | QPF magnitude adjusted based on FM | Past 60 days |
| CMA-GD-OTS | QPF magnitude adjusted based on optimal TS | Past 60 days |
| CMA-SH3 | Classic CMA-SH3 QPF | None |
| CMA-SH3-FM | QPF magnitude adjusted based on FM | Past 60 days |
| CMA-SH3-OTS | QPF magnitude adjusted based on optimal TS | Past 60 days |
| Indicator | Expression |
|---|---|
| Spearman correlation coefficient (Ri) | |
| Weight (Wj) | |
| New pattern (D) |
| Experiments | Pattern | Intensity | Training Window |
|---|---|---|---|
| PM | Ensemble mean | Ensemble members | None |
| WPM | WMA | Ensemble members | Past 60 days |
| WPM-best | WMA | The optimal member | Past 60 days |
| Indicator | Expression |
|---|---|
| Threat score (TS) | |
| Clear-rainy TS | |
| Probability of detection (POD) | |
| False alarm ratio (FAR) |
Publisher’s Note: MDPI stays neutral with regard to jurisdictional claims in published maps and institutional affiliations. |
© 2021 by the authors. Licensee MDPI, Basel, Switzerland. This article is an open access article distributed under the terms and conditions of the Creative Commons Attribution (CC BY) license (https://creativecommons.org/licenses/by/4.0/).
Share and Cite
Liu, J.-Q.; Li, Z.-L.; Wang, Q.-Q. Quantitative Precipitation Forecasting Using an Improved Probability-Matching Method and Its Application to a Typhoon Event. Atmosphere 2021, 12, 1346. https://0-doi-org.brum.beds.ac.uk/10.3390/atmos12101346
Liu J-Q, Li Z-L, Wang Q-Q. Quantitative Precipitation Forecasting Using an Improved Probability-Matching Method and Its Application to a Typhoon Event. Atmosphere. 2021; 12(10):1346. https://0-doi-org.brum.beds.ac.uk/10.3390/atmos12101346
Chicago/Turabian StyleLiu, Jin-Qing, Zi-Liang Li, and Qiong-Qun Wang. 2021. "Quantitative Precipitation Forecasting Using an Improved Probability-Matching Method and Its Application to a Typhoon Event" Atmosphere 12, no. 10: 1346. https://0-doi-org.brum.beds.ac.uk/10.3390/atmos12101346