Article

Sulfur and Nitrogen Oxides in the Atmosphere of Lake Baikal: Sources, Automatic Monitoring, and Environmental Risks

Limnological Institute, Siberian Branch of the Russian Academy of Sciences (RAS), 664033 Irkutsk, Russia
*
Author to whom correspondence should be addressed.
Submission received: 26 August 2021 / Revised: 21 September 2021 / Accepted: 10 October 2021 / Published: 15 October 2021
(This article belongs to the Special Issue Air Quality Management)

Abstract

:
This paper analyzes the results of the automatic (in situ) recording of the regional transport of pollutants from the large regional coal-fired thermal power plants in the atmospheric boundary layer above the southern basin of Lake Baikal. Due to high stacks (about 200 m), emissions from large thermal power plants rise to the altitudes of several hundreds of meters and spread over long distances from their source by tens and hundreds of kilometers. The continuous automatic monitoring of the atmosphere in the southern basin of Lake Baikal on top of the coastal hill (200 m above the lake) revealed the transport of a large number of sulfur oxides and nitrogen oxides in the form of high-altitude plumes from thermal power plants of the large cities located 70 to 100 km to the northwest of the lake (Irkutsk and Angarsk). The consequence of such transport is the increased acidity of precipitation in the southern basin of Lake Baikal and the additional influx of biogenic nitrogen compounds to the lake ecosystem. The spatial scale and possible risks of such regional transport of air pollution for the lake ecosystem require further closer study.

1. Introduction

Anthropogenic sulfur and nitrogen oxides are the most common pollutants of the atmospheric boundary layer in many regions of the world [1,2,3,4]. This is because their sources are predominantly high-capacity thermal power plants that burn huge amounts of fossil fuels (mainly coal) to supply heat and electricity to large cities and industrial enterprises. High stacks (up to 200 m or more) are used at these thermal power plants to remove fuel combustion products from settlements. Taking into account the heating, the gases released from the stacks can rise even higher and spread at altitudes of several hundreds of meters above the earth’s surface at a distance of hundreds of kilometers from their source and have a negative impact on the natural ecosystems, even in remote background areas. In particular, one of the most negative consequences of long-range transport of sulfur and nitrogen oxides is acidification of precipitation [5,6,7]. In this regard, monitoring of atmospheric pollution should be carried out not only in the atmospheric surface layer but also in the atmospheric boundary layer along the pathways of probable long-range transport of pollution, especially toward specially protected natural objects.
Lake Baikal is one of the world’s natural heritage sites, the largest storage of the world’s freshwater reserves, having a unique biological ecosystem. The atmosphere above the lake is one of the important channels of a possible anthropogenic impact on the state of its ecosystem. Near the southern part of the lake, 70 to 100 km to the northwest and southeast of it, there are large industrial centers of the region, which use high-capacity coal-fired thermal power plants as energy sources. Until recently, the possible impact of these coal-fired thermal power plants on the state of the lake ecosystem was underestimated due to the difficulties in instrumental monitoring of the high-altitude regional transport of their emissions toward the lake. Currently, a system of the state-automated monitoring of the atmosphere [8] is developing in the region, but it is mainly concentrated in large cities, such as Irkutsk, Angarsk, and Ulan-Ude, and in the near-ground layer of the atmosphere. This system reflects rather well air pollution from low sources (e.g., vehicles and small boiler houses) and practically does not control high-altitude emissions from large thermal power plants, which spread at altitudes of several hundreds of meters, reaching the area of Lake Baikal. About 80 to 90% of all emissions of sulfur oxides and nitrogen oxides in the region are high-altitude emissions from large coal-fired thermal power plants.
To control high-altitude transport of air pollution to Lake Baikal, the Limnological Institute Siberian Branch of the Russian Academy of Sciences (SB RAS), with the participation of the authors of this article, organized an atmospheric monitoring station Listvyanka on the southwestern border of the central ecological zone of Lake Baikal. Listvyanka is located on top of the coastal hill near the source of the Angara River (Figure 1), along the pathway of the most likely direction of air masses coming to Lake Baikal from the large cities of the region. The location of the station atop the hill (ca. 650 m above see level) allows us to partially control the transport of pollution to Lake Baikal precisely in the atmospheric boundary layer. A joint analysis of the data on the state-automated monitoring in the cities of the region and at Lake Baikal (Listvyanka station) provides a better understanding of the processes of air pollution above Lake Baikal and assessment of the possible risks for its ecosystem.
In this regard, this article aims to analyze specific cases of automatic records of high-altitude transport of air pollution to Lake Baikal and to assess the frequency and capacity of this transport in different seasons of the year, their contribution to air pollution deposition on the lake, and the possible impact on its ecosystem.

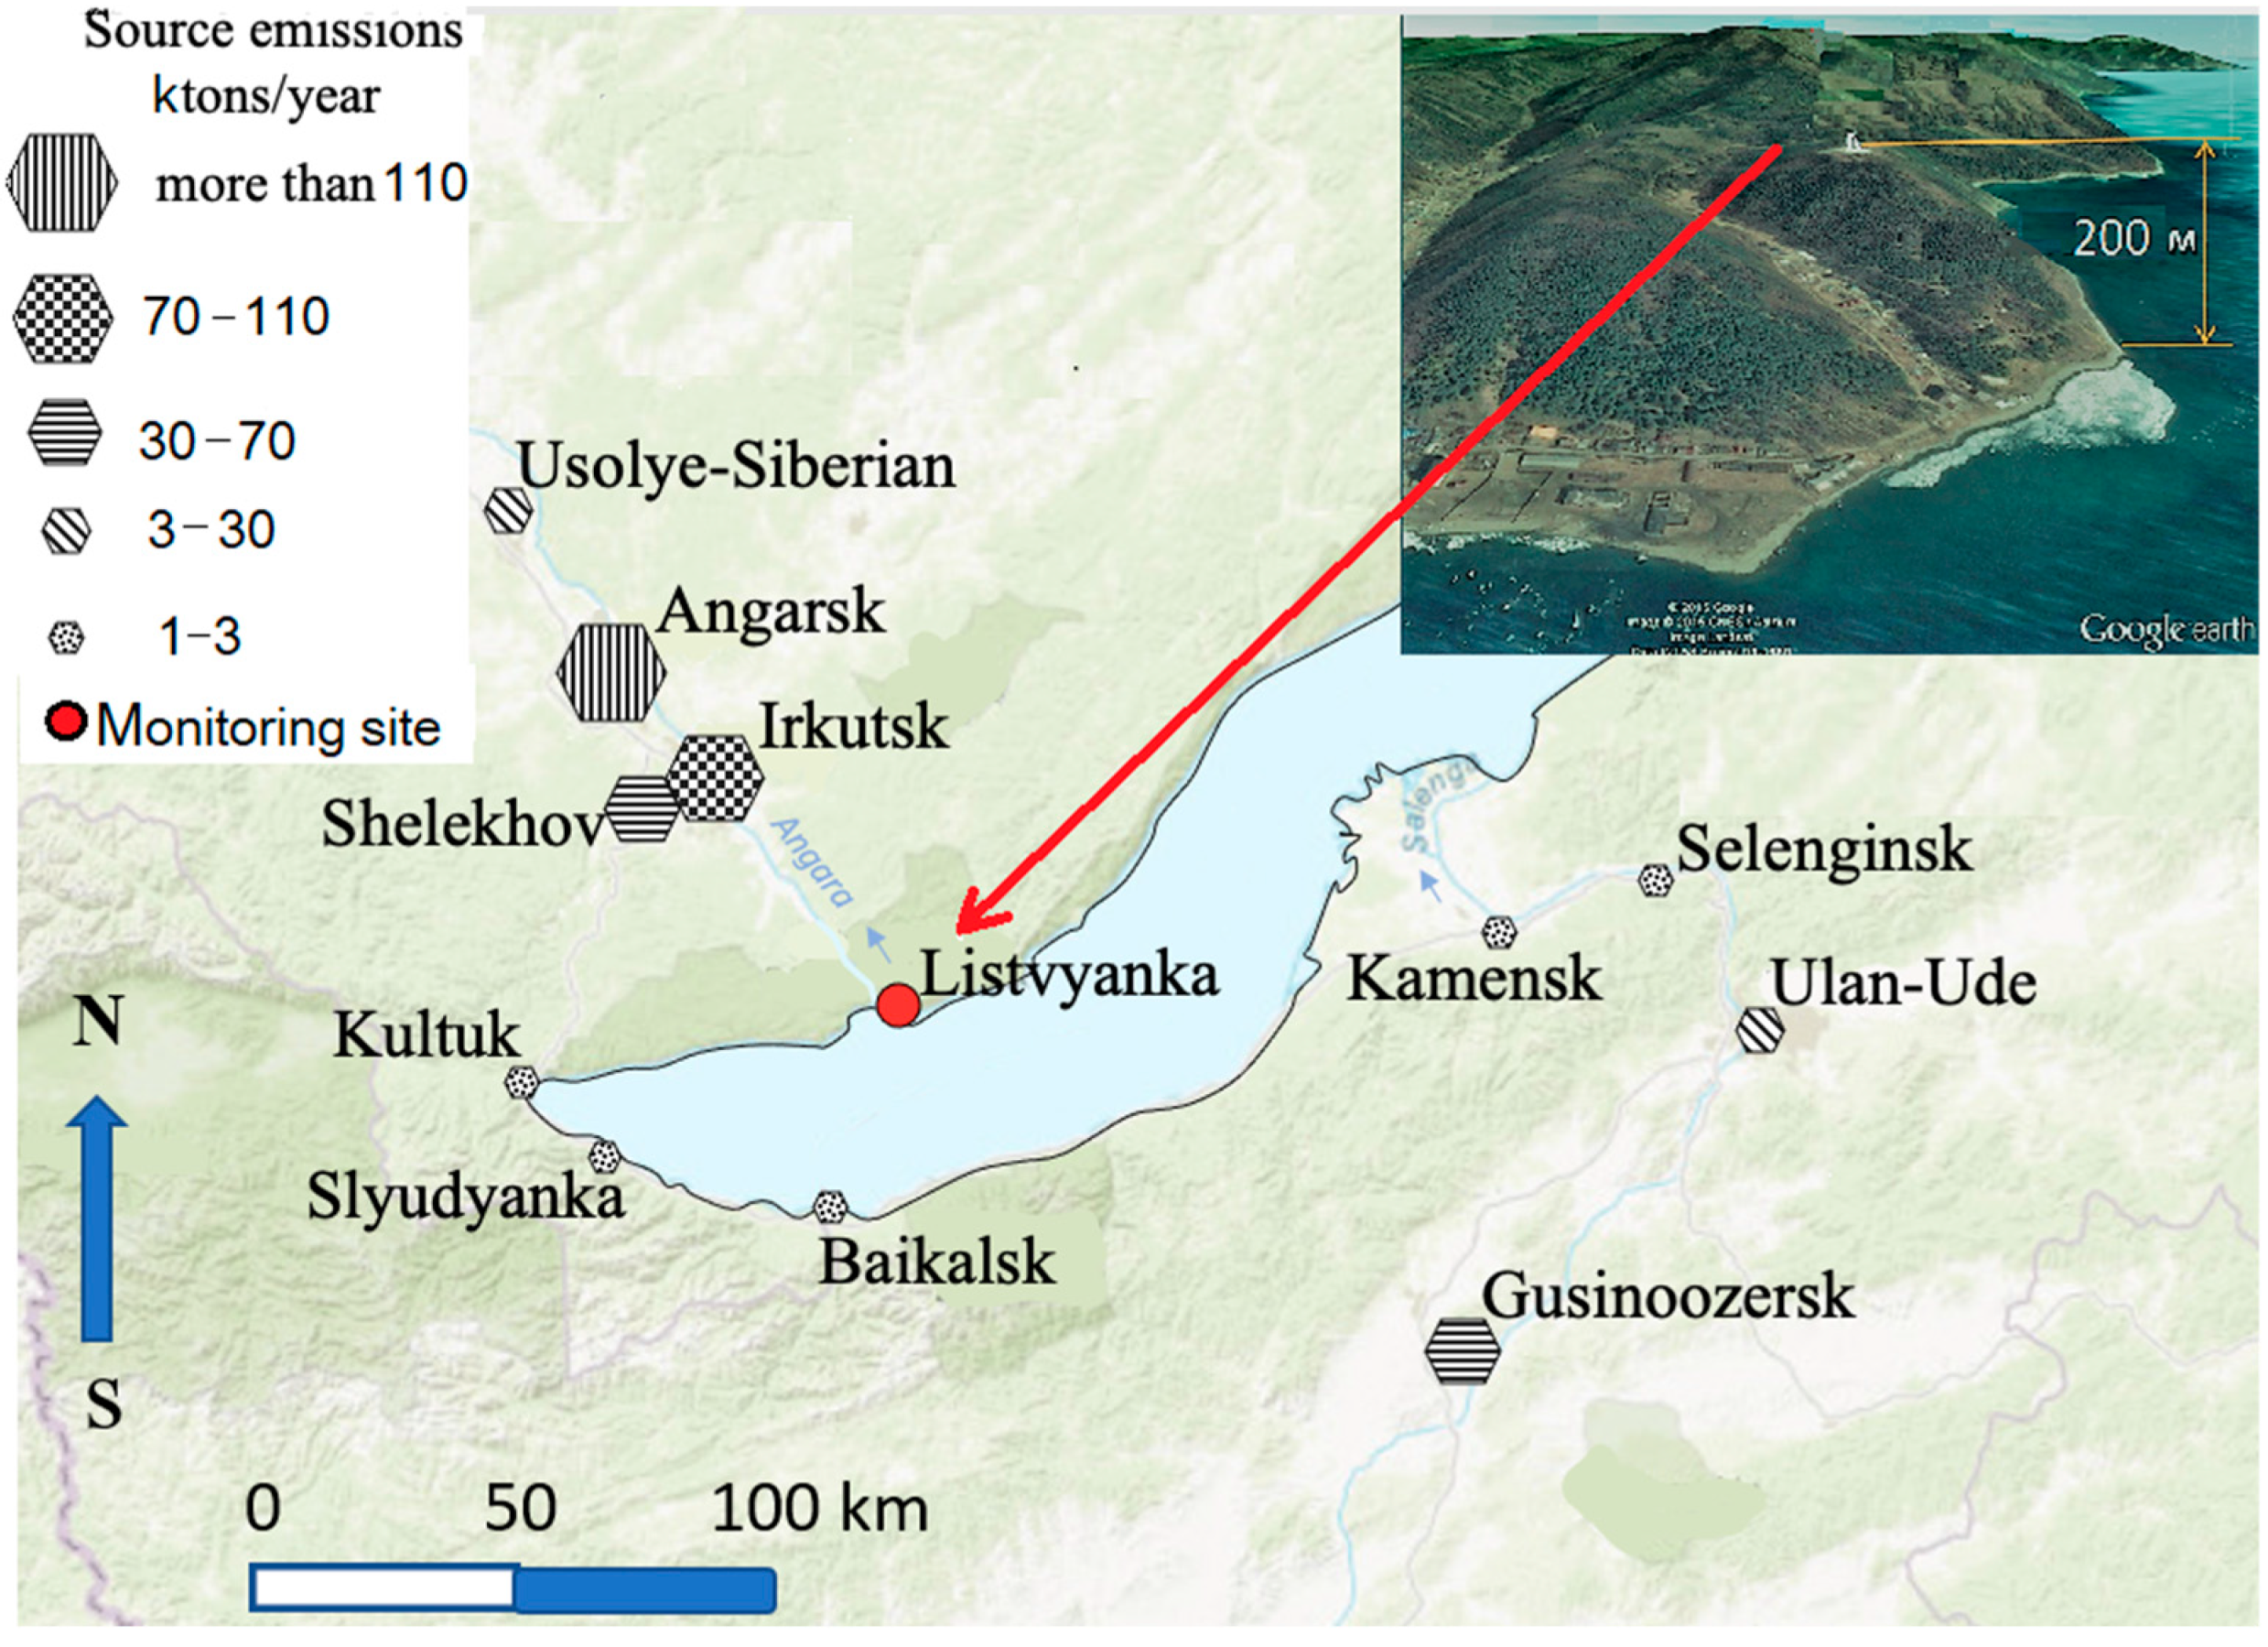
2. Monitoring Sites and Methods

Small settlements using mainly low-capacity boiler houses predominate directly in the area of the central ecological zone of Lake Baikal. The total atmospheric emission from the Lake Baikal sources is many times lower compared to the large cities of the region (Table 1, Figure 1). In the large cities, the maximum volume of atmospheric emissions is mainly due to sulfur dioxide and nitrogen dioxide from high stacks of thermal power plants. The emission of sulfur dioxide from low-altitude sources, such as vehicles and boiler houses, is insignificant. However, urban vehicles contribute significantly to the emission of nitrogen oxide in the atmospheric surface layer. The bulk of the emissions from thermal power plants is carried away and dispersed outside the cities at altitudes of up to several hundreds of meters owing to high stacks. Therefore, the stations monitoring the atmospheric surface layer poorly control high-altitude emissions of pollutants such as SO2.
In this connection, to monitor the transport of high-altitude air pollution to Lake Baikal from high sources, automatic monitoring was organized on top of the coastal hill (200 m above sea level) on the pathway of the predominant transport of air masses along the valley of the Angara River (Figure 1). The coordinates of the stations are 51°51’ N; 104°54’ E, 200 m above the lake level. Such an arrangement of the station allows avoiding the influence of local sources of air pollution (e.g., small boiler houses, stove heating, and vehicles) and tracking only high-altitude regional and global transport of pollution.
The automatic monitoring complex includes the following devices.
  • SO2 and H2S—“СВ-320”, OPTEC (Optics in Ecology), Saint Petersburg, Russia); the detection limit is 0.001 mg/m3 and error rate 10–15%.
  • NO and NO2—“РА-310А”, OPTEC, Saint Petersburg, Russia; the detection limit is 0.001 mg/m3 and error rate 10–15%.
  • CO—“К-100”, OPTEC, Saint Petersburg, Russia; the detection limit is 0.1 mg/m3 and error rate 10–15%.
  • O3—“F-105”, OPTEC, Saint Petersburg, Russia; the detection limit is 0.001 mg/m3 and error rate 10–15%.
  • Hg (gaseous elemental)—РА-915АМ, Lumex, Saint Petersburg, Russia; the detection limit is 0.5 ng/m3 and error rate 10%.
  • Aerosols (PM10; PM2.5; PM1.0)—“DUSTTRACK—8533” (TSI, Shoreview, MN, USA); the detection limit is 0.001 mg/m3 and error rate 10–15%.
  • Ultrasonic meteorological station—“Meteo-2М” (IОА SB РАS, Tomsk, Russia).
In the warm season, samples of precipitation (every event) were collected by an automatic US-320 “wet-only” precipitation collector (Japan), and in the cold season, they were collected in plastic containers. Ionic concentrations, pH, and specific electrical conductance were determined in precipitation samples. Chemical analyses of precipitation were carried out in the accredited Laboratory of Hydrochemistry and Atmosphere Chemistry at the Limnological Institute SB RAS according to the methods recommended within the atmospheric monitoring networks of the international programs EMEP (European Monitoring Environmental Program) and EANET (East Asia Network for Acid Deposition). Analyses were conducted using an atomic absorption spectrophotometer from Carl Zeiss Jena (Jena, Germany), an ICS-3000 Ion Chromatography System (Dionex, Sunnyvale, CA, USA), an Expert-pH meter (Tver, Russia), and a Horiba DS-12 conductivity meter (Horiba, Kyoto, Japan). Modern methods of analysis ensured high accuracy of measurement results, up to 4% with a confidence level of p = 0.95.
To assess the long-range transport of air masses from remote emission sources of Angarsk, Irkutsk, and other cities to the southern basin of Lake Baikal, the Hybrid Single-Particle Lagrangian Integrated Trajectory (HYSPLIT) model [10] was used, which calculated air mass trajectories at the three vertical levels: 50, 150, and 500 m. Synoptic situations were analyzed by the program “Digital Atmosphere” (www.weathergraphics.com).
In addition to measurements at the Listvyanka station, the results of measurements from the state network for automated atmospheric monitoring in large cities of the region (Angarsk, Irkutsk, Ulan-Ude, etc.) was also partially included in the analysis. These data are available at the website http://www.feerc.ru/baikal/ru/monitoring/air (accessed on 21 June 2021). However, unlike the Listvyanka station, this system reflects the state of the atmosphere in the surface layer and thereby does not always take into account the pollution from high stacks of thermal power plants, the emissions from which spread outside the cities at significant altitudes. This is important to take into account when comparing the monitoring results in the cities and at the Listvyanka station.

3. Results and Discussion

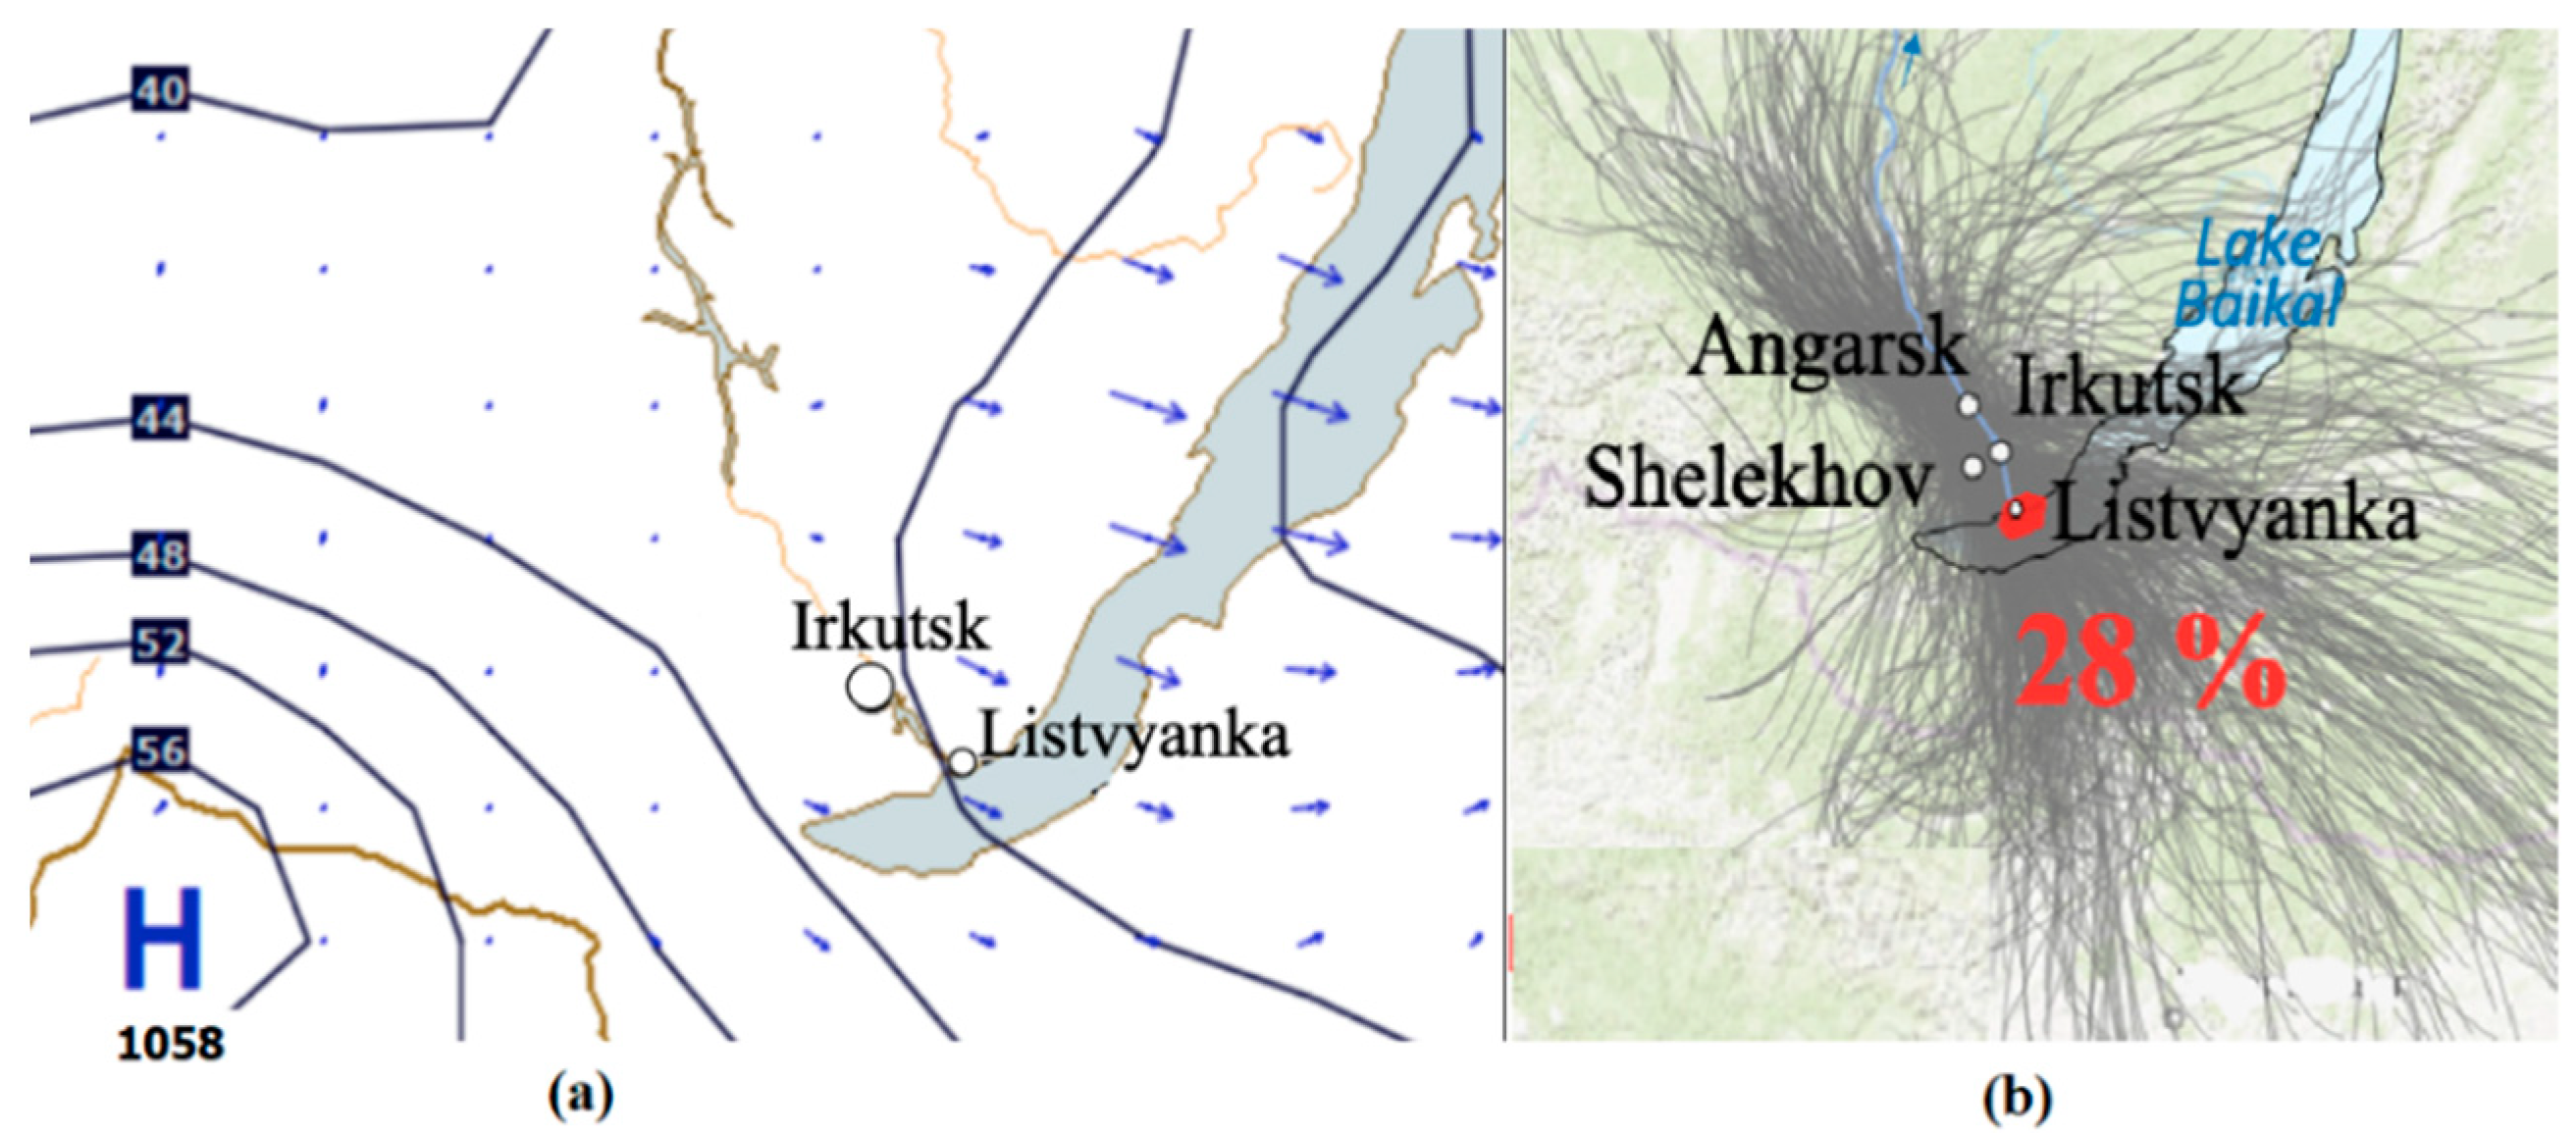
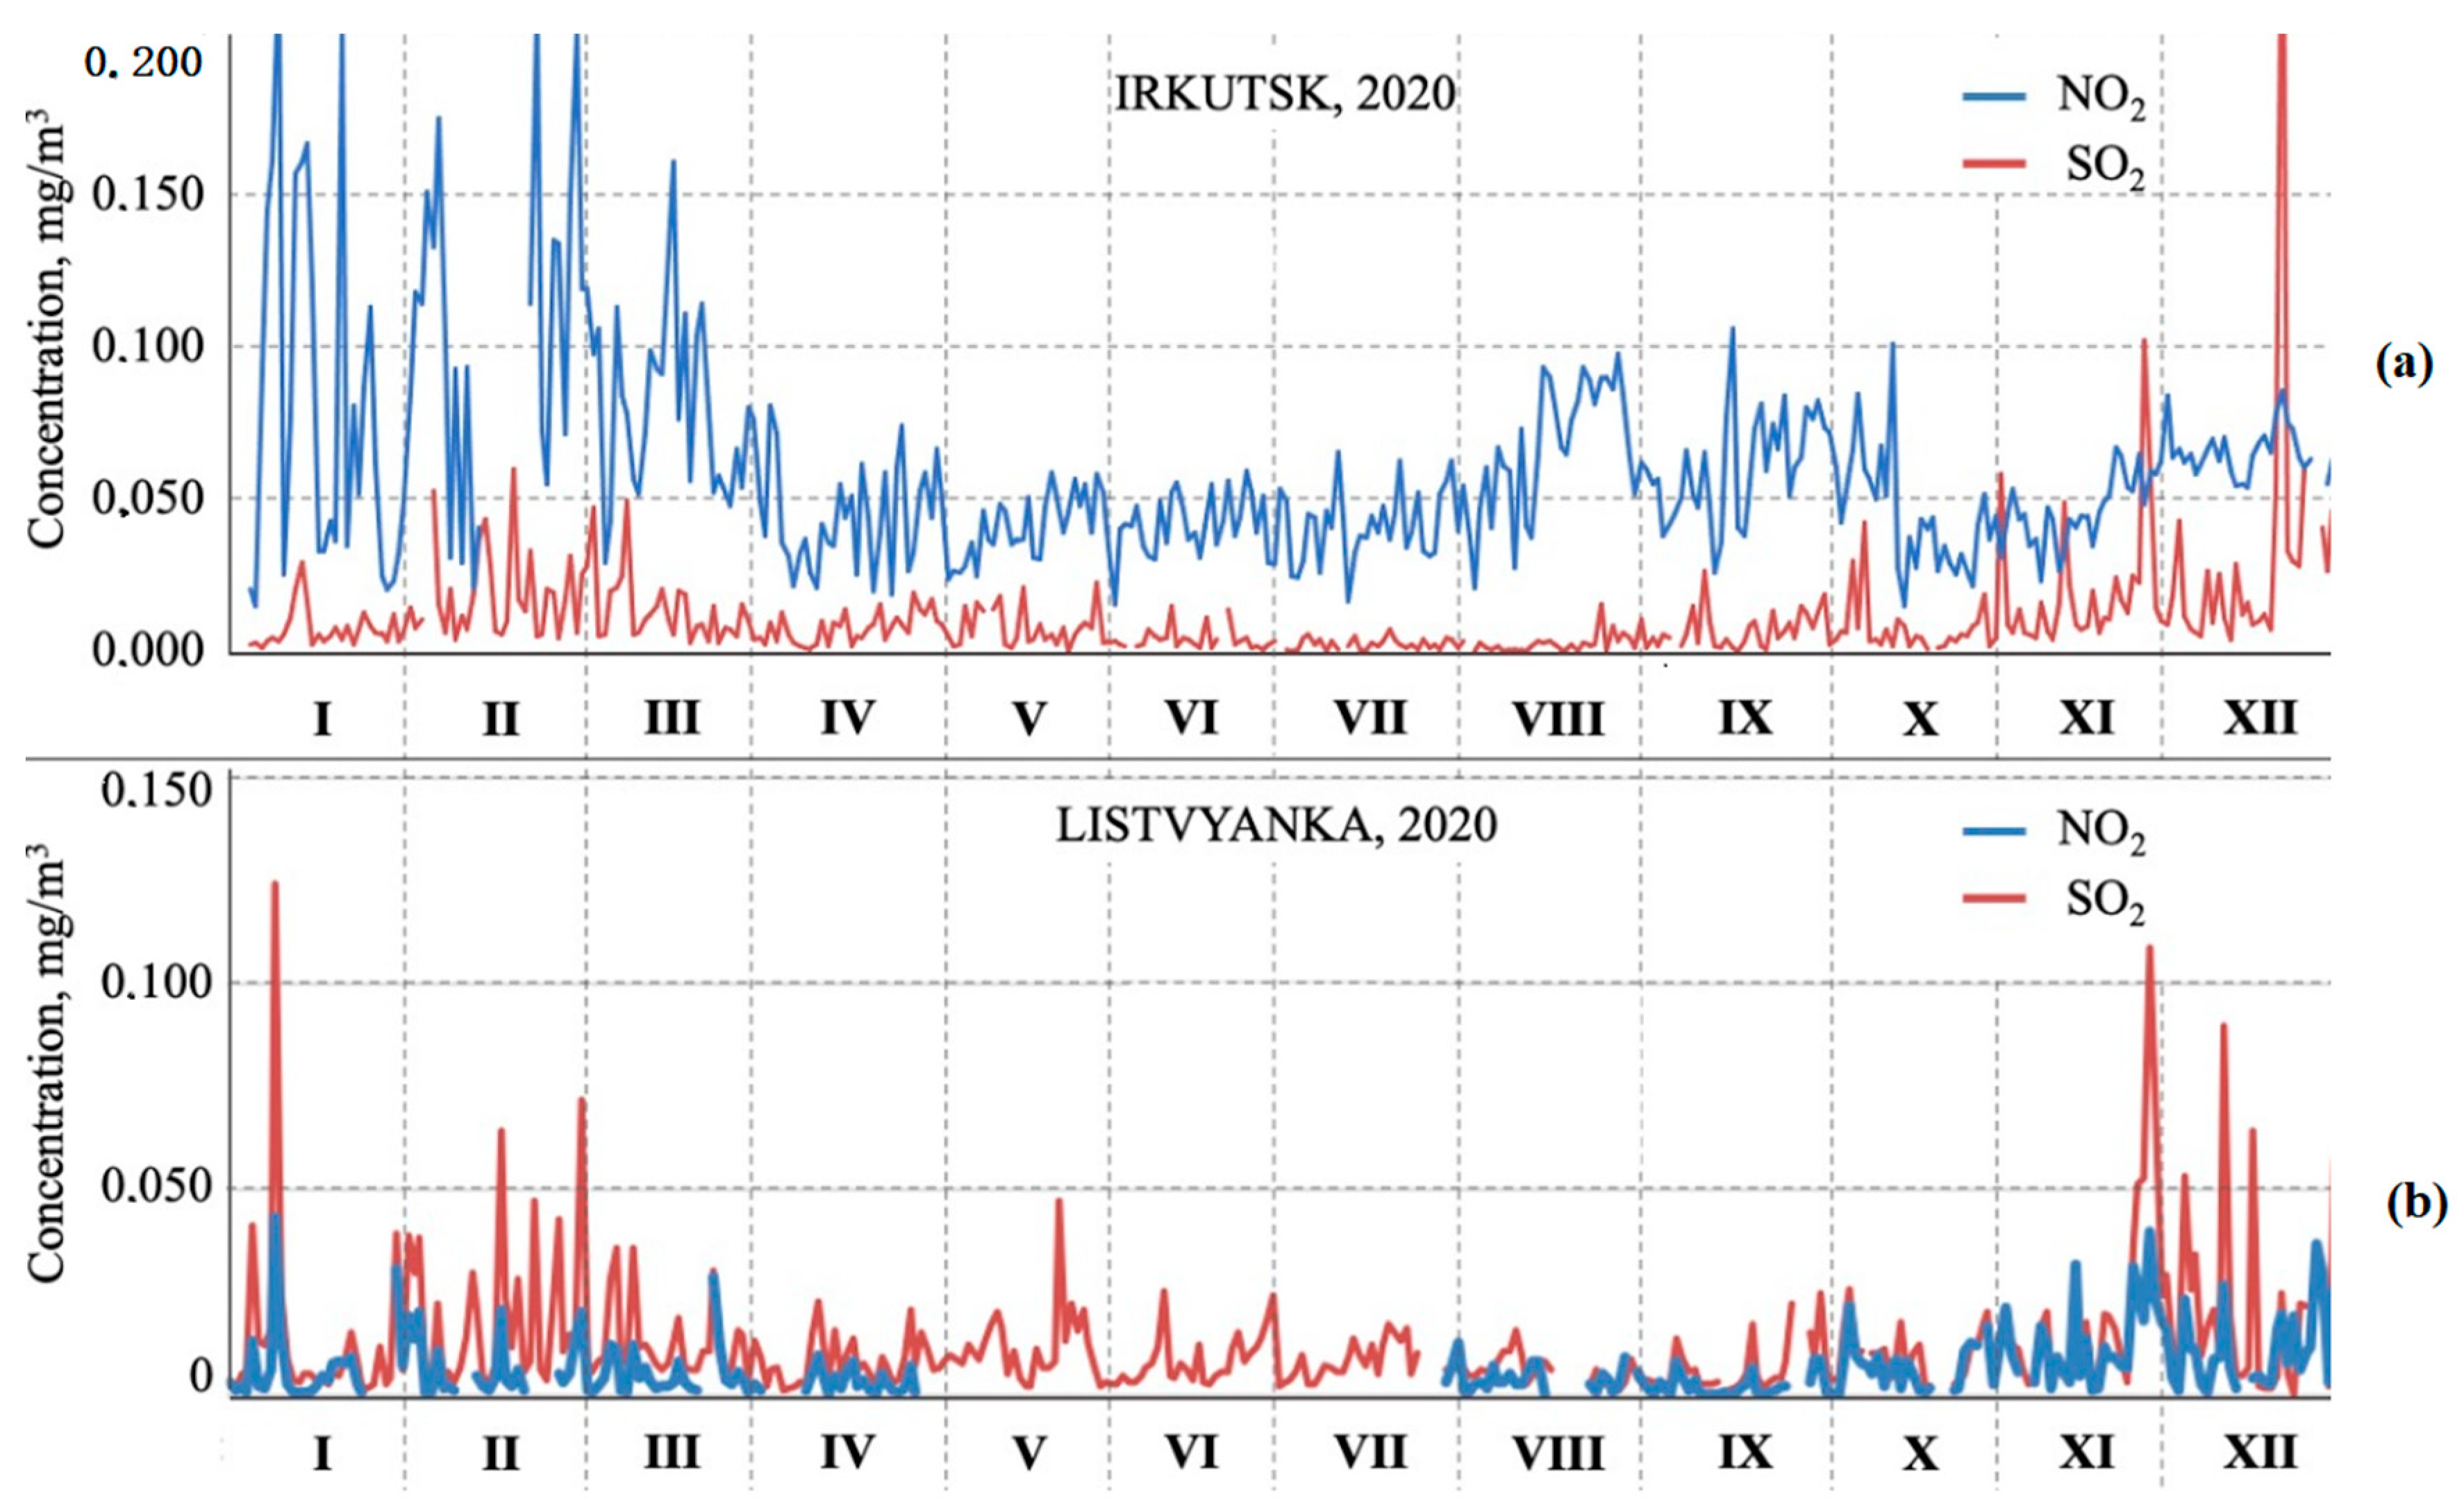
3.1. Transport Processes of Pollutants and Seasonal Variability in Diurnal Concentrations of Sulfur Oxides in the Atmosphere of Lake Baikal and in the Air of Source Cities

Because the emissions from large thermal power plants with high stacks (up to 200 m or more) take place at high altitudes, in addition to synoptic conditions (transport direction), meteorological conditions of the atmospheric boundary layer and its altitude influence the spread of pollution, which vary both during the day and from season to season. Thus, synoptic conditions for the transport of impurities to Lake Baikal in the cold and warm seasons differ significantly. In winter, a cold Mongolian anticyclone is often formed to the southwest of Lake Baikal, and the northwesterly transport from the cities located in the valley of the Angara River toward Lake Baikal prevails along its northeastern periphery (Figure 2a). In summer, the Mongolian anticyclone is practically not formed, and the northwesterly transport to Lake Baikal is much rarer and less intense. The results of trajectory analysis revealed that in 2020, the proportion of air mass transport directly through Listvyanka from the source cities of Irkutsk, Angarsk, and Shelekhov was approximately 28% of the total amount of transport toward the lake (Figure 2b). A significant part of the trajectories can bypass the monitoring area (Listvyanka) to the south or north (more often toward the central basin of the lake). Therefore, the Listvyanka monitoring station records only about a quarter of the real events of transport of air pollution to Lake Baikal.
Figure 3 shows the variability in the average diurnal concentrations of sulfur dioxide and nitrogen dioxide at the Listvyanka station (on the border of Lake Baikal) and one of the automated monitoring stations in Irkutsk. High concentration variability can be seen. The short-term spikes of NO2 and SO2 concentrations are caused by wind directions—by the coming of emission plumes directly at the monitoring point. The seasonal differences (higher in winter and lower in summer) are connected with different emission rates for winter and for summer and also due to the higher stability of the atmospheric boundary layer in winter than in summer. Based on the data from the state-monitoring station in the near-ground air layer, the concentrations of nitrogen dioxide significantly prevail over the concentrations of sulfur dioxide. On the contrary, at the Listvyanka station (on top of the hill), the concentrations of nitrogen dioxide are lower than those of sulfur dioxide, which corresponds to their ratio in emissions from thermal power plants (SO2 about three times higher than NO2 (Table 1)). At the same time, despite the remoteness of the Listvyanka station from Irkutsk, the SO2 concentrations at both sites had, on average, close values (unlike NO2) and similar variability. This may indicate that thanks to the location of the Listvyanka station on the hill, it detects the high-altitude transport of pollution from urban thermal power stations, and the surface layer emissions from urban vehicles and highways do not reach the station.
Correlation analysis of the short-term variability in the concentrations of gaseous pollutants (Table 2) confirms that air pollution in the city is primarily associated with vehicles, and high-altitude emissions from urban thermal power plants are carried away mainly outside the city. Pollutants typical of vehicles, such as СО, NO, and NO2, are well correlated between themselves but are not correlated with SO2, the source of which is high stacks of thermal power plants. In addition, noteworthy is a rather high negative correlation between the variability in СО, NO, and NO2 and the variability in О3, indicating the rapid absorption of ozone by traffic emissions and its deficit in the city, especially in winter. In summer, due to improved ventilation of the atmosphere above the city, these correlations weaken.
The ratio of the SO2/NO2 concentrations at the Listvyanka station (Figure 3b) is close to their ratio in emissions from urban thermal power plants (SO2 > NO2), and they are clearly correlated with each other (r = 0.89). Such impurities as СО and NO (from low-altitude sources) are practically absent at the Listvyanka station during the year. This confirms that at the height of station, long-range transport of sulfur and nitrogen oxides from high stacks of thermal power plants of large cities prevails.
The long-range transport of sulfur oxides and nitrogen oxides to Lake Baikal is so significant that sometimes exceeded average daily maximal permissible concentrations (MPC) of these pollutants are recorded at the Listvyanka monitoring station. For example, during the winter months of 2020, at the Listvyanka station, there were six records of the exceeded average daily MPC for SO2. All these events were associated with the transport of air masses from Irkutsk (and probably other cities), as evidenced by the back-trajectories of the air mass transport (Figure 4). Along the trajectories, there are several cities with large thermal power sources that apparently make a general contribution to air pollution above Lake Baikal.

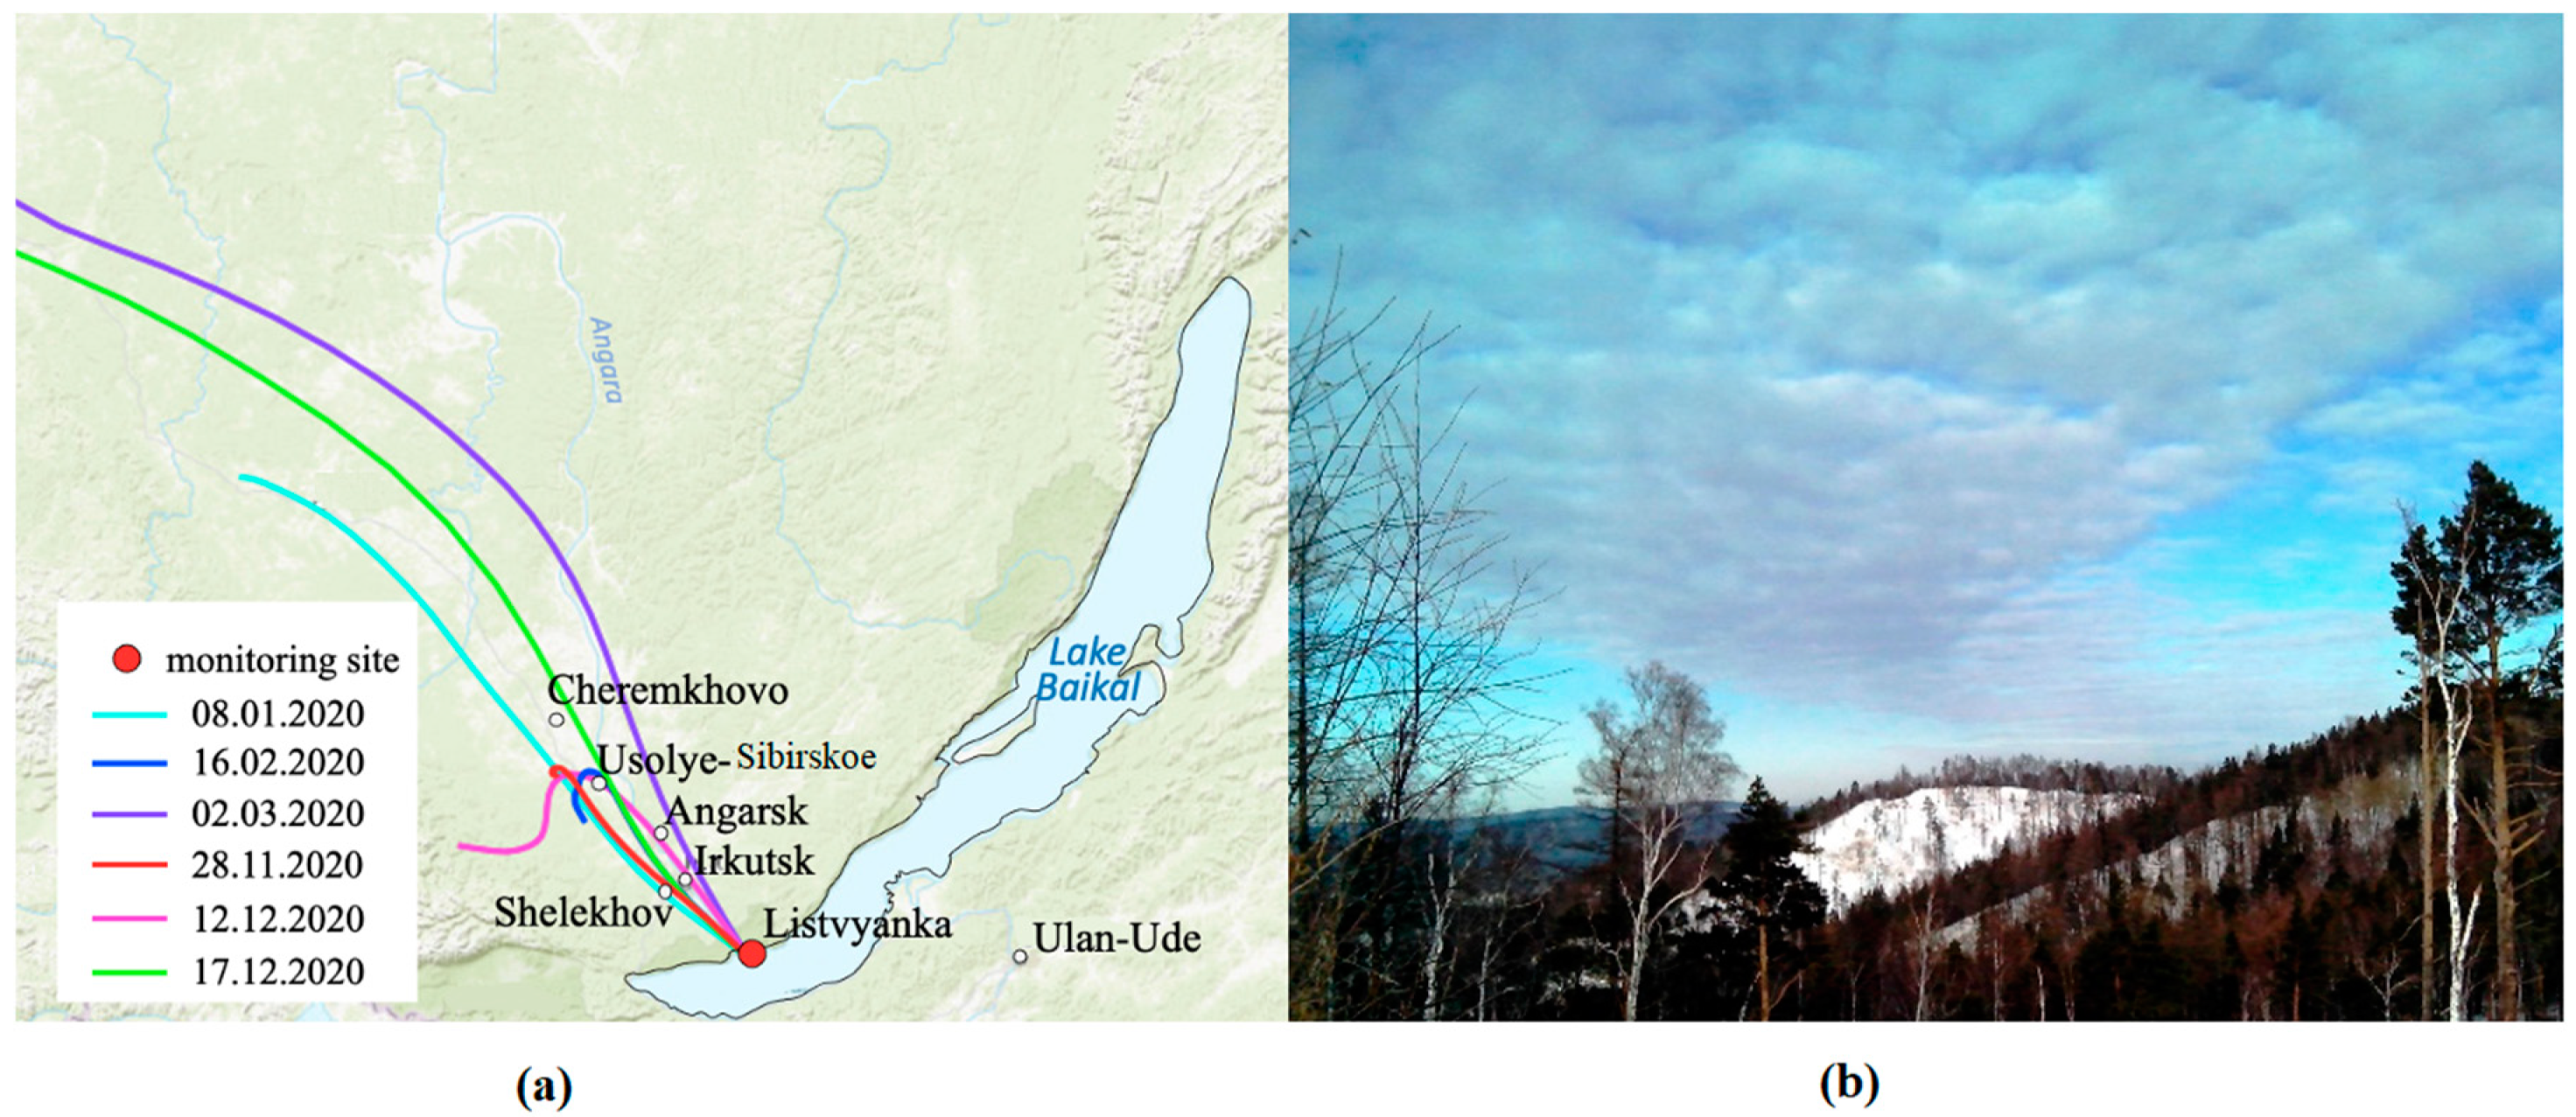
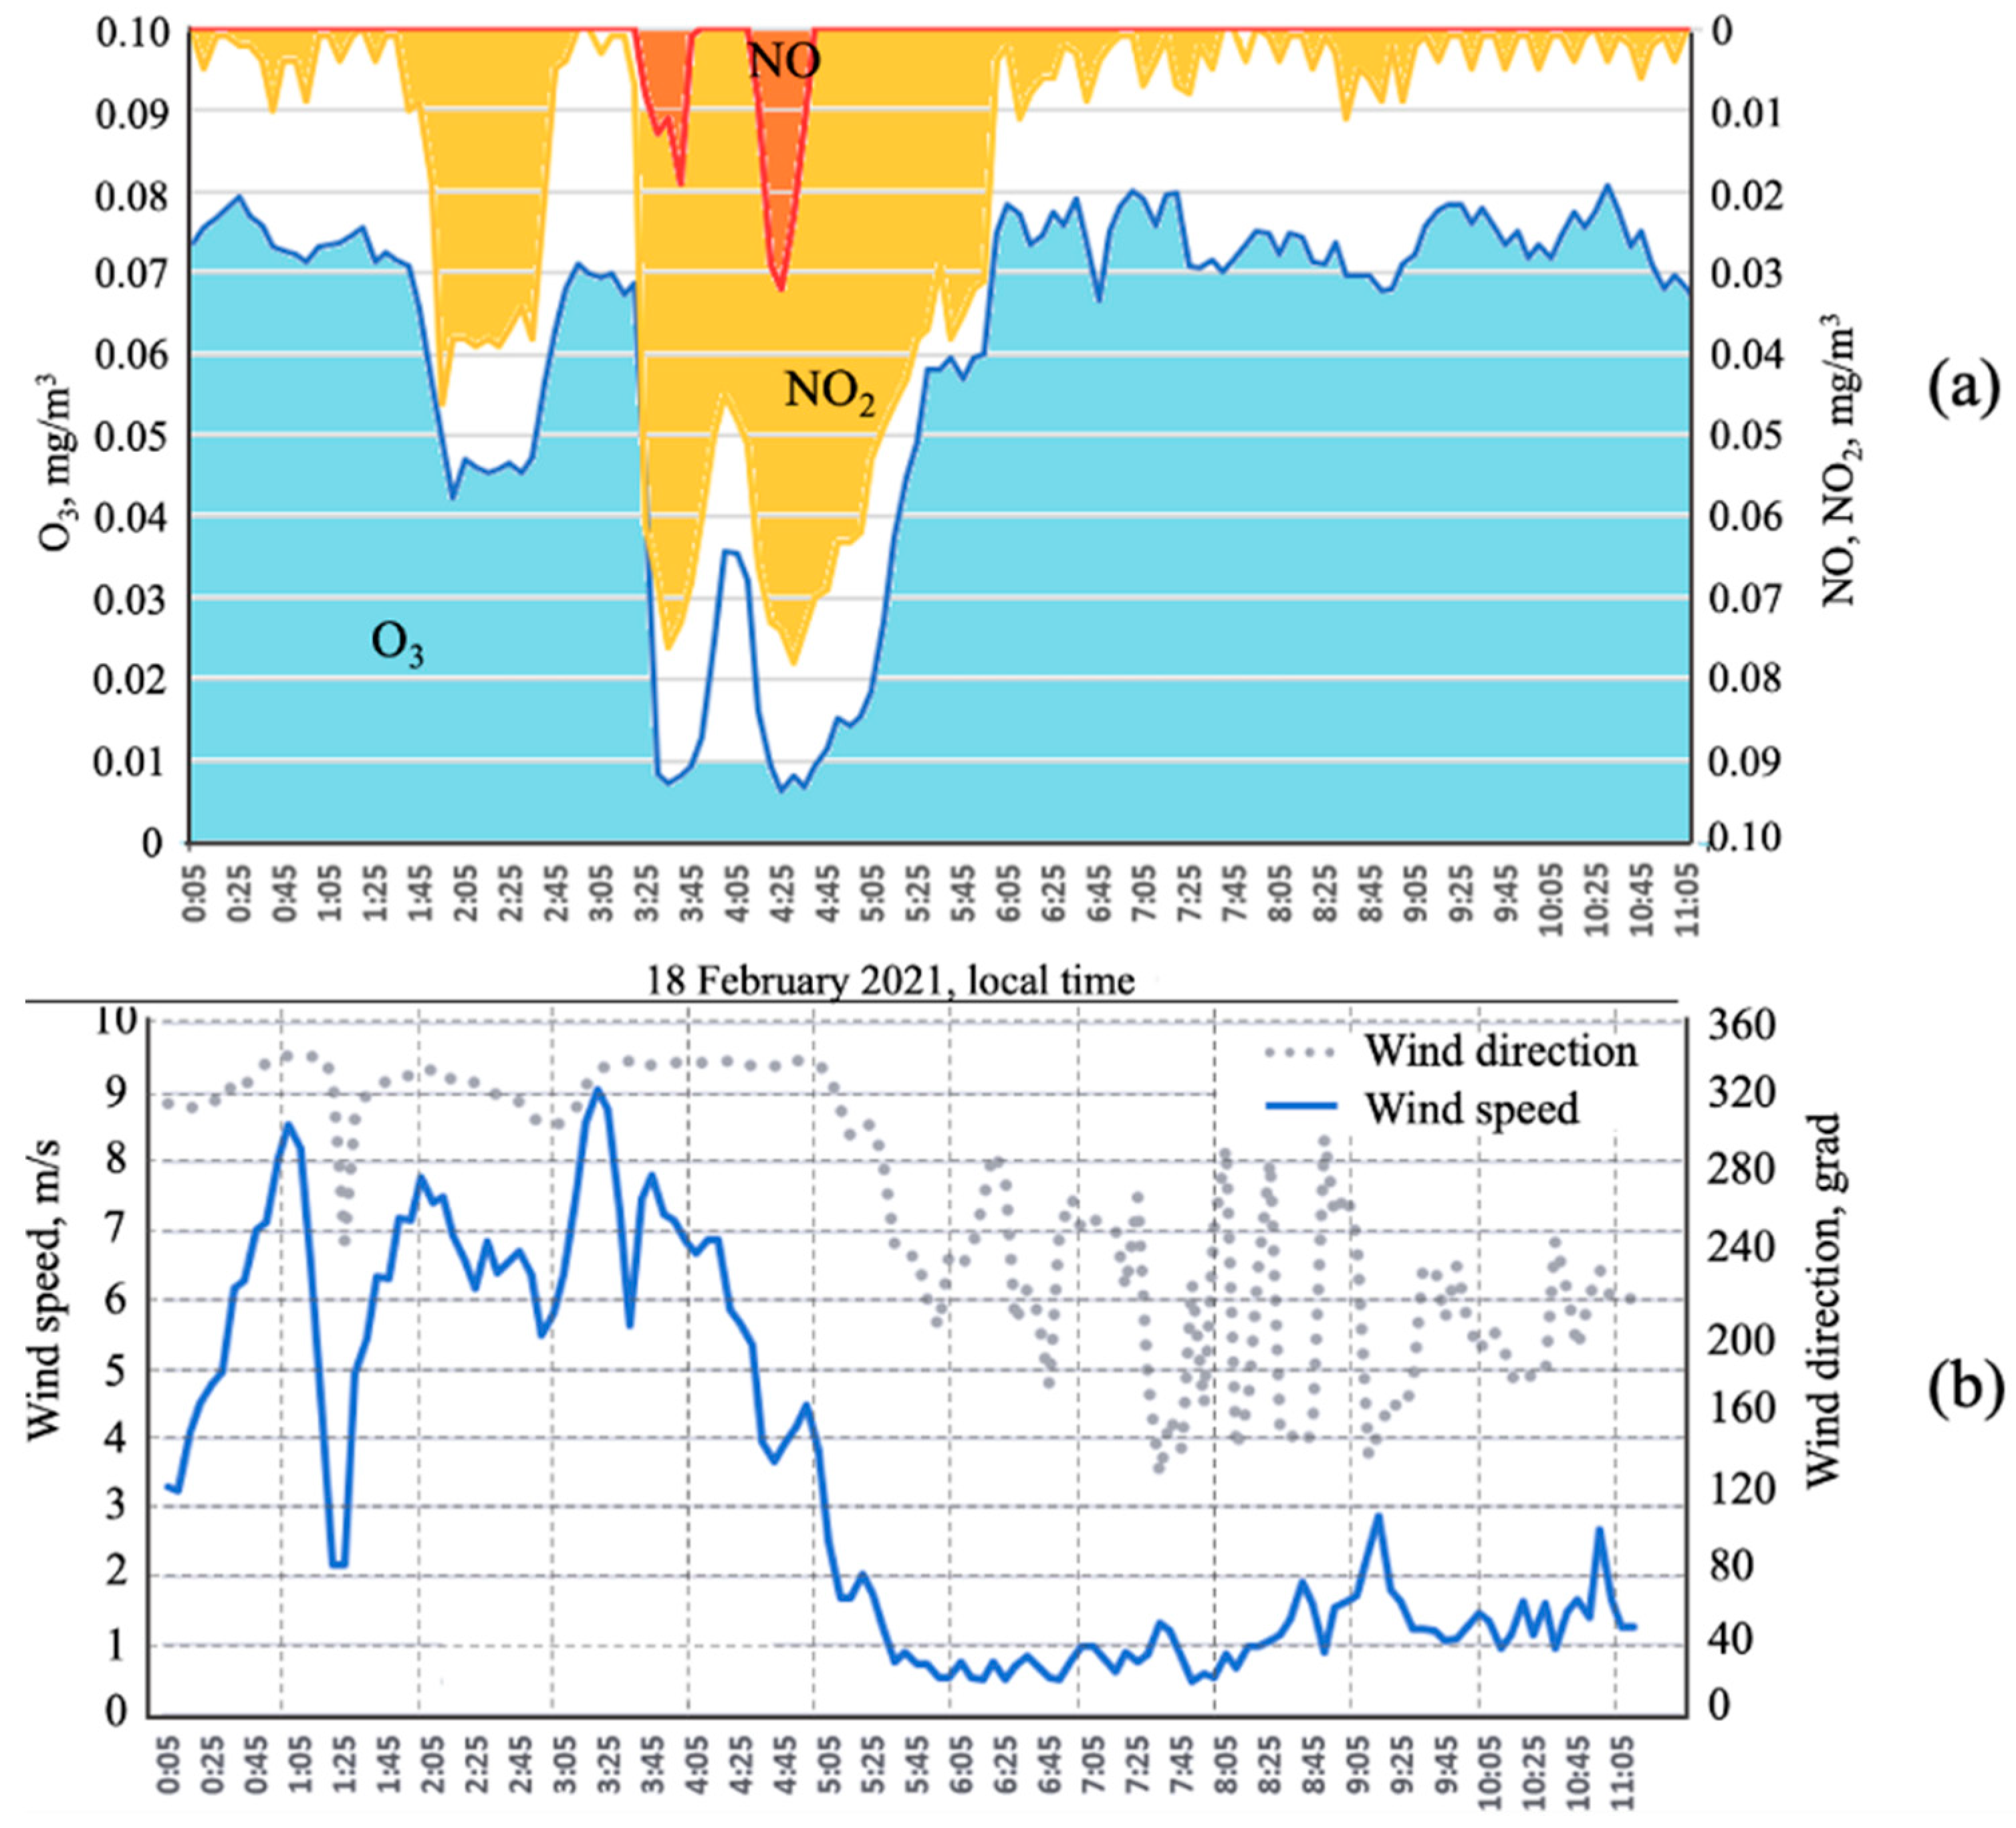
3.2. Short-Term Daily Variations of Air Pollutants Transfers to Lake Baikal and Their Possible Chemical Transformations

The variability in concentrations of air pollutants above Lake Baikal is extremely high depending on meteorological conditions, primarily on the transport direction and stratification of the boundary atmospheric layer, i.e., its dispersion ability. At night and in the morning, the air dispersion is weaker, and the transport of pollutants occurs at a longer distance; during the day, the dispersion is more intense, and the atmosphere is cleared faster. In this regard, the transport of pollution from external sources reaches Lake Baikal in the cold season and at night. As an example, Figure 5 illustrates the event of the nocturnal transport of nitrogen oxides with a plume from thermal power plants above the Listvyanka station on 18 February 2021. The transport occurred at high speed of the northwesterly wind, up to 8–9 m/s, which is one of the indicators of the jet nature of the transport [11,12]. With the arrival of the plume, the concentrations of NO2 increased from 0 to 70–80 μg/m3, which is close to the maximum one-time MPC. Moreover, nitrogen oxides during their transport react with the ambient ozone, causing the formation of secondary pollutants, mainly nitrous acid and nitric acid.

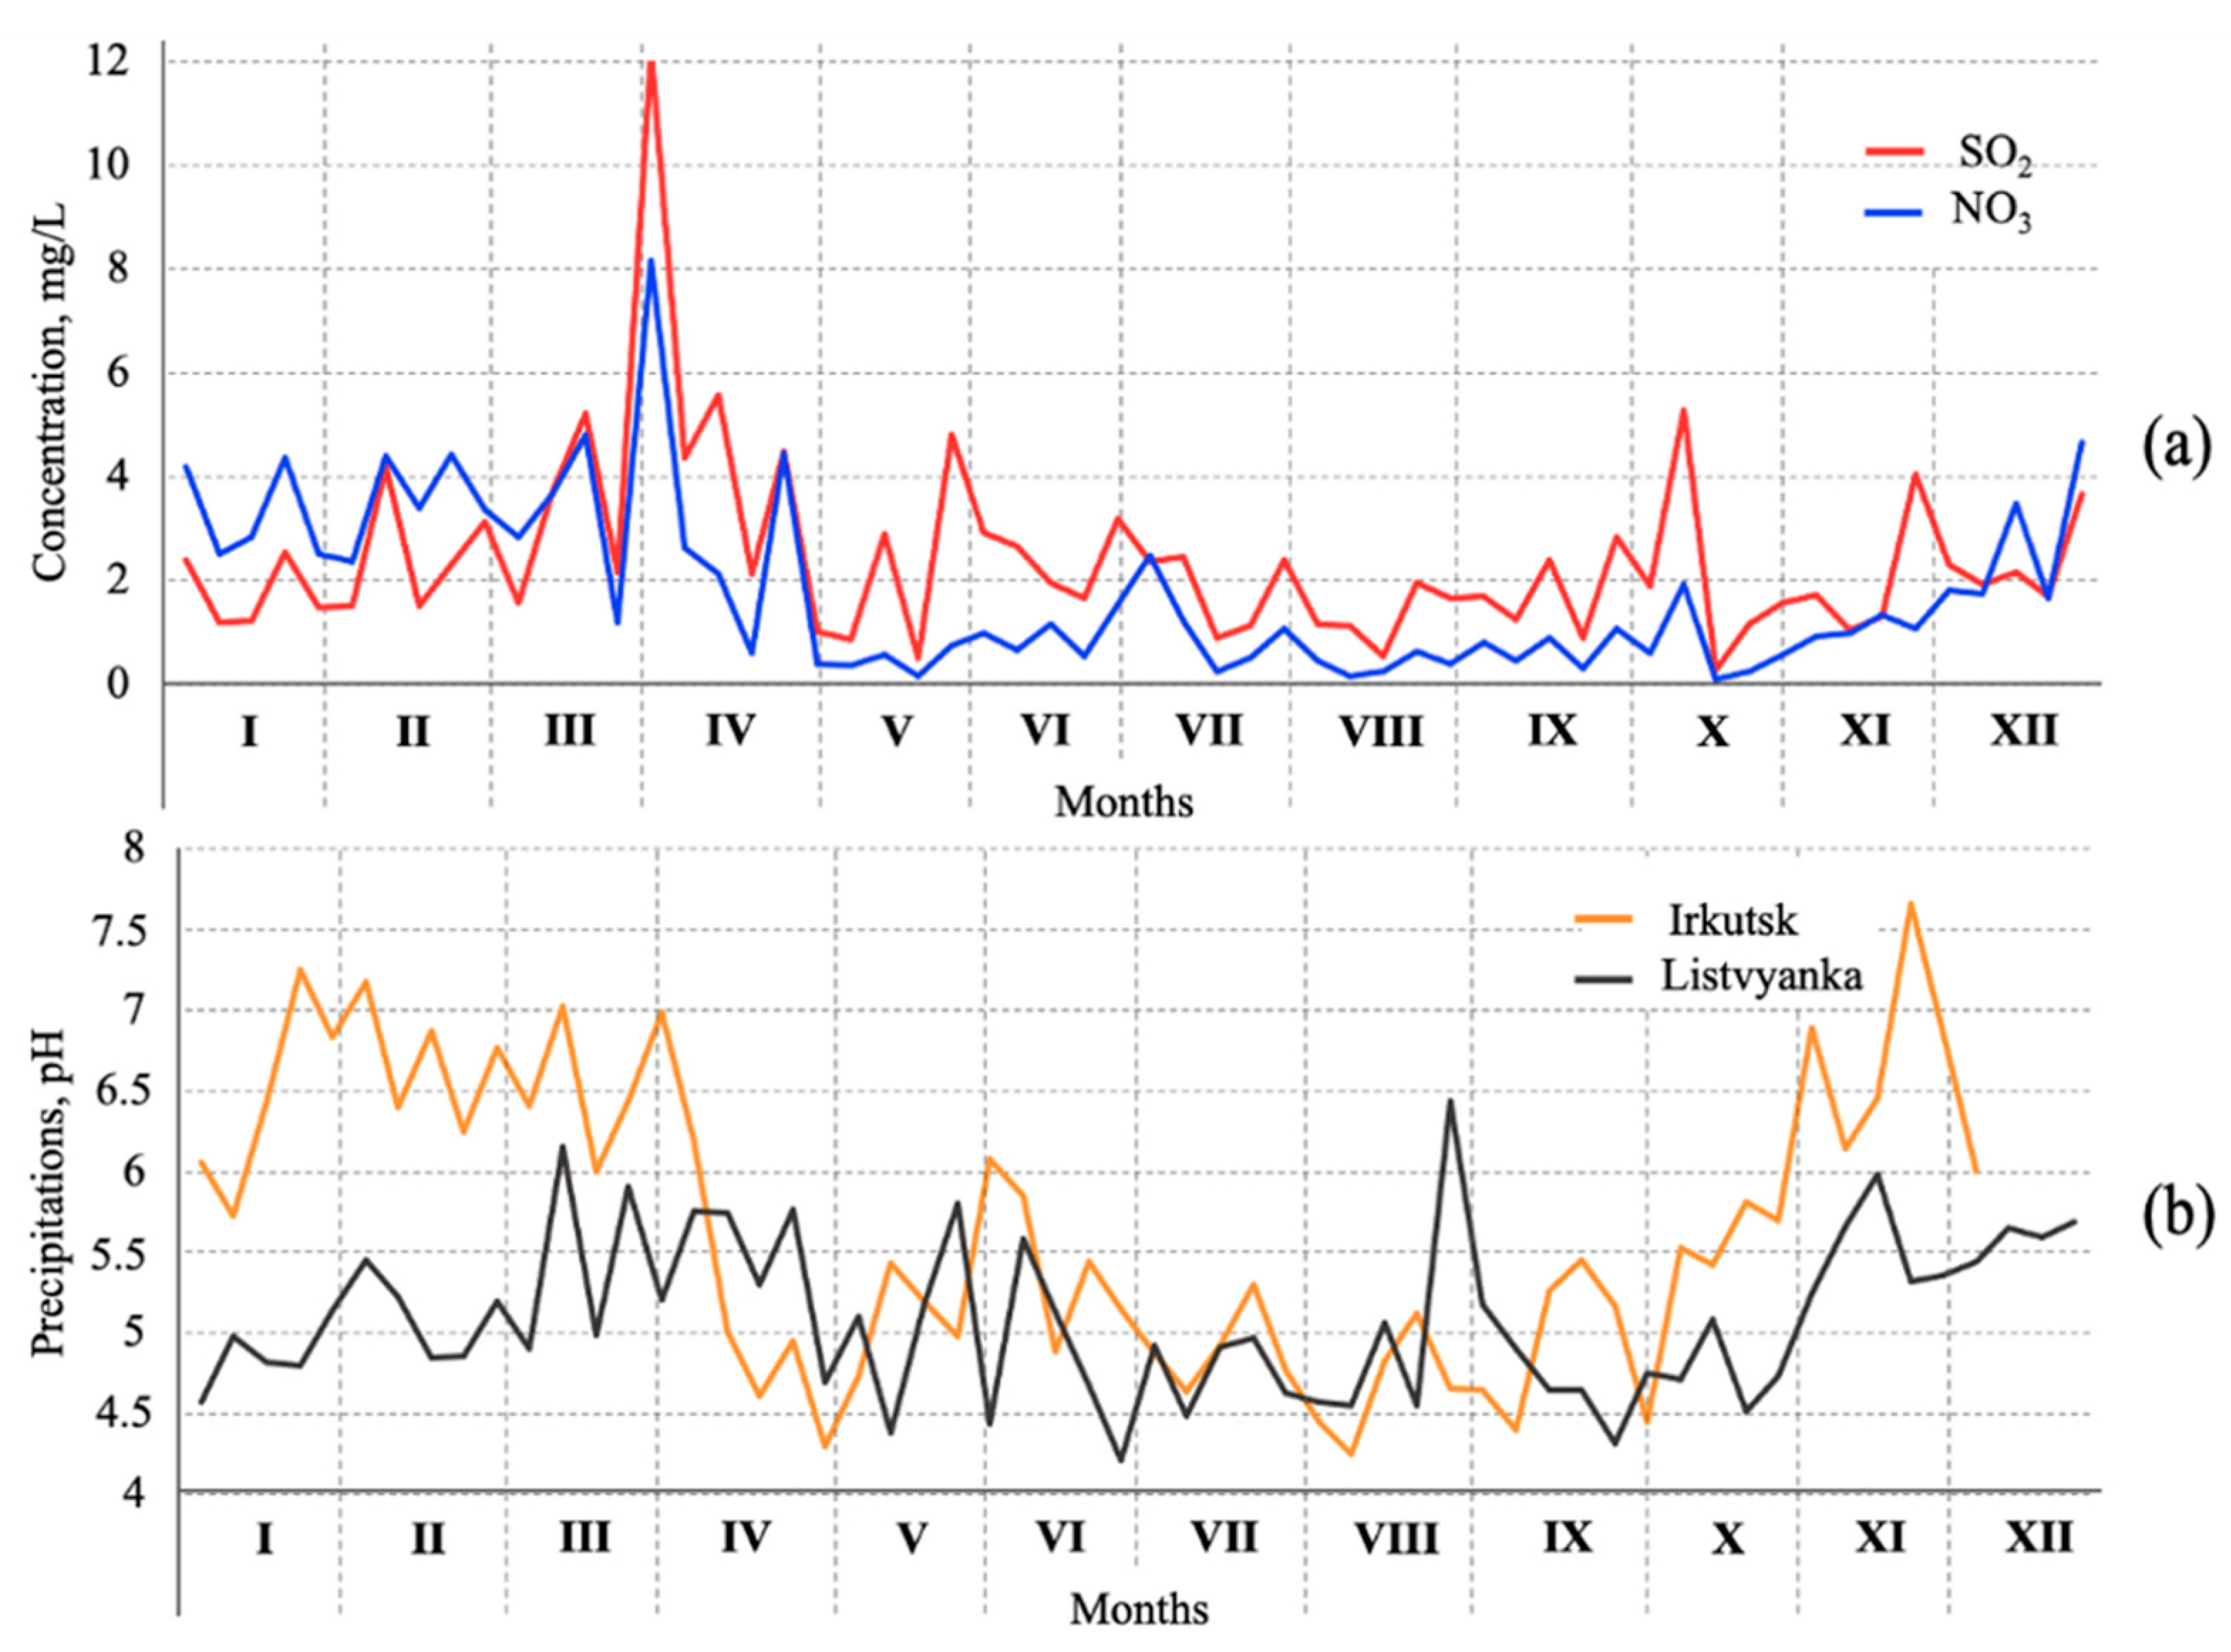
3.3. Influence on the Chemical Composition of Precipitation above the Lake

During transport, air pollution partially is absorbed by water drops and vapor or washed out from the sub-cloud layers with precipitation. Thereby, it can affect not only the quality of the air environment but also the chemical composition of precipitation and surface water in the lake. At the same time, in contrast to river runoff, precipitation falls directly into the upper photic layers of the lake where the primary biological production of the ecosystem is mainly formed. Hence, the role of precipitation in the ecosystems of lakes is higher [5,6] than simply its contribution to the water balance and requires more in-depth research.
The influence of the transport of anthropogenic sulfur and nitrogen oxides on precipitation at Lake Baikal primarily manifests not only as an increase in the acidity of precipitation but also as an additional influx of nutrients to the water of the lake. Table 3 shows the concentrations of major ions in the precipitation of 2020 compared to the composition of surface waters in the lake.
As evidenced by the table, the concentrations of nutrients in precipitation at the Listvyanka station (nitrate nitrogen, ammonium nitrogen, and phosphorus) are many times higher than their concentrations in the lake’s surface water. Furthermore, nitrate nitrogen contains a significant anthropogenic component, especially in the cold season. Therefore, the transport of gaseous sulfur and nitrogen oxides to Lake Baikal from the large coal-fired thermal power plants of the region can affect (through precipitation and dry deposition) the productivity of the surface layers in the lake. Recent field experiments have revealed that rainfall and dry depositions significantly influences the dynamics of the abundance of some algal species in aquatic ecosystems in generally [13] and in the lake Baikal particular [14,15,16].
Acidification of precipitation associated with the transport of anthropogenic sulfur and nitrogen oxides from large industrial centers is a rather well-known and well-studied regional problem in many parts of the world [1,2,3,4]. This suggests that the elevated acidity of precipitation at Lake Baikal is related to the transformation of gaseous sulfur and nitrogen oxides into acid components caused by the reaction with ozone [17]. In winter, the main mechanism of precipitation acidification is the reaction of nitrogen oxides in plumes from thermal power plants with ambient atmospheric ozone, followed by the formation of nitric acid, as shown in Figure 5, where the ozone concentrations drop to zero in response to the growth in the concentrations of NO2 and NO.
Figure 6 shows a seasonal distribution of the concentrations of sulfates and nitrates in precipitation at the Listvyanka station as well as a comparison of pH values in Irkutsk and Listvyanka. During the cold season, the nitrate concentrations in precipitation in Listvyanka prevail over sulfates, and they apparently make the greatest contribution to the acidification of winter precipitation (Figure 6b). During the warm season, the acidity of precipitation at Lake Baikal is probably associated with both nitrates and sulfates. The acidity of precipitation at Lake Baikal is, on average, much higher than in Irkutsk, which has certain risks for the nature surrounding the lake. The problem of precipitation acidification is well known and widely discussed in many publications [18,19]. The current investigations near Lake Baikal reveal that the southern basin of Lake Baikal has the highest acidity of precipitation in the region, much higher than around the source cities themselves [20,21,22,23]. Although the risk for the Lake Baikal water acidification is unlikely due to its huge buffer capacity, there is a real danger of acidification of the lake’s tributaries and soils of coastal forest ecosystems.

4. Conclusions

The data on the high-resolution automatic monitoring of sulfur oxides and nitrogen oxides in the area of the southern basin of Lake Baikal indicate significant air pollution coming through the southwestern border of the lake. The source of this pollution is primarily the regional industrial centers located to the west and northwest of the lake (Irkutsk, Angarsk, and also more distant cities) along the valley of the Angara River, which is open toward Lake Baikal. Small settlements located directly near the lake apparently do not contribute significantly to the pollution of the lake ecosystem, although they may influence air quality in the settlements themselves.
Plumes of emissions from the large regional coal-fired thermal power plants periodically reach the atmosphere of Lake Baikal with the appropriate directions of air mass transport. The transport of pollution to Lake Baikal mainly occurs at altitudes of up to several hundreds of meters and usually in the form of narrow jet streams that can pass through the Listvyanka monitoring station or bypass it in other directions, which must be taken into account during the development of the atmosphere monitoring systems at Lake Baikal.
During the transport from the source cities to Lake Baikal, sulfur oxides and nitrogen oxides transform, forming nitrates (nitric acid) and sulfates. This leads to an increase in acidification of precipitation at Lake Baikal and the additional (anthropogenic) influx of nutrients to the water area of the lake and its basin.

Author Contributions

Conceptualization, V.O. and T.K.; methodology, V.O., E.M. and T.K.; formal analysis, M.S. and V.O.; investigation, V.O. and M.S.; writing—original draft preparation, V.O., E.M. and T.K.; visualization, E.M., V.O. and M.S.; supervision, V.O. and T.K.; funding acquisition, T.K.; chemical analyses of precipitation, O.N. All authors have read and agreed to the published version of the manuscript.

Funding

The results were supported by the Ministry of Science and Higher Education of the Russian Federation (no. 075-15-2020-787) for implementation of the large scientific project “Fundamentals, Methods and Technologies for Digital Monitoring and Forecasting of the Environmental Situation on the Baikal Natural Territory.” Section 2.

Institutional Review Board Statement

Not applicable.

Informed Consent Statement

Not applicable.

Data Availability Statement

The automatic daily monitoring data for Irkutsk are available at the website http://www.feerc.ru/baikal/ru/monitoring/air/ (accessed on 20 August 2021); the database on automatic monitoring data for Listvyanka station is recently designed and will be available later.

Conflicts of Interest

The authors declare no conflict of interest.

References

  1. Campbell, C.W.; Lee, D.S. Atmospheric deposition of sulphur and nitrogen species in United Kingdom. Freshwater Biol. 1996, 36, 151–167. [Google Scholar] [CrossRef]
  2. Fiedler, V.; Nau, R.; Ludmann, S.; Arnold, F.; Schlager, H.; Stohl, A. East Asian SO2 pollution plume over Europe—Part 1: Airborne trace gas measurements and source identification by particle dispersion model simulations. Atmos. Chem. Phys. Discuss. 2009, 9, 4717–4728. [Google Scholar] [CrossRef] [Green Version]
  3. Abrahamsen, G.; Stuanes, A.O.; Tveite, B. Effect of long range transported air pollutants in Scandinavia. Water Qual. Bull. 1983, 8, 89–95. [Google Scholar]
  4. Ionel, I.; Makra, L.; Csépe, Z.; Tusnády, G.; Cercelaru, C.; Ioan Ungureanu, C. Assessment of relationship between meteorological elements and air pollutants load in an urban environment. J. Environ. Prot. Ecol. 2018, 19, 1462–1471. [Google Scholar]
  5. Grennfelt, P.; Engleryd, A.; Forsius, M.; Hov, Ø.; Rodhe, H.; Cowling, E. Acid rain and air pollution: 50 years of progress in environmental science and policy. AMBIO 2019, 49, 849–864. [Google Scholar] [CrossRef] [PubMed] [Green Version]
  6. Netsvetaeva, O.G.; Golobokova, L.P.; Obolkin, V.A.; Khodzher, T.V. Multiyear research of atmospheric deposition: Case study at the Listvyanka monitoring station (Southern Pribaikalye, Russia). In 24th International Symposium on Atmospheric and Ocean Optics: Atmospheric Physics; SPIE: Bellingham, WA, USA, 2018; Volume 10833, pp. 1–6. [Google Scholar]
  7. Vladimir, O.; Tamara, K.; Larisa, S.; Irina, T.; Olga, N.; Ludmila, G. Effect of long-range transport of sulphur and nitrogen oxides from large coal power plants on acidification of river waters in the Baikal region, East Siberia. Int. J. Environ. Stud. 2016, 73, 452–461. [Google Scholar]
  8. Monitoring of Environmental Pollution. Available online: http://www.feerc.ru/baikal/ru/monitoring/air/ (accessed on 20 August 2021).
  9. IUGMS. The State of Atmospheric Air Pollution in Cities on the Territory of the Activity of the FSBI Irkutsk UGMS in 2016. In Yearbook; IUGMS: Irkutsk, Russia, 2017; 100p. [Google Scholar]
  10. Draxler, R.R.; Rolph, G.D. HYSPLIT (Hybrid Single-Particle Lagrangian Integrated Trajectory Model). 2013. Available online: https://www.scienceopen.com/document?vid=3c4d79f1-5098-4dbd-83f3-64a0020f78da (accessed on 21 June 2021).
  11. Cocks, A.T.; Kallend, A.S.; Marsh, A.R.W. Dispersion limitations of oxidation in power plant plumes during long-range transport. Nature 1983, 305, 122–123. [Google Scholar] [CrossRef]
  12. Obolkin, V.A.; Potemkin, V.L.; Makukhin, V.L.; Chipanina, Y.V.; Marinayte, I.I. Low-level atmospheric jets as main mechanism of long-range transport of power plant plumes in the Lake Baikal Region. Int. J. Environ. Stud. 2014, 71, 391–397. [Google Scholar] [CrossRef]
  13. Ventura, A.; Simões, E.; Almeida, A.; Martins, R.; Duarte, A.; Loureiro, S.; Duarte, R. Deposition of Aerosols onto Upper Ocean and Their Impacts on Marine Biota. Atmosphere 2021, 12, 684. [Google Scholar] [CrossRef]
  14. Bondarenko, N.A.; Tomberg, I.V.; Shirokaya, A.A.; Belykh, O.I.; Tikhonova, I.V.; Fedorova, G.A.; Netsvetaeva, O.G.; Eletskaya, E.V.; Timoshkin, O.A. Dolichospermum lemmermannii (Nostocales) bloom in world’s deepest Lake Baikal (East Siberia): Abundance, toxicity and factors influencing growth. Limnol. Freshw. Biol. 2021, 4, 1101–1110. [Google Scholar] [CrossRef]
  15. Obolkin, V.A.; Volkova, E.A.; Ohira, S.I.; Toda, K.; Netsvetaeva, O.G.; Chebunina, N.S.; Nosova, V.V.; Bondarenko, N.A. The role of atmospheric precipitation in the under-ice blooming of endemic dinoflagellate Gymnodinium baicalense var. minor An-tipova in Lake Baikal. Limnol. Freshw. Biol. 2019, 2, 345–352. [Google Scholar] [CrossRef]
  16. Kravtsova, L.S.; Izhboldina, L.A.; Khanaev, I.V.; Pomazkina, G.V.; Rodionova, E.V.; Domysheva, V.M.; Sakirko, M.V.; Tomberg, I.V.; Kostornova, T.Y.; Kravchenko, O.S.; et al. Nearshore benthic blooms of filamentous green algae in Lake Baikal. J. Great Lakes Res. 2014, 40, 441–448. [Google Scholar] [CrossRef]
  17. Khuriganova, O.; Obolkin, V.; Akimoto, H.; Ohizumi, T.; Khodzher, T.; Potemkin, V.; Golobokova, L. Long-Term Dynamics of Ozone in Surface Atmosphere at Remote Mountain, Rural and Urban Sites of South-East Siberia, Russia. Open Access Libr. J. 2016, 3, e2578. [Google Scholar] [CrossRef]
  18. Miller, J.D.; Anderson, H.A.; Harriman, R.; Collen, P. The consequences of liming a highly acidified catchment in central Scotland. Water Air Soil Pollut. 1995, 85, 1015–1020. [Google Scholar] [CrossRef]
  19. Moiseenko, T.I. The determination of the critical loads of acid deposition for surface waters. Water Resour. 2002, 3, 322–328. [Google Scholar]
  20. Semenov, M.Y.; Khodzher, T.V.; Obolkin, V.A.; Domysheva, V.M.; Golobokova, L.P.; Kobeleva, N.A.; Netsvetaeva, O.G.; Potemkin, V.L.; Van Grieken, R.; Fukuzaki, N. Assessing the acidification risk in the lake Baikal region. Chem. Ecol. 2006, 22, 1–11. [Google Scholar] [CrossRef]
  21. Onischuk, N.A.; Netsvetaeva, O.G.; Tomberg, I.V.; Sakirko, M.V.; Domysheva, V.M.; Golobokova, L.P.; Khodzher, T.V. Seasonal dynamics of mineral forms of nitrogen in the rivers, snow cover and precipitation at the southwest coast of the Southern Baikal. Limnol. Freshw. Biol. 2019, 2, 245–252. [Google Scholar] [CrossRef]
  22. Sorokovikova, L.M.; Sinyukovich, V.N.; Netsvetaeva, O.G.; Tomberg, I.V.; Sezko, N.P.; Lopatina, I.N. Chemical composition of snow and river water on the south-eastern coast of Lake Baikal. Meteorol. Hydrol. 2015, 5, 71–83. [Google Scholar]
  23. State Report on «About the State and environmental Protection of the Irkutsk Region in 2019» [Electronic Resource]. 2020. Available online: https://irkobl.ru/region/ecology/doklad/ (accessed on 20 September 2021).
Figure 1. The layout of the monitoring station and the main cities as sources of air pollution. The inset shows a view of the location of the Listvyanka station atop the coastal hill.
Atmosphere 12 01348 g001
Figure 2. The most typical synoptic situation for air mass transport in the winter season (10 December 2020, 00:00 UTC) (a); forward air mass trajectories from Angarsk, Irkutsk, and Shelekhov in 2020 (b).
Atmosphere 12 01348 g002
Figure 3. Average diurnal concentrations of SO2 and NO2 during 2020: (a) in Irkutsk (the Roshydromet data [8]) and (b) at the Listvyanka station (personal data).
Atmosphere 12 01348 g003
Figure 4. Back-trajectories of air transport (250 m) for days with SO2 concentrations in Listvyanka exceeding MPCs (a); an example of an air plume from a remote thermal power plant above the coastal hills near Listvyanka (b) (photo by Obolkin).
Atmosphere 12 01348 g004
Figure 5. An example of high-altitude transport of nitrogen oxides above Listvyanka with a nocturnal jet stream on 18 February 2021: (a) concentrations of O3, NO, and NO2 (reverse order of values on the right scale); (b) wind speed and direction.
Atmosphere 12 01348 g005
Figure 6. Seasonal variation in the concentrations of sulfates and nitrates in precipitation at the Listvyanka station (a) and pH values in precipitation in Irkutsk and Listvyanka (b) in 2020.
Atmosphere 12 01348 g006
Table 1. Annual volumes of air pollutant emissions by the main cities of the region [9].
Main Sources of Air Emission in the RegionEmission, Thousand Tons Per Year (1)
SO2NO2COPM
Irkutsk
(60 km from the lake)
Thermal power plants
Vehicles
40
0.3
10
4.6
4.4
41
7.2
--
Angarsk
(100 km from the lake)
Thermal power plants
Vehicles
90
0.1
14
1.4
7.6
13
20
--
Southern basin of Lake Baikal
(Total emission from all settlements)
2.30.6----
Ulan-Ude
(100 km from the lake)
Thermal power plants
Vehicles
7.6
--
3.0
--
6.2
--
14
--
Gusinoozersk
(70 km from the lake)
Thermal power plants
Vehicles
13
--
11
--
0.8
--
12
--
(1) The accuracy of these data is not specified in the source [9], but it is apparently not higher than 30%.
Table 2. Correlation matrix of 20 min concentrations of gaseous pollutants in Irkutsk.
January (n = 2211)July (n = 2276)
CONONO2SO2O3 CONONO2SO2
CO1.00 CO1.00
NO0.901.00 NO0.681.00
NO20.850.831.00 NO20.240.181.00
SO2−0.11−0.13−0.011.00 SO20.220.080.111.00
O3−0.48−0.40−0.580.081.00O3--------
Table 3. Ionic concentrations in precipitation (2020) at the Listvyanka station and in Lake Baikal water.
PeriodSO42−NO3ClNa+K+Ca2+Mg 2+NH4+PO43−pH
Precipitation in 2020, mg/L
Year2.411.790.240.200.240.770.140.380.035.09
Winter2.963.300.350.320.231.280.200.430.045.24
Summer1.990.770.140.100.270.350.080.340.034.88
Maximum12.208.160.931.371.393.680.612.360.226.44
Minimum0.280.090.010.030.020.020.010.030.004.21
Lake Baikal water (surface), mg/L
Average5.500.500.473.300.9516.13.00.010.018.00
Publisher’s Note: MDPI stays neutral with regard to jurisdictional claims in published maps and institutional affiliations.

