Article

Long-Term Variability of Dust Events in Southwestern Iran and Its Relationship with the Drought

by
Nasim Hossein Hamzeh
1,
Dimitris G. Kaskaoutis
2,3,*,
Alireza Rashki
4 and
Kaveh Mohammadpour
4,5
1
Atmospheric Science & Meteorological Research Center (ASMERC), Tehran 14977-16385, Iran
2
Institute for Environmental Research and Sustainable Development, National Observatory of Athens, 15236 Athens, Greece
3
Environmental Chemical Processes Laboratory, Department of Chemistry, University of Crete, 70013 Crete, Greece
4
Department of Desert and Arid Zones Management, Ferdowsi University of Mashhad, Mashhad 91779-4897, Iran
5
Climate Modeling Laboratory, Department of Sustainability (SSPT-MET-CLIM), Italian National Agency for New Technologies Energy and Sustainable Development (ENEA), 00123 Rome, Italy
*
Author to whom correspondence should be addressed.
Submission received: 26 August 2021 / Revised: 6 October 2021 / Accepted: 12 October 2021 / Published: 15 October 2021

Abstract

:
Dust storms represent a major environmental challenge in the Middle East. The southwest part of Iran is highly affected by dust events transported from neighboring desert regions, mostly from the Iraqi plains and Saudi Arabia, as well as from local dust storms. This study analyzes the spatio-temporal distribution of dust days at five meteorological stations located in southwestern Iran covering a period of 22 years (from 1997 to 2018). Dust codes (06, 07, 30 to 35) from meteorological observations are analyzed at each station, indicating that 84% of the dust events are not of local origin. The average number of dust days maximizes in June and July (188 and 193, respectively), while the dust activity weakens after August. The dust events exhibit large inter-annual variability, with statistically significant increasing trends in all of five stations. Spatial distributions of the aerosol optical depth (AOD), dust loading, and surface dust concentrations from a moderate resolution imaging spectroradiometer (MODIS) and Modern-Era Retrospective analysis for Research and Applications (MERRA-2) retrievals reveal high dust accumulation over southwest Iran and surrounding regions. Furthermore, the spatial distribution of the (MODIS)-AOD trend (%) over southwest Iran indicates a large spatial heterogeneity during 2000–2018 with trends ranging mostly between −9% and 9% (not statistically significant). 2009 was the most active dust year, followed by 2011 and 2008, due to prolonged drought conditions in the fertile crescent and the enhanced dust emissions in the Iraqi plains during this period. In these years, the AOD was much higher than the 19-year average (2000 to 2018), while July 2009 was the dustiest month with about 25–30 dust days in each station. The years with highest dust activity were associated with less precipitation, negative anomalies of the vegetation health index (VHI) and normalized difference vegetation index (NDVI) over the Iraqi plains and southwest Iran, and favorable meteorological dynamics triggering stronger winds.

1. Introduction

Sand and dust storms (SDSs) are meteorological phenomena that are triggered due to turbulent wind enabling to remove loose sand and dust from exposed dry top soil in arid and semi-arid areas, causing movement of sand dunes or airborne dust [1,2,3,4,5]. SDSs have major and multiple economic, health, and environmental impacts causing respiratory infections and diseases [6,7,8,9,10]. The SDSs paths include trajectories of Aeolian dust particles transported to deposition areas from a primary source that is often far away, travelling over oceans and continents [11,12,13,14]. Removal of fertile top sediments may increase soil salinity with deleterious effects on agriculture [15,16,17,18], while dust deposition can also affect terrestrial and oceanic biochemical cycles and distress forests and agriculture productivity, thus increasing food production costs [19,20,21]. The SDSs also contain iron, a limiting nutrient in the marine environment, so when dust is deposited onto the sea, it can act as a fertilizer for the growth of phytoplankton or algae [22,23]. The rates of fluvial and Aeolian erosion may be of a similar magnitude to rates of Aeolian deposition resulted from SDSs [24]. Poor visibility and sand encroachment, as a result of SDS, increase incidence of road accidents and aviation hazards, and disrupt supply chain infrastructures, communication, and transportation [25]. Overall, the SDSs affect the whole climate system and can cause changes in the earth’s radiation balance and drought intensification [26,27,28,29].
The frequency and intensity of SDS have increased during the last few decades in some desert areas, as a result of human intervention and climate change, thus posing a main challenge to accomplish sustainable development in the affected regions [30]. This increasing trend in dust activity is especially important in the Middle East during the last two decades [31,32,33,34,35,36]. Factors that facilitate this increasing trend include intensified land degradation and increased soil disturbance, desertification, and climate change [37,38,39], which are associated with socioeconomic impacts and triggering a feedback cycle of environmental degradation [40,41,42]. This necessitates control measures and strategies in a way to prevent soil erosion at local and regional scales. In the Middle East, green belts and native plants have contributed to the reduction in the annual rates of mobile sand by 95.3% and 94%, and deposited dust by 68.4% and 64.5%, respectively [43,44]. Native plants play a major role in controlling saltation and suspension of sand and dust particles [45,46], while greenery areas also pose a negative feedback of dust emissions [47,48,49].
Methods for identification of dust sources can be divided into four general groups including (i) mineral dust sampling; (ii) satellite remote sensing techniques; (iii) horizontal visibility records; and (iv) backward trajectory analysis [50,51,52]. In the Middle East and southwest part of Iran, SDSs occur throughout the year but with higher frequency and intensity in spring and summer [52,53,54]. Past and recent studies have provided useful insights about interrelations, triggering forces and weather clusters between synoptic meteorology and dust activity over the region [55,56,57,58,59,60,61,62,63,64]. Certain synoptic meteorological conditions associated with high- and low-pressure systems, strong frontal or synoptic wind speeds, low soil moisture, and reduced wet scavenging via precipitation facilitate frequent and intense SDS, as shown from surface measurements and satellite remote sensing [65,66,67,68,69]. Al-Jumaily and Ibrahim [70] analyzed the synoptic conditions of several dust storms over Iraq, while Mashat and Awad [71] studied the synoptic characteristics of the autumn dust storms in northern Saudi Arabia. Later on, Mashat et al. [72] investigated the dynamic and synoptic situations of spring dust storms over northern Saudi Arabia. Namdari et al. [63] examined the impact of meteorological dynamics on dust activity in the Middle East, highlighting the influence of turbulence and upper atmosphere winds in intensifying the surface winds and dust emissions.
The southwest (SW) part of Iran is the area most affected by dust storms, along with the Sistan Basin, recording the highest number of dust days throughout the year [52,73]. The largest city in this region, Ahvaz, is among the five most polluted cities worldwide in terms of particulate matter below 10 μm (PM10) concentrations due to high frequency of dust events, imposing deleterious effects on environment, agriculture, aviation, industrial activity, culture, and public health [74,75,76]. Major sources of dust that affect SW Iran include the Sahara Desert and deserts in Iraq, Saudi Arabia, and Kuwait [77,78,79,80]. Dried marshy regions between the Tigris and Euphrates rivers are the most effective dust-emitting sources impacting SW Iran [52,54,81,82,83].
Temporal evolution, intra-seasonal to inter-annual variation, and long-term trends in SDS have a great importance in the desert/arid regions and in affected areas, such as the East Mediterranean–Middle East (EMME) region [35,84,85,86]. In this study, statistical analysis of dust events is performed at the five most polluted cities in SW Iran covering a period of 22 years (from 1997 to 2018). The study analyzes the spatio-temporal evolution of dust days, seasonality, long-term variation, as well as the factors associated with short- and long-term trends in dust activity. Although previous studies have analyzed the long-term variability of dust events over SW Iran [52,87,88,89], the current work provides a comprehensive analysis combining ground measurements at five stations with satellite and re-analysis observations and regional meteorology, and also differentiates the local and regional dust events.

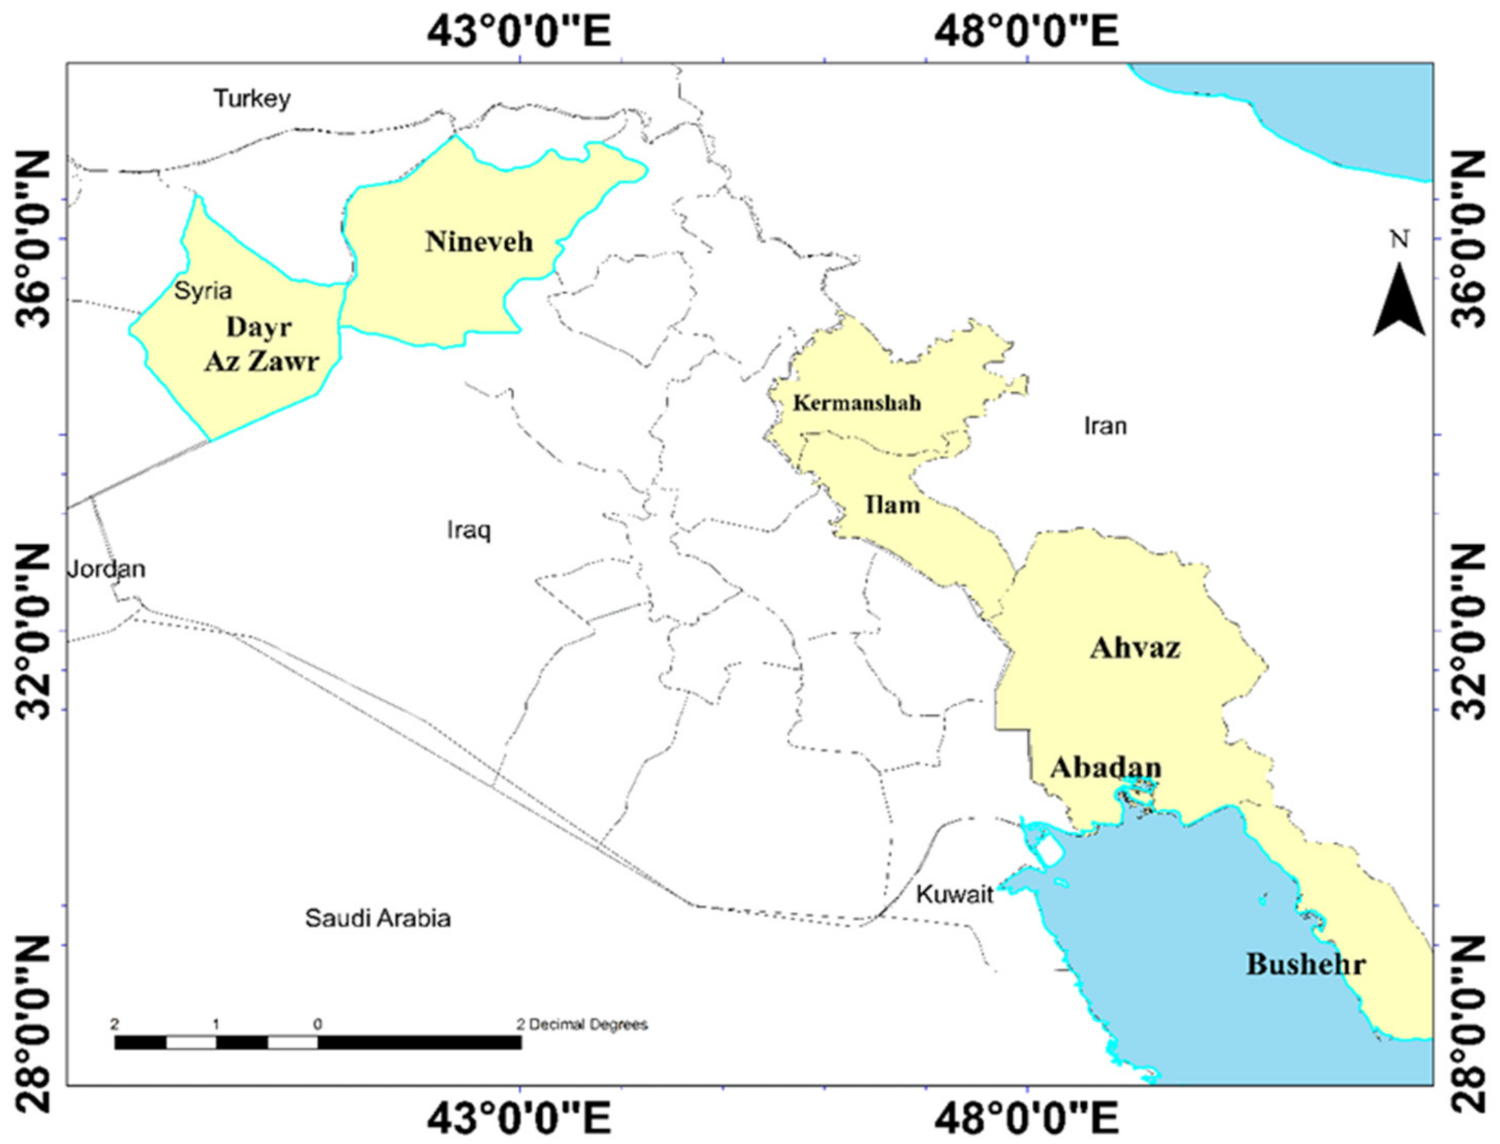
2. Study Area and Dust Storms

The examined study area in SW part of Iran includes four Iranian provinces, namely Khuzestan, Bushehr, Ilam, and Kermanshah [87]. The five most dust-affected cities in these provinces were selected for the analysis, namely Ahvaz and Abadan in the Khuzestan province, Bushehr in the coastal plain of the Persian Gulf (located in the middle of the Bushehr province), and Ilam and Kermanshah located in the homonymous provinces (Figure 1; Table 1). Ahvaz (48°68′ E, 31°32′ N; 18 m asl) is one of the largest cities in Iran with a population of about 1,112,000 habitats and an area of ~530 km2 [77]. It is one of the dustiest large cities in the world and the World Health Organization (WHO) ranked it as the world’s most air-polluted city in 2011 in terms of PM10 concentrations [90,91]. Maximum and minimum PM10 concentrations in Ahvaz were detected in July (>400 μg m−3) and January (~150 μg m−3), respectively [74]. The weather in Ahvaz is very hot and humid, with temperatures up to 50 °C and relative humidity (RH) close to saturation point during summer. The city suffers from frequent and intense dust storms all year round with higher frequency in spring and early summer [52,92]. Abadan exhibits mostly similar meteorological conditions with Ahvaz and high dust loading throughout the year.
Kermanshah city is located near to Zagros mountainous range (34.3° N, 47.5° E and 1350 m asl) with population of about 1 million. Dust storms mostly from the Iraqi deserts affect the city and sometimes reduce visibility to less than 1 km [93,94]. The annual average PM10 concentrations in Kermanshah is 229 μg m−3 and the city is among the most polluted in the Middle East [95]. In recent years, some dust sources were also activated near the city. Dust storms originated from the deserts in Iraq and Syria also affect Ilam city, located west of the Zagros Mountains [96,97]. Karimi et al. [95] also analyzed dust storms in Ilam and the performance of six numerical models for dust simulation during a severe dust storm over the area.
The city of Bushehr is located in the northern shore of the Persian Gulf in southwest part of Iran (29° N and 51° E). The annual rainfall in the city is low (about 268 mm) and its climate is warm and semi-desert. The prevailing wind direction is from south to north, thus facilitating dust plumes coming from the Arabian Peninsula. Keshavarzi et al. [98] examined the levels, source apportionment, and health risks of polycyclic aromatic hydrocarbons (PAHs) from street dust samples in Bushehr, indicating large effects from the deserts and considerable health risk.

3. Data Set and Methodology

In this study, the annual frequency of dust events is analyzed at five polluted cities in the southwestern part of Iran during the period 1997–2018. Table 1 includes the longitude, latitude, elevation, and the total number of dust days at the meteorological stations in each city. For the determination of the dust events/days, three-hour recordings (8 times a day) of the synoptic codes (06, 07, 30 to 35) related to dust were used at the meteorological stations. For the consideration of a dust day, at least one daily observation should include a dust code.
The synoptic code 06 shows widespread dust in suspension, which is not raised by wind at or near the station, indicating non-local dust. Code 07 indicates dust or sand raised by wind near the station, thus mostly corresponding to local dust events [99], while the codes 30–35 were very rare in all stations. Codes 30–32 indicate slight or moderate SDS, while intense or severe SDS correspond to codes 33–35 [89]. The analysis of the frequency and seasonality of the dust events was initially performed separately for the synoptic codes that represent different intensity of the dust events.
In addition, weekly vegetation health index (VHI) data from 2000 to 2016 were taken from the Center for Satellite Applications and Research (STAR; 4 km resolution) in the Ninawa (Nineveh) province of Iraq and the Dier-ez-Zur province of Syria (Figure 1), which are known for frequent dust emissions that strongly impact the west part of Iran [100,101].
VHI is an indicator for estimating the vegetation health and is provided from the advanced very high-resolution radiometer (AVHRR) NOAA sensor. This index is based on the properties of vegetation in absorbing and reflecting sunlight. In non-drought years, green plants reflect little visible light due to the absorption of sunlight by chlorophyll, and most of their radiation is due to the diffusion of infrared light by the inner fibers of the leaves and the water inside them. There is a big difference in reflectance between the visible and infrared spectrum, which indicates that the vegetation is green and abundant. In drought years, due to the decrease in chlorophyll and water content of plants, the reflection of visible light increases and the infrared light decreases [79]. Therefore, VHI is based on reflection and absorption of solar visible and infrared radiations and is calculated using the following formula:
VHI = a × VCI + 1 a × TCI
where:
VCI   = 100 NDVI NDVImin / NDVImax     NDVImin TCI   = 100 BTmax BT / BTmax BTmin
where a = 0.5 (combinations of vegetation condition index (VCI) and temperature condition index (TCI) as possible predictors of crop yield). BT is brightness temperature. All three indices are scaled to range from 0 (severe vegetation stress) to 100 (exceptionally favorable conditions). Furthermore, Terra Moderate Resolution Imaging Spectroradiometer (MODIS) for monthly normalized difference vegetation index (NDVI) with a spatial resolution of 0.05 degrees was analyzed over the study region from 2000 to 2018. NDVI is given by the formula:
NDVI = NIR RED / NIR + RED
and corresponds to spectral reflectance measurements in Red (0.620–0.670 μm) and NIR (0.841–0.876 μm) wavelength bands. NDVI varies between −1 and 1. The higher vegetation corresponds to positive and closer to 1 NDVI values, since plants and vegetated areas reflect the visible light less than the infrared one.
Furthermore, level 3 (1° × 1° spatial resolution) Terra-MODIS AOD550 values from collection C6.1 were used over the Middle East from 2000 to 2018, downloaded from the Giovanni visualization tool (https://giovanni.gsfc.nasa.gov, accessed on 2 October 2021). While, MODIS-AOD550 values in level 2 (0.1° × 0.1° spatial resolution) were also used at a small domain over SW Iran (46°–51° E and 30°–35° N) during the same time frame. For the spatial AOD distribution the “Dark_Target and Deep_Blue_AOD_550_Combined” (DTDB) MODIS retrievals were used [102,103]. Furthermore, spatial distribution and time series of several atmospheric parameters, such as AOD550, dust loading, dust surface concentration, and dry and wet dust deposition, were taken over the study region from the Modern-Era Retrospective analysis for Research and Applications (MERRA-2) re-analysis database, 5.12.4 model, at a horizontal resolution of 0.5° × 0.625° (latitude, longitude) [104,105]. MERRA-2 has been proved as an accurate database for monitoring of dust aerosols, spatial variability, and trends over the Middle East, exhibiting considerable agreement with MODIS observations [35,86]. Moreover, ERA-5 reanalysis [106], with a 31-km horizontal resolution and 137 levels spanning from the surface of the Earth to 0.01 hPa, was used to obtain meteorological fields of surface vector winds at 0.75° × 0.75° spatial resolution.

4. Results and Discussion

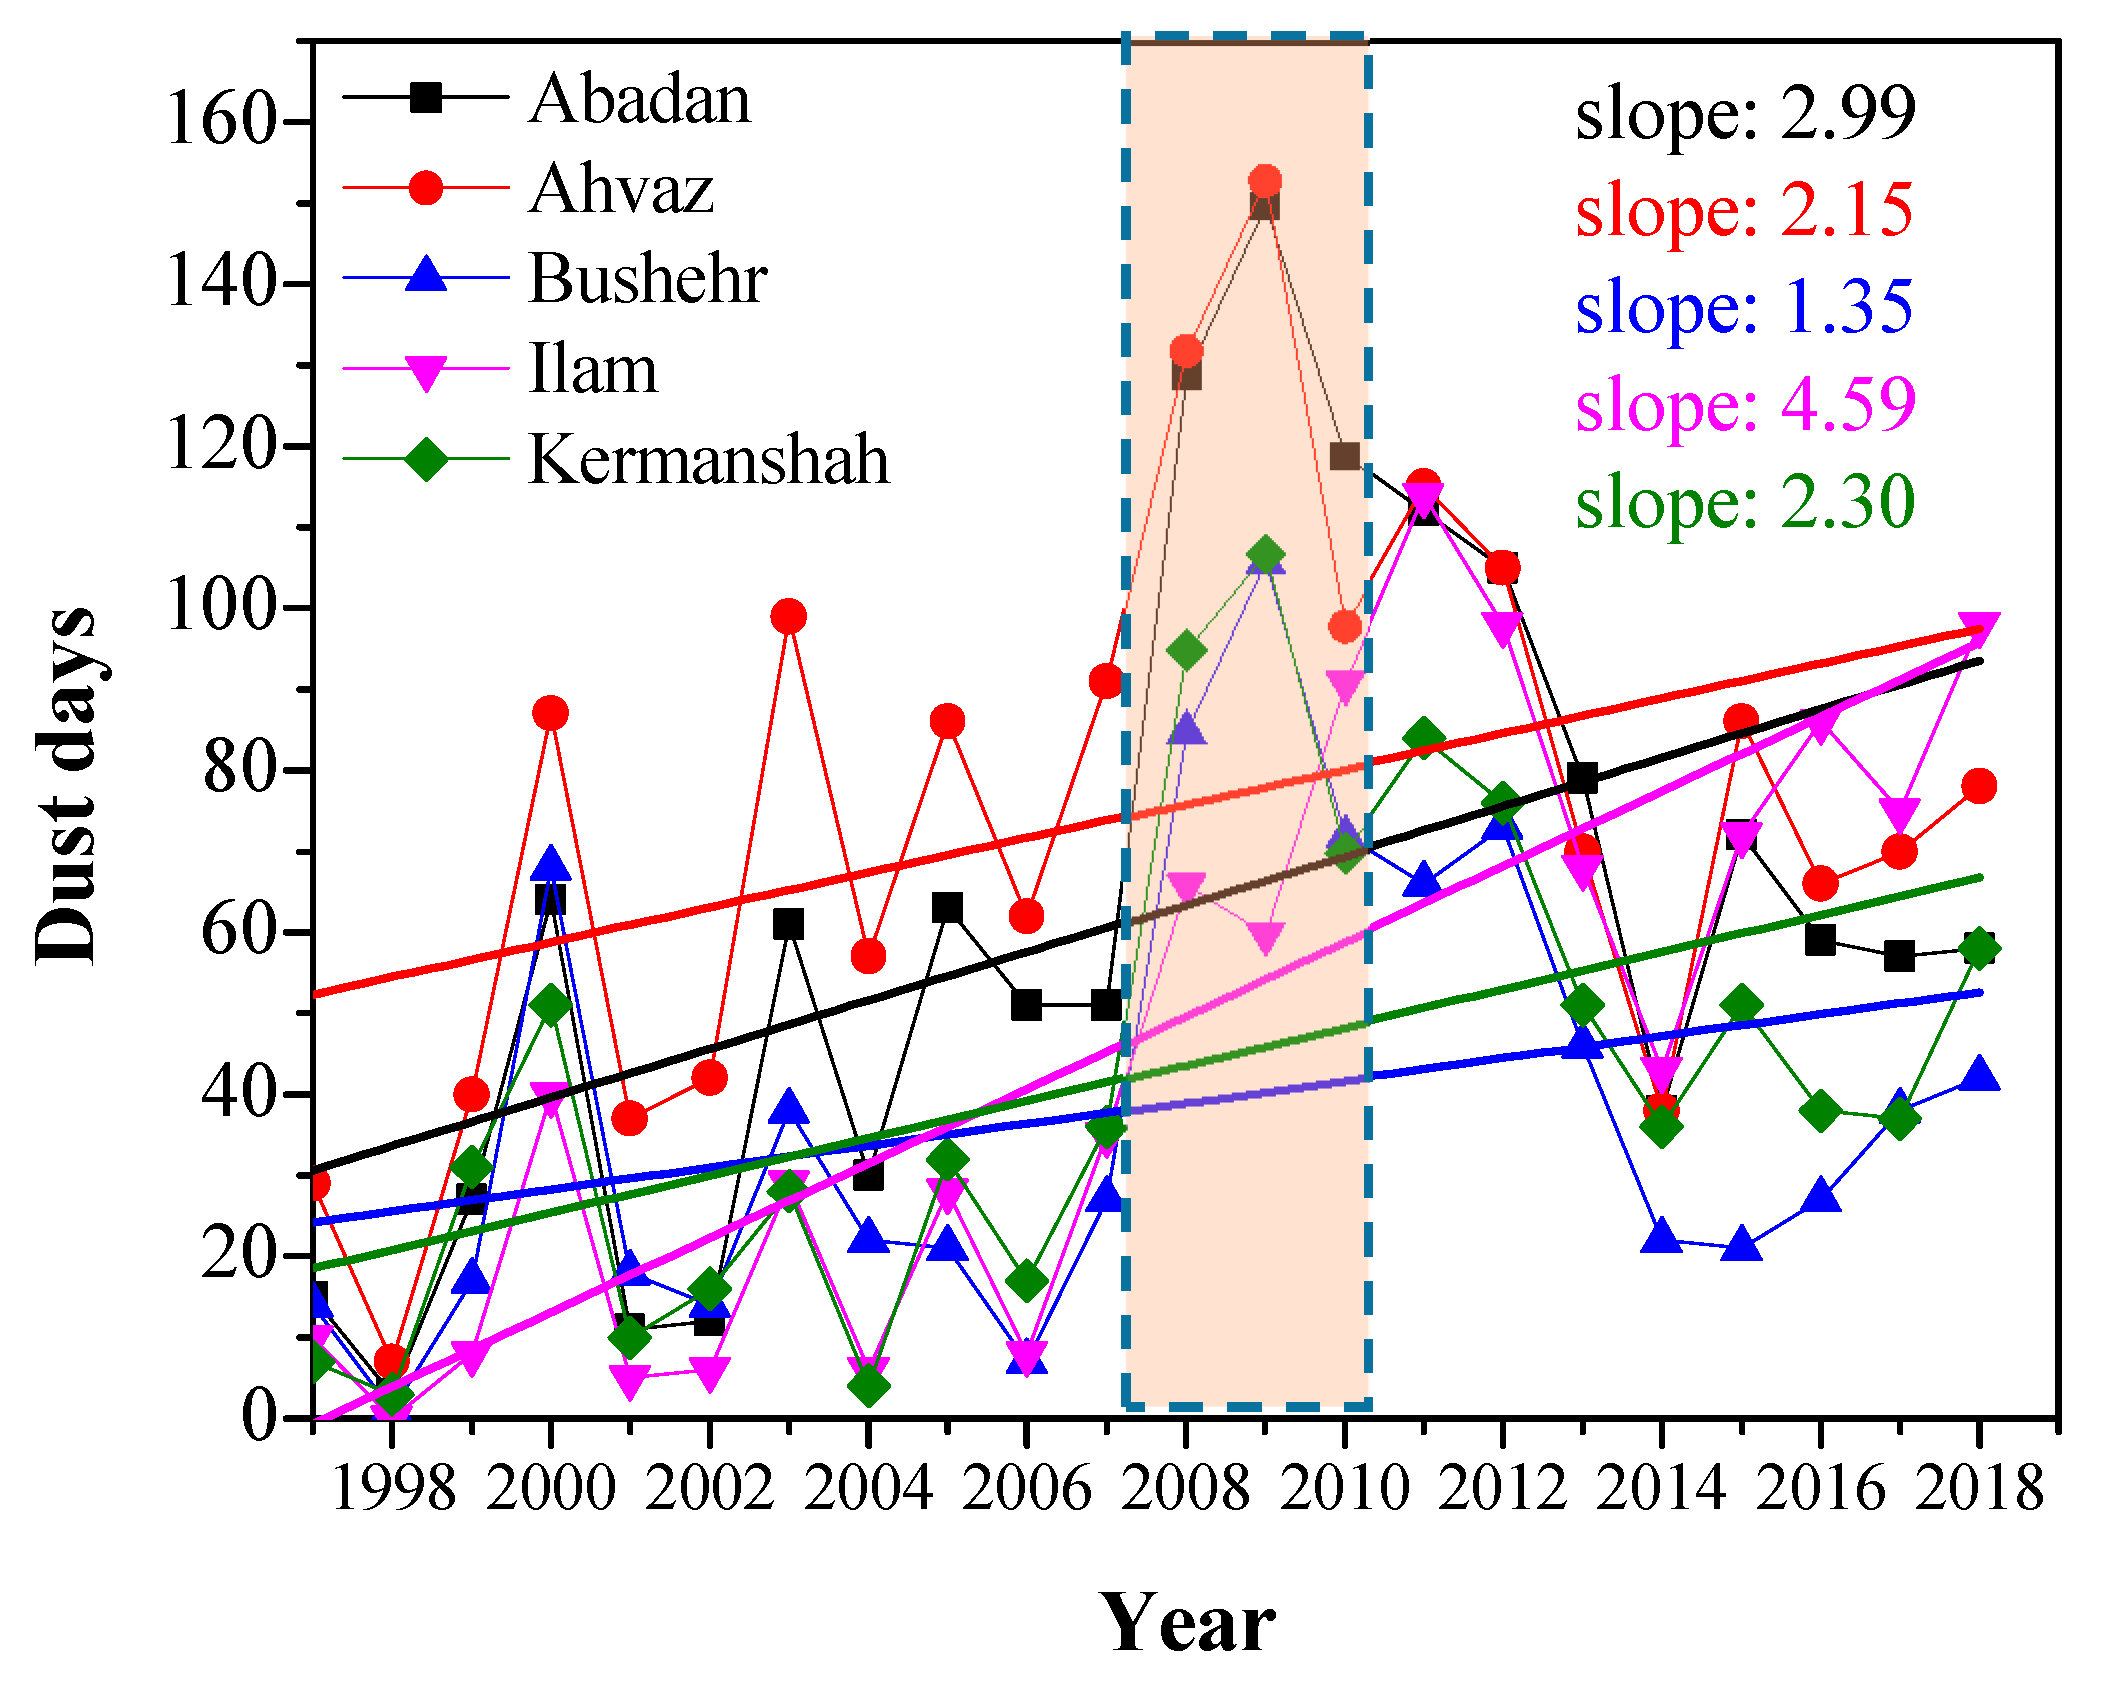
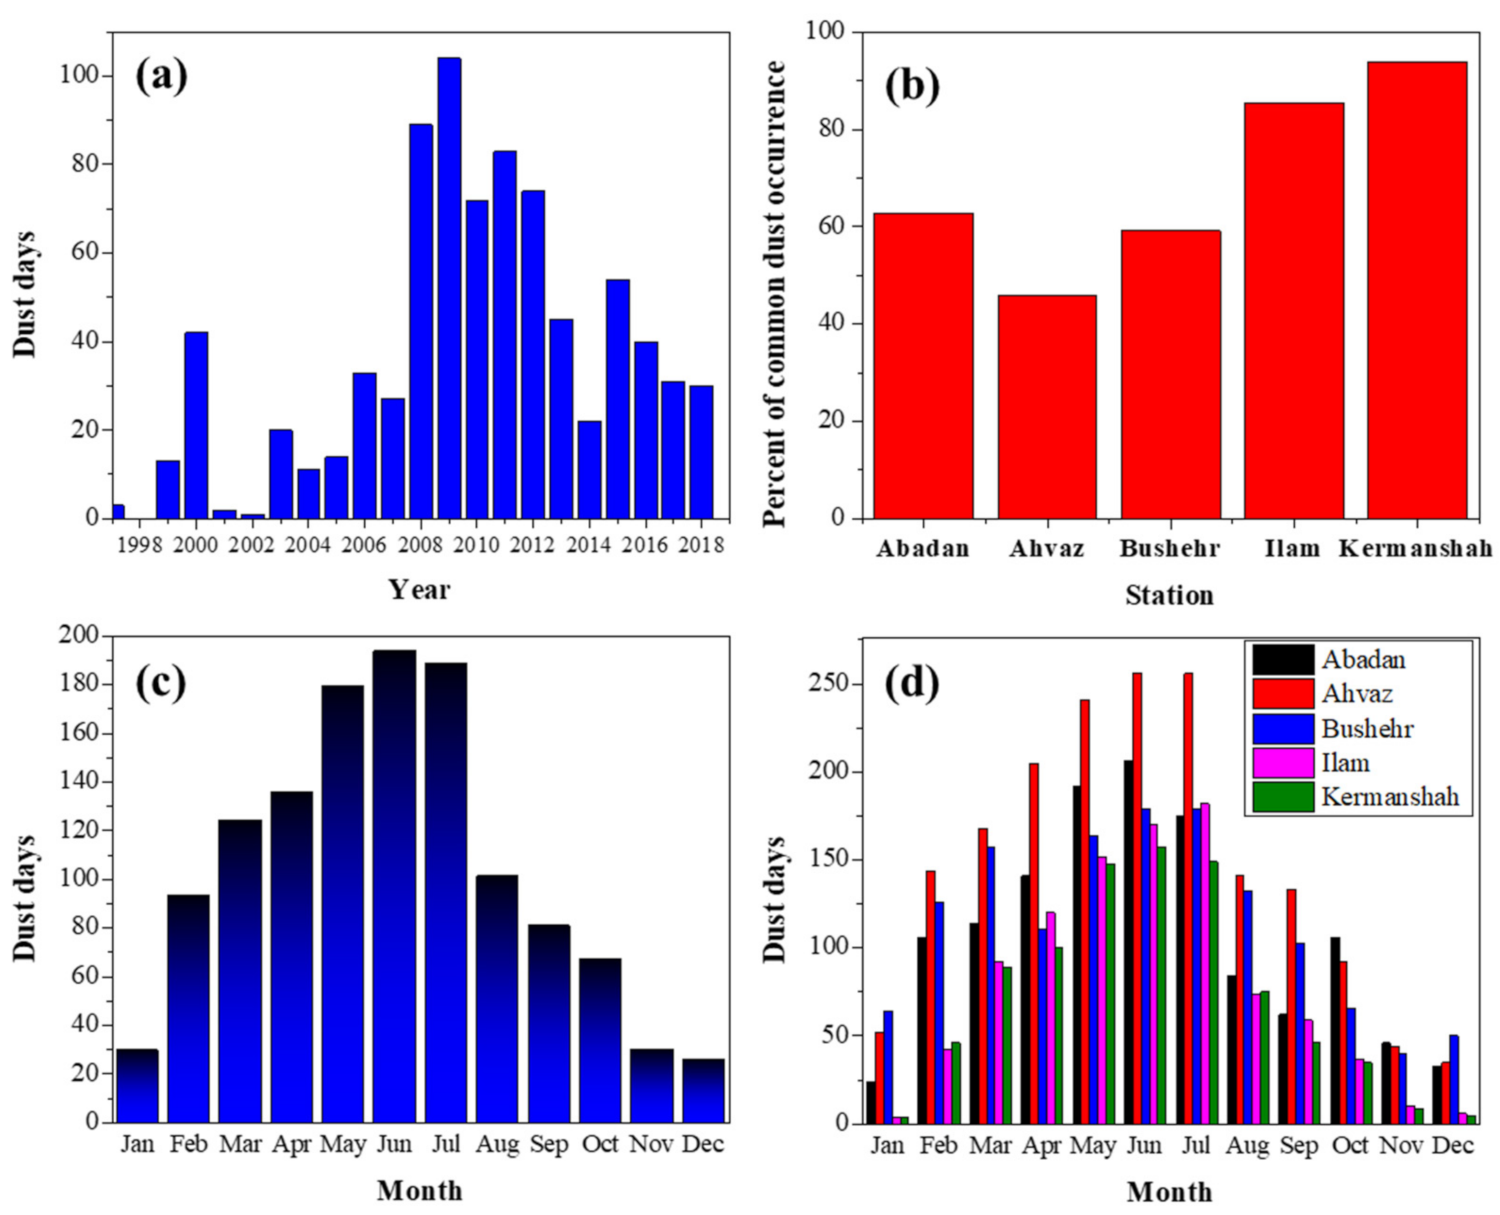
4.1. Evolution of Dust Days in SW Iran

This section analyzes the evolution of dust days at the five examined stations in SW Iran from 1997 to 2018. The dust events over the region are attributed to local emissions from the arid terrains, but mostly to transported dust storms of various intensity from the Mesopotamia plains and deserts in Iraq and Syria. Previous studies have shown that the dust particle size and composition play a major role in source apportionment of the dust storms, emission, and deposition rates [107,108,109,110,111]. The deposited dust in Ahvaz was found to be composed of ~80% of carbonates, followed by quartz (~13%) [112], while a recent work justified this mineralogical composition [113]. The carbonates move faster and uplifted at higher heights than other minerals, such as quartz and feldspars, while rich carbonate soils prevail in the Khuzestan province and southern Iraqi plains [92], indicating dust of local/regional origin.
Analysis of the synoptic codes (06, 07, and 30 to 35) at the five stations revealed that dust episodes in Ahvaz observed at 10.6% of the total observations from 1997 to 2018, out of which 89% corresponds to code 6 and 10% to code 7, while codes 30–35 were very rare (1%). Dust in Bushehr occurred at 11% of the cases, while 94.8% of the meteorological observations in Kermanshah did not show dust presence; in Ilam, this fraction was 94.7% and in Abadan it was 90.7%. Furthermore, code 6 prevailed with fractions of 82% in Abadan, 73% in Bushehr, and 99% in Ilam and Kermanshah, indicating dominance of widespread dust in suspension from non-local sources, characterized as regional or long-range transported [89]. On average, 84% of dust events in all stations were non-local (code 06) and about 16% can be characterized as local dust (code 07). It should be noted that the mountainous terrains and forest cover in Ilam and Kermanshah provinces do not facilitate local dust sources and they are mostly affected by transported dust plumes originated from central-south Iraq and Syria [114].
On the other hand, local dust storms of higher intensity are more frequent in Ahvaz (10%), Abadan (18%), and Bushehr (26%) stations, which are located in plain and open areas directly impacted by the arid/desert surrounding terrains [52,84,115]. Furthermore, the desiccation of Hour Al-Azim wetland and Karkheh river in west Khuzestan contributes significantly to the local dust events in Ahvaz and Abadan [115,116,117]. After extensive field visits at 180 source points in Khuzestan plain, Heydarian et al. [118] reported that about 9% of the total area, equivalent to 349,254 hectares, is a potential source of dust storms. Dust sources have different characteristics in this area, including degraded pastures, abandoned rain-fed agricultural lands, uncovered lands, wetlands, and dried-up ponds and deserts [119]. Bushehr station is highly affected by transported dust plumes from Iraq and Saudi Arabia after crossing the Persian Gulf, while local dust events are also important originated from the arid/desert terrains in coastal southwest Iran, since ~25% of the Bushehr province can be considered as an active dust-prone area [3]. A previous study reported two climatic dust peaks in Bushehr, i.e., between 1982 and 1990 and between 2005 and 2008 [120]. In agreement with our results, Arami et al. [121] reported that, in 25 stations in west and southwest Iran, the fractions of non-local (06 code) and local dust (code 07) were 74.9% and 25%, respectively, during a period of 20 years.
The annual evolution of the frequency of dust days at the five stations from 1997 to 2018 is shown in Figure 2. A remarkable annual variability is observed, while the stations present a general co-variability, indicating rather common years of low and high dust activity. Ahvaz and Abadan stations present the highest number of dust days, which increased dramatically after 2007 and till about 2012. This is the period of a drought shift in the fertile crescent in Iraq (Mesopotamia plains), which lasted for about 3–4 years [53,100] and highly increased the dust activity over Iraq, southwest Iran, Kuwait and northeast Saudi Arabia [32,69,100,122]. Increasing trends in dust days in almost all stations are also observed after 2014. Trend analysis in the number of annual dust days revealed statistically significant trends in all five stations at 95% confidence level, with Z values from the Mann–Kendall test above the critical of 1.645 (ranging from 1.90 in Ahvaz to 3.78 in Ilam). Ilam presents the highest increasing rate in the number of dust days (4.59 per year), while the increasing rates for the other stations range between 1.35 in Bushehr and 2.99 in Abadan (Figure 2). This indicates an important increase in dust activity over southwest Iran, which was also found in the neighboring regions of the Middle East, such as Iraqi plains, Syrian desert, Persian Gulf, and nearly whole Saudi Arabia based on MODIS observations from 2000 to 2015 [32]. The peak in frequency of dust days occurred in 2009 at almost all the stations (Figure 2), similarly to previous works over the region [82,123,124,125].
Figure 3a shows the annual variation of the common dust days in all stations, thus revealing dust plumes covering the whole region. The total number of common dust days was 810 during the period 1997–2018, which exhibit higher frequency in 2009 (104 days), following by 2008 with 89 days and 2011 with 83 days. It is characteristic that during 1999–2002, the dust days were less over SW Iran (except of 2000), while at the same time, east and southeast Iran faced the largest frequency of dust events due to prolonged drought conditions, driven by large-scale dynamics and the prolonged La-Nina phase [34,126,127]. This indicates that local, regional, and large-scale meteorological dynamics that modulate dust activity over the west-southwest and east parts of Iran are totally different, as also shown by recent works that examined the atmospheric circulation patterns and local winds over these areas [64,128].
The ratios of the common dust days per the number of dust days in each station show large differences between the stations (Figure 3b). In Bushehr, the ratio of 59% means that the city faces an important fraction of dust events (41%), which do not affect all other four stations. Furthermore, Kermanshah and Ilam exhibit large fractions of 93.8% and 85.4%, whereas in the Khuzestan stations the ratios are much lower, i.e., Abadan (62.8%) and Ahvaz (45.8%), indicating that a large fraction of the dust days is of local origin affecting only these cities.
The mean monthly variability of the dust days shows that the highest frequency occurred in July with 193 dust days, followed by June (188) and May with 179 dust days (Figure 3c). On the contrary, the average frequency of dust days is below 30 from November to January, which are mostly associated with frontal systems, i.e., pre-frontal and post-frontal dust storms [66,69].
Figure 3d shows the monthly variation of the dust days in each of the five stations throughout the 22-year period. In all stations, the highest frequency of dust days occurred in June and July (or May), indicating a rather similar annual pattern. Ahvaz is the most dust-affected site, especially in May, June, and July, while Ilam and Kermanshah exhibit very low number of dust days during the cold period (Figure 3d). Furthermore, Nabavi et al. [129] reported larger number of dust days in June and July in Khuzestan plain during a 16-year (2000–2015) period, while Zarasvandi et al. [92] also found an increasing number and duration of dust events in June and July over the same area. About 61% of the Khuzestan plain contains lowland and desert areas, and, apart from some mountainous areas in the northeast of the province, the wind erosion treats other areas [130,131]. Zagros Mountains also help in the accumulation and persistence of dust over the Khuzestan plain and prevents the higher-altitude stations of Ilam and Kermanshah from persistent dust plumes, thus contributing to the lower number of dust days [132].
As shown above, 2009 was the most dust-laden year in southwest Iran during the last decades, and more specifically, July 2009 was the dustiest month. Table 2 includes the number of dust days in July 2009 in comparison with the mean number of dust days in July at several stations in west, southwest and south Iran during the period 2000–2017. The results show that July 2009 was extremely dusty, while at most stations the dust days ranged from 25 to 30. Furthermore, the dust days in this month present a dramatic increase from the average number of dust days in July, which varied from 7 to 13 at most of the stations (Table 2), with serious respiratory, cardiovascular problems, and hospitalization of dozens of people [133]. Therefore, using of native plants and green belts in the upwind sides of urban centers as effective methods in trapping dust particles and reduce the movement of the sand dunes is highly recommended for such extreme dust cases [134,135].

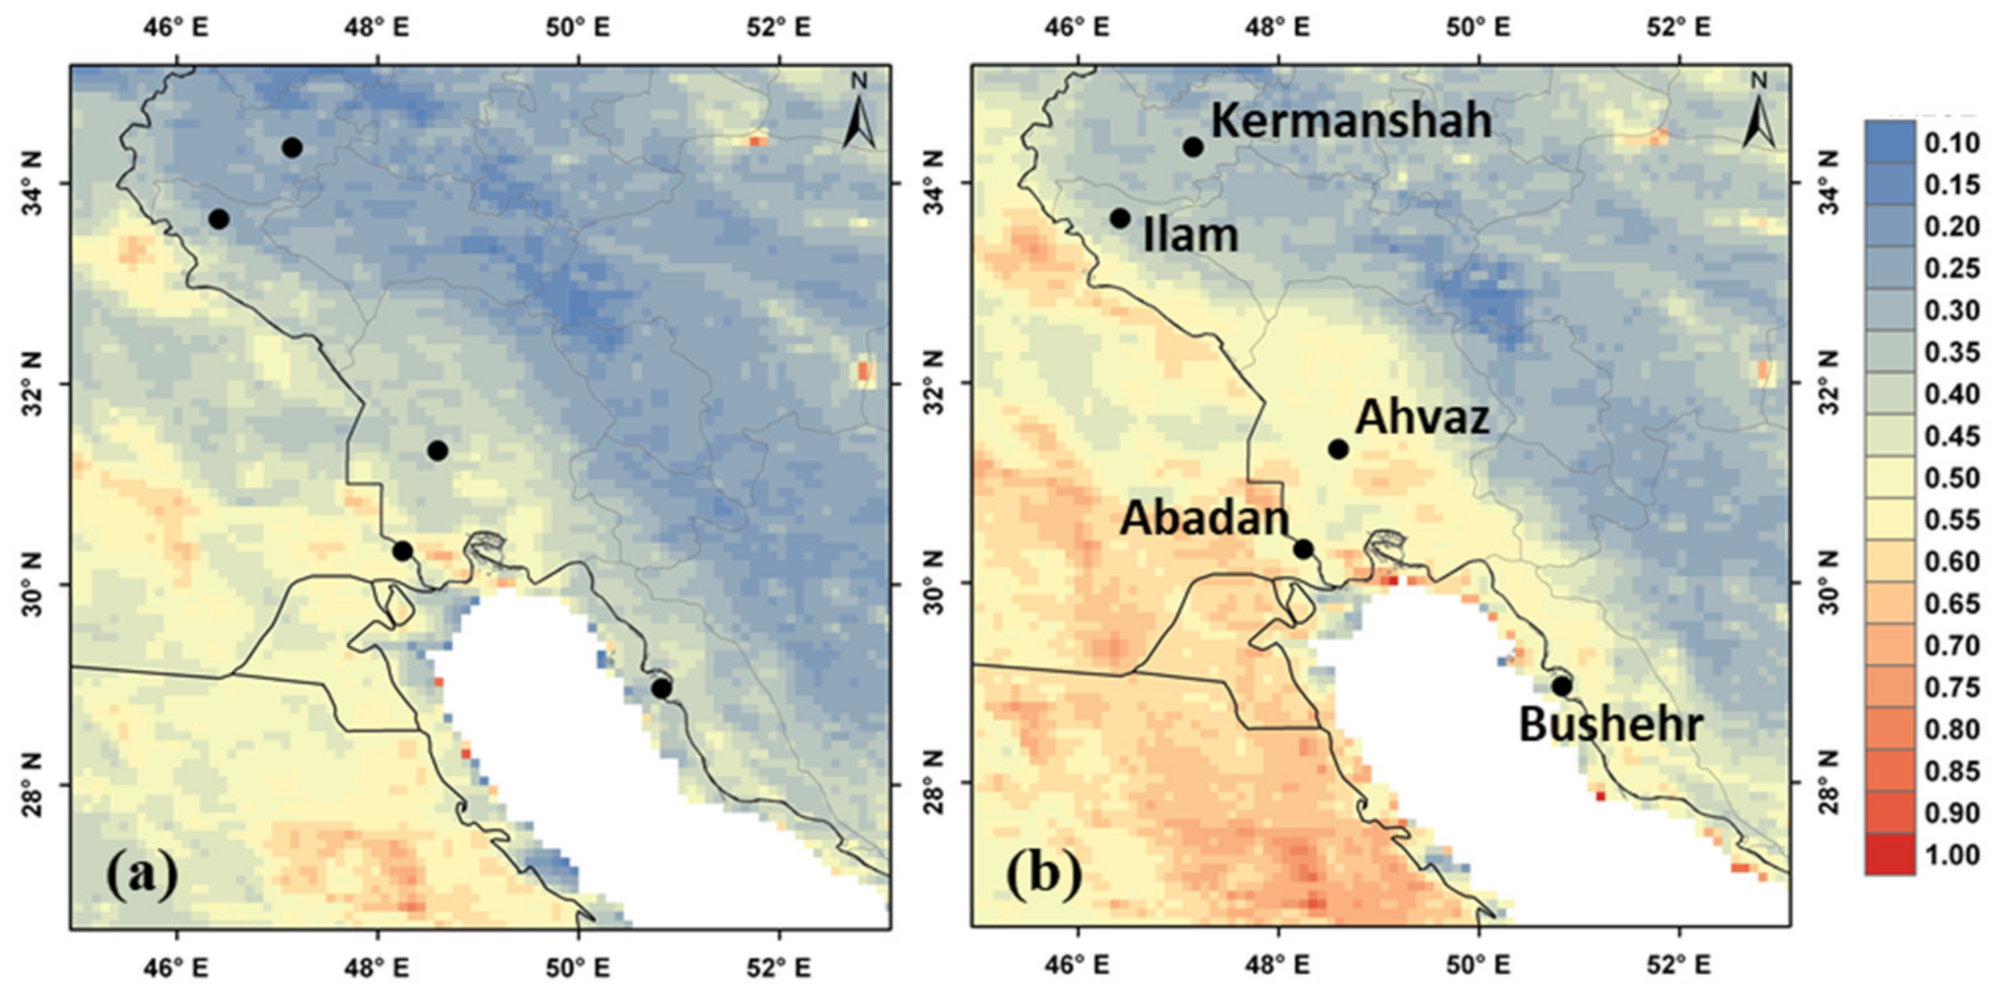
4.2. Satellite Observations

Figure 4 shows the mean Terra-MODIS AOD550 spatial distribution (resolution: 10 km) over southwest Iran and surrounding regions from 2000 to 2018 and the AOD550 pattern over the same area during 2008–2009. In long-term basis, higher AODs are observed in vast areas of south Iraq, Kuwait, northeastern parts of Saudi Arabia, and southwest Iran, as previous studies also showed [32,136,137]. The AOD550 was significantly higher in 2008–2009 indicating positive anomalies over nearly the whole study region. This was attributed to increasing dust emissions in Iraq (fertile crescent) after 2007 due to a shift to a drought period, influenced by La Nina and Pacific Decadal Oscillation teleconnection patterns that modulated sea surface temperature (SST); atmospheric circulation patterns; and rainfall over the northern Arabian Sea, the Arabian Peninsula, and the Middle East [53,100].
The annual variability of the MODIS AOD550 values (Level 2) centered over the five examined stations from 2000 to 2018 are shown in Figure 5a, indicating a peak in AOD during 2008–2009. In this period, Ahvaz presented the highest annual mean AOD, while Abadan exhibited highest annual values in the beginning of the 2000s. Kermanshah and Ilam presented the lowest annual-mean AODs, with a similar covariance, indicating a rather homogeneous aerosol amount over the mountainous part of west Iran [138,139]. All stations show an increasing AOD tendency with similar slopes of ~0.002/year, but not statistically significant at 95% confidence level, against the statistically significant increase in frequency of dust days. Klingmüller et al. [32] also found a positive trend in MODIS AODs over the Middle East region between 2000 and 2015, mostly due to much larger AODs after 2008. Gandham et al. [137] studied MODIS AOD and dust profiles from CALIOP satellite measurements to investigate the vertical distributions of the dust events in the Arabian Peninsula from 2003 to 2017. They found a significant increase in AOD and in frequency of dust events from 2007 to 2012 that peaked in 2012. Figure 5b shows the spatial distribution of the MODIS-AOD trend (%) using high-resolution (10 km) data over the southwest part of Iran. The results indicate a large spatial heterogeneity in the AOD trends during 2000–2018 ranging mostly from −9% to 9%.
Table 1 from 2000 to 2016 shows that, in most years, VHI in Nineveh was higher than that in Dayr Az Zawr (Figure 6). In general, VHI in the Dayr Az Zawr province was lower than 40, indicating a significant lack of vegetation in this area. Furthermore, a significant decrease was observed in VHI values in both regions from 2006 to 2009, followed by a slight recover afterwards, while this decrease was more intense in the Nineveh province. These provinces consist of arid/desert areas that highly affect the dust activity in the Middle East and southwest Iran. Therefore, the decrease in VHI after 2006 signaled the increase in dust activity over southwest Iran [52,84,100].
In the following, time series of columnar AOD, dust loading, surface dust concentration, NDVI, and wet and dry dust deposition, obtained from MODIS observations and MERRA-2 reanalysis, are analyzed over a specific domain including parts of southwest Iran and southeast Iraq (Figure 7a), in order to examine the variability and trends in dust activity.
The annual variation of surface dust concentration and dust load obtained from MERRA-2 reanalysis is shown in Figure 7b, both exhibiting a peak in 2008 and a large increase after 2007 and till about 2012. The mean surface dust concentration exhibited values ranging between 200 μg m−3 and 250 μg m−3, while both parameters showed lower values during the beginning of the examined period, as well as in 2014 and 2016. Due to distinct seasonality of dust in SW Iran [64,80,140,141], the annual variability is mostly driven by the dust patterns in spring and summer, when dust activity highly maximizes. Karimi et al. [142] also showed that 2008 and 2009 were the dustiest years from 2005 to 2015m and July was the dustiest month during that time frame [143]. Dust concentration and load presented statistically significant (at 95% confidence level) increasing trends during 1997–2018, thus affecting the increasing trend in frequency of dust days over SW Iran.
The Terra-MODIS and MERRA-2 AOD annual variations (Figure 7c) exhibit considerable agreement with dust load (R2 = 0.83, 0.94) and surface dust concentrations in a lower degree (R2 = 0.63, 0.78). Both datasets present highest annual AODs in 2008 (MERRA-2) and 2009 (MODIS), while the strong correlation (R2 = 0.81) indicated a great consistency between MODIS and MERRA-2 AODs over the Middle East and Iran [86,144,145,146,147,148]. However, MERRA-2 generally exhibited lower annual AOD values, while the underestimation compared to MODIS increases in the high dust-laden years (e.g., 2008–2012), as has been documented from previous studies [35,137,148]. Both MODIS and MERRA-2 AODs exhibited an increasing trend during the study period, but without statistical significance at the 95% confidence level. Furthermore, the MODIS NDVI presented very low values in 2008, 2009m and in 2011–2012 (Figure 7d), in close relation with the maximum AODs and number of dust days in those years (Figure 2, Figure 3a and Figure 7c). Gholamnia et al. [149] also reported minimum NDVI values in 2008 in the Kurdistan province in the west part of Iran (north from the Kermanshah province), indicating expanded drought conditions that affected nearly the whole Middle East.
Finally, the time series of dry and wet depositions, along with precipitation, obtained from MERRA-2, are shown in Figure 7e for the period 1997–2018. The highest amount of dry deposition occurred in 2008, while during this drought year, the amount of wet deposition and rainfall were significantly lower compared to the other years [100,150,151]. This indicates a higher possibility of dust to remain in the atmosphere for several days and/or weeks and to be transported at long-distances downwind [63,64,72], thus increasing the dust AODs [32,120]. This was also verified by the current analysis, indicating that apart from soil dryness and reduced vegetation cover, deficit of rainfall and lower wet deposition rates were responsible for enhanced accumulation of dust over the Middle East after 2007 and till about 2012.
Figure 8 shows the spatial distributions of the dust concentration, dust load, and dry and wet dust deposition over SW Iran from MERRA-2 retrievals during the period 1997–2018. All patterns show a remarkable spatial heterogeneity of the dust properties even over a small geographic area, highlighting the difficulty in assessing common dust characteristics between the stations and the challenges and biases in simulating the dust plumes via numerical dust models [89,138,152]. The maximum surface dust concentrations and columnar dust load are observed in the southwestern part of the Khuzestan province and the northwest Persian Gulf, while high values of dust load also extended to the Bushehr province, in the northern shores of the Persian Gulf. The highest amount of dry deposition was over the Persian Gulf and the western half of Khuzestan plain in the borders with Iraq and Kuwait [153], thus contributing largely to the surface dust concentrations due to significant dust fallout rates. However, the spatial pattern of the wet deposition is completely different and the maximum values were observed over the northeast of Khuzestan plain and along the Zagros mountain range, where the rainfall is generally higher. Rainfall favors wet dust deposition and highly controlled its temporal variation over the study area (Figure 7e), while Broomandi et al. [123] found a strong negative correlation between annual rainfall and the number of dust storms in every year in the south and west parts of Iran.
Previous works and current analysis revealed that, over the last two decades, the Middle East faced an increasing trend in dust emissions and concentrations, especially over the Tigris–Euphrates basin, southwest Iran, and the eastern part of the Arabian Peninsula. Due to shift to a prolonged dry period after 2007, dust storms over the region have significantly increased, thus enhancing the dust-aerosol loading and concentrations. Current analysis highlighted July 2009 as the dustiest month over southwest Iran with several intense dust-storms like those on 5, 16, and 27 July 2009 [89]. Apart from the extensive drought over the fertile crescent after 2007 [100], the meteorological conditions prevailed in July 2009 facilitated enhanced dust emissions, due to an increase in pressure gradient between the Caspian Sea and low-pressure areas in Iraq and Saudi Arabia that triggered stronger Shamal winds over the Mesopotamia fluvial arid terrain. The synoptic meteorology prevailed during July 2009 was analyzed in a previous work [89], while here we present the spatial AOD distribution (from L3 MODIS observations) along with surface winds (from ERA-5 reanalysis; [64]) in July 2009 with respect to mean July (2000–2018) conditions (Figure 9). The MODIS observations justify the large increase in AOD (mostly dust AOD) during July 2009 along the fertile crescent; Syrian desert; Iraqi plains; and in downwind regions, such as eastern Saudi Arabia. The southwest part of Iran also exhibited higher AODs, as the high-resolution (10 km) MODIS observations show (Figure 9d). Furthermore, over these regions, an enhancement of the west/north-westerlies took place in July 2009 (Figure 9c), which, along with the drought conditions, favored dust emissions and an increase in dust days.

5. Conclusions

This study examined the long-term (for about two decades) variation and trends of dust days and dust characteristics (aerosol optical depth, surface concentration, dust load) over the southwest part of Iran, based on synergy of meteorological data at five cities in the region and satellite observations. In this respect, the dust presence was identified from meteorological observations of the dust synoptic codes (06, 07, and 30 to 35) at five stations (Ahvaz, Abadan, Bushehr, Ilam, and Kermanshah) highly impacted by local, regional, and long-range transported dust events throughout the year, but with higher frequency and intensity in spring and summer.
On average, 92% of the cases during the period 1997–2018 were dust-free, 7% were related to code 06 (raised or transported dust), and about 1% related to code 07 (local dust). In addition, 84% of the dust events were non-local and 16% of local origin, while these fractions presented notable differences between the stations. The analysis detected 810 dust days that affected concurrently all five stations, which exhibited highest frequency in 2009 (104 days), in 2008 (89 days), and in 2011 (83 days). On a monthly basis, the highest frequency was detected in July, June, and May months. Ahvaz and Abadan stations presented the highest number of dust days due to their location in the main downwind region (Khuzestan plain) affected by Iraqi dust events, whereas Ilam and Kermanshah exhibited the lowest number of dust events, as they are located at elevated areas in the Zagros Mountains. Trend analysis indicated a statistically significant (95% confidence level) increase in dust days in all stations during the period 1997–2018, which was driven by the large increase after the prolonged drought shift in 2007, which enhanced the dust activity over the Middle East. After 2012, the frequency of the dust days decreased but not at the levels during the beginning of the 2000s.
High-resolution Terra-MODIS observations over southwest Iran also justified the maximum annual-mean AODs in 2008–2009, in agreement with the peak in dust days. The drought conditions after 2007 and till about 2011/12 were also justified by the lowest NDVI values in southwest Iran and the lowest vegetation health index (VHI) values in two provinces that are prone to dust emissions in Iraq (the Nineveh province) and Syria (the Dayr Az Zawr province). This indicates that the regional shift to a drought period in the Middle East after 2007 had a dramatic effect on vegetation growth, land susceptibility to wind erosion, and an increase in dust activity over the region. However, long-term (2000–2018) trend analysis of level 2 MODIS AODs over the examined stations did not reveal a statistically significant trend in any of them, although the general increasing AODs.
July 2009 was found to be the dustiest month over the last few decades in southwest Iran. The extended drought in the fertile crescent in Iraq, along with favorable meteorological conditions of increased pressure gradients and winds and absence of rainfall, led to more than 25 dust days in this month in many stations in west and south Iran. MODIS observations also highlighted an abnormal increase in dust AODs over the region in July 2009, signaling high deterioration of air quality.

Author Contributions

Conceptualization, N.H.H. and D.G.K.; methodology, N.H.H. and D.G.K.; software, N.H.H. and K.M.; validation, N.H.H., D.G.K. and A.R.; formal analysis, N.H.H., D.G.K., A.R. and K.M.; resources, N.H.H., A.R. and K.M.; data curation, N.H.H.; writing—original draft preparation, N.H.H.; writing—review and editing, D.G.K., A.R. and K.M.; visualization, N.H.H., D.G.K., A.R. and K.M.; supervision, D.G.K. All authors have read and agreed to the published version of the manuscript.

Funding

This research received no external funding.

Institutional Review Board Statement

Not applicable.

Informed Consent Statement

Not applicable.

Data Availability Statement

Data sets supporting reported results are: MODIS and MERRA-2 via Giovanni (https://giovanni.sci.gsfc.nasa.gov/giovanni/, accessed on 2 October 2021). ERA-5 via https://www.ecmwf.int/en/forecasts/datasets/reanalysis-datasets/era5 (accessed on 3 October 2021).

Acknowledgments

We are thankful for MODIS and MERRA-2 retrievals used in this study via Giovanni visualization tool (https://giovanni.sci.gsfc.nasa.gov/giovanni/, accessed on 2 October 2021). The authors are greatly thankful to the ECMWF ERA-5 meteorological products that are used in the current work. D.G.K. acknowledges the support of the project “PANhellenic infra-structure for Atmospheric Composition and climatE change” PANACEA (MIS 5021516), funded by the Operational Program “Competitiveness, Entrepreneurship and Innovation” (NSRF 2014–2020) and co-financed by Greece and the European Union. A.R acknowledges support by Iran National Science Foundation (INSF) under project No 99003984. KMP acknowledges the grant support by ICTP and ENEA, Italy, and sincerely thanks ENEA/SSPT department and Climate Modelling Laboratory for providing needed facilities. A.R. and K.M. are also greatly thankful to grant support by Ferdowsi University of Mashhad.

Conflicts of Interest

The authors declare no conflict of interest.

References

  1. Pokharel, A.K.; Kaplan, M.L.; Fiedler, S. Subtropical Dust Storms and Downslope Wind Events: Subtropical Dust Storms. J. Geophys. Res. 2017, 122, 10191–10205. [Google Scholar]
  2. Mandija, F.; Chavez-Perez, V.; Nieto, R.; Sicard, M.; Danylevsky, V.; Añel, J.; Gimeno, L. The climatology of dust events over the European continent using data of the BSC-DREAM8b model. Atmos. Res. 2018, 209, 144–162. [Google Scholar] [CrossRef] [Green Version]
  3. Abbasi, E.; Etemadi, H.; Smoak, J.M.; Amouniya, H.; Mahoutchi, M.H. Dust storm source detection using ANP and WRF models in southwest of Iran. Arab. J. Geosci. 2021, 14, 1529. [Google Scholar] [CrossRef]
  4. Francis, D.; Alshamsi, N.; Cuesta, J.; Isik, A.G.; Dundar, C. Cyclogenesis and Density Currents in the Middle East and the Associated Dust Activity in September 2015. Geoscience 2019, 9, 376. [Google Scholar] [CrossRef] [Green Version]
  5. Miri, A.; Maleki, S.; Middleton, N. An investigation into climatic and terrestrial drivers of dust storms in the Sistan region of Iran in the early twenty-first century. Sci. Total Environ. 2021, 757, 143952. [Google Scholar] [CrossRef] [PubMed]
  6. Al-Hemoud, A.; Al-Dousari, A.; Al-Dashti, H.; Petrov, P.; Al-Saleh, A.; Al-Khafaji, S.; Behbehani, W.; Li, J.; Koutrakis, P. Sand and dust storm trajectories from Iraq Mesopotamian flood plain to Kuwait. Sci. Total Environ. 2020, 710, 136291. [Google Scholar] [CrossRef]
  7. Miri, A.; Ahmadi, H.; Ekhtesasi, M.R.; Panjehkeh, N.; Ghanbari, A. Environmental and socio-economic impacts of dust storms in Sistan Region, Iran. Int. J. Environ. Stud. 2009, 66, 343–355. [Google Scholar] [CrossRef]
  8. Goudie, A.S. Desert dust and human health disorders. Environ. Int. 2014, 63, 101–113. [Google Scholar] [CrossRef]
  9. Nastos, P.T.; Kampanis, N.A.; Giaouzaki, K.N.; Matzarakis, A. Environmental impacts on human health during a Sa-haran dust episode at Crete Island, Greece. Meteorol. Z. 2011, 20, 517–529. [Google Scholar] [CrossRef]
  10. Schepanski, K. Transport of Mineral Dust and Its Impact on Climate. Geoscience 2018, 8, 151. [Google Scholar] [CrossRef] [Green Version]
  11. Gavrouzou, M.; Hatzianastassiou, N.; Gkikas, A.; Lolis, C.; Mihalopoulos, N. A Climatological Assessment of Intense Desert Dust Episodes over the Broader Mediterranean Basin Based on Satellite Data. Remote Sens. 2021, 13, 2895. [Google Scholar] [CrossRef]
  12. Titos, G.; Ealo, M.; Pandolfi, M.; Pérez, N.; Sola, Y.; Sicard, M.; Comerón, A.; Querol, X.; Alastuey, A. Spatiotemporal Evolution of a Severe Winter Dust Event in the Western Mediterranean: Aerosol Optical and Physical Properties: Dust Optical and Physical Properties. J. Geophys. Res. 2017, 122, 4052–4069. [Google Scholar] [CrossRef] [Green Version]
  13. Rashki, A.; Kaskaoutis, D.G.; Mofidi, A.; Minvielle, F.; Chiapello, I.; Legrand, M.; Dumka, U.C.; Francois, P. Effects of Monsoon, Shamal and Levar Winds on Dust Accumulation over the Arabian Sea during Summer—The July 2016 Case. Aeolian Res. 2019, 36, 27–44. [Google Scholar] [CrossRef]
  14. Francis, D.; Chaboureau, J.-P.; Nelli, N.; Cuesta, J.; Alshamsi, N.; Temimi, M.; Pauluis, O.; Xue, L. Summertime dust storms over the Arabian Peninsula and impacts on radiation, circulation, cloud development and rain. Atmos. Res. 2021, 250, 105364. [Google Scholar] [CrossRef]
  15. Ahmady-Birgani, H.; Ravan, P.; Schlosser, J.S.; Cuevas-Robles, A.; AzadiAghdam, M.; Sorooshian, A. On the chemical nature of wet deposition over a major desiccated lake: Case study for Lake Urmia basin. Atmos. Res. 2020, 234, 104762. [Google Scholar] [CrossRef]
  16. Gholami, H.; Mohammadifar, A.; Pourghasemi, H.R.; Collins, A.L. A New Integrated Data Mining Model to Map Spatial Variation in the Susceptibility of Land to Act as a Source of Aeolian Dust. Environ. Sci. Pollut. Res. Int. 2020, 27, 42022–42039. [Google Scholar] [CrossRef] [PubMed]
  17. Gholami, H.; Mohammadifar, A.; Golzari, S.; Kaskaoutis, D.G.; Collins, A.L. Using the Boruta algorithm and deep learning models for mapping land susceptibility to atmospheric dust emissions in Iran. Aeolian Res. 2021, 50, 100682. [Google Scholar] [CrossRef]
  18. Motaghi, F.A.; Hamzehpour, N.; Abasiyan, S.M.A.; Rahmati, M. The wind erodibility in the newly emerged surfaces of Urmia Playa Lake and adjacent agricultural lands and its determining factors. Catena 2020, 194, 104675. [Google Scholar] [CrossRef]
  19. Avila, A.; Peñuelas, J. Increasing frequency of Saharan rains over Northeastern Spain and its ecological consequences. Sci. Total Environ. 1999, 228, 153–156. [Google Scholar] [CrossRef]
  20. Al-Dousari, A.; Al-Awadhi, J.; Al-Enezi, A. Barchan Dunes in Northern Kuwait. Desertif. Third Millenn. 2003, 299–308. [Google Scholar] [CrossRef]
  21. Kumar, A.; Suresh, K.; Rahaman, W. Geochemical Characterization of Modern Aeolian Dust over the Northeastern Ara-bian Sea: Implication for Dust Transport in the Arabian Sea. Sci. Total Environ. 2020, 729, 138576. [Google Scholar] [CrossRef] [PubMed]
  22. Hayes, C.T.; Anderson, R.F.; Fleisher, M.Q.; Serno, S.; Winckler, G.; Gersonde, R. Biogeography in 231Pa/230Th Ratios and a Balanced 231Pa Budget for the Pacific Ocean. Earth Planet. Sci. Lett. 2014, 391, 307–318. [Google Scholar] [CrossRef] [Green Version]
  23. Tyagi, G.; Babu, K.N.; Solanki, H.A. Monitoring Bio-Optical Response of Coastal Waters Surrounding the Indian Sub-continent to Atmospheric Dust Deposition Using Satellite Data. Environ. Sci. Pollut. Res. Int. 2020, 27, 5523–5535. [Google Scholar] [CrossRef] [PubMed]
  24. Goudie, A.S. Dust storms: Recent developments. J. Environ. Manag. 2009, 90, 89–94. [Google Scholar] [CrossRef] [PubMed]
  25. Middleton, N. Rangeland management and climate hazards in drylands: Dust storms, desertification and the overgrazing debate. Nat. Hazards 2018, 92, 57–70. [Google Scholar] [CrossRef] [Green Version]
  26. Prakash, P.J.; Stenchikov, G.; Kalenderski, S.; Osipov, S.; Bangalath, H. The impact of dust storms on the Arabian Peninsula and the Red Sea. Atmos. Chem. Phys. Discuss. 2015, 15, 199–222. [Google Scholar] [CrossRef] [Green Version]
  27. Kumar, S.; Kumar, S.; Kaskaoutis, D.G.; Singh, R.P.; Singh, R.K.; Mishra, A.K.; Srivastava, M.K.; Singh, A.K. Meteorological, Atmospheric and Climatic Perturbations during Major Dust Storms over Indo-Gangetic Basin. Aeolian Res. 2015, 17, 15–31. [Google Scholar] [CrossRef]
  28. Kosmopoulos, P.G.; Kazadzis, S.; Taylor, M.; Athanasopoulou, E.; Speyer, O.; Raptis, P.I.; Marinou, E.; Proestakis, E.; Solomos, S.; Gerasopoulos, E.; et al. Dust impact on surface solar irradiance assessed with model simulations, satellite observations and ground-based measurements. Atmos. Meas. Tech. 2017, 10, 2435–2453. [Google Scholar] [CrossRef] [Green Version]
  29. Kaskaoutis, D.G.; Francis, D.; Rashki, A.; Chaboureau, J.-P.; Dumka, U.C. Atmospheric Dynamics from Synoptic to Local Scale during an Intense Frontal Dust Storm over the Sistan Basin in Winter 2019. Geosciences 2019, 9, 453. [Google Scholar] [CrossRef] [Green Version]
  30. Kok, J.F.; Adebiyi, A.A.; Albani, S.; Balkanski, Y.; Checa-Garcia, R.; Chin, M.; Colarco, P.R.; Hamilton, D.S.; Huang, Y.; Ito, A.; et al. Contribution of the World’s Main Dust Source Regions to the Global Cycle of Desert Dust. Atmos. Chem. Phys. 2021, 21, 8169–8193. [Google Scholar] [CrossRef]
  31. Pozzer, A.; de Meij, A.; Yoon, J.; Tost, H.; Georgoulias, A.K.; Astitha, M. AOD Trends during 2001–2010 from Observations and Model Simulations. Atmos. Chem. Phys. 2015, 15, 5521–5535. [Google Scholar] [CrossRef] [Green Version]
  32. Klingmüller, K.; Pozzer, A.; Metzger, S.; Stenchikov, G.L.; Lelieveld, J. Aerosol optical depth trend over the Middle East. Atmos. Chem. Phys. Discuss. 2016, 16, 5063–5073. [Google Scholar] [CrossRef] [Green Version]
  33. Floutsi, A.A.; Korras-Carraca, M.; Matsoukas, C.; Hatzianastassiou, N.; Biskos, G. Climatology and trends of aerosol optical depth over the Mediterranean basin during the last 12 years (2002–2014) based on Collection 006 MODIS-Aqua data. Sci. Total Environ. 2016, 551–552, 292–303. [Google Scholar] [CrossRef] [PubMed]
  34. Middleton, N. Variability and Trends in Dust Storm Frequency on Decadal Timescales: Climatic Drivers and Human Impacts. Geoscience 2019, 9, 261. [Google Scholar] [CrossRef] [Green Version]
  35. Shaheen, A.; Wu, R.; Aldabash, M. Long-Term AOD Trend Assessment over the Eastern Mediterranean Region: A Comparative Study Including a New Merged Aerosol Product. Atmos. Environ. 2020, 238, 117736. [Google Scholar] [CrossRef]
  36. Rashki, A.; Middleton, N.; Goudie, A. Dust storms in Iran—Distribution, causes, frequencies and impacts. Aeolian Res. 2021, 48, 100655. [Google Scholar] [CrossRef]
  37. Engelstaedter, S.; Tegen, I.; Washington, R. North African dust emissions and transport. Earth-Sci. Rev. 2006, 79, 73–100. [Google Scholar] [CrossRef]
  38. Parajuli, S.P.; Stenchikov, G.L.; Ukhov, A.; Kim, H. Dust Emission Modeling Using a New High-Resolution Dust Source Function in WRF-Chem With Implications for Air Quality. J. Geophys. Res. Atmos. 2019, 124, 10109–10133. [Google Scholar] [CrossRef] [Green Version]
  39. Gholami, H.; Mohamadifar, A.; Collins, A.L. Spatial mapping of the provenance of storm dust: Application of data mining and ensemble modelling. Atmos. Res. 2020, 233, 104716. [Google Scholar] [CrossRef]
  40. Gholami, H.; Rahimi, S.; Fathabadi, A.; Habibi, S.; Collins, A.L. Mapping the spatial sources of atmospheric dust using GLUE and Monte Carlo simulation. Sci. Total Environ. 2020, 723, 138090. [Google Scholar] [CrossRef]
  41. Li, S.; Pan, D.; Xu, Z.; Lin, P.; Zhang, Y. Numerical simulation of dynamic water grouting using quick-setting slurry in rock fracture: The Sequential Diffusion and Solidification (SDS) method. Comput. Geotech. 2020, 122, 103497. [Google Scholar] [CrossRef]
  42. Emamian, A.; Rashki, A.; Kaskaoutis, D.G.; Gholami, A.; Opp, C.; Middleton, N. Assessing Vegetation Restoration Potential under Different Land Uses and Climatic Classes in Northeast Iran. Ecol. Indic. 2021, 122, 107325. [Google Scholar] [CrossRef]
  43. Al-Dousari, A.M.; Alsaleh, A.; Ahmed, M.; Misak, R.; Al-Dousari, N.; Al-Shatti, F.; Elrawi, M.; William, T. Off-Road Vehicle Tracks and Grazing Points in Relation to Soil Compaction and Land Degradation. Earth Syst. Environ. 2019, 3, 471–482. [Google Scholar] [CrossRef]
  44. Al-Dousari, A.; Pye, K.; Al-Hazza, A.; Al-Shatti, F.; Ahmed, M.; Al-Dousari, N.; Rajab, M. Nanosize inclusions as a fingerprint for aeolian sediments. J. Nanopart. Res. 2020, 22, 94. [Google Scholar] [CrossRef]
  45. Ahmed, M.; Al-Dousari, N.; Al-Dousari, A. The role of dominant perennial native plant species in controlling the mobile sand encroachment and fallen dust problem in Kuwait. Arab. J. Geosci. 2016, 9, 134. [Google Scholar] [CrossRef]
  46. El-Wahab, R.H.A.; Al-Rashed, A.R.; Al-Dousari, A. Influences of Physiographic Factors, Vegetation Patterns and Human Impacts on Aeolian Landforms in Arid Environment. Arid. Ecosyst. 2018, 8, 97–110. [Google Scholar] [CrossRef]
  47. Kharol, S.K.; Kaskaoutis, D.; Badarinath, K.; Sharma, A.R.; Singh, R. Influence of land use/land cover (LULC) changes on atmospheric dynamics over the arid region of Rajasthan state, India. J. Arid. Environ. 2013, 88, 90–101. [Google Scholar] [CrossRef]
  48. Ebrahimi-Khusfi, Z.; Mirakbari, M.; Khosroshahi, M. Vegetation response to changes in temperature, rainfall, and dust in arid environments. Environ. Monit. Assess. 2020, 192, 691. [Google Scholar] [CrossRef] [PubMed]
  49. Ebrahimi-Khusfi, Z.; Mirakbari, M.; Ebrahimi-Khusfi, M.; Taghizadeh-Mehrjardi, R. Impacts of vegetation anomalies and agricultural drought on wind erosion over Iran from 2000 to 2018. Appl. Geogr. 2020, 125, 102330. [Google Scholar] [CrossRef]
  50. Washington, R.; Todd, M.; Middleton, N.J.; Goudie, A.S. Dust-Storm Source Areas Determined by the Total Ozone Monitoring Spectrometer and Surface Observations. Ann. Assoc. Am. Geogr. 2003, 93, 297–313. [Google Scholar] [CrossRef]
  51. Rashki, A.; Kaskaoutis, D.; Sepehr, A. Statistical evaluation of the dust events at selected stations in Southwest Asia: From the Caspian Sea to the Arabian Sea. Catena 2018, 165, 590–603. [Google Scholar] [CrossRef]
  52. Salmabadi, H.; Khalidy, R.; Saeedi, M. Transport routes and potential source regions of the Middle Eastern dust over Ahvaz during 2005–2017. Atmos. Res. 2020, 241, 104947. [Google Scholar] [CrossRef]
  53. Yu, Y.; Notaro, M.; Liu, Z.; Wang, F.; Alkolibi, F.; Fadda, E.; Bakhrjy, F. Climatic Controls on the Interannual to Decadal Variability in Saudi Arabian Dust Activity: Toward the Development of a Seasonal Dust Prediction Model: Saudi Arabian Dust Prediction. J. Geophys. Res. 2015, 120, 1739–1758. [Google Scholar] [CrossRef]
  54. Mohammadpour, K.; Sciortino, M.; Saligheh, M.; Raziei, T.; Boloorani, A.D. Spatiotemporal regionalization of atmospheric dust based on multivariate analysis of MACC model over Iran. Atmos. Res. 2021, 249, 105322. [Google Scholar] [CrossRef]
  55. Arfan Ali, M.A.; Assiri, M. Analysis of AOD from MODIS-Merged DT–DB Products over the Arabian Peninsula. Earth Syst. Environ. 2019, 3, 625–636. [Google Scholar]
  56. Ali, A.; Nichol, J.E.; Bilal, M.; Qiu, Z.; Mazhar, U.; Wahiduzzaman; Almazroui, M.; Islam, M.N. Classification of aerosols over Saudi Arabia from 2004–2016. Atmos. Environ. 2020, 241, 117785. [Google Scholar] [CrossRef]
  57. Sabetghadam, S.; Alizadeh, O.; Khoshsima, M.; Pierleoni, A. Aerosol properties, trends and classification of key types over the Middle East from satellite-derived atmospheric optical data. Atmos. Environ. 2021, 246, 118100. [Google Scholar] [CrossRef]
  58. Xu, X.; Xie, L.; Yang, X.; Wu, H.; Cai, L.; Qi, P. Aerosol optical properties at seven AERONET sites over Middle East and Eastern Mediterranean Sea. Atmos. Environ. 2020, 243, 117884. [Google Scholar] [CrossRef]
  59. Yousefi, R.; Wang, F.; Ge, Q.; Shaheen, A. Long-term aerosol optical depth trend over Iran and identification of dominant aerosol types. Sci. Total Environ. 2020, 722, 137906. [Google Scholar] [CrossRef]
  60. Hamidi, M.; Kavianpour, M.R.; Shao, Y. Synoptic analysis of dust storms in the Middle East. Asia-Pac. J. Atmos. Sci. 2013, 49, 279–286. [Google Scholar] [CrossRef]
  61. Yu, Y.; Notaro, M.; Kalashnikova, O.V.; Garay, M.J. Climatology of Summer Shamal Wind in the Middle East: Summer Shamal Climatology. J. Geophys. Res. 2016, 121, 289–305. [Google Scholar] [CrossRef] [Green Version]
  62. Hermida, L.; Merino, A.; Sanchez, J.L.; Fernández-González, S.; García-Ortega, E.; Lopez, L. Characterization of synoptic patterns causing dust outbreaks that affect the Arabian Peninsula. Atmos. Res. 2018, 199, 29–39. [Google Scholar] [CrossRef]
  63. Namdari, S.; Karimi, N.; Sorooshian, A.; Mohammadi, G.; Sehatkashani, S. Impacts of climate and synoptic fluctuations on dust storm activity over the Middle East. Atmos. Environ. 2018, 173, 265–276. [Google Scholar] [CrossRef]
  64. Mohammadpour, K.; Sciortino, M.; Kaskaoutis, D.G. Classification of weather clusters over the Middle East associated with high atmospheric dust-AODs in West Iran. Atmos. Res. 2021, 259, 105682. [Google Scholar] [CrossRef]
  65. Mashat, A.; Awad, A.M. A synoptic and dynamic study of a dust storm event over the Middle East. Bull. Fac. Sci. Cairo Univ. 2010, 78, 43–64. [Google Scholar]
  66. Beegum, N.; Gherboudj, I.; Chaouch, N.; Temimi, M.; Ghedira, H. Simulation and analysis of synoptic scale dust storms over the Arabian Peninsula. Atmos. Res. 2018, 199, 62–81. [Google Scholar] [CrossRef]
  67. Ledari, D.G.; Hamidi, M.; Shao, Y. Evaluation of the 13 April 2011 frontal dust storm in west Asia. Aeolian Res. 2020, 44, 100592. [Google Scholar] [CrossRef]
  68. Labban, A.H.; Mashat, A.S.; Awad, A.M. The variability of the Siberian high ridge over the Middle East. Int. J. Clim. 2021, 41, 104–130. [Google Scholar] [CrossRef]
  69. Hamzeh, N.; Karami, S.; Kaskaoutis, D.; Tegen, I.; Moradi, M.; Opp, C. Atmospheric Dynamics and Numerical Simulations of Six Frontal Dust Storms in the Middle East Region. Atmosphere 2021, 12, 125. [Google Scholar] [CrossRef]
  70. Al-Jumaily, K.J.; Ibrahim, M.K. Analysis of Synoptic Situation for Dust Storms in Iraq. Int. J. Energy Environ. 2013, 4, 851–858. [Google Scholar]
  71. Mashat, A.; Awad, A. The Synoptic Features of the Autumn Dust Classes in Northern Saudi Arabia. Int. J. Adv. Res. 2015, 3, 461–471. [Google Scholar]
  72. Mashat, A.-W.S.; Awad, A.M.; Assiri, M.E.; Labban, A.H. Dynamic and synoptic study of spring dust storms over northern Saudi Arabia. Theor. Appl. Clim. 2020, 140, 619–634. [Google Scholar] [CrossRef]
  73. Baghbanan, P.; Ghavidel, Y.; Farajzadeh, M. Spatial analysis of spring dust storms hazard in Iran. Theor. Appl. Clim. 2019, 139, 1447–1457. [Google Scholar] [CrossRef]
  74. Maleki, H.; Sorooshian, A.; Goudarzi, G.; Nikfal, A.; Baneshi, M.M. Temporal Profile of PM10 and Associated Health Ef-fects in One of the Most Polluted Cities of the World (Ahvaz, Iran) between 2009 and 2014. Aeolian Res. 2016, 22, 135–140. [Google Scholar] [CrossRef] [PubMed] [Green Version]
  75. Goudarzi, G.; Geravandi, S.; Foruozandeh, H.; Babaei, A.A.; Alavi, N.; Niri, M.V.; Khodayar, M.J.; Salmanzadeh, S.; Mohammadi, M.J. Cardiovascular and respiratory mortality attributed to ground-level ozone in Ahvaz, Iran. Environ. Monit. Assess. 2015, 187, 487. [Google Scholar] [CrossRef] [PubMed]
  76. Shahsavani, A.; Tobías, A.; Querol, X.; Stafoggia, M.; Abdolshahnejad, M.; Mayvaneh, F.; Guo, Y.; Hadei, M.; Hashemi, S.S.; Khosravi, A.; et al. Short-term effects of particulate matter during desert and non-desert dust days on mortality in Iran. Environ. Int. 2020, 134, 105299. [Google Scholar] [CrossRef] [PubMed]
  77. Naimabadi, A.; Ghadiri, A.; Idani, E.; Babaei, A.A.; Alavi, N.; Shirmardi, M.; Khodadadi, A.; Marzouni, M.B.; Ankali, K.A.; Rouhizadeh, A.; et al. Chemical composition of PM10 and its in vitro toxicological impacts on lung cells during the Middle Eastern Dust (MED) storms in Ahvaz, Iran. Environ. Pollut. 2016, 211, 316–324. [Google Scholar] [CrossRef] [PubMed]
  78. Soleimani, Z.; Teymouri, P.; Darvishi Boloorani, A.; Mesdaghinia, A.; Middleton, N.; Griffin, D.W. An Overview of Bioaerosol Load and Health Impacts Associated with Dust Storms: A Focus on the Middle East. Atmos. Environ. 2020, 223, 117187. [Google Scholar] [CrossRef]
  79. Zoljoodi, M.; Didevarasl, A.; Saadatabadi, A.R. Dust Events in the Western Parts of Iran and the Relationship with Drought Expansion over the Dust-Source Areas in Iraq and Syria. Atmos. Clim. Sci. 2013, 03, 321–336. [Google Scholar] [CrossRef]
  80. Broomandi, P.; Karaca, F.; Guney, M.; Fathian, A.; Geng, X.; Kim, J.R. Destinations frequently impacted by dust storms originating from southwest Iran. Atmos. Res. 2021, 248, 105264. [Google Scholar] [CrossRef]
  81. Sissakian, V.K.; Al-Ansari, N.; Knutsson, S. Sand and dust storm events in Iraq. Nat. Sci. 2013, 5, 1084–1094. [Google Scholar] [CrossRef] [Green Version]
  82. Hamidi, M.; Kavianpour, M.R.; Shao, Y. A quantitative evaluation of the 3–8 July 2009 Shamal dust storm. Aeolian Res. 2017, 24, 133–143. [Google Scholar] [CrossRef]
  83. Karimi, N.; Namdari, S.; Sorooshian, A.; Bilal, M.; Heidary, P. Evaluation and modification of SARA high-resolution AOD retrieval algorithm during high dust loading conditions over bright desert surfaces. Atmos. Pollut. Res. 2019, 10, 1005–1014. [Google Scholar] [CrossRef]
  84. Darvishi Boloorani, A.; Papi, R.; Soleimani, M.; Karami, L.; Amiri, F.; Neysani Samany, N. Water Bodies Changes in Tigris and Euphrates Basin Has Impacted Dust Storms Phenomena. Aeolian Res. 2021, 50, 100698. [Google Scholar] [CrossRef]
  85. Pikridas, M.; Vrekoussis, M.; Sciare, J.; Kleanthous, S.; Vasiliadou, E.; Kizas, C.; Savvides, C.; Mihalopoulos, N. Spatial and temporal (short and long-term) variability of submicron, fine and sub-10 μm particulate matter (PM1, PM2.5, PM10) in Cyprus. Atmos. Environ. 2018, 191, 79–93. [Google Scholar] [CrossRef]
  86. Shaheen, A.; Wu, R.; Lelieveld, J.; Yousefi, R.; Aldabash, M. Winter AOD trend changes over the Eastern Mediterranean and Middle East region. Int. J. Clim. 2021, 41, 5516–5535. [Google Scholar] [CrossRef]
  87. Alizadeh-Choobari, O.; Ghafarian, P.; Owlad, E. Temporal Variations in the Frequency and Concentration of Dust Events over Iran Based on Surface Observations: Climatology of dust events over Iran. Int. J. Climatol. 2016, 36, 2050–2062. [Google Scholar] [CrossRef]
  88. Karami, S.; Hossein Hamzeh, N.; Noori, F.; Ranjbar, A. Investigation of Dust Storms in Ilam and the Performance Analysis of Simulation of 6 Numerical Prediction Models at a Severe Dust Storm in West of Iran. J. Air Pollut. Health 2019, 4, 133–146. [Google Scholar] [CrossRef]
  89. Hamzeh, N.H.; Karami, S.; Opp, C.; Fattahi, E.; Jean-François, V. Spatial and temporal variability in dust storms in the Middle East, 2002–2018: Three case studies in July 2009. Arab. J. Geosci. 2021, 14, 1–14. [Google Scholar] [CrossRef]
  90. Ahmadi Doabi, S.A.; Karami, M.A.M. Assessment of Kermanshah Province Atmospheric Dust Contamination with Selected Heavy Metals Using Pollution Indexes during the Summer 2013. J. Water Soil 2017, 30, 822–834. [Google Scholar]
  91. Shahsavani, A.; Naddafi, K.; Jaafarzadeh Haghighifard, N.; Mesdaghinia, A.; Yunesian, M.; Nabizadeh, R.; Arhami, M.; Yarahmadi, M.; Sowlat, M.H.; Ghani, M.; et al. Characterization of Ionic Composition of TSP and PM10 during the Middle Eastern Dust (MED) Storms in Ahvaz, Iran. Environ. Monit. Assess. 2012, 184, 6683–6692. [Google Scholar] [CrossRef] [PubMed]
  92. Zarasvandi, A.; Carranza, E.J.; Moore, F.; Rastmanesh, F. Spatio-temporal occurrences and mineralogical–geochemical characteristics of airborne dusts in Khuzestan Province (southwestern Iran). J. Geochem. Explor. 2011, 111, 138–151. [Google Scholar] [CrossRef]
  93. Goudarzi, G.; Daryanoosh, S.; Godini, H.; Hopke, P.; Sicard, P.; De Marco, A.; Rad, H.D.; Harbizadeh, A.; Jahedi, F.; Mohammadi, M.; et al. Health risk assessment of exposure to the Middle-Eastern Dust storms in the Iranian megacity of Kermanshah. Public Health 2017, 148, 109–116. [Google Scholar] [CrossRef]
  94. Sekhavati, B.; Sekhavati, N. Chemical, Physical and Mineralogical Properties of Dust Fractions in the Kermanshah Province, Iran. ECOPERSIA 2020, 8, 261–268. [Google Scholar]
  95. Karimi, K.; Aeini, H.T.S.; Nokhandan, M.H.; Moghadas, N.H. Identifying the Origins of Dust Storm Production in the Middle East Using Remote Sensing. J. Clin. Res. 2011, 2, 57–72. [Google Scholar]
  96. Mehrizi, E. An Investigation about the Sources of Ilam Dust. In Proceedings of the Second International Conference on Dust, Ilam, Iran, 25–27 April 2018. [Google Scholar]
  97. Amarloei, A.; Jonaidi Jafari, A.; Mazloomi, S. Study of Particulate Matters Concentration and Radiation Rate in the Atmosphere of Ilam City during Middle East Dust Storms. Int. J. Environ. Anal. Chem. 2020, 1–9. [Google Scholar] [CrossRef]
  98. Keshavarzi, B.; Abbasi, H.S.; Moore, F.; Delshab, H.; Soltani, N. Polycyclic Aromatic Hydrocarbons in Street Dust of Bushehr City, Iran: Status, Source, and Human Health Risk Assessment. Polycycl. Aromat. Compd. 2020, 40, 61–75. [Google Scholar] [CrossRef]
  99. O’Loingsigh, T.; McTainsh, G.; Tews, E.; Strong, C.; Leys, J.; Shinkfield, P.; Tapper, N. The Dust Storm Index (DSI): A method for monitoring broadscale wind erosion using meteorological records. Aeolian Res. 2014, 12, 29–40. [Google Scholar] [CrossRef]
  100. Notaro, M.; Yu, Y.; Kalashnikova, O.V. Regime shift in Arabian dust activity, triggered by persistent Fertile Crescent drought. J. Geophys. Res. Atmos. 2015, 120, 110–229. [Google Scholar] [CrossRef]
  101. Abdollahi, S.; Madadi, M.; Ostad-Ali-Askari, K. Monitoring and investigating dust phenomenon on using remote sensing science, geographical information system and statistical methods. Appl. Water Sci. 2021, 11, 111. [Google Scholar] [CrossRef]
  102. Levy, R.C.; Mattoo, S.; Munchak, L.A.; Remer, L.A.; Sayer, A.M.; Patadia, F.; Hsu, N.C. The Collection 6 MODIS Aero-sol Products over Land and Ocean. Atmos. Meas. Tech. 2013, 6, 2989–3034. [Google Scholar] [CrossRef] [Green Version]
  103. Sayer, A.M.; Hsu, N.C.; Lee, J.; Kim, W.V.; Dutcher, S.T. Validation, Stability, and Consistency of MODIS Collection 6.1 and VIIRS Version 1 Deep Blue Aerosol Data Over Land. J. Geophys. Res. Atmos. 2019, 124, 4658–4688. [Google Scholar] [CrossRef]
  104. Gelaro, R.; McCarty, W.; Suárez, M.J.; Todling, R.; Molod, A.; Takacs, L.; Randles, C.A.; Darmenov, A.; Bosilovich, M.G.; Reichle, R.; et al. The Modern-Era Retrospective Analysis for Research and Applications, Version 2 (MERRA-2). J. Clim. 2017, 30, 5419–5454. [Google Scholar] [CrossRef]
  105. Randles, C.A.; Da Silva, A.M.; Buchard, V.; Colarco, P.R.; Darmenov, A.; Govindaraju, R.; Smirnov, A.; Holben, B.; Ferrare, R.; Hair, J.; et al. The MERRA-2 Aerosol Reanalysis, 1980 Onward. Part I: System Description and Data Assimilation Evaluation. J. Clim. 2017, 30, 6823–6850. [Google Scholar] [CrossRef] [PubMed]
  106. Hersbach, H.; Bell, B.; Berrisford, P.; Hirahara, S.; Horanyi, A.; Muñoz-Sabater, J.; Nicolas, J.; Peubey, C.; Radu, R.; Schepers, D.; et al. The ERA5 global reanalysis. Q. J. R. Meteorol. Soc. 2020, 146, 1999–2049. [Google Scholar] [CrossRef]
  107. Rashki, A.; Kaskaoutis, D.G.; Rautenbach, C.J.D.; Eriksson, P.G.; Qiang, M.; Gupta, P. Dust Storms and Their Horizontal Dust Loading in the Sistan Region, Iran. Aeolian Res. 2012, 5, 51–62. [Google Scholar] [CrossRef] [Green Version]
  108. Aminfar, R.; Landi, A.; Hojati, S. Study of Deposition Rate and Dust Particle Size Distribution with Attention to Soil Properties in Hoveizeh-Khorramshahr Supercritical Source. Iran. J. Soil Water Res 1550, 51. [Google Scholar] [CrossRef]
  109. Behrooz, R.D.; Esmaili-Sari, A.; Bahramifar, N.; Kaskaoutis, D. Analysis of the TSP, PM10 concentrations and water-soluble ionic species in airborne samples over Sistan, Iran during the summer dusty period. Atmos. Pollut. Res. 2017, 8, 403–417. [Google Scholar] [CrossRef]
  110. Foroushani, M.A.; Opp, C.; Groll, M.; Nikfal, A. Evaluation of WRF-Chem Predictions for Dust Deposition in South-western Iran. Atmosphere 2020, 11, 757. [Google Scholar] [CrossRef]
  111. Li, Y.; Song, Y.; Kaskaoutis, D.G.; Zan, J.; Orozbaev, R.; Tan, L.; Chen, X. Aeolian dust dynamics in the Fergana Valley, Central Asia, since ~30 ka inferred from loess deposits. Geosci. Front. 2021, 12, 101180. [Google Scholar] [CrossRef]
  112. Al-Ghadban, A.N.; Uddin, S.; Beg, M.U.; Al-Dousari, A.M.; Gevao, B.; Al-Yamani, F. Ecological Consequences of River Manipulations and Drainage of Mesopotamian Marshes on the Arabian Gulf Ecosystem: Investigations on Changes in Sedimentology and Environmental Quality, with Special Reference to Kuwait Bay. Kuwait Inst. Sci. Res. (KISR) 2008, 9362, 1–174. [Google Scholar]
  113. MalAmiri, N.; Rashki, A.; Hosseinzadeh, S.R.; Kaskaoutis, D.G. Mineralogical, Geochemical, and Textural Characteristics of Soil and Airborne Samples during Dust Storms in Khuzestan, Southwest Iran. Chemosphere 2022, 286, 131879. [Google Scholar] [CrossRef] [PubMed]
  114. Arami, S.A.; Ownegh, M.; MohammadianBehbahani, A.; Akbari, M.; Zarasvandi, A.; Gorgan University of Agricultural Sciences and Natural Resources (GUASNR); Kharazmi University; Shahid Chamran University of Ahvaz. The analysis of dust hazard studies in southwest region of Iran in 22 years (1996–2017). J. Spat. Anal. Environ. Hazarts 2018, 5, 39–66. [Google Scholar] [CrossRef]
  115. Malamiri, N.; Rashki, A.; Hosseinzadeh, S.; Gahadi Toroqh, M. Identification of Desert Dust Sources in the West Khuzestan Province Using of Brightness Temperature Algorithms. J. Geogr. Environ. Hazards 2019, 8, 97–110. [Google Scholar]
  116. Heidarian, P.; Azhdari, A.; Joudaki, M.; Khatooni, J.D.; Firoozjaei, S.F. Integrating Remote Sensing, GIS, and Sedimentology Techniques for Identifying Dust Storm Sources: A Case Study in Khuzestan, Iran. J. Ind. Soc. Remote Sens. 2018, 46, 1113–1124. [Google Scholar] [CrossRef]
  117. Ghojghar, M.A.; Pourgholam-Amiji, M.; Bazrafshan, J.; Araghinejad, S.; Liaghat, A.; Hosseini-Moghari, S.-M. Performance Evaluation of Genetic Algorithm and GA-SA Hybrid Method in Forecasting Dust Storms (Case Study: Khuzestan Province). Soil Water Res. 2021, 51, 22059. [Google Scholar]
  118. Heydarian, M.; Ghorbani, H.R. Prehistoric Evidence of Sonqor Koliyaie Plain in Central Zagros. Iran. J. Archaeol. Stud. 2016, 6, 19–29. [Google Scholar]
  119. Ghojghar, M.A.; Bazrafshan, J.; Araghinejad, S.; Parsi, E.; Soltani, S. Evaluation of the Performance of the Support-Wavelet Vector Machine Hybrid Model in Predicting Dust Storms. Environ. Manag. Hazards 2020, 7, 331–351. [Google Scholar]
  120. Ghasem, A.; Shamsipour, A.; Miri, M.; Safarrad, T. Synoptic and Remote Sensing Analysis of Dust Events in Southwestern Iran. Nat. Hazards 2012, 64, 1625–1638. [Google Scholar] [CrossRef]
  121. Arami, S.A.; Ownegh, M.; Mohammadian Behbahani, A.; Akbari, M.; Zarasvandi, A. Statistical Analysis of Spatio-Temporal Pattern of Dust Storms in West and Southwest of Iran. J. Water Soil Conserv. 2018, 25, 61–83. [Google Scholar]
  122. Yousefi, R.; Wang, F.; Ge, Q.; Lelieveld, J.; Shaheen, A. Aerosol Trends during the Dusty Season over Iran. Remote Sens. 2021, 13, 1045. [Google Scholar] [CrossRef]
  123. Broomandi, P.; Dabir, B.; Bonakdarpour, B.; Rashidi, Y. Identification of dust storm origin in South–West of Iran. J. Environ. Health Sci. Eng. 2017, 15, 16. [Google Scholar] [CrossRef] [Green Version]
  124. Farhadipour, S.; Azadi, M.; Bidokhti, A.A.; Sayyari, H.; Choobari, O.A. Study and Simulation of Severe Dust Storms in the West and Southwest of Iran. Russ. Meteorol. Hydrol. 2018, 43, 613–624. [Google Scholar] [CrossRef]
  125. Hojati, S.; Khademi, H.; Cano, A.F.; Landi, A. Characteristics of dust deposited along a transect between central Iran and the Zagros Mountains. Catena 2012, 88, 27–36. [Google Scholar] [CrossRef]
  126. Kaskaoutis, D.G.; Rashki, A.; Houssos, E.E.; Mofidi, A.; Goto, D.; Bartzokas, A.; Francois, P.; Legrand, M. Meteorological aspects associated with dust storms in the Sistan region, southeastern Iran. Clim. Dyn. 2015, 45, 407–424. [Google Scholar] [CrossRef]
  127. Rashki, A.; Kaskaoutis, D.; Francois, P.; Kosmopoulos, P.; Legrand, M. Dust-storm dynamics over Sistan region, Iran: Seasonality, transport characteristics and affected areas. Aeolian Res. 2015, 16, 35–48. [Google Scholar] [CrossRef]
  128. Hamidianpour, M.; Jahanshahi, S.M.A.; Kaskaoutis, D.G.; Rashki, A.; Nastos, P.G. Climatology of the Sistan Levar wind: Atmospheric dynamics driving its onset, duration and withdrawal. Atmos. Res. 2021, 260, 105711. [Google Scholar] [CrossRef]
  129. Nabavi, S.S.; Moradi, H.; Shrifikia, M. Evaluation of Dust Storm Temporal Distribution and the Relation of the Effective Factors with the Frequency of Occurrence in Khuzestan Province from 2000 to 2015. Sci.-Res. Q. Geograph. Data (SEPEHR) 2019, 28, 191–203. [Google Scholar]
  130. Tahmasebi, A.M.; Sardari, F. Revisiting Project of Critical Sources of Wind Erosion, Suitable to Prevent Wind Erosion in the Country; Yazd University: Yazd, Iran, 2010. [Google Scholar]
  131. Ebrahimi-Khusfi, Z.; Nafarzadegan, A.R.; Dargahian, F. Predicting the Number of Dusty Days around the Desert Wetlands in Southeastern Iran Using Feature Selection and Machine Learning Techniques. Ecol. Indic. 2021, 125, 107499. [Google Scholar] [CrossRef]
  132. Sahraei, J.; Mobarak Hassan, E.; Mohammadi, N. The Effect of the Zagros Mountain Range on Transporting Iraqi Dust to Western Iran Using the WRF/Chem Model (Case Study). J. Geogr. Environ. Hazards 2020, 8, 119–134. [Google Scholar]
  133. Akbary, M.; Farahbakhshi, M. Analyzing and Tracing of Dust Hazard in Recent Years in Kermanshah Province. Int. J. Environ. Res. 2015, 9, 673–682. [Google Scholar]
  134. Al-Dousari, A.M.; Ahmed, M.; Al-Dousari, N.; Al-Awadhi, S. Environmental and economic importance of native plants and green belts in controlling mobile sand and dust hazards. Int. J. Environ. Sci. Technol. 2019, 16, 2415–2426. [Google Scholar] [CrossRef]
  135. Al-Dousari, A.; Ramadan, A.; Al-Qattan, A.; Al-Ateeqi, S.; Dashti, H.; Ahmed, M.; Al-Dousari, N.; Al-Hashash, N.; Othman, A. Cost and effect of native vegetation change on aeolian sand, dust, microclimate and sustainable energy in Kuwait. J. Taibah Univ. Sci. 2020, 14, 628–639. [Google Scholar] [CrossRef]
  136. Rashki, A.; Kaskaoutis, D.G.; Eriksson, P.G.; Rautenbach, C.J.D.W.; Flamant, C.; Vishkaee, F.A. Spatio-temporal variability of dust aerosols over the Sistan region in Iran based on satellite observations. Nat. Hazards 2013, 71, 563–585. [Google Scholar] [CrossRef] [Green Version]
  137. Gandham, H.; Dasari, H.P.; Langodan, S.; Karumuri, R.K.; Hoteit, I. Major Changes in Extreme Dust Events Dynamics over the Arabian Peninsula during 2003–2017 Driven by Atmospheric Conditions. J. Geophys. Res. Atmos. 2020, 125, 24. [Google Scholar] [CrossRef]
  138. Kontos, S.; Liora, N.; Giannaros, C.; Kakosimos, K.; Poupkou, A.; Melas, D. Modeling natural dust emissions in the central Middle East: Parameterizations and sensitivity. Atmos. Environ. 2018, 190, 294–307. [Google Scholar] [CrossRef]
  139. Nabavi, S.O.; Haimberger, L.; Samimi, C. Climatology of Dust Distribution over West Asia from Homogenized Remote Sensing Data. Aeolian Res. 2016, 21, 93–107. [Google Scholar] [CrossRef] [Green Version]
  140. Daniali, M.; Karimi, N. Spatiotemporal analysis of dust patterns over Mesopotamia and their impact on Khuzestan province, Iran. Nat. Hazards 2019, 97, 259–281. [Google Scholar] [CrossRef]
  141. Francis, D.B.K.; Flamant, C.; Chaboureau, J.-P.; Banks, J.; Cuesta, J.; Brindley, H.; Oolman, L. Dust emission and transport over Iraq associated with the summer Shamal winds. Aeolian Res. 2017, 24, 15–31. [Google Scholar] [CrossRef]
  142. Karimi, M.; Oladi Ghadikolaei, J.; Mohammadi, J.; Sari Agricultural Sciences and Natural Resources University; Sari Agricultural Sciences and Natural Resources University; Gorgan Agricultural Sciences and Natural Resources University. Investigating the vegetation changes in the internal and external dust storm sources using MODIS satellite imagery (case study: Kermanshah province). Ecol. Iran. For. 2018, 6, 39–49. [Google Scholar] [CrossRef]
  143. Rezaei Moghadam, M.H.; Boroujeni, M.M. Determination of the Dust Using NOAA Satellite AVHRR (Case Study: South-West of Iran). Geogr. Environ. Sustain. 2015, 5, 1–13. [Google Scholar]
  144. Hassan, E.M.; Saadatabadi, A.; Fattahi, E. Dust Investigation by MERRA-2 Model in Iran. Iran. J. Soil Water Res. 2020, 10, 22059. [Google Scholar]
  145. Khan, R.; Kumar, K.; Zhao, T.; Ullah, W.; de Leeuw, G. Interdecadal Changes in Aerosol Optical Depth over Pakistan Based on the MERRA-2 Reanalysis Data during 1980–2018. Remote Sens. 2021, 13, 822. [Google Scholar] [CrossRef]
  146. Tuna Tuygun, G.; Gündoğdu, S.; Elbir, T. Estimation of Ground-Level Particulate Matter Concentrations Based on Synergistic Use of MODIS, MERRA-2 and AERONET AODs over a Coastal Site in the Eastern Mediterranean. Atmos. Environ. 2021, 261, 118562. [Google Scholar] [CrossRef]
  147. Che, H.; Gui, K.; Xia, X.; Wang, Y.; Holben, B.N.; Goloub, P.; Cuevas-Agulló, E.; Wang, H.; Zheng, Y.; Zhao, H.; et al. Large contribution of meteorological factors to interdecadal changes in regional aerosol optical depth. Atmos. Chem. Phys. Discuss. 2019, 19, 10497–10523. [Google Scholar] [CrossRef] [Green Version]
  148. Shi, L.; Zhang, J.; Yao, F.; Zhang, D.; Guo, H. Temporal variation of dust emissions in dust sources over Central Asia in recent decades and the climate linkages. Atmos. Environ. 2020, 222, 117176. [Google Scholar] [CrossRef]
  149. Gholamnia, M.; Khandan, R.; Bonafoni, S.; Sadeghi, A. Spatiotemporal Analysis of MODIS NDVI in the Semi-Arid Region of Kurdistan. Iran. Remote Sens. 2019, 11, 1723. [Google Scholar] [CrossRef] [Green Version]
  150. Bozorg-Haddad, O.; Zolghadr-Asli, B.; Sarzaeim, P.; Aboutalebi, M.; Chu, X.; Loáiciga, H.A. Evaluation of water shortage crisis in the Middle East and possible remedies. J. Water Supply: Res. Technol. 2019, 69, 85–98. [Google Scholar] [CrossRef]
  151. Hameed, M.; Ahmadalipour, A.; Moradkhani, H. Apprehensive Drought Characteristics over Iraq: Results of a Multidecadal Spatiotemporal Assessment. Geosciences 2018, 8, 58. [Google Scholar] [CrossRef] [Green Version]
  152. Basart, S.; Vendrell, L.; Baldasano, J. High-resolution dust modelling over complex terrains in West Asia. Aeolian Res. 2016, 23, 37–50. [Google Scholar] [CrossRef]
  153. Yassin, M.F.; Almutairi, S.; Al-Hamoud, A. Dust Storms Backward Trajectories’ and Source Identification over Kuwait. Atmos. Res. 2018, 212, 158–171. [Google Scholar] [CrossRef]
Figure 1. Study area with the 5 synoptic weather stations in SW Iran, Nineveh and Dayr Az Zawr provinces in Iraq and Syria, respectively.
Atmosphere 12 01350 g001
Figure 2. Annual variation of the number of dust days (lines+symbols) and associated trends (solid lines) at 5 stations in southwest Iran from 1997 to 2018. The highlighted column shows highest dust years.
Atmosphere 12 01350 g002
Figure 3. (a) Inter-annual variation of common dust days in all of 5 stations in SW Iran, (b) the ratio of common dust days in all of 5 stations per the number of dust days in each station, (c) mean monthly dust days per station, (d) monthly frequency of dust days in each station during the period 1997–2018.
Atmosphere 12 01350 g003
Figure 4. Mean AOD550 spatial distribution (10 km × 10 km) during the period 2000–2018 (a) and during 2008–2009 (b) from Terra-MODIS observations.
Atmosphere 12 01350 g004
Figure 5. Inter annual variation of the MODIS AOD550 values (10 km × 10 km) over each station (a) and spatial distribution of the MODIS-AOD trends in southwest Iran (b) during 2000–2018.
Atmosphere 12 01350 g005
Figure 6. Spatial-averaged annual VHI values in the Ninawa province in Iraq and the Dayr Az Zawr province in Syria from 2000 to 2016.
Atmosphere 12 01350 g006
Figure 7. (a) Study area (black box) for the annual spatial-averaged retrievals of (b) surface dust concentration (in μg m−3) and dust load (in g m−2) from MERRA-2, (c) AOD550 from Terra-MODIS and MERRA-2, (d) NDVI from MODIS and, (e) dry deposition (in μg m−2 s−1), wet deposition (in μg m−2 s−1), and average rainfall (in mm day−1) from MERRA-2.
Atmosphere 12 01350 g007
Figure 8. Spatial distribution of the mean surface dust concentration (in μg m−3) (a), dust load (in g m−2) (b), dry deposition (in μg m−2 s−1) (c) and wet deposition (in μg m−2 s−1) (d) from MERRA-2 retrievals during 1997–2018 over southwest Iran.
Atmosphere 12 01350 g008
Figure 9. Spatial distribution of Terra-MODIS L3 AOD over the Middle East, south, and central Asia during July 2000–2018 (a), July 2009 (b) and the difference (c). Superimposed vector winds correspond to wind regime over each period and the difference. MODIS level 2 (10 km × 10 km) AOD differences are observed in (d) with an emphasis over the study region. Black dots show the five examined stations in southwest Iran.
Atmosphere 12 01350 g009
Table 1. The selected meteorological stations in southwest Iran and total number of dust days during 1997–2018.
Synoptic StationLongitudeLatitudeElevationTotal Number of Dust Days
Ahvaz48.631.3322.51289
Abadan48.2530.3361767
Bushehr50.8328.96291371
Kermanshah47.1534.351318863
Ilam46.4233.641387948
Table 2. Number of dust days in July 2009 with respect to the average number of dust days during July months of the period 2000–2017 at meteorological stations in west, southwest, and south Iran.
Synoptic StationLocationNumber of Dust Days in July 2009Mean Number of Dust Days in July (2000 to 2017)
GotvandSouthwest317.2
KangvarWest317.2
AhvazSouthwest3013
BostanSouthwest3014.4
DorudWest298.9
IzehSouthwest2910.5
AbadanSouthwest2813.6
Masjed-SoleymanSouthwest3013.8
KermanshahWest288
GilanegharbWest277
DehloranSouthwest2713.5
Khark IslandPersian Gulf265.1
EyvanWest306.7
Khoram AbadWest2510
BushehrSouth258.9
ArakWest249.5
Bandar DayyerWest2212.5
Publisher’s Note: MDPI stays neutral with regard to jurisdictional claims in published maps and institutional affiliations.

