
Short-Term Associations between Morbidity and Air Pollution in Metropolitan Area of Monterrey, Mexico

 ,
,  ,
,  ,
,
Abstract
:1. Introduction
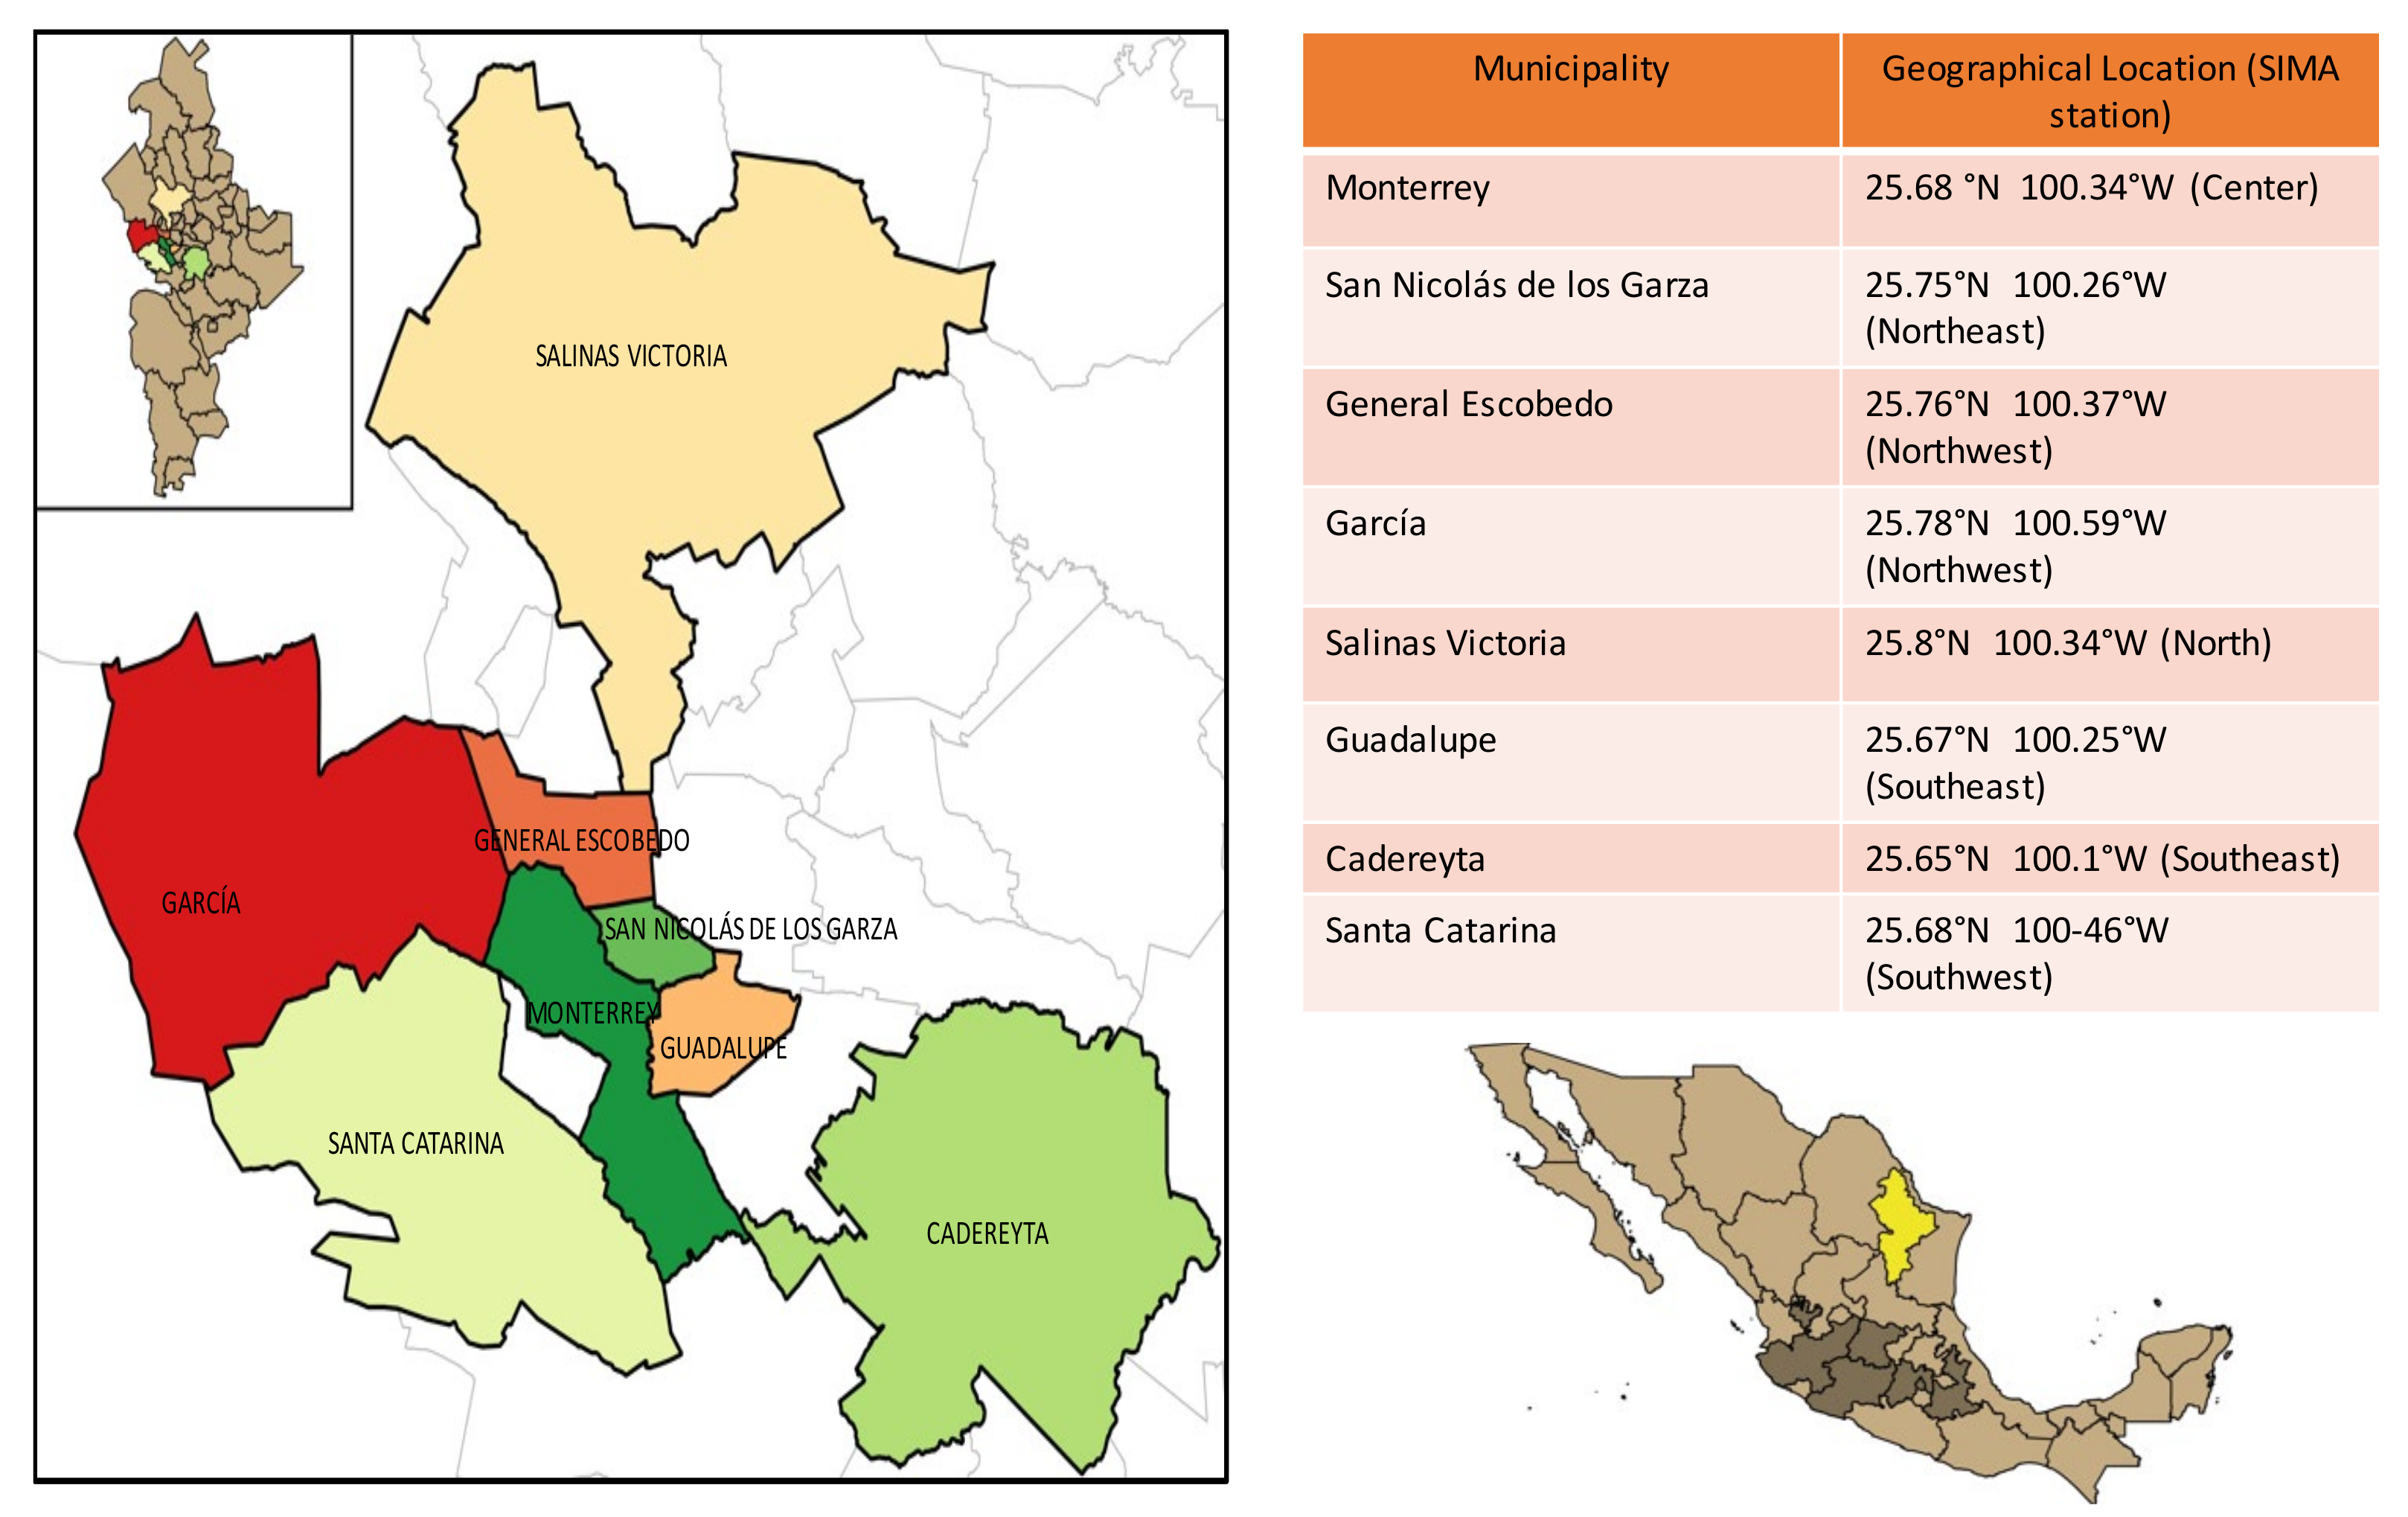
2. Study Area
3. Materials and Methods
3.1. Air Quality Data
3.2. Epidemiologic Data
3.3. Response, Explanatory and Confounding Variables
3.4. Statistical Analysis and Association between Criteria Air Pollutants and Morbidity
4. Results
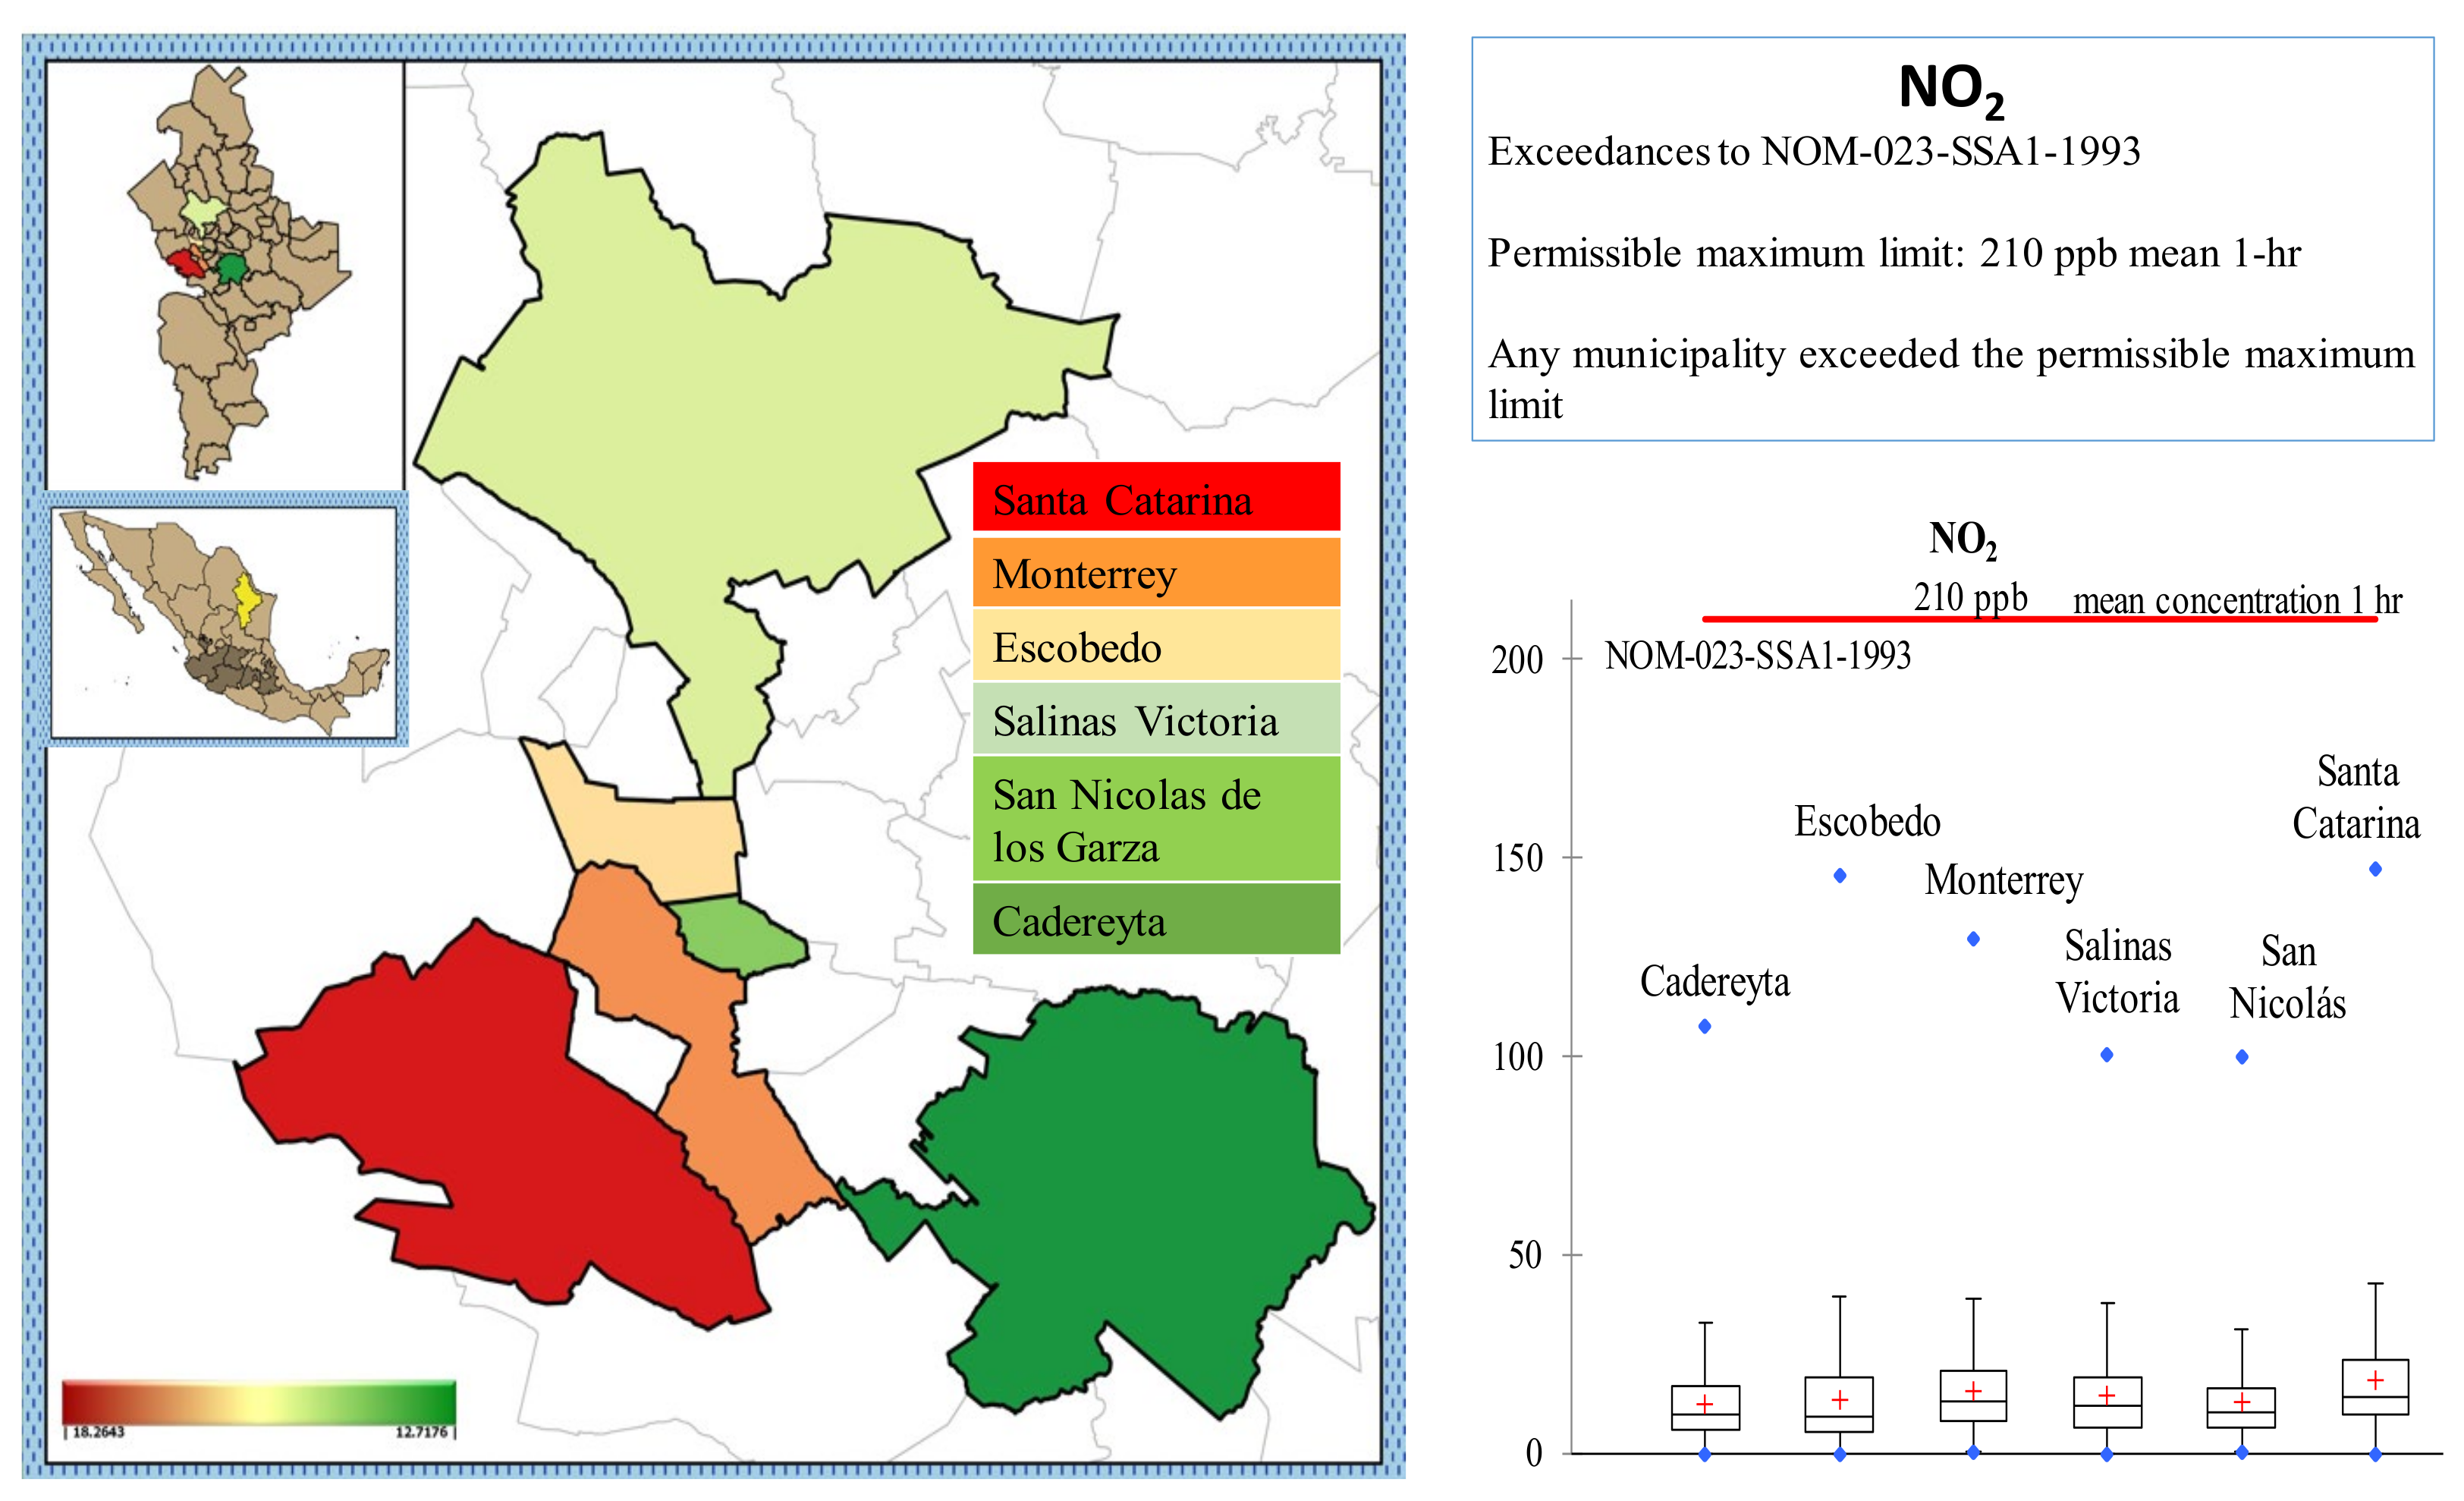
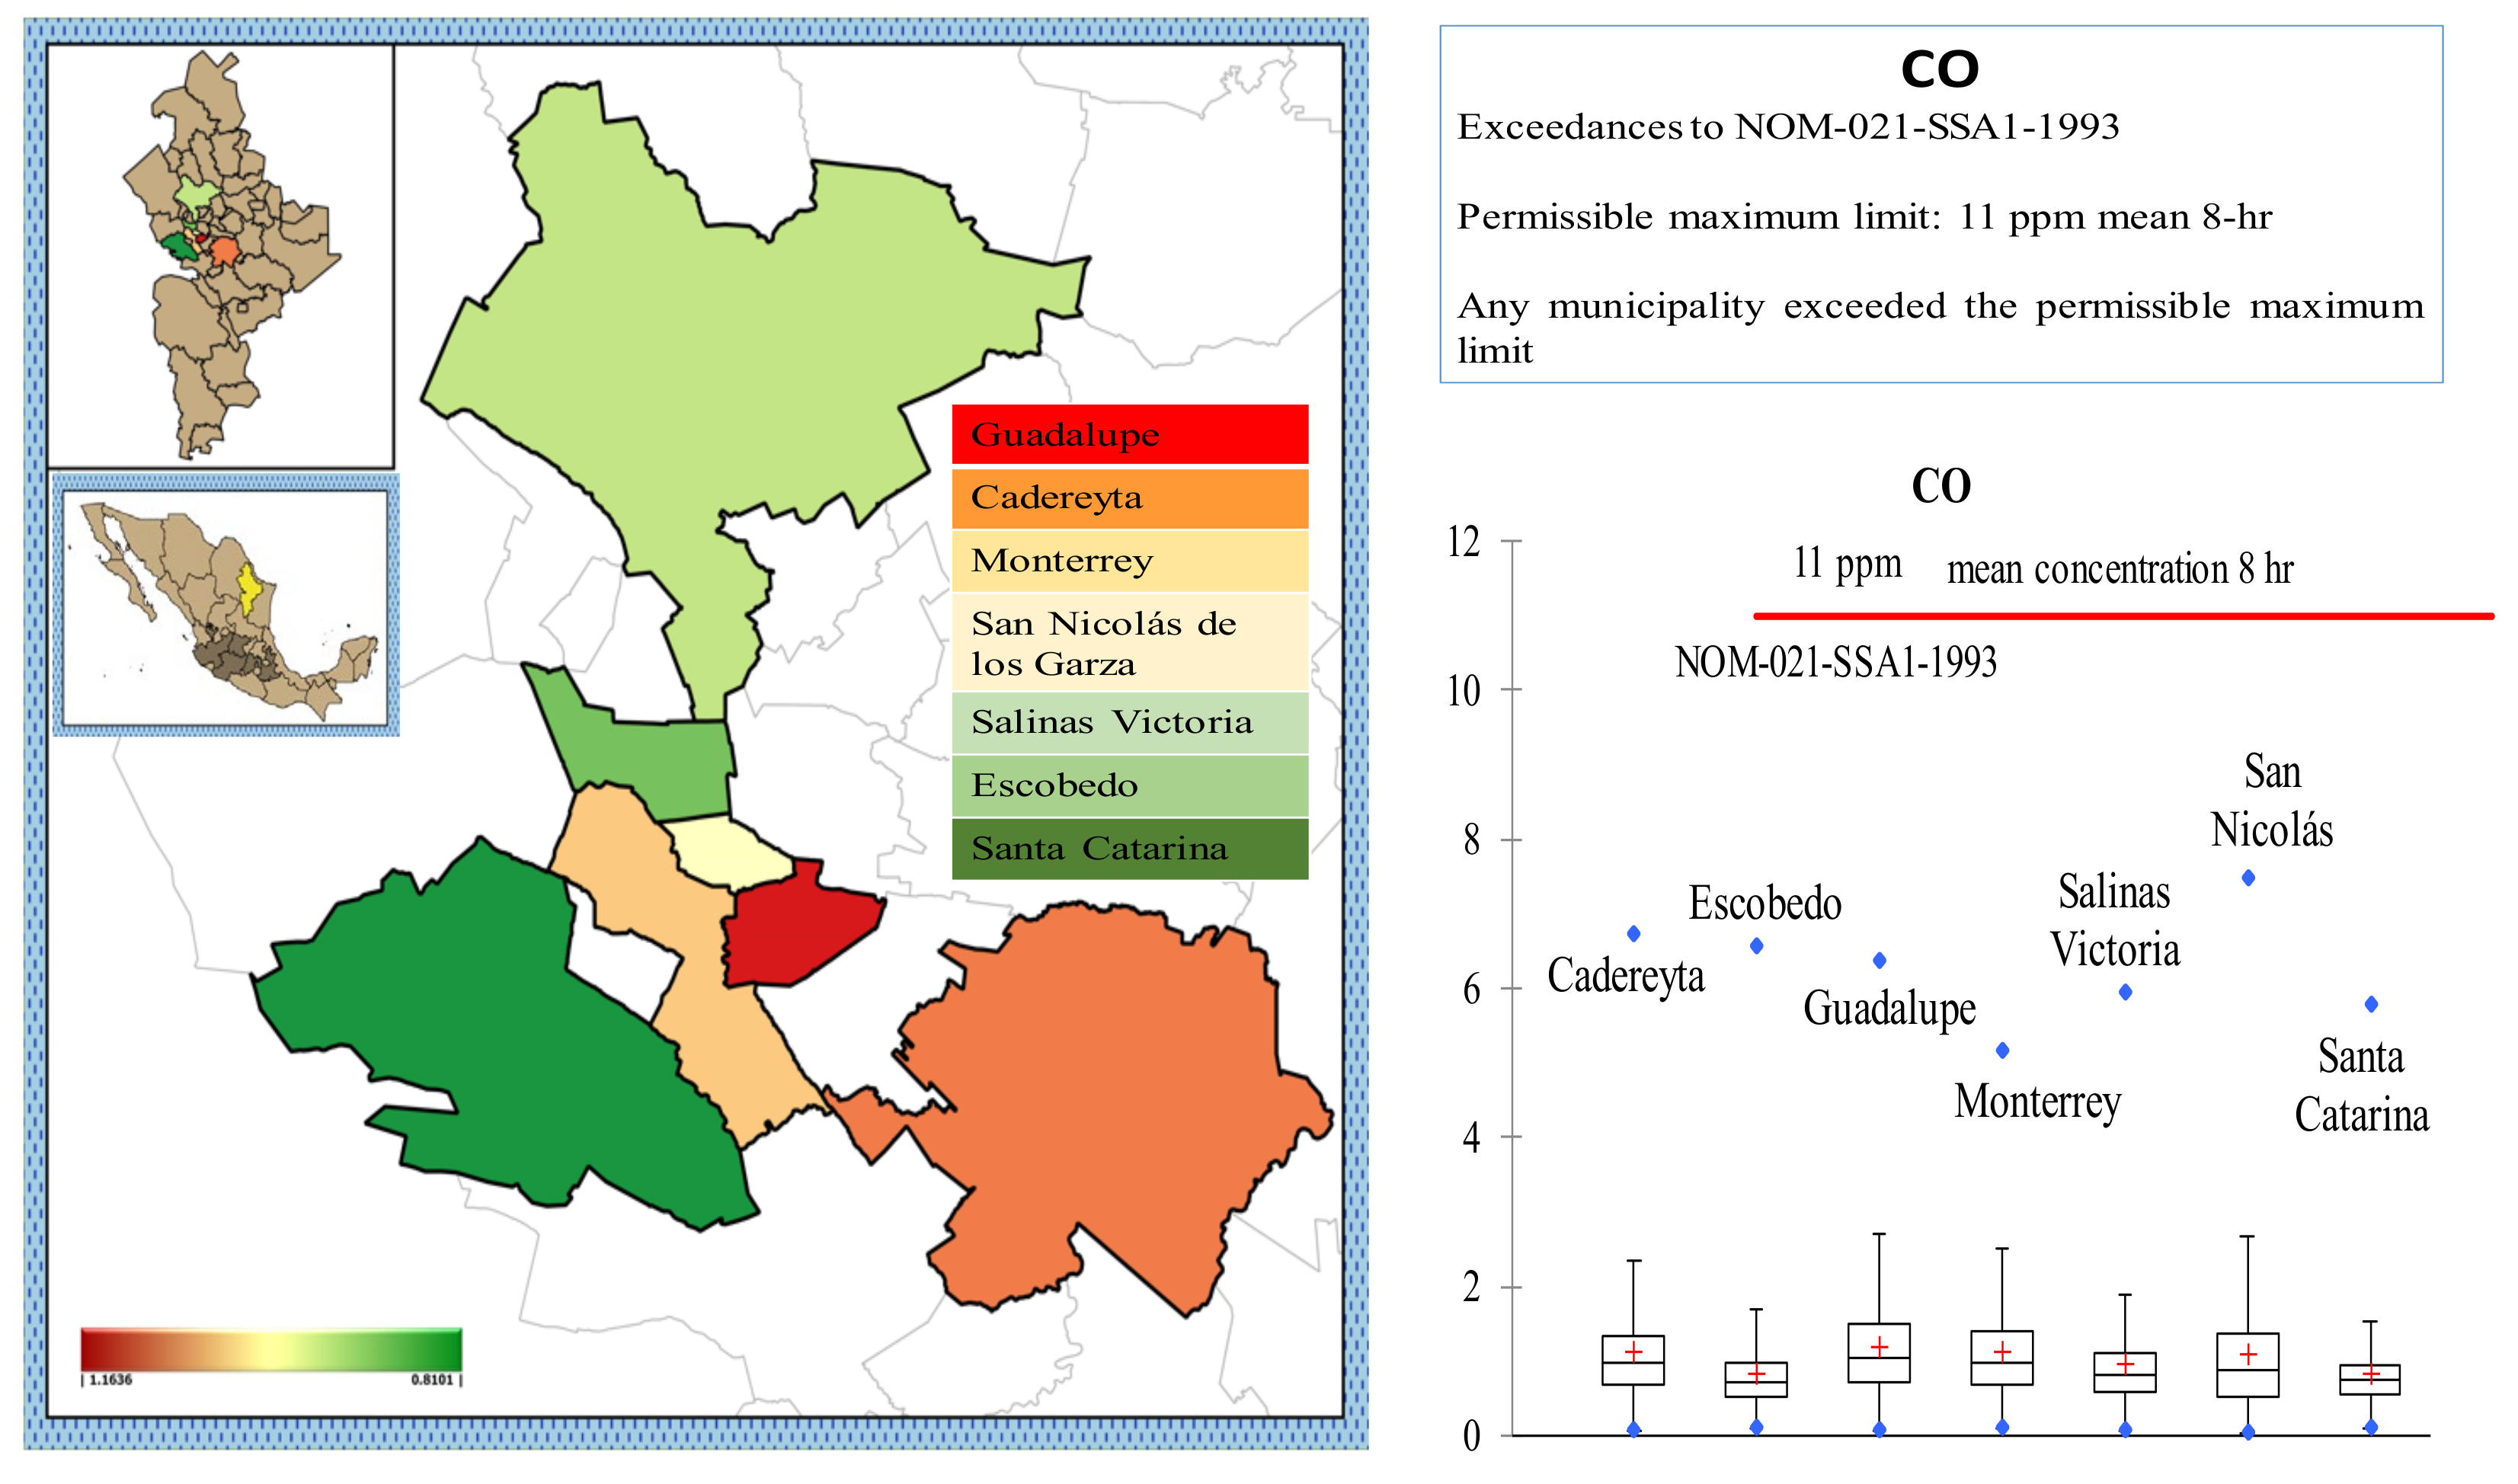
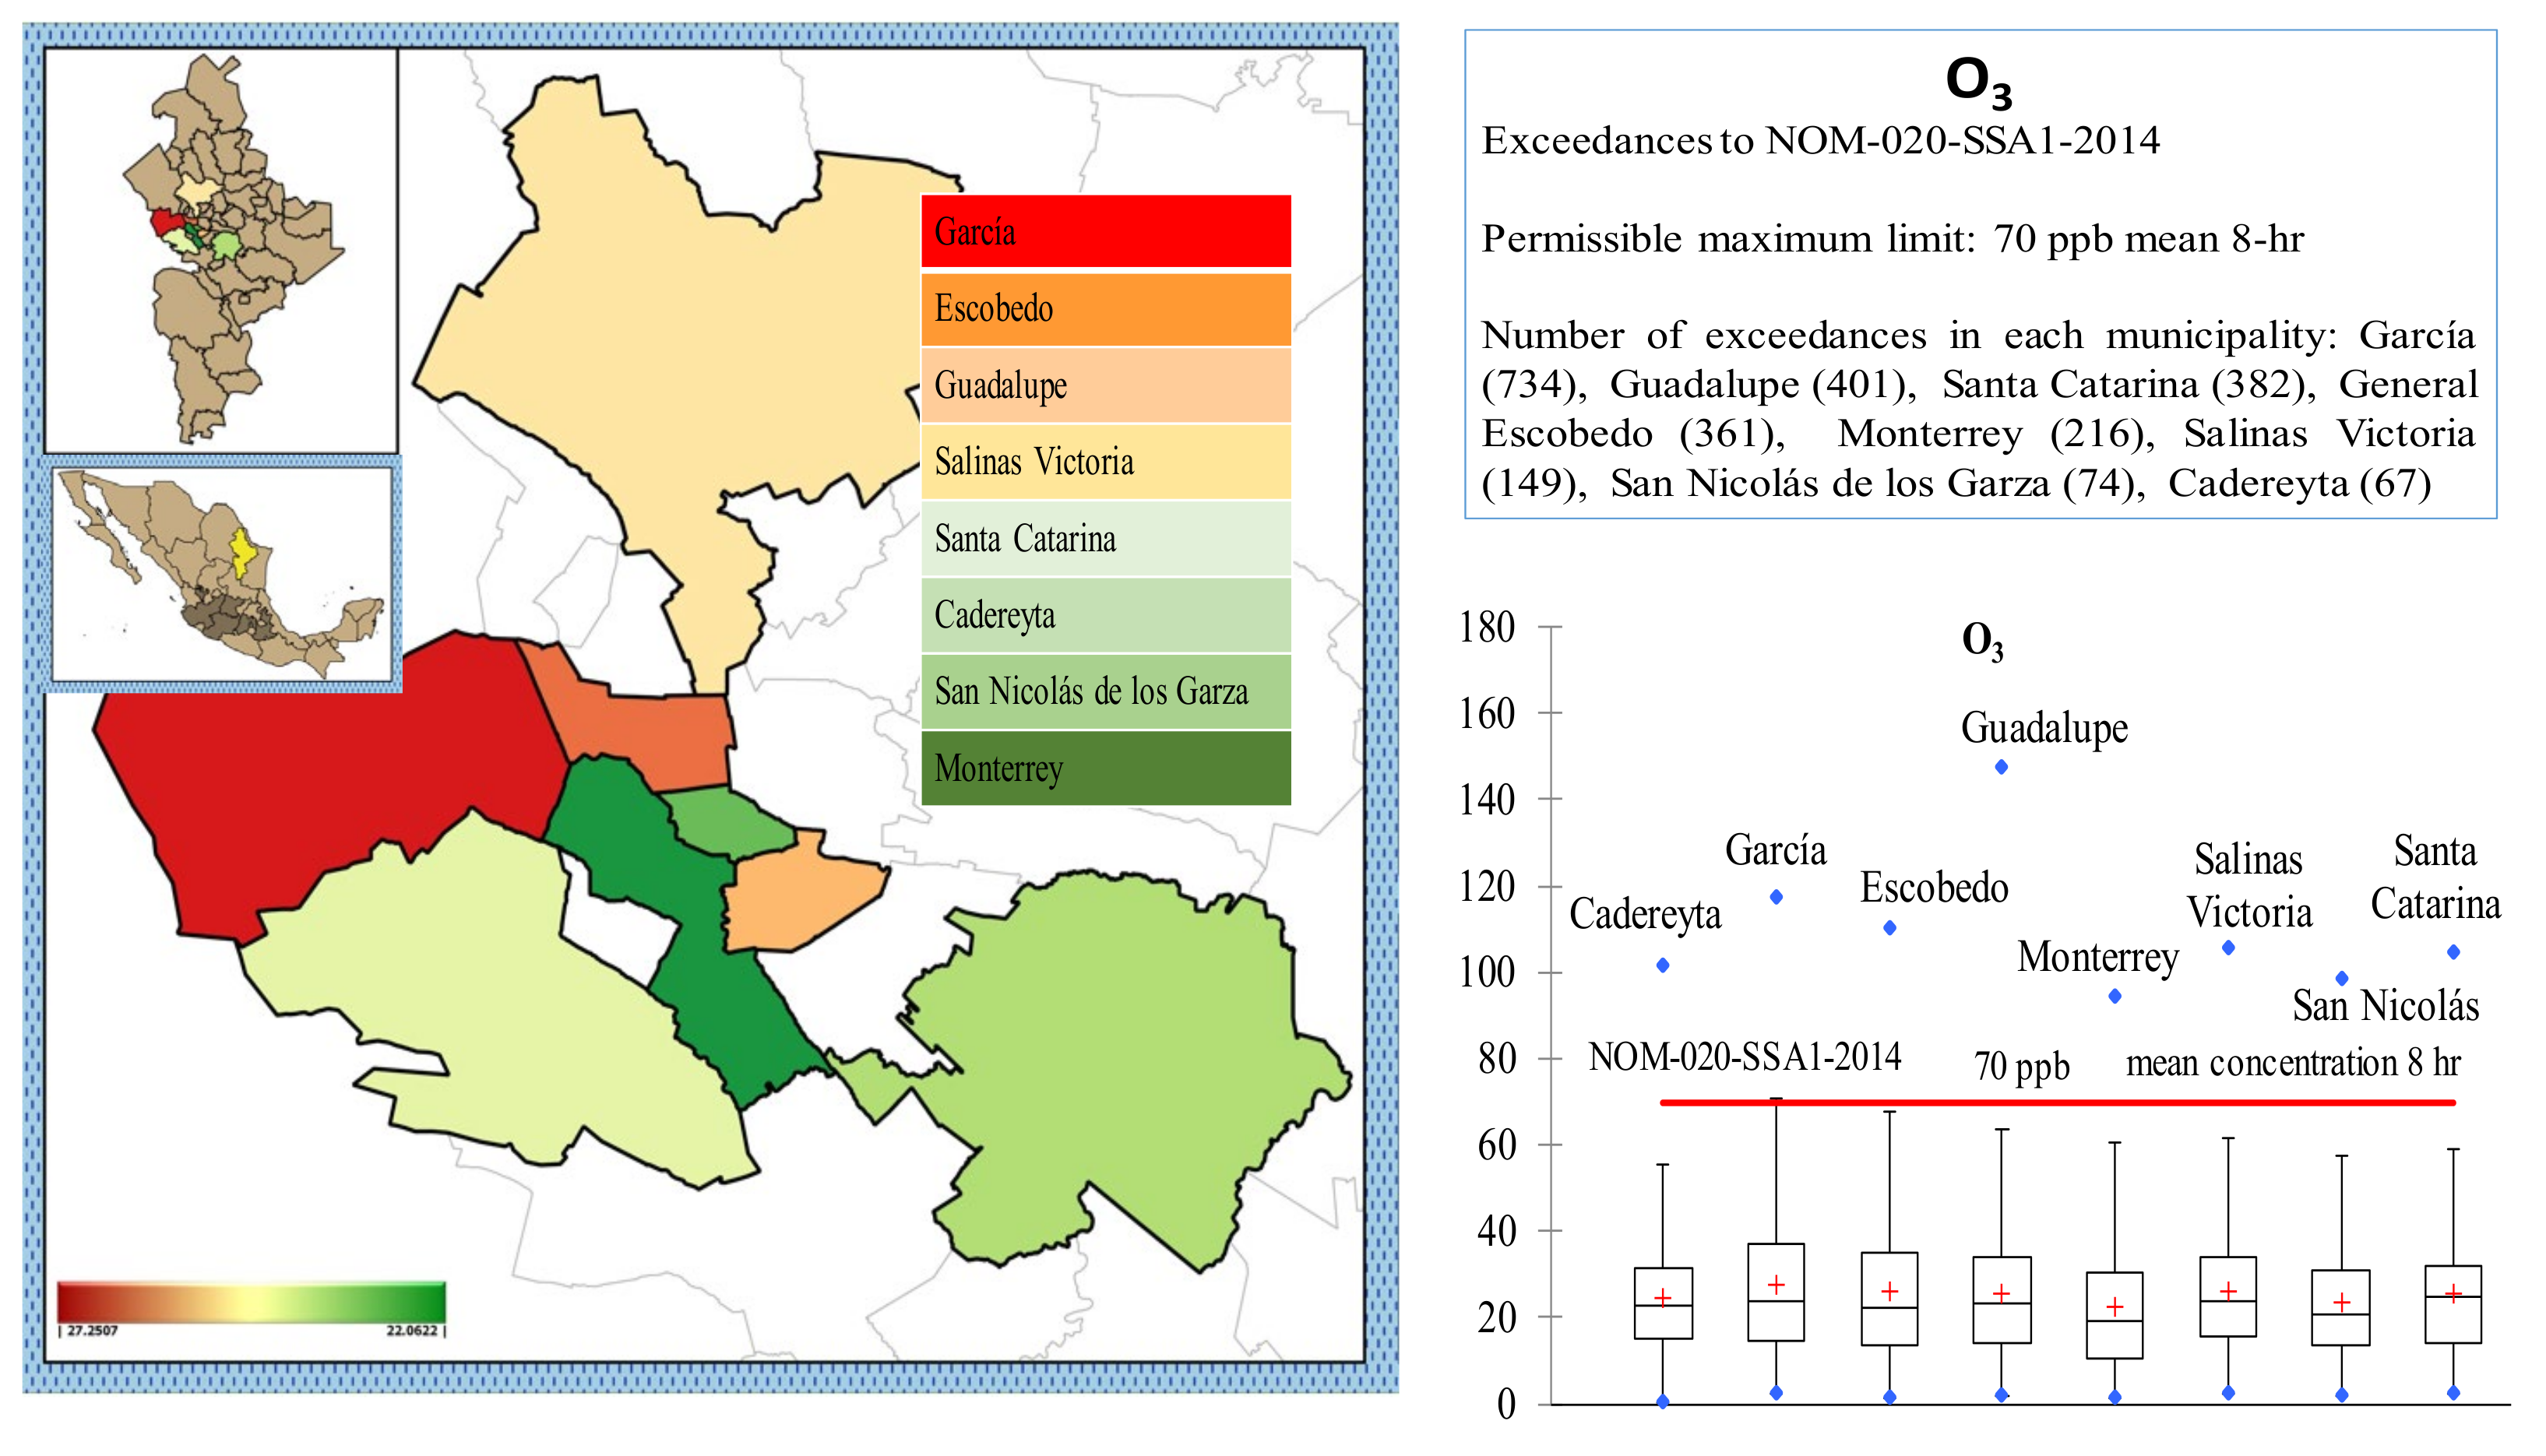
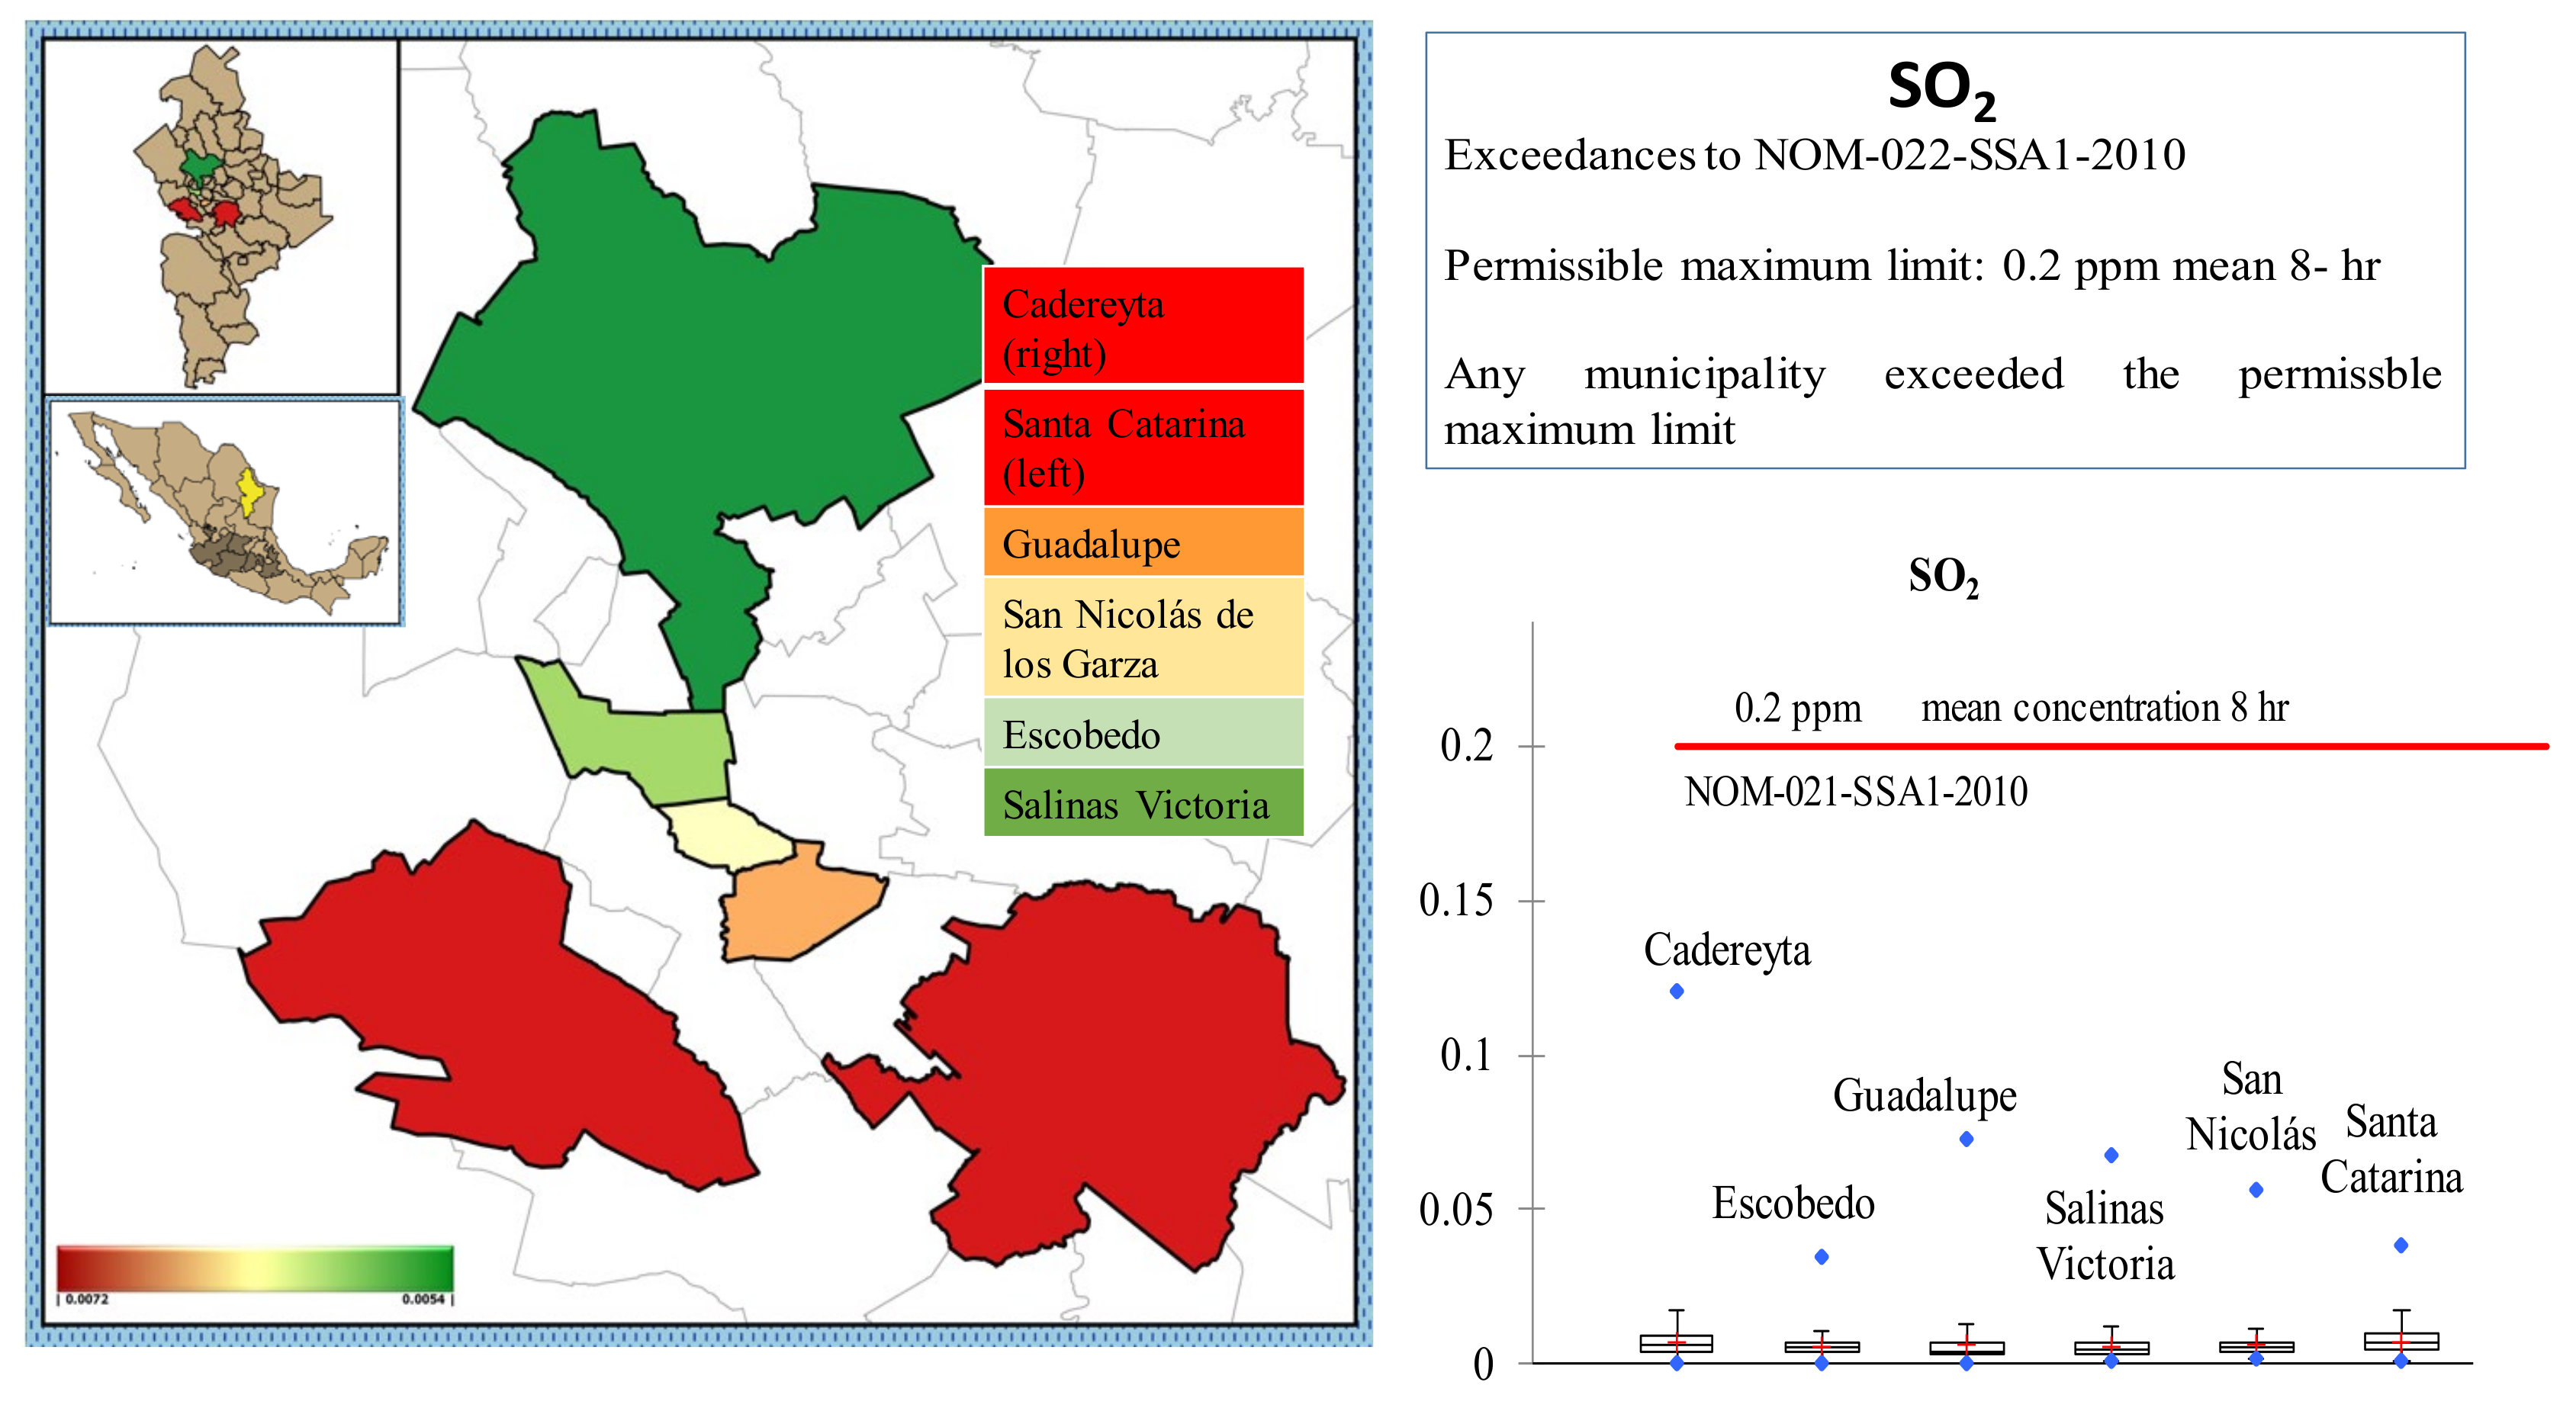
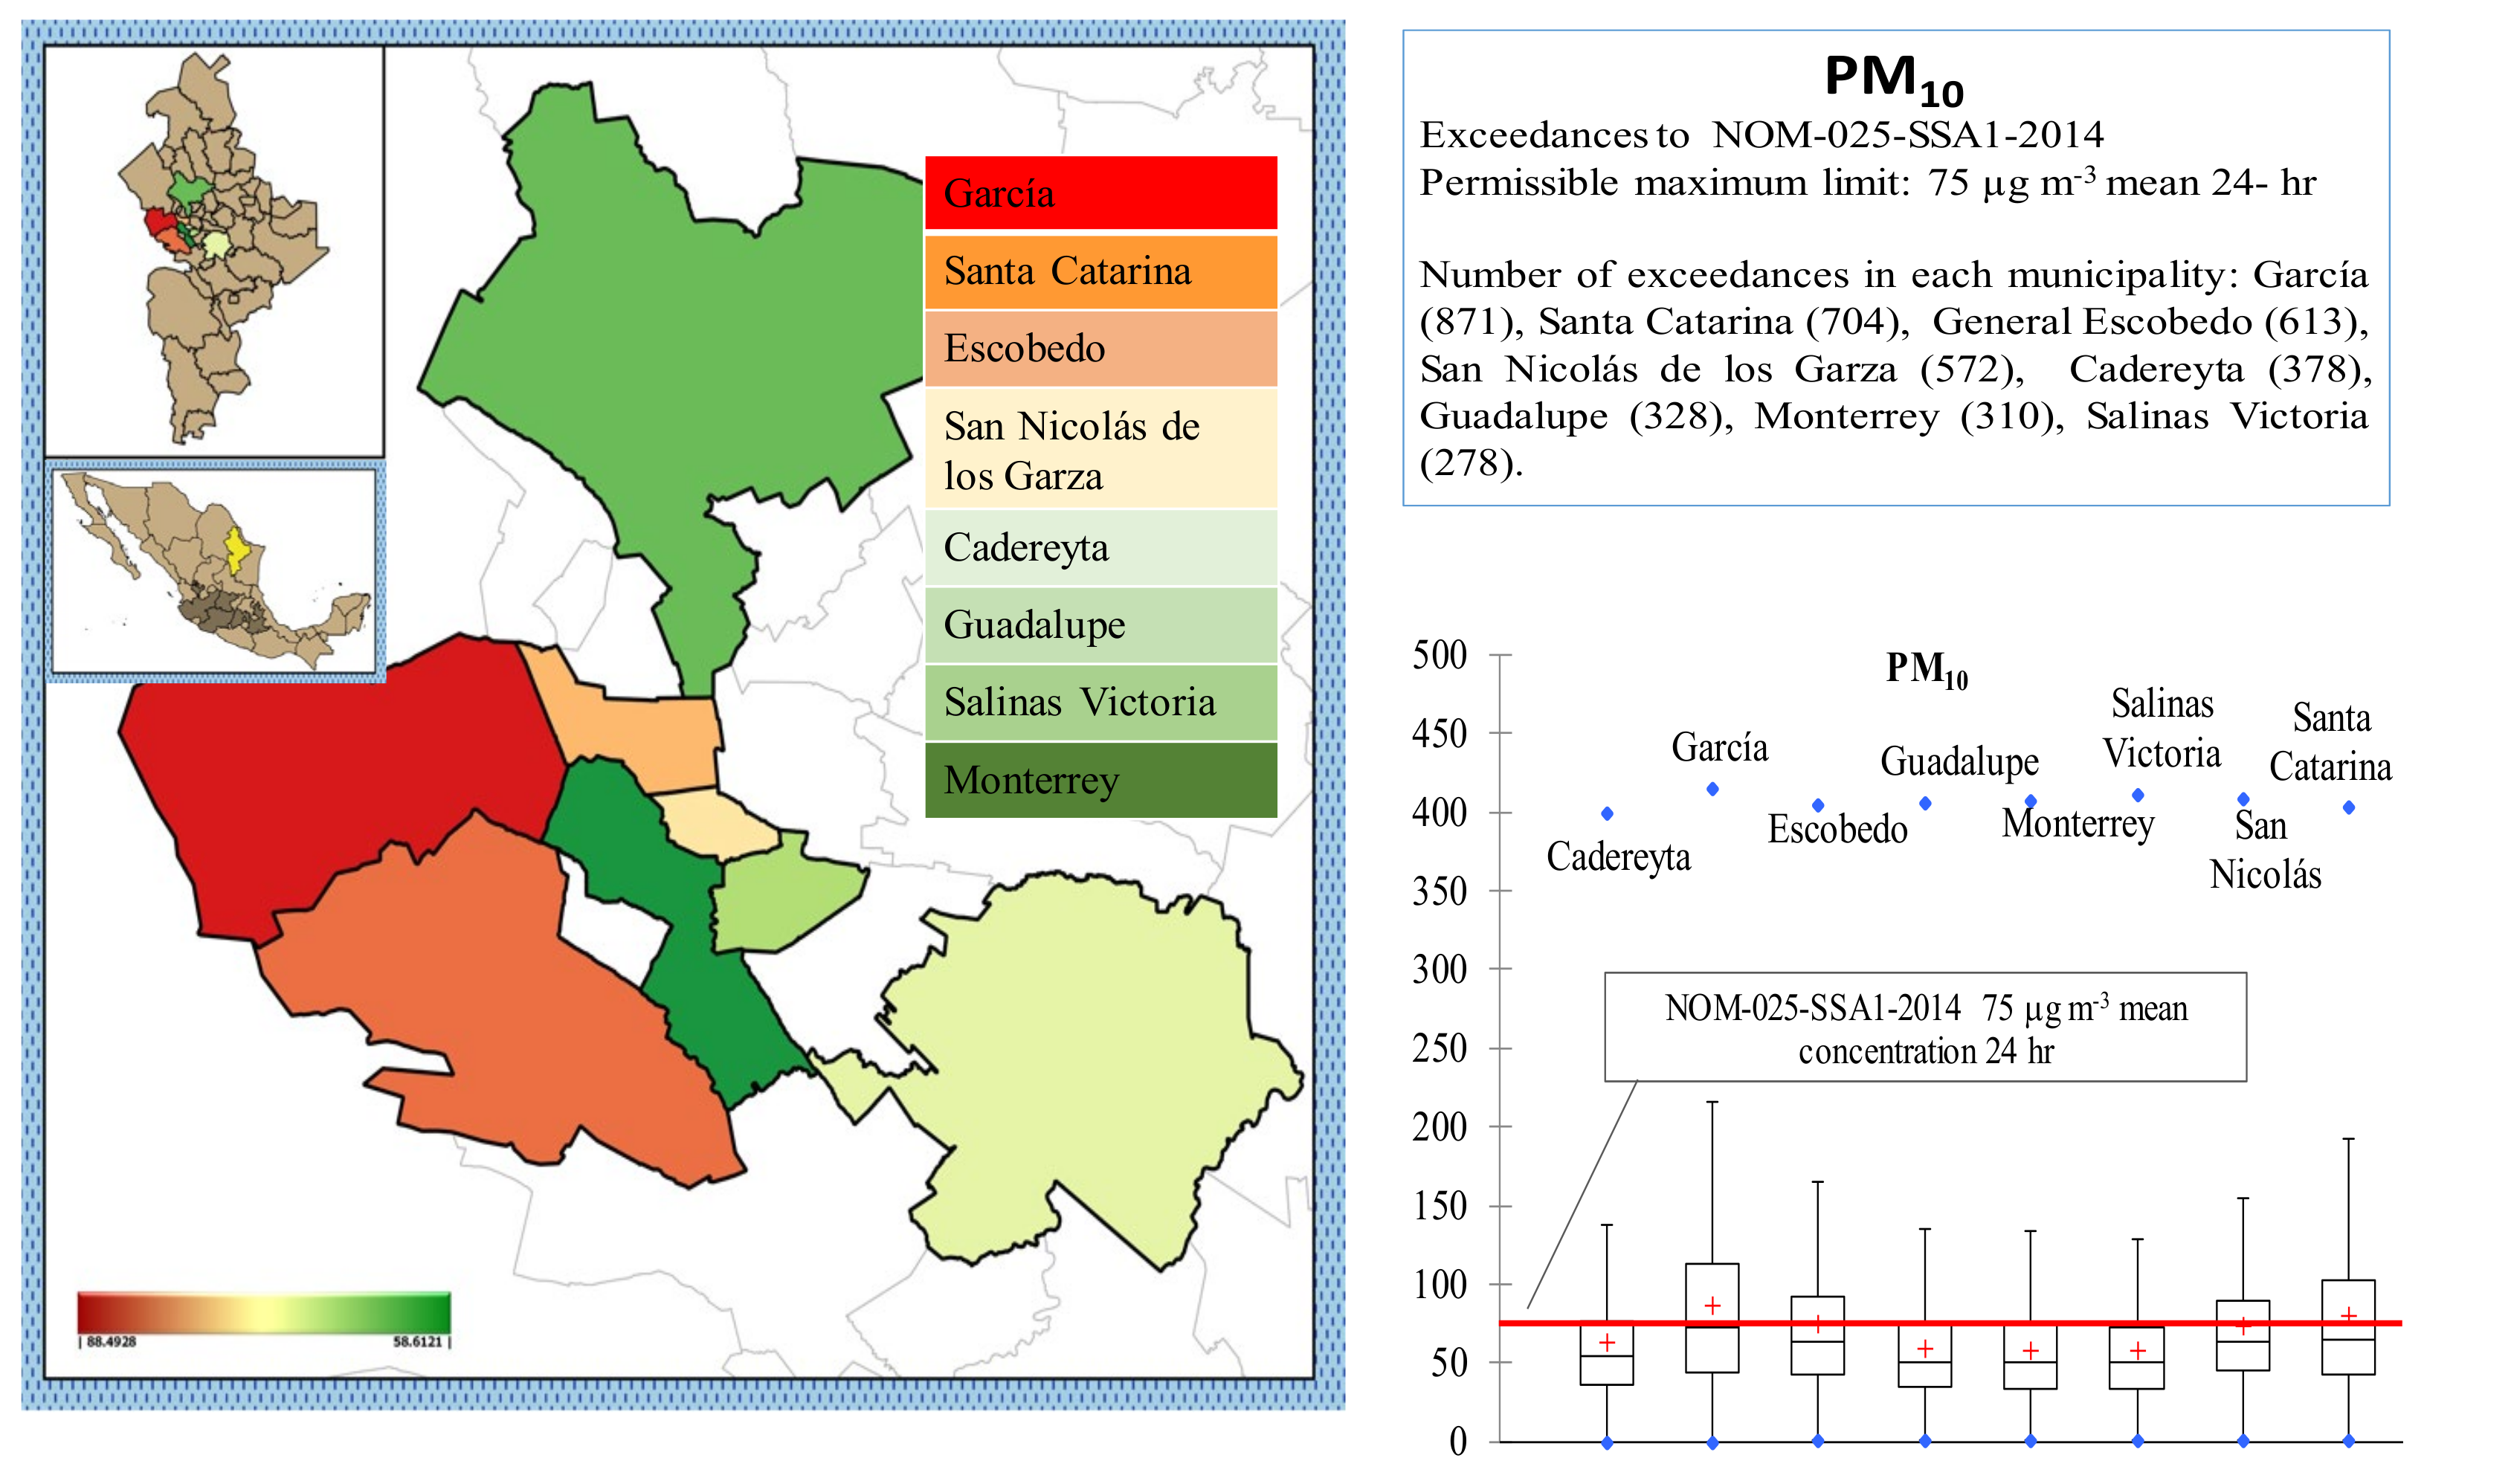
4.1. Air Quality and Exceedances
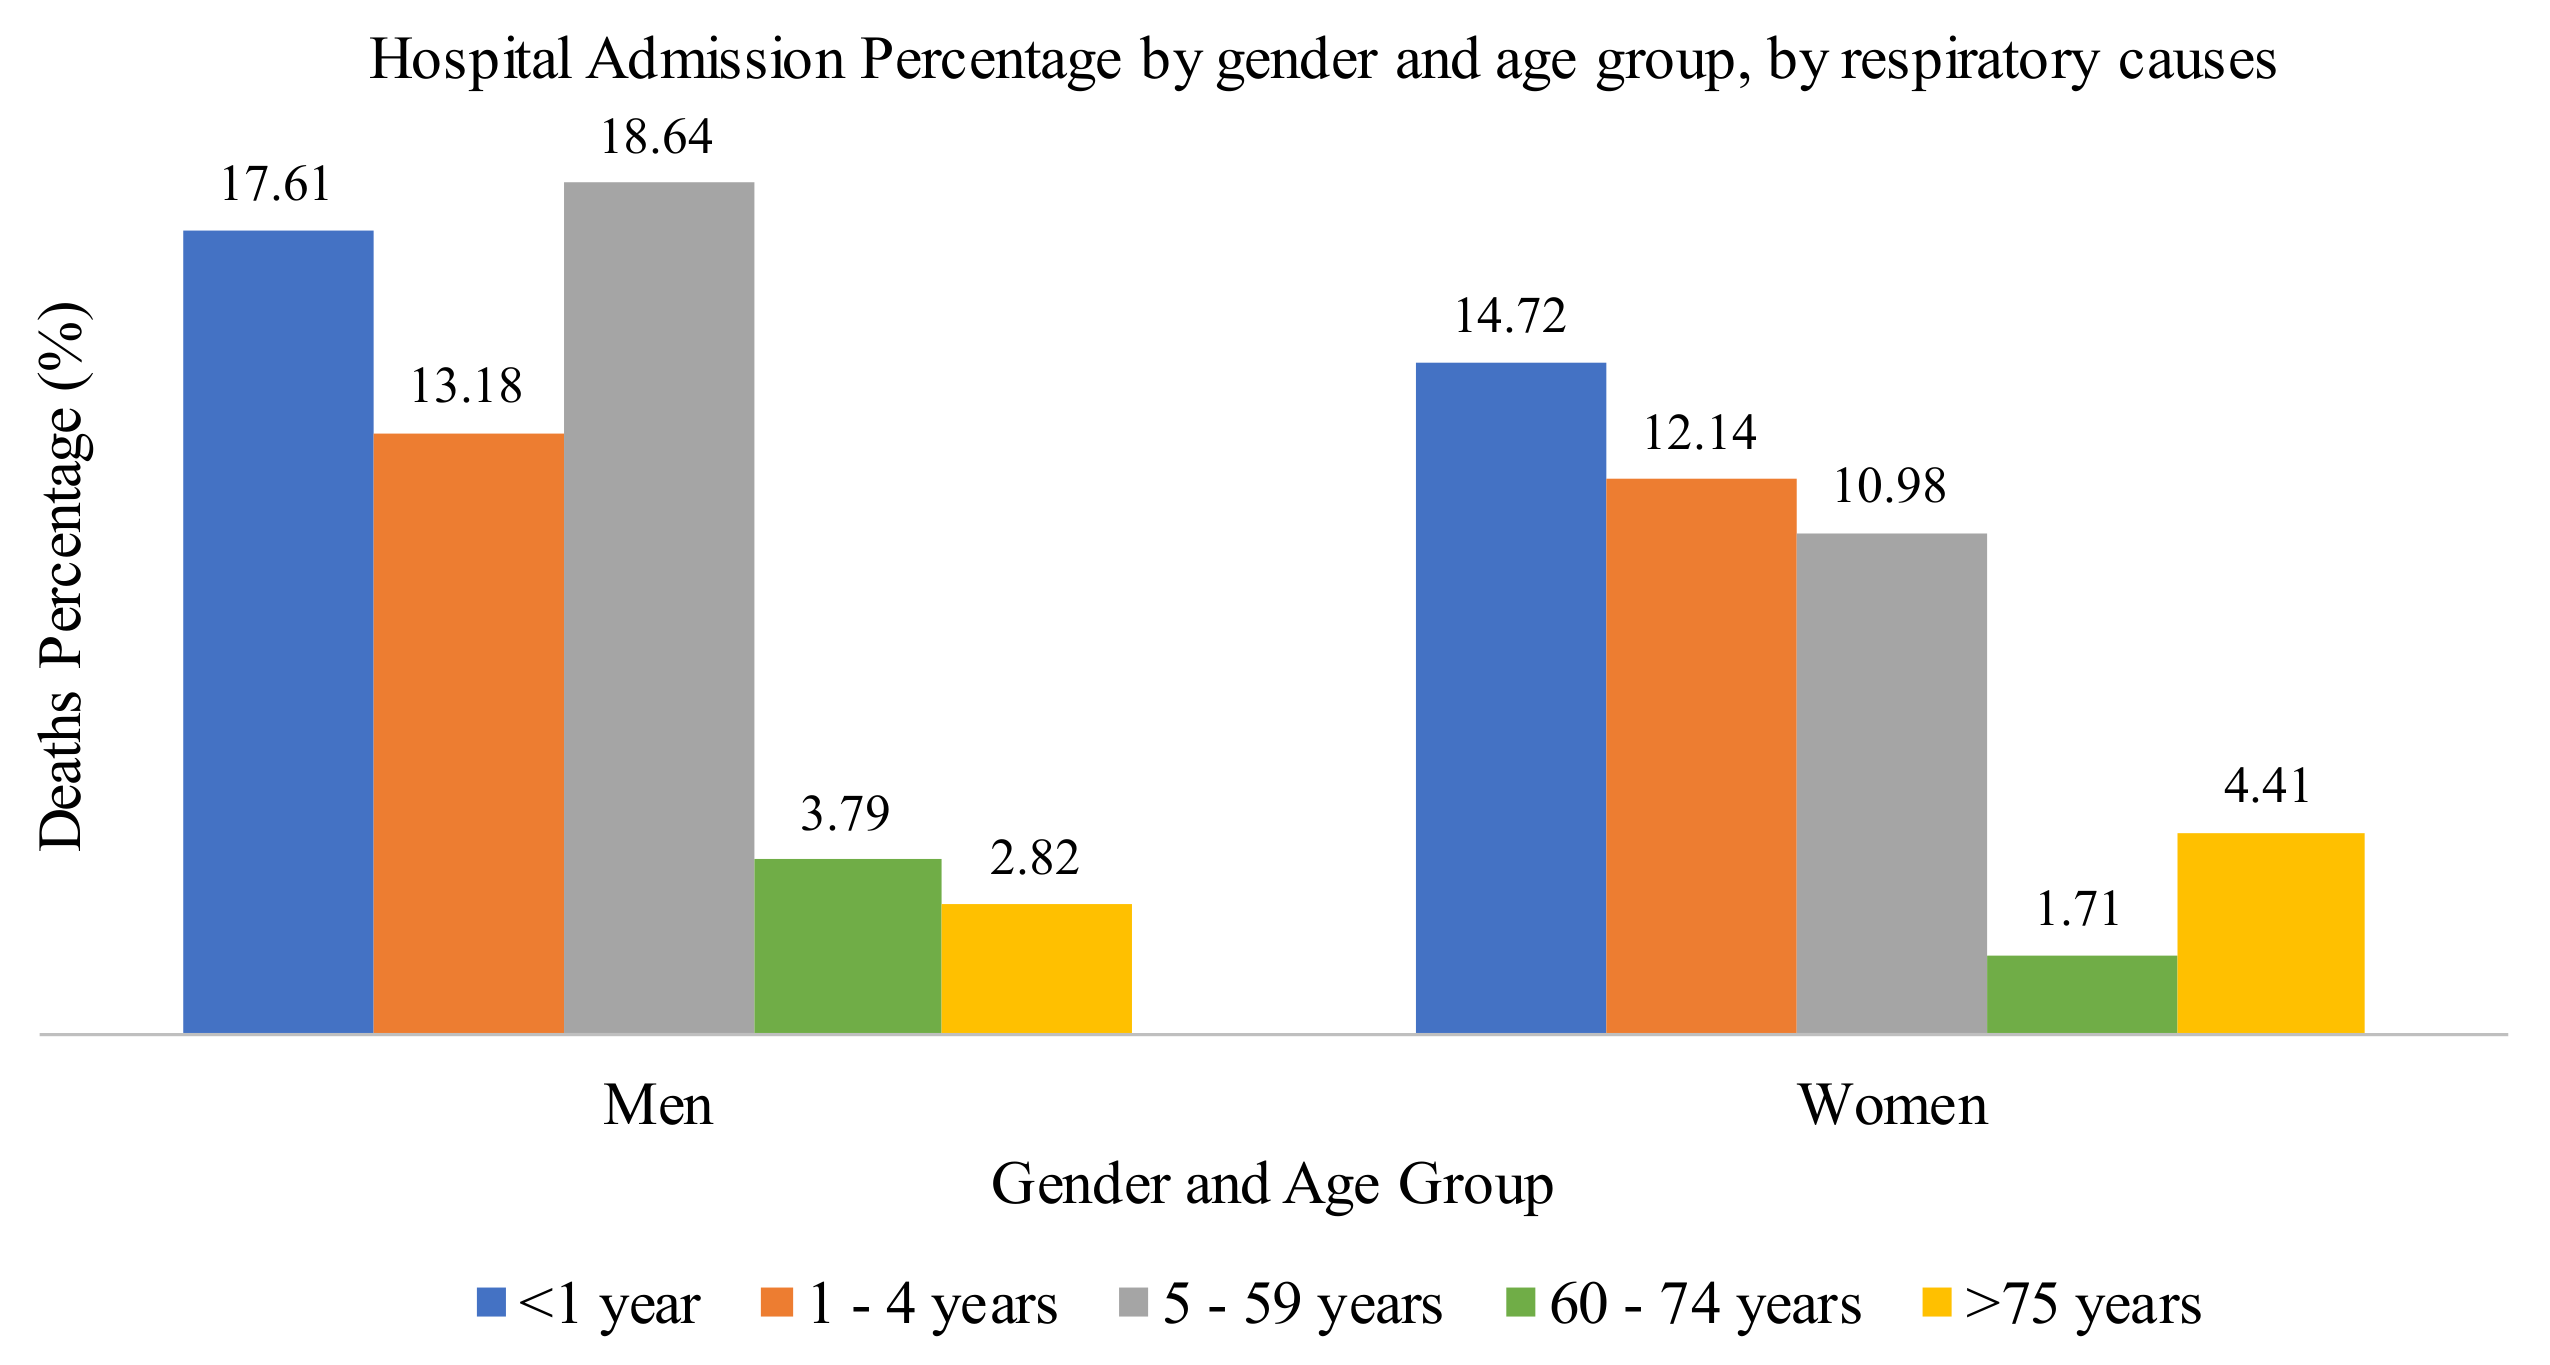
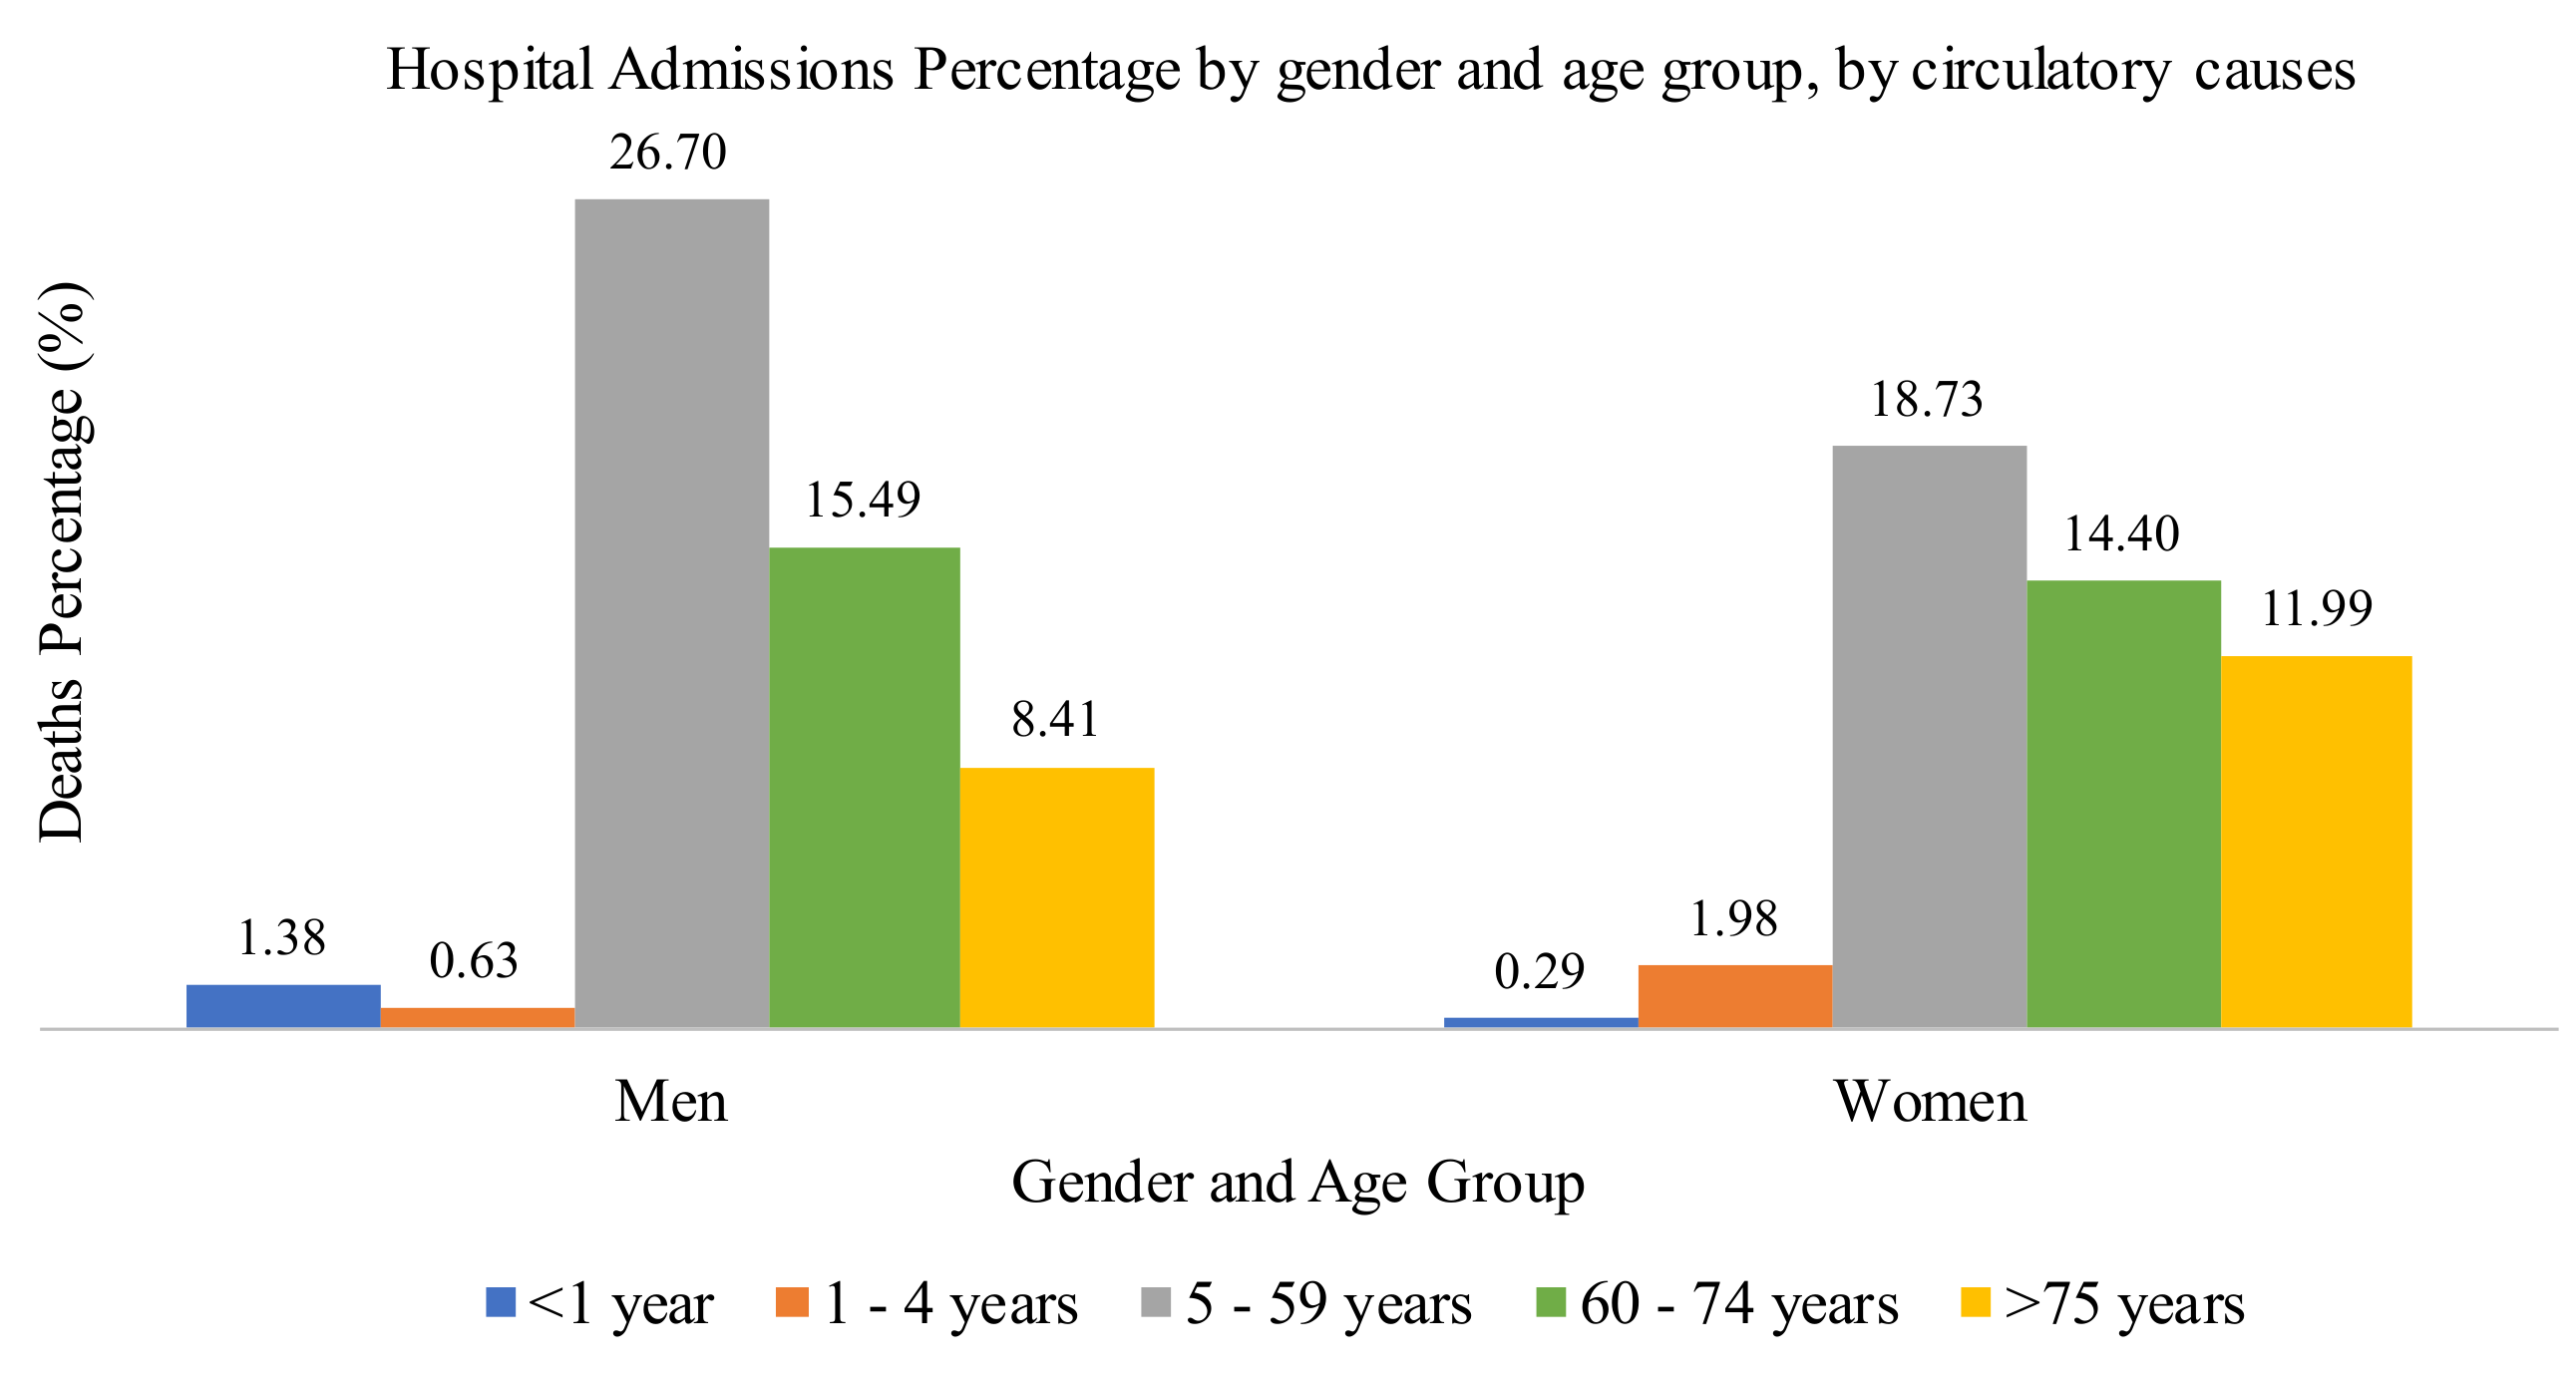
4.2. Epidemiologic Study
4.3. Statistical Analysis and Association between Criteria Air Pollutants and Morbidity
4.3.1. Analysis of Daily Morbidity Considering All Causes
4.3.2. Analysis of Daily Morbidity Considering Respiratory Causes
4.3.3. Analysis of Daily Morbidity Considering Circulatory Causes
4.3.4. Relative Risk Index and Comparison with Other Studies
4.4. Discussion
4.4.1. Exposure Data
4.4.2. Health Data
4.4.3. Association between Morbidity and Criteria Air Pollutants
4.4.4. Seasonality
4.4.5. Population Characteristics
4.4.6. Housing Conditions and Study Zone
4.4.7. Exposure Assessment
5. Conclusions
Author Contributions
Funding
Informed Consent Statement
Data Availability Statement
Acknowledgments
Conflicts of Interest
References
- Correia, A.W.; Pope, C.A., III; Dockery, D.; Wong, Y.; Ezzati, M.; Dominici, F. The effect of air pollution control on life expectancy in the United States: An analysis of 545 US counties for the period 2000 to 2007. Epidemiology 2007, 20B, 23–31. [Google Scholar] [CrossRef] [PubMed] [Green Version]
- Maciejewska, K. Short-term impact of PM2.5, PM10 and PMc on mortality and morbidity in the agglomeration of Worsaw, Poland. Air Qual. Atmos. Health 2020, 13, 659–672. [Google Scholar] [CrossRef]
- Khaniabadi, Y.O.; Sicard, P.; Takdastan, A.; Khaniabadi, J.G.; De Marco, A.; Daryanoosh, M. Mortality and morbidity due to ambient air pollution in Iran. Clin. Epidemiol. Glob. Health 2019, 7, 222–227. [Google Scholar] [CrossRef] [Green Version]
- Samek, L. Overall human mortality and morbidity due to exposure to air pollution. Int. J. Occup. Med. Environ. Health 2016, 29, 417–426. [Google Scholar] [CrossRef] [PubMed]
- Lipfert, F.W. Long-term association of morbidity with air pollution: A catalog and synthesis. J. Air Waste Manag. Assoc. 2018, 68, 12–28. [Google Scholar] [CrossRef] [PubMed]
- Ai, A.; Wang, C.; Qian, Z.; Cui, Y.; Liu, Y.; Acharya, B.K.; Sun, X.; Hinyard, L.; Jansson, D.; Qin, L.; et al. Hourly associations between ambient air pollution and emergency ambulance calls in one Central Chinese city: Implications for hourly air quality standards. Sci. Total. Environ. 2019, 695, 133956. [Google Scholar] [CrossRef] [PubMed]
- Helfand, W.H.; Lazarus, J.; Theerman, P. Donora, Pensylvania: An environmental disaster of the 20th century. Amb. J. Public Health 2001, 91, 553. [Google Scholar]
- De Pablo, F.; López, A.; Rivas Soriano, L.; Tomás, C. Relationships of daily mortality and hospital admission to air pollution in Castilla-León, Spain. Atmosfera 2006, 19, 23–39. [Google Scholar]
- Romieu, I. Health impacts of air pollution on morbidity and mortality among children of Ciudad Juarez, Chihuahua, Mexico. Comm. Environ. Coop. N. Am. 2003, 35, 45. [Google Scholar]
- Cerón, R.; Cerón, J.; Lara, R.; Espinosa, M.L.; Ramírez, E.; Rangel, M.; Rodríguez, A.; Uc, M. Short-term effects of air pollution health in the Metropolitan Area of Guadalajara using a time-series approach. Aerosol Air Qual. Res. 2018, 18, 2383–2411. [Google Scholar] [CrossRef] [Green Version]
- Cerón, R.; Cerón, J.; Kahl, J.; Espinosa, M.; Ramírez, E.; Rangel, M.; Lara, R.; Uc, M. Short-term effects of air pollution on daily mortality and their modification by increased temperaturas associated with a climatic change scenario in Northern Mexico. Int. J. Environ. Res. Public Health 2020, 17, 9219. [Google Scholar]
- Dominic, F.; Peng, R.D.; Zeger, S.L.; White, R.H.; Samet, J.M. Particulate air pollution and mortality in the United States: Did the risks change from 1987 to 2000? Am. J. Epidemiol. 2007, 166, 880–888. [Google Scholar] [CrossRef] [PubMed]
- Pope, C.A., III; Ezzati, M.; Dockery, D.W. Fine-particulate air pollution and life expectancy in the United States. N. Engl. J. Med. 2006, 360, 376–386. [Google Scholar] [CrossRef] [PubMed] [Green Version]
- INEGI. National Institute of Statistic, Geography and Informatics. Population Census; INEGI: Mexico City, Mexico, 2020. [Google Scholar]
- NOM-022-SSA1-2010. Environmental Health. Criteria to Assess Air Quality of Ambient Air Regarding to Sulfur Dioxide (SO2); DOF: Mexico City, Mexico, 2010.
- NOM-021-SSA1-1993. Environmental Health. Criteria to Assess Air Quality of Ambient Air Regarding to Carbon Monoxide (CO); DOF: Mexico City, Mexico, 1993.
- NOM-023-SSA1-1993. Environmental Health. Criteria to Assess Air Quality of Ambient Air Regarding to Nitrogen Dioxide (NO2); DOF: Mexico City, Mexico, 1993.
- NOM-020-SSA1-1993. Environmental Health. Criteria to Assess Air Quality of Ambient Air Regarding to Ozone (O3); DOF: Mexico City, Mexico, 1993.
- NOM-025-SSA1-2014. Environmental Health. Criteria to Assess Air Quality of Ambient Air Regarding to Particles Minor than 10 Microns (PM10); DOF: Mexico City, Mexico, 2014.
- NOM-038-SEMARNAT-1993. Mexican Regulation that Establish Measuring Methods to Determine the Concentration of Sulfur Dioxide in Ambient Air and the Procedures for Calibration of Measuring Equipment; DOF: Mexico City, Mexico, 1993.
- NOM-034-SEMARNAT-1993. Mexican Regulation that Establish Measuring Methods to Determine the Concentration of Carbon Monoxide in Ambient Air and the Procedures for Calibration of Measuring Equipment; DOF: Mexico City, Mexico, 1993.
- NOM-037-SEMARNAT-1993. Mexican Regulation that Establish Measuring Methods to Determine the Concentration of Nitrogen Dioxide in Ambient Air and the Procedures for Calibration of Measuring Equipment; DOF: Mexico City, Mexico, 1993.
- NOM-036-SEMARNAT-1993. Mexican Regulation that Establish Measuring Methods to Determine the Concentration of Ozone in Ambient Air and the Procedures for Calibration of Measuring Equipment; DOF: Mexico City, Mexico, 1993.
- Epa, U.S. Reference method to measuring PM10 and PM2.5 in ambient air. Manual reference method RFPS-0699-130. Fed. Regist. 1999, 64, 33481. [Google Scholar]
- Preda, C.; Saporta, G.; Mbarek, M. The NIPALS algorithm for missing functional data. Rev. Roum. Math. Pures Appl. 2010, 55, 315–326. [Google Scholar]
- Nelson, R.C.; Taylor, P.A.; MacGregor, J.F. Missing data methods in PCA and PLS: Score calculations with incomplete observations. Chemom. Intell. Lab. Syst. 1996, 35, 45–65. [Google Scholar] [CrossRef]
- Ping, X.; Lai, F.; Tseng, Y.; Liang, J.; Huang, G.; Yang, P. Evaluation of Imputation Methods for Missing Data and Their Effect on the Reliability of Predictive Models. Proceedings of BIOTECHNO. Sixth Int. Conf. Bioinform. Biocomput. Syst. Biotechnol. 2014, 6, 8–14. [Google Scholar]
- Nassiri, V.; Lovik, A.; Molenberghs, G.; Verbeke, G. On using multiple imputation for exploratory factor analysis of incomplete data. Behav. Res. Methods 2018, 1–15. [Google Scholar] [CrossRef] [Green Version]
- Ballester, F.; Sáez, M.; Alonso, E.; Taracido, M.; Ordoñez, J.; Aguinaga, I.; Daponte, A.; Bellido, J.; Guillen, J.; Pérez, M. El proyecto EMECAM: Estudio multicéntrico español sobre la relación entre la contaminación y la mortalidad. Antecedentes, participantes, objetivo y metodología. Rev. Esp. Salud Pública 1999, 73, 165–175. [Google Scholar] [CrossRef]
- Ballester, F.; Sáez, M.; Pérez-Hoyos, S.; Iñiquez, C.; Gandarillas, A.; Tobías, A.; Bellido, J.; Taracido, M.; Arribas, F.; Daponte, A. The EMECAM Project: A multicentre study on air pollution and mortality in Spain: Combined results for particulates and for sulfur dioxide. Occup. Environ. Med. 2002, 59, 300–308. [Google Scholar] [CrossRef] [Green Version]
- Lowe, R.; Ballester, J.; Creswick, J.; Robine, J.M.; Herrmann, F.; Rodó, X. Evaluating the performance of a climate-driven mortality model during heat waves and cold spells in Europe. Int. J. Environ. Res. Public Health 2015, 12, 1279–1294. [Google Scholar] [CrossRef] [Green Version]
- Emissions Inventory for the Metropolitan Area of Monterrey 2013. National Emissions Inventory 2016. SEMARNAT-INECC. Available online: https://gisviewer.semarnat.gob.mx/wmaplicacion/inem/ (accessed on 20 February 2020).
- Management Program to Improve the Air Quality of the State of Nuevo Léon Pro-Aire 2016–2025, SEMARNAT-Secretaría de Desarrollo Sustentable, Gobierno del Estado de Nuevo León, September 2016. Available online: https://www.gob.mx/cms/uploads/attachment/file/250974/ProAire_Nuevo_Leon.pdf (accessed on 18 March 2020).
- Téllez-Rojo, M.M.; Romieu, I.; Ruiz-Velazco, S.; Meneses-González, F.; Hernández-Avila, M. Efecto de la contaminación ambiental sobre las consultas por infecciones respiratorias en niños de la Ciudad de México. Salud Pública México 1997, 39, 513–522. [Google Scholar] [CrossRef]
- Gurjar, B.R.; Jain, A.; Sharma, A.; Agarwal, A.; Gupta, P.; Nagpure, A.S.; Lelieveld, J. Human health risks in megacities due to air pollution. Atmos. Environ. 2010, 44, 4606–4613. [Google Scholar] [CrossRef]
- Hales, S.; Atkinson, J.; Metcalfe, J.; Kuschel, G.; Woodward, A. Long-term exposure to air pollution, mortality and morbidity in New Zealand: Cohort study. Sci. Total. Environ. 2021, 801, 149660. [Google Scholar] [CrossRef]
- To, T.; Shen, S.; Atenafu, E.; Guan, J.; McLimont, S.; Stocks, B.; Licksai, C. The air quality health index and asthma morbidity: A population-based study. Environ. Health Perspect. 2013, 121, 46–52. [Google Scholar] [CrossRef]
- Abdolahnejad, A.; Jafari, N.; Mohammadi, A.; Miri, M.; Hajizadeh, Y. Mortality and morbidity due to exposure to ambient NO2, SO2 and O3 in Isfahan in 2013–2014. Int. J. Prev. Med. 2018, 9, 1–6. [Google Scholar]
- Qiu, H.; Tan, K.; Lung, F.; Wong, L.; Yu, H.; Deng, R.; Lung, H.; Zhang, Y.; Pan, J. The burden of COPD morbidity attributable to the interaction between ambient air pollution and temperature in Chengdu, China. Int. J. Environ. Res. Public Health 2018, 15, 492. [Google Scholar] [CrossRef] [PubMed] [Green Version]
- Paoin, K.; Ueda, K.; Ingviya, T.; Buya, S.; Phosri, A.; Tesoro, X.; Seubsman, S.; Kelly, M.; Sleigh, A.; Hund, A.; et al. Long-term air pollution exposure and self-reported morbidity: A longitudinal analysis from the Thai cohort study (TCS). Environ. Res. 2021, 192, 110330. [Google Scholar] [CrossRef]
- Lee, J.T.; Kim, H.; Sung, H.; Hung, Y.C.; Cho, Y.S.; Shin, S.Y. Air pollution and asthma among children in Seoul, Korea. Epidemiology 2002, 13, 481–484. [Google Scholar] [CrossRef]
- Lee, B.E.; Ha, E.H.; Park, H.S.; Kim, H.; Lee, Y.K. Air pollution and respiratory symptoms of school children in a panel study in Seoul. J. Prev. Med. Public Health 2005, 38, 465–472. [Google Scholar]
- Son, J.Y.; Lee, J.T.; Park, Y.H.; Bell, M.L. Short-term effects of air pollution on hospital admissions in Korea. Epidemiology 2013, 24, 545–554. [Google Scholar] [CrossRef]
- Kim, J.; Han, Y.; Seo, S.C.; Lee, J.Y.; Choi, J.; Kim, K.H. Association of carbon monoxide levels with allergic diseases in children. Allergy Asthma Proc. 2016, 37, e1–e7. [Google Scholar] [CrossRef]
- Lee, W.H.; Choo, Y.J.; Sun, J.Y.; Kim, H. Association between long-term exposure to air pollutants and prevalence of cardiovascular disease in 108 South Korean communities in 2008–2010: A cross-sectional study. Sci. Total. Environ. 2016, 565, 271–278. [Google Scholar] [CrossRef] [PubMed]
- Kim, H.; Kim, J.; Kim, S.; Kong, S.H.; Kim, H.J.; Kim, H. Cardiovascular effects of long-term exposure to air pollution; A population-based study with 900 845 person-years of follow-up. J. Am. Heart Assoc. 2017, 6, e007170. [Google Scholar] [CrossRef] [PubMed] [Green Version]
- Schwartz, J.; Spix, C.; Toulomi, G.; Bachárova, L.; Barumamdzadeh, T.; Le Tertre, A. Methodological issues in studies or air pollution and daily count of deaths or hospital admissions. J. Epidemiol. Community Health 1996, 50 (Suppl. S1), S3–S11. [Google Scholar] [CrossRef] [Green Version]
- Son, J.Y.; Kim, H.; Lee, J.T.; Kim, S.Y. Relationship between the exposure to ozone in Seoul and the childhood asthma-related hospital admissions according to the socioeconomic status. J. Prev. Med. Public Health 2006, 39, 81–86. [Google Scholar] [PubMed]
- Han, M.H.; Hi, Y.; Hi, J.; Ko, Y.; Kim, Y.S.; Lee, Y.J. Association between hemorrhagic stroke occurrence and meteorological factors and pollutants. BMC Neurol. 2016, 16, 59. [Google Scholar] [CrossRef] [Green Version]
- Le Tetre, A.; Medina, S.; Samoli, E.; Forsberg, B.; Michelozzi, P.; Boumghar, A. Short-term effects of particulate air pollution on cardiovascular diseases in eight European cities. J. Epidemiol. Community Health 2004, 56, 773–779. [Google Scholar] [CrossRef]
- Khaniabadi, Y.; Pierre, S.; Khaniabadi, A.O.; Mohamma, S.; Keishams, F.; Takdastan, A.; Abolreza, N.; De Marco, A.; Goudorzi, G.; Daryanoosh, S.M. Air quality modeling for health risk assessment of ambient PM10, PM2.5 and SO2 in Iran. Hum. Ecol. Risk Assess. Int. J. 2018, 25, 1298–1310. [Google Scholar] [CrossRef]
- Yi, O.; Hong, Y.; Kim, H. Seasonal effect of PM10 concentrations on mortality and morbidity in Seoul, Korea: A temperature-matched case-crossover analysis. Environ. Res. 2009, 110, 89–95. [Google Scholar] [CrossRef] [PubMed]
- Samet, J.; Zeger, S.; Dominic, F.; Curriero, F.; Coursac, I.; Dockery, D.; Schwartz, J.; Zanobetti, A. The national morbidity, mortality and air pollution study. Part II Morb. Mortal. Air Pollut. U. S. Res. Rep. Health Eff. Inst. 2000, 94, 5–79. [Google Scholar]
- Wilmshurt, P. Temperature and cardiovascular mortality. BMJ 1994, 309, 1029. [Google Scholar] [CrossRef] [PubMed] [Green Version]
- Herity, B.; Daly, L.; Bourke, Q.; Horgan, J.M. Hypothermia and mortality and morbidity. Epidemiol. Anal. J. Epidemiol. Community Health 1991, 45, 19–23. [Google Scholar] [CrossRef] [PubMed] [Green Version]
- Rogot, E.; Sorlie, P.D.; Backi-Und, E. Air-conditioning and mortality in hot weather. Am. J. Epidemiol. 1992, 136, 106–116. [Google Scholar] [CrossRef] [PubMed]
- Rojas-Bracho, L. Evaluación del Grado de Exposición a Aeropartículas en los Habitantes de la Zona Metropolitana de la Ciudad de México. Master’s Thesis, Universidad Nacional Autónoma de México, Mexico City, Mexico, 1994. [Google Scholar]
- Fernández-Bremauntz, A.; Quentin, M.J. A survey of commuter travel habits in the Metropolitan Area of Mexico City. J. Expos. Anal. Environ. Epidemiol. 1992, 2, 1–7. [Google Scholar]


| Air Pollutant Criteria | NOM | Publication Date | Description |
|---|---|---|---|
| SO2 | NOM-022-SSA1-2010 [15] | 08/09/2010 | 0.110 ppm, maximum 24-h mean 0.200 ppm second annual maximum 8 h moving average 0.025 ppm, annual mean |
| CO | NOM-021-SSA1-1993 [16] | 23/12/1994 | 11.0 ppm annual maximum 8 h moving average |
| NO2 | NOM-023-SSA1-1993 [17] | 23/12/1994 | 0.210 ppm, hourly mean |
| O3 | NOM-020-SSA1-2014 [18] | 19/08/2014 | 0.095 ppm, hourly mean 0.070 ppm, annual maximum 8 h moving average |
| PM10 | NOM-025-SSA1-2014 [19] | 20/08/2014 | 75 µg m−3, 24-h mean 40 µg m−3, annual mean |
| PM2.5 | NOM-025-SSA1-2014 [19] | 20/08/2014 | 45 µg m−3, 24-h mean 12 µg m−3, annual mean |
| Air Pollutant Criteria | NOM | Publication Date | Description |
|---|---|---|---|
| SO2 | NOM-038-SEMARNAT-1993 [20] | 18/10/1993 | Equivalent method, UV fluorescence |
| CO | NOM-034-SEMARNAT-1993 [21] | Reference method, infrared absorption | |
| NO2 | NOM-037-SEMARNAT-1993 [22] | Reference method, gas phase chemioluminiscence | |
| O3 | NOM-036-SEMARNAT-1993 [23] | Equivalent method, UV photometry | |
| PM10 | US EPA Equivalent method, [24] | Gravimetric or β-radiation attenuation | |
| PM2.5 | US EPA Equivalent method, [24] | Gravimetric or β-radiation attenuation | |
| Municipality | NO2 (ppb) | CO (ppm) | O3 (ppb) | SO2 (ppb) | PM10 (µg m−3) |
|---|---|---|---|---|---|
| Cadereyta | 12 | 1.1 | 24 | 7 | 63.9 |
| Garcia | * | * | 27 | * | 88.4 |
| General Escobedo | 15 | 0.8 | 25 | 5 | 74.9 |
| Guadalupe | * | 1.1 | 25 | 6 | 60.2 |
| Monterrey | 15 | 1.1 | 22 | * | 58.6 |
| Salinas Victoria | 14 | 0.9 | 25 | 5 | 58.7 |
| San Nicolas de los Garza | 13 | 1.0 | 23 | 5 | 74.0 |
| Santa Catarina | 18 | 0.8 | 25 | 7 | 81.2 |
| Site | LL | RRI | UL | Cause |
|---|---|---|---|---|
| Mexico City [34] | 1.1468 | 1.2125 | 1.2782 | Respiratory, Children |
| India [35] | 0.99 | 1.021 | 1.06 | All, adults |
| New Zealand [36] | 1.09 | 1.18 | 1.28 | Respiratory, Children |
| Canada [37] | 0.983 | 0.991 | 0.999 | Respiratory |
| Isfahan, Iran [38] | 1.0004 | 1.0038 | 1.0094 | Respiratory |
| Isfahan, Iran [38] | 1.0015 | 1.0036 | 1.0084 | Circulatory |
| Chengdu, China [39] | 1.37 | 3.48 | 5.64 | Respiratory |
| Central China [6] | 0.06 | 0.52 | 0.99 | All |
| Thailand [40] | 0.94 | 1.01 | 1.09 | Circulatory |
| Seoul, Korea [41] | 1.1 | 1.15 | 1.2 | Respiratory |
| Seoul, Korea [42] | 1.06 | 1.18 | 1.31 | Respiratory |
| Seoul, Korea [43] | 0.6 | 2.2 | 3.7 | Respiratory |
| Seoul, Korea [43] | 1.1 | 2.2 | 3.4 | Circulatory |
| Seoul, Korea [44] | 1.03 | 1.67 | 2.71 | Respiratory |
| Seoul, Korea [45] | 0.994 | 1.073 | 1.157 | Respiratory |
| Seoul, Korea [45] | 0.968 | 1.047 | 1.134 | Circulatory |
| Seoul, Korea [46] | 1.46 | 1.81 | 2.25 | Circulatory |
| Seoul, Korea [46] | 2.29 | 2.65 | 3.06 | Respiratory |
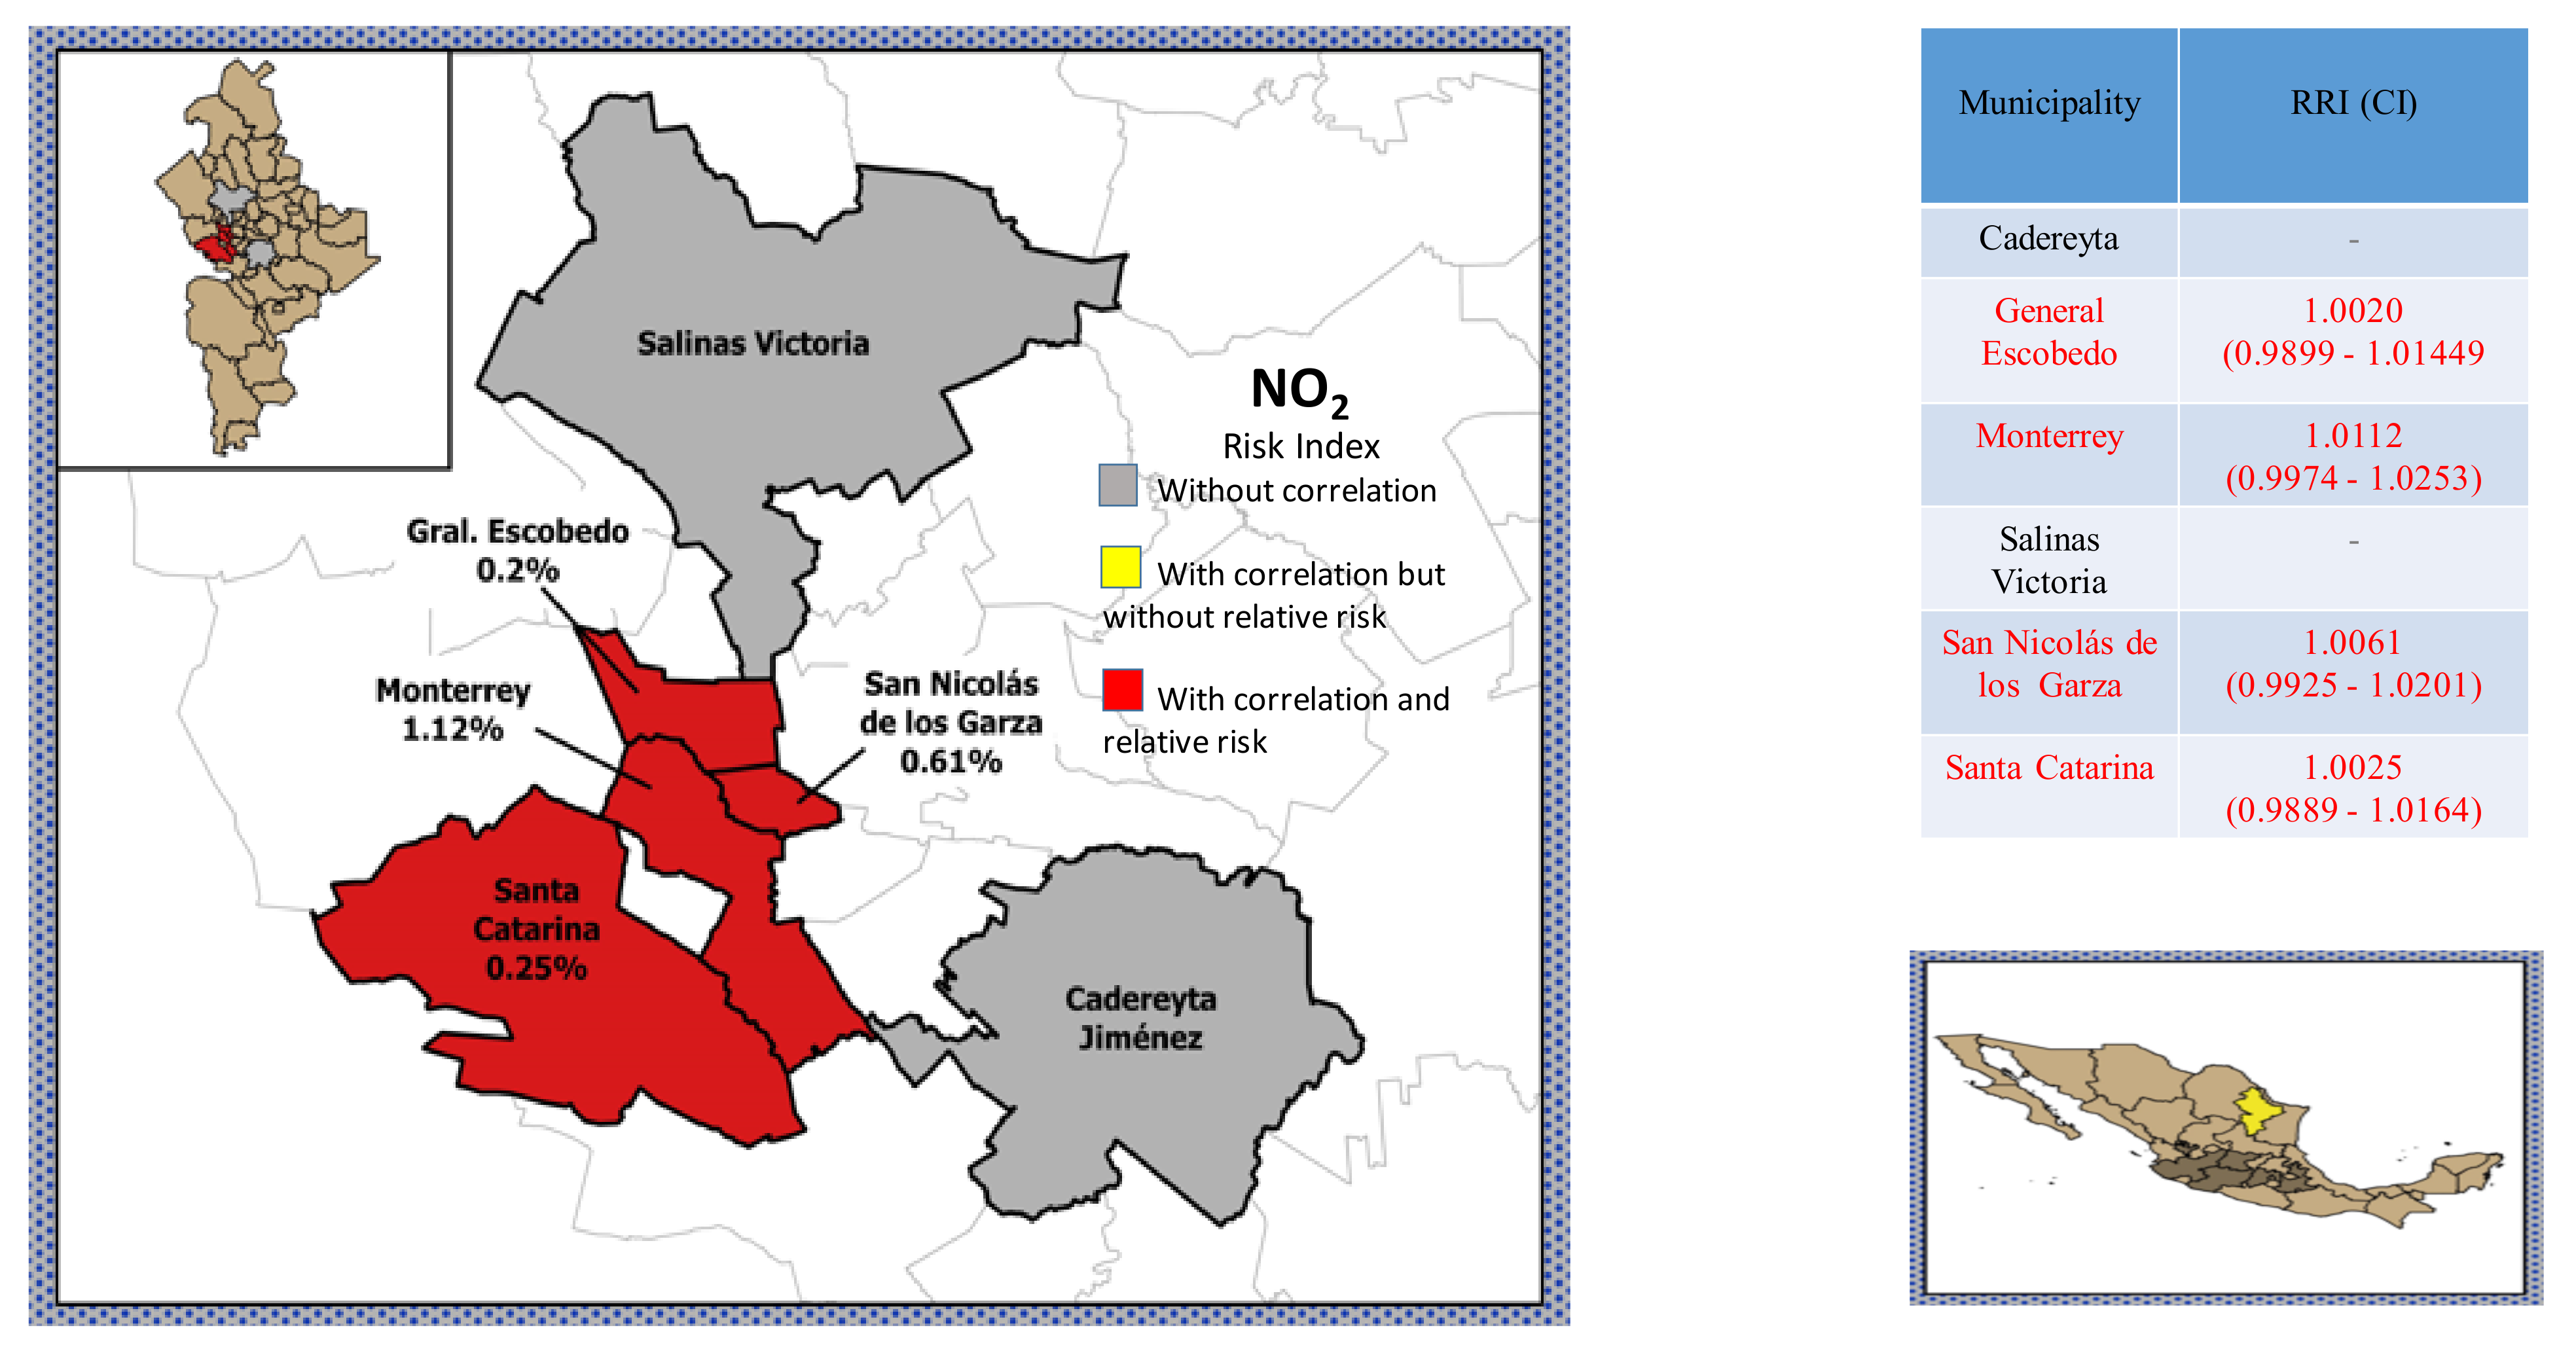
| General Escobedo | 0.9899 | 1.0021 | 1.0144 | All |
| Monterrey | 0.9974 | 1.0112 | 1.0253 | All |
| San Nicolás de los Garza | 0.9925 | 1.0062 | 1.0201 | All |
| Santa Catarina | 0.9889 | 1.0026 | 1.0164 | All |
| Cadereyta | 0.9625 | 0.9964 | 1.0316 | 5–59 years |
| Escobedo | 0.9874 | 1.0007 | 1.0142 | 5–59 years |
| Monterrey | 1.0017 | 1.0081 | 1.0144 | 5–59 years |
| Salinas Victoria | 0.8865 | 1.0063 | 1.1424 | 5–59 years |
| San Nicolás de los Garza | 0.9862 | 1.003 | 1.0201 | 5–59 years |
| Escobedo | 0.9869 | 1.0024 | 1.018 | Respiratory |
| Monterrey | 1.0019 | 1.0087 | 1.0155 | Respiratory |
| San Nicolás de los Garza | 0.9808 | 1.001 | 1.0216 | Respiratory |
| Santa Catarina | 0.9876 | 1.0018 | 1.0161 | Respiratory |
| San Nicolás de los Garza | 0.988 | 1.0043 | 1.0208 | Circulatory |
| Santa Catarina | 0.9838 | 1.0082 | 1.0333 | Circulatory |
| Site | LL | RRI | UL | Cause |
|---|---|---|---|---|
| Thailand [40] | 1 | 1.07 | 1.15 | Circulatory |
| Seoul, Korea [41] | 1.1 | 1.16 | 2.22 | Respiratory |
| Seoul, Korea [42] | 1.02 | 1.16 | 1.32 | Respiratory |
| Seoul, Korea [44] | 1.03 | 1.1 | 1.19 | Respiratory |
| Seoul, Korea [45] | 0.987 | 1.336 | 2.011 | Respiratory |
| Seoul, Korea [46] | 1.72 | 2.12 | 2.611 | Circulatory |
| Seoul, Korea [46] | 1.73 | 2 | 2.3 | Respiratory |
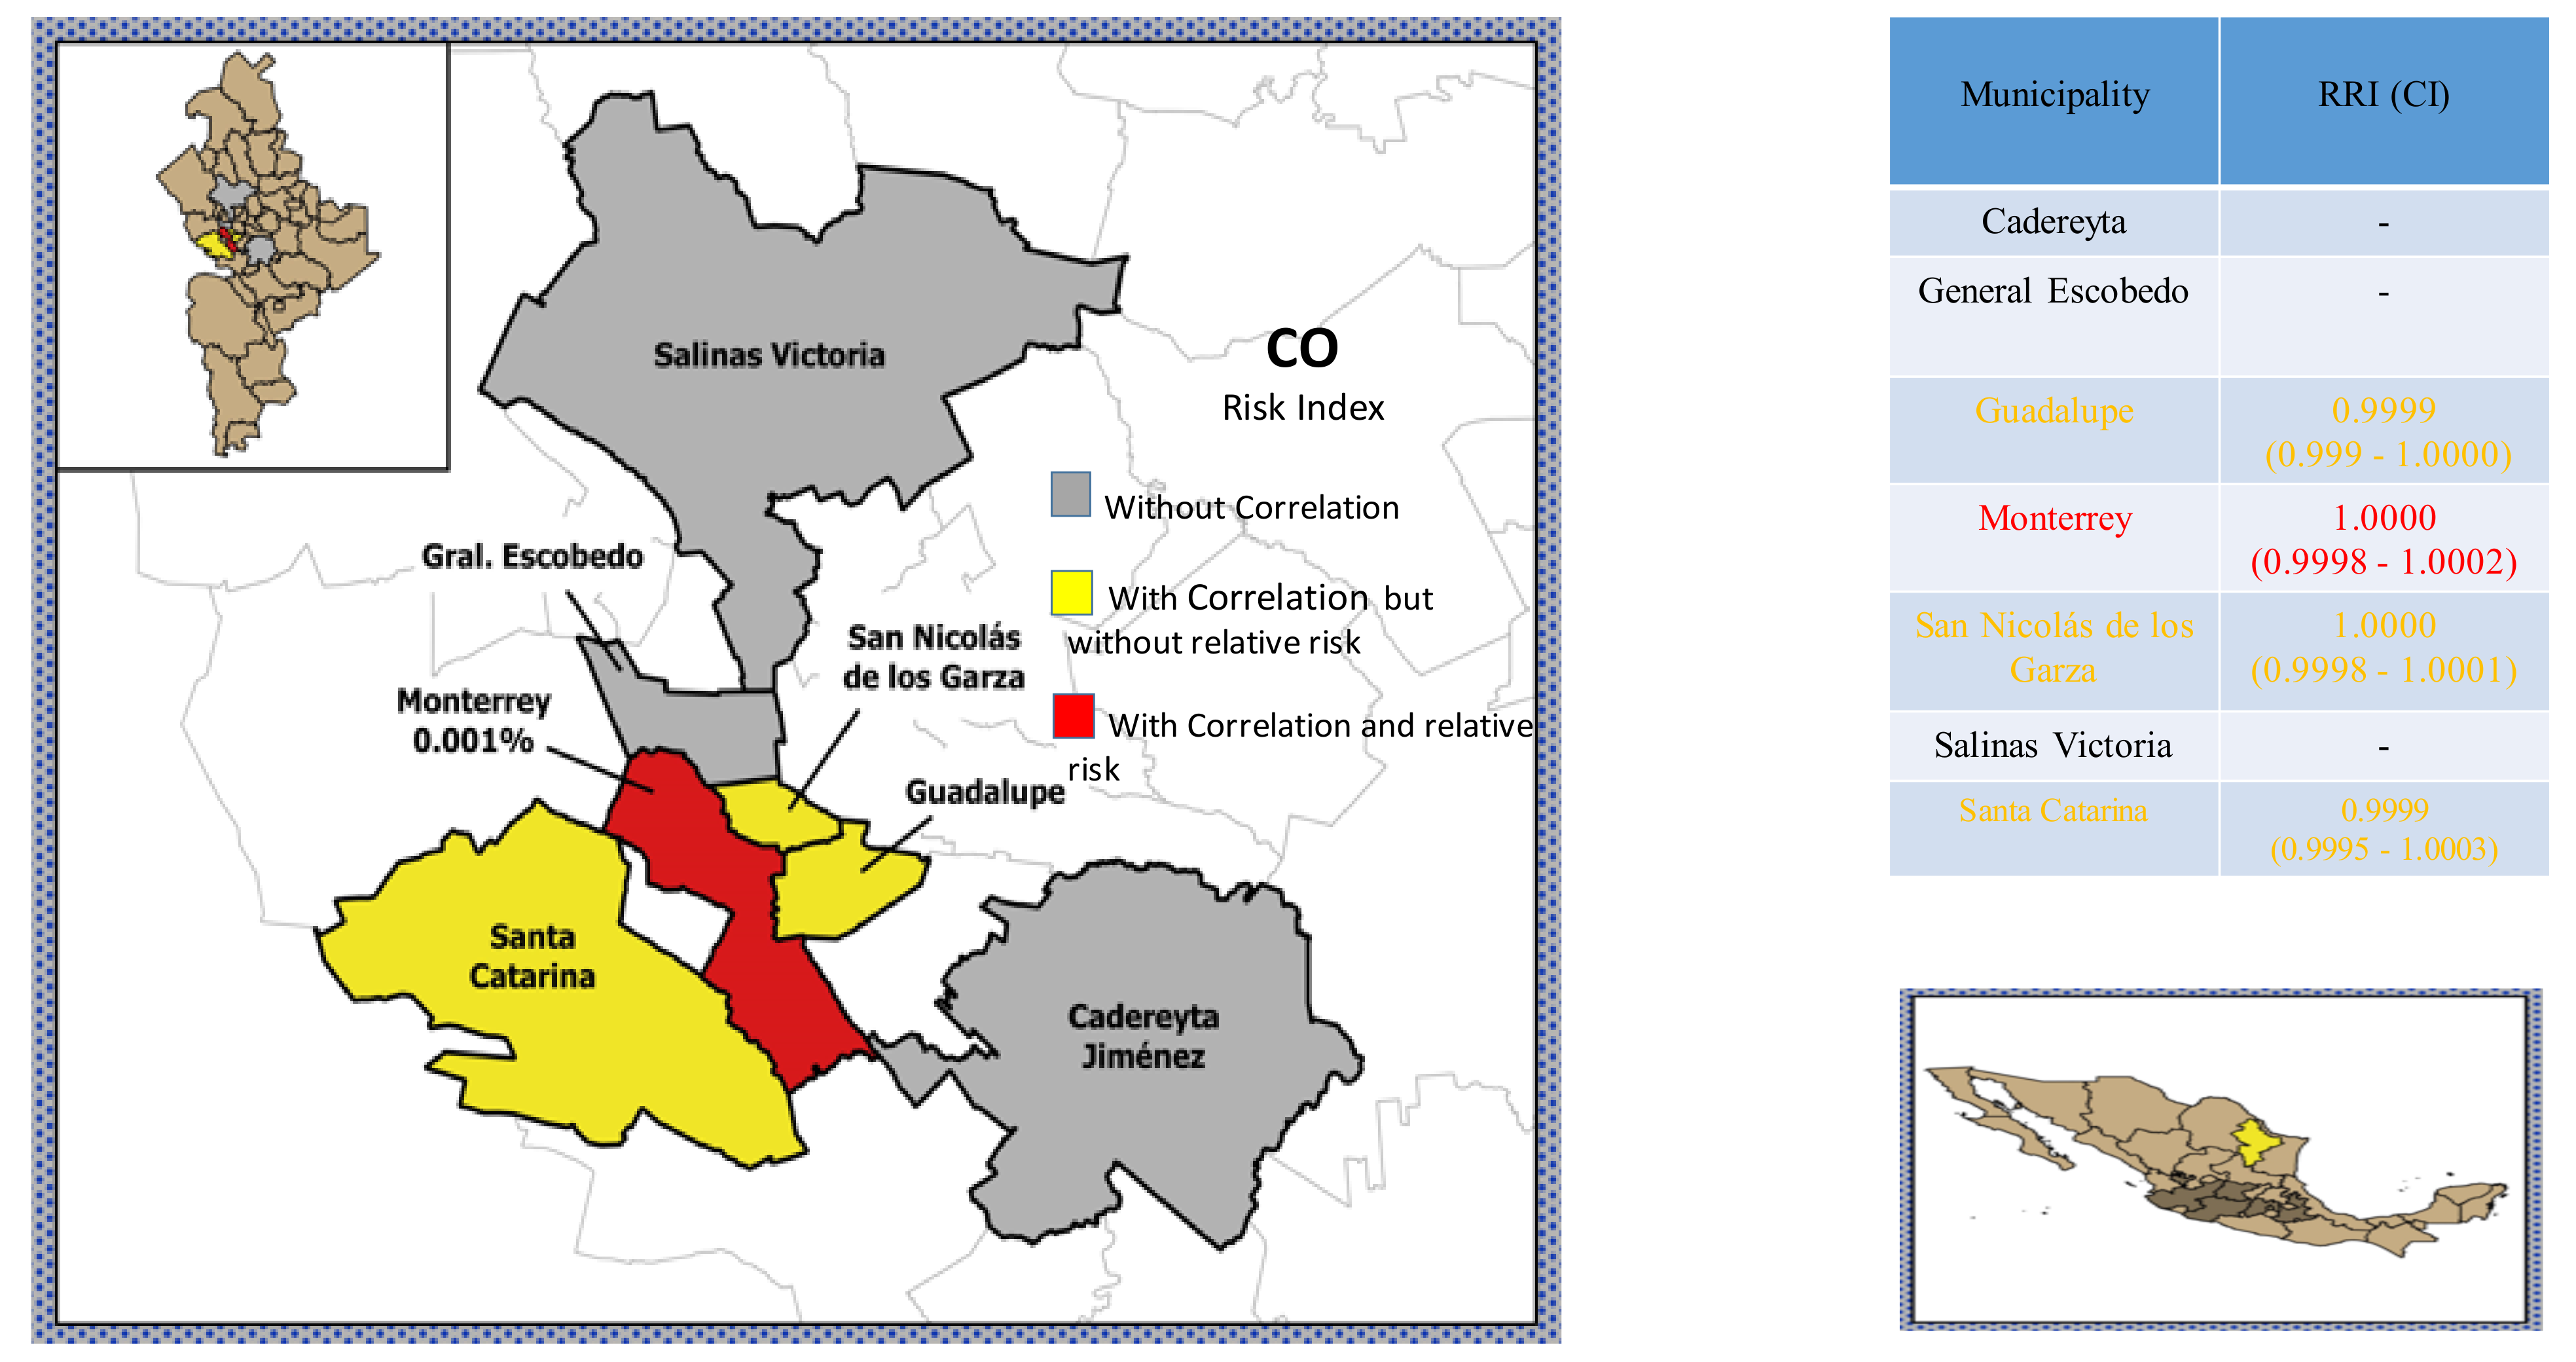
| Guadalupe | 0.9999 | 0.9999 | 1 | All |
| Monterrey | 0.9998 | 1 | 1.0021 | All |
| San Nicolás de los Garza | 0.9998 | 1 | 1.0001 | All |
| Santa Catarina | 0.9995 | 0.9999 | 1.0003 | All |
| Cadereyta | 0.9997 | 1.0001 | 1.0005 | 5–59 years |
| Guadalupe | 0.9997 | 0.9999 | 1.0002 | 5–59 years |
| San Nicolás de los Garza | 0.9998 | 1 | 1.0002 | 5–59 years |
| Santa Catarina | 0.9996 | 0.9999 | 1.0003 | 5–59 years |
| Escobedo | 0.9995 | 0.9999 | 1.0003 | Respiratory |
| Guadalupe | 0.9997 | 0.9999 | 1.0002 | Respiratory |
| Monterrey | 0.9999 | 1 | 1.0001 | Respiratory |
| San Nicolás de los Garza | 0.9998 | 1 | 1.0002 | Respiratory |
| Santa Catarina | 0.9995 | 0.9999 | 1.0004 | Respiratory |
| Site | LL | RRI | UL | Cause |
|---|---|---|---|---|
| Juárez City, Mexico [9] | 1.021 | 1.051 | 1.085 | Respiratory, children |
| Mexico City [34] | 1.0339 | 1.0472 | 1.0603 | Respiratory, children |
| Canada [37] | 1.036 | 1.043 | 1.051 | Respiratory |
| Seoul, Korea [41] | 1.07 | 1.12 | 1.16 | Respiratory |
| Seoul, Korea [46] | 0.63 | 0.71 | 0.82 | Circulatory |
| Seoul, Korea [46] | 0.55 | 0.6 | 0.65 | Respiratory |
| Ohio, USA [47] | 1.02 | 1.09 | 1.16 | All, adults |
| García | 0.9625 | 0.9989 | 1.0366 | All |
| Escobedo | 0.9886 | 0.9995 | 1.0105 | All |
| Guadalupe | 0.9863 | 0.9929 | 0.9995 | All |
| Monterrey | 0.9833 | 0.9979 | 1.0127 | All |
| Salinas Victoria | 0.956 | 1.0861 | 1.2339 | All |
| San Nicolás de los Garza | 0.986 | 0.9974 | 1.0089 | Al |
| Santa Catarina | 0.9796 | 0.9964 | 1.0134 | All |
| Cadereyta | 0.9758 | 0.9991 | 1.0228 | 5–59 years |
| García | 0.9723 | 0.9984 | 1.0253 | 5–59 years |
| Guadalupe | 0.9754 | 0.9932 | 1.0114 | 5–59 years |
| San Nicolás de los Garza | 0.9823 | 0.9963 | 1.0104 | 5–59 years |
| Santa Catarina | 0.9799 | 0.999 | 1.0185 | 5–59 years |
| García | 0.9526 | 1.0015 | 1.0528 | Respiratory |
| Escobedo | 0.983 | 0.9972 | 1.0116 | Respiratory |
| Guadalupe | 0.9732 | 0.9912 | 1.0095 | Respiratory |
| Monterrey | 0.9915 | 0.9987 | 1.0059 | Respiratory |
| San Nicolás de los Garza | 0.9825 | 0.9975 | 1.0127 | Respiratory |
| San Nicolás de los Garza | 0.986 | 0.9974 | 1.0089 | all |
| Santa Catarina | 0.981 | 0.9968 | 1.0127 | Respiratory |
| Site | LL | RRI | UL | Cause |
|---|---|---|---|---|
| Isfahan, Iran [38] | 1 | 1.004 | 1.011 | Respiratory |
| Isfahan, Iran [38] | 1.0026 | 1.0064 | 1.01 | Circulatory |
| Thailand [40] | 1.08 | 1.22 | 1.38 | Circulatory |
| Seoul, Korea [41] | 1.06 | 1.11 | 1.17 | Respiratory |
| Seoul, Korea [42] | 1.01 | 1.12 | 1.25 | Respiratory |
| Seoul, Korea [44] | 1.01 | 1.09 | 1.17 | Respiratory |
| Seoul, Korea [46] | 1.52 | 1.82 | 2.19 | Circulatory |
| Seoul, Korea [46] | 2 | 2.25 | 2.54 | Respiratory |
| Ohio, USA [47] | 0.99 | 1.03 | 1.06 | All, adults |
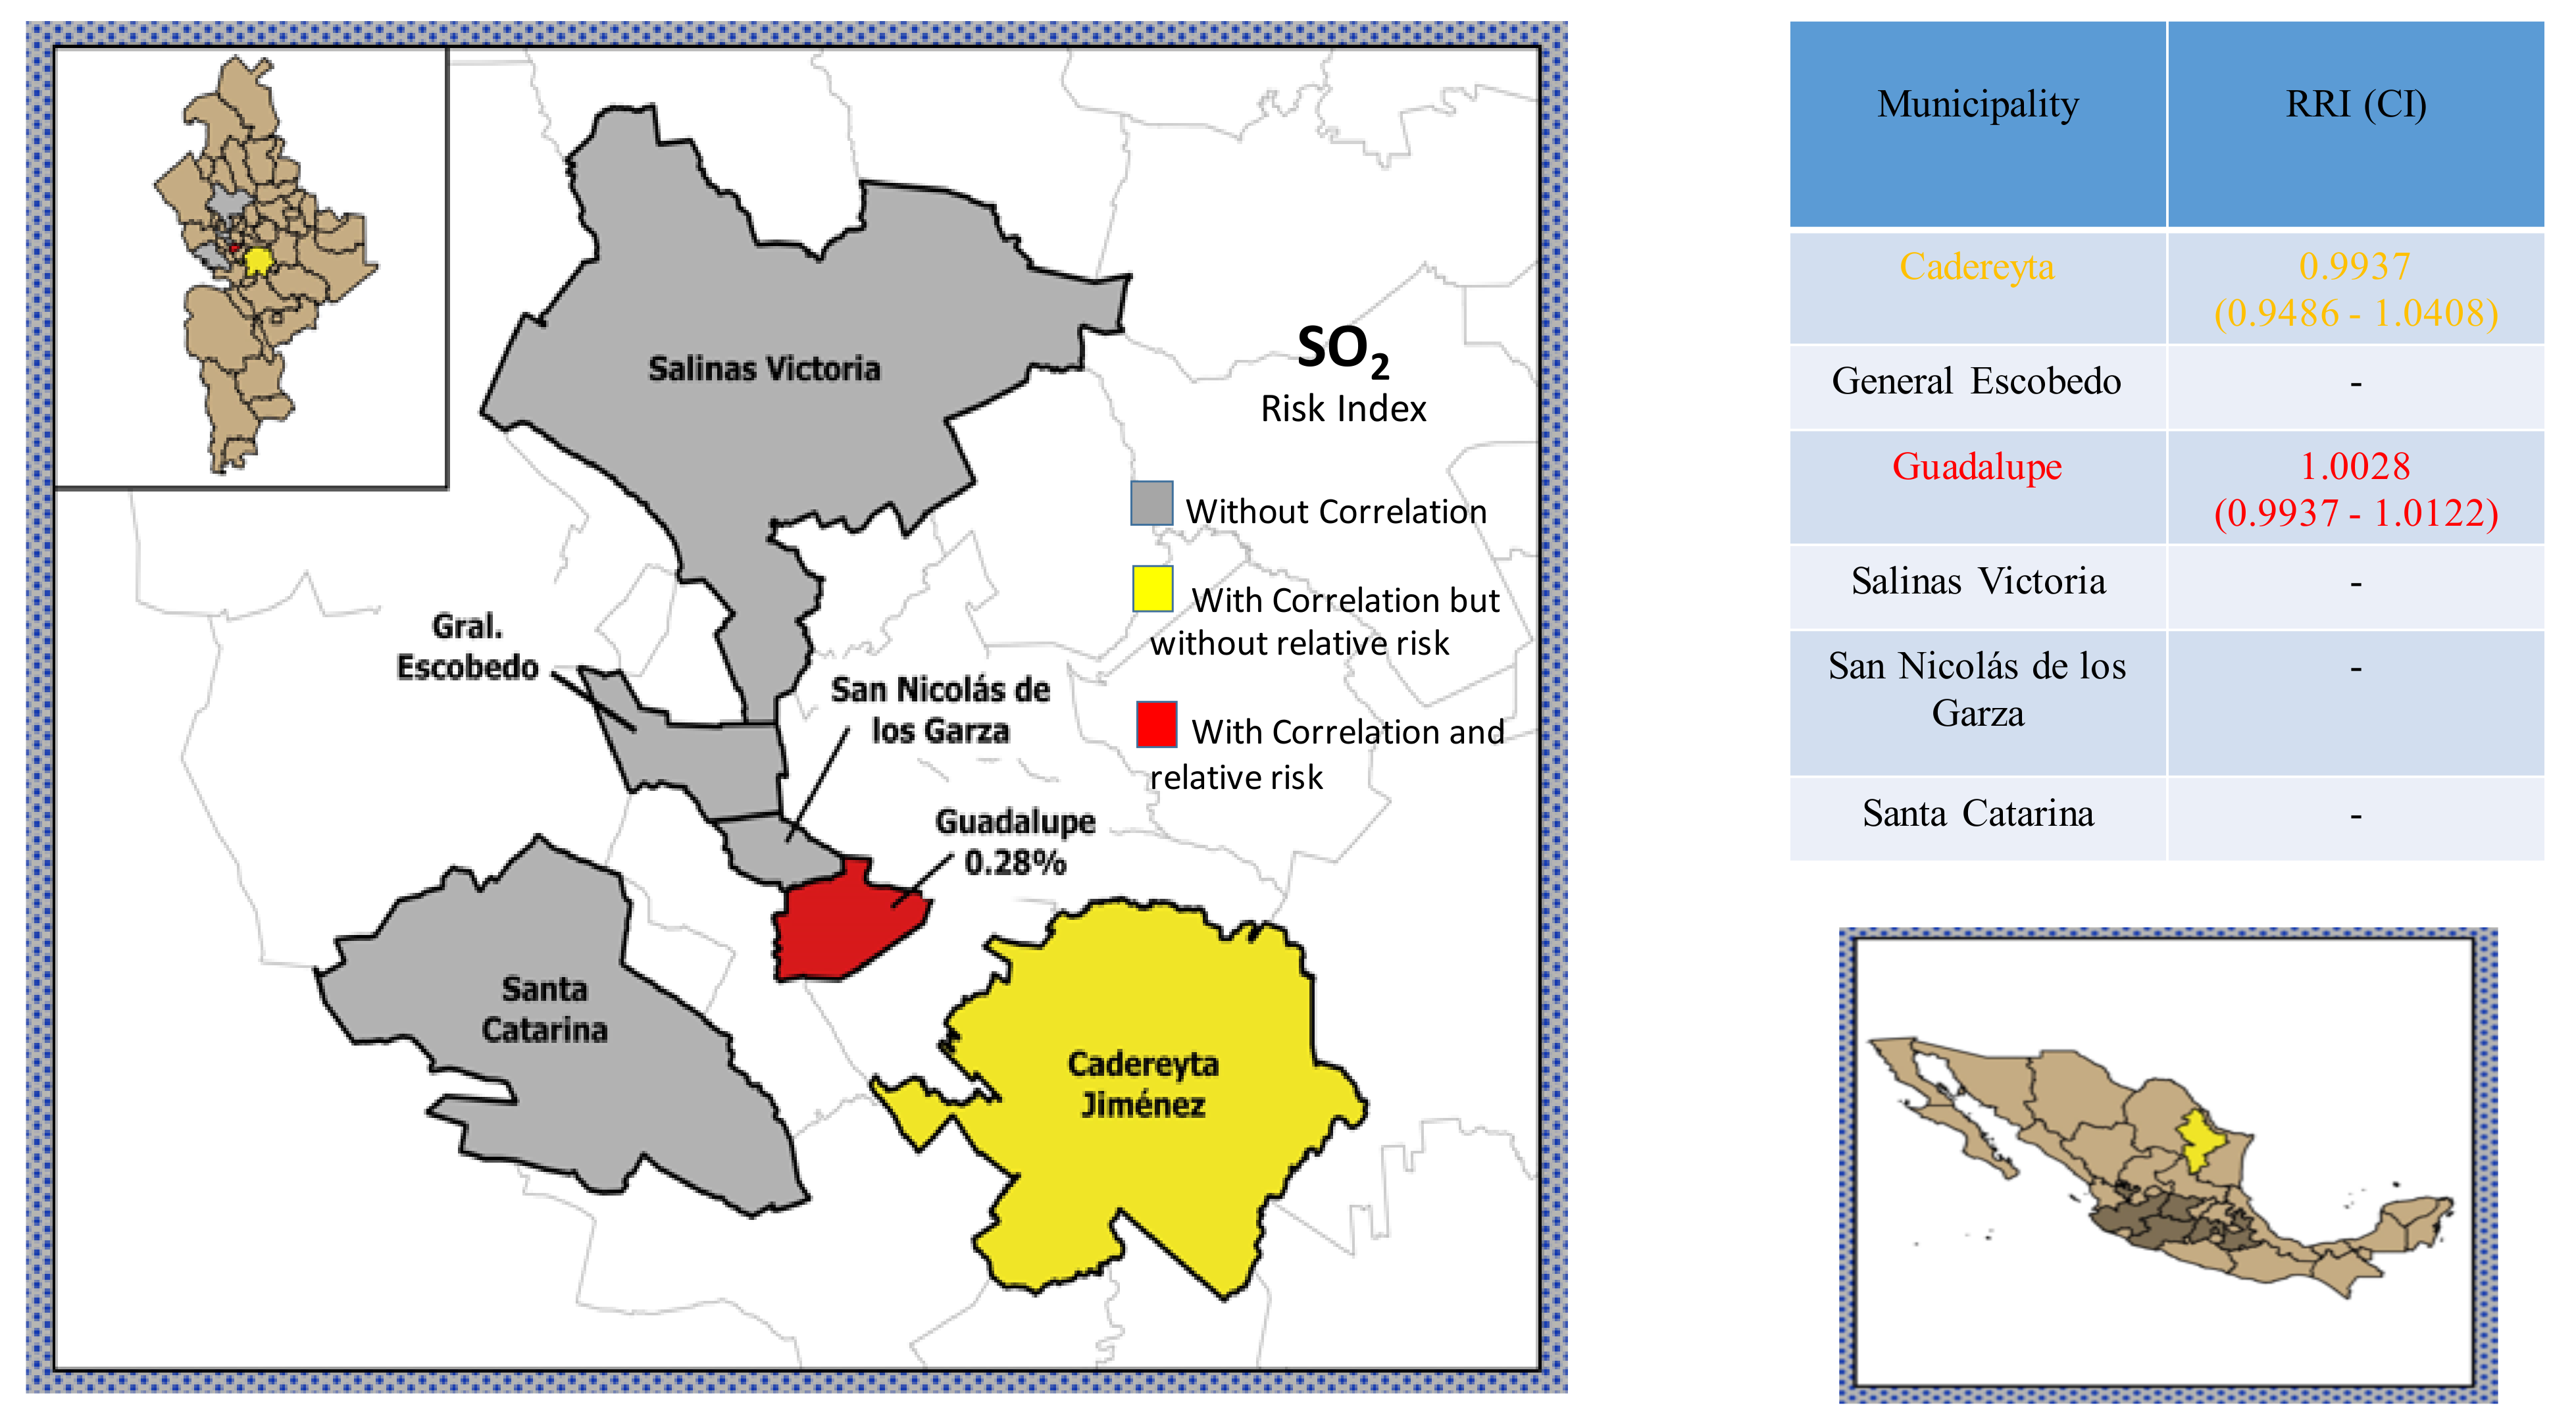
| Cadereyta | 0.9486 | 0.9937 | 1.0408 | All |
| Guadalupe | 0.9937 | 1.0029 | 1.0122 | All |
| Cadereyta | 0.9293 | 0.9862 | 1.053 | 5–59 years |
| Escobedo | 0.9508 | 0.9994 | 1.0506 | 5–59 years |
| Salinas Victoria | 0.7709 | 1.105 | 1.5838 | 5–59 years |
| Escobedo | 0.9588 | 1.0114 | 1.0668 | Respiratory |
| San Nicolás de los Garza | 0.9678 | 1.0065 | 1.0469 | Respiratory |
| Author | LL | IRR | UL | Cause |
|---|---|---|---|---|
| Juárez City, Mexico [9] | 0.981 | 1.004 | 1.028 | all, children |
| Juárez City, Mexico [9] | 0.975 | 1.002 | 1.03 | Respiratory, children |
| Juárez City, Mexico [9] | 0.979 | 1.01 | 1.042 | Circulatory, children |
| Chengdu, China [39] | 0.75 | 1.31 | 1.8 | Respiratory |
| Thailand [40] | 1.04 | 1.13 | 1.23 | Circulatory |
| Seoul, Korea [41] | 1.04 | 1.07 | 1.11 | Respiratory |
| Seoul, Korea [43] | 0.9 | 1.7 | 2.6 | Respiratory |
| Ohio. USA [47] | 1.01 | 1.12 | 1.24 | all, adults |
| Seoul, Korea [48] | 1.02 | 1.09 | 1.15 | Circulatory |
| 8 European cities [49] | 1.003 | 1.006 | 1.009 | Circulatory |
| European Cities [50] | 1.006 | 1.011 | 1.0017 | Respiratory |
| Iran [51] | 1.04 | 1.117 | 1.189 | All, adults |
| Iran [51] | 0.98 | 1.08 | 1.19 | All. Children |
| 14 cities, USA [53] | 1.01 | 1.17 | 1.33 | Circulatory |
| 14 cities, USA [53] | 1.49 | 1.98 | 2.47 | Respiratory |
| Seoul, Korea [52] | 0.94 | 1.19 | 1.44 | Respiratory |
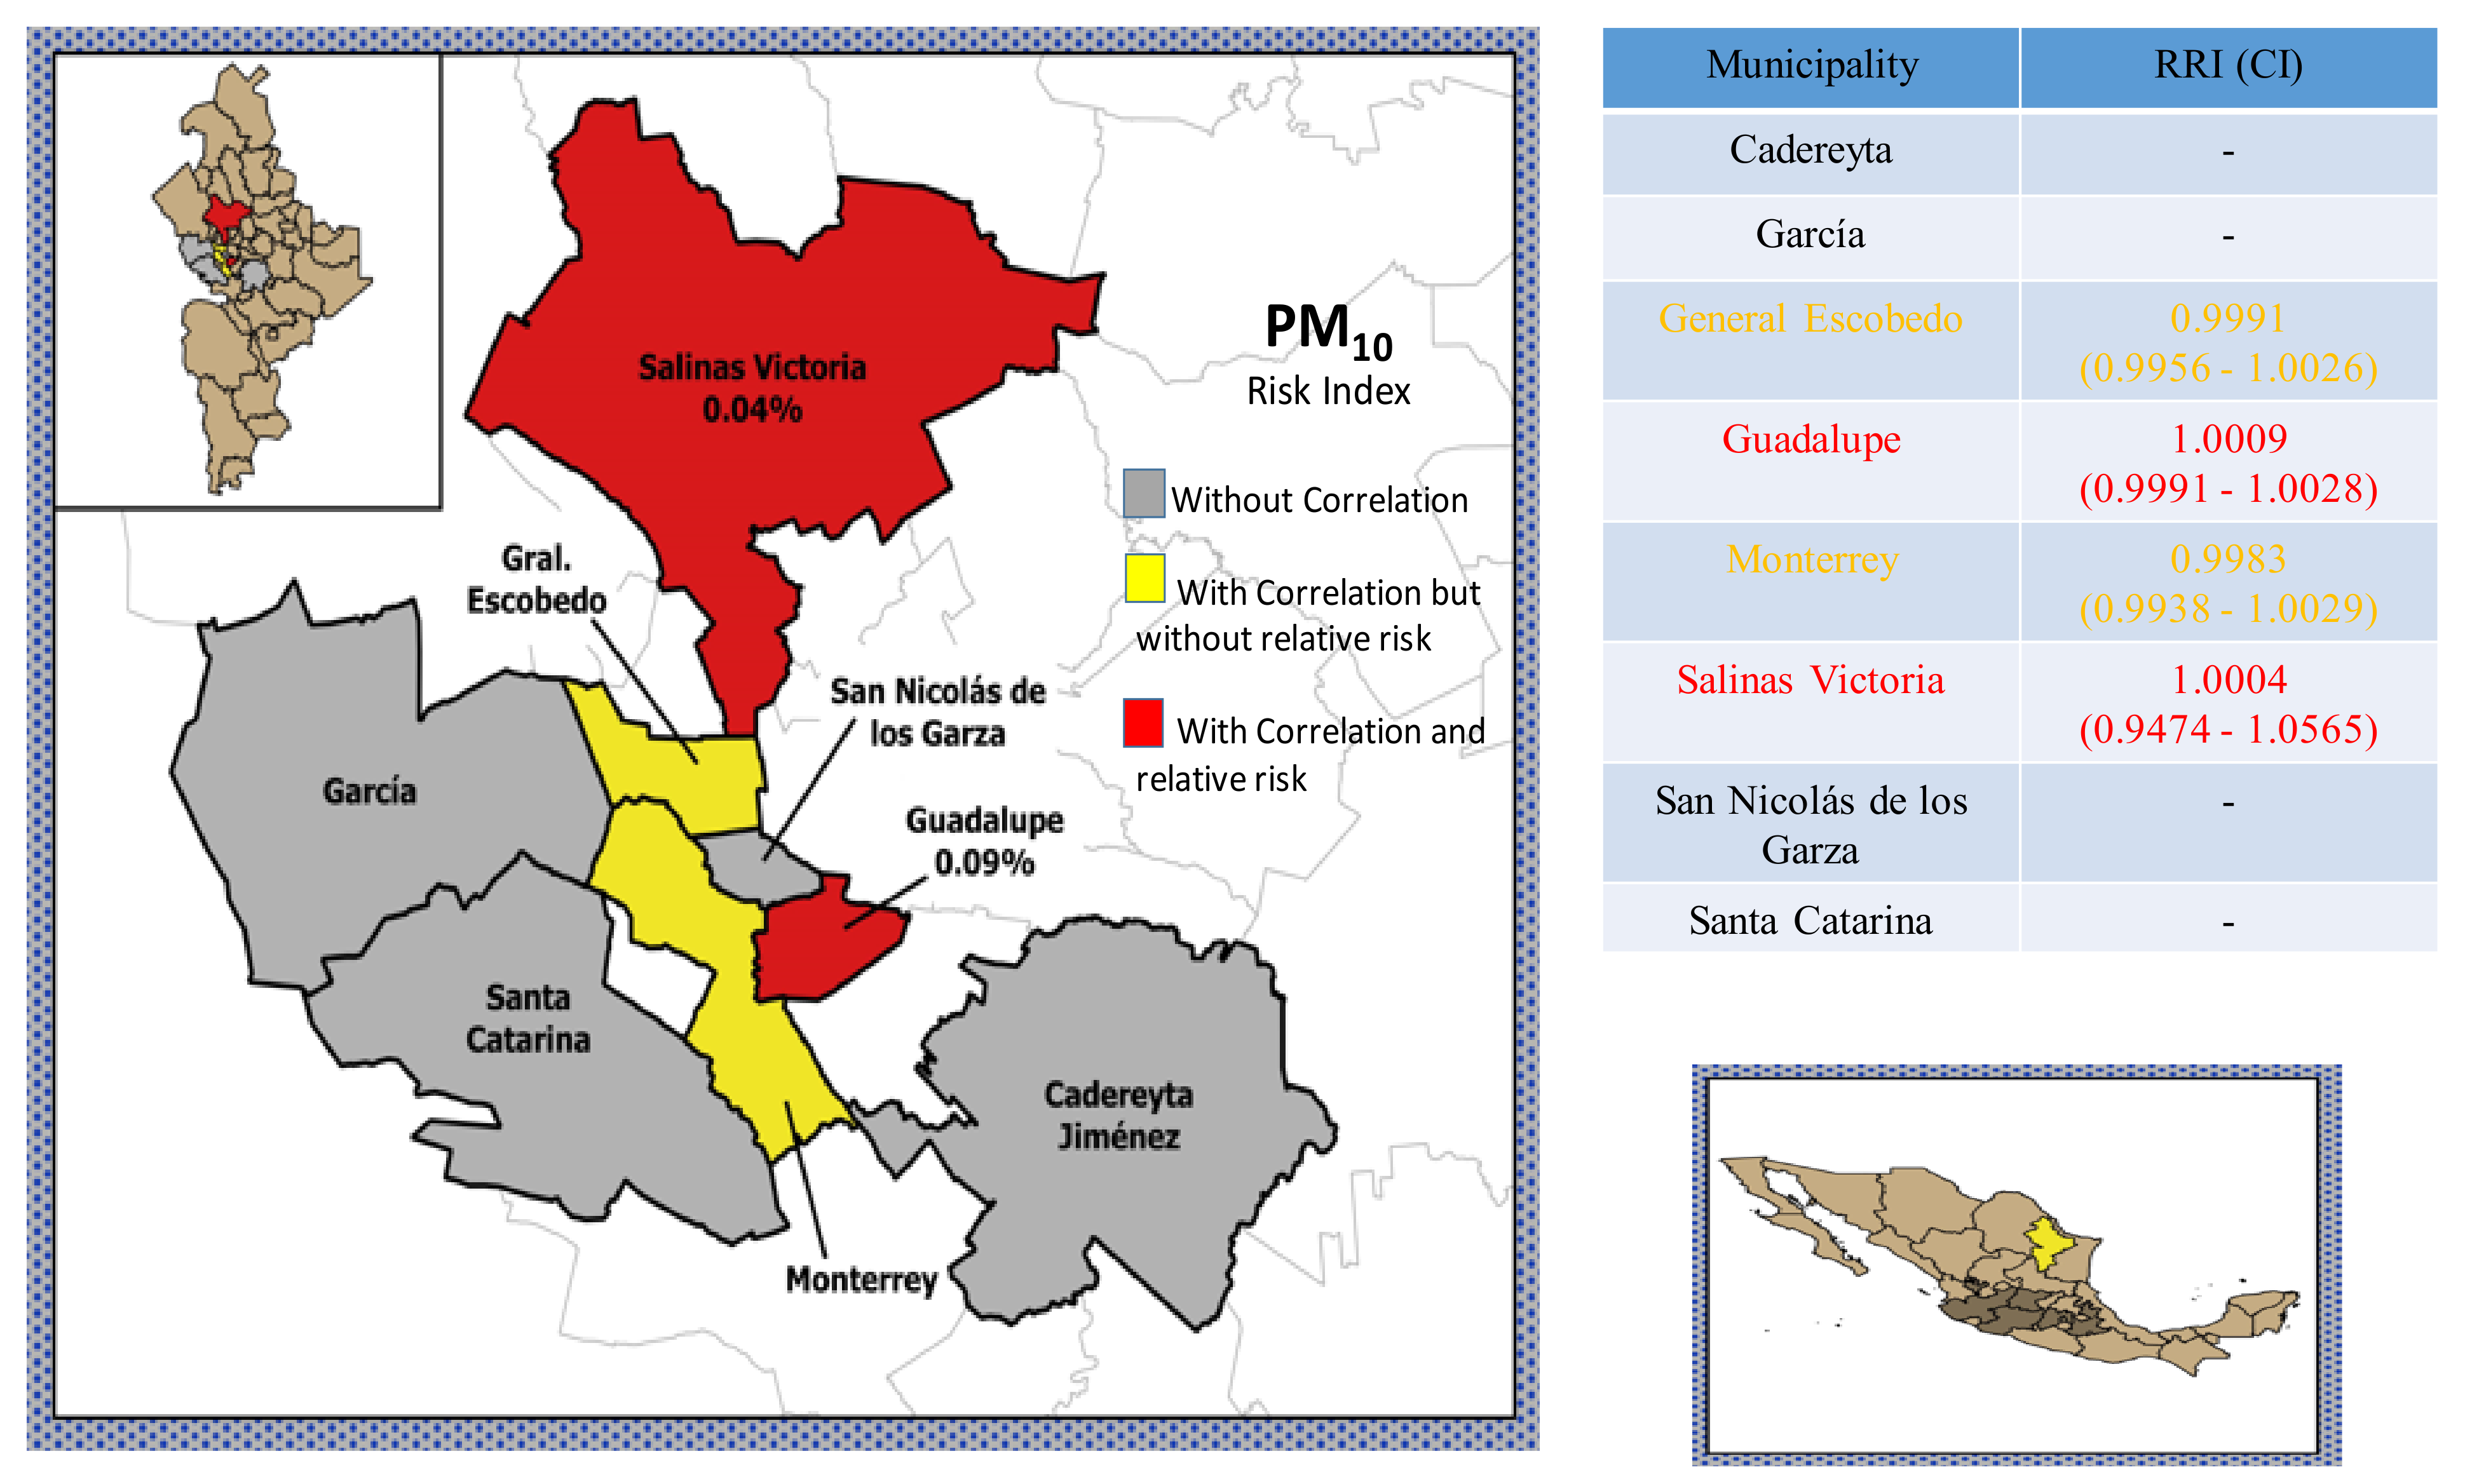
| Escobedo | 0.9956 | 0.991 | 1.0026 | All |
| Guadalupe | 0.9991 | 1.001 | 1.0028 | All |
| Monterrey | 0.9938 | 0.9983 | 1.0029 | All |
| Salinas Victoria | 0.9474 | 1.0005 | 1.0565 | 5–59 years |
| Cadereyta | 0.9938 | 1.0007 | 1.0076 | 5–59 years |
| Guadalupe | 0.9967 | 1.0017 | 1.0067 | 5–59 years |
| Monterrey | 0.9968 | 0.9988 | 1.0008 | 5–59 years |
| Guadalupe | 0.9961 | 1.0012 | 1.0064 | Respiratory |
| Monterrey | 0.9969 | 0.9991 | 1.0014 | Respiratory |
| San Nicolás de los Garza | 0.9961 | 1.0008 | 1.0054 | Respiratory |
| Santa Catarina | 0.9861 | 0.9974 | 1.0088 | Circulatory |
Publisher’s Note: MDPI stays neutral with regard to jurisdictional claims in published maps and institutional affiliations. |
© 2021 by the authors. Licensee MDPI, Basel, Switzerland. This article is an open access article distributed under the terms and conditions of the Creative Commons Attribution (CC BY) license (https://creativecommons.org/licenses/by/4.0/).
Share and Cite
Cerón Breton, R.M.; Céron Breton, J.; de la Luz Espinosa Fuentes, M.; Kahl, J.; Espinosa Guzman, A.A.; Martínez, R.G.; Guarnaccia, C.; del Carmen Lara Severino, R.; Ramirez Lara, E.; Francavilla, A.B. Short-Term Associations between Morbidity and Air Pollution in Metropolitan Area of Monterrey, Mexico. Atmosphere 2021, 12, 1352. https://0-doi-org.brum.beds.ac.uk/10.3390/atmos12101352
Cerón Breton RM, Céron Breton J, de la Luz Espinosa Fuentes M, Kahl J, Espinosa Guzman AA, Martínez RG, Guarnaccia C, del Carmen Lara Severino R, Ramirez Lara E, Francavilla AB. Short-Term Associations between Morbidity and Air Pollution in Metropolitan Area of Monterrey, Mexico. Atmosphere. 2021; 12(10):1352. https://0-doi-org.brum.beds.ac.uk/10.3390/atmos12101352
Chicago/Turabian StyleCerón Breton, Rosa Maria, Julia Céron Breton, María de la Luz Espinosa Fuentes, Jonathan Kahl, Alberto Antonio Espinosa Guzman, Rocío García Martínez, Claudio Guarnaccia, Reyna del Carmen Lara Severino, Evangelina Ramirez Lara, and Antonella Bianca Francavilla. 2021. "Short-Term Associations between Morbidity and Air Pollution in Metropolitan Area of Monterrey, Mexico" Atmosphere 12, no. 10: 1352. https://0-doi-org.brum.beds.ac.uk/10.3390/atmos12101352