
Comparison of PM10 Sources at Traffic and Urban Background Sites Based on Elemental, Chemical and Isotopic Composition: Case Study from Krakow, Southern Poland

 , ,
, ,  , , , ,
Abstract
:1. Introduction
2. Materials and Methods
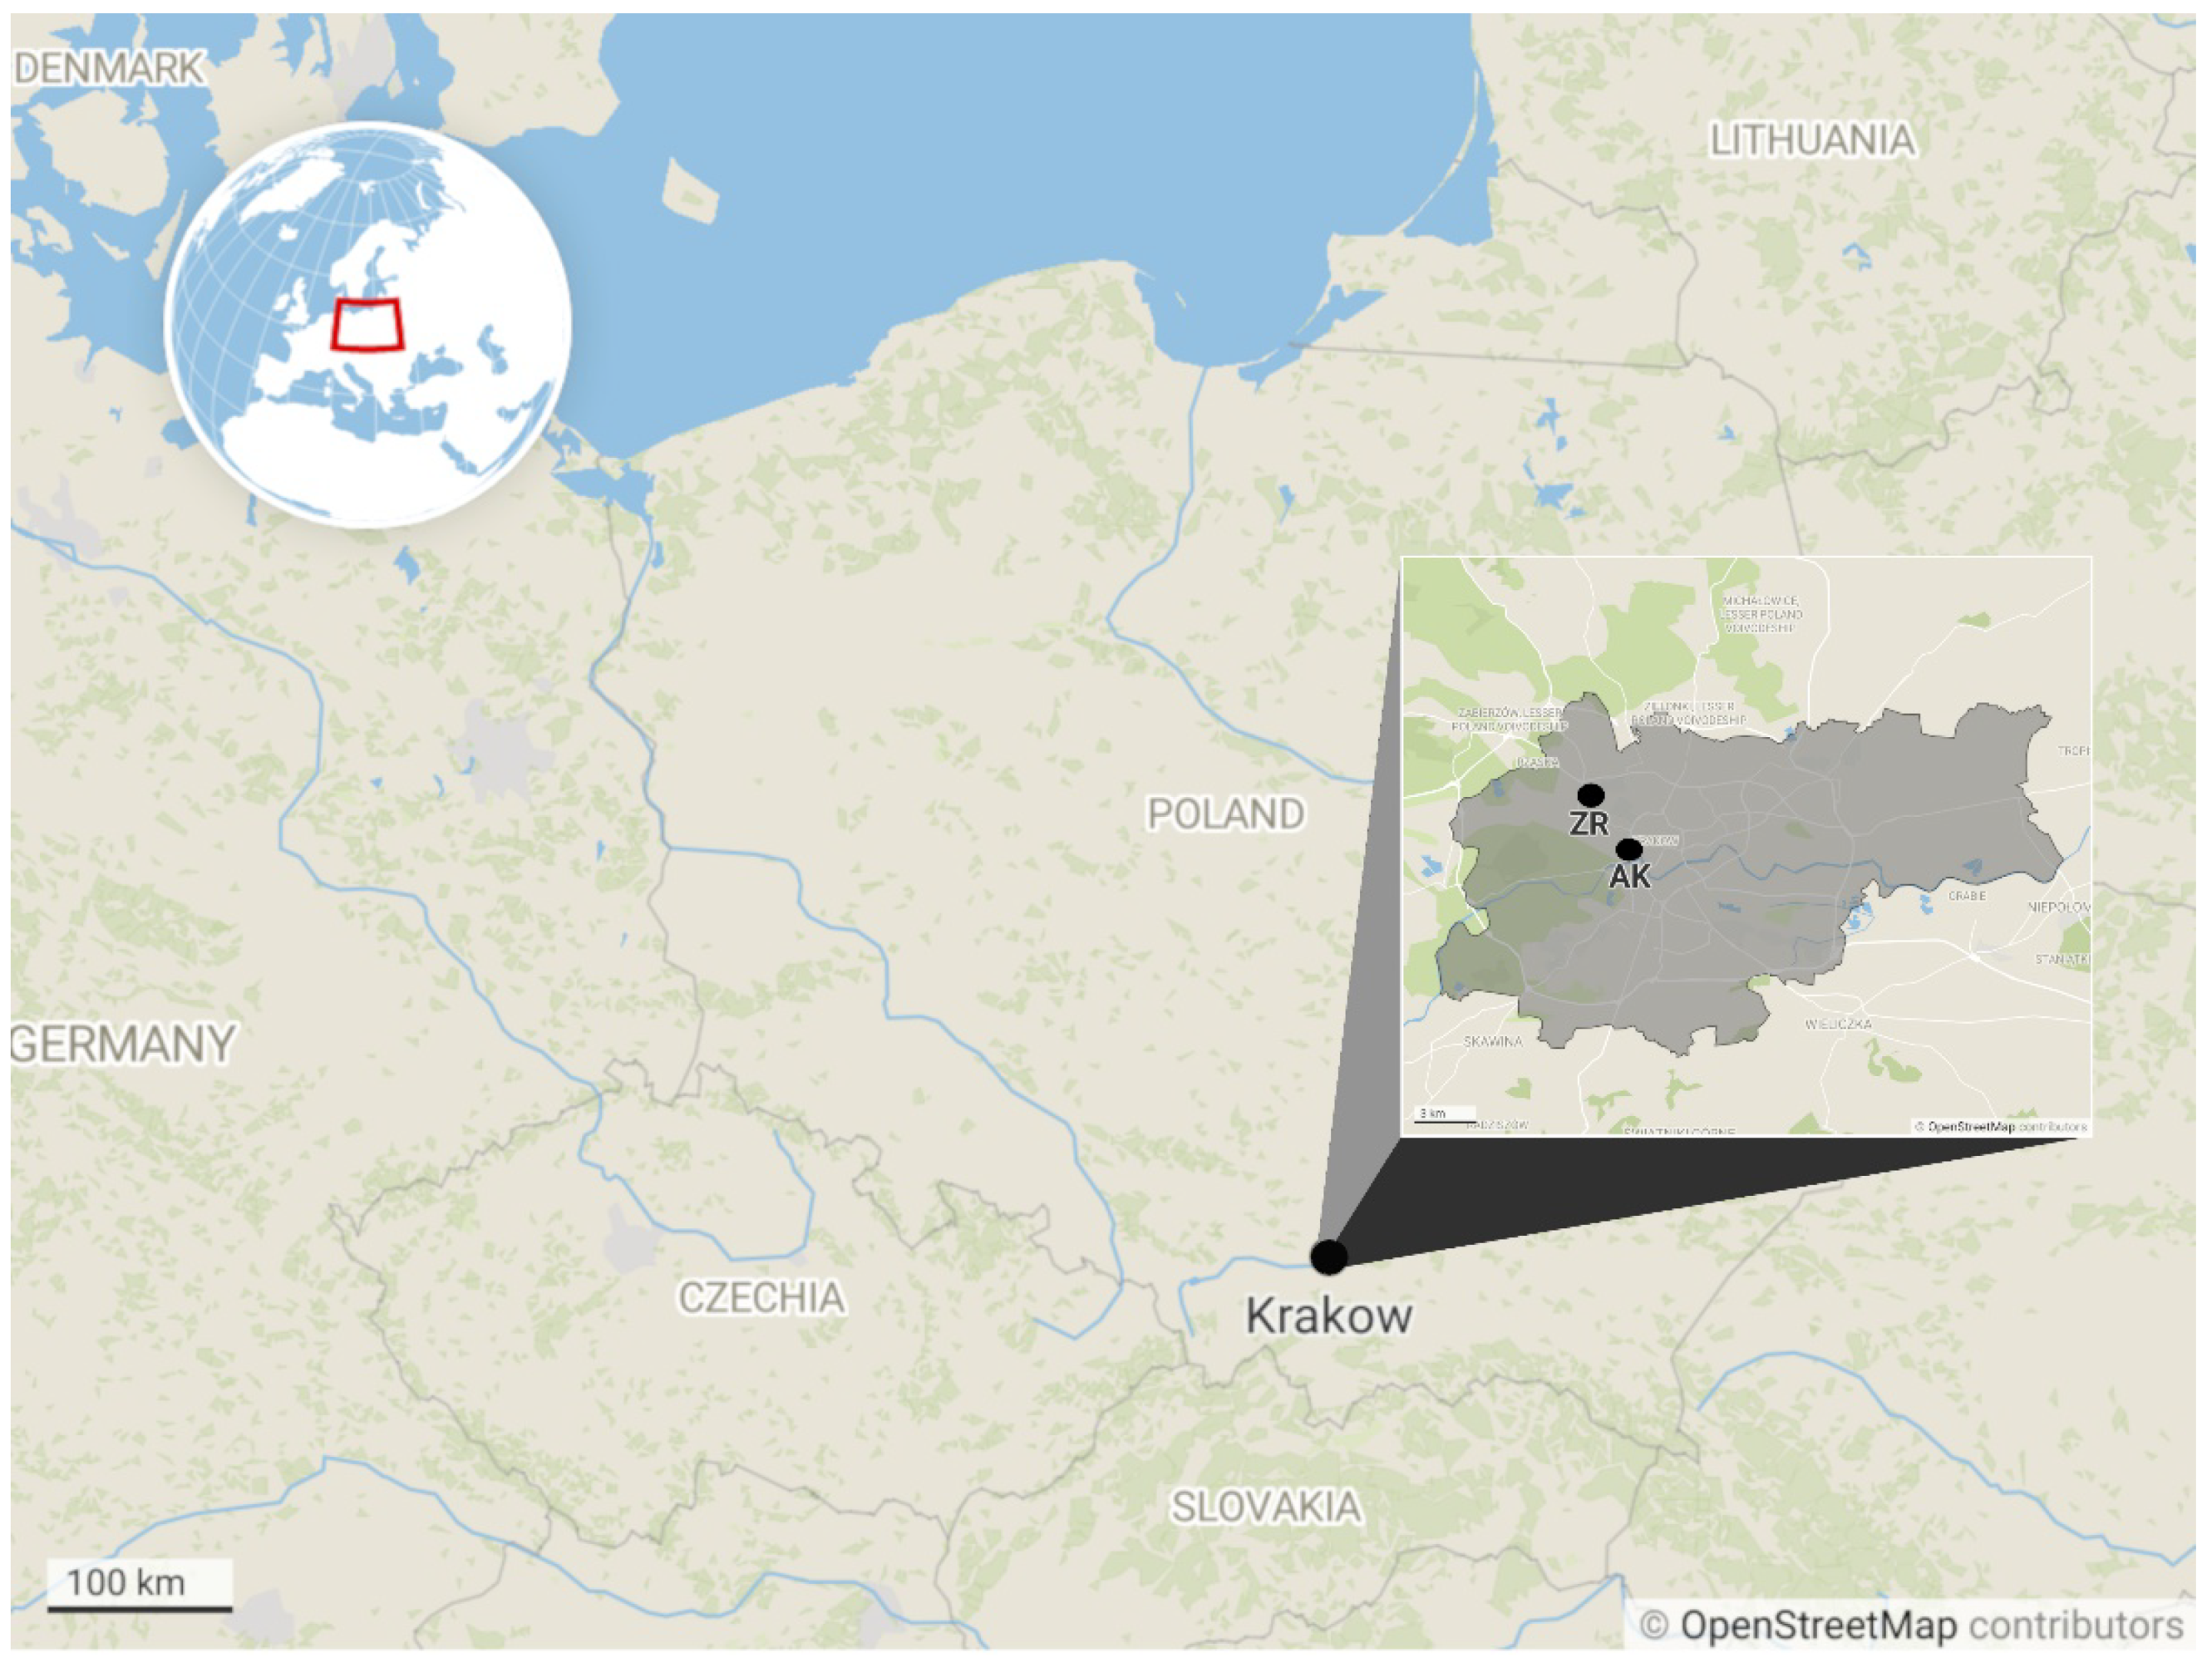
2.1. Sampling
2.2. Chemical Analyses
2.3. Carbon Isotope Analyses
2.3.1. Sample Preparation
2.3.2. Isotope Mass Balance
2.4. Source Apportionment
2.4.1. Elemental Enrichment Factors
2.4.2. Positive Matrix Factorization (PMF)
3. Results and Discussion
3.1. PM Concentrations and Main Constituents
3.2. Ions, Organic (OC) and Elemental (EC) Carbon Concentrations
3.3. Carbon Isotope Analyses
3.4. Source Apportionment
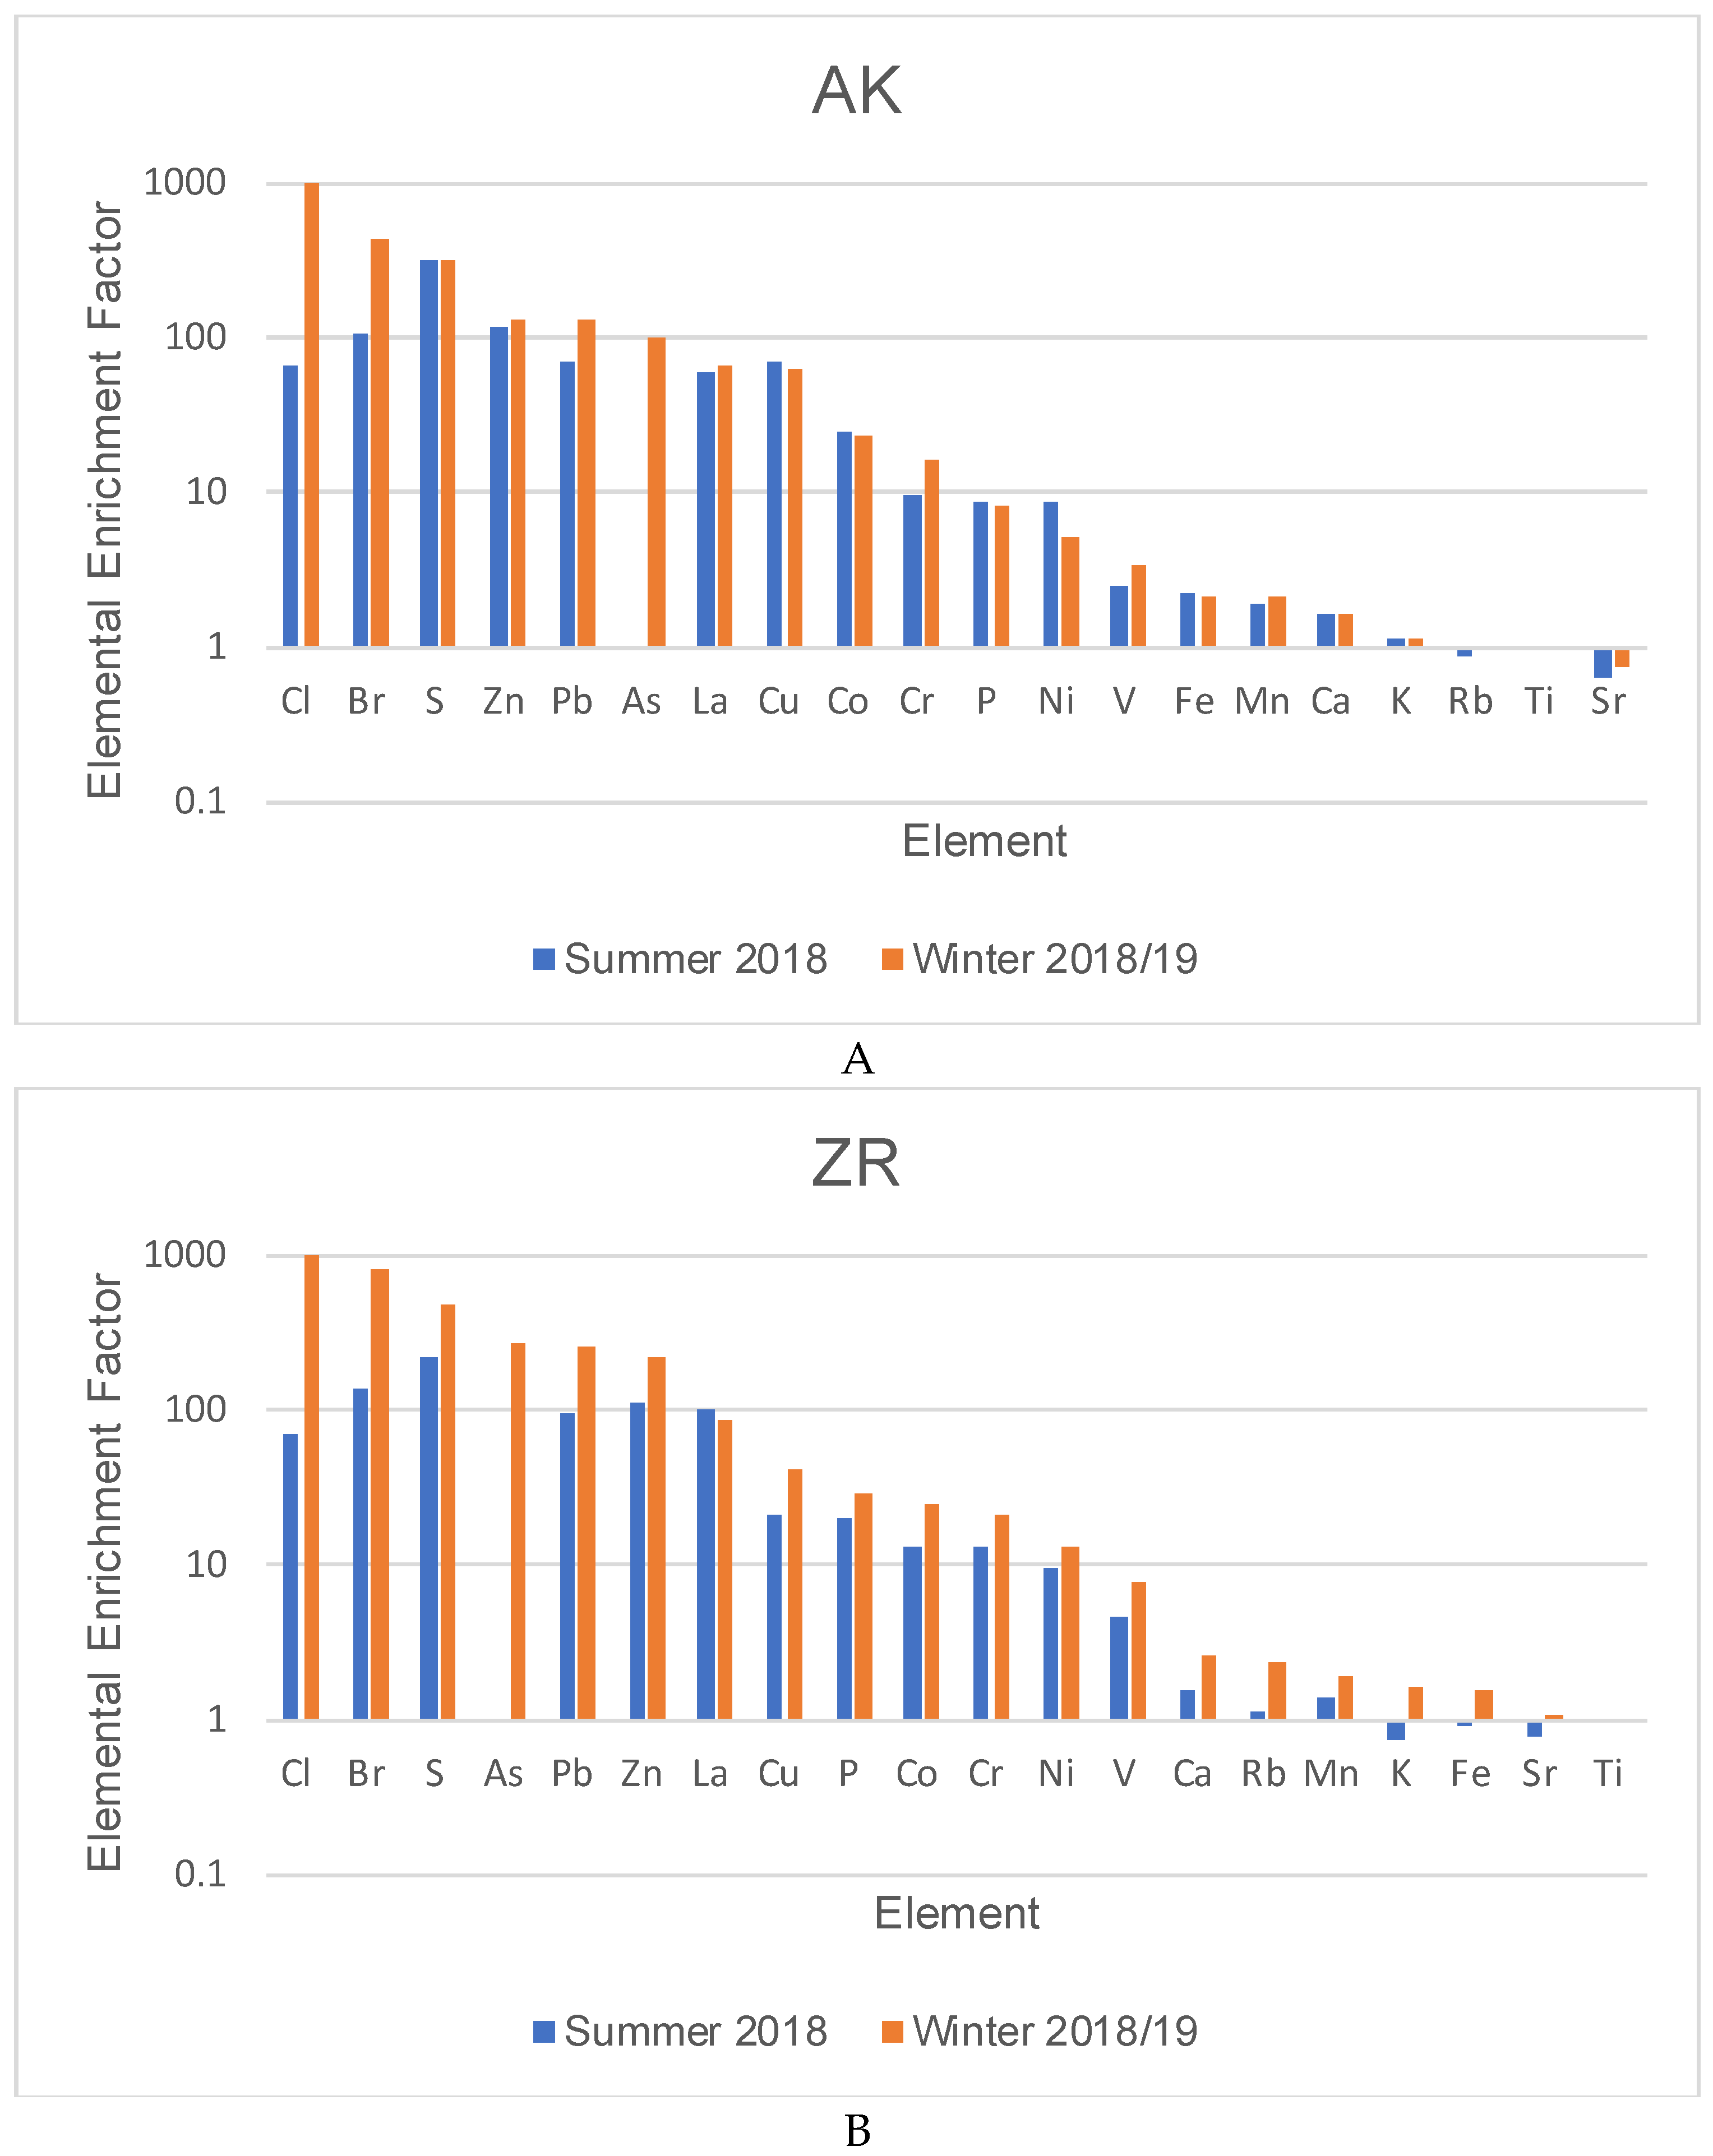
3.4.1. Preliminary Identification of PM10 Sources: Elemental Enrichment Factors
3.4.2. Identification of PM10 Sources by PMF Analysis
4. Conclusions
Supplementary Materials
Author Contributions
Funding
Institutional Review Board Statement
Informed Consent Statement
Data Availability Statement
Acknowledgments
Conflicts of Interest
References
- Du, Y.; Xu, X.; Chu, M.; Guo, Y.; Wang, J. Air particulate matter and cardiovascular disease: The epidemiological, biomedical and clinical evidence. J. Thorac. Dis. 2016, 8, E8–E19. [Google Scholar] [CrossRef] [PubMed]
- Lelieveld, J.; Klingmüller, K.; Pozzer, A.; Pöschl, U.; Fnais, M.; Daiber, A.; Münzel, T. Cardiovascular disease burden from ambient air pollution in Europe reassessed using novel hazard ratio functions. Eur. Heart J. 2019, 40, 1590–1596. [Google Scholar] [CrossRef] [PubMed] [Green Version]
- Münzel, T.; Gori, T.; Al-Kindi, S.; Deanfield, J.; Lelieveld, J.; Daiber, A.; Rajagopalan, S. Effects of gaseous and solid constituents of air pollution on endothelial function. Eur. Heart J. 2018, 39, 3543–3550. [Google Scholar] [CrossRef] [PubMed] [Green Version]
- UNION; PEAN. Directive 2008/50/EC of the European Parliament and the Council of 21 May 2008 on ambient air quality and cleaner air for Europe. Off. J. Eur. Union 2008, 51, 1–361. [Google Scholar]
- Regulation of the Minister of the Environment of 24 August 2012 on the levels of certain substances in the air. J. Laws 2012, 1031. (In Polish)
- GIOS. The Annual Reports of Air Quality Measurements of Chief Inspectorate of Environmental Protection, 2010–2019. Available online: pios.gov.pl (accessed on 1 June 2021). (In Polish)
- WIOS. The Annual Reports of Air Quality Measurements of Voivodeship Inspectorate for Environmental Protection in Krakow, 2010–2020. Available online: pios.gov.pl (accessed on 1 June 2021). (In Polish)
- Maps. Openstreetmap.org. Available online: https://app.datawrapper.de/map/04BMK/basemap (accessed on 30 June 2021).
- Polish Committee for Standardization. Atmospheric air—Standard gravimetric measurement method for determining the mass concentrations of PM10 or PM2.5 fractions of particulate matter. PN EN 2014, 12, 341. [Google Scholar]
- Samek, L.; Turek-Fijak, A.; Skiba, A.; Furman, P.; Styszko, K.; Furman, L.; Stegowski, Z. Complex Characterization of Fine Fraction and Source Contribution to PM2.5 Mass at an Urban Area in Central Europe. Atmosphere 2020, 11, 1085. [Google Scholar] [CrossRef]
- Samek, L.; Stegowski, Z.; Styszko, K.; Furman, L.; Fiedor, J. Seasonal contribution of assessed sources to submicron and fine particulate matter in a Central European urban area. Environ. Pollut. 2018, 241, 406–411. [Google Scholar] [CrossRef]
- Stein, A.F.; Draxler, R.R.; Rolph, G.D.; Stunder, B.J.B.; Cohen, M.D.; Ngan, F. NOAA’s HYSPLIT atmospheric transport and dispersion modeling system. Bull. Am. Meteorol. Soc. 2015, 96, 2059–2077. [Google Scholar] [CrossRef]
- Major, I.; Furu, E.; Janovics, R.; Hajdas, I.; Kertész, Z.; Molnár, M. Method development for the 14C measurement of atmospheric aerosols. Acta Phys. Debrecina XLVI 2012, 46, 83–95. [Google Scholar]
- Goslar, T.; Czernik, J.; Goslar, E. Low-energy 14C AMS in Poznań Radiocarbon Laboratory, Poland. Nucl. Instrum. Methods Phys. Res. Sect. B Beam Interact. Mater. At. 2004, 223, 5–11. [Google Scholar] [CrossRef]
- Zimnoch, M.; Morawski, F.; Kuc, T.; Samek, L.; Bartyzel, J.; Gorczyca, Z.; Skiba, A.; Rozanski, K. Summer–winter contrast in carbon isotope and elemental composition of total suspended particulate matter in the urban atmosphere of Krakow, Southern Poland. Nukleonika 2020, 65, 181–191. [Google Scholar] [CrossRef]
- Zimnoch, M.; Samek, L.; Furman, L.; Styszko, K.; Skiba, A.; Gorczyca, Z.; Galkowski, M.; Rozanski, K.; Konduracka, E. Application of Natural Carbon Isotopes for Emission Source Apportionment of Carbonaceous Particulate Matter in Urban Atmosphere: A Case Study from Krakow, Southern Poland. Sustainability 2020, 12, 5777. [Google Scholar] [CrossRef]
- Mook, W.G.; van der Plicht, J. Reporting 14C activities and concentrations. Radiocarbon 1999, 41, 227–239. [Google Scholar] [CrossRef] [Green Version]
- Belis, C.A.; Karagulian, F.; Larsen, B.R.; Hopke, P.K. Critical review and meta-analysis of ambient particulate matter source apportionment using receptor models in Europe. Atmos. Environ. 2013, 69, 94–108. [Google Scholar] [CrossRef]
- Rudnick, R.L.; Gao, S. The composition of the continental crust. In Treatise on Geochemistry—The Crust; Rudnick, R.L., Holland, H.D., Turekian, K.K., Eds.; Elsevier: Oxford, UK, 2003; pp. 1–64. [Google Scholar]
- Paatero, P.; Tapper, U. Positive matrix factorization: A non-negative factor model with optimal utilization of error estimates of data values. Environmetrics 1994, 5, 111–126. [Google Scholar] [CrossRef]
- Karagulian, F.; Belis, C.A. Enhancing source apportionment with receptor models to foster the air quality directive implementation. Int. J. Environ. Pollut. 2012, 50, 190–199. [Google Scholar] [CrossRef]
- Manousakas, M.; Diapouli, E.; Papaefthymiou, H.; Migliori, A.; Karydas, A.G.; Padill-Alvarez, R.; Bogovac, M.; Kaiser, R.B.; Jaksic, M.; Bogdanovic-Radivic, I.; et al. Source apportionment by PMF on elemental concentrations obtained by PIXE analysis of PM10 samples collected at the vicinity of lignite power plants and mines in Megalopolis, Greece. Nucl. Instrum. Methods Phys. Res. B 2015, 349, 114–124. [Google Scholar] [CrossRef]
- Samek, L.; Stegowski, Z.; Furman, L.; Styszko, K.; Szramowiat, K.; Fiedor, J. Quantitative Assessment of PM2.5 Sources and Their Seasonal Variation in Krakow. Water Air Soil Pollut. 2017, 228, 290. [Google Scholar] [CrossRef] [PubMed] [Green Version]
- Polissar, A.V.; Hopke, P.K.; Paatero, P. Atmospheric Aerosol over Alaska—2. Elemental Composition and Sources. J. Geophys. Res. Atmos. 1998, 103, 19045–19057. [Google Scholar] [CrossRef]
- Manousakas, M.; Papaefthymiou, H.; Diapouli, E.; Migliori, A.; Karydas, A.G.; Bogdanovic-Radivic, I.; Eleftheriadis, K. Assessment of PM2.5 sources and their corresponding level of uncertainty in a coastal urban area using EPA PMF 5.0 enhanced diagnostics. Sci. Total Environ. 2017, 574, 155–164. [Google Scholar] [CrossRef] [PubMed] [Green Version]
- Juda-Rezler, K.; Reizer, M.; Maciejewska, K.; Blaszczak, B.; Klejnowski, K. Characterization of atmospheric sources at a Central European urban background site. Sci. Total Environ. 2020, 713, 136729. [Google Scholar] [CrossRef] [PubMed]
- Szidat, S.; Jenk, T.M.; Gäggeler, H.W.; Synal, H.A.; Fisseha, R.; Baltensperger, U.; Kalberer, M.; Samburova, V.; Reimann, S.; Kasper-Giebl, A.; et al. Radiocarbon (14C)- deduced biogenic and anthropogenic contributions to organic carbon (OC) of urban aerosols from Zürich. Switzerland. Atmos. Environ. 2004, 38, 4035–4044. [Google Scholar] [CrossRef]
- Amato, F.; Pandolfi, M.; Moreno, T.; Furger, M.; Pey, J.; Alastuey, A.; Bukowiecki, N.; Prevot, A.S.H.; Baltensperger, U.; Querol, X. Sources and variability of inhalable road dust particles in three European cities. Atmos. Environ. 2011, 45, 6777–6787. [Google Scholar] [CrossRef]
- Harrison, R.M.; Jones, A.M.; Gietl, J.; Yin, J.; Green, D.C. Estimation of the contributions of brake dust, tire wear, and resuspension to non-exhaust traffic particles derived from atmospheric measurements. Environ. Sci. Technol. 2012, 46, 6523–6529. [Google Scholar] [CrossRef] [PubMed]
- Klejnowski, K.; Janoszka, K.; Czaplicka, M. Characterization and Seasonal Variations of Organic and Elemental Carbon and Levoglucosan in PM10 in Krynica Zdroj, Poland. Atmosphere 2017, 8, 190. [Google Scholar] [CrossRef] [Green Version]
- Major, I.; Furu, E.; Varga, T.; Horvath, A.; Futo, I.; Gyokos, B.; Somodi, G.; Lisztes-Szabo, Z.; Jull, A.J.T.; Kertesz, Z.; et al. Source identification of PM2.5 carbonaceous aerosol using combined carbon fraction, radiocarbon and stable carbon isotope analyses in Debrecen, Hungary. Sci. Total Environ. 2021, 782, 146520. [Google Scholar] [CrossRef]
- Pio, C.; Cerqueira, M.; Harrison, R.M.; Nunes, T.; Mirante, F.; Alves, C.; Oliveira, C.; Sanchez de la Campa, A.; Artinano, B.; Matos, M. OC/EC ratio observations in Europe: Re-thinking the approach for apportionment between primary and secondary organic carbon. Atmos Environ. 2011, 45, 6121–6132. [Google Scholar] [CrossRef]
- Gorka, M.; Rybicki, M.; Simoneit, B.R.T.; Marynowski, L. Determination of multiple organic matter sources in aerosol PM10 from Wroclaw, Poland using molecular and stable carbon isotope compositions. Atmos. Environ. 2014, 89, 739–748. [Google Scholar] [CrossRef]
- Aguilera, J.; Whigham, L.D. Using the C-13/C-12 carbon isotope ratio to characterise the emission sources of airborne particulate matter: A review of literature. Isot. Environ. Health Stud. 2018, 54, 573–587. [Google Scholar] [CrossRef]
- Weber, S.; Salameh, D.; Albinet, A.; Alleman, L.Y.; Waked, A.; Besombes, J.L.; Jacob, V.; Guillaud, G.; Meshbah, B.; Rocq, B.; et al. Comparison of PM10 Sources Profiles at 15 French Sites Using a Harmonized Constrained Positive Matrix Factorization Approach. Atmosphere 2019, 10, 310. [Google Scholar] [CrossRef] [Green Version]


| Traffic-Dominated Site | ||||||||
|---|---|---|---|---|---|---|---|---|
| No. | Aggregation Period | Number of Aggregated Samples | PM10 (μg/m3) | OC (μg/m3) | EC (μg/m3) | δ13CVPDB (‰) | pMC (%) | FF (%) |
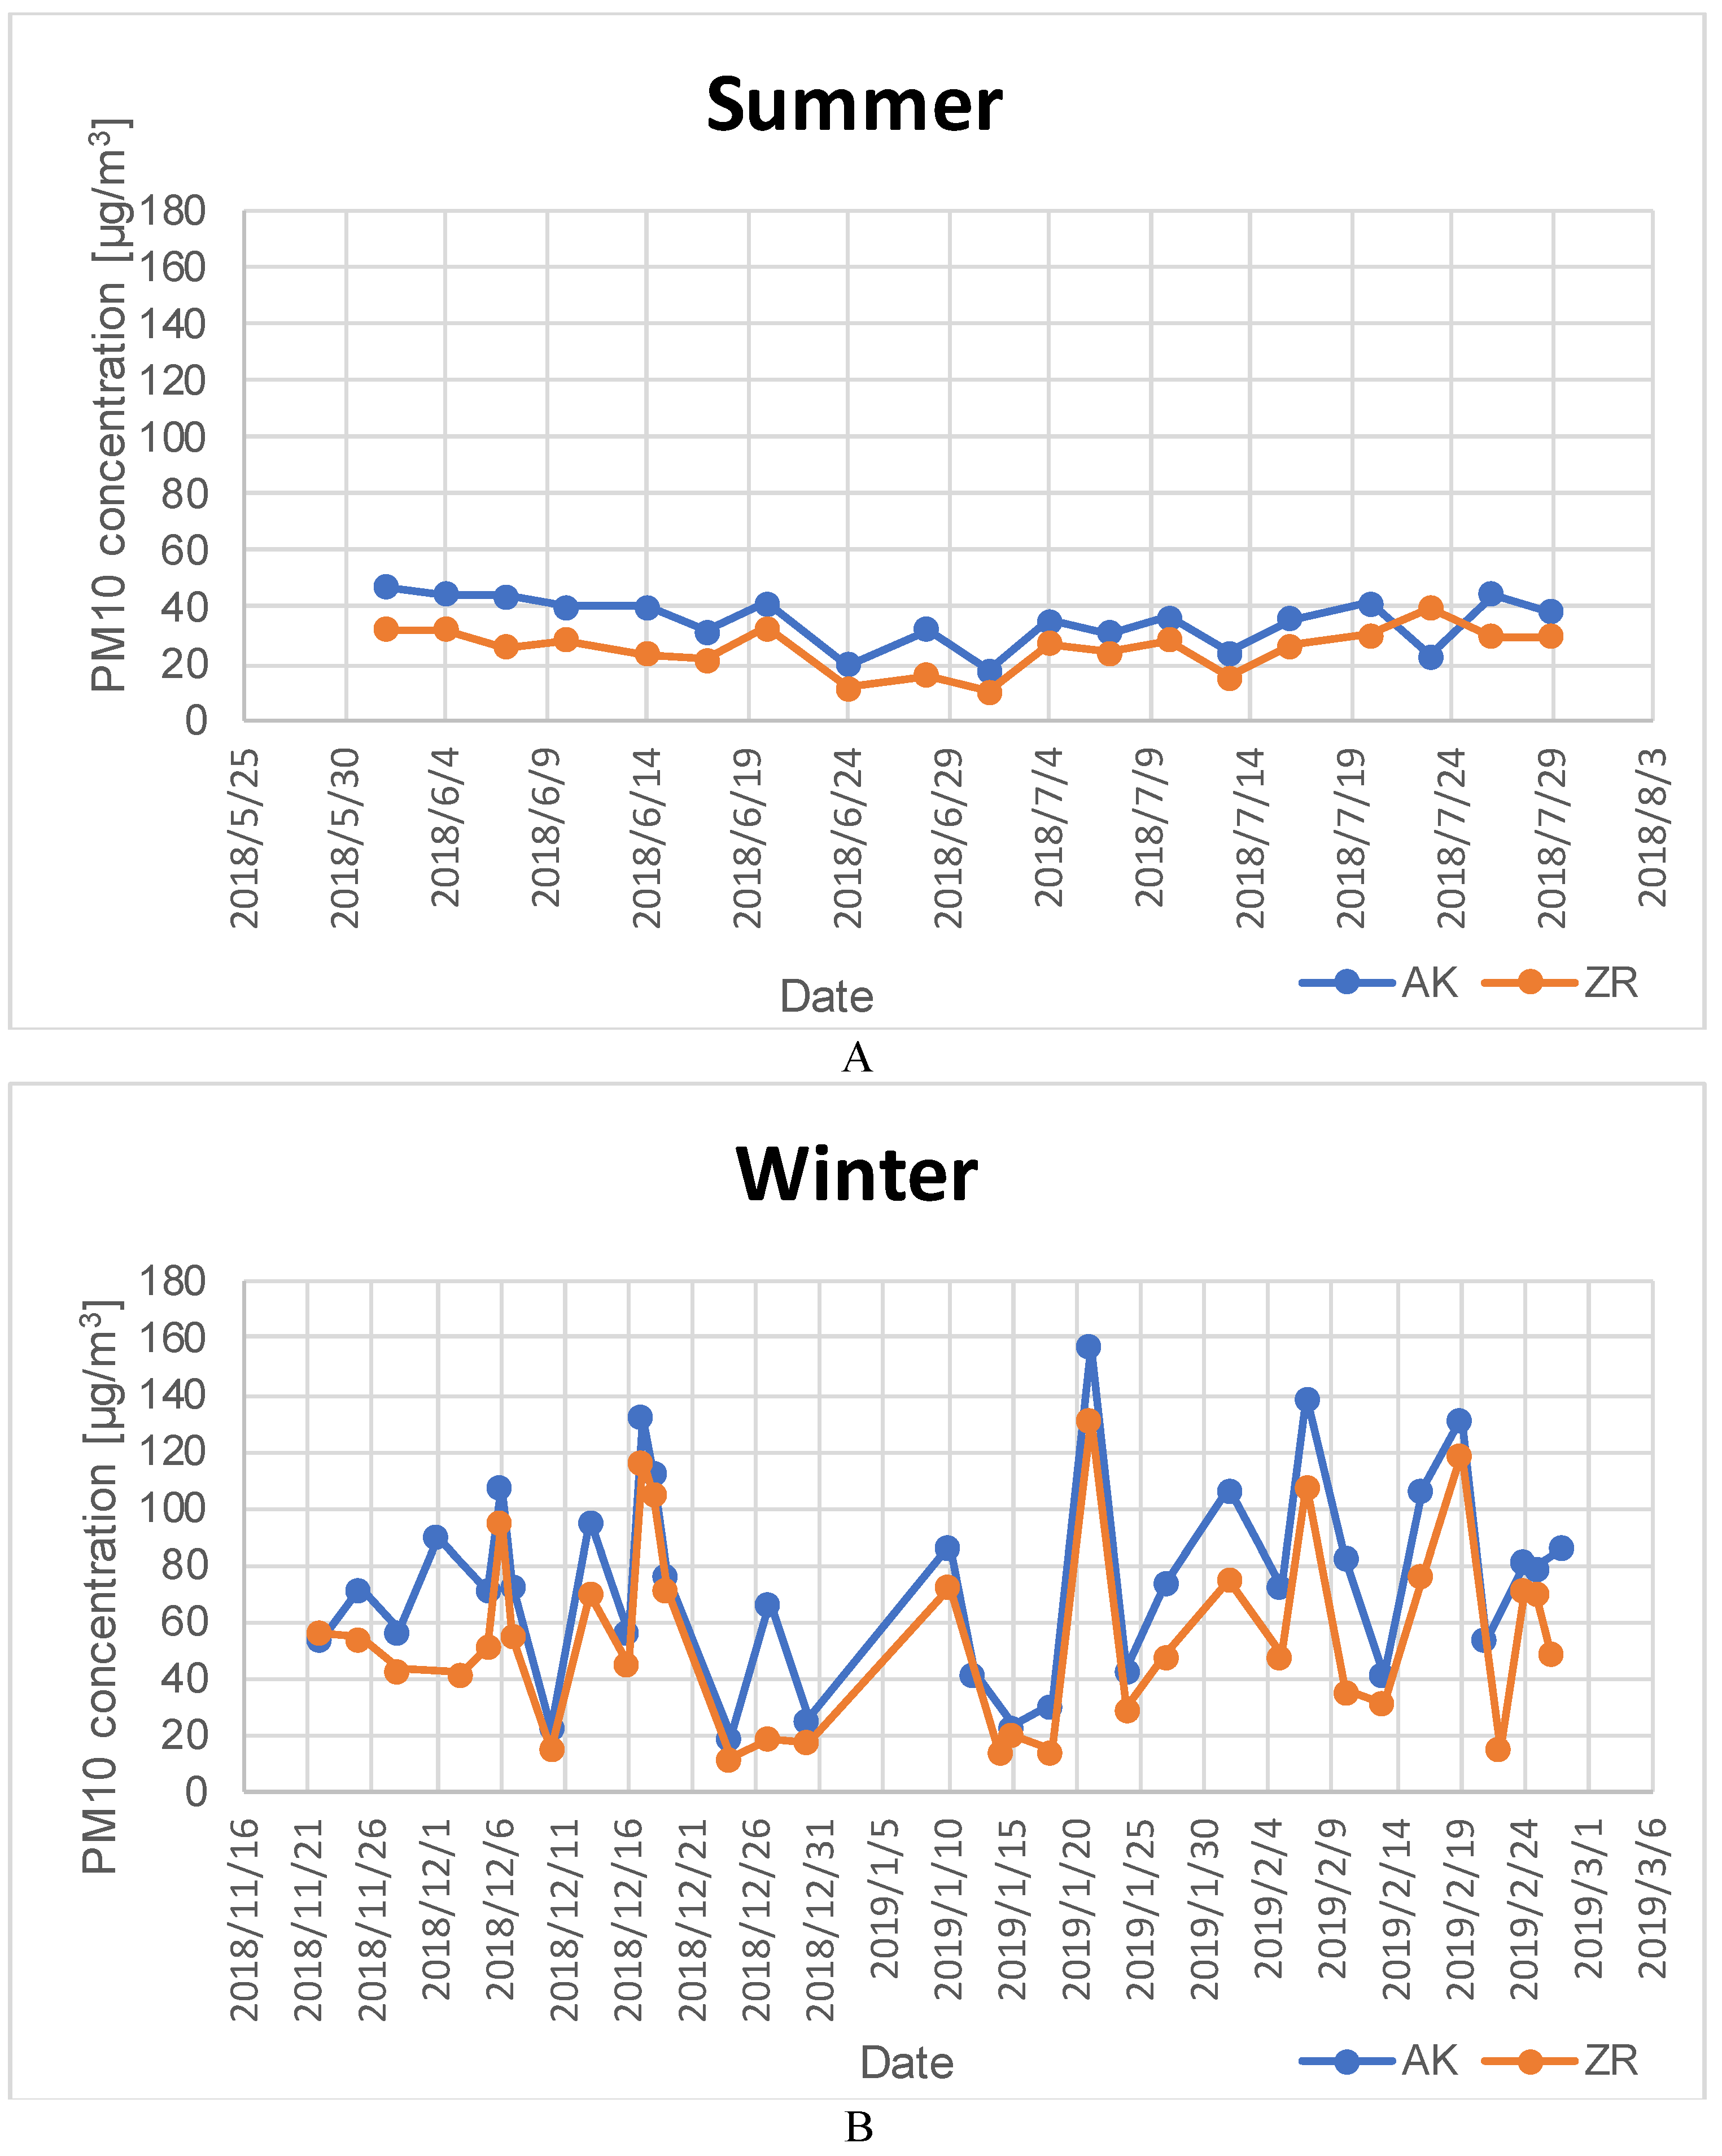
| 1 | 1–28.06.2018 | 15 | 40.1 | 9.62 | 6.045 | −28.0 | 41.6 | 58.5 |
| 2 | 1–29.07.2018 | 15 | 35.5 | 8.53 | 5.555 | −28.1 | 41.8 | 58.2 |
| 3 | 22–30.11.2018 | 8 | 54.7 | 20.72 | 6.777 | −28.4 | 37.2 | 62.8 |
| 4 | 1–27.12.2018 | 6 | 100.8 | 24.58 | 8.220 | −26.1 | 36.7 | 63.3 |
| 5 | 10–27.01.2019 | 7 | 65.3 | 24.08 | 5.910 | −25.6 | 39,6 | 60.4 |
| 6 | 1–25.02.2019 | 5 | 112.7 | 26.44 | 10.157 | −26.4 | 39.1 | 60.9 |
| urban-background site | ||||||||
| No. | Aggregation period | Number of aggregated samples | PM10 (μg/m3) | OC (μg/m3) | EC (μg/m3) | δ13CVPDB (‰) | pMC (%) | FF (%) |
| 1 | 1–28.06.2018 | 15 | 26.8 | 7.74 | 1.265 | −27.9 | 55.4 | 44.6 |
| 2 | 1–29.07.2018 | 16 | 29.1 | 8.97 | 1.595 | −27.8 | 58.6 | 41.4 |
| 3 | 22–30.11.2018 | 8 | 48.5 | 17.16 | 2.830 | −26.7 | 52.4 | 47.6 |
| 4 | 1–27.12.2018 | 10 | 53.6 | 21.78 | 3.718 | −25.8 | 40.9 | 59.1 |
| 5 | 10–27.01.2019 | 7 | 47.2 | 22.46 | 2.416 | −25.1 | 42.8 | 57.2 |
| 6 | 1–25.02.2019 | 9 | 68.5 | 23.87 | 4.697 | −25,8 | 40.3 | 59.7 |
| Source | Summer 2018 | Winter 2018/2019 | ||
|---|---|---|---|---|
| AK | ZR | AK | ZR | |
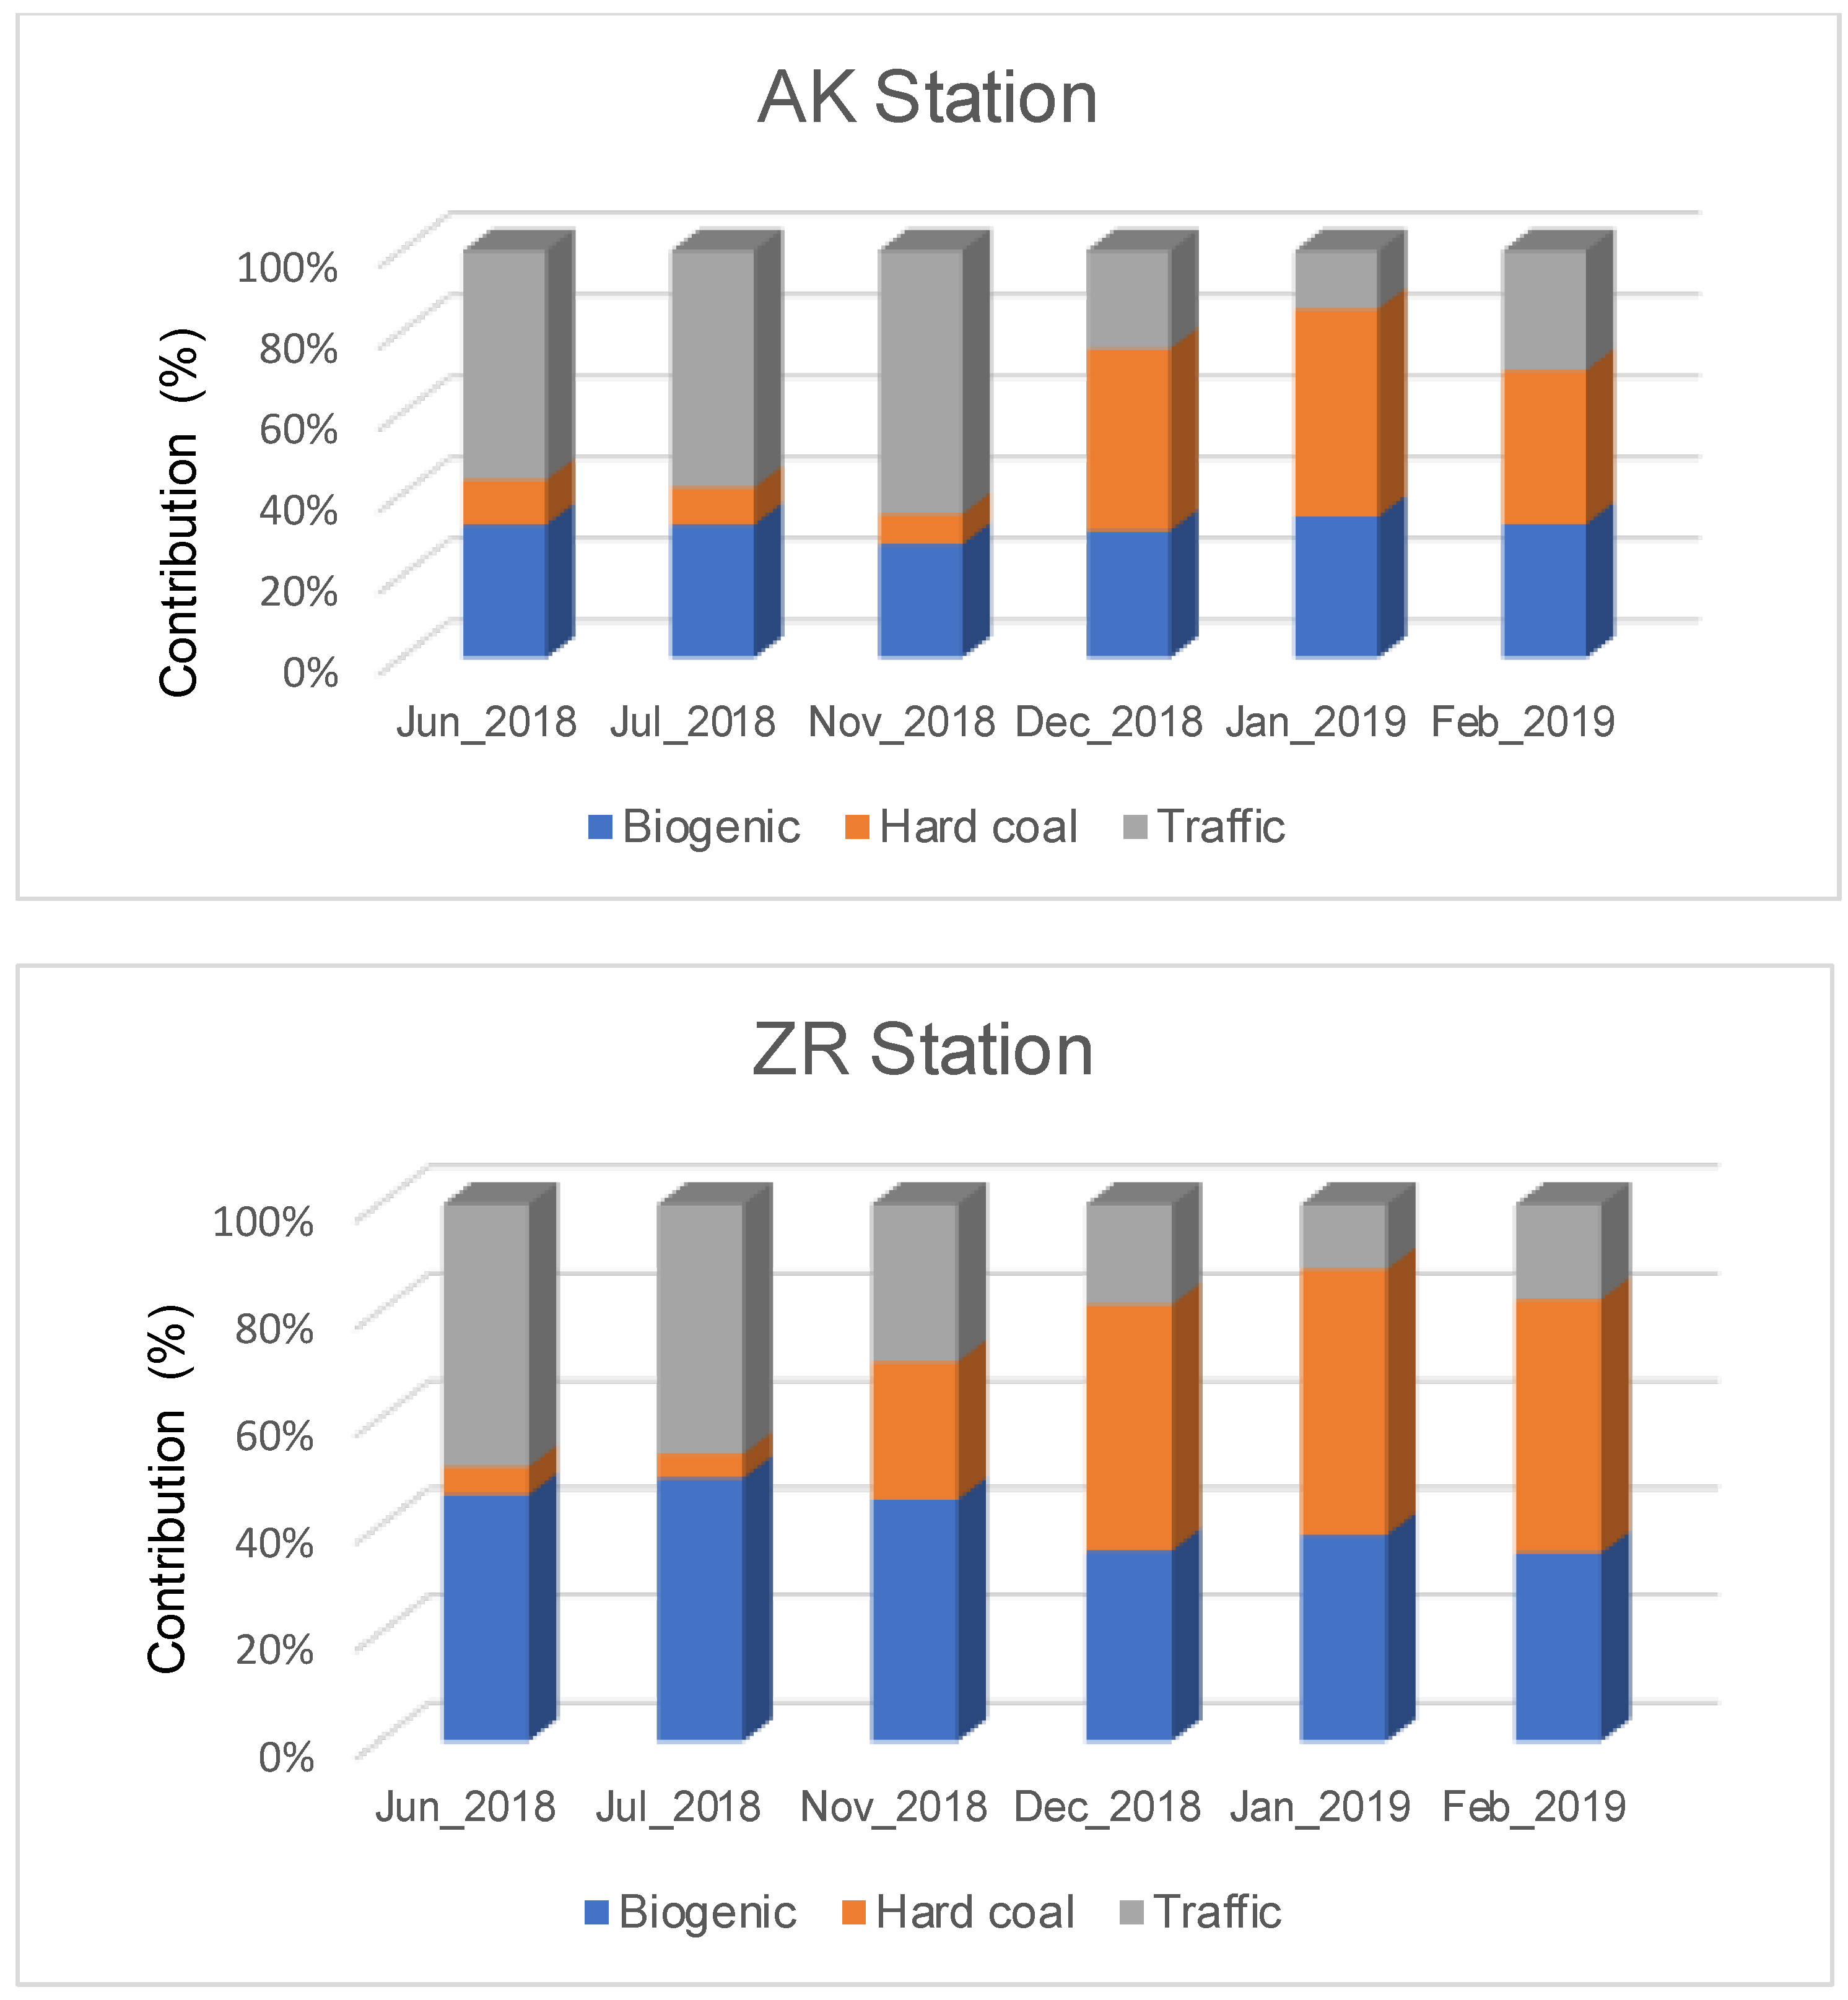
| Biogenic and biomass burning | 4.9 ± 1.7 (33%) | 3.9 ± 0.8 (47%) | 9.5 ± 5.1 (32%) | 9.6 ± 5.3 (39%) |
| Hard Coal | 1.5 ± 1.1 (10%) | 0.5 ± 0.6 (5%) | 11 ± 5.6 (35%) | 10 ± 6.2 (42%) |
| Traffic | 8.5 ± 2.3 (57%) | 4.7 ± 0.9 (48%) | 11 ± 6 (33%) | 4.7 ± 3.6 (19%) |
| Identified Source | Chemical Species Identifying Source |
|---|---|
| Fossil Fuel Combustion | Cl, NO3−, Na+, OC, EC |
| Secondary Inorganic Aerosols | NO3−, SO42−, NH4+ |
| Traffic Exhaust | EC, SO42−, NO3−, NH4+, OC, Ti, Cu, Fe, Co |
| Soil | PO43−, Ni, Na+ |
| Road Dust, Industry, Construction work | Ca, Ti, Co, Cr, Fe, Mn, Zn, Cu, EC |
| Source | Summer 2018 | Winter 2018/2019 | ||
|---|---|---|---|---|
| Traffic-Dominated (AK) | Urban-Background (ZR) | Traffic-Dominated (AK) | Urban-Background (ZR) | |
| Fossil Fuel Combustion | nd | 2 ± 1 (8%) | 7 ± 4 (10%) | 20 ± 8 (36%) |
| Road dust, Industry, Construction work | 11 ± 8 (32%) | 13 ± 7 (48%) | 18 ± 12 (24%) | 5 ± 5 (8%) |
| Soil | 3 ± 2 (9%) | 2 ± 2 (8%) | 5 ± 4 (7%) | 4 ± 4 (7%) |
| Secondary Inorganic Aerosols | 2 ± 2 (5%) | 4 ± 3 (16%) | 21 ± 19 (28%) | 16 ± 10 (29%) |
| Traffic exhaust | 17 ± 5 (48%) | 1 ± 1 (4%) | 18 ± 10 (24%) | 9 ± 5 (16%) |
| Non identified | 2 ± 1 (6%) | 5 ± 2 (19%) | 6 ± 3 (8%) | 2 ± 1 (4%) |
Publisher’s Note: MDPI stays neutral with regard to jurisdictional claims in published maps and institutional affiliations. |
© 2021 by the authors. Licensee MDPI, Basel, Switzerland. This article is an open access article distributed under the terms and conditions of the Creative Commons Attribution (CC BY) license (https://creativecommons.org/licenses/by/4.0/).
Share and Cite
Samek, L.; Styszko, K.; Stegowski, Z.; Zimnoch, M.; Skiba, A.; Turek-Fijak, A.; Gorczyca, Z.; Furman, P.; Kasper-Giebl, A.; Rozanski, K. Comparison of PM10 Sources at Traffic and Urban Background Sites Based on Elemental, Chemical and Isotopic Composition: Case Study from Krakow, Southern Poland. Atmosphere 2021, 12, 1364. https://0-doi-org.brum.beds.ac.uk/10.3390/atmos12101364
Samek L, Styszko K, Stegowski Z, Zimnoch M, Skiba A, Turek-Fijak A, Gorczyca Z, Furman P, Kasper-Giebl A, Rozanski K. Comparison of PM10 Sources at Traffic and Urban Background Sites Based on Elemental, Chemical and Isotopic Composition: Case Study from Krakow, Southern Poland. Atmosphere. 2021; 12(10):1364. https://0-doi-org.brum.beds.ac.uk/10.3390/atmos12101364
Chicago/Turabian StyleSamek, Lucyna, Katarzyna Styszko, Zdzislaw Stegowski, Miroslaw Zimnoch, Alicja Skiba, Anna Turek-Fijak, Zbigniew Gorczyca, Przemyslaw Furman, Anne Kasper-Giebl, and Kazimierz Rozanski. 2021. "Comparison of PM10 Sources at Traffic and Urban Background Sites Based on Elemental, Chemical and Isotopic Composition: Case Study from Krakow, Southern Poland" Atmosphere 12, no. 10: 1364. https://0-doi-org.brum.beds.ac.uk/10.3390/atmos12101364