1. Introduction
Precipitable water vapor (PWV) is an important indicator of global and regional climate changes. PWV and its changes are the basis of research on radiation balance [
1], cloud formation and precipitation mechanism [
2], numerical weather forecasting [
3], remote sensing applications [
4], etc. The special atmospheric water cycle on the Qinghai-Tibet Plateau and its surroundings makes it a key area that affects climate change in China, and even the world [
5]. The northern Qinghai-Tibet Plateau is rich in surface water resources and is of strategic significance to China’s water resource security, ecological protection, and social and economic development. With global warming, temperature, precipitation, evapotranspiration, and atmospheric water vapor transport have been varying largely, which has led to glacier melt, permafrost thaw, and more frequent drought events in Qinghai-Tibet Plateau [
6,
7,
8,
9]. Therefore, the study of PWV, a basic climate indicator for the atmosphere, is a prerequisite to recognize the fact of climate change and to understand its causes in the study region.
Ground-based detection, satellite remote sensing, and numerical simulations are the main ways to obtain PWV [
10]. Weather balloons have been a primary source of upper-air data for long, but they cannot perform large-scale and high-resolution PWV detection. Although radiosonde data are limited by factors such as flight altitude, observation range, detection time, and susceptibility to external environmental interference, compared with other data sources, radiosonde data can still better reflect the real values, and can be used to verify the accuracy and applicability of remote sensing data and reanalysis data. Ground-based remote sensing of the upper-air can also detect PWV from the surface with high accuracy, since it is not affected by complex surface radiation and other reflected signals. However, its spatial coverage and resolution are poorly limited by the location and number of stations, and there are deviations between the observation results due to differences in measurement principles among different instruments.
Compared with ground-based “point data,” remote sensing and reanalysis data, which are naturally “area data,” have been widely used in PWV research [
11,
12,
13]. Numerous studies have shown that Atmospheric Infrared Sounder (AIRS) remote-sensed data and the fifth generation of global climate reanalysis data published by the European Centre for Medium-Range Weather Forecasts (ERA-5) can give sufficient variation characteristics of PWV, temperature, and specific humidity [
14,
15,
16,
17,
18].
Since the release of AIRS and ERA-5 data, many scholars have applied them to various studies without sufficient verification; at the same time, more and more scholars have begun to pay attention to the research on the characteristics of water vapor in the Qinghai-Tibet Plateau. Therefore, in the case of climate change, the accuracy and applicability of PWV from different datasets in high-altitude areas should be the priorities to ensure the reliability of the analysis results, which has been noticed in some research. For example, Zhang et al. [
19] used data from more than 2000 weather stations and 89 radiosonde stations in China in 2016, and verified that the ERA-5 dataset can be used in realizing high-precision GPS PWV inversion and can correctly reflect intra-day changes, but there is a large relative error in winter for the Qinghai-Tibet Plateau.
At present, PWV data from the ERA-5 dataset has not been used for plateau areas, including comparisons with remote sensing data [
20]. At the same time, deep verification and error analysis of ERA-5 PWV under different cloud cover conditions still cannot be found in the literature. Based on the above considerations, the accuracy and applicability of AIRS and ERA-5 PWV data in the northern Qinghai-Tibet Plateau were verified and analyzed in this study, by using the radiosonde data from meteorological stations. Specifically, the distribution and variation trends of PWV under different cloud cover conditions were analyzed in detail, the differences in different sub-regions were explored. The cause of ERA-5 PWV error was examined with relative humidity and temperature. Therefore, this work can provide deeper insights into the ERA-5 data quality, providing a basis for further analysis of PWV changes in different cloud cover conditions and in different regions. This paper is expected to arouse more attention toward data quality, rather than availability, to guarantee that subsequent study conclusions are accurate and solid in climatic research in the plateau areas.
2. Datasets and Methods
2.1. Research Area
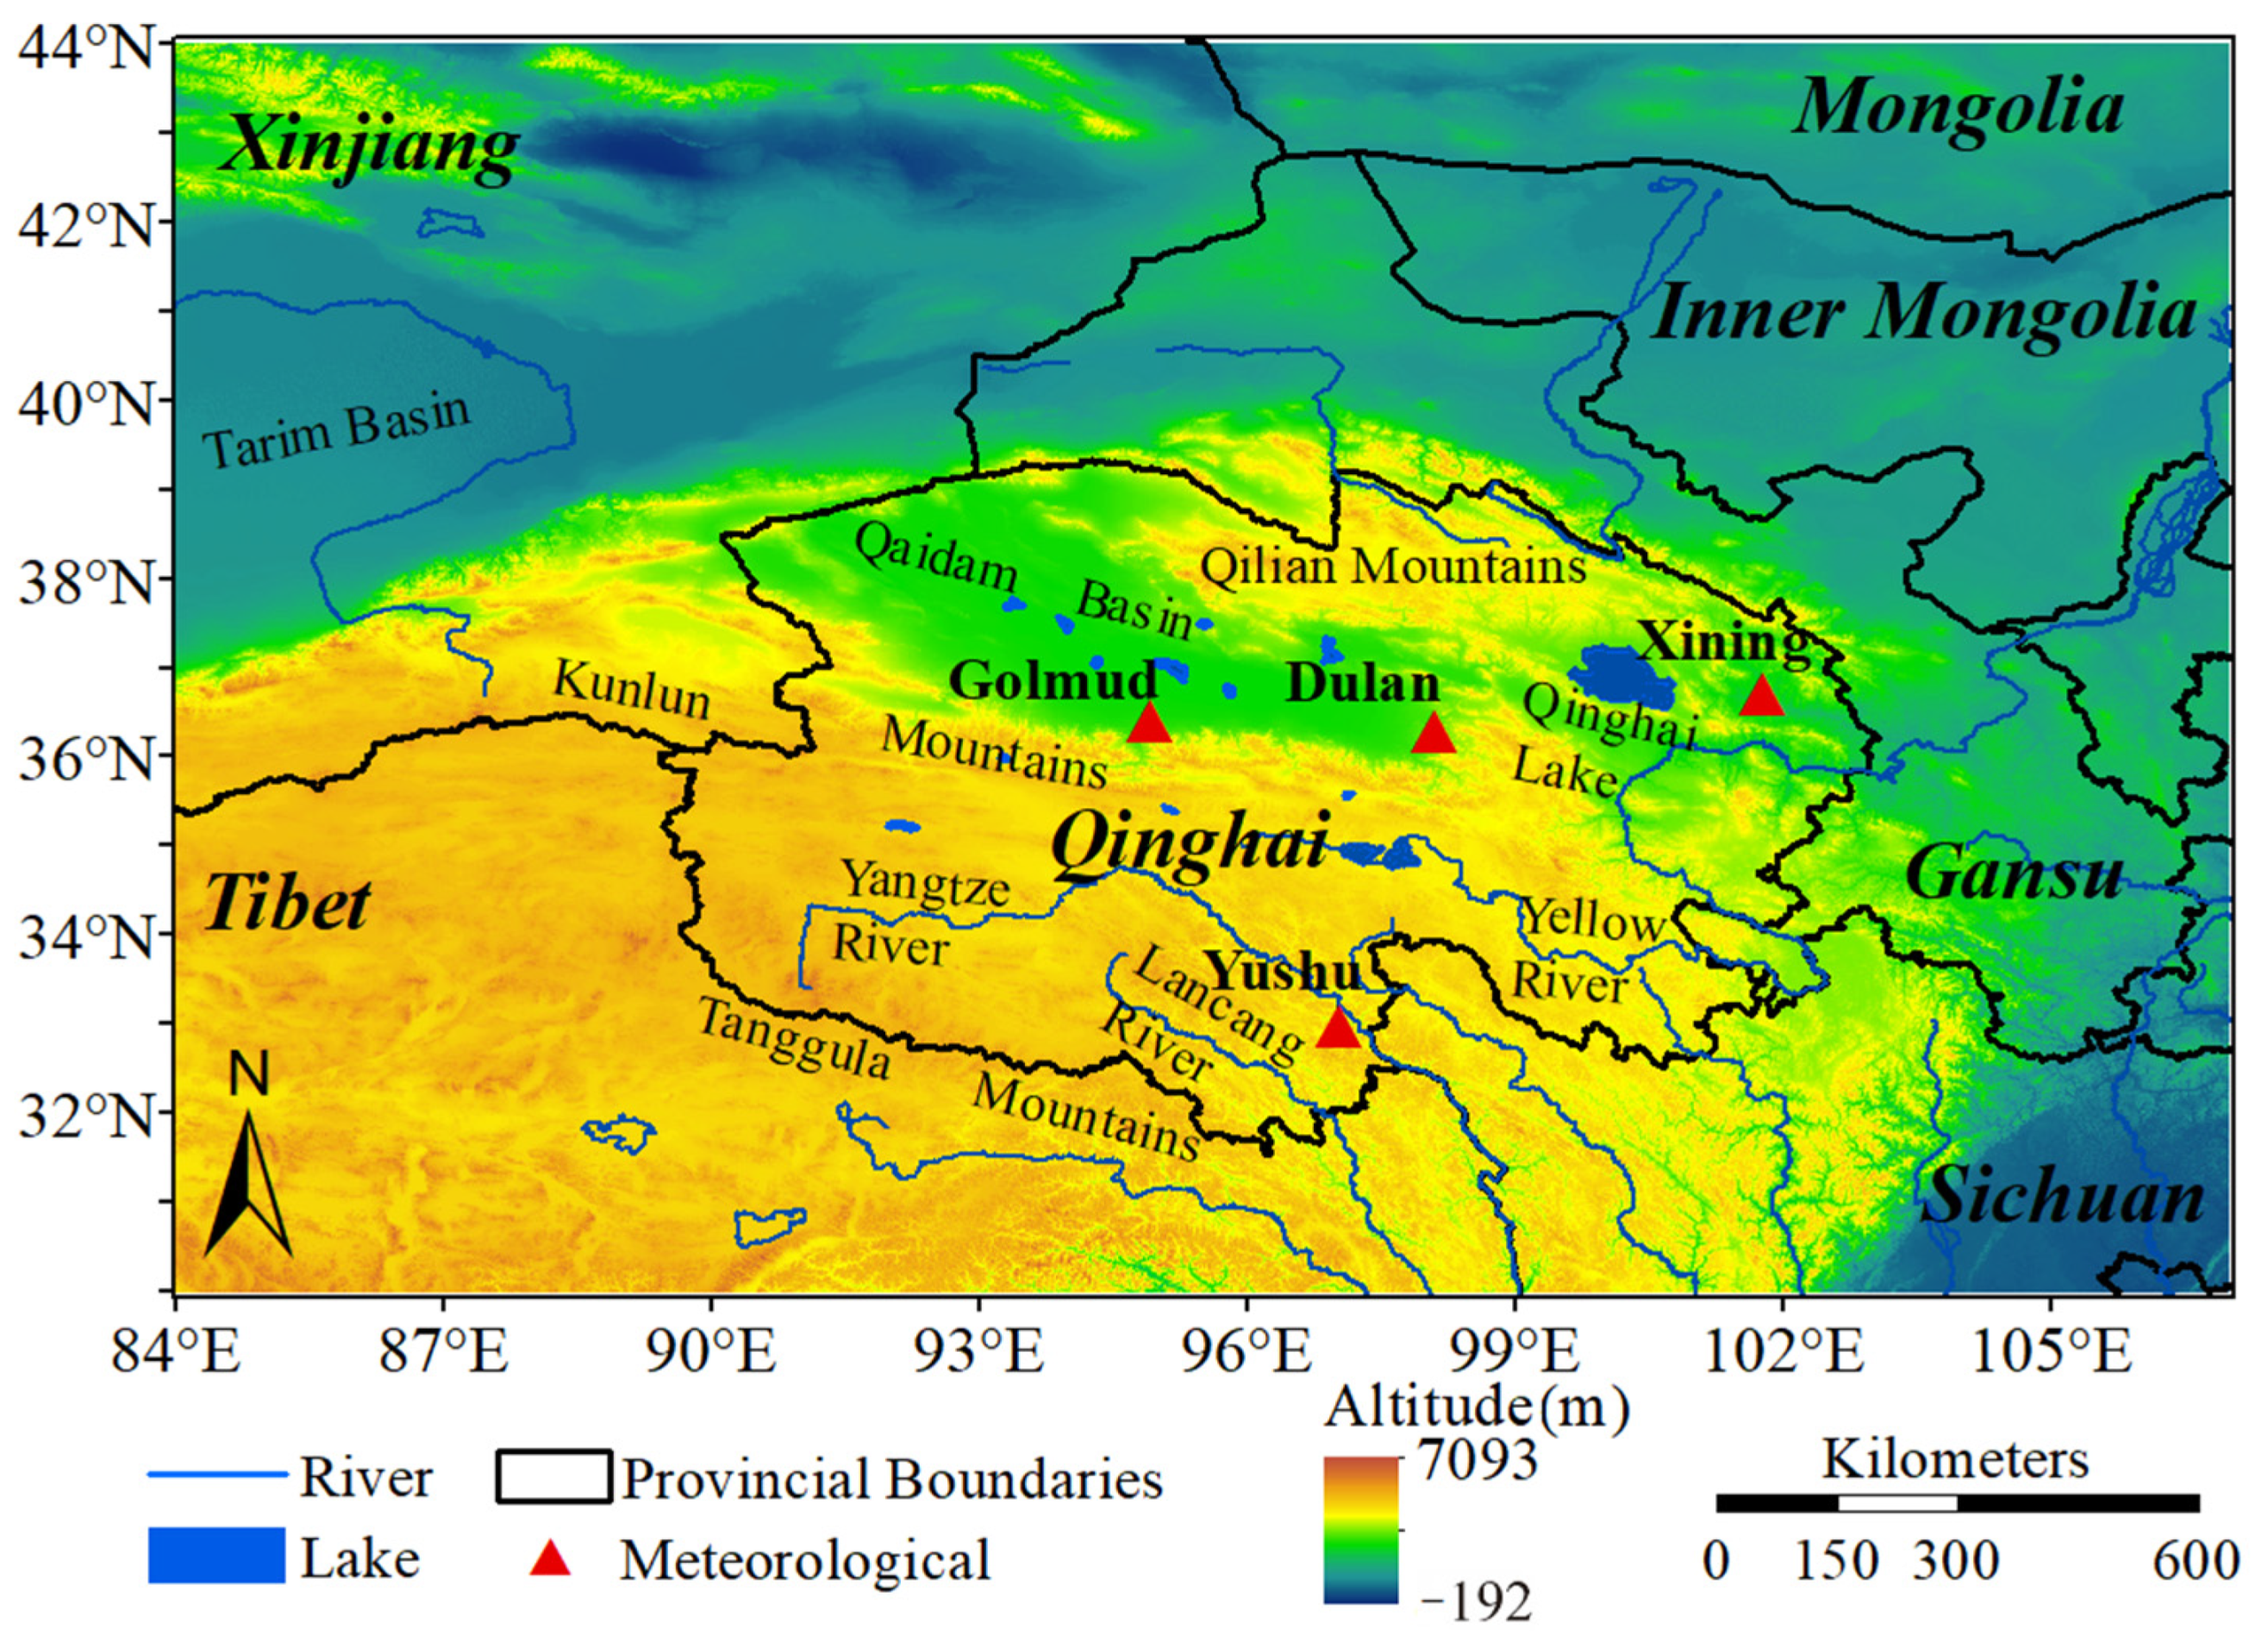
As the third pole of the world and the water tower in Asia, the Qinghai-Tibet Plateau plays an important role as a barrier for ecological security in Asia. The Qilian Mountains, Kunlun Mountains, Tanggula Mountains, and other basins, such as Qaidam and Qinghai Lake, distributed from north to south, provide necessary conditions for complex topography and climatic environment. The northern Qinghai-Tibet Plateau has a typical plateau continental climate, dominated by cold and drought, with an average annual temperature of −6 to –9 °C and annual precipitation of 16–750 mm. 84° E–107° E, 30° N–44° N was selected as the study area in this paper. As shown in
Figure 1, it includes the entire Qinghai Province and the surrounding plateaus and basins. It is representative for accuracy verification with different datasets of areas such as mountains, basins, and plains.
From the perspective of water vapor sources, the northern Qinghai-Tibet Plateau is mainly affected by the wet and warm southwest and southeast monsoons in summer, and dry westerly current in winter. The geographical locations of the four meteorological stations in Xining, Dulan, Golmud, and Yushu in Qinghai Province are shown in
Figure 1. The precipitation and climate characteristics of each station are significantly different.
Xining Station is located in the eastern agricultural area of Qinghai Province, with an average elevation of 2260 m, an annual mean precipitation of about 380 mm, and an average annual temperature of 7.6 °C; and the rain and heat are in the same season. Dulan Station is located in the central part of Qinghai Province and the southeastern corner of the Qaidam Basin, having an average elevation level of 3180 m, an annual mean precipitation level of about 180 mm, and a mean temperature of 2.7 °C. Golmud Station is located in the midwest of Qinghai Province, having an average altitude of 2780 m; there is little rain; the annual mean precipitation level is about 100 mm; and the mean temperature is 4.3 °C. Yushu Station is located in the southwestern part of Qinghai Province, having an average altitude of 4500 m and an annual mean temperature of only −4.9 °C. Affected by water vapor transport from the southeast, the annual mean precipitation here is about 600 mm.
Based on the four typical stations with different meteorological conditions, the analysis in this paper can basically reflect the distribution and change trends of water vapor content and cloud cover in different climatic regions of the northern Qinghai-Tibet Plateau.
2.2. Datasets
Ground-based data were collected from those 4 meteorological stations in
Figure 1. Data used in this paper include radiosonde data that was used to calculate PWV, which are measured twice a day (0:00, 12:00, UTC) and are available from 1979 to 2017; and cloud cover data measured every 6 h (0:00, 6:00, 12:00, 18:00 UTC), available from 1989 to 2017.
PWV data from the Atmospheric Infrared Sounder (AIRS) Version 6 Release Level 2 dataset from 2002 to 2016 were selected as a typical remote sensing data [
21]. This dataset was interpreted from the AIRS detection data onboard the Aqua satellite in the NASA’s EOS (Earth Observing System) satellite series. Following the Sun-synchronous orbit, each area can be observed twice a day by Aqua satellite at local times of about 1:30 a.m. (17:30 UTC for the study area) and 1:30 p.m. (5:30 UTC for the study area). The AIRS dataset was planned to be jointly interpreted from three instruments including the AIRS, AMSU-A, and HSB. However, due to the failure of HSB in February 2003, the AIRS2RET data estimated by AIRS and AMSU-A instruments were used in this study. The daily AIRS2RET data are stored in 240 granules; each includes 6 min of measurements registered onto 30 footprints across track by 45 lines along track with resolution of 45 km at nadir [
22]. Besides, the study area cannot completely be covered by these scanning points, which leads to some blind regions between satellite orbits. Therefore, it was necessary to generate regular raster data by interpolating and rasterizing the original data points to facilitate subsequent research and analysis. Kriging interpolation was used to obtain the regular grid data with a resolution of 0.1° × 0.1°, and the missing data were filled in with the multi-year mean of the same ordinal day at the same location.
The data of PWV, total cloud cover, temperature, and relative humidity in ERA-5 dataset from 1979 to 2017 were selected as the typical reanalysis data, with a horizontal resolution of 0.25° × 0.25° and temporal resolution of 1 h.
2.3. Method
2.3.1. Bilinear Interpolation
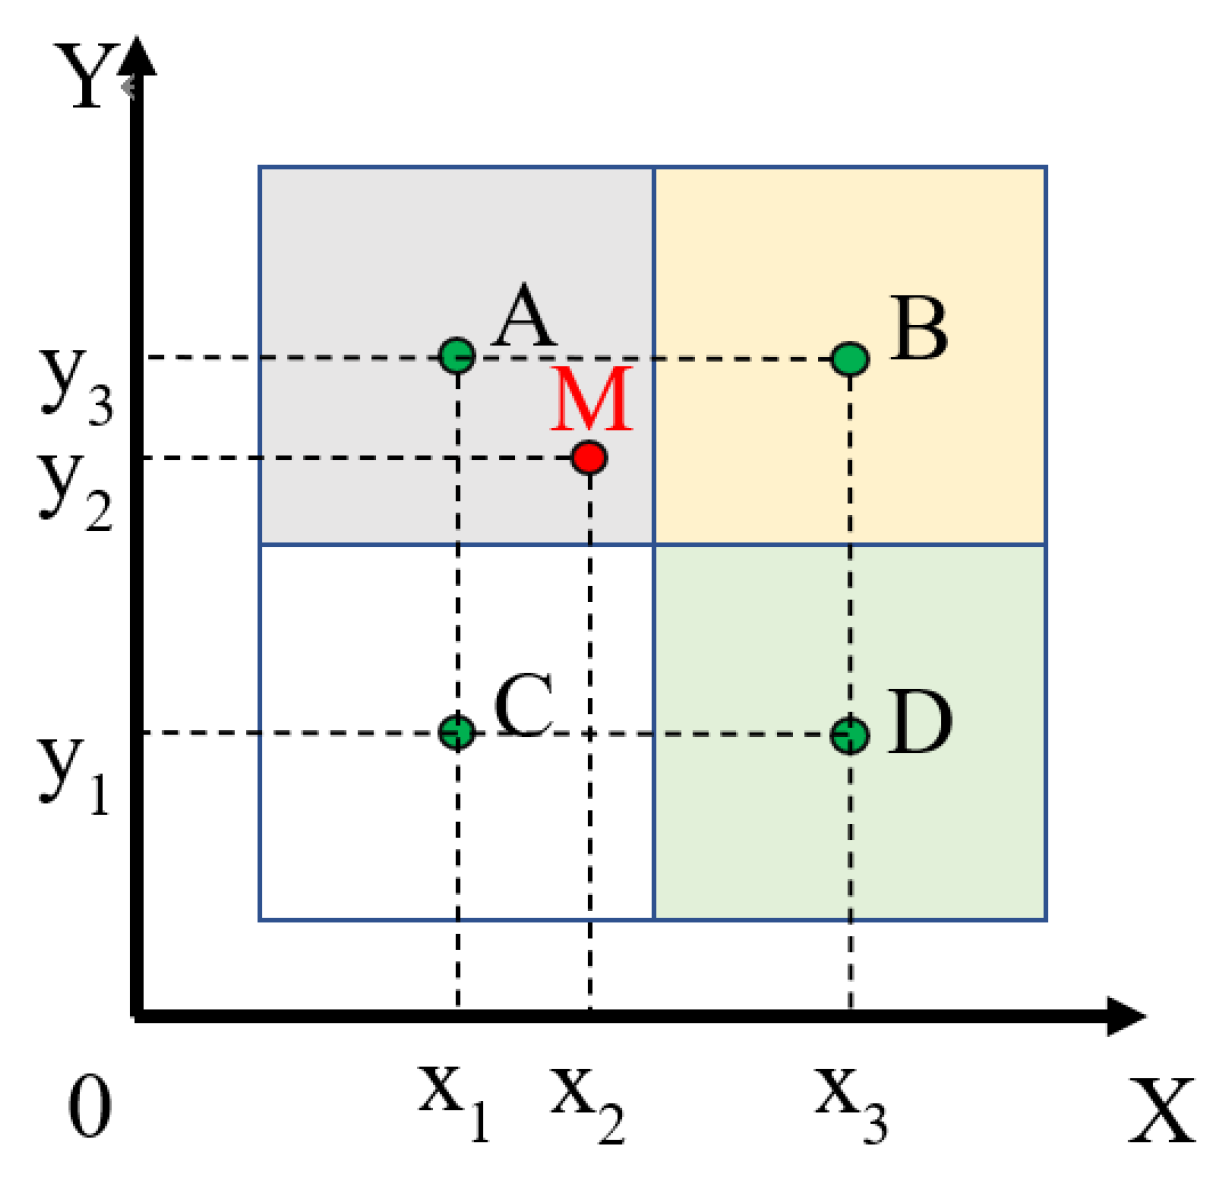
The temporal resolution and observation times of the datasets are different. In order to ensure the reliability of the analysis results, we only compared data observed/computed at the same time or very near in time. For spatial alignment, all the comparisons were made at the locations of the meteorological stations. To convert the area data to station point data, four grid cells adjacent to a station were used to perform the bilinear interpolation. The schematic diagram of the bilinear interpolation is shown in
Figure 2, where point M(
x2,
y2) denotes the meteorological station, and A(
x1,
y3), B(
x3,
y3), C(
x1,
y1), and D(
x3,
y1) are the center points of the four adjacent grid cells. The different colors of the grid represent different values, namely,
,
,
, and
. The station value
can be calculated using the bilinear interpolation:
It should be noted that interpolation always smoothes the data values, whereas the point-measured data are more sharp. We knew this would affect the comparison in the variances of the area and point datasets, but would not affect the comparison in their means, the main aim of this paper. There is another limitation of this interpolation—namely, the elevation of the points was not taken into account. Considering that the spatial resolution of ERA-5 is 0.25° × 0.25°, elevation heterogeneity at a mean distance of 20 km would not have affected the interpolation results much, especially for the meteorological stations that are not on local high mountains or low valleys.
2.3.2. MK Trend Analysis Method
The Mann–Kendall (MK) trend analysis method is a non-parametric test method recommended by the World Meteorological Organization for time series analysis, and is often used for trend analysis of temperature, precipitation, and runoff. Its advantage is that it is not disturbed by outliers and both linear and non-linear conditions are applicable.
2.3.3. Kriging Interpolation
Kriging is a regression algorithm for spatial modeling and prediction (interpolation) of random processes/random fields based on the covariance function. In certain random processes, such as inherently stationary processes, the kriging method can give the best linear unbiased estimation (best linear unbiased prediction, BLUP), so it is also called spatial optimal unbiased estimation in geostatistics (Spatial BLUP) [
23]. See references for details.
3. Results
3.1. Spatial Distribution of PWV and Total Cloud Amount
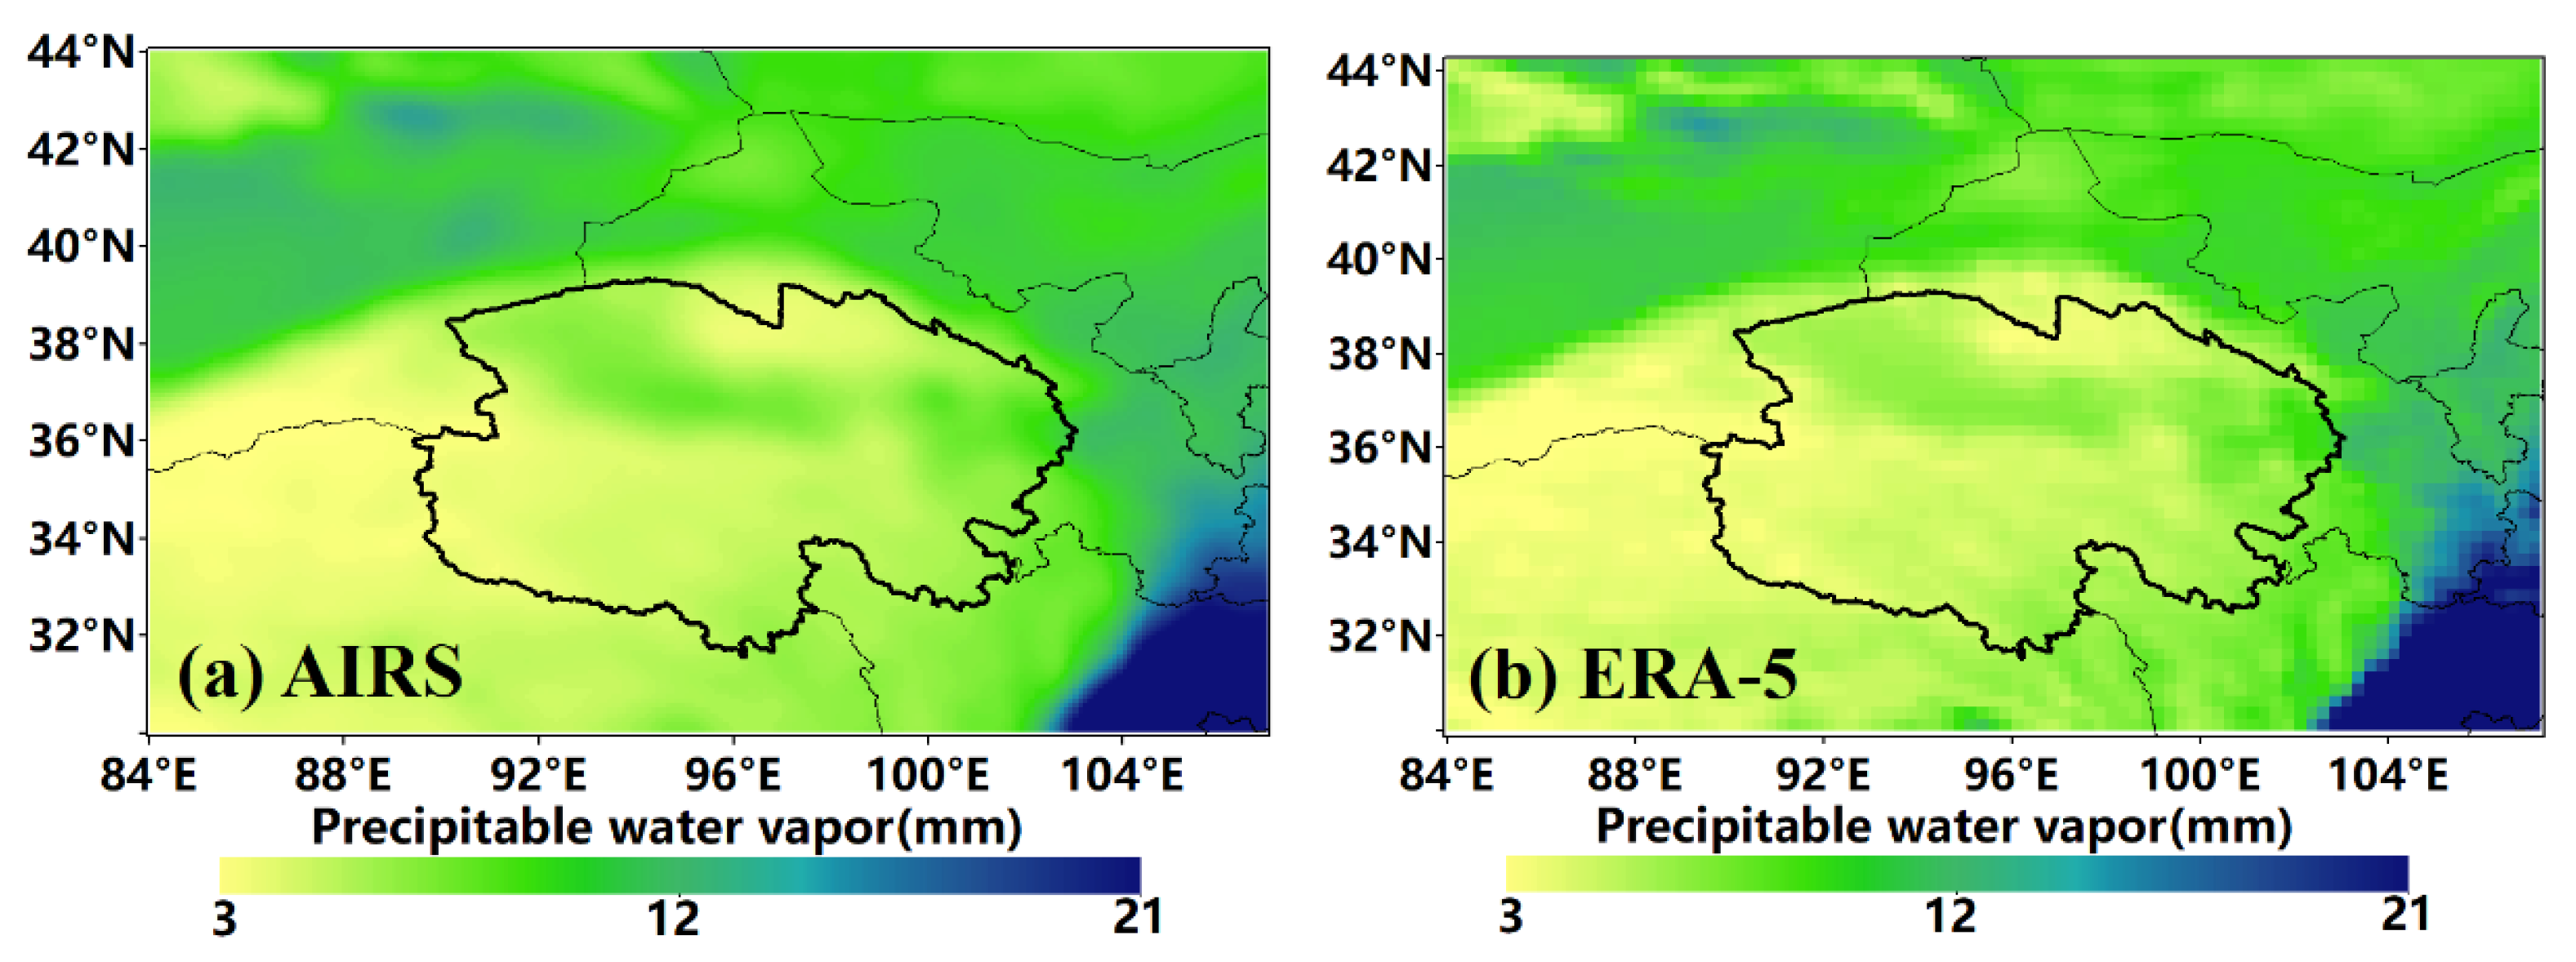
Firstly, the overall spatial patterns of PWV means from 2002 to 2016 of AIRS data and ERA-5 data are shown in
Figure 3. It can be observed that the distribution patterns given by the two data are basically identical. The PWV levels in eastern Sichuan Province and southeastern Gansu Province are significantly higher than those in other regions, followed by Xinjiang Tarim Basin and Ningxia Autonomous Region; and PWV levels over Qinghai-Tibet Plateau and Tianshan Mountains are the lowest. This shows that the surface altitude and the source of PWV supply have a greater correlations with the amount of PWV. Similarly, the Qaidam Basin, Xining City, Haidong City, and other places in Qinghai Province had the highest PWV levels. The PWV level over the Qilian Mountains, Kunlun Mountains, and the high-altitude hinterland of the Qinghai-Tibet Plateau were significantly lower than those of other areas.
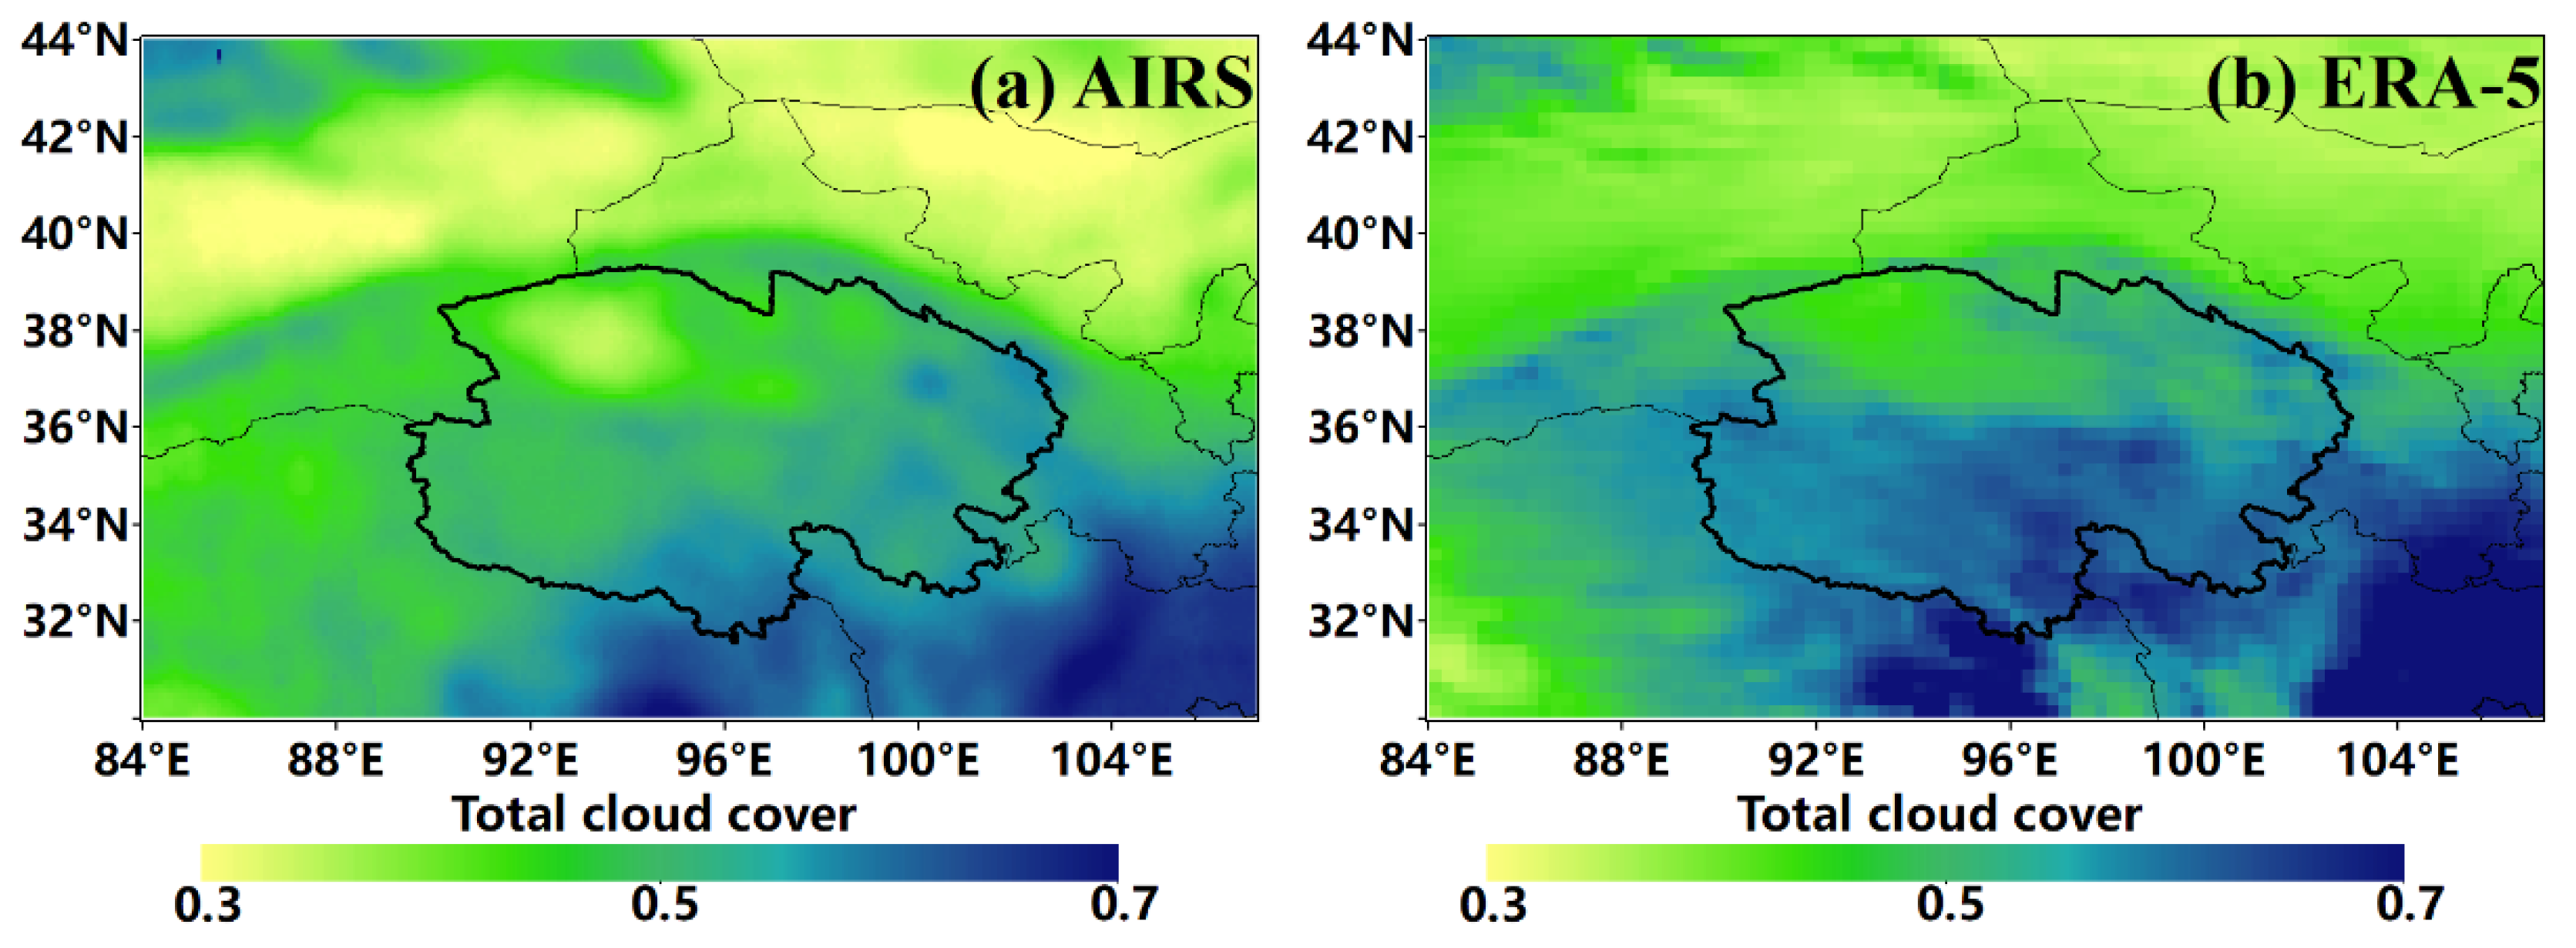
The total cloud cover distribution of AIRS data and ERA-5 data is shown in
Figure A1. Overall, there is a trend of more in the south and less in the north; the multi-year spatial averages are 0.50 and 0.56, respectively. Except for the northwest corner, the cloud cover in the northern part of the study area is significantly less than that in other regions, and that in the southeastern regions, such as Sichuan Province, is significantly higher than that in other regions. The topography has an important influence on cloud formation [
24,
25]. In the case of abundant water vapor transportation, the water vapor encounters the windward side of the slopes and rises with the topography, which is conducive to the generation of clouds. With the changes in the topography of the northern Qinghai-Tibet Plateau, the cloud cover also tends to be higher in the south and lower in the north, and the Qilian Mountains are higher. However, there is a certain difference between the two types of data in the distribution trend of cloud cover in the southwestern part of Qinghai Province, and the accuracy of the data needs to be compared and verified.
3.2. PWV Verification
For the two area datasets, the AIRS PWV was 0.7 mm higher than the ERA-5 PWV in multi-year mean value, without statistical significance (p = 0.0623).
Since the meteorological stations can only collect data twice a day, ERA-5 data at the same time points were selected for comparative analysis. Bilinear interpolation was used to calculate the values of the AIRS data and ERA-5 data at the station locations in terms of spatial location matching. Through the data verification of four meteorological stations, the accuracies of the datasets under different climatic characteristics and geographical conditions in the northern Qinghai-Tibet Plateau can be better reflected. It should be noted that the influence in the sounding ball moving with the wind direction was ignored in this study, which will have slightly increased the error when comparing the radiosonde data with other estimates.
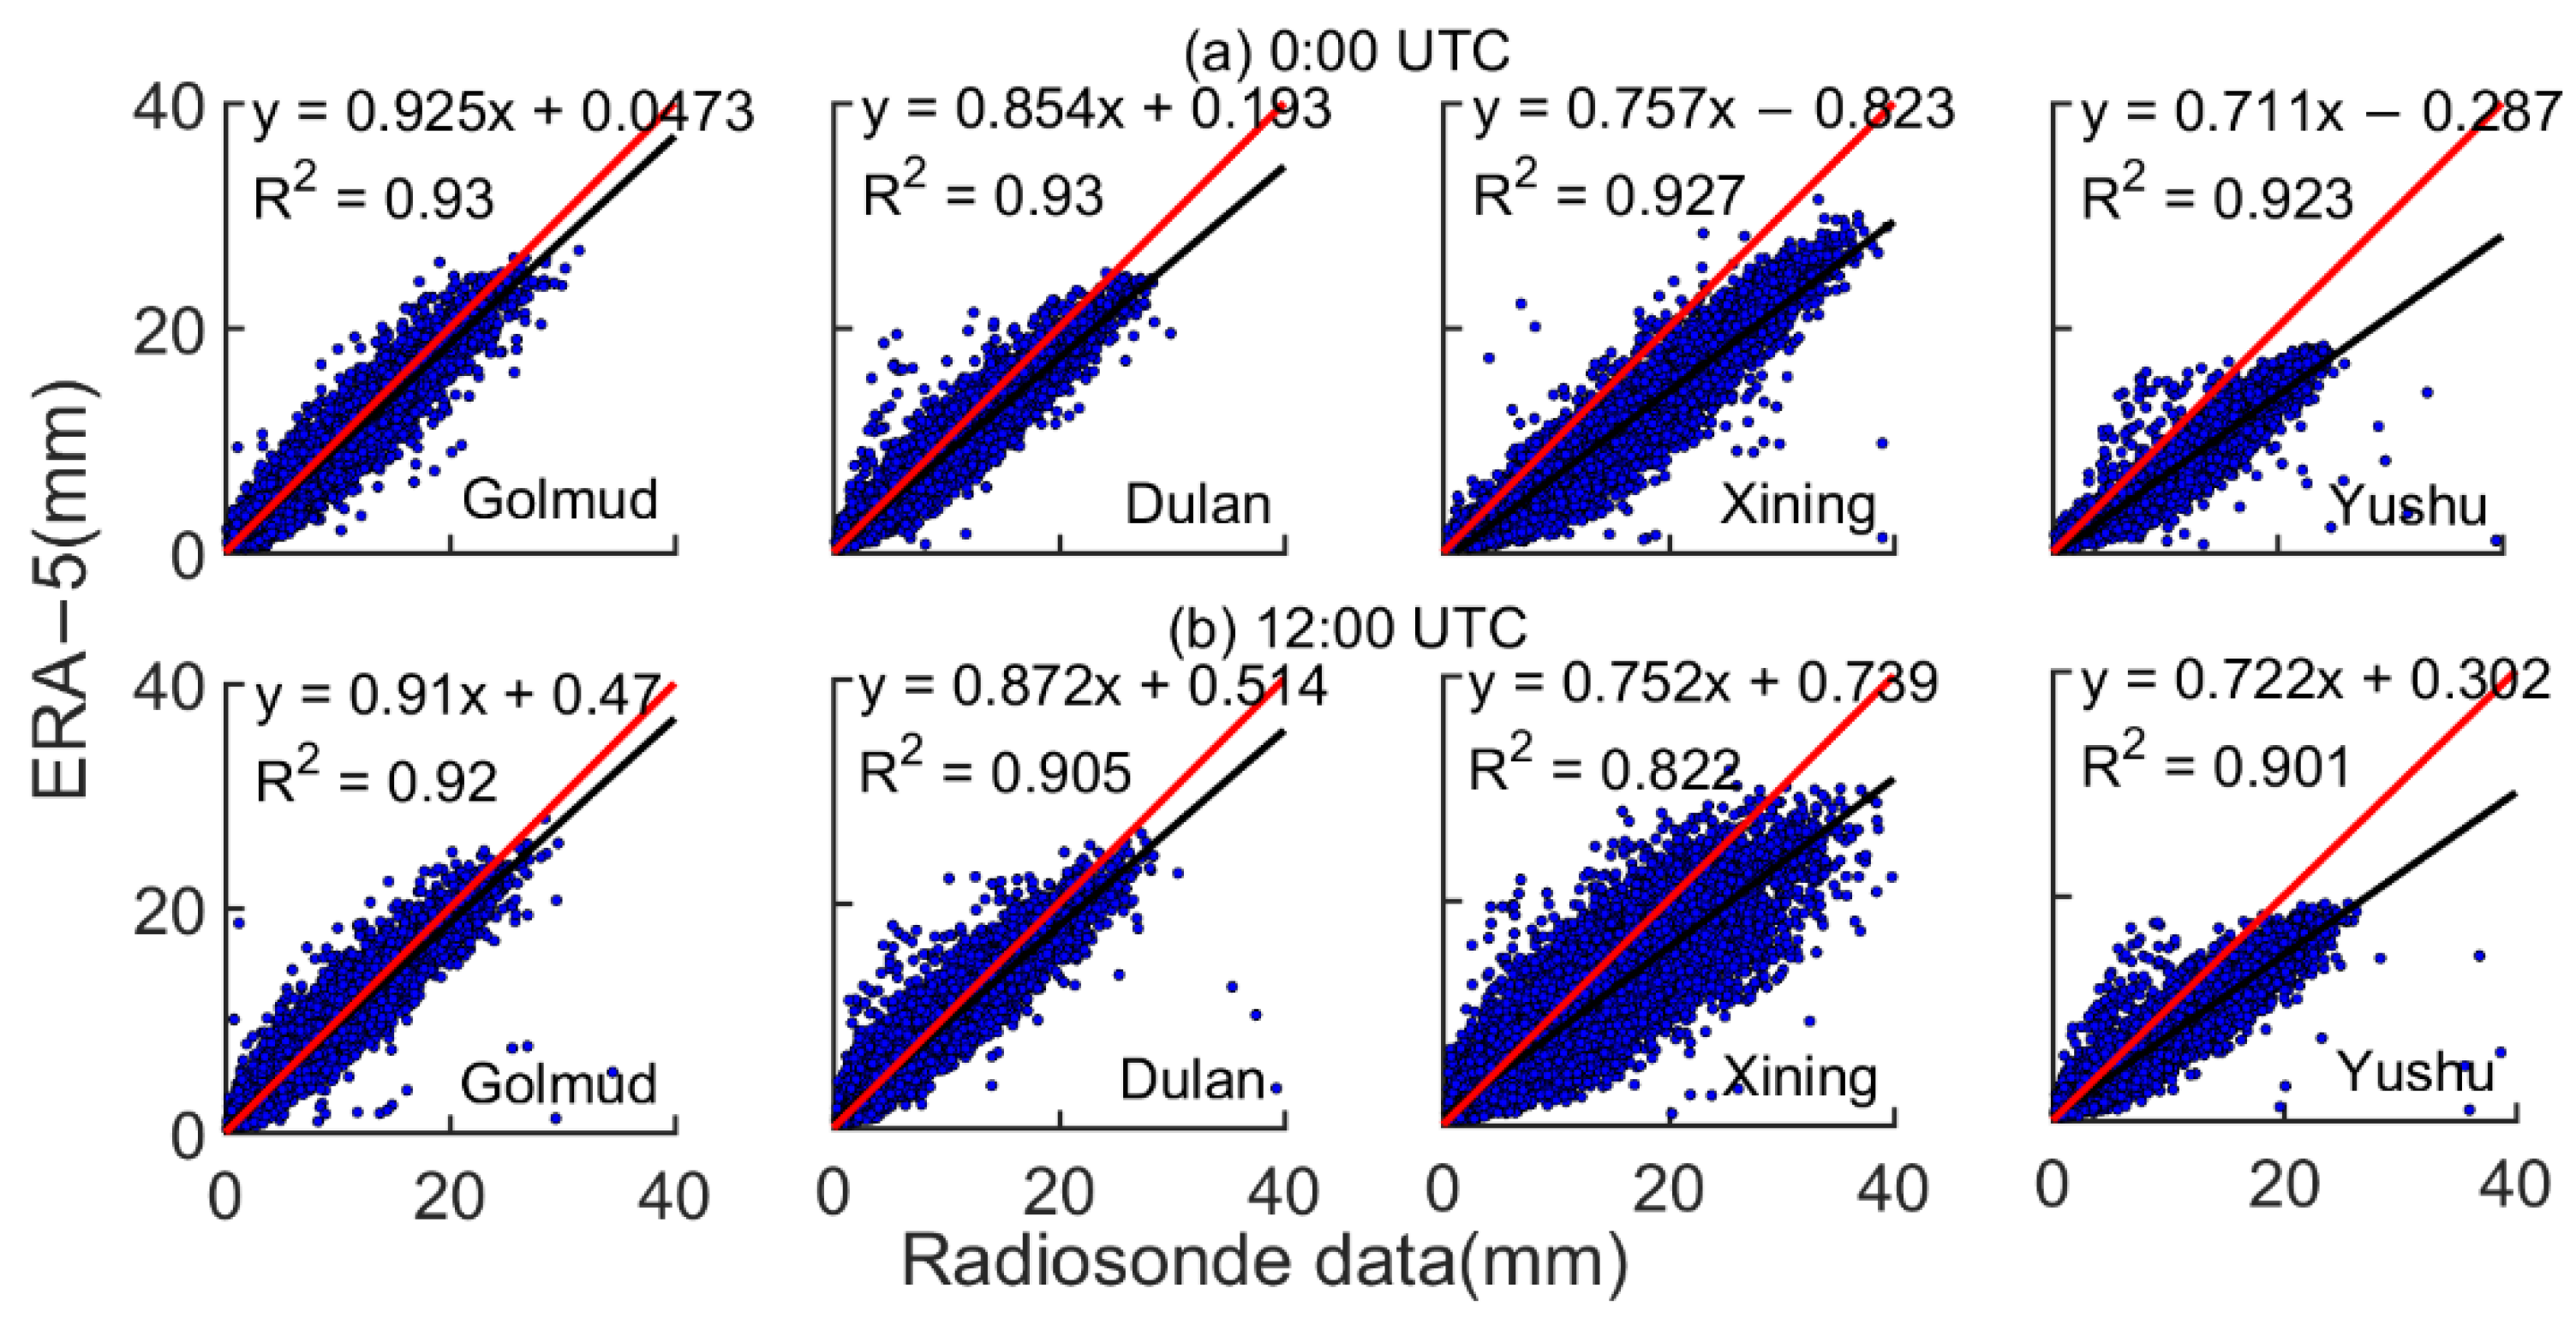
Figure 4 depicts that the distribution of PWV scatter points between radiosonde data and ERA-5 data at four stations from 1979 to 2017. Among the four stations, the Xining station had the highest PWV level under the influence of low altitude and the southeast monsoon; the Yushu station had the lowest PWV level due to the highest altitude; PWV levels of Golmud and Dulan stations were in the middle, and their values were consistent. According to the linear fitting of the scattered point distribution, it can be seen that the PWV level of ERA-5 data was lower than that of radiosonde data. The two levels were closest at Golmud station, and most disparate at Yushu station. R
2 is greater than 0.9, except for Xining 12:00 data from the perspective of the correlation level, which indicates that the fitting effect is good. Comparing different times, it can be seen that PWV data of ERA-5 at each station at 0:00 is closer to the radiosonde data than at 12:00.
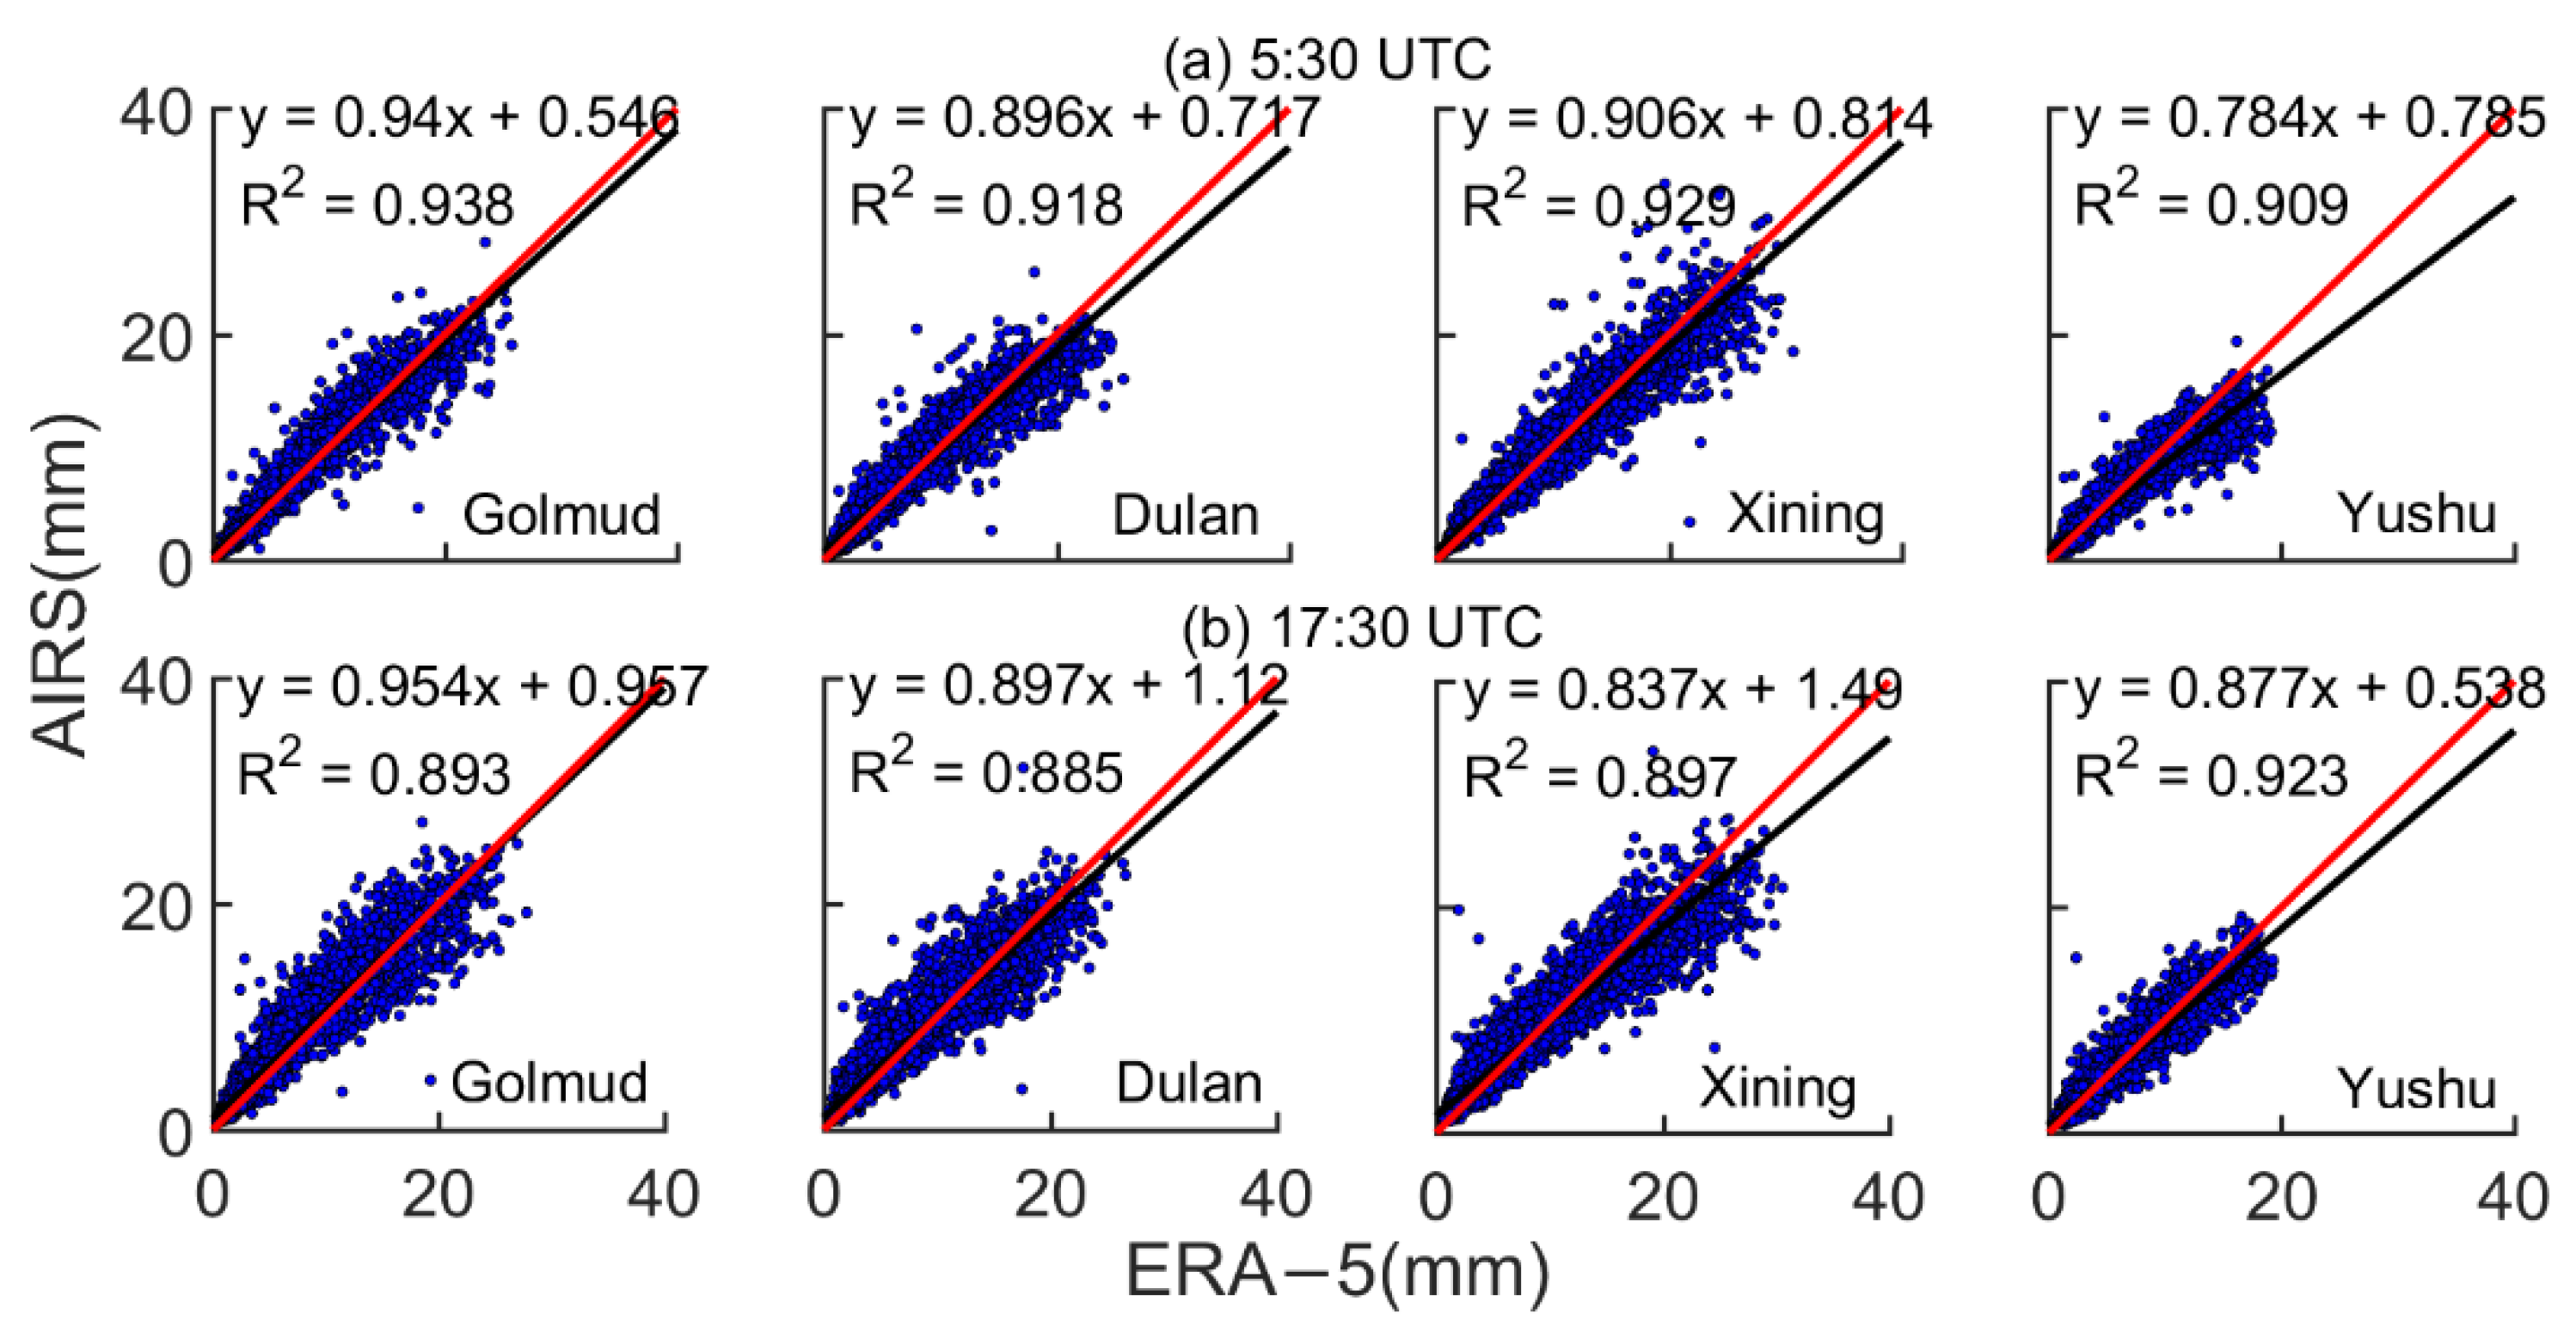
Since the transit time of the Aqua satellite is far from the radiosonde time, it is impossible to directly compare AIRS data with radiosonde data. The accuracy and deviation of the data can be indirectly analyzed by comparing them with ERA-5 data. The transit times of the Aqua satellite are about 5:30 and 17:30; in the comparative analysis, the mean values of the 5:00 and 6:00 data in ERA-5 data were defined as the 5:30 data, and the mean values of the 17:00 and 18:00 data were defined as the 17:30 data.
Figure 5 depicts that the scatter plot of PWV of each station at 5:30 and 17:30 for AIRS and ERA-5 data from September 2002 to September 2016. The comparison shows that the PWV level of ERA-5 data is higher than that of AIRS; and the gap between the two is largest at Yushu Station and is the smallest at Golmud Station. R
2 is greater than 0.88, and the correlation is still good.
In summary, the relationship between the PWV levels of different datasets at the four stations is: radiosonde data > ERA-5 data > AIRS data. The applicability of using the ERA-5 data to analyze PWV is high in the northern Qinghai-Tibet Plateau in the public raster dataset, but there is still a certain difference from the radiosonde data, which has significantly lower values in high altitude areas.
3.3. Total Cloud Cover Verification
In this paper, the total cloud cover, relative humidity, and temperature are partially analyzed in detail to explore the sources of differences between ERA-5, AIRS, and radiosonde data. The comparative analysis of PWV under different cloud cover types was to get the specific difference in PWV from each dataset under different cloudy and sunny conditions. The specific difference in PWV from each dataset under cloudy and sunny conditions can be obtained through the comparative analysis of PWV under different cloud cover levels.
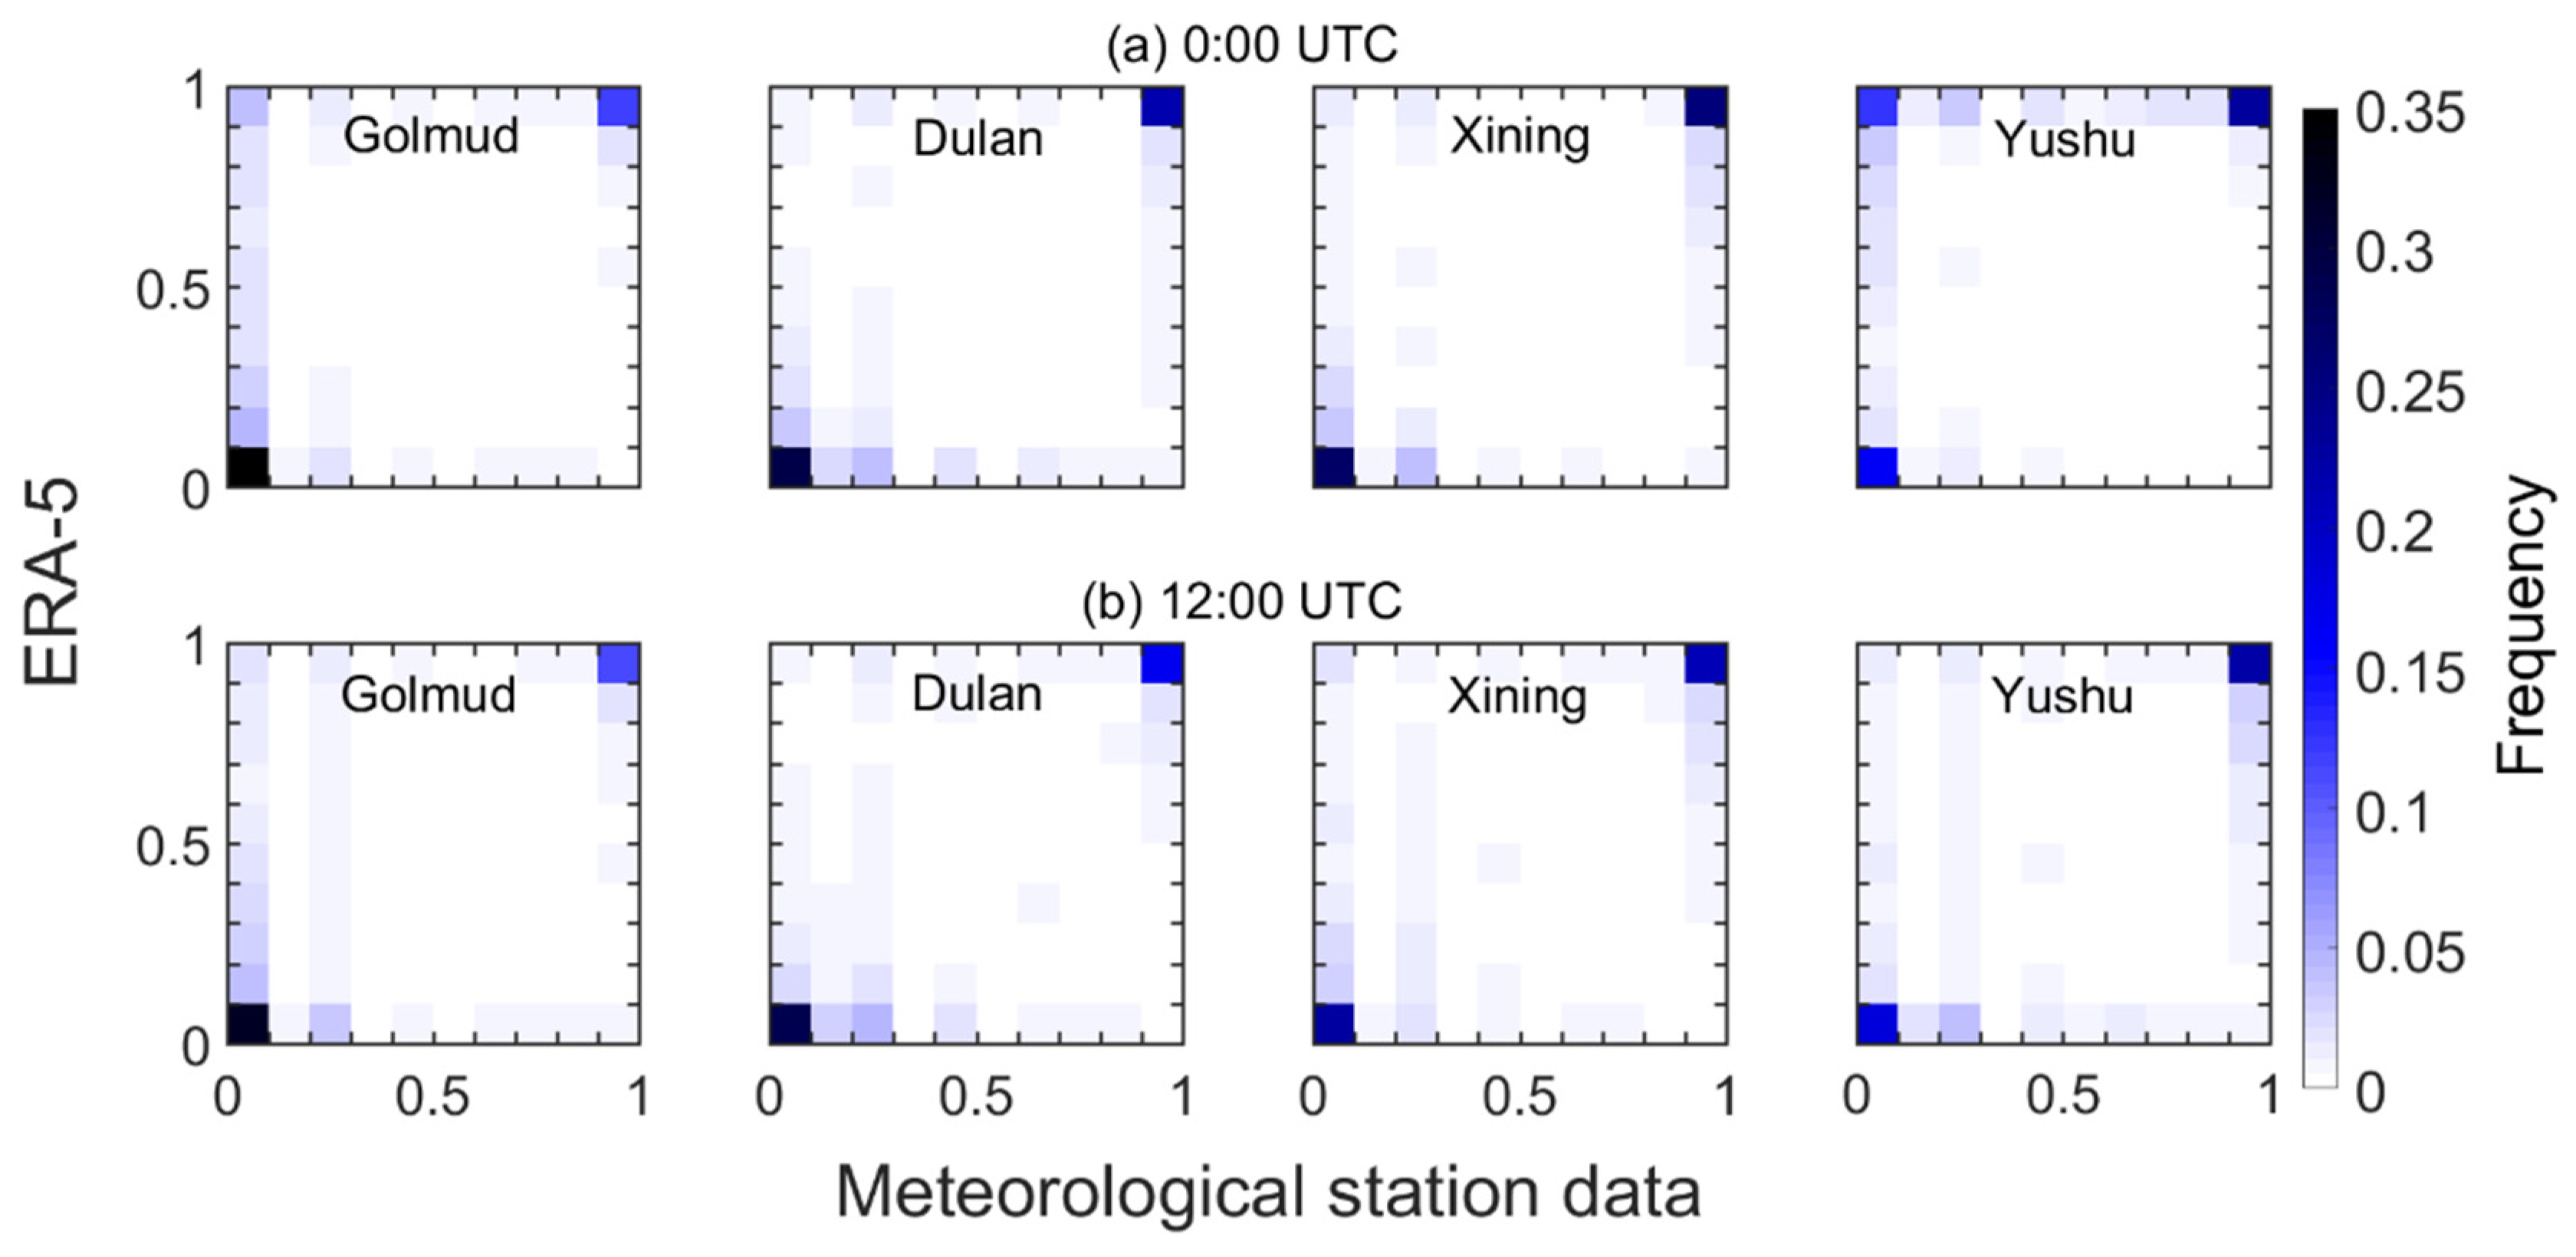
Figure 6 depicts the coincidence frequency of the total cloud cover at each station at 0:00 and 12:00 between the radiosonde data and ERA-5 data from 2002 to 2016. It can be seen from the figure that the four stations have the highest frequencies and good consistency under the condition of full clouds and cloudlessness; the frequency is lower and the correlation is relatively scattered under the condition of middle cloud cover. The results show that ERA-5 data and radiosonde data have good consistency in total cloud cover, and good correspondence can be obtained when analyzing PWV with a clear sky and in cloudy conditions, respectively.
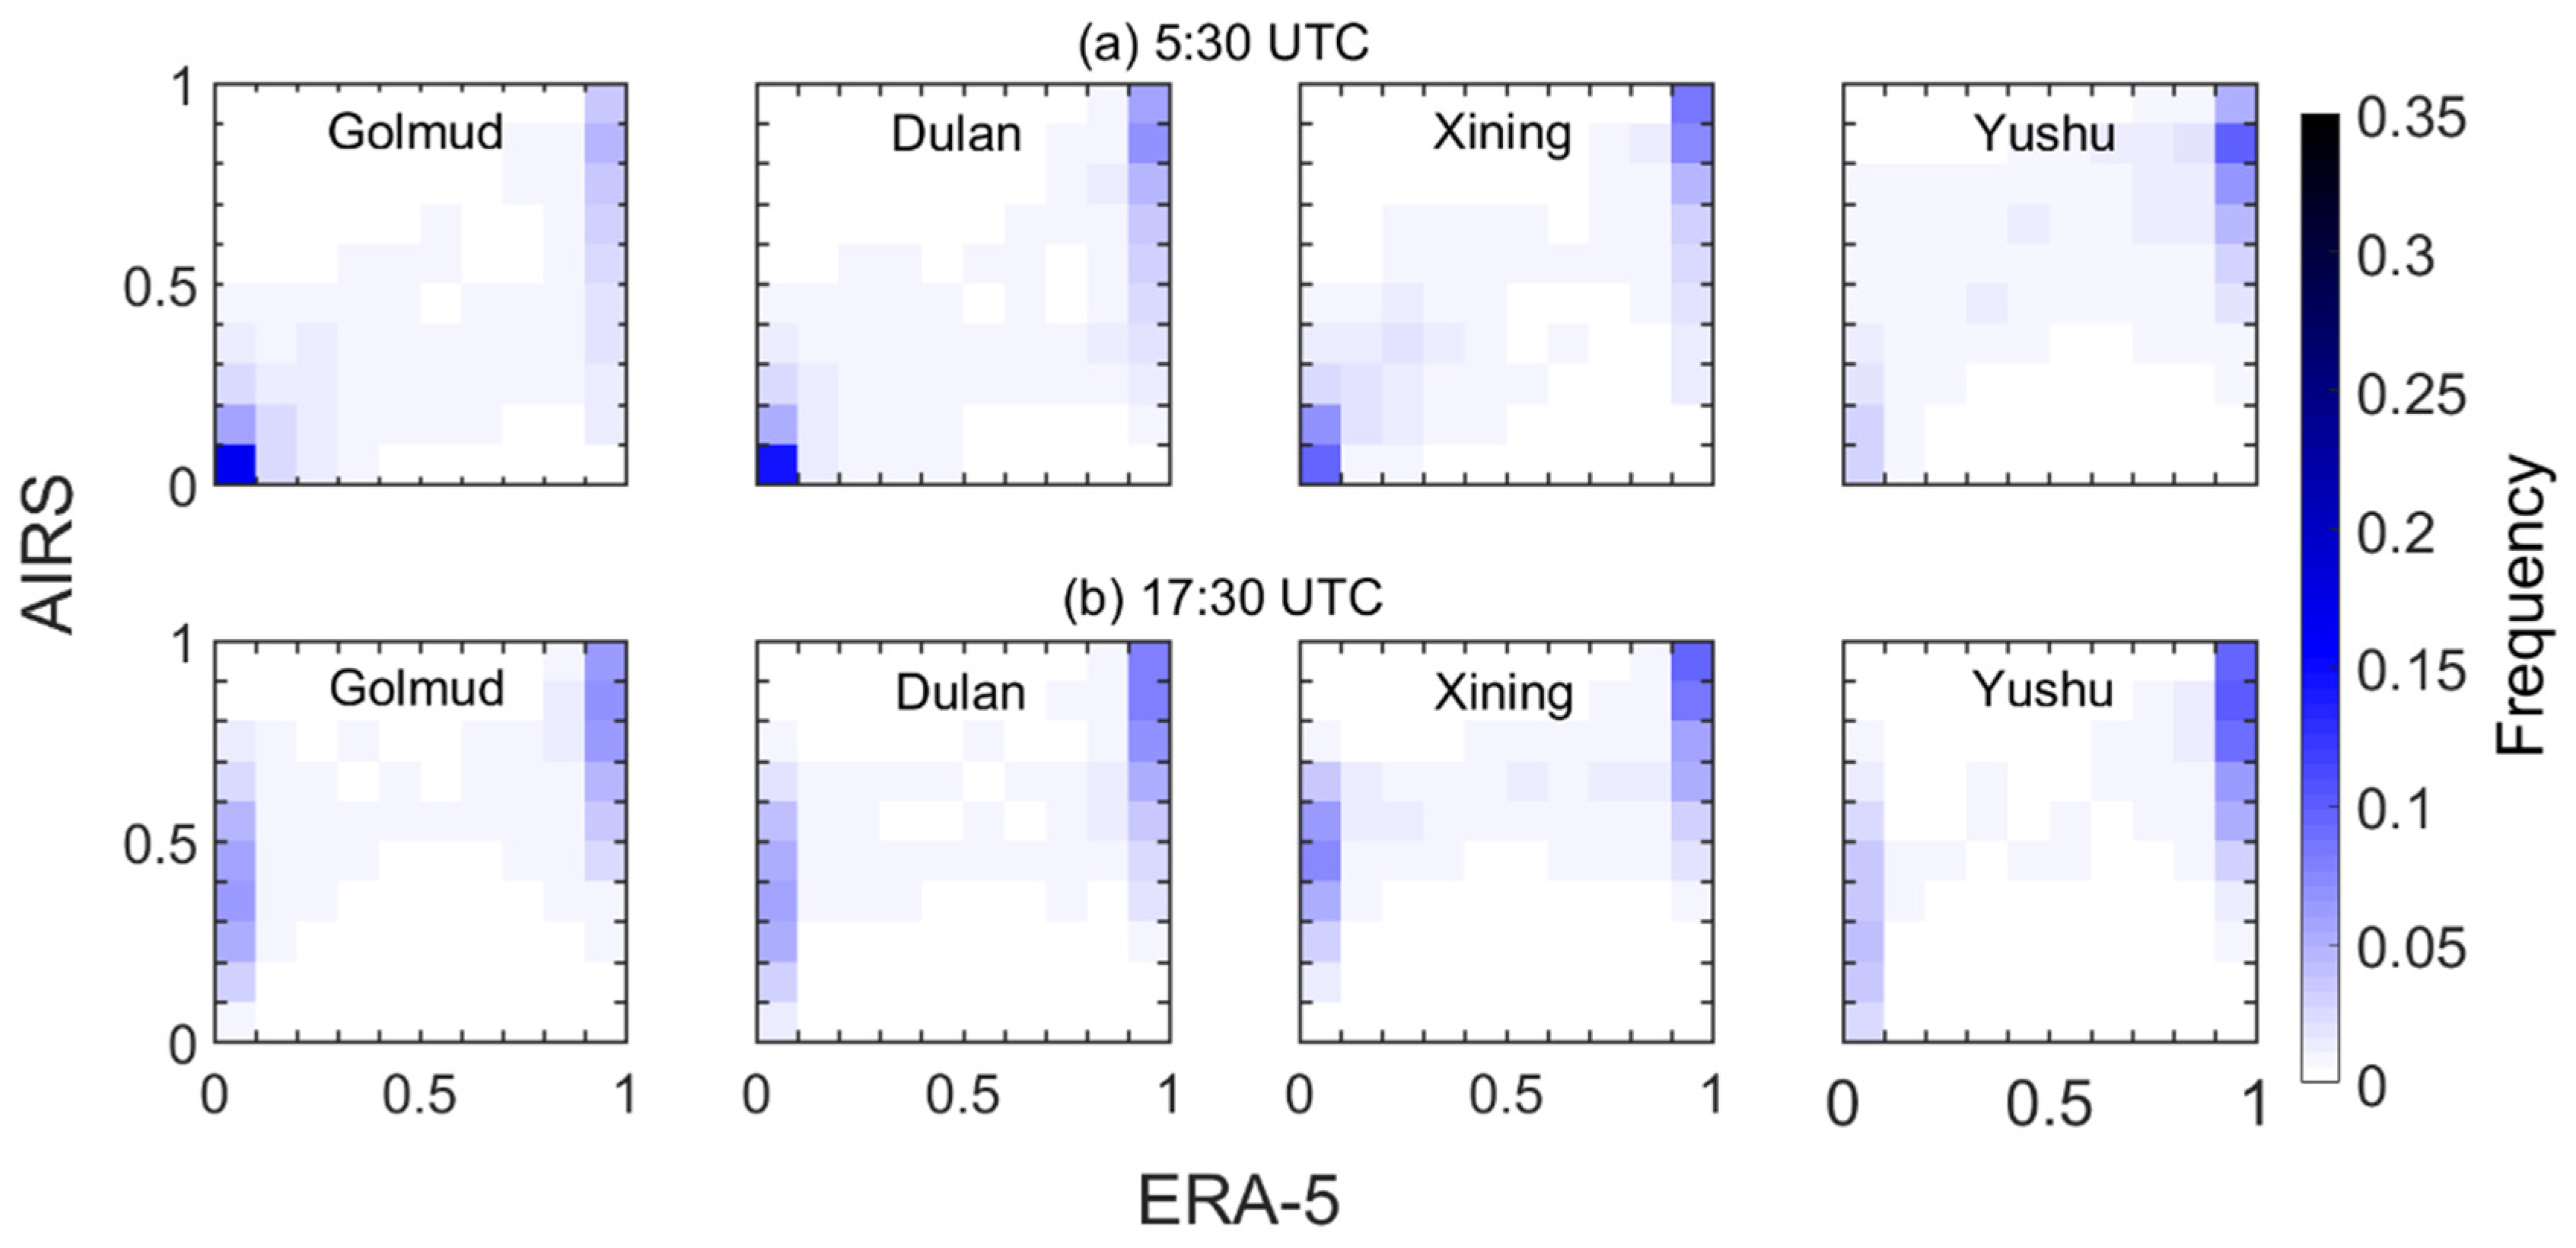
Figure 7 depicts the coincidence frequency of the total cloud cover of each station at 5:30 and 17:30 between AIRS and ERA-5 data during the study period. It can be seen from the figure that the coincidence degrees of the total cloud cover of the two kinds of data at different stations and times are low, which made it difficult to meet the accuracy required for comparing and analyzing the two kinds of PWV under different cloud cover.
Figure 6 and
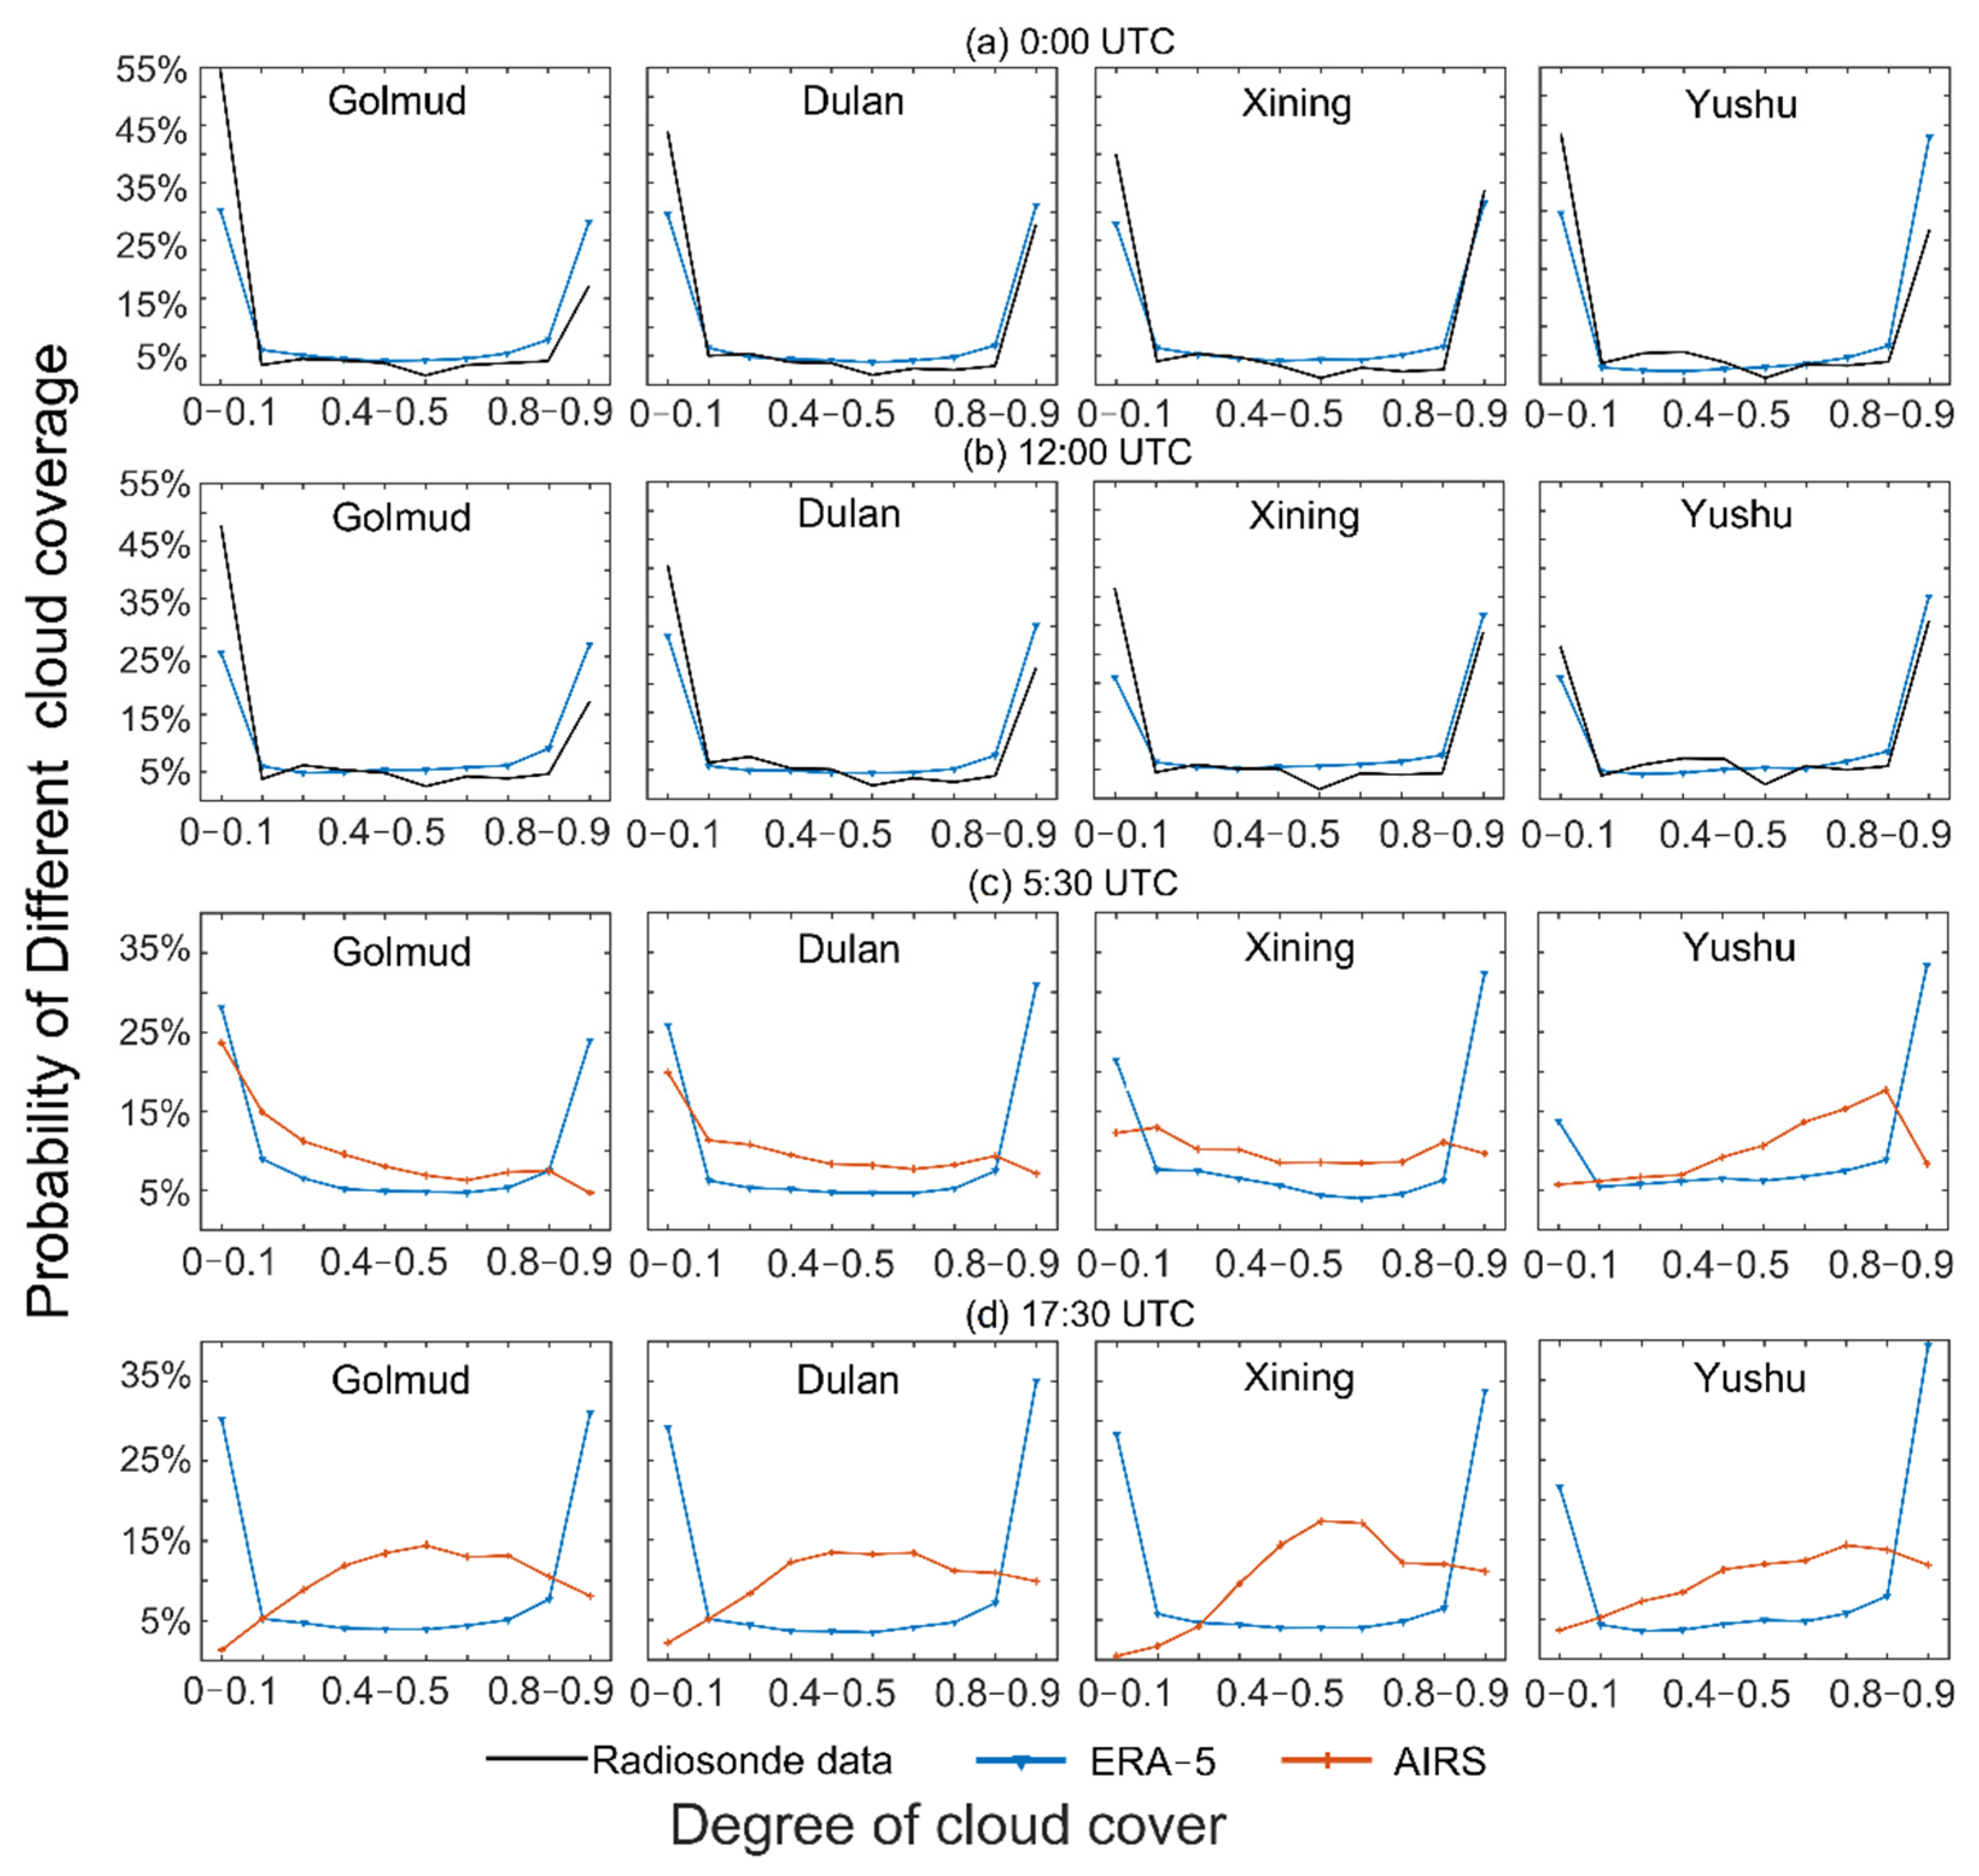
Figure 7 reflect the coincidence of the same cloud cover at the same time in different datasets, and the probability of different cloud cover in the study period can reflect the probability of cloudy and sunny in the region.
Figure 8 shows the probability curves of different cloud amounts at different time points in different datasets. Comparing (a) and (b), it was found that the probabilities of the total cloud cover in ERA-5 and radiosonde data being 0–0.1 and 0.9–1 at different times were the highest, and the occurrence probability of other cloud cover was more consistent, and the change trend of the two is relatively consistent. It shows that the total cloud cover increase in ERA-5 better reflects the real situation.
Comparing (a) and (b), it was found that the probabilities of the total cloud cover of ERA-5 being 0–0.1 and 0.9–1 at different times were the highest; however, there is a significant difference in the probability of AIRS cloud cover appearing day and night in different stations. At 17.30 (UTC), with the increase of cloud cover, the trend of the cloud cover probability of AIRS is opposite to that of ERA-5, which indirectly indicates that the cloud cover estimated by AIRS has a larger error at night.
3.4. Verification of PWV under Different Total Cloud Cover
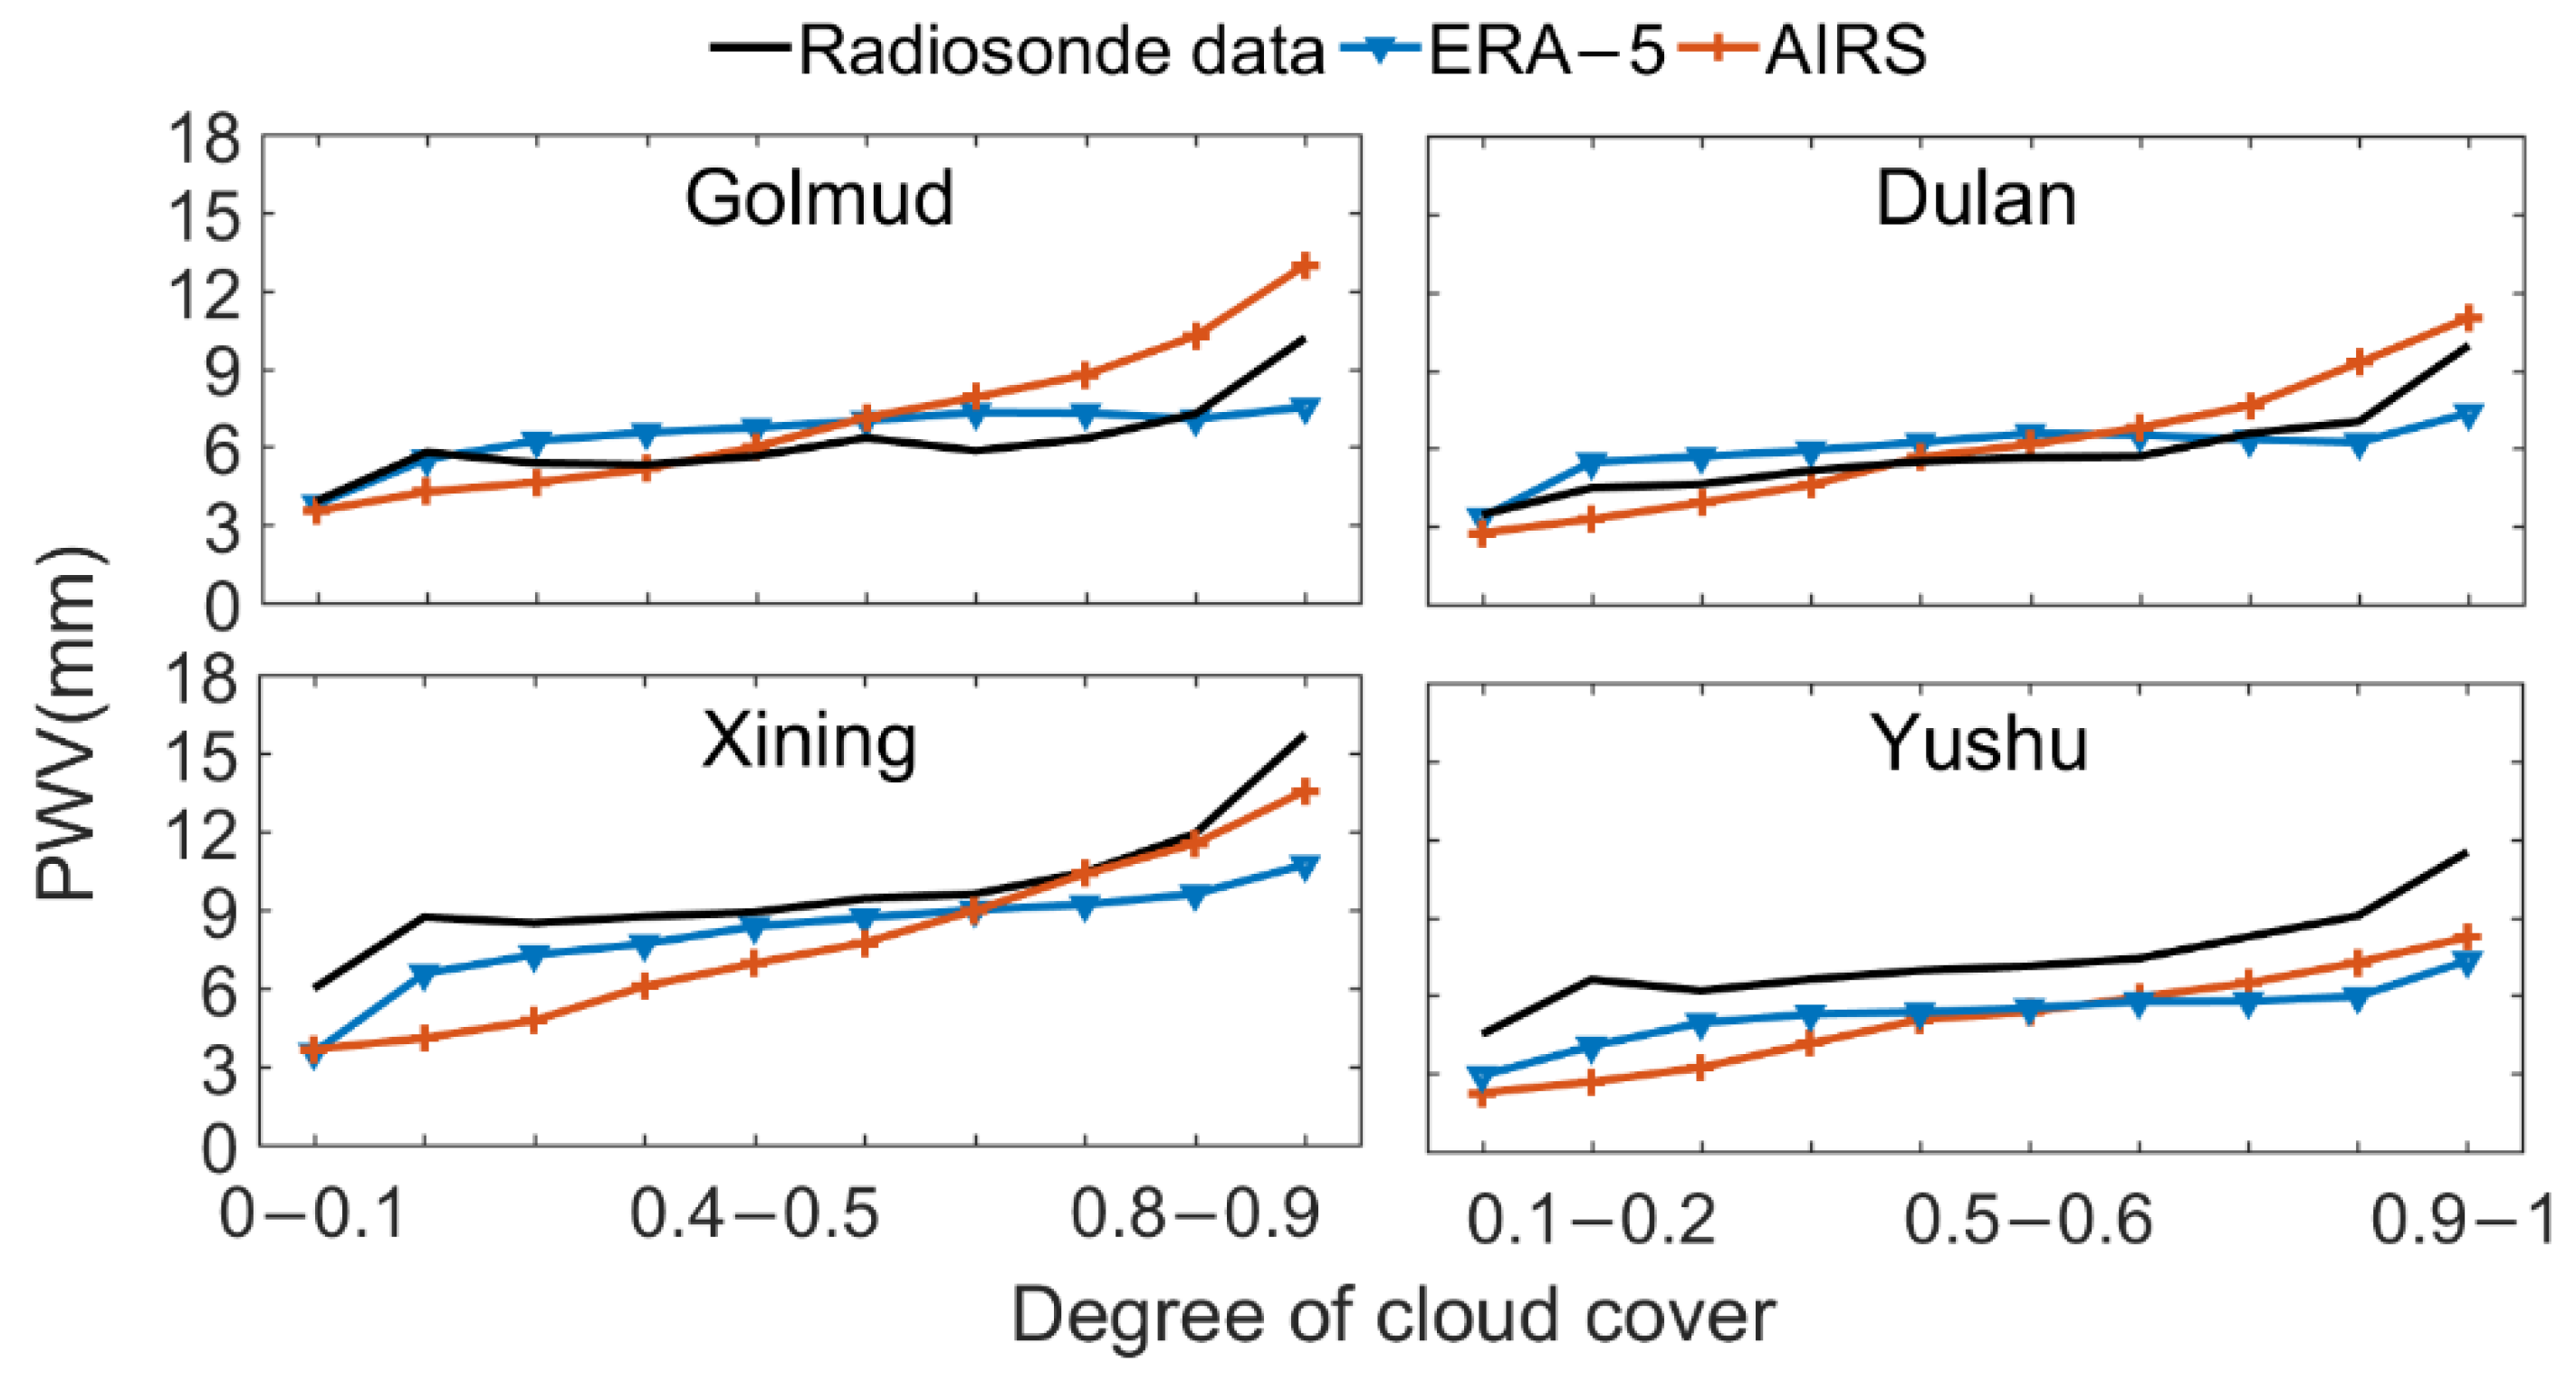
The comparison of PWV of radiosonde data, ERA-5 data and AIRS data under different cloud cover is shown in
Figure 9. It can be seen from the figure that PWV increases with the increase of the total cloud amount. In Yushu and Xining stations, PWV of ERA-5 data and AIRS data has been lower than that of radiosonde data; in Dulan station, PWV of ERA-5 data is higher than the radiosonde data when the total cloud cover is in the range of 0.2 to 0.7 and is significantly lower than the radiosonde data when the cloud is full; in Golmud station, PWV of ERA-5 data is higher than that of the radiosonde data when the total cloud cover is in the range of 0.3 to 0.8, and lower than that of radiosonde data when the cloud is full. The PWV in ERA-5 data and AIRS data has a certain regularity under different total cloud cover. At 4 stations, PWV of ERA-5 data is significantly higher than that of AIRS data When cloud cover is less than 0.6; PWV of ERA-5 data is lower than that of AIRS data when cloud cover is greater than 0.7.
Compared with ERA-5 data, AIRS data have greater differences compared with the radiosonde data in terms of PWV, total cloud cover, and PWV under different total cloud cover levels. Therefore, only ERA-5 data and radiosonde data were compared and analyzed in the subsequent analysis. It should be noted that one advantage of AIRS data over ERA-5 data is that the former can better reflect the increasing trend of PWV with increasing cloud cover.
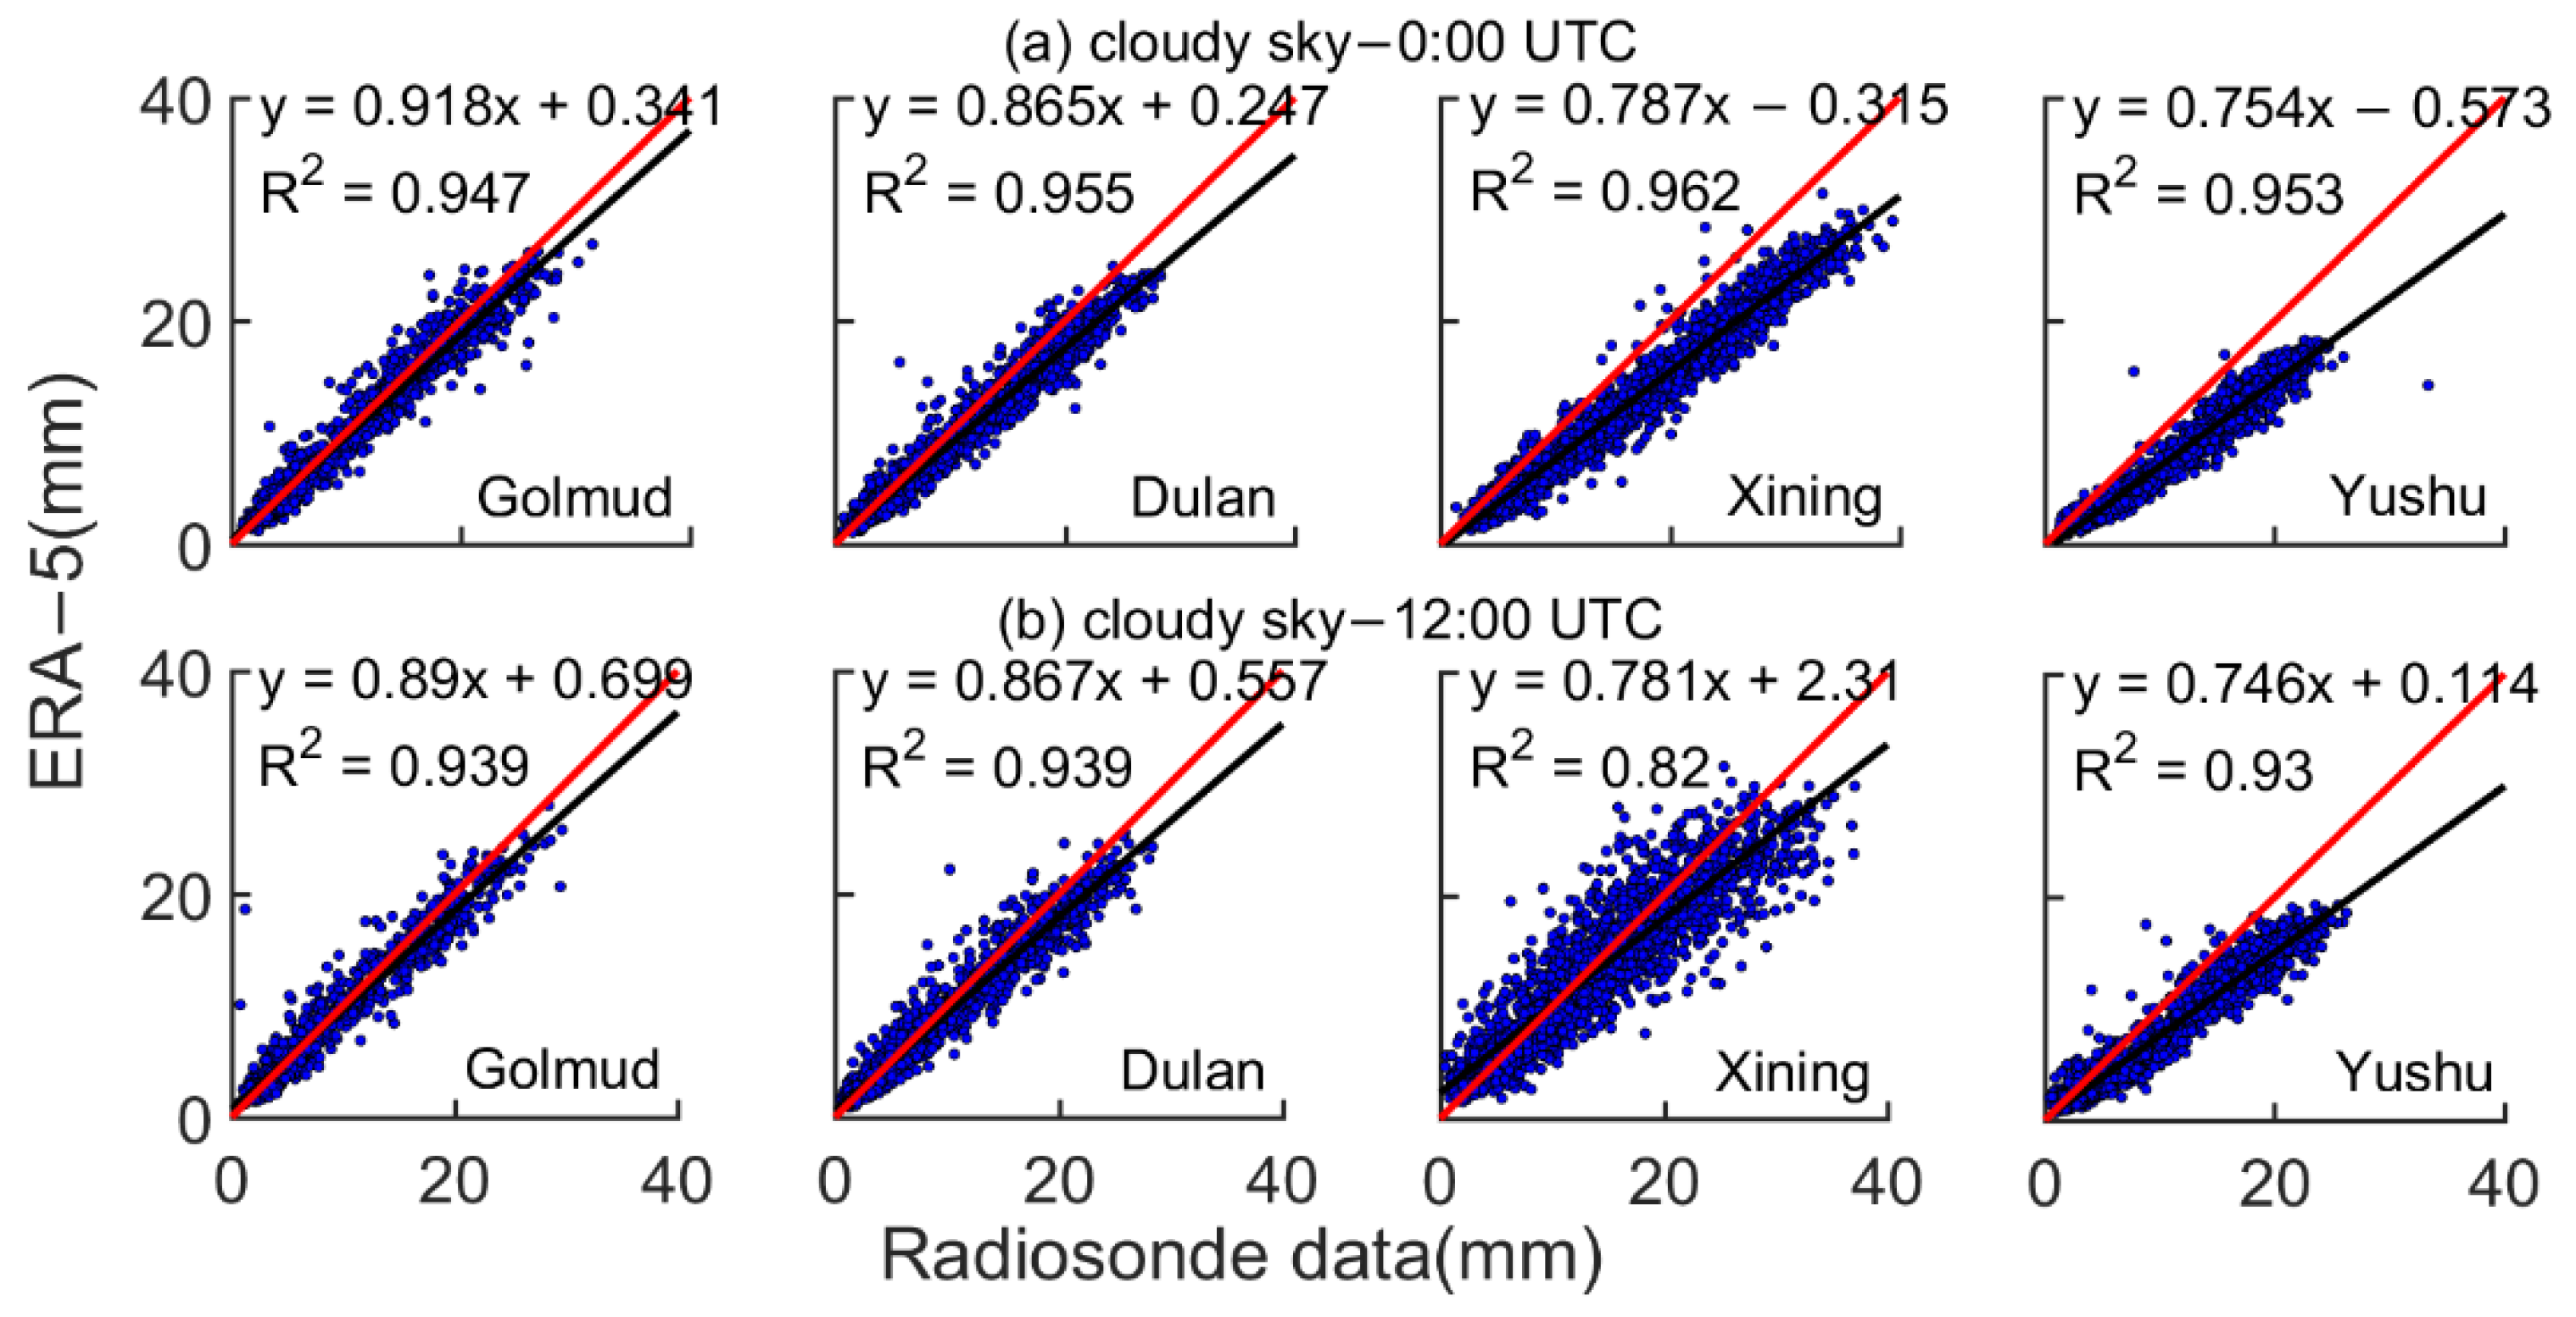
3.5. Verification of PWV under Clear and Cloudy Skies
According to the cloud cover coincidence frequency, the clear sky condition was defined as when the total cloud cover was less than or equal to 0.2, and the cloudy sky condition was when the total cloud cover was greater than or equal to 0.8. To ensure that the radiosonde data and ERA-5 data reflected the same days regarding clear sky or cloudy sky, the sky condition of each time step was determined using the total cloud cover from meteorological station data.
The scatter points in
Figure A2 show the relationship between the ERA-5 PWV and radiosonde PWV with clear skies, at 0:00 and 12:00 UTC, respectively. It can be seen from the figure that the ERA-5 PWV data under clear skies at all the stations still have lower values than the radiosonde data. Compared with
Figure 4, where cloud cover is not taken into consideration, the relative difference (slope deviation from 1.0) between ERA-5 PWV and radiosonde PWV is greater under the clear sky condition, for all stations and times. For Xining and Yushu stations especially, the ERA-5 PWV levels are much lower than the actual values, with slope from 0.58 to 0.61.
Figure A3 shows the relationship between the ERA-5 PWV and radiosonde PWV under cloudy sky condition. The values of ERA-5 data are still lower than the radiosonde data at all the stations. However, as the PWV values are higher in cloudy skies, the difference between the two datasets in the cloudy condition is very close to the overall difference shown in
Figure 4, and the change in the difference is not unidirectional, as with the clear sky condition.
3.6. Multi-Year PWV Analysis with Clear and Cloudy Skies
The 12-month moving average values of monthly PWV of different datasets were calculated to eliminate seasonal variations and accidental factors, and then the multi-year variation trends of PWV could be obtained.
Figure 10 shows the changing trends of ERA-5 PWV and radiosonde PWV under the clear sky condition. For radiosonde data, the multi-year means of PWV at different stations are ordered as: Xining > Yushu > Golmud > Dulan, with 9.25, 5.99, 4.70, and 4.23 mm, respectively. The PWV values show insignificant decreasing trends at all the stations. For the ERA-5 data, the multi-year means of PWV are ordered as: Xining > Golmud > Dulan > Yushu, with values of 5.52, 4.36, 3.9, and 3.67 mm, respectively. It can be seen that the ERA-5 data underestimated PWV values at Xining (5.52 mm vs. 9.25 mm) and Yushu (3.67 mm vs. 5.99 mm) in clear skies, and the deviation was larger in the early stage before the 2000s. For these two stations, the PWV annual variations were also underestimated, which can be seen in
Figure 10c,d. The ERA-5 PWV values show an insignificant decreasing trend in three stations with slopes lower than that of radiosonde data, except for the Golmud station, which has an insignificant increasing trend. This trend and slope difference is mainly caused by ERA-5′s underestimation in the early stage.
On the whole, radiosonde data show that PWV in clear skies was generally stable before 2005, then decreased till 2012, and was climbing in recent years, for three stations except for Yushu with the highest elevation. However, this variation is neither statistically significant, nor a climatic trend, because of the short data length. The ERA-5 data performed better in recent years, basically caught the uptrend for Golmud and Dulan, but missed this trend in Xining.
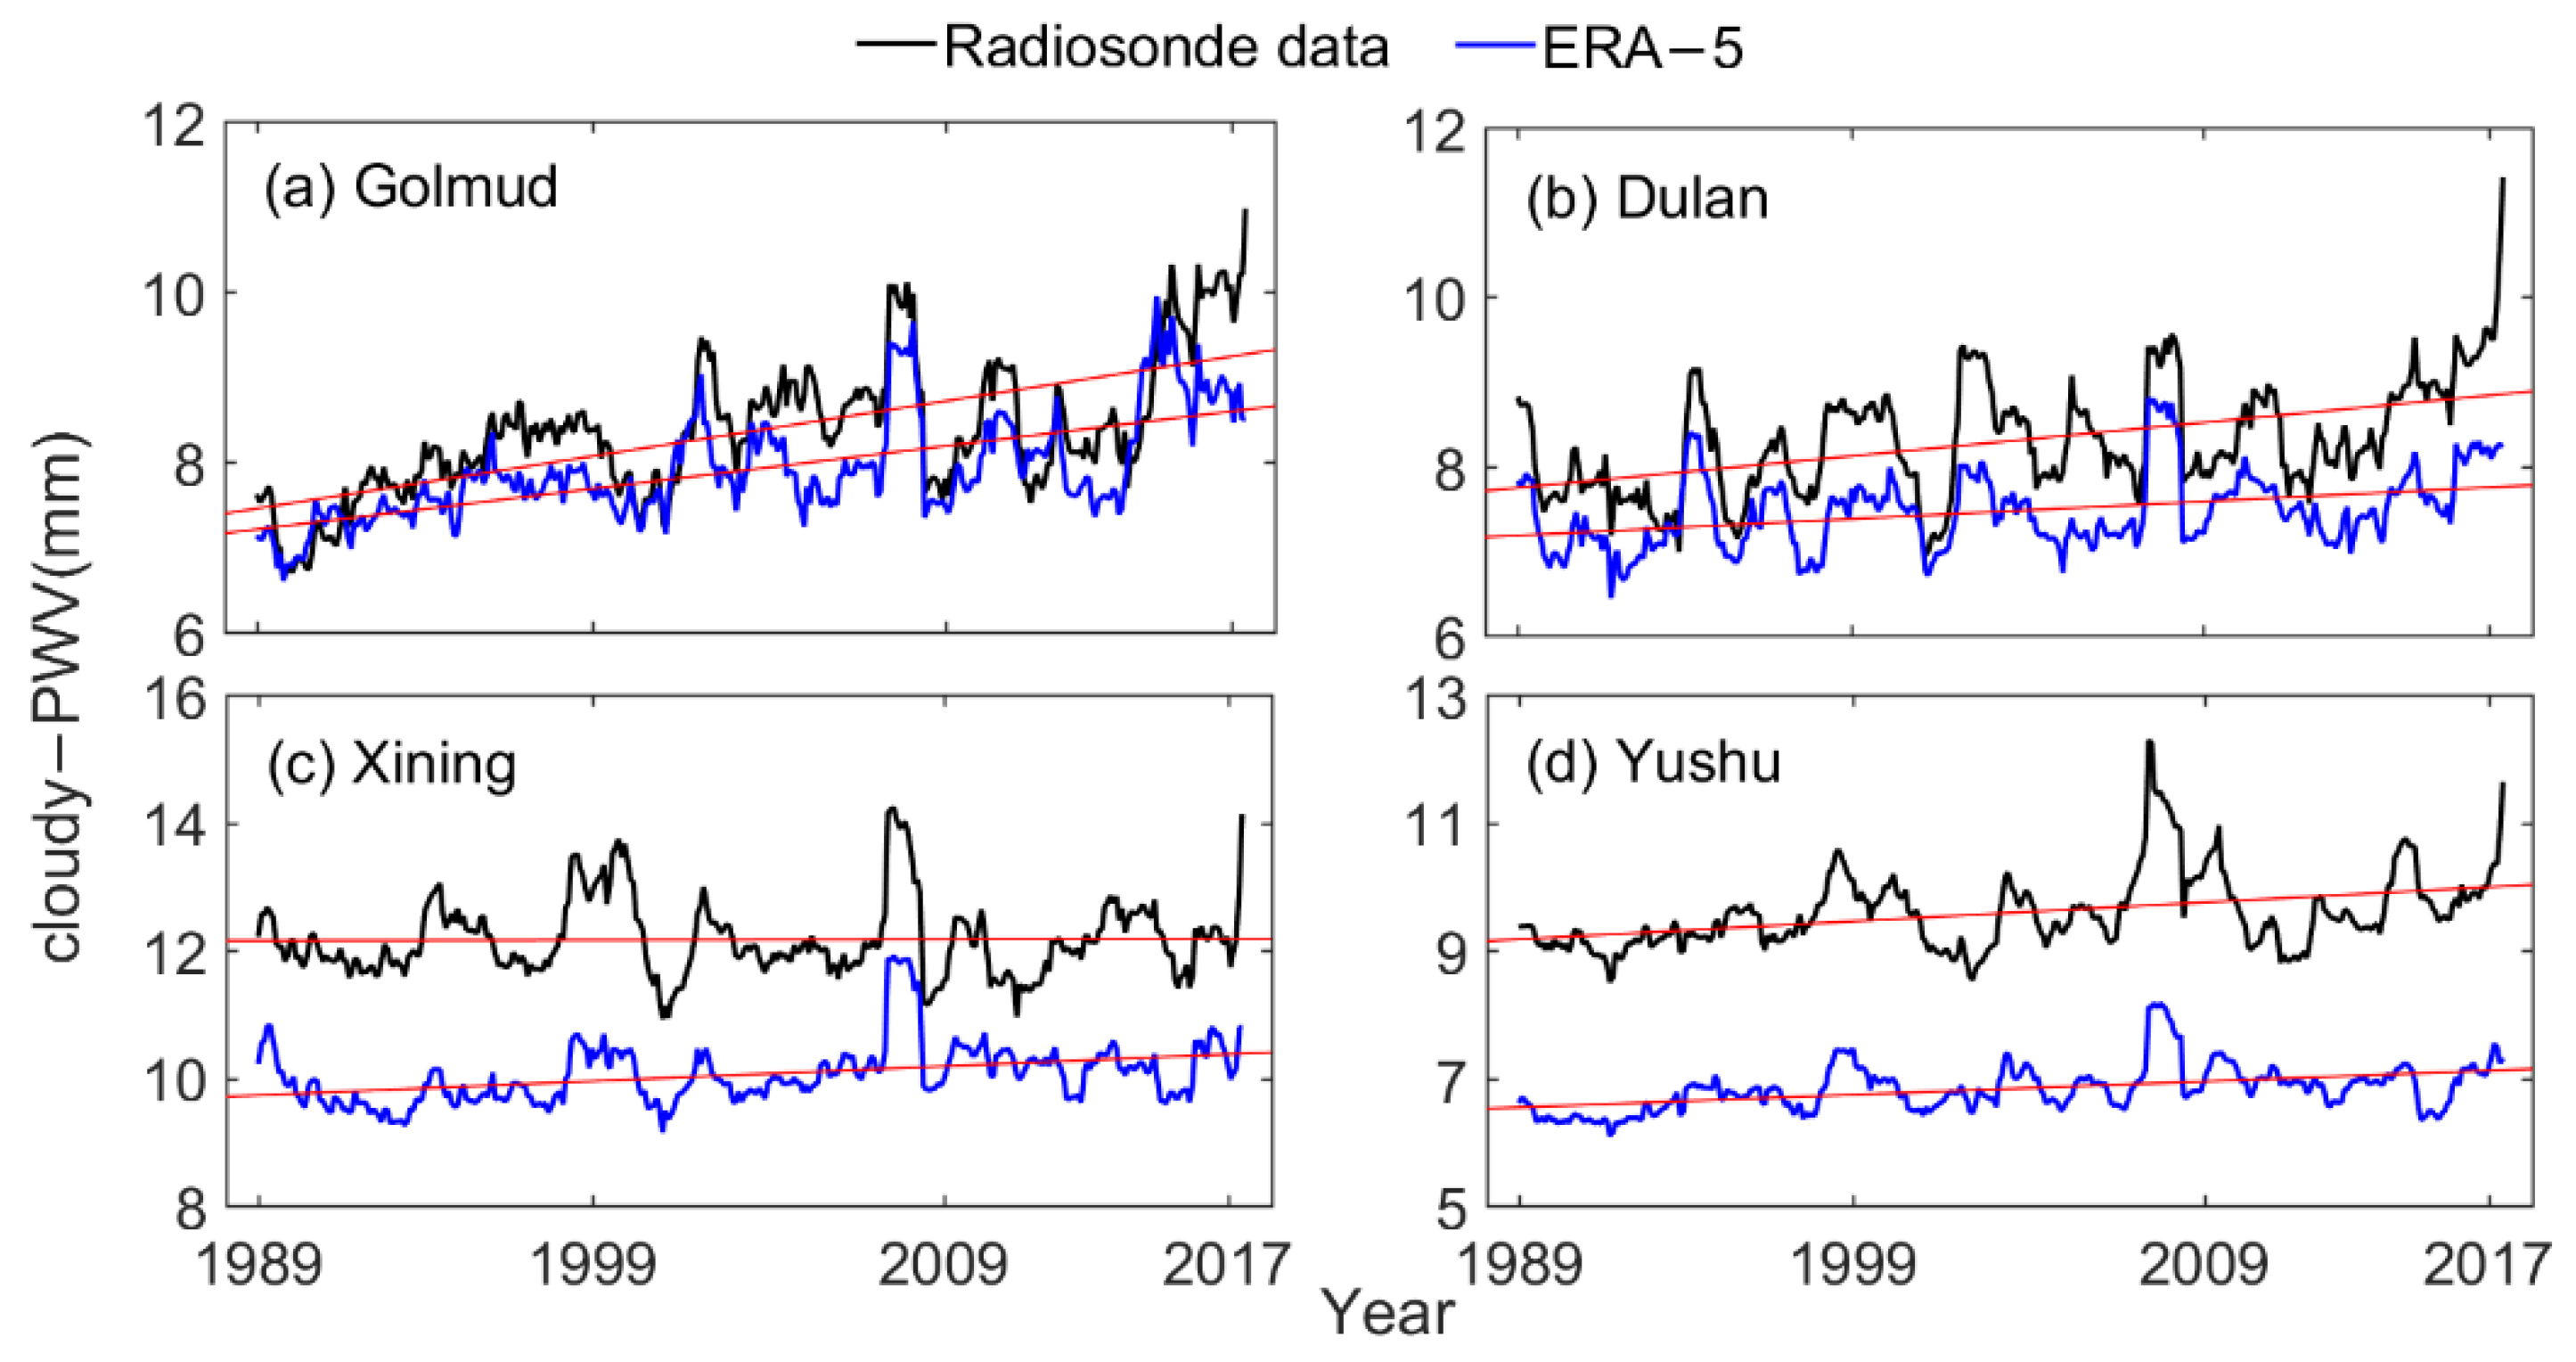
Figure 11 shows the changing trends of the ERA-5 PWV and radiosonde PWV under the cloudy sky condition. It can be seen that all the cloudy-sky PWV levels at different stations from different datasets have had increasing trends. Although the increases at the arid Golumd and Dulan stations seem more intensive, none of the trends is statistically significant. The two datasets show the same order of the multi-year mean cloudy-sky PWV at different stations, Xining > Yushu > Dulan > Golmud, which is generally affected by elevation and source of water vapor. In radiosonde data, the values are 12.2, 9.58, 8.36, and 8.30 mm; in the ERA-5 data, the values are 9.47, 7.32, 7.01, and 6.54 mm.
In Yushu and Xining stations, where water vapor income is relatively abundant, the ERA-5 PWV level is obviously lower than that of radiosonde data again, but the difference between them is relatively stable. For Dulan and Golmud stations, the difference between the two datasets is less, but gradually increases with time, and the ERA-5 PWV did not catch the up in the last year.
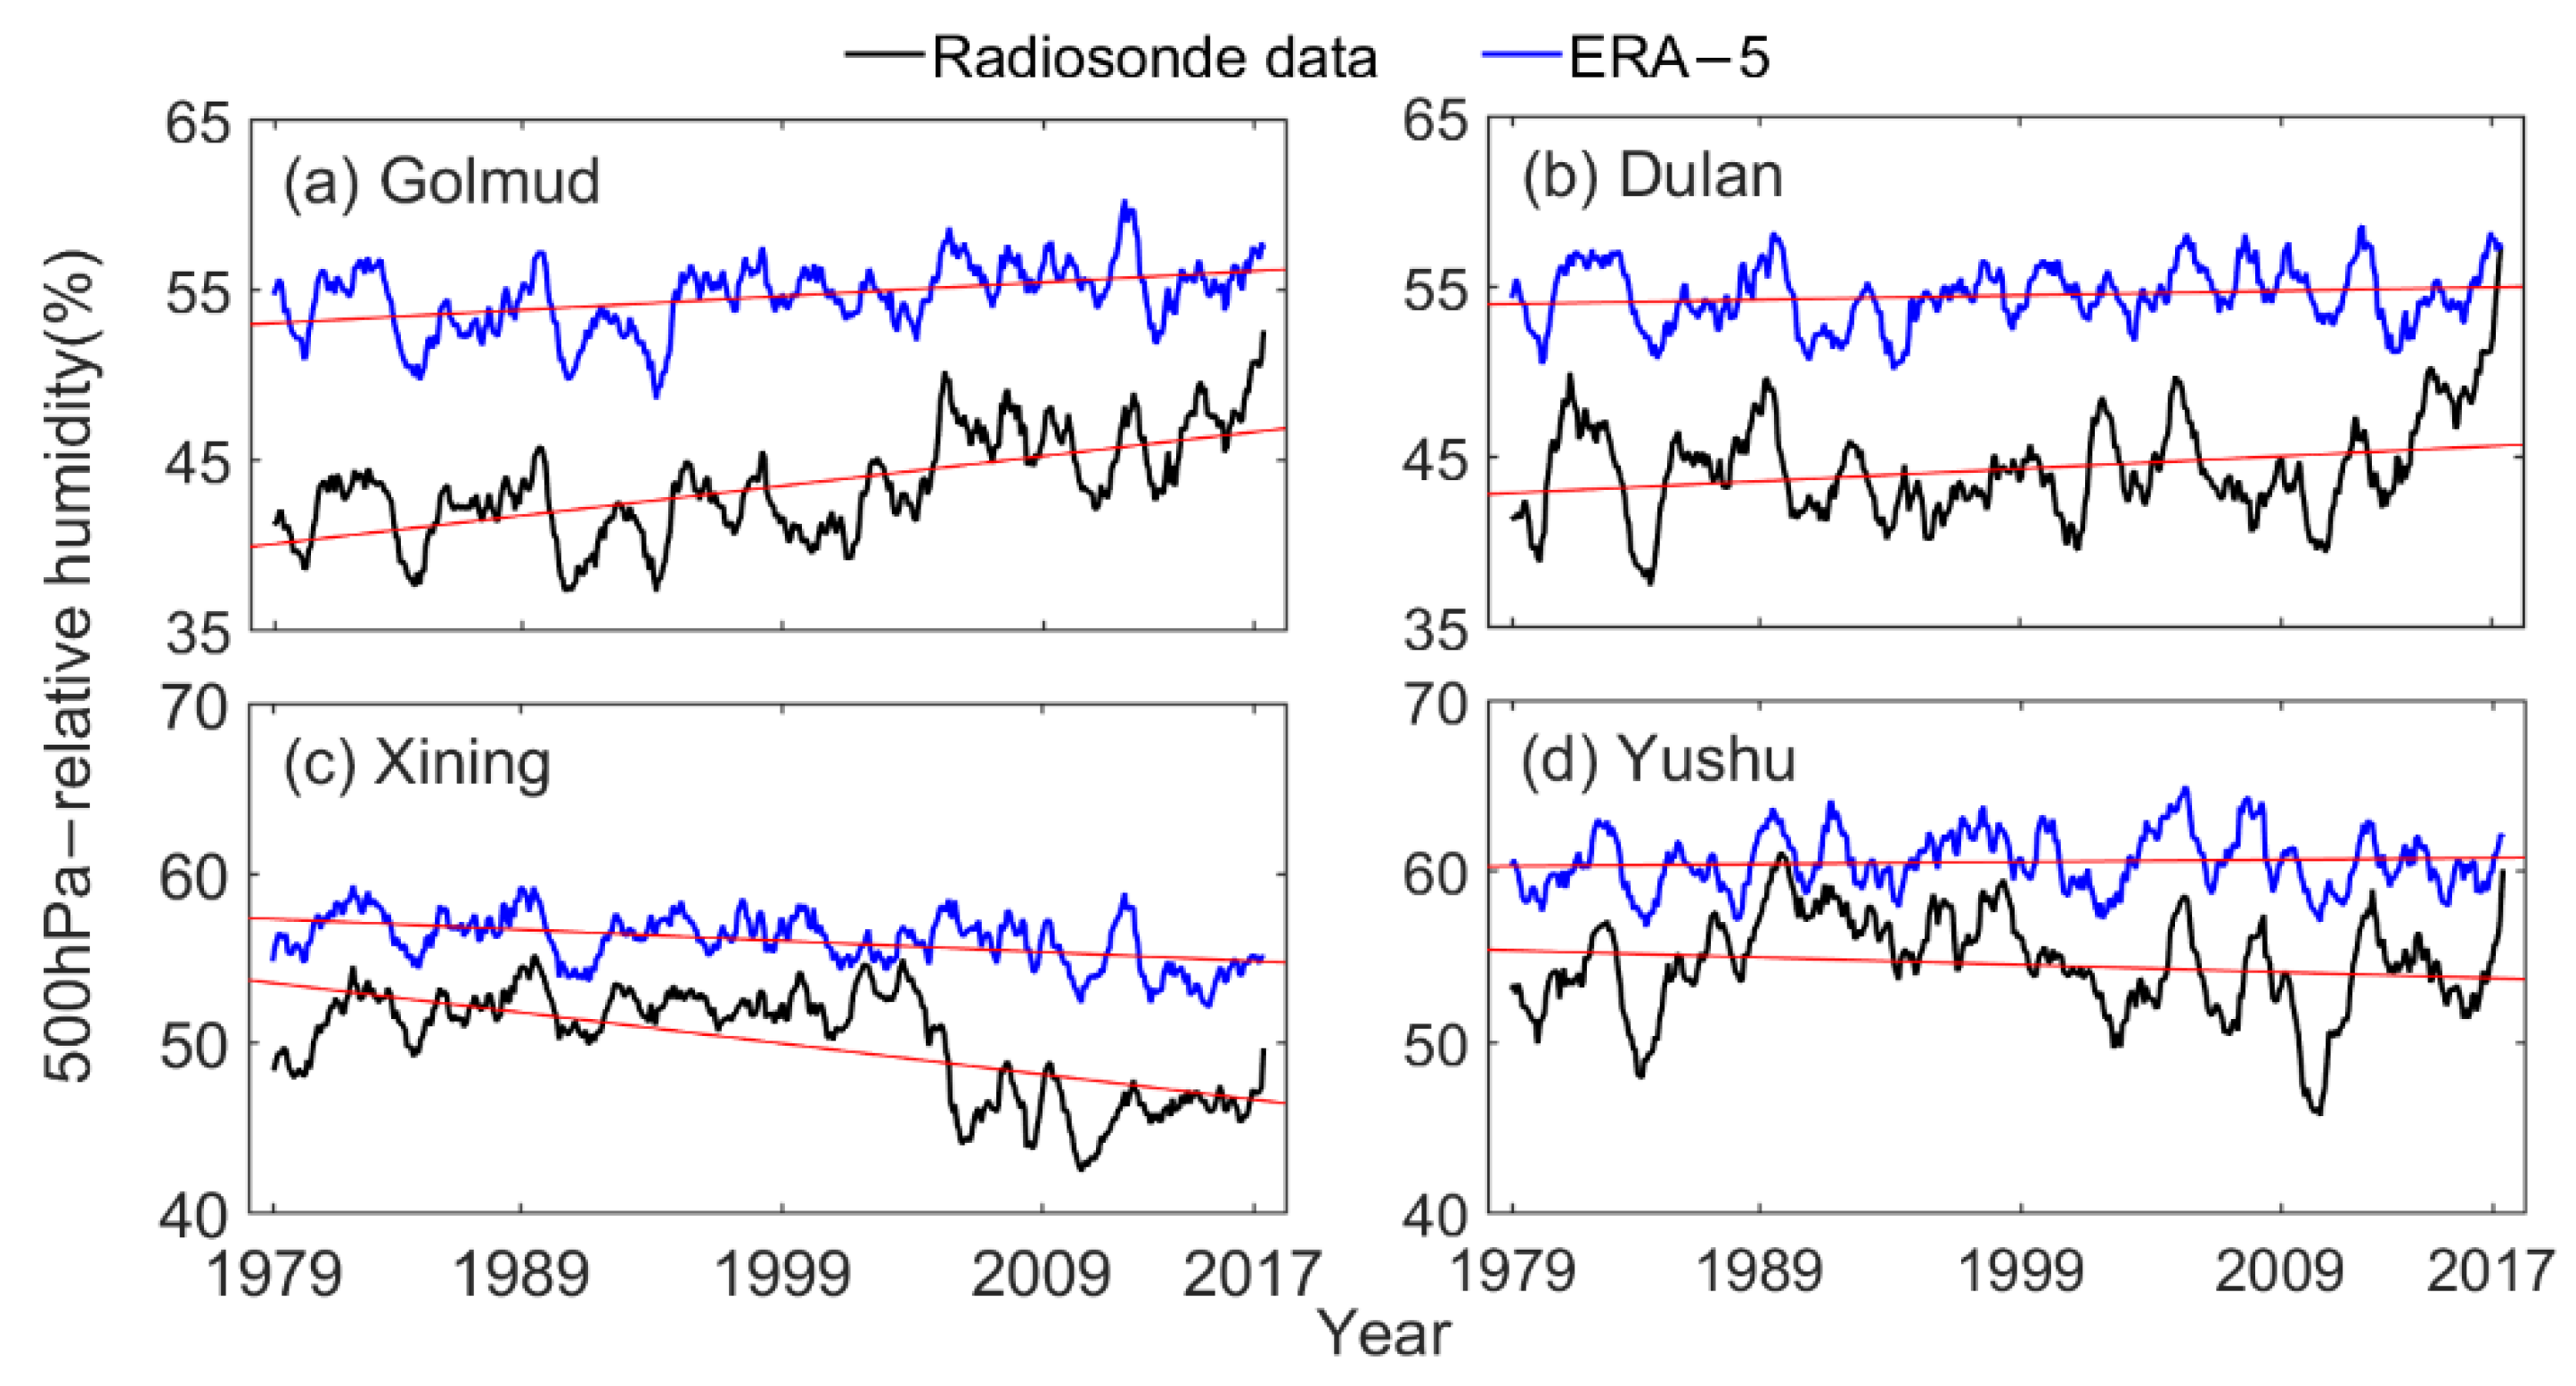
3.7. Comparative Analysis of Relative Humidity
The relative humidity is the water vapor pressure as a percentage of the value at which the air becomes saturated and reflects the abundance of PWV. We can intuitively grasp the changing trend of PWV in the whole layer by analyzing the relative humidities of different pressure layers.
Based on the completeness of the data and the geographic location of each station, the relative humidity of a representative pressure layer was selected for analysis. The trends of relative humidity change in radiosonde data and ERA-5 data at 500 hPa are shown in
Figure A4. It can be seen from the figure that the relative humidity in ERA-5 data is higher than that of the radiosonde data. The relative humidities of the different datasets have consistent change trends, among which the data of Golmud and Dulan stations show significant increasing trends, and the data of Xining stations show significant decreasing trends; and the data of Yushu station was relatively stable.
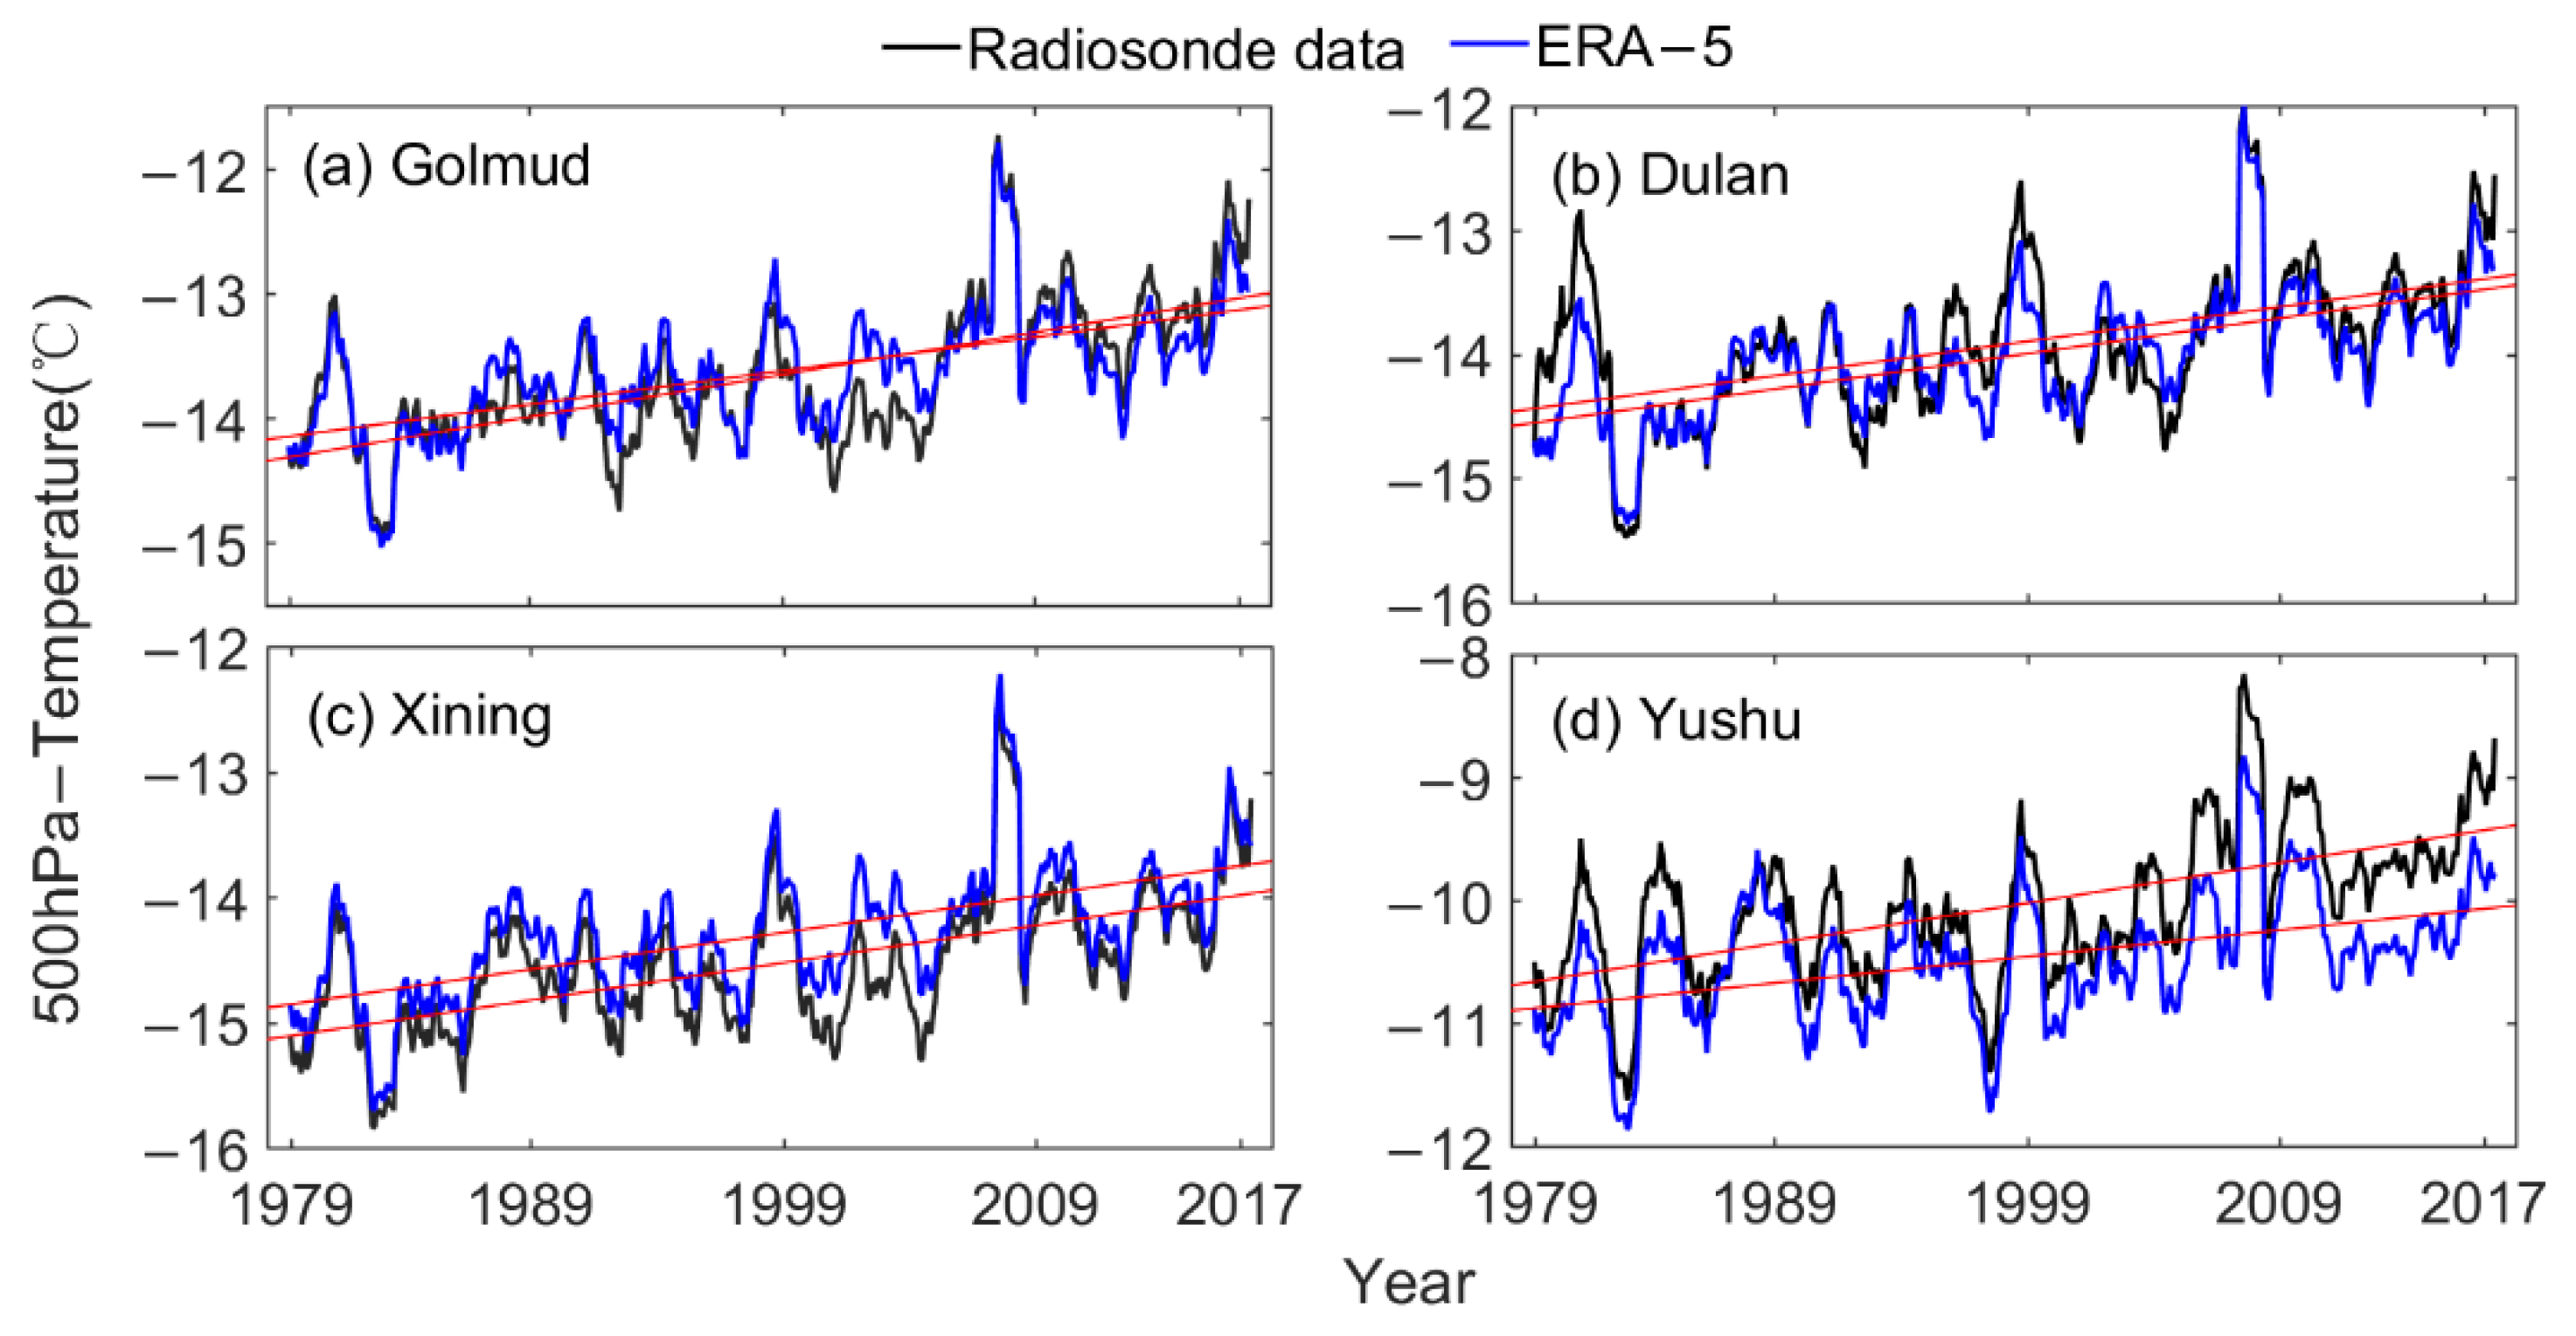
3.8. Comparative Analysis of Temperature
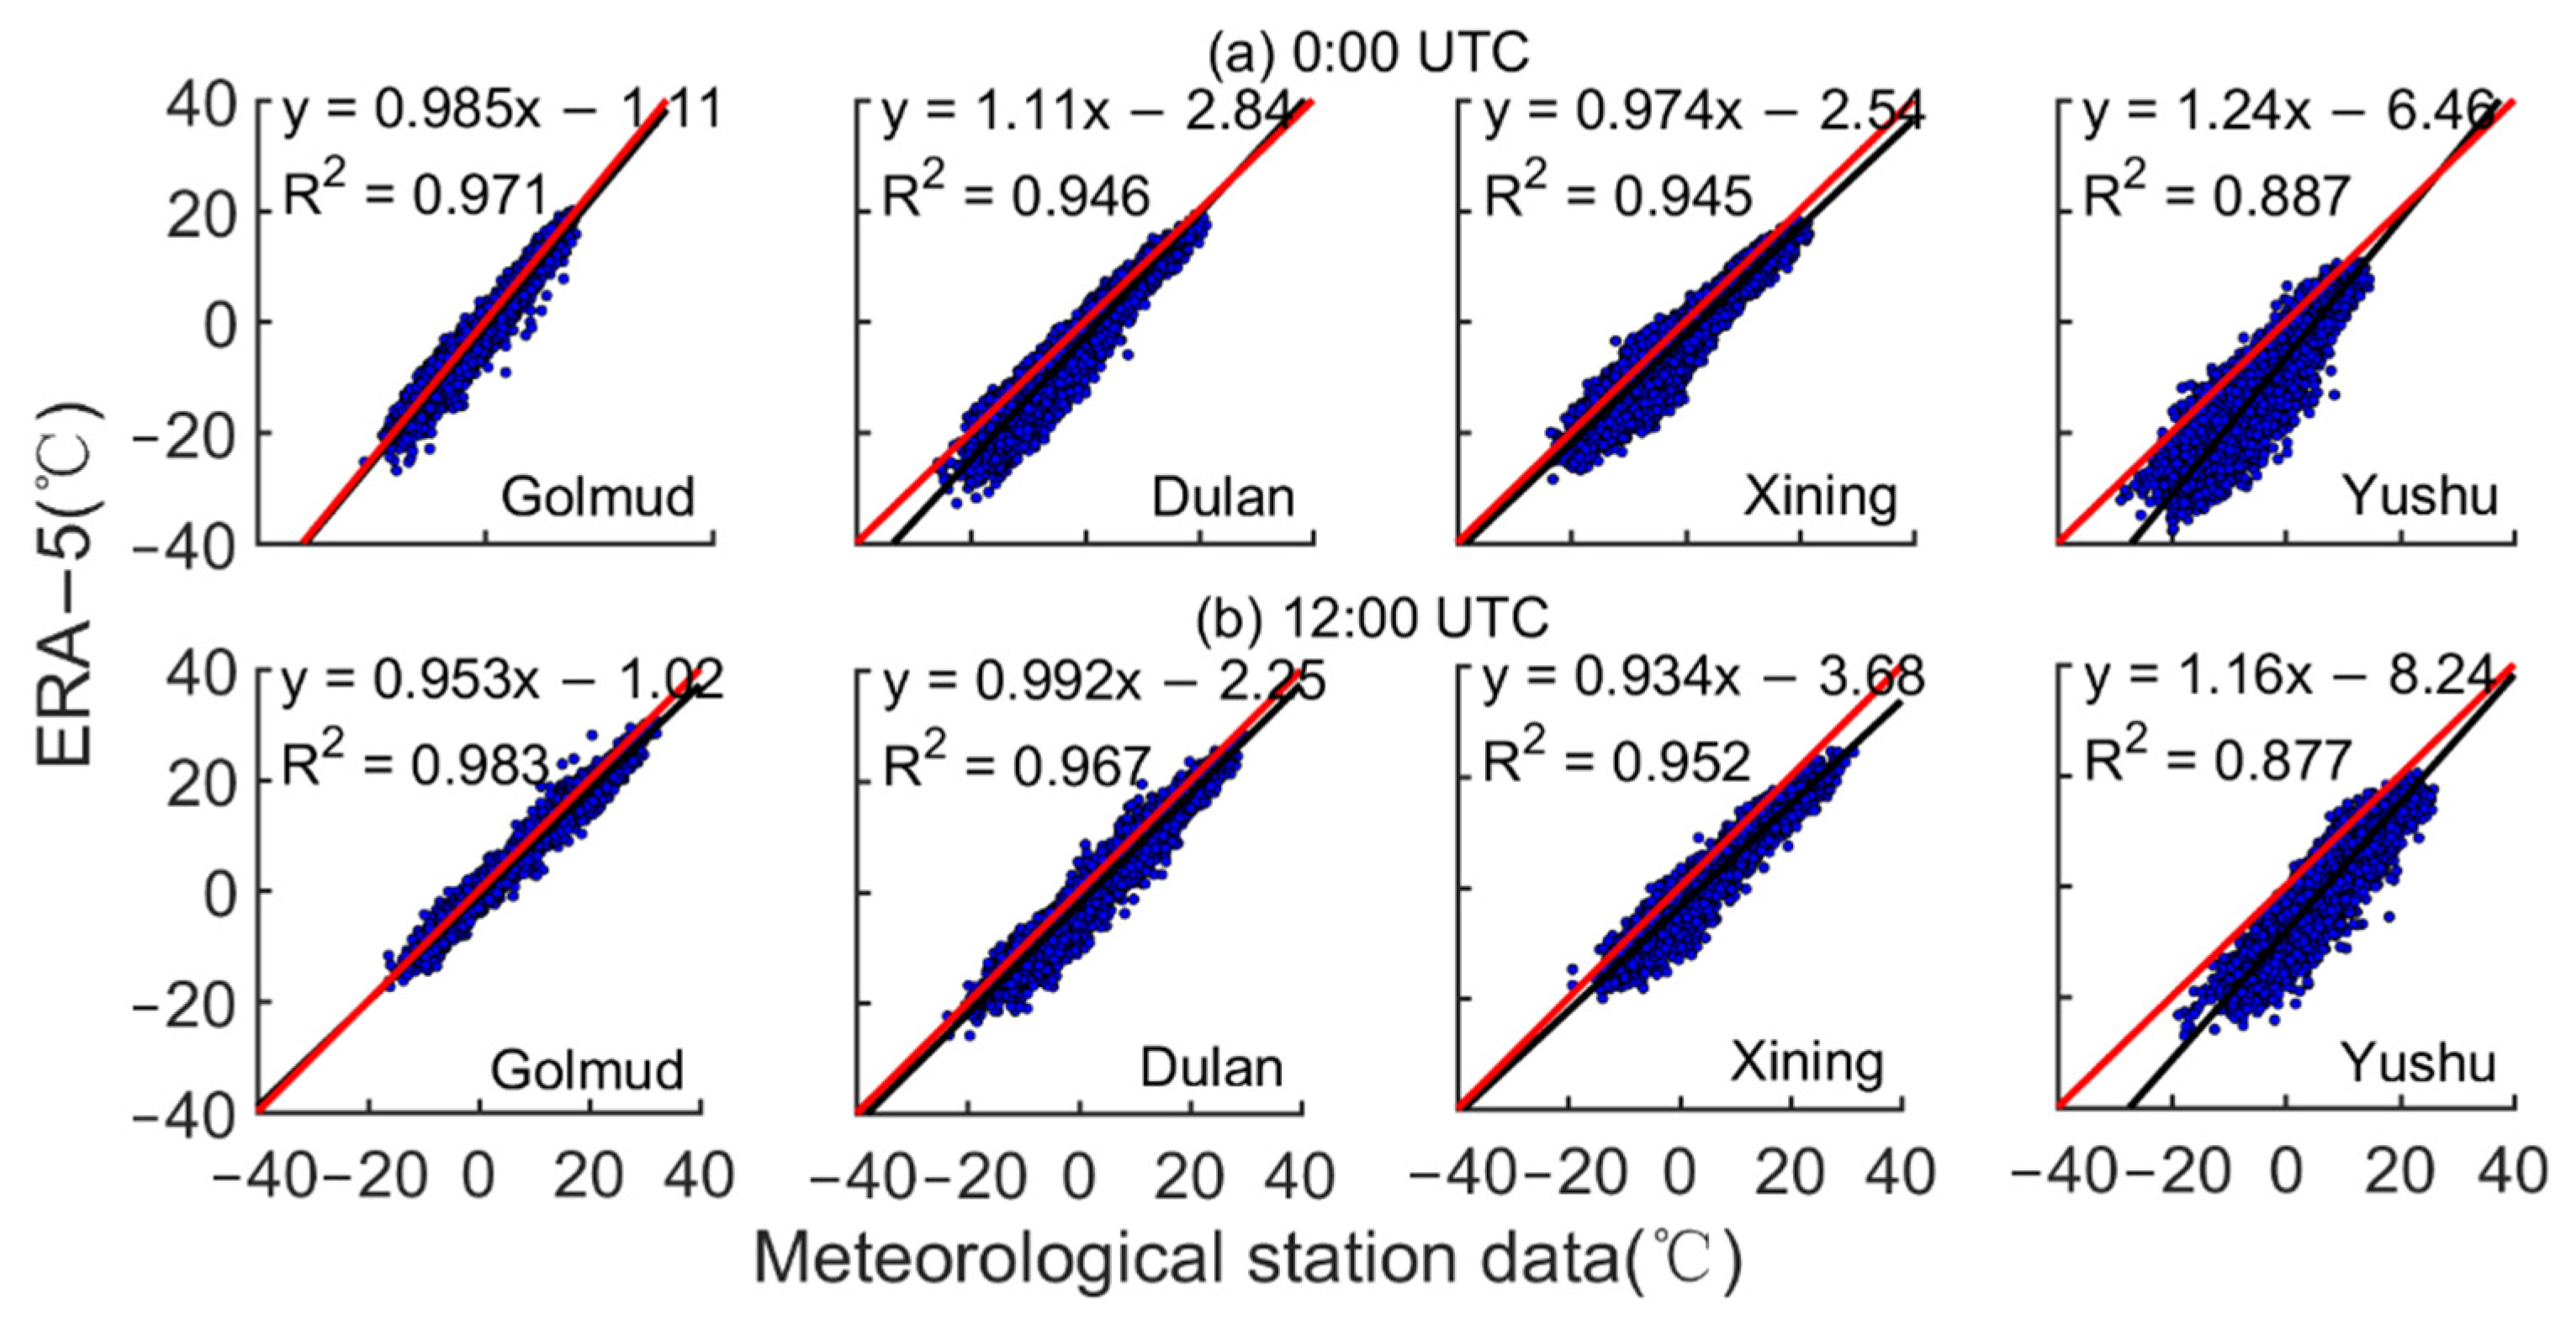
The distribution of temperature in radiosonde data and ERA-5 data at a distance of 2 m from the surface is shown in
Figure 12. The comprehensive scatter distributions and trend fitting lines show that they have high consistency, especially in the Golmud area. The large temperature deviation at the Yushu station indicates that the reliability of ERA-5 data in this region is low. The radiosonde data at Xining station showed a significant decreasing trend. When analyzing the multi-year variation trend of 2 m temperature at each station, the data were found to be consistent with the variation trend of PWV at Xining station. It is speculated that the variation trend of PWV has changed due to temperature changes.
The monthly average change trend of temperature at 500 hPa is shown in
Figure A5. It can be seen from the figure that the changes in the two kinds of data are consistent and show significant increasing trends. The difference between ERA-5 and radiosonde data increased at the Yushu station after 2009. ERA-5 is not applicable at Yushu station compared to other stations from the changing trend and the numerical value of the view.
4. Conclusions and Discussion
Given the analysis in the above sections, the applicability of the data should be paid attention to when the remote sensing data and the reanalyzed data are applied in the northern Qinghai-Tibet Plateau (especially in areas with high altitude and climatic conditions). Xia et al. [
20] used the AIRS dataset to analyze the spatiotemporal variation characteristics of PWV in the Sanjiangyuan area under clear sky conditions (to avoid the influence of total cloud cover on the detection accuracy), but did not verify the AIRS data. The results are yet to be verified. Wang et al. [
26] verified PWV in near-infrared remote sensing data by radiosonde data, and the results showed that PWV would be underestimated by near-infrared data, which is consistent with the viewpoint in this paper. Through the verification of some parameters, it is concluded that the applicability of ERA5 data in high-altitude areas is better, and it should be noted that there is still a gap between ERA5 data and the measured data, which is consistent with the conclusion obtained by Jiao et al. [
27], who analyzed ERA-5 data’s applicability in high-altitude areas. In this paper, PWV and total cloud cover of ERA-5 data and AIRS data were compared based on the data of surface meteorological stations in the northern Qinghai-Tibet Plateau (the default was the actual value), and their applicability in the northern Qinghai-Tibet Plateau was analyzed. The variation trends and differences of PWV, relative humidity, the temperature under different conditions were discussed in detail.
(1) On the whole, the ERA-5 PWV and AIRS PWV had lower values than the measured ones, and the deviation was greater as the altitude increased; the ERA-5 PWV values were closer to the measured ones.
(2) Compared with AIRS data, ERA-5 data and radiosonde data have better consistency in total cloud cover. The PWV increases with the increase of cloud cover. In the comparison between ERA-5 and AIRS data, the ERA-5 PWV values are lower than those of the AIRS data when the cloud cover is high; the ERA-5 PWV values are significantly higher than those of the AIRS data when the cloud cover is low. Although AIRS data can better reflect the changing trend of PWV under different cloud cover, it cannot be analyzed later because of the large gap between AIRS data and measured data. ERA-5 data will overestimate the PWV in areas with low cloud cover; it will underestimate the PWV in areas with high cloud cover.
(3) In clear sky conditions, the changing trend of the ERA-5 PWV increased with time, which is the opposite to the measured data. In cloudy sky conditions, both of them showed a significant increasing trend with time. The scattered point distribution was consistent with the situation when cloud cover was not considered. The distribution of scatter points in different weather conditions was consistent with that when cloud cover was not considered.
(4) Compared with the relative humidity of the typical atmospheric pressure layer, it was found that the ERA-5 relative humidity was higher than the actual value; and its change trend was consistent with the actual values. On the whole, at the Golmud and Dulan stations, the relative humidity showed increasing trends over time; at the Xining and Yushu stations, the relative humidity showed decreasing trends over time.
(5) By analyzing the temperature at 2 m and 500 hPa, it was concluded that the ERA-5 temperature is consistent with measured values.
In summary, ERA-5 data are more suitable for high altitude areas than the remote sensing AIRS data. However, the existence of large gaps between the ERA-5 PWV data and the actual values in some areas may bring questionable results in climate change analysis, which leads to its limited applicability in the northern Qinghai-Tibet Plateau.
This paper only analyzed the applicability of the PWV and cloud cover data from the AIRS data and ERA-5 data in the northern Qinghai-Tibet Plateau. We did not compare and analyze them in other high-elevation regions. Therefore, the conclusions of this paper cannot directly apply to other regions. The reasons for the differences between datasets have not been analyzed from the aspects of influencing factors in this paper, which need further study.


