
Innovative Carbon Mitigation Techniques to Achieve Environmental Sustainability Agenda: Evidence from a Panel of 21 Selected R&D Economies

 , , ,
, , ,
Abstract
:1. Introduction
1.1. The Role of Innovations in Achieving the Environmental Sustainability Agenda
1.2. The Role of Financial Development in Carbon Cost Modeling
1.3. The Impact Assessment of Carbon Pricing on Environmental Pollution
1.4. Research Question(s), Objectives, and Contribution of the Study
- —
- Does market innovation fuel low-carbon drivers and stimulate clean technology options for the country’s economic growth?
- —
- Does carbon pricing provide the basis to mobilize financial investment and give economic incentives for clean development?
- —
- Does outcome-based climate financing associated with trade policies help scale GHG emissions to achieve environmental sustainability?
- (i)
- To examine the role of technological innovations and financial development in the carbon mitigation agenda.
- (ii)
- To analyze the impact of carbon taxes, trade openness, and energy demand on carbon emissions.
- (iii)
- To substantiate the EKC hypothesis across countries.
- (iv)
- To determine the causality and inter-temporal relationship between the variables.
2. Materials and Methods
Theoretical Consideration
3. Results
4. Discussion
5. Conclusions and Policy Implications
- Substituting non-renewable fuels with renewable energy to decarbonize industrial production.
- Financialization in the ecological resource market would be beneficial for conserving economic resources.
- Technological innovation helps to reduce carbon emissions and improve the supply chain process.
- Carbon taxes reduce carbon abatement costs and improve economic restructuring.
- Trade regulations are highly needed to limit polluting firms from dirty production.
Author Contributions
Funding
Institutional Review Board Statement
Informed Consent Statement
Data Availability Statement
Conflicts of Interest
Abbreviations
| COP-21 | 21st Conference of the Parties |
| DES | Distributed energy system |
| GHG Emissions | Greenhouse gas emissions |
| EG | Economic growth |
| FD | Financial development |
| R&D | Research and development |
| ESA | Environmental sustainability agenda |
| RE | Renewable energy |
| ETS | Emissions trading system |
| NRE | Non-renewable energy |
| EKC | Environmental Kuznets curve |
| EUSE | Energy use |
| TOP | Trade openness |
| CO2 emissions | Carbon dioxide emissions |
| CPRICE | Carbon pricing |
| PHH | Pollution haven hypothesis |
| FDINDEX | Financial development index |
| PCA | Principle component analysis |
| INOVINDEX | Innovation index |
| FMOLS | Fully Modified OLS |
| IRF | Impulse response function |
| VDA | Variance decomposition analysis |
| VAR | Vector autoregressive |
References
- FCS. COP21 Summit: Highlights and Key Takeaways. First Carbon Solutions, Newsletters, United States. 2016. Available online: https://www.firstcarbonsolutions.com/resources/newsletters/january-2016-cop21-summit-highlights-and-key-takeaways/cop21-summit-highlights-and-key-takeaways/ (accessed on 15 August 2019).
- World Bank. Carbon Pricing: Building on the Momentum of the Paris Agreement. Washington, DC, USA. 2016. Available online: https://www.worldbank.org/en/news/feature/2016/04/15/carbon-pricing-building-on-the-momentum-of-the-paris-agreement (accessed on 15 August 2019).
- Awan, U. Steering for Sustainable Development Goals: A Typology of Sustainable Innovation. In Industry, Innovation and Infrastructure. Encyclopedia of the UN Sustainable Development Goals; Filho, W.L., Azul, A.M., Brandli, L., Salvia, A.L., Wall, T., Eds.; Springer: Cham, Switzerland, 2020. [Google Scholar] [CrossRef]
- United Nations. UN Climate Action Summit. United Nation Climate Action Summit 2019. 2019. Available online: https://www.un.org/en/climatechange/un-climate-summit-2019.shtml (accessed on 15 August 2019).
- Cheng, Y.; Awan, U.; Ahmad, S.; Tan, Z. How do technological innovation and fiscal decentralization affect the environment? A story of the fourth industrial revolution and sustainable growth. Technol. Forecast. Soc. Chang. 2020, 162, 120398. [Google Scholar] [CrossRef]
- De Mel, I.; Demis, P.; Dorneanu, B.; Klymenko, O.; Mechleri, E.; Arellano-Garcia, H. Global Sensitivity Analysis for Design and Operation of Distributed Energy Systems. 30th European Symposium on Computer Aided Process Engineering. In Computer Aided Chemical Engineering; Pierucci, S., Manenti, F., Bozzano, G.L., Manca, D., Eds.; Elsevier: Amsterdam, The Netherlands, 2020; Volume 48, pp. 1519–1524. [Google Scholar]
- Chwieduk, D.; Bujalski, W.; Chwieduk, B. Possibilities of Transition from Centralized Energy Systems to Distributed Energy Sources in Large Polish Cities. Energies 2020, 13, 6007. [Google Scholar] [CrossRef]
- Awan, U.; Khattak, A.; Rabbani, S.; Dhir, A. Buyer-Driven Knowledge Transfer Activities to Enhance Organizational Sustainability of Suppliers. Sustainability 2020, 12, 2993. [Google Scholar] [CrossRef] [Green Version]
- Kanwal, N.; Awan, U. Role of Design Thinking and Biomimicry in Leveraging Sustainable Innovation. In Industry, Innovation and Infrastructure, Encyclopedia of the UN Sustainable Development Goals (UNSDGs); Leal Filho, W., Azul, A., Brandli, L., Lange Salvia, A., Wall, T., Eds.; Springer Nature: Cham, Switzerland, 2020. [Google Scholar] [CrossRef]
- Huisingh, D.; Zhang, Z.; Moore, J.C.; Qiao, Q.; Li, Q. Recent advances in carbon emissions reduction: Policies, technologies, monitoring, assessment and modeling. J. Clean. Prod. 2015, 103, 1–12. [Google Scholar] [CrossRef]
- Irandoust, M. The renewable energy-growth nexus with carbon emissions and technological innovation: Evidence from the Nordic countries. Ecol. Indic. 2016, 69, 118–125. [Google Scholar] [CrossRef]
- Calel, R.; Dechezlepretre, A. Environmental policy and directed technological change: Evidence from the European carbon market. Rev. Econ. Stat. 2016, 98, 173–191. [Google Scholar] [CrossRef] [Green Version]
- Miao, C.; Fang, D.; Sun, L.; Luo, Q.; Yu, Q. Driving effect of technology innovation on energy utilization efficiency in strategic emerging industries. J. Clean. Prod. 2018, 170, 1177–1184. [Google Scholar] [CrossRef]
- Mensah, C.N.; Long, X.; Boamah, K.B.; Bediako, I.A.; Dauda, L.; Salman, M. The effect of innovation on CO2 emissions of OCED countries from 1990 to 2014. Environ. Sci. Pollut. Res. 2018, 25, 29678–29698. [Google Scholar] [CrossRef]
- Du, K.; Li, J. Towards a green world: How do green technology innovations affect total-factor carbon productivity. Energy Policy 2019, 131, 240–250. [Google Scholar] [CrossRef]
- Du, K.; Li, P.; Yan, Z. Do green technology innovations contribute to carbon dioxide emission reduction? Empirical evidence from patent data. Technol. Forecast. Soc. Chang. 2019, 146, 297–303. [Google Scholar] [CrossRef]
- Balsalobre-Lorente, D.; Álvarez-Herranz, A.; Shahbaz, M. The Long-Term Effect of Economic Growth, Energy Innovation, Energy Use on Environmental Quality. In Energy and Environmental Strategies in the Era of Globalization; Springer: Cham, Switzerland, 2019; pp. 1–34. [Google Scholar]
- Parveen, N.; Singh, D.V.; Azam, R. Innovations in Recycling for Sustainable Management of Solid Wastes. In Innovative Waste Management Technologies for Sustainable Development; IGI Global: Hershey, PA, USA, 2020; pp. 177–210. [Google Scholar]
- Khan, A.; Chenggang, Y.; Hussain, J.; Kui, Z. Impact of technological innovation, financial development and foreign direct investment on renewable energy, non-renewable energy and the environment in belt & Road Initiative countries. Renew. Energy 2021, 171, 479–491. [Google Scholar]
- Kihombo, S.; Ahmed, Z.; Chen, S.; Adebayo, T.S.; Kirikkaleli, D. Linking financial development, economic growth, and ecological footprint: What is the role of technological innovation? Environ. Sci. Pollut. Res. 2021, 28, 61235–61245. [Google Scholar] [CrossRef] [PubMed]
- Qayyum, M.; Ali, M.; Nizamani, M.M.; Li, S.; Yu, Y.; Jahanger, A. Nexus between Financial Development, Renewable Energy Consumption, Technological Innovations and CO2 Emissions: The Case of India. Energies 2021, 14, 4505. [Google Scholar] [CrossRef]
- Awan, U.; Nauman, S.; Sroufe, R. Exploring the effect of buyer engagement on green product innovation: Empirical evidence from manufacturers. Bus. Strategy Environ. 2021, 30, 463–477. [Google Scholar] [CrossRef]
- Ghisetti, C.; Mazzanti, M.; Mancinelli, S.; Zoli, M. Do Financial Constraints Make the Environment Worse Off? Understanding the Effects of Financial Barriers on Environmental Innovations; Working Paper Series; SEEDS: Ferrara, Italy, 2015; 19p. [Google Scholar]
- Alam, A.; Azam, M.; Abdullah, A.B.; Malik, I.A.; Khan, A.; Hamzah, T.A.A.T.; Khan, M.M.; Zahoor, H.; Zaman, K. Environmental quality indicators and financial development in Malaysia: Unity in diversity. Environ. Sci. Pollut. Res. 2015, 22, 8392–8404. [Google Scholar] [CrossRef] [PubMed]
- Shahbaz, M.; Nasir, M.A.; Roubaud, D. Environmental degradation in France: The effects of FDI, financial development, and energy innovations. Energy Econ. 2018, 74, 843–857. [Google Scholar] [CrossRef] [Green Version]
- Ghisetti, C.; Mancinelli, S.; Mazzanti, M.; Zoli, M. Financial barriers and environmental innovations: Evidence from EU manufacturing firms. Clim. Policy 2017, 17 (Suppl. 1), S131–S147. [Google Scholar] [CrossRef]
- Adams, S.; Klobodu, E.K.M. Capital flows and economic growth revisited: Evidence from five Sub-Saharan African countries. Int. Rev. Appl. Econ. 2018, 32, 620–640. [Google Scholar] [CrossRef]
- Pan, X.; Uddin, M.K.; Han, C.; Pan, X. Dynamics of financial development, trade openness, technological innovation and energy intensity: Evidence from Bangladesh. Energy 2019, 171, 456–464. [Google Scholar] [CrossRef]
- Koçak, E.; Ulucak, Z.Ş. The effect of energy R&D expenditures on CO2 emission reduction: Estimation of the STIRPAT model for OECD countries. Environ. Sci. Pollut. Res. 2019, 26, 14328–14338. [Google Scholar]
- Dauda, L.; Long, X.; Mensah, C.N.; Salman, M. The effects of economic growth and innovation on CO2 emissions in different regions. Environ. Sci. Pollut. Res. 2019, 26, 15028–15038. [Google Scholar] [CrossRef]
- Yang, B.; Jahanger, A.; Ali, M. Remittance inflows affect the ecological footprint in BICS countries: Do technological innovation and financial development matter? Environ. Sci. Pollut. Res. 2021, 28, 23482–23500. [Google Scholar] [CrossRef]
- Shen, Y.; Su, Z.W.; Malik, M.Y.; Umar, M.; Khan, Z.; Khan, M. Does green investment, financial development and natural resources rent limit carbon emissions? A provincial panel analysis of China. Sci. Total Environ. 2021, 755, 142538. [Google Scholar] [CrossRef] [PubMed]
- Rezaee, A.; Dehghanian, F.; Fahimnia, B.; Beamon, B. Green supply chain network design with stochastic demand and carbon price. Ann. Oper. Res. 2017, 250, 463–485. [Google Scholar] [CrossRef]
- Kök, A.G.; Shang, K.; Yücel, Ş. Impact of electricity pricing policies on renewable energy investments and carbon emissions. Manag. Sci. 2016, 64, 131–148. [Google Scholar] [CrossRef] [Green Version]
- Zeng, S.; Nan, X.; Liu, C.; Chen, J. The response of the Beijing carbon emissions allowance price (BJC) to macroeconomic and energy price indices. Energy Policy 2017, 106, 111–121. [Google Scholar] [CrossRef]
- Cong, R.; Lo, A.Y. Emission trading and carbon market performance in Shenzhen, China. Appl. Energy 2017, 193, 414–425. [Google Scholar] [CrossRef] [Green Version]
- Böhringer, C.; Carbone, J.C.; Rutherford, T.F. Embodied carbon tariffs. Scand. J. Econ. 2018, 120, 183–210. [Google Scholar] [CrossRef]
- Wang, Q.; Hubacek, K.; Feng, K.; Guo, L.; Zhang, K.; Xue, J.; Liang, Q.M. Distributional impact of carbon pricing in Chinese provinces. Energy Econ. 2019, 81, 327–340. [Google Scholar] [CrossRef] [Green Version]
- Baloch, M.A.; Ozturk, I.; Bekun, F.V.; Khan, D. Modeling the dynamic linkage between financial development, energy innovation, and environmental quality: Does globalization matter? Bus. Strategy Environ. 2021, 30, 176–184. [Google Scholar] [CrossRef]
- Lilliestam, J.; Patt, A.; Bersalli, G. The effect of carbon pricing on technological change for full energy decarbonization: A review of empirical ex-post evidence. Wiley Interdiscip. Rev. Clim. 2021, 12, e681. [Google Scholar] [CrossRef]
- Campiglio, E. Beyond carbon pricing: The role of banking and monetary policy in financing the transition to a low-carbon economy. Ecol. Econ. 2016, 121, 220–230. [Google Scholar] [CrossRef] [Green Version]
- Boutabba, M.A. The impact of financial development, income, energy and trade on carbon emissions: Evidence from the Indian economy. Econ. Model. 2014, 40, 33–41. [Google Scholar] [CrossRef] [Green Version]
- Zhang, Y.J. The impact of financial development on carbon emissions: An empirical analysis in China. Energy Policy 2011, 39, 2197–2203. [Google Scholar] [CrossRef]
- Grupp, H.; Schubert, T. Review and new evidence on composite innovation indicators for evaluating national performance. Res. Policy 2010, 39, 67–78. [Google Scholar] [CrossRef]
- Lee, S.Y.; Florida, R.; Gates, G. Innovation, human capital, and creativity. Int. Rev. Public Adm. 2010, 14, 13–24. [Google Scholar] [CrossRef]
- Makkonen, T.; van der Have, R.P. Benchmarking regional innovative performance: Composite measures and direct innovation counts. Scientometrics 2013, 94, 247–262. [Google Scholar] [CrossRef] [Green Version]
- Batool, R.; Sharif, A.; Islam, T.; Zaman, K.; Shoukry, A.M.; Sharkawy, M.A.; Gani, S.; Aamir, A.; Hishan, S.S. Green is clean: The role of ICT in resource management. Environ. Sci. Pollut. Res. 2019, 26, 25341–25358. [Google Scholar] [CrossRef]
- Tietenberg, T.H. Reflections—Carbon pricing in practice. Rev. Environ. Econ. Policy 2013, 7, 313–329. [Google Scholar] [CrossRef]
- Baranzini, A.; Van den Bergh, J.C.; Carattini, S.; Howarth, R.B.; Padilla, E.; Roca, J. Carbon pricing in climate policy: Seven reasons, complementary instruments, and political economy considerations. Wiley Interdiscip. Rev. Clim. Chang. 2017, 8, e462. [Google Scholar] [CrossRef] [Green Version]
- Jenkins, J.D. Political economy constraints on carbon pricing policies: What are the implications for economic efficiency, environmental efficacy, and climate policy design? Energy Policy 2014, 69, 467–477. [Google Scholar] [CrossRef]
- Zaman, K.; Moemen, M.A.E.; Islam, T. Dynamic linkages between tourism transportation expenditures, carbon dioxide emission, energy consumption and growth factors: Evidence from the transition economies. Curr. Issues Tour. 2017, 20, 1720–1735. [Google Scholar] [CrossRef]
- Amin, A.; Dogan, E.; Khan, Z. The impacts of different proxies for financialization on carbon emissions in top-ten emitter countries. Sci. Total Environ. 2020, 740, 140127. [Google Scholar] [CrossRef]
- Khurshid, A.; Rauf, A.; Calin, A.C.; Qayyum, S.; Mian, A.H.; Fatima, T. Technological innovations for environmental protection: Role of intellectual property rights in the carbon mitigation efforts. Evidence from western and southern Europe. Int. J. Environ. Sci. Technol. 2021. [Google Scholar] [CrossRef]
- Mundaca, G.; Strand, J.; Young, I.R. Carbon pricing of international transport fuels: Impacts on carbon emissions and trade activity. J. Environ. Econ. Manag. 2021, 110, 102517. [Google Scholar] [CrossRef]
- Ali, S.; Yusop, Z.; Kaliappan, S.R.; Chin, L. Trade-environment nexus in OIC countries: Fresh insights from environmental Kuznets curve using GHG emissions and ecological footprint. Environ. Sci. Pollut. Res. 2021, 28, 4531–4548. [Google Scholar] [CrossRef]
- World Bank. World Development Indicators; World Bank: Washington, DC, USA, 2019. [Google Scholar]
- Khan, H.U.R.; Zaman, K.; Usman, B.; Nassani, A.A.; Aldakhil, A.M.; Abro, M.M.Q. Financial management of natural resource market: Long-run and inter-temporal (forecast) relationship. Resour. Policy 2019, 63, 101452. [Google Scholar] [CrossRef]
- Khan, H.U.R.; Islam, T.; Yousaf, S.U.; Zaman, K.; Shoukry, A.M.; Sharkawy, M.A.; Gani, S.; Aamir, A.; Hishan, S.S. The impact of financial development indicators on natural resource markets: Evidence from two-step GMM estimator. Resour. Policy 2019, 62, 240–255. [Google Scholar] [CrossRef]
- Hishan, S.S.; Khan, A.; Ahmad, J.; Hassan, Z.B.; Zaman, K.; Qureshi, M.I. Access to clean technologies, energy, finance, and food: Environmental sustainability agenda and its implications on Sub-Saharan African countries. Environ. Sci. Pollut. Res. 2019, 26, 16503–16518. [Google Scholar] [CrossRef] [PubMed]
- Qureshi, M.I.; Elashkar, E.E.; Shoukry, A.M.; Aamir, A.; Mahmood, N.H.N.; Rasli, A.M.; Zaman, K. Measuring the ecological footprint of inbound and outbound tourists: Evidence from a panel of 35 countries. Clean Technol. Environ. Policy 2019, 21, 1949–1967. [Google Scholar] [CrossRef]
- Tsaurai, K. The impact of financial development on carbon emissions in Africa. Int. J. Energy Econ. Policy 2019, 9, 144–153. [Google Scholar] [CrossRef]
- Bhuiyan, M.A.; Zaman, K.; Shoukry, A.M.; Gani, S.; Sharkawy, M.A.; Sasmoko; Khan, A.; Ahmad, A.; Hishan, S.S. Energy, tourism, finance, and resource depletion: Panel data analysis. Energy Source B Econ. Plan. Policy 2018, 13, 463–474. [Google Scholar] [CrossRef]
- Rahman, S.; Chen, S.; Saleem, N.; Bari, M.W. Financial development and its moderating role in environmental Kuznets curve: Evidence from Pakistan. Environ. Sci. Pollut. Res. 2019, 26, 19305–19319. [Google Scholar] [CrossRef]
- Khan, K.A.; Zaman, K.; Shoukry, A.M.; Sharkawy, A.; Gani, S.; Ahmad, J.; Khan, A.; Hishan, S.S. Natural disasters and economic losses: Controlling external migration, energy and environmental resources, water demand, and financial development for global prosperity. Environ. Sci. Pollut. Res. 2019, 26, 14287–14299. [Google Scholar] [CrossRef]
- Zhang, Y.J.; Peng, Y.L.; Ma, C.Q.; Shen, B. Can environmental innovation facilitate carbon emissions reduction? Evidence from China. Energy Policy 2017, 100, 18–28. [Google Scholar] [CrossRef]
- Ganda, F. The impact of innovation and technology investments on carbon emissions in selected organisation for economic Co-operation and development countries. J. Clean. Prod. 2019, 217, 469–483. [Google Scholar] [CrossRef]
- Long, X.; Chen, Y.; Du, J.; Oh, K.; Han, I. Environmental innovation and its impact on economic and environmental performance: Evidence from Korean-owned firms in China. Energy Policy 2017, 107, 131–137. [Google Scholar] [CrossRef]
- Lee, K.H.; Min, B. Green R&D for eco-innovation and its impact on carbon emissions and firm performance. J. Clean. Prod. 2015, 108, 534–542. [Google Scholar]
- Zhang, N.; Wang, B.; Liu, Z. Carbon emissions dynamics, efficiency gains, and technological innovation in China’s industrial sectors. Energy 2016, 99, 10–19. [Google Scholar] [CrossRef]
- Uyarra, E.; Shapira, P.; Harding, A. Low carbon innovation and enterprise growth in the UK: Challenges of a place-blind policy mix. Technol. Forecast. Soc. Chang. 2016, 103, 264–272. [Google Scholar] [CrossRef]
- Li, D.; Huang, M.; Ren, S.; Chen, X.; Ning, L. Environmental legitimacy, green innovation, and corporate carbon disclosure: Evidence from CDP China 100. J. Bus. Ethics 2018, 150, 1089–1104. [Google Scholar] [CrossRef]
- Solow, R.M. A contribution to the theory of economic growth. Q. J. Econ. 1956, 70, 65–94. [Google Scholar] [CrossRef]
- Levin, A.; Lin, C.F.; Chu, C.S.J. Unit root tests in panel data: Asymptotic and finite-sample properties. J. Econom. 2002, 108, 1–24. [Google Scholar] [CrossRef]
- Im, K.S.; Pesaran, M.H.; Shin, Y. Testing for unit roots in heterogeneous panels. J. Econom. 2003, 115, 53–74. [Google Scholar] [CrossRef]
- Pedroni, P. Fully modified OLS for heterogeneous cointegrated panels. In Nonstationary Panels, Panel Cointegration, and Dynamic Panels; Emerald Group Publishing Limited: Bingley, UK, 2001; pp. 93–130. [Google Scholar]
- Bailey, I.; MacGill, I.; Passey, R.; Compston, H. The fall (and rise) of carbon pricing in Australia: A political strategy analysis of the carbon pollution reduction scheme. Environ. Politics 2012, 21, 691–711. [Google Scholar] [CrossRef]
- Andrew, B. Market failure, government failure and externalities in climate change mitigation: The case for a carbon tax. Public Adm. Dev. 2008, 28, 393–401. [Google Scholar] [CrossRef]
- Newman, J.; Head, B.W. Categories of failure in climate change mitigation policy in Australia. Public Policy Adm. 2015, 30, 342–358. [Google Scholar] [CrossRef]
- Fang, C.C. Carbon Pricing: Correcting Climate Change’s Market Failure. Sustain. J. Rec. 2018, 11, 162–166. [Google Scholar] [CrossRef]
- Naz, S.; Sultan, R.; Zaman, K.; Aldakhil, A.M.; Nassani, A.A.; Abro, M.M.Q. Moderating and mediating role of renewable energy consumption, FDI inflows, and economic growth on carbon dioxide emissions: Evidence from robust least square estimator. Environ. Sci. Pollut. Res. 2019, 26, 2806–2819. [Google Scholar] [CrossRef]
- Zaman, K. The impact of hydro-biofuel-wind energy consumption on environmental cost of doing business in a panel of BRICS countries: Evidence from three-stage least squares estimator. Environ. Sci. Pollut. Res. 2018, 25, 4479–4490. [Google Scholar] [CrossRef]
- Apergis, N.; Jebli, M.B.; Youssef, S.B. Does renewable energy consumption and health expenditures decrease carbon dioxide emissions? Evidence for sub-Saharan Africa countries. Renew. Energy 2018, 127, 1011–1016. [Google Scholar] [CrossRef]
- Emir, F.; Bekun, F.V. Energy intensity, carbon emissions, renewable energy, and economic growth nexus: New insights from Romania. Energy Environ. 2019, 30, 427–443. [Google Scholar] [CrossRef]
- Doğan, B.; Driha, O.M.; Balsalobre Lorente, D.; Shahzad, U. The mitigating effects of economic complexity and renewable energy on carbon emissions in developed countries. Sustain. Dev. 2021, 29, 1–12. [Google Scholar] [CrossRef]
- Hasanov, F.J.; Khan, Z.; Hussain, M.; Tufail, M. Theoretical framework for the carbon emissions effects of technological progress and renewable energy consumption. Sustain. Dev. 2021, 29, 810–822. [Google Scholar] [CrossRef]
- Pata, U.K. Renewable energy consumption, urbanization, financial development, income and CO2 emissions in Turkey: Testing EKC hypothesis with structural breaks. J. Clean. Prod. 2018, 187, 770–779. [Google Scholar] [CrossRef]
- Kabir, E.; Kumar, P.; Kumar, S.; Adelodun, A.A.; Kim, K.H. Solar energy: Potential and future prospects. Renew. Sust. Energy Rev. 2018, 82, 894–900. [Google Scholar] [CrossRef]
- Farhani, S.; Ozturk, I. Causal relationship between CO2 emissions, real GDP, energy consumption, financial development, trade openness, and urbanization in Tunisia. Environ. Sci. Pollut. Res. 2015, 22, 15663–15676. [Google Scholar] [CrossRef]
- Salahuddin, M.; Alam, K.; Ozturk, I.; Sohag, K. The effects of electricity consumption, economic growth, financial development and foreign direct investment on CO2 emissions in Kuwait. Renew. Sust. Energy Rev. 2018, 81, 2002–2010. [Google Scholar] [CrossRef] [Green Version]
- Ali, H.S.; Law, S.H.; Lin, W.L.; Yusop, Z.; Chin, L.; Bare, U.A.A. Financial development and carbon dioxide emissions in Nigeria: Evidence from the ARDL bounds approach. Geo J. 2019, 84, 641–655. [Google Scholar] [CrossRef]
- Hashmi, R.; Alam, K. Dynamic relationship among environmental regulation, innovation, CO2 emissions, population, and economic growth in OECD countries: A panel investigation. J. Clean. Prod. 2019, 231, 1100–1109. [Google Scholar] [CrossRef]
- Ling Guo, L.; Qu, Y.; Tseng, M.L. The interaction effects of environmental regulation and technological innovation on regional green growth performance. J. Clean. Prod. 2017, 162, 894–902. [Google Scholar]
- Costantini, V.; Crespi, F.; Marin, G.; Paglialunga, E. Eco-innovation, sustainable supply chains and environmental performance in European industries. J. Clean. Prod. 2017, 155, 141–154. [Google Scholar] [CrossRef]
- Tian, P.; Lin, B. Promoting green productivity growth for China’s industrial exports: Evidence from a hybrid input-output model. Energy Policy 2017, 111, 394–402. [Google Scholar] [CrossRef]
- Yaduma, N. Investigating the oil curse in OECD and non-OECD oil-exporting economies using green measures of income. Environ. Dev. Sustain. 2018, 20, 2725–2745. [Google Scholar] [CrossRef]
- Carfora, A.; Pansini, R.V.; Romano, A.A.; Scandurra, G. Renewable energy development and green public policies complementarities: The case of developed and developing countries. Renew. Energy 2018, 115, 741–749. [Google Scholar] [CrossRef]


| Country | R&D Expenditures (USD Billions, PPP) | Country | R&D Expenditures (USD Billions, PPP) | Country | R&D Expenditures (USD Billions, PPP) |
|---|---|---|---|---|---|
| United States | 511.1 a | Turkey | 15.3 d | Thailand | 3.6 f |
| China | 451.9 a | Switzerland | 13.1 c | Hungary | 3.4 d |
| Japan | 165.7 a | Malaysia | 10.6 b | Ukraine | 3 e |
| India | 66.5 b | Singapore | 10 d | Pakistan | 2.4 e |
| Brazil | 38.4 c | Mexico | 9 d | New Zealand | 1.8 e |
| Canada | 25.7 d | Egypt | 6.2 e | Colombia | 1.6 d |
| Australia | 23.3 d | South Africa | 4.8 c | Chile | 1.5 d |
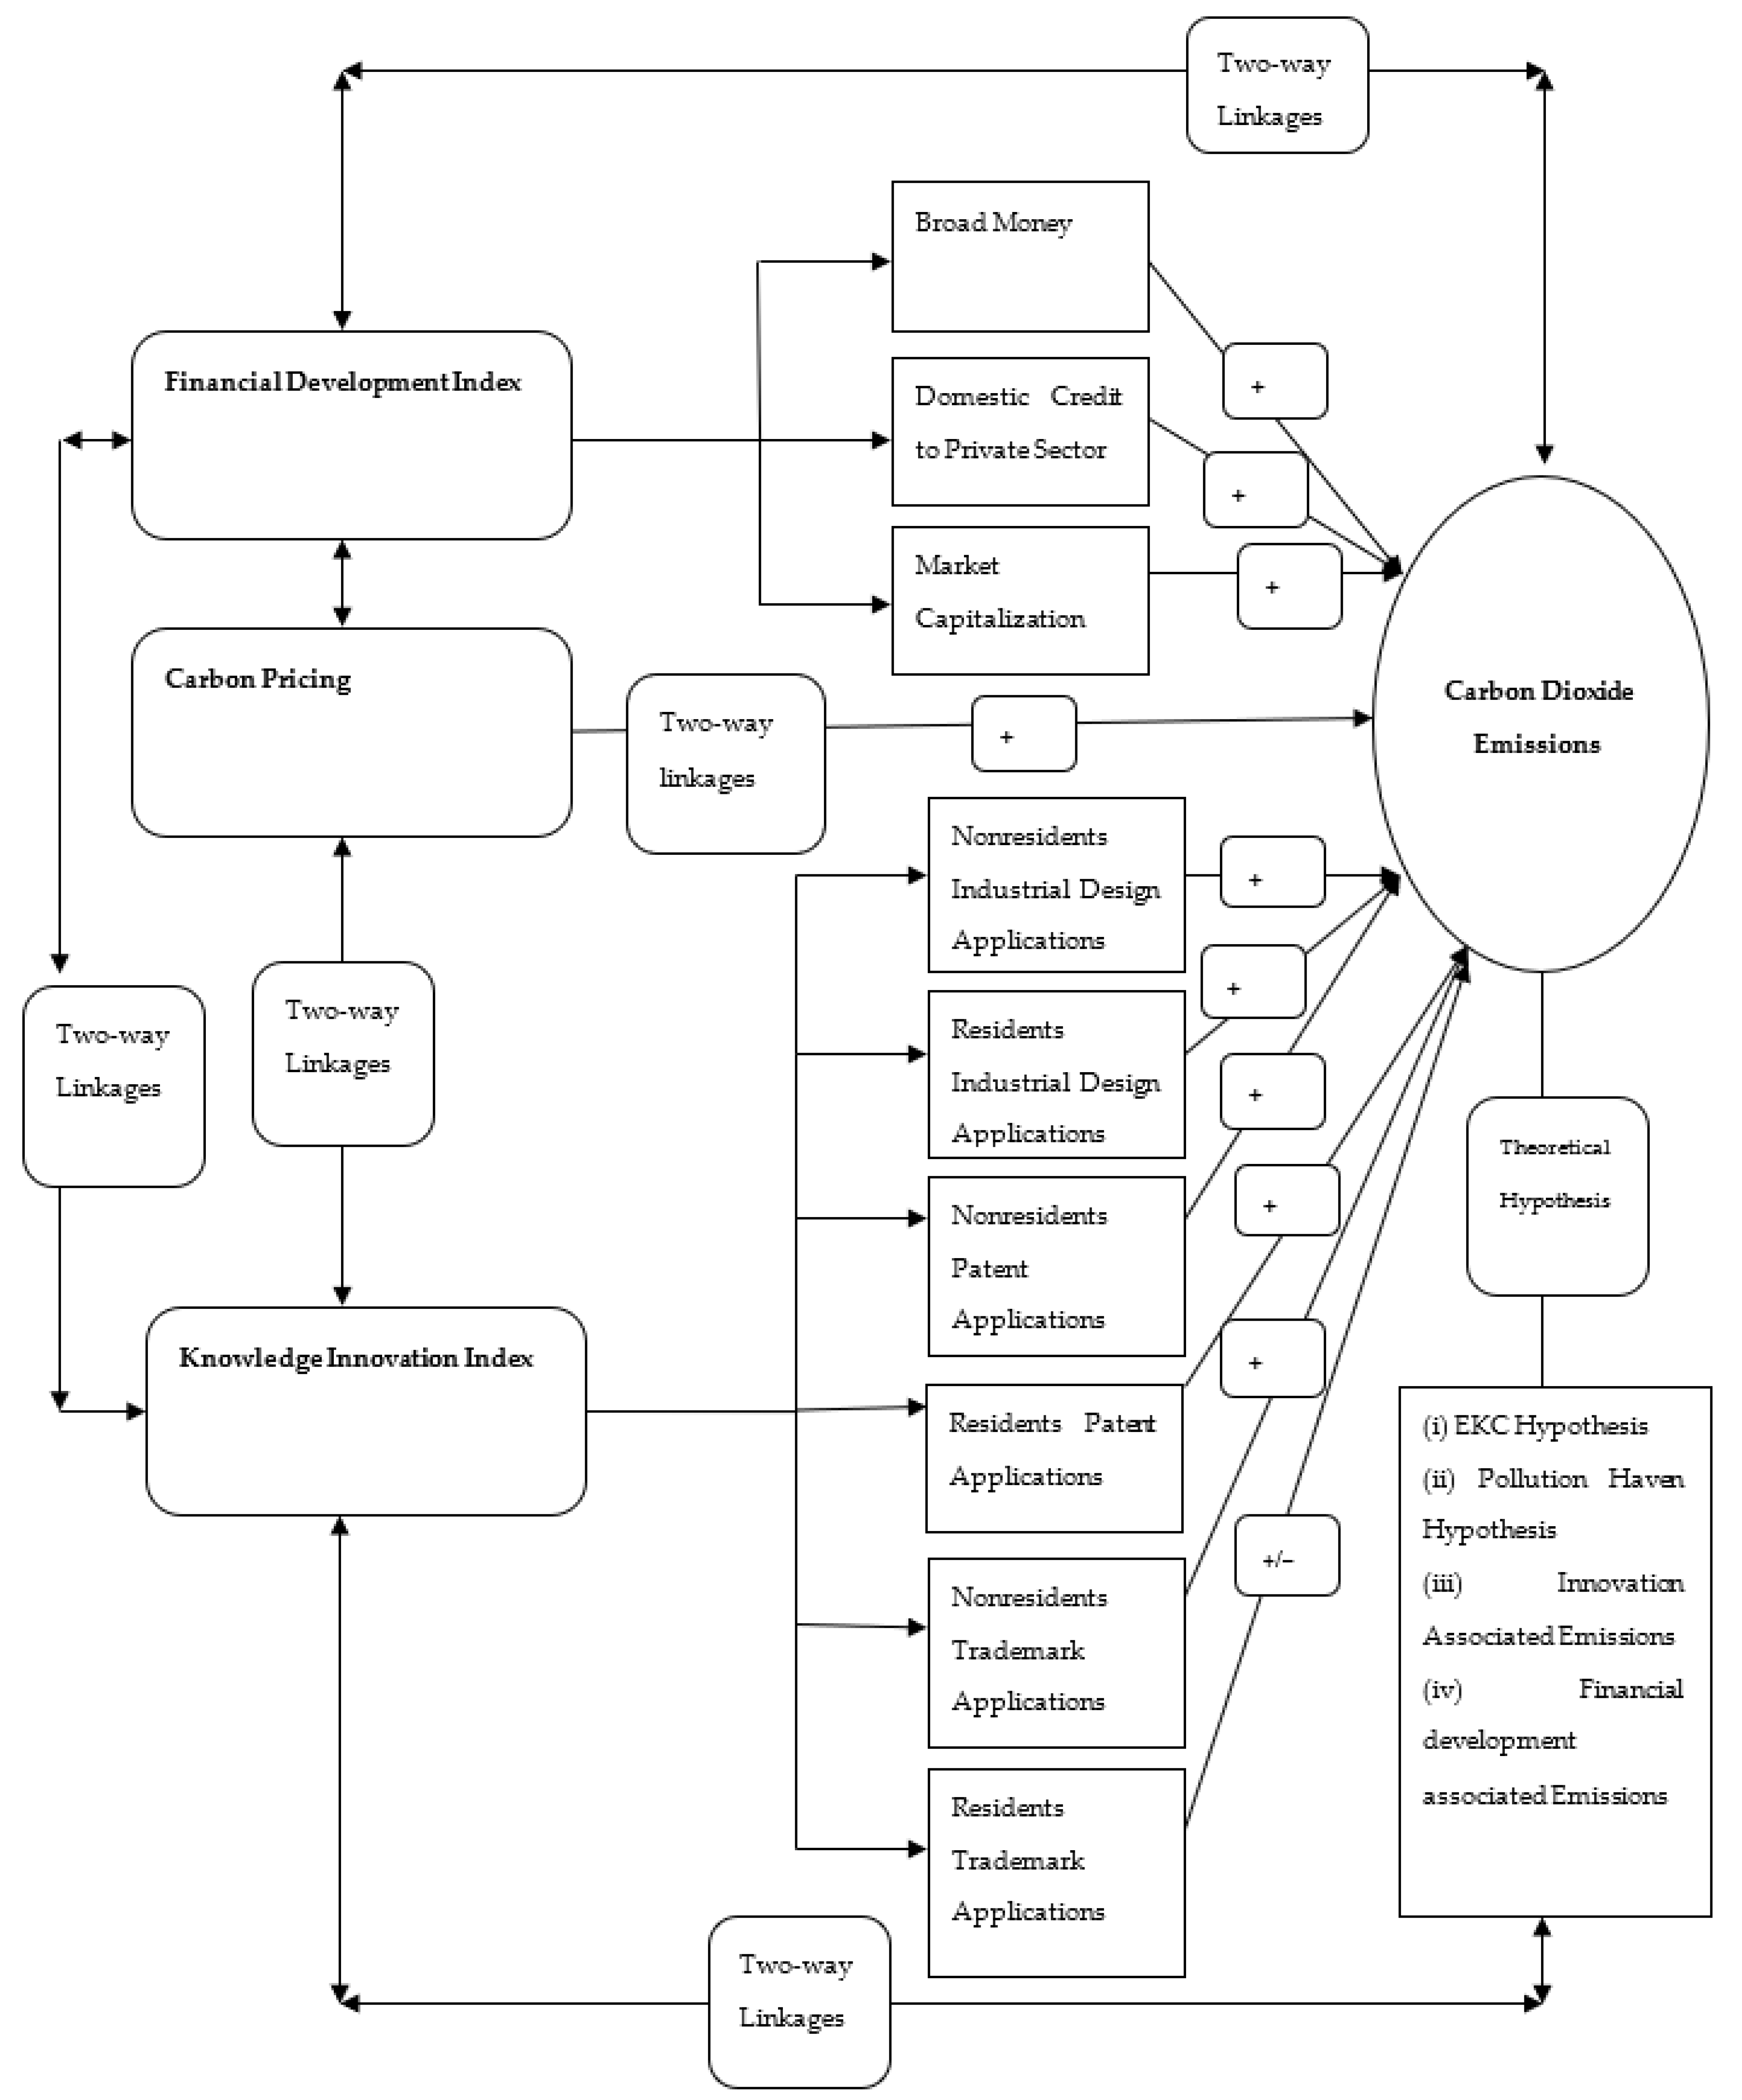
| Factors | Variables | Symbol | Measurement | Weighted Index/Theoretical Arguments |
|---|---|---|---|---|
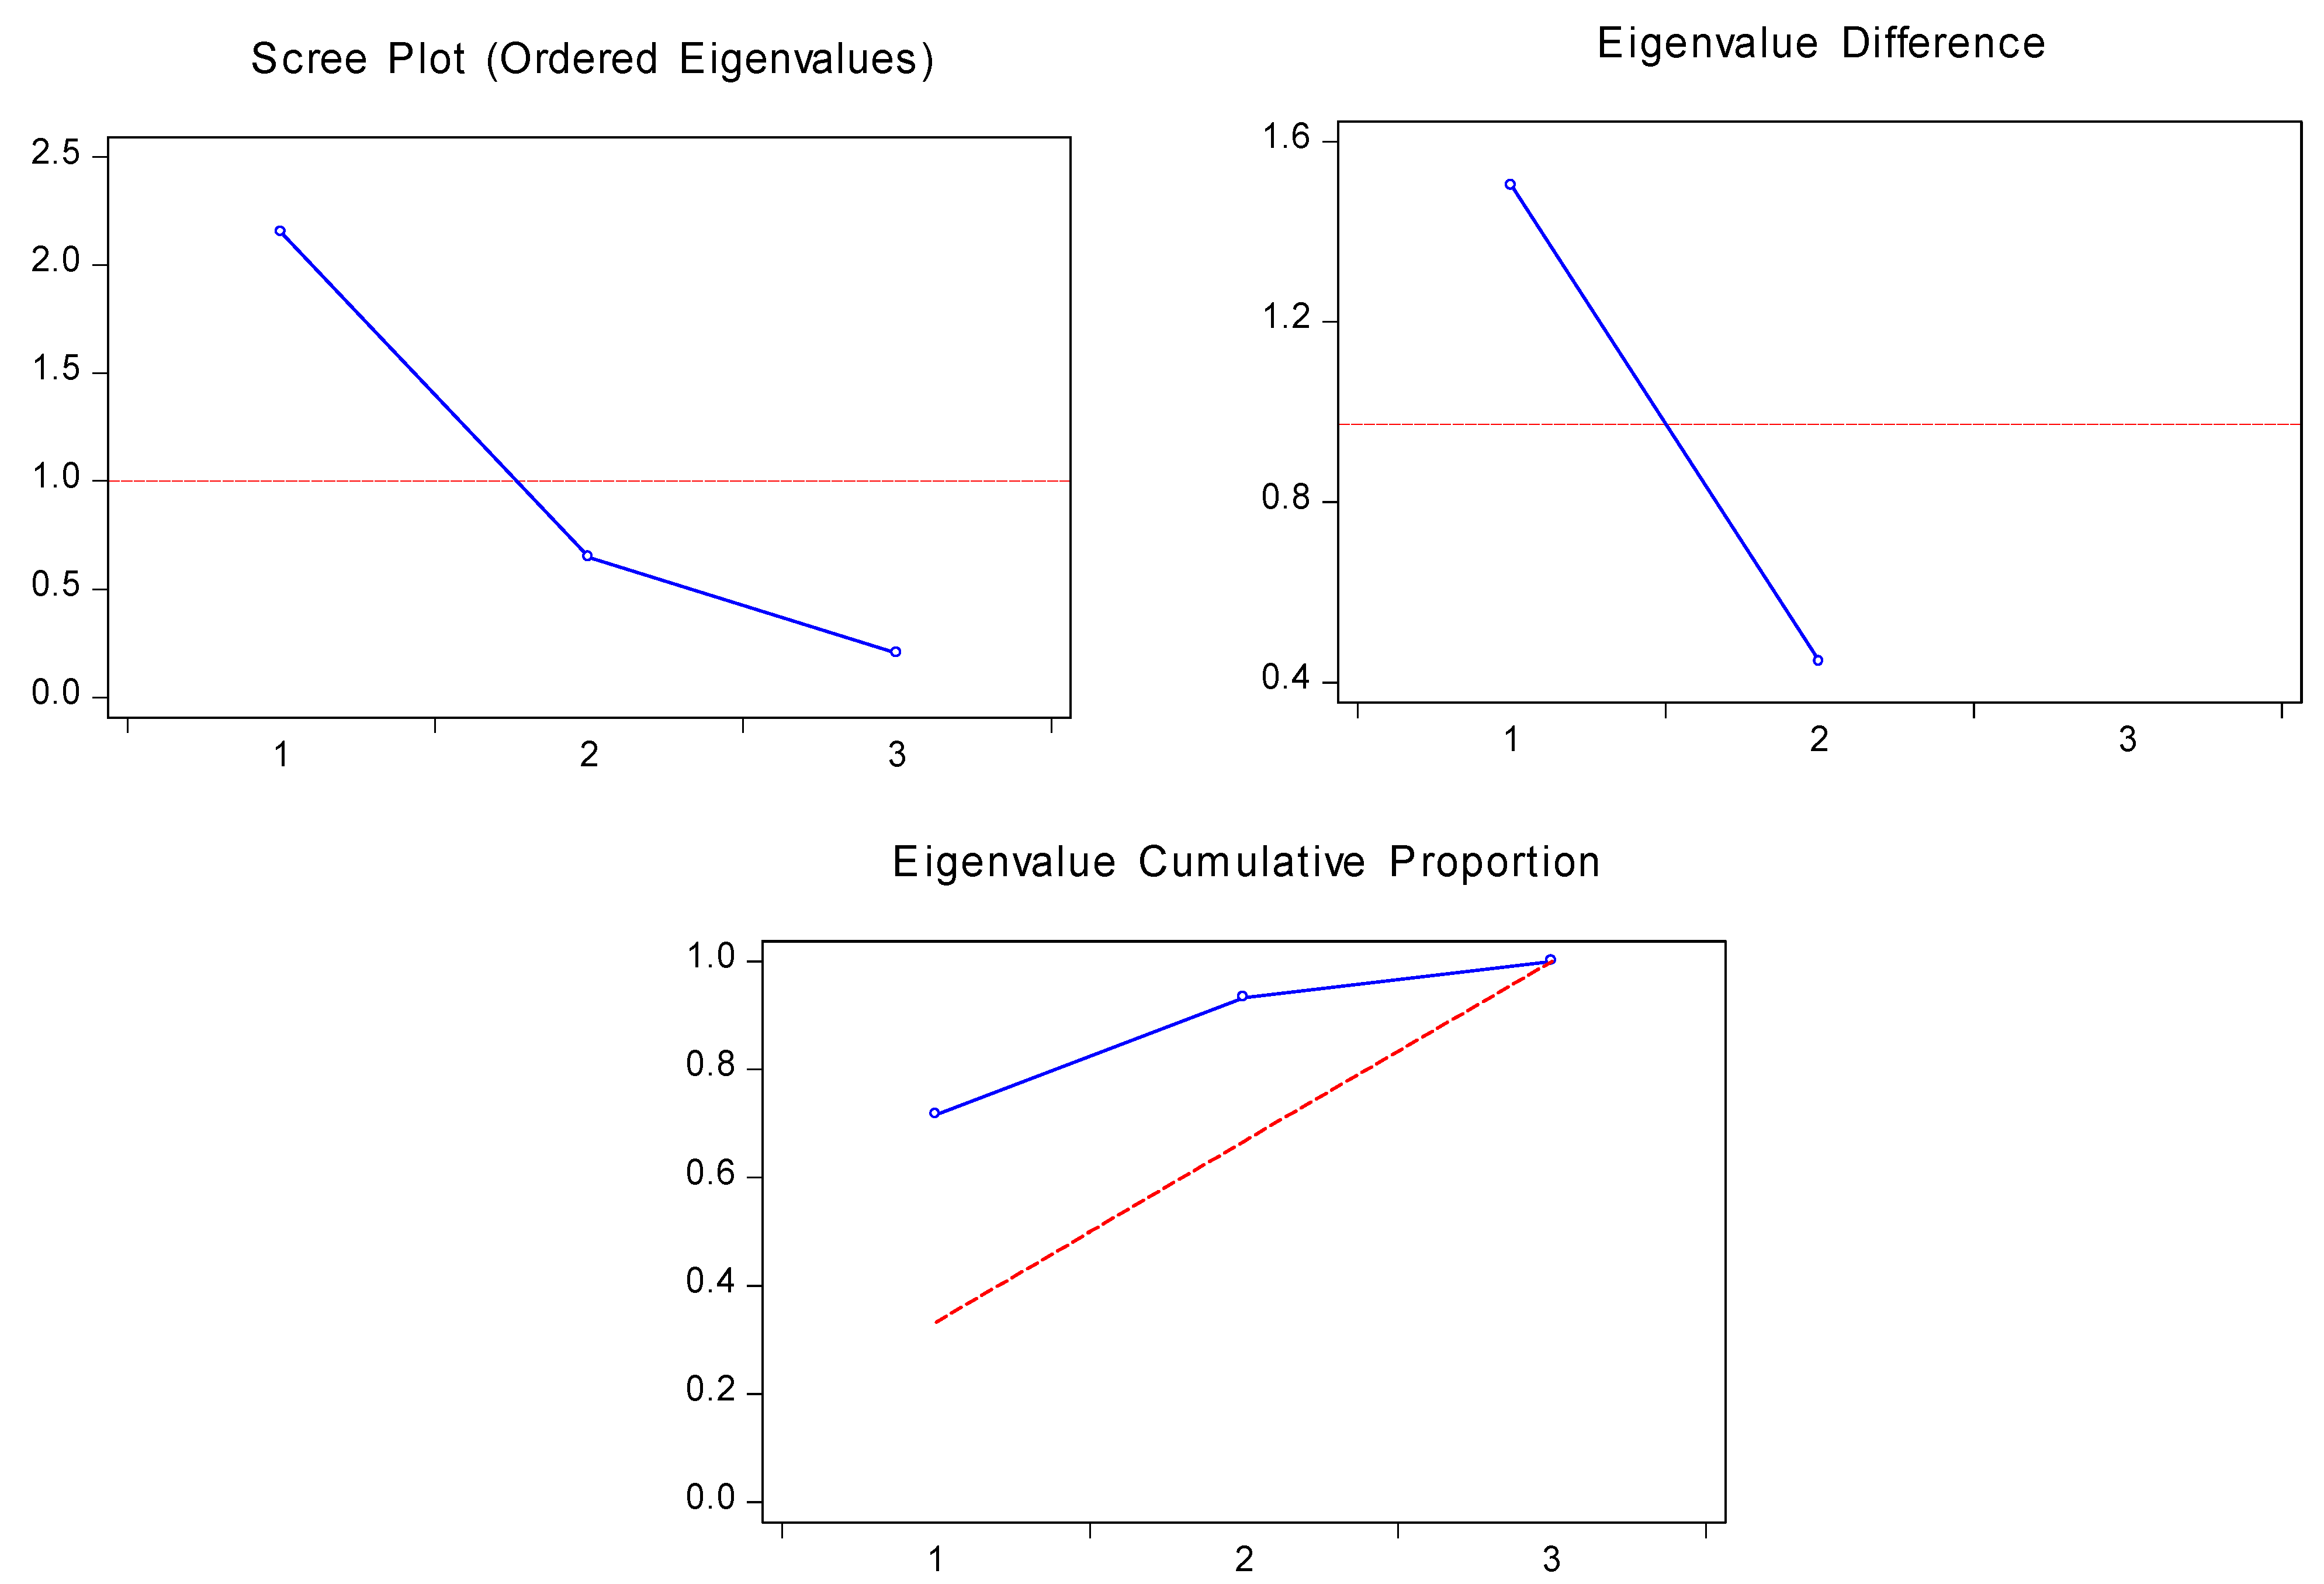
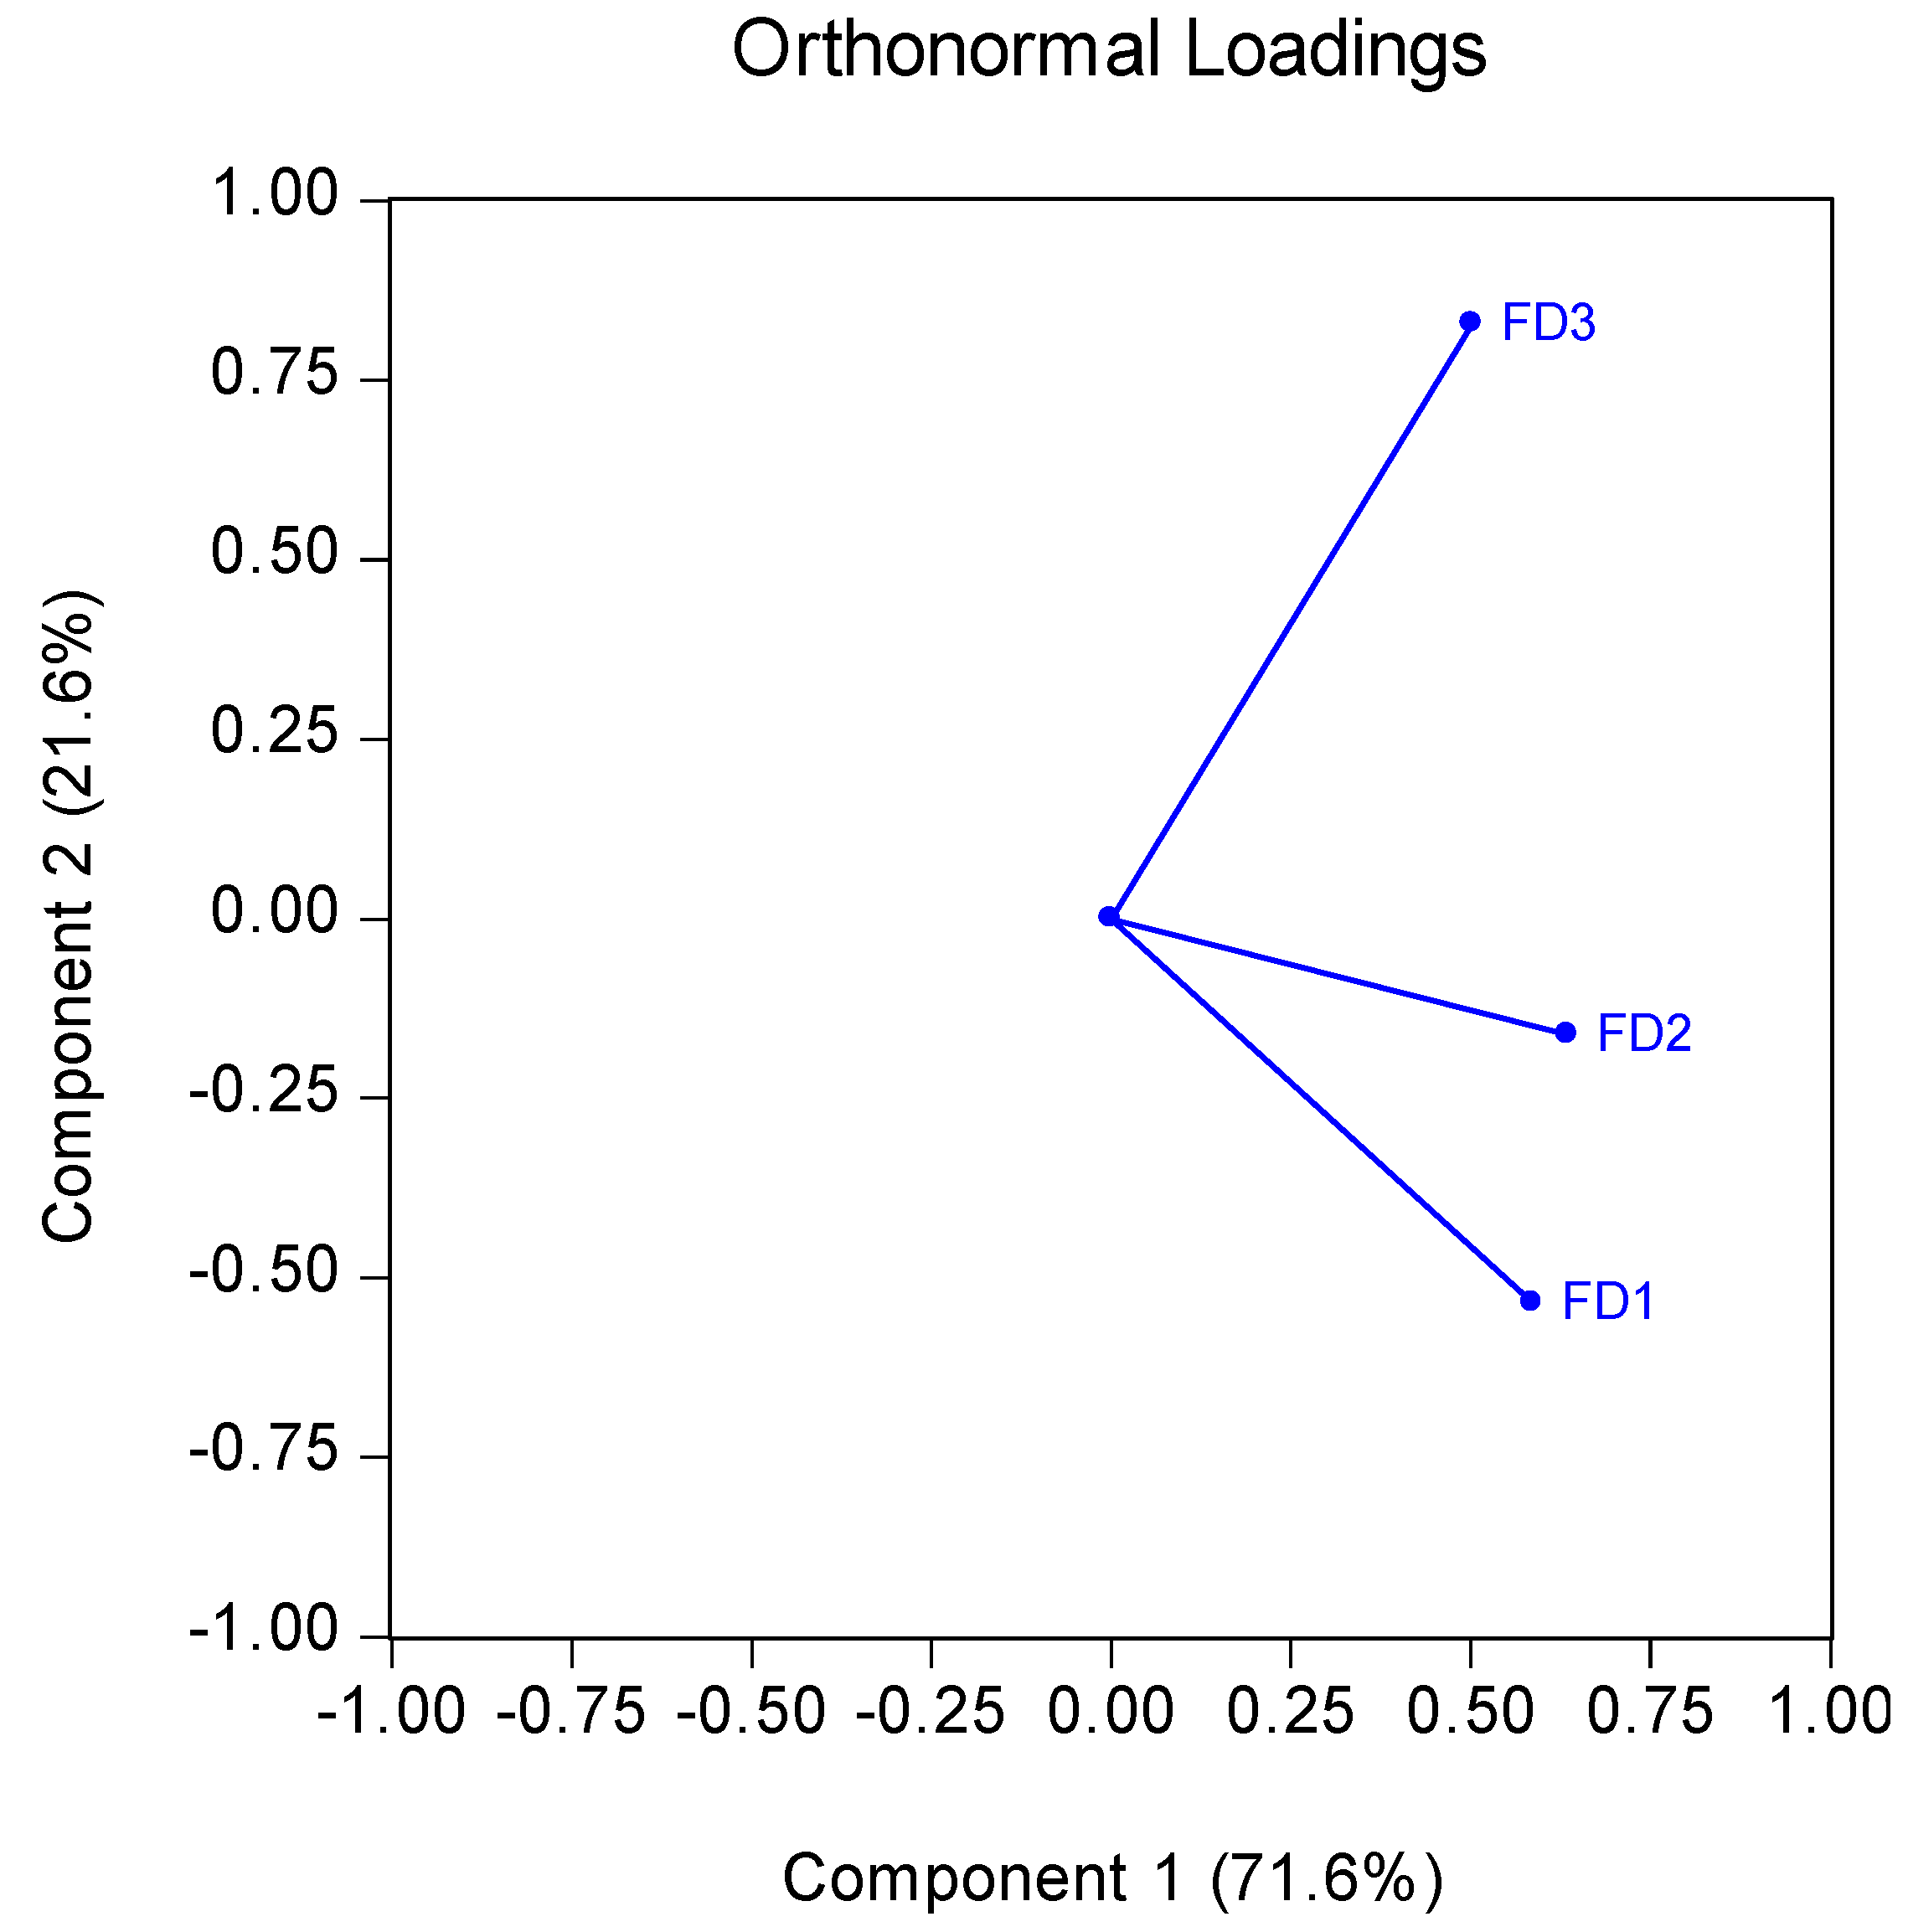
| Financial Development Indicators | Broad Money Supply | FD_1 | % of GDP | Financial Development Index (FDINDEX) construct based on FD_1, FD_2, and FD_3 to form a relative weighted index by Principal Component Analysis (PCA) |
| Domestic Credit to Private Sector | FD_2 | % of GDP | ||
| Market Capitalization of Listed Domestic Companies | FD_3 | % of GDP | ||
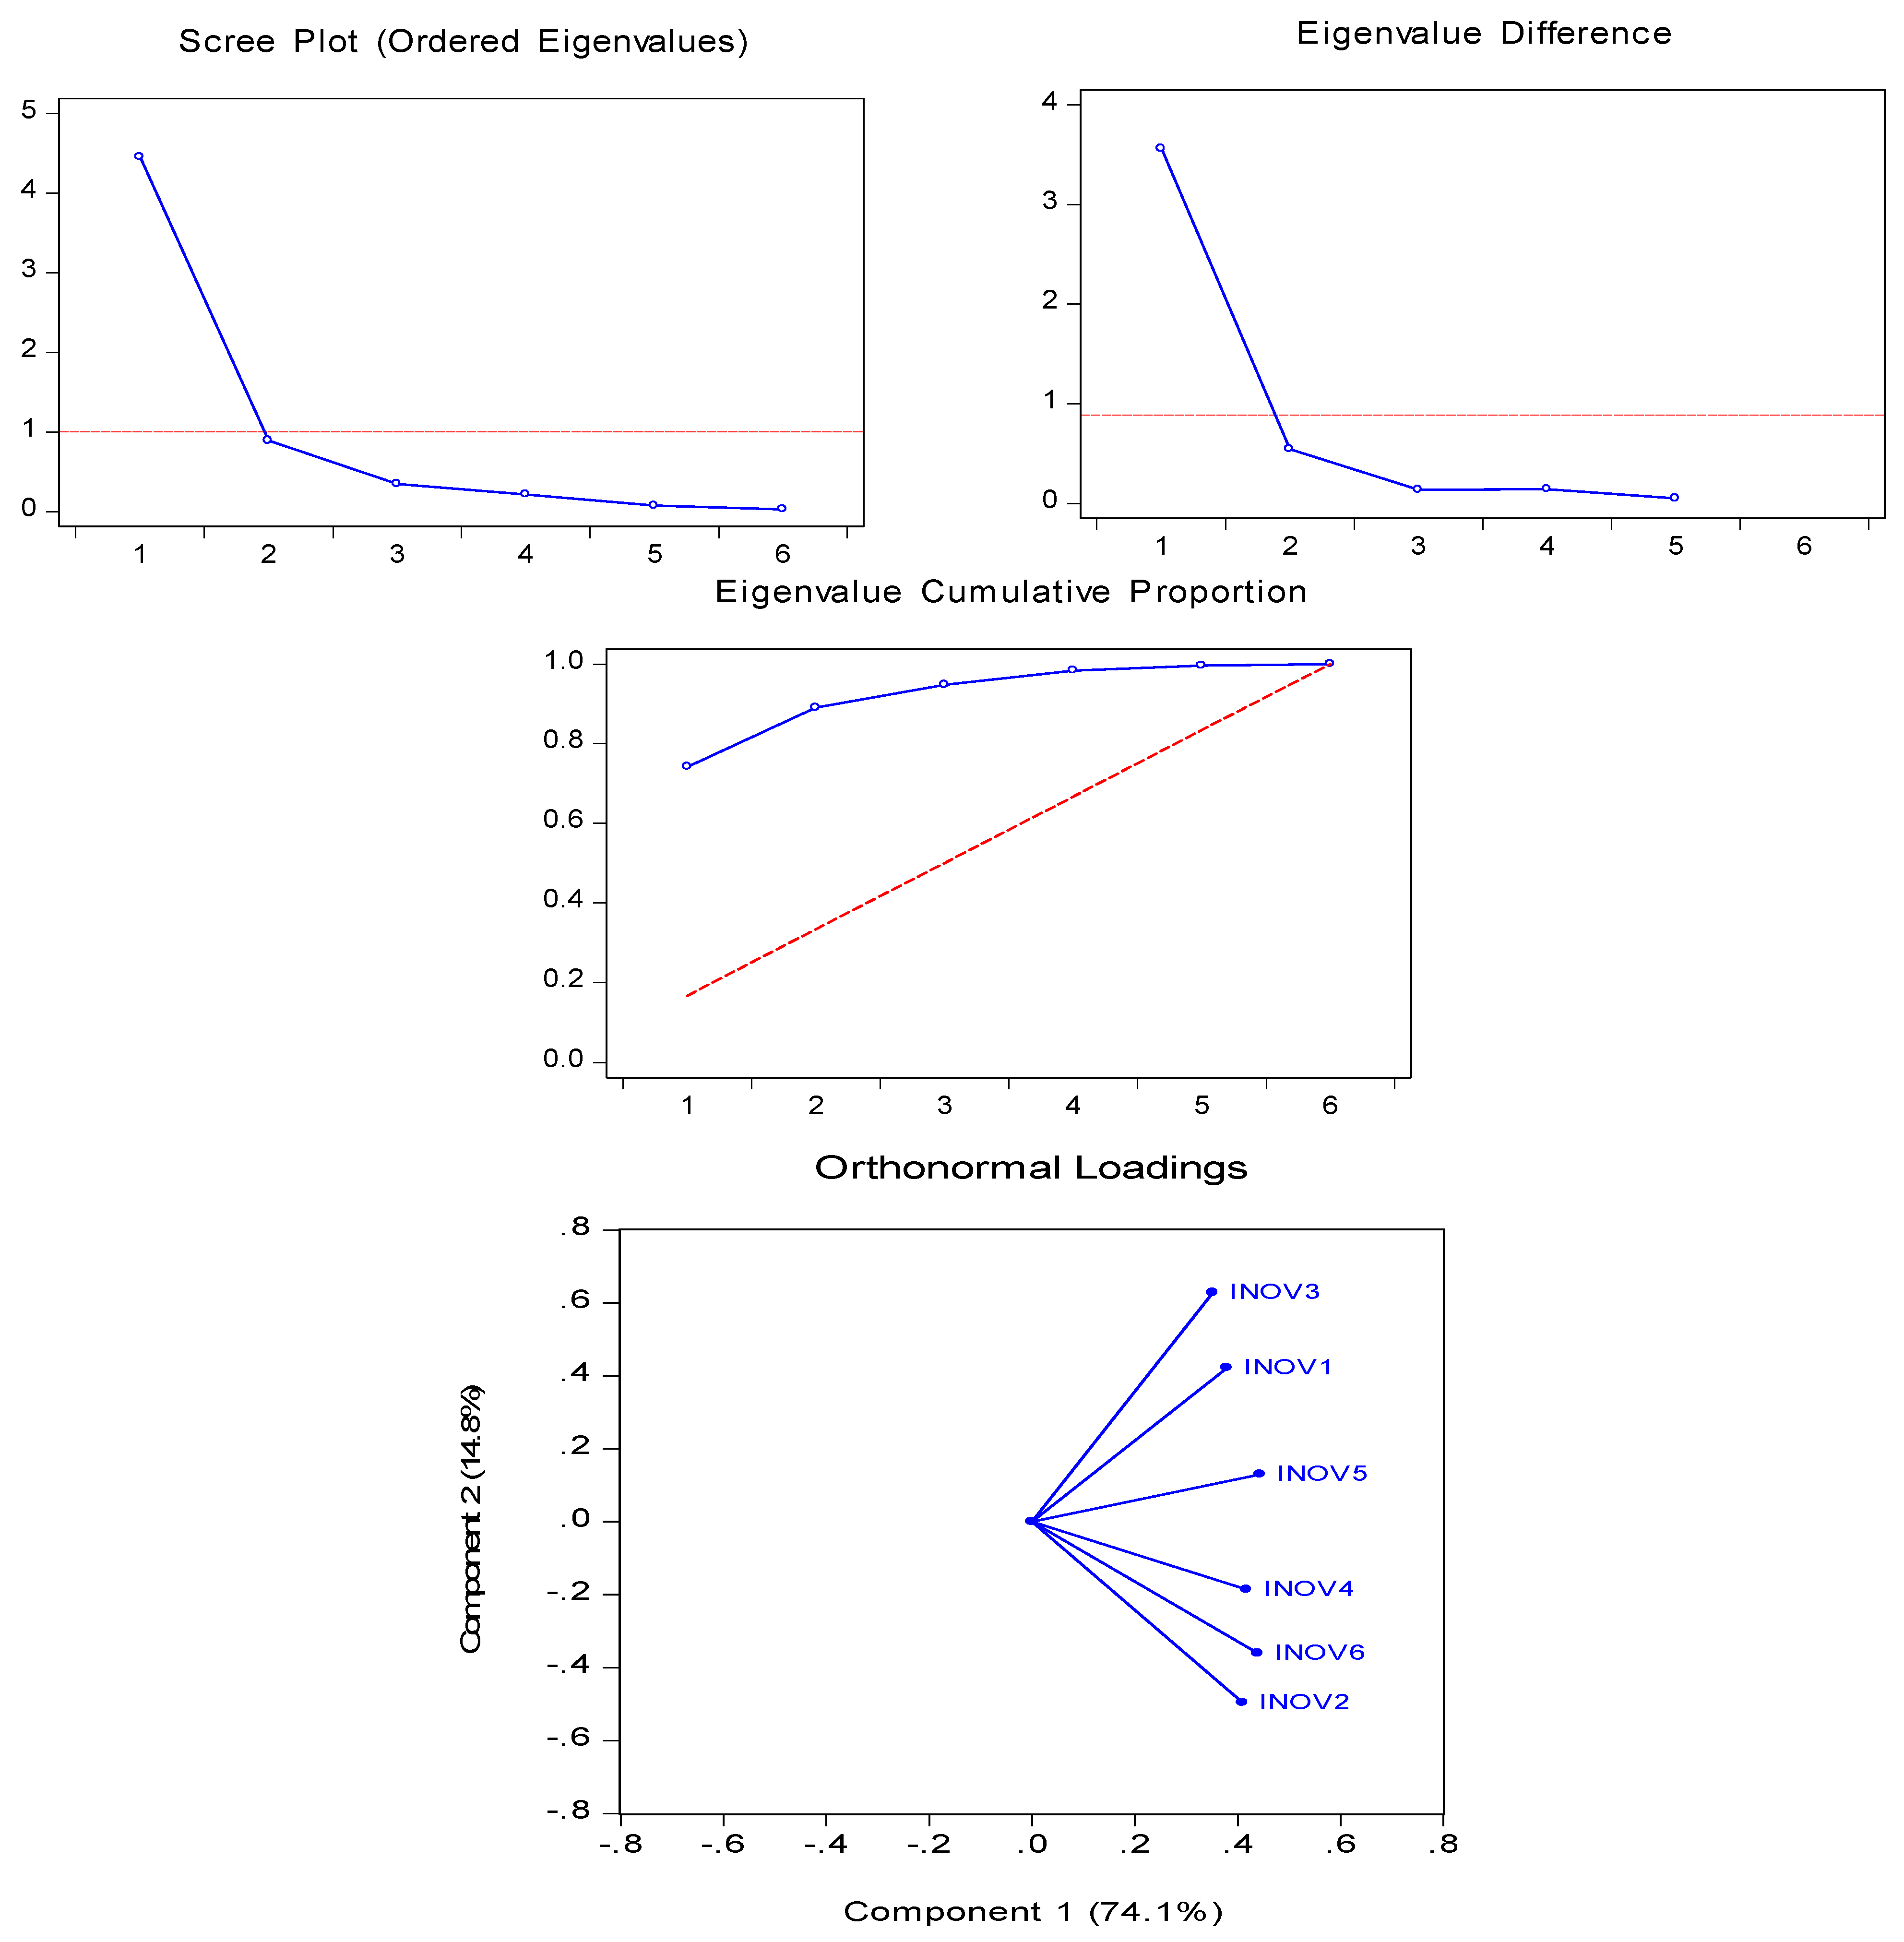
| Innovation Factors | Nonresidents Industrial Design Applications | INOV_1 | In number counts | Innovation Index (INOVINDEX) is constructed based on INOV_1 to INOV_6 to form a composite index by PCA. |
| Residents of Industrial Design Applications | INOV_2 | In number counts | ||
| Nonresidents Patent Applications | INOV_3 | In number counts | ||
| Residents Patent Applications | INOV_4 | In number counts | ||
| Nonresidents Trademark Applications | INOV_5 | In number counts | ||
| Residents Trademark Applications | INOV_6 | In number counts | ||
| Growth -Specific Factors | GDP Per Capita | GDPPC | Constant of 2010 USD |
|
| Square GDP Per Capita | SQGDPPC | Constant of 2010 USD | ||
| Energy Use | EUSE | Kg of oil equivalent per capita | ||
| Trade Openness | TOP | % of GDP | ||
| Environmental Factors | Carbon Dioxide Emissions | CO2 | Metric tons per capita | A carbon tax is used for measuring carbon pricing that helps to limit global carbon emissions stocks. |
| Carbon Pricing | CPRICE | CPI, annual % |
| Financial Development Factors | Eigenvalues | Eigenvectors (Loadings) | ||
| PC1 | PC2 | PC3 | ||
| FD_1 | 2.148 | 0.586 | −0.535 | 0.607 |
| FD_2 | 0.647 | 0.635 | −0.161 | −0.755 |
| FD_3 | 0.203 | 0.502 | 0.829 | 0.245 |
| Innovation Factors | Eigenvalues | Eigenvectors (Loadings) | ||
| PC1 | PC2 | PC3 | ||
| INOV_1 | 4.448 | 0.379 | 0.422 | −0.653 |
| INOV_2 | 0.889 | 0.409 | −0.495 | −0.193 |
| INOV_3 | 0.347 | 0.352 | 0.627 | 0.453 |
| INOV_4 | 0.214 | 0.417 | −0.186 | 0.561 |
| INOV_5 | 0.074 | 0.443 | 0.130 | −0.113 |
| INOV_6 | 0.025 | 0.439 | −0.360 | −0.039 |
| Methods | FD_1 | FD_2 | FD_3 | FDINDEX | INOV_1 | INOV_2 | INOV_3 | INOV_4 | INOV_5 | INOV_6 | INOVINDEX | CO2 | CPRICE | EUSE | GDPPC | TOP |
|---|---|---|---|---|---|---|---|---|---|---|---|---|---|---|---|---|
| Mean | 84.558 | 86.603 | 81.479 | 0.002 | 2907.222 | 15,924.88 | 20,558.63 | 40,169.72 | 16,285.71 | 74,167.93 | 3.03×10⁻¹⁷ | 6.652 | 54.172 | 2799.604 | 19,381.48 | 76.751 |
| Maximum | 252.102 | 221.288 | 352.845 | 3.624 | 22,313 | 644,398 | 313,052 | 1,245,709 | 117,567 | 1,997,058 | 7.702 | 20.178 | 4734.914 | 8455.547 | 78,816.22 | 437.326 |
| Minimum | 11.487 | 1.385 | 3.374 | −2.309 | 2 | 41 | 30 | 16 | 520 | 703 | −0.403 | 0.616 | −1.401 | 350.075 | 575.501 | 15.161 |
| Std. Dev. | 47.524 | 54.055 | 65.311 | 1.467 | 3659.654 | 73,398.46 | 45,621.28 | 132,565.7 | 16,842.26 | 223,395.6 | 1.0008 | 5.177 | 419.380 | 2164.787 | 20,346.47 | 74.353 |
| Skewness | 1.170 | 0.300 | 1.344 | 0.369 | 2.359 | 7.133 | 4.138 | 5.421 | 3.696 | 6.897 | 5.394 | 1.024 | 10.072 | 1.036 | 1.059 | 2.681 |
| Kurtosis | 4.207 | 1.938 | 4.500 | 2.041 | 9.277 | 55.231 | 22.180 | 40.984 | 19.715 | 55.304 | 36.434 | 3.036 | 107.776 | 3.166 | 2.891 | 10.542 |
| Variables | LLC | IPS | ADF | PP |
|---|---|---|---|---|
| Level | ||||
| CO2 | −1.967 ** | 0.338 | 37.580 | 36.613 |
| CPRICE | −6.987 * | −7.898 * | 150.938 * | 207.557 * |
| Breitung t-stat (CPRICE) | t-stat = −0.910 | Prob. value: 0.182 | ||
| EUSE | −2.019 ** | −0.163 | 53.965 | 48.667 |
| FDINDEX | −1.560 *** | −0.021 | 40.782 | 40.138 |
| GDPPC | 1.891 | 6.415 | 11.978 | 6.732 |
| INOVINDEX | −0.369 | 2.502 | 26.056 | 21.956 |
| TOP | −2.769 * | −1.217 | 47.894 | 40.507 |
| First Difference | ||||
| ∆CO2 | −8.905 * | −10.790 * | 196.339 * | 363.385 * |
| ∆CPRICE | −14.075 * | −16.128 * | 302.069 * | 503.999 * |
| Breitung t-stat (CPRICE) | t-stat = −9.190 * | Prob. value: 0.000 | ||
| ∆EUSE | −8.122 * | −10.237 * | 186.161 * | 334.634 * |
| ∆FDINDEX | −9.437 * | −13.404 * | 250.592 * | 427.118 * |
| ∆GDPPC | −5.115 * | −7.776 * | 148.475 * | 213.738 * |
| ∆INOVINDEX | −10.428 * | −12.939 * | 237.829 * | 368.726 * |
| ∆TOP | −10.731 * | −12.163 * | 222.352 * | 383.800 * |
| Panel Methods (within Dimensions) | Statistics | Group Methods (between Dimensions) | Statistics |
|---|---|---|---|
| v-Statistics | −3.852 | rho-Statistics | 5.065 |
| rho-Statistics | 2.995 | PP-Statistics | −6.360 * |
| PP-Statistics | −18.966 * | ADF-Statistics | −3.608 * |
| ADF-Statistics | −11.862 * | ||
| Kao Residual Cointegration Test | |||
| ADF t-Statistics | −5.494 * | Residual Variance | 0.256 |
| Johansen Fisher Panel Cointegration Test | |||
| No. of Cointegration Equations | Trace Test | Maximum Eigenvalue Test | |
| None | 918.5 * | 603.9 * | |
| At most 1 | 529.3 * | 255.0 * | |
| At most 2 | 311.8 * | 172.4 * | |
| At most 3 | 171.3 * | 103.9 * | |
| At most 4 | 95.91 * | 68.54 * | |
| At most 5 | 61.25 ** | 50.34 | |
| At most 6 | 65.99 * | 65.99 * | |
| Variables | FMOLS-1 | FMOLS-2 | FMOLS-3 | FMOLS-4 | FMOLS-5 |
|---|---|---|---|---|---|
| CPRICE | 0.000121 | 7.37 × 10⁻⁵ | 9.92 × 10⁻⁵ | 0.000777 * | 0.000231 |
| EUSE | 0.002353 | 0.002470 * | 0.002442 * | ----- | 0.002529 * |
| FDINDEX | 0.409379 * | 0.565516 * | ----- | 0.662272 * | ----- |
| INOVINDEX | 0.228078 * | ----- | 0.302764 * | 0.374210 * | 0.318359 * |
| GDPPC | −0.000150 * | −0.000143 * | −0.000118 * | 8.40 × 10⁻⁵ | −0.000153 * |
| SQGDPPC | 6.64 × 10⁻¹⁰ | 5.42 × 10⁻¹⁰ | 6.67 × 10⁻¹⁰ | −2.29 × 10⁻⁹ * | 9.42 × 10⁻¹⁰ *** |
| TOP | −0.017518 * | −0.018378 * | −0.015082 * | −0.021380 * | ----- |
| Statistical Tests | |||||
| R2 | 0.980 | 0.979 | 0.980 | 0.970 | 0.977 |
| Adjusted R2 | 0.979 | 0.978 | 0.979 | 0.968 | 0.976 |
| S.E of Regression | 0.735 | 0.756 | 0.744 | 0.910 | 0.794 |
| Long-run Variance | 1.189 | 1.257 | 1.248 | 2.138 | 1.513 |
| Variables | ∆∑CO2 | ∆∑CPRICE | ∆∑EUSE | ∆∑FDINDEX | ∆∑INOVINDEX | ∆∑GDPPC | ∆∑TOP | Joint Significance Test |
|---|---|---|---|---|---|---|---|---|
| ∆∑CO2 | ----- | 15.077 * | 6.941 ** | 8.716 ** | 7.267 ** | 4.791 | 1.827 | 41.199 * |
| ∆∑CPRICE | 6.074 ** | ----- | 0.712 | 17.405 * | 0.049 | 0.053 | 0.136 | 23.881 ** |
| ∆∑EUSE | 15.978 * | 30.138 * | ----- | 9.326 * | 2.988 | 2.382 | 8.991 ** | 76.587 * |
| ∆∑FDINDEX | 4.672 | 5.823 *** | 0.514 | ----- | 2.404 | 14.389 * | 4.652 | 27.763 * |
| ∆∑INOVINDEX | 0.111 | 0.023 | 0.057 | 8.749 ** | ----- | 3.149 | 0.400 | 12.531 |
| ∆∑GDPPC | 6.834 ** | 2.756 | 1.245 | 112.546 * | 2.270 | ----- | 35.278 * | 176.157 * |
| ∆∑TOP | 19.795 * | 7.492 ** | 0.120 | 34.900 * | 3.884 | 9.908 * | ----- | 80.714 * |
| Response of CO2 | |||||||
|---|---|---|---|---|---|---|---|
| Period | CO2 | CPRICE | EUSE | FDINDEX | GDPPC | INOVINDEX | TOP |
| 2019 | 0.540151 | 0.000000 | 0.000000 | 0.000000 | 0.000000 | 0.000000 | 0.000000 |
| 2020 | 0.466355 | −0.029529 | −0.048381 | 0.051259 | −0.036555 | 0.035983 | 0.018563 |
| 2021 | 0.452705 | −0.057029 | −0.026534 | 0.024820 | −0.049593 | 0.058182 | 0.022728 |
| 2022 | 0.432001 | −0.070740 | −0.017527 | 0.036125 | −0.048330 | 0.074380 | 0.016282 |
| 2023 | 0.421910 | −0.080519 | −0.008583 | 0.044419 | −0.049775 | 0.084510 | 0.011970 |
| 2024 | 0.411167 | −0.087806 | −0.001909 | 0.053207 | −0.051990 | 0.090602 | 0.008145 |
| 2025 | 0.401620 | −0.093233 | 0.004065 | 0.061132 | −0.054504 | 0.093379 | 0.004704 |
| 2026 | 0.392807 | −0.097204 | 0.009143 | 0.068925 | −0.057056 | 0.093595 | 0.001456 |
| 2027 | 0.384771 | −0.100113 | 0.013487 | 0.076420 | −0.059666 | 0.091815 | −0.001570 |
| 2028 | 0.377359 | −0.102239 | 0.017171 | 0.083625 | −0.062298 | 0.088504 | −0.004393 |
| Variance Decomposition of CO2 | ||||||||
|---|---|---|---|---|---|---|---|---|
| Period | S.E. | CO2 | CPRICE | EUSE | FDINDEX | GDPPC | INOVINDEX | TOP |
| 2019 | 0.540151 | 100 | 0 | 0 | 0 | 0 | 0 | 0 |
| 2020 | 0.719768 | 98.29833 | 0.168310 | 0.451817 | 0.507179 | 0.257929 | 0.249926 | 0.066513 |
| 2021 | 0.856703 | 97.30914 | 0.561929 | 0.414854 | 0.441935 | 0.517168 | 0.637648 | 0.117331 |
| 2022 | 0.967117 | 96.31151 | 0.975967 | 0.358380 | 0.486314 | 0.655559 | 1.091858 | 0.120413 |
| 2023 | 1.063774 | 95.33482 | 1.379598 | 0.302722 | 0.576312 | 0.760776 | 1.533588 | 0.112185 |
| 2024 | 1.149868 | 94.37947 | 1.763856 | 0.259363 | 0.707353 | 0.855552 | 1.933373 | 0.101032 |
| 2025 | 1.227866 | 93.46847 | 2.123431 | 0.228555 | 0.868216 | 0.947349 | 2.273906 | 0.090071 |
| 2026 | 1.299327 | 92.60932 | 2.455946 | 0.209057 | 1.056732 | 1.038835 | 2.549544 | 0.080562 |
| 2027 | 1.365408 | 91.80350 | 2.761583 | 0.199068 | 1.270176 | 1.131673 | 2.760915 | 0.073085 |
| 2028 | 1.426959 | 91.04786 | 3.041824 | 0.196744 | 1.506403 | 1.226753 | 2.912555 | 0.067864 |
Publisher’s Note: MDPI stays neutral with regard to jurisdictional claims in published maps and institutional affiliations. |
© 2021 by the authors. Licensee MDPI, Basel, Switzerland. This article is an open access article distributed under the terms and conditions of the Creative Commons Attribution (CC BY) license (https://creativecommons.org/licenses/by/4.0/).
Share and Cite
Anser, M.K.; Abbas, S.; Nassani, A.A.; Haffar, M.; Zaman, K.; Abro, M.M.Q. Innovative Carbon Mitigation Techniques to Achieve Environmental Sustainability Agenda: Evidence from a Panel of 21 Selected R&D Economies. Atmosphere 2021, 12, 1514. https://0-doi-org.brum.beds.ac.uk/10.3390/atmos12111514
Anser MK, Abbas S, Nassani AA, Haffar M, Zaman K, Abro MMQ. Innovative Carbon Mitigation Techniques to Achieve Environmental Sustainability Agenda: Evidence from a Panel of 21 Selected R&D Economies. Atmosphere. 2021; 12(11):1514. https://0-doi-org.brum.beds.ac.uk/10.3390/atmos12111514
Chicago/Turabian StyleAnser, Muhammad Khalid, Shujaat Abbas, Abdelmohsen A. Nassani, Mohamed Haffar, Khalid Zaman, and Muhammad Moinuddin Qazi Abro. 2021. "Innovative Carbon Mitigation Techniques to Achieve Environmental Sustainability Agenda: Evidence from a Panel of 21 Selected R&D Economies" Atmosphere 12, no. 11: 1514. https://0-doi-org.brum.beds.ac.uk/10.3390/atmos12111514