
An Overview of Experiences Made and Tools Used to Inform the Public on Ambient Air Quality


1
National Research Council—Institute of Atmospheric Pollution Research (CNR-IIA), Monterotondo, 00015 Rome, Italy
2
National Research Council—Institute of Atmospheric Pollution Research (CNR-IIA) c/o Ministry of Ecological Transition, 00147 Rome, Italy
3
Department of Environmental Health Engineering, Faculty of Public Health, Sri Ramachandra Institute of Higher Education and Research (DU), Chennai 600116, Tamil Nadu, India
*
Author to whom correspondence should be addressed.
Atmosphere 2021, 12(11), 1524; https://0-doi-org.brum.beds.ac.uk/10.3390/atmos12111524
Submission received: 18 October 2021
/
Revised: 12 November 2021
/
Accepted: 14 November 2021
/
Published: 18 November 2021
(This article belongs to the Special Issue Air Quality Assessment and Management)
Abstract
:Legislative regulations on atmospheric pollution have been established in different parts of the world for addressing air quality management. An important public commitment, common among all nations, is to ensure environmental safety and health protection, particularly for the most fragile population groups. Each country has its own rules and practices to provide adequate and timely information on ambient air quality. Information is given either through easily accessible media, including websites and apps, or by traditional means of telecommunication. An air quality index (AQI) is definitely a valuable tool for disseminating data on the main regulated pollutants and represents a readable indicator of the prevailing situation of air quality in the area. Several calculating expressions were formulated to combine, in a unique value, different parameters, and a few methods were created to determine and compare different AQIs. This paper gives almost a global overview of approaches and tools used to inform the public about the status of the ambient air quality. Different AQIs are analyzed to contribute to the sharing of air quality management practices and information to raise public awareness and to help policymakers to act accordingly.
1. Introduction
It is generally recognized that air pollution is one of the most relevant causes of negative impacts on human health. According to the World Health Organization (WHO), it is linked to several health problems, including cardiovascular illness, stroke, respiratory disease, and cancer; outdoor air pollution led to approximately 4.2 million deaths globally in 2016, with most of this disease burden registered in developing countries [1]. Clear evidence of high morbidity and mortality due to air pollution comes also from the yearly report titled “Air quality in Europe” produced by the European Environmental Agency (EEA); according to the 2020 report, in Europe the number of premature deaths associated with particulate matter (PM2.5) concentrations in 2018 is about 379,000 while the numbers associated to nitrogen dioxide and ozone concentrations are, respectively, 54,000 and 19,400 [2].
Considering the huge impact of air quality on human health, it is really necessary to implement all possible policies and measures to reduce air pollutant emissions, but also to inform the people on the levels of pollution in the places where they live, on the associated health risks, and on what they can do in order to reduce their exposure and to contribute to a general reduction of the pollution levels.
To such an extent, all countries use a set of instruments and media in order to spread data and information on air quality, both in terms of assessed concentrations and reduction measures. Many countries publish a complete set of data and information on the methodologies applied to monitor air pollution. The tools used can include traditional media, but also websites, social media, and mobile apps. In most countries, rules are also set to assure public access to environmental information as a relevant obligation according to the principles of the Aarhus Convention; in such a way, information on air quality is completely shared with the public and the communication between the public and administrations is improved [3].
A simple and useful tool worldwide used to inform the general population about the state of air quality is an air quality index (AQI), which is described as “a communication tool and a standardized summary measure of ambient air quality used to express the level of health risk related to particulate and gaseous air pollution” [4]. The purpose of the AQI is to inform people about the air quality so they can take steps to protect their health. The index is also useful to compare the spatial and temporal patterns of air quality, to implement prediction systems, and to give early warnings to the population in case of high levels of pollution [5]. To reach most of the people, it is important to try to deliver the AQI in as many ways as possible, and web applications are the main solution to disseminate information.
In many cases, readable and colored formats are used in order to show the messages correlated to the AQIs, and interactive maps are also available. A web-based approach is, for instance, described by Sharma et al. to provide information on the Indian AQI; it is designed to make comparisons between the AQI calculated at different locations and on different dates, to calculate the AQI for past and current data and to forecast it [6].
Several apps are also available to give simple information on air quality to the public. They are an easy way to have updated and localized information; they can also include alerts in case of exceedances and behavioral suggestions for vulnerable people. The choice of data used to feed the apps is really important; AirForU, (v. 1.5(6) of 1 January 2016) for instance, is based on Environmental Protection Agency (EPA) data [7] and gives information both on air quality and the possible related health effects. Information can be also automatically associated with the zip code of the user. Apps giving information based on reliable data can be useful in order to spread easy and rapid information to the public, but also to boost the interest in such information and to increase public awareness on this issue, thanks to the typical characteristics of these tools that are used to share information. In some cases, such applications are also fed by data directly provided by citizens or local institutions such as schools, universities, and hospitals, through low-cost sensors [8].
Currently, most AQIs implemented by authorities, such as those applied in the USA and China, are based on one pollutant rather than representing the overall air condition, which may greatly underestimate the impact of multiple contaminants [9].
A series of AQIs that rely on various subindicators, calculation, and aggregation methods have been formulated based on local air quality conditions as well as national standards to accommodate differences in air characteristics and management requirements among countries. There are many studies in literature analyzing different types of air quality indexes [10,11,12,13,14,15] with the aim of finding a way to compare them and often to reach a proposal for a general index to be used worldwide. It is quite difficult to use the existing indexes as they are to make comparisons at an international level due to the sensible differences among them.
The indexes can be calculated applying different methodologies, but from a general point of view, there are some common criteria that should be considered when elaborating an index. First of all, it should be easily understandable by the public and therefore able to describe the air quality status in simple terms, especially when describing the possible impacts of pollutants on human health. It should consider all relevant pollutants and possibly their synergies and be related to the official national standards. It is important that the index is based on valid and official air quality data, describing the general exposure of the population. In order to avoid false alarms or unclear situations, it should be strictly linked to the possible exceedances of the standards established to protect human health [13].
The major AQIs can be described by dividing them into two categories: single- and multi-contaminant-oriented AQIs [10]. Single-contaminant-oriented AQIs are determined by the maximum value of individual pollutants while multi-contaminant-oriented AQIs take into account multiple effects due to the exposure to more pollutants. Indexes of the latter category give more complete information on the possible impacts of air pollutants on health even if they are more complex and less comparable.
In some countries, the information given through the air quality index is integrated with an air quality health index (AQHI) that is directly connected with the effects that air pollution can produce on human health. It seems that a multi-pollutant index based on data on morbidity associated with the levels of air pollutants is a proper tool to protect people from exposure to multiple air pollutants [9].
Since the air pollution index is intended to inform the general population about the state of air quality, the effectiveness of the tools used to disseminate information concerning the AQI is important in achieving the goal of public knowledge; therefore, to test the population awareness on the availability of these tools and their possible use, some studies were carried out by performing ad-hoc surveys on individuals’ familiarity with the air quality index. A specific study was carried out by Beaumont in the United Kingdom in which a survey was conducted on these issues by sending a questionnaire to the general public about their information needs on the theme of air quality and questioning interested professionals and information providers through a one-day workshop on the same topics. The main outcomes of this analysis were that the public needs “local” information concerning the area where they live, but they chose the most popular and reliable mass media as information sources even though those sources normally provide data on a larger spatial scale [16].
In Qian, the results of a similar survey conducted in Ningbo, a town south of Shanghai, was reported. It was found that the main sources of information concerning air pollution were television and the internet, which has replaced books and newspapers. The variables that most affected the degree of awareness on this topic were age and occupation. The highest awareness rate was characteristic of the age range 14–29 years and among students. In this study, 85% of the residents were informed about the air quality index [17].
Borbet reported on such a study in the Mexico City Metropolitan Area where individuals were selected via probability sampling and contacted by phone to get information on their knowledge on the air quality index, the level of pollution, and individual behaviors. In general, high awareness on the air quality index was assessed (53%), with the highest scores in urban areas, mainly among older and more educated people and when the information was conveyed by healthcare providers [18].
In Magaña Villegas [19], a web portal was designed as a proper tool for the communication of air quality in the framework of a study on the air quality conducted in Villahermosa, Tabasco, southeast of Mexico City. The site is meant to provide information both to the academic community and to the population, with the aim to protect them from high levels of pollution.
Generally, many countries publish information about AQIs on their official websites, but there are also plenty of non-official websites where it is possible to find global AQIs calculated in order to give information on air pollution across the whole world; it has to be underlined that such indexes are calculated applying different methodologies and using different kinds of data gathered by many sources. It is therefore important to be aware of using official or non-official sources when the AQIs are employed for different purposes or further disseminated.
2. Materials and Methods
The analysis includes the official AQIs used by different countries to inform the population of the air quality status so that they can have official and reliable information on the levels of pollution they are exposed to and on possible risks for their health. All the selected AQIs are therefore the institutional ones, calculated based on official and validated data. The countries considered in this work, reported in Section 2.1, are distributed in Europe, America, Asia, and Australia and selected to give a quite wide picture of different AQIs used.
In Section 2.2, several calculation methods, found in scientific literature concerning AQIs, are summarized.
2.1. Analysis of Different Countries’ AQIs
There are different indexes developed in Europe both at the institutional level and as a result of research studies. Some details are reported for the United Kingdom, Spain, France, and Germany. The harmonized index developed by European Union is also described and used as the main reference for the whole of Europe.
Many American countries are also investigated and, in particular, the United States and Canada for North America, and Mexico, Argentina, Bolivia, Brazil, Chile, Colombia, Paraguay, Peru, Uruguay, and Venezuela for Latin America. Some similarities have been found in the choices made by some countries, and mainly the USA Environment Protection Agency (EPA) general methodology was implemented in some Latin American countries.
For some Asian countries, it was quite difficult to find all necessary information, but air quality indexes applied in India, Korea, China, and Thailand are reported, observing that also in this area some USA EPA choices are used as a reference.
Finally, a section on Australia is also reported.
For each country, information on the applied air quality standards is given in order to have a picture of the main pollutants considered as relevant for the calculation of the indexes and to know which values are chosen as a reference for their calculation. A description of the air quality index is then reported with indications on the pollutants used, their averaging times, unit of measures, and criteria applied to calculate it. Additional details concerning the visual representation of the indexes, the associated health messages, and the tools used to spread information to the public is given. Starting from such a description, some comparisons on the AQIs are made reporting the points of contact and the differences among them and underlining the different ranges of concentrations associated with the health messages given to the population for nitrogen dioxide (NO2), sulphur dioxide (SO2), particulate matter (PM10, PM2.5), ozone (O3), and carbon monoxide (CO).
As a complementary comparison of the AQI values and classes, the methodology of normalization described by Lokys [20] was applied. This methodology, based on a two-stage normalization procedure, was applied by Lokys to three European AQIs and by Karavas [3] to six European AQIs to make the index values directly comparable. The AQI normalization in both works is based on European guideline values, while in this work, after a comprehensive study of national standards almost worldwide, the USA standards were chosen as reference values (or benchmarks).
Data and information on each country are summarized in the following paragraphs.
2.1.1. Europe
A recent comparative study of air quality indexes in the European Union [3] selected some European cities (Rome, Madrid, Paris, London, Berlin, Warsaw, Stockholm, and Oslo) and calculated for them different air quality indexes starting from the row data downloaded by the European air quality database. The main pollutants were included (CO, NO2, SO2, O3, PM10, and PM2.5) and the most relevant for each city was determined. The statistical correlation among the indexes was analyzed, and different results were found in the different cities. The results were clear that the application of a unique AQI is necessary to ensure a common way of assessing and improving the quality of the atmosphere in Europe.
At national level, looking at the institutional websites it is also possible to collect information on the air quality indexes used in many countries. In this case it is also clear that some differences appear in the type of index implemented in terms of selected pollutants, averaging periods, concentration ranges, and classes of air quality chosen.
An overview on the indexes used in a few European Countries is given to have a look at the mentioned differences. The United Kingdom, Spain, France, and Germany have been considered. The harmonized AQI used for the countries joining the European Union is then described and used as the main reference for our study.
The United Kingdom applies a Daily Air Quality Index (DAQI, Table S1), calculated for the following pollutants: NO2, SO2, O3, and particulate matter (PM2.5 and PM10). The DAQI for a site or a region is determined by the highest concentration of the mentioned pollutants and also provides health advice, suggesting recommended actions to take according to the level of air pollution. The index is numbered from 1 to 10 and divided into four bands (low, moderate, high, and very high), corresponding to classes of air quality going from low (1) to very high (10). The DAQI is used both for representing monitored data and forecasts for the next day.
Information on the UK index is reported on the institutional website of the Government Department for Environment Food and Rural Affairs.
In Spain, the air quality index (Table S2) is calculated on the basis of near-real-time data of the same pollutants used in the UK: NO2, SO2, O3, and particulate matter (PM2.5 and PM10). Monitoring data can be supplemented, when necessary, by the results of modelling applications.
The updated index is available on the website of the Spanish Ministry for the Ecological Transition and the Demographic challenge.
The air quality index in France qualifies the state of the air according to five classes: good, average, bad, very bad, and extremely bad (Table S3). It is calculated daily from the concentrations of the main five pollutants used also in the UK and Spain: particulate matter (PM2.5 and PM10), NO2, O3, and SO2. It is determined from the concentrations measured at fixed background stations and from modelling integrating and aggregating data from pollutant emission inventories, measurements, and meteorological forecasts. The concentration ranges selected for pollutants are the same used in Spain.
The index is reported on the website of the Fédération Atmo France.
The air quality index in Germany (Table S4) is based on the concentration values of three pollutants: NO2, particulate matter (PM₁₀), and O3, and to calculate the index at least one of the three pollutants has to be measured at a station. The highest concentration determines the total index.
The index is available on the website of the German Environment Agency.
The common air quality index for the European Union (Table S5) is based on the concentrations of five key pollutants among those for which air quality standards exist in legislation (Table S6): SO2, NOx, O3, and particulate matter (PM2.5 and PM10). According to the levels of each pollutant, the air quality is defined as good, fair, moderate, poor, very poor, or extremely poor.
The index corresponds to the poorest level for any of the five pollutants and is calculated hourly by more than two thousand air quality monitoring stations across Europe, using near-real-time data reported by countries, complemented where necessary by modelled air quality data from the European Union’s Copernicus Atmosphere Monitoring Service (CAMS). Therefore, since it is based on not-yet-validated data it cannot be used for compliance purposes.
Health messages for fragile categories are associated with different concentration ranges in order to protect human health as much as possible (Table S7).
At the European level, the European Environment Agency (EEA) website is one of the main sources to get reliable information on this issue.
2.1.2. America
In the USA, the Clean Air Act, first released during the ‘70s and amended in the ‘90s, is the legislative regulation on air pollution issues; 40 CFR part 50 of the act sets the National Ambient Air Quality Standards (NAAQS) on the six main pollutants harmful to public health and the environment (CO, NO2, SO2, O3, PM, and Pb), according to the Environmental Protection Agency (EPA) indications (see Table S8). The standards are classified as primary (aimed at protecting the health of the general population, including sensitive people) and secondary (aimed at the protection of public welfare).
The first air quality index (Pollutant Standards Index (PSI)) was defined in the USA in 1976, representing in the form of descriptive words and colors the state of the air in a simple and communicative fashion. The index comprised six classes and the breakpoints were set based on the National Ambient Air Quality Standards (NAAQS) and epidemiological studies; the scale span was from 0 to 500, the value of 100 was set equal to the NAAQS.
This index was revised by the USEPA and named the AQI in 1999, when PM2.5 was introduced as a new subindex. In Tables S9 and S10, the class breakpoints and the corresponding health messages of the new index, respectively, are reported.
Metropolitan Statistical Areas (MSAs), with a population greater than 350,000, shall report daily, for a minimum of five days per week, the AQI to the public. The AQI levels can be diffused through traditional media (tv, radio, and newspapers) or more frequently in recent years through websites on air quality or weather forecasts, apps, and social media.
The EPA’s AirNow website (https://www.airnow.gov/, accessed on 12 October 2021) disseminates air quality data from state and local air quality agencies.
Canada, if compared to the USA, has less uniform legislation due to shared jurisdiction, since both the federal government and provinces have their own powers. The federal government sets National Air Quality Objectives (NAQOs) for ambient levels of criteria air pollutants (O3, SO2, NOx, and VOCs), non-binding guidelines that the provincial governments have the option to adopt as guidelines or as legal standards (Table S11). The Canadian Ambient Air Quality Standards (CAAQS), reported in Table S12, represent a unified approach to achieve the common goal of protecting the environment and human health. The efforts of all the single provinces are, indeed, necessary to achieve emission reduction goals at a national level.
Two kinds of indexes were developed in Canada: an air quality index and an air quality health index (AQHI). The calculation expressions of the two indexes and the pollutants considered are reported in Section 2.2. The breakpoints between the AQI categories, reported in Table S13, were derived from air quality standards or mathematical extrapolation, and the health messages are reported in Table S14. The AQHI index is calculated based on the sum of excess mortality risk, adjusted to a 1–10 scale, which is subdivided into four categories (low, moderate, high, and very high), the calculation expression is reported in Section 2.2. The AQHI is derived from an ascertained linkage between ambient air pollutants and short-term mortality. The AQHI is essentially a simple linear combination of NO2, O3, and PM2.5. Each unit increase in the AQHI is equivalent to a roughly 1% increase in daily mortality.
The AQHI used in the provinces of Ontario, British Columbia, Manitoba, Newfoundland and Labrador, Nova Scotia, Prince Edward Island, New Brunswick, and Quebec have been implemented in large cities. A mixed use of general AQIs (for instance, IQUA) and an AQHI is conducted in the provinces of New Brunswick, Saskatchewan, and Alberta.
Regional AQHI values are published every hour on Environment Canada’s Air Quality Health Index website.
Mexico implemented legislation on ambient air quality in the 1970s and currently Mexico’s Secretary of Health (Secretaría de Salud) is in charge of regulating this matter at the federal level. The official standards (normas oficiales (NOM)) were issued in 1994 by Mexico’s Secretary of Health on criteria pollutants such as CO, O3, NO2, SO2, PM2.5, PM10, and Pb (Table S15). O3 and PM standards were lately updated in 2014 [21].
Mexico City, as many other megacities, has indeed a certain degree of autonomy, to some extent, similar to a state.
Mexico City’s air quality management and action plans are implemented by the Secretariat of the Environment (SEDEMA).
The metropolitan air quality index (IMECA), implemented in 1982, had a scale 0 to 500, and it considered O3, SO2, NO2, PM10, PM2.5, and CO levels.
In 2019, derived from the creation of a new official Mexican standard (NOM-172-SEMARNAT-2019), it was agreed to use an air and health (Aire y Salud) index, which replaced the IMECA. The breakpoints of the classes of this index are represented in Table S16.
In Argentina, the national law on air quality is N° 20.284—Plan for the prevention of critical situations of atmospheric pollution, which is quite old (16 April 1973). Other more recent regulations are valid at the municipal level (Gobierno de la Ciudad Autónoma de Buenos Aires-GCABA) as the Decr. Regl. 198/06 (Law N° 1356) and refer to the main atmospheric pollutants (CO, NO2, SO2, O3, PM10, benzene, Pb, and, in the actualized form, PM2.5) (Table S17).
Based on the US EPA air quality index, the Índice de Calidad de Aire (ICA, Table S18) was developed as a more general index concerning the overall environmental quality Índice de Calidad Ambiental (ICA), which shares the same acronym. The air quality index ICA is calculated from the measurement of concentration in the air of five basic pollutants, which are: CO, SO2, NO2, O3, and PM10. The chromatic scale is the same as the American AQI, and the terms defining the different classes are the same except for the highest class, which is termed as “dangerous” instead of “hazardous”.
The calculation is performed according to the same expression of the USA EPA AQI.
In Bolivia, the air quality is regulated by Supreme Decree 24176 (8 December 1995), which is the implementation of the general law on the environment N° 1333 (27 March 1992). In Table S19, the limit values are reported.
In 2006, the air quality pollution index (ICA) was defined according to Normas Bolivianas (NB) 62018 by the Bolivian Institute of Normalization; the ICA is a dimensionless value calculated from the limits specified in NB 62011 (Table S20). Its objective is to facilitate the information about risk from exposure to air pollutants and the protective actions that can be taken.
In Brazil, the National Environmental Council (Conama), part of the Ministry of the Environment, sets air quality standards, which do not have the force of law [22]. Following the WHO recommendations, in addition to the NAQS, interim targets were proposed for a progressive reduction of air pollution down to the final proposed value. Interim target (IT) values for IT-1 should be adopted immediately, except for CO, Pb, and total particulate matter (TPM), for which NAQS should be adopted. The NAQS values for the regulated air pollutants are those recommended by the WHO in 2005. According to the new legislation, there is no predetermined data to adopt each interim target nor final NAQS values for PM2.5, PM10, O3, NO2, and SO2.The same interim targets and AQS for PM2.5, PM10, O3, NO2, and CO were established in São Paulo State in 2013, whereas the IT-1 values have been valid since 2013. For SO2, the annual mean is the same as that shown in Table S21, but the 24-h means IT-1 is 60 μg m−3.
Two AQIs were implemented by the São Paulo State Environmental Agency (CETESB) and by the Municipal Department of the Environment (SMAC) and the State Environmental Agency (INEA) in Rio de Janeiro (Table S22). Both the indexes are calculated using the concentrations of PM10, SO2, CO, O3, and NO2, and PM2.5 is also added for the CETESB index. The index used by CETESB since 2013 has a five-level scale, from good air quality (0–40) to extremely high pollution (>200). Between 41 and 80, the air quality is considered “Moderate”, a level at which the population is not considered to be affected, except for a reduced number of people. For an AQI in the interval of 81–120, the air quality is considered “Unhealthy” if at least one of the national standards for criteria pollutants has been exceeded. The other levels, 121–200 and >200, represent a severe risk to public health. The SMAC index uses a five-level scale, ranging from good air quality (0–50) to extremely high pollution (>300). Between 51 and 100, the air quality is considered “Moderate”, from 101 to 200 the air quality is considered “Unhealthy”, from 201 to 300 it’s “Very unhealthy”, and >300 is “Hazardous”.
The calculation of the different indexes on the same dataset provided different results [23], being the AQI calculated based on the 2018 CONAMA resolution is the most conservative if compared to CETESB- and SMAC-based values.
In Chile, the Environmental Act attributes the responsibility of air quality regulation to the National Environment Commission (CONAMA). On 5 January 2000, CONAMA began the process of revising the primary air quality standard for SO2, TSP, CO, O3, and NO2.
In Table S23, the levels of the primary air quality standards for pollutants are reported. In Table S24 are also defined levels for all pollutants associated to a state of emergency.
In Chile, the supreme decree D.S. Nº 59/98 of the Ministry General Secretariat of the Presidency established the primary quality standard for PM10. Like the United States Environmental Protection Agency (USEPA, 1987), the primary daily standard for PM10 was set at 150 µg/m3. As early as 2013, the D.S. No. 20 maintained the primary quality standard for PM10, and based on this value, the levels that define environmental emergency situations are reported through the indicator ICAP Indice de Calidad del Aire referred to Particles (Table S25).
The air quality limit values in Colombia are set by the resolution Nr. 2254 of 1 November 2017, as reported in Table S26 for criteria pollutants and in Table S27 for other pollutants.
In the same resolution, the future limit values to be met by 2030 are indicated for PM10, PM2.5, NO2, and SO2 as the Indice de Calidad del Aire (ICA) classes and breakpoints. The ICA is based on the USA AQI (with conversion of some units to μg/m3). The classes and breakpoints are reported in Table S28.
In Colombia, reports on the air quality are not available for all regions of the country. The only cities that currently report an index are Bogotá (IBOCA), Bucaramanga (IBUCA), and the Área Metropolitana del Valle de Aburrá. Two of these indexes use the same calculation methodology (IBOCA and IBUCA). Both indexes are obtained from concentration data of CO, SO2, PM10, NO2, and O3; a normalized value for each pollutant is calculated and finally the one with the highest value is registered as the IBOCA/IBUCA of the city. The IBOCA is currently (first trimester of 2021) under review.
A bi-pollutant index, based on PM10 and O3, has been proposed in [24].
In Peru, the supreme decree Nº 003-2017-MINAM074-2001-PCM establishes the annex current standards on air quality, as reported in Table S29.
The air quality index (INCA) has an optimal value between 0 and 100, which coincides with compliance with the environmental air quality standards. For a better understanding, INCA is divided into four categories or qualifications of the air quality (Table S30). The green-colored band comprises INCA values from 0 to 50 and means that the air quality is good; the yellow band includes values from 51 to 100 and indicates moderate air quality; the orange band is located between the values 101 and the threshold value of the state of care (VUEC) of each pollutant, which tells us that the air quality is bad; finally the red color of the fourth band indicates that the air quality is higher than the threshold value, and this value corresponds to the application of national alert states by the health authority.
The air quality index values were calculated taking as reference the environmental quality standards of air and, as a final range, the threshold value of application of the alert state levels (Table S31). INCA will be elaborated on the air quality information base generated in priority attention areas.
Uruguay has recently (4 May 2021) reviewed its legislation on air quality; in Table S32 the new limit values are reported.
The daily limit values of SO2, PM2.5, and PM10 will be further lowered, respectively, to 20, 25, and 50 μg/m3, and the 1-year limit value of PM2.5 and PM10 to 50 and 20 μg/m3 by 1 January 2024.
The Montevideo air quality index, ICAire, is a representative value of the level of air pollution associated with a region;. it is reported weekly with the results obtained in the previous week, so it is not a predictive index, but rather informative. The quality index ICAire is calculated from a function that is based on the levels recommended by different international organizations and by the competent national and municipal authorities. It is based on an arbitrary scale between 0–400 that relates the concentration of the parameters evaluated with a preset guide value. The ICAire value thus obtained allows qualifying the air quality into six categories, which are associated with colors ranging from green to red. The classification updated in 2010 is reported in Table S33 and the reference values of the classes in Table S34.
2.1.3. Asia
In India, the Central Pollution Control Board (CPCB) of the Ministry of Environment and Forest (MOEF) revised the National Ambient Air Quality Standard (NAAQS) in the year 2009 with a list of 12 air components that include PM10, PM2.5, NO2, SO2, CO, O3, NH3, Pb, Ni, As, benzo(a)pyrene, and benzene [25] (Table S35).
The Government of India launched its national air quality index in April 2015, a relatively easy communication tool for assessing air quality in certain areas. By acknowledging the increasing air pollution in the country, the prime minister launched this tool that reports PM10, PM2.5, NO2, O3, CO SO2, NH3, and lead levels using six different color codes to indicate good, satisfactory, moderate, poor, very poor, and severe air quality on a scale ranging from 0 to 500 to communicate to people daily. The tables reported in the Appendix A represent, respectively, India’s AQI classifications (Table S36) and the color-coded air quality classes with health statements (Table S37).
An important national flagship program launched in 2019 to address air pollution in specified non-attainment Indian cities and allied pollution control boards were asked to submit action plans with the estimation of a minimum of 20% reduction in air pollution in their respective territories.
A web-based system has been developed by the CPCB for quick and simple responses for AQI dissemination and queries.
The web-based system is designed to provide the AQI on a real-time basis. For manual monitoring stations, an AQI calculator sheet is provided to get AQI values.
The web-based system includes the various types of information listed in Table S38.
The Republic of Korea (South Korea) started establishing limits for air pollutants in 1978 and has gradually increased the number of pollutants considered for setting ambient air quality standards. In 1983, standards for CO, NO2, TSP, O3, and HCs were added to the list and pollutants were made gradually more stringent. In 1995, PM10 standards were also established.
At present, the Republic of Korea has established standards for eight air pollutants, PM10, PM2.5, NO2, SO2, O3, CO, Pb, and benzene. All the ambient air quality standards established are listed in Table S39.
According to the information made available by the Korean Ministry of Environment (MOE) and the Korea Environment Corporation (KECO), South Korea’s way of describing ambient air quality based on health risk of air pollution is the Comprehensive Air Quality Index (CAI). The index aims to help people easily understand air quality levels and to protect their health from air pollution. It includes six pollutants: PM10, PM2.5, NO2, SO2, O3, and CO.
The CAI has values that go from 0 to 500, divided into four categories (good, moderate, unhealthy, and very unhealthy). The higher the CAI value, the greater the level of air pollution (Tables S40 and S41). The AQI level above 100 represents unhealthy conditions.
CAI values are calculated for each of six air pollutants, for which the air quality index has been set, and the highest value is used as the CAI value.
If two pollutants have subindexes both higher than 100, the higher subindex value is considered the responsible pollutant and its value plus 50 is adopted as the CAI; if three pollutants have subindexes higher than 100, the highest subindex value is considered the responsible pollutant and its value plus 75 is adopted as the CAI [10].
A comprehensive web-based system has been developed by the Republic of Korea and is available at https://www.airkorea.or.kr/eng (accessed on 8 September 2021). It includes the air quality info reported in Table S42.
In China, ambient air quality legislation has been established since the ‘80s, when limits were first defined for total suspended particulates (TSP), SO2, NO2, lead, and BaP (benzo(a)pyrene). In the last twenty years, the standards were both strengthened and expanded.
In 2012, China established a new national ambient air quality standard [26], which for the first time included limits for PM2.5 and achieved nationwide implementation in 2016.
China’s current air quality standards establish two classes of limit values: Class 1 standards apply to special regions such as national parks while Class 2 standards apply to all other areas, including urban and industrial areas.
China’s air quality standards listed in Table S43 include a list of 10 air components: PM10, PM2.5, NO2, SO2, CO, O3, and then TSP, NOx, Pb, and benzo(a)pyrene.
In 1996, China defined the Air Pollution Index (API), an index that indicates the pollution level of the atmosphere, ranging from 0 to 500, and includes PM10, SO2, and NO2 levels. According to the National Ambient Air Quality Standard established in 2012, six pollutants (i.e., PM2.5, PM10, Ozone, SO2, NO2, and CO) are included in the new standard, along with seven indexes (daily average PM2.5 concentration, daily average PM10 concentration, daily maximum 1-h Ozone concentration, maximum 8-h Ozone concentration, daily average SO2 concentration, daily average NO2 concentration, and daily average CO concentration), as shown in Table S44.
The daily AQI not exceeding 100 is considered to represent an attainment day [27].
The basic categories of the air quality index are excellent, good, slight pollution, moderate pollution, heavy pollution, and serious pollution (Table S45).
The lower the AQI value, the better the air quality. According to the Technical Regulation on Ambient Air Quality Index established in China, when the AQI is greater than 50, the pollutant with the highest IAQI value is defined as the primary pollutant. If two or more pollutants have the highest and same IAQI value, all of them will be considered as the primary pollutants [28].
Thailand’s National Ambient Air Quality Standards have been set by the Pollution Control Department of the Ministry of Natural Resources and Environment for eight pollutants (PM2.5, PM10, TSP, O3, SO2, NO2, CO, and Lead) (Table S46) considered as the highest priority in order to protect national public health.
According to the information made available through the institutional website of the Air Quality and Noise Management Division of Bangkok (https://bangkokairquality.com, accessed on 8 September 2021), and by a recent scientific publication [29]), the AQI in Thailand is based on the levels of six atmospheric pollutants, namely PM2.5, PM10, CO, O3, NO2, and SO2 (Table S47). The air quality index for Thailand foresees five levels ranging from 0 to values >201: very good quality, good quality, medium, began to affect health, and affecting health (Table S48).
An air quality index value of 100 is associated for each pollutant to the concentration value of the air quality standard. In general, an air quality index higher than 100 means that the air pollution concentration is worse than standard.
The air quality index with the highest value, previously calculated on any air pollutant, is assigned to a certain day.
2.1.4. Australia
In 1998, Australia established the National Environment Protection Measure for Ambient Air Quality, the so-called NEPM. The legislation defined national standards for six air pollutants: CO, O3, SO2, NO2, lead, and particulate matter (PM10), while in 2003 a standard for PM2.5 was added (Table S49). In 2021 the National Environment Protection Council reviewed the standards for NO2, SO2, and O3.
Australia is constituted by six states (New South Wales, Queensland, South Australia, Tasmania, Victoria, and Western Australia), three internal territories, and seven external territories. New South Wales (NSW) is the most populous state and its capital is Sydney.
The Department of Planning, Industry and Environment set also for NSW a standard for visibility.
In NSW, the air quality data were presented through an AQI from 2008 to 2020, representing for each pollutant a percentage of the NEPM standard according to this formula: AQI = (pollutant concentration/pollutant standard) × 100.
An AQI value of 100 therefore represented a value equal to the standard while levels above 100 were for unhealthy air quality conditions. The AQI had six different colored categories. Each category corresponded to a different air quality level and associated health risk.
In 2020 the AQI in NSW was replaced by the Air Quality Categories (AQC) in order to provide more health information (Table S50). The AQC is based on the concentrations of the following six variables, PM2.5, PM10, O3, NO2, CO, SO2, and visibility levels.
The AQC includes five colored categories, good, fair, poor, very poor, and extremely poor.
The AQC at a certain site is determined from the highest category found after comparing all single pollutants at that site. Australia’s NSW AQI health messages are reported in Table S51.
2.2. Air Quality Indexes Calculation Methods
Based on the type of calculation, Mayer [30] made a distinction between air stress index and air quality index, and both are used to inform populations on the air quality in a concise way but differ on the calculating expression, which in the former case is basically an arithmetic summation of the concentration with respect to air quality standards or number of exceedances as set at by the European legislation:
where C is the mean concentration (on a yearly basis) and R is a reference value for the air pollutant i.
where the concentrations are divided by the yearly standard of each pollutant. The link of these indexes to health is the pollutant concentration ratio to the reference value (limit value) set by the legislation considering epidemiological studies.
The AQIs, instead, define different ranges of concentrations for the various species taking into account their effect on health. Air quality indexes do not apply arithmetic summation, but different expressions as in the following.
Many indexes, as already reported, are based on calculation expression where the AQI is a simple linear function of individual pollutants:
where:
Cp (concentration of the pollutant p averaged according to the standards);
BPHi and BPLo are respectively the breakpoints higher and lower than Cp;
IHi and ILo are the AQI values corresponding to BPHi and BPLo
According to this, the USA and other countries (the Asiatic China, India, Thailand, and Republic of Korea, as well as the Americans Mexico, Argentina, and Brazil) calculate a series of subindexes for each regulated pollutant, the worst of which is reported and disseminated as public information.
A different calculating expression of the Canadian AQI, simplified with respect to the ones in use, which vary according to the different pollutants and the different classes, may be written as:
Bi refers to a slope that is constant for pollutant i but differs from that of other pollutants; Bi is determined by the air quality standards/guidelines (e.g., B = 1.011 for PM2.5, B = 0.655 for O3, B = 0.2005 for NO2, and B = 0.128 for SO2).
Canada was also the first country to implement an integrated multipollutant air quality health index. An AQI is a simple linear function of single pollutants, whereas an AQHI can be thought of as a simple linear combination of three air pollutants, and in some circumstances they can perform similarly. The Canadian AQHI appeared to predict better, if compared to the AQI, peaking events of air pollution and to be more sensitive to NO2, which is mainly emitted by vehicular traffic, whereas the AQI is more helpful in cases of transient changes of O3 and PM2.5.
The Mexican RESPIRA index is based on five subindexes associated with the environmental concentrations of six regulated pollutants, O3, PM10, PM2.5 (3-h running average), SO2, NO2, and CO (hourly average), with two approaches: bi-pollutant and mono-pollutant. When all six criteria pollutants are available, a maximum of five subscripts will be obtained, of which two will be bi-pollutant (O3–PM10, O3–PM2.5) and three will be mono-pollutant (NO2, SO2, CO).
Other comprehensive multipollutant indexes were also developed to integrate the different air quality data in a unique expression. One of the first papers proposing such approach was that of Swamee and Tyagi [31], which defined this expression:
where different subindexes as:
relative to each pollutant p of q observed concentrations are summed up. The term qs is the concentration of the standard for that pollutant (limit value), ss is a scaling coefficient (500 for NAAQS), and m is a constant different for each pollutant, as reported in the paper. The value of ρ varies (ρ→0 maximum of the subindexes and ρ = 1 sum of all the subindexes). The optimum value of ρ = 0.4 is indicated to avoid both eclipsicity and ambiguity. The same expression is also proposed by Kyrkilis [32], keeping the value of m equal to 1 and getting to the expression:
where and ρ = 2.5, hence giving as in the former expression the value of 1/ρ = 0.4.
A new approach in defining the AQI was described by Cairncross [33], which considered the increased daily mortality due to the simultaneous effect of different pollutants. The AQI is expressed as:
where aP is a coefficient of proportionality to the increased risk due to the pollutant p. The different effect of the various pollutants on health is considered by giving the same subindex value to comparable effects on health by different species.
As reported in the detailed section Materials and Methods, many of the AQIs in the world are based on the US AQI, and modifications of this index were proposed in some papers. Murena [34] modified it by taking as breakpoints in the US AQI the EU standards and considering as additives the effects of the different pollutants:
where Cp is the concentration of the pollutant p, BPp,c is the lower concentration of pollutant p in each class c, and PIbc is the bottom value of PI corresponding to the highest pollution category c for which the summation is ≥1. Adding the different pollutants may not be correct if their effects on health are not similar.
Other modifications of the EPA AQI are proposed by Cheng [35], which define a new index RAQI as the product of three terms, and in the third the Shannon entropy function was introduced:
where the first factor F1 is the highest value of the subindex Ip of each pollutant p, the second factor F2 is the background arithmetic mean index value of each pollutant, and the third F3 is the background arithmetic mean entropy index value. The second factor accounts for the single contribution of the subindexes to the final one in order to mitigate eclipsicity, and the third is a log10 of the highest value of the subindex Ip, which helps avoid both ambiguity and eclipsicity.
Other complex expressions were further developed over the years—a comprehensive report on this is available in [10]—but basically several different statistical approaches were tried to optimize the AQI obtained.
The less complex treatment made by Bishoi [36] on raw data (not standardized), proposes an integrated approach to the principal component analysis (PCA); the index is defined as:
Applying statistical methods, several indexes can be obtained by successive hierarchical aggregations of data in time, space, and pollutants following different patterns. Aggregation in space and pollutants should be preceded by a step of standardization of data with different units of measurement and/or order of magnitude. Among the first, Bruno and Cocchi [37] aggregated by monitoring site and by pollutant considering, respectively, the median for the first and the maximum for the second, yielding the ImM index.
A new approach was later proposed by Plaia et al. [14] with a two-step process. A PCA is applied in the first step, spatial synthesis, on a reorganized dataset, and the second step, pollutant synthesis, applies the index I2, already proposed by Ruggieri and Plaia [15], obtaining the new index :
This is the I2 index relative to day t.
This index avoids the problem of eclipsicity encountered by the USA-AQI-based indexes by standardizing the highest pollutant concentration, and the PCA synthesis in space and pollutant dimensions provides an overall evaluation of the air quality due to the simultaneous presence of several pollutants. To analogous results came also Passamani et al. in a recent study [38] where a three-way PCA is performed. The reduction of two dimensions (monitoring sites and pollutants) is performed in this work jointly rather than in two steps as in the Plaia methodology.
3. Results
The AQIs defined by each country according to the air quality standards set by its legislation, or in a few cases following other countries, are aimed at providing information to the public to protect first sensitive groups and then the general population from the consequences of unhealthy or dangerous concentration levels of regulated chemical species.
The analysis of governmental official sites and documents provides valuable and comprehensive information about the different approaches adopted in many countries, as reported in Section 3.
3.1. Air Quality Indexes Comparison
The task of comparing the various indexes is complex since differences in units, averaging periods, methods of calculation and aggregation, and, finally, in the number and width of classes should be taken into consideration and the correct approach should be chosen.
An overview of the main countries’ AQIs is provided in Table 1, where the calculation details, the pollutants considered, their units, and the averaging times are reported.
From the analysis of Table 1, it appears clear that there is great variability in the averaging times chosen by different countries for the calculation of their AQIs; in particular, in the case of SO2 and NO2, most of the countries use a 1-h averaging time, while some (China and India, for both pollutants, and Mexico, Brazil, and Peru only for SO2) use the 24-h averaged values. As expected, the AQI averaging times were based on those of the respective national air quality standards. China has both 1-h and 24-h standards and has chosen the daily one for its AQI. The advantage of short averaging times is to provide alerts to the population in case of peak episodes.
A comparison of the chromatic scales of the selected AQIs can be observed in Table 2. Colors reported in the Table 2 are those chosen by each country to provide health advices associated to the different AQI classes.
In Figure 1a, Figure 2a, Figure 3a, Figure 4a, Figure 5a and Figure 6a the subindexes (after conversion of concentrations in the same units) are plotted vs. the different pollutant concentrations; the chromatic scale and the maximum index value for each class are also reported. The chromatic scale, represented in each Figure, is the same reported in Table 2 and corresponds to that chosen by countries for the different AQI classes.
A comparison of values and classes of selected AQIs, normalized according to the method proposed by Lokys [20], is presented in Figure 1b, Figure 2b, Figure 3b, Figure 4b, Figure 5b and Figure 6b. The colors used in these Figures, are not that related to AQI chromatic scales, but they have been arbitrarily chosen to distinguish the different AQI classes.
The methodology foresees a two-step normalization procedure where all normalized AQIs range from 0 to 1 starting from different scales and values. The 0 is assigned to the minimum value of each AQI while 1 is assigned to each maximum value. As some AQIs have no fixed upper thresholds for some individual pollutants and, in these cases, there are no defined maximum values, the upper index values were calculated using the interpolation method. As an intermediate normalized value, this method assigns 0.5 to the standard chosen for the comparison. Even if the AQIs considered at a global scale are developed on different standards, after a comprehensive analysis of the air quality standards applied in the examined countries, it was decided to take as a benchmark the USA limit values and to consider the distribution of classes referred to these. The values indicated in each column in the following figures represent the original AQI classes in each country.
From the observation of Figure 1a, it is apparent how many countries place more “relaxing” colored classes below the standard; on average two classes lay below the value of 100 ppb taken as a reference (the USA hourly limit value). China and India are reported for completeness since their AQIs are based on daily values.
In many countries (USA, Brazil, Peru, Australia, Thailand, and, even if referring to daily averages, also China and India), concentrations above the standard are highlighted by the color shifting from green/yellow to orange. Differences can be noted between a most conservative approach as the European one and a less strict one as those shown by Latin American countries like Mexico and Uruguay, where the limit value is the border separating green shades of colors and yellow (which for the former country corresponds to an “acceptable” level). The classes above the limit are wider in the case of the USA and Brazil, comprising very high values, whereas they are neighboring the standard in the other cases, for which a not exactly defined higher limit is set for the last class. In the case of the EU and Australia, the values of the classes are set arbitrarily in this work, since only the concentration range, chromatic scale, and warning messages could be found.
From the observation of the normalized NO2 values (Figure 1b), the distribution of classes can be compared: it is evident that only one country has only one class below the reference value (i.e., Mexico). Most of the countries (i.e., USA, Canada, Brazil, Peru, Australia, and Thailand) have two classes below the level of 0.5, that is the reference level. The countries that have the most conservative approach differentiating more among the lower values, below the reference value, are Uruguay, the Republic of Korea, and the EU, which have three, three, and four classes, respectively, below 0.5. For the upper classes, above 0.5, the country that differentiates less is the Republic of Korea with only one class, while the US is the most careful with five different breakpoint classes.
The AQI subindexes for SO2 are in many cases (half of the ones examined) relative to the daily values, therefore the comparison among different indexes should be split in two. Some differences can be observed among the countries that base their AQIs on hourly values (Figure 2a), some of which, as is the case in the US and China, set the shift from yellow to orange in correspondence to the limit value, whereas other locations such as Europe, Australia, Thailand, and the Republic of Korea consider this level as safe. The countries that base the index on daily values do not show big differences in the chromatic scale and the standard is fully in the orange just for Peru.
For SO2, the AQI normalized values show that Figure 2b, except for the Republic of Korea, all countries have a low grade of differentiation in classes below the level chosen as a reference value (75 ppb, the USA standard). Three countries (Canada, Australia, and Thailand) have only one class below this value. Two places (USA and EU) have two classes below the reference threshold, thus giving more attention to the lower levels.
Above the chosen reference value, the situation is quite homogeneous, except for the Republic of Korea that has only one class. The other countries have five classes (USA) or four (Canada, the EU, Australia, and Thailand), thus demonstrating attention to better characterize upper levels of air pollution.
As observed in Figure 3a, almost all countries’ PM10 standard averaging time is 24 h, the only exceptions being Mexico and Australia. Therefore, the comparison is easier, the lower standard values were those set by the EU and Australia (50 μg/m3), hence the USA standard, set as a reference (150 μg/m3), falls respectively in the maroon and orange area of the chromatic scale. In some cases (Mexico and Uruguay), an intermediate value of 75 μg/m3 is set, but most of the countries set their limit values at around 100 μg/m3 (Peru, Thailand, Republic of Korea, and India) or 150 μg/m3 (USA and Brazil). Thus, the standard is in most of the cases between the yellow and orange classes. It should be noted the countries that differentiate most the classes above 150 μg/m3 are the USA, China, and India.
From the observation of the normalized PM10 values (Figure 3b), it is evident that many countries have two classes below the reference value chosen for comparison (USA, Brazil, Peru, and China). Other locations differ greatly in the number of classes below the value chosen for comparison (the EU, Uruguay, Thailand, Republic of Korea, and India) with, respectively, five, four, four, three, and three classes. It is evident that in these cases there is more attention given to characterizing the lowest concentrations as expected since, as already shown in the previous Figure, in these countries the PM10 standards are set at lower levels compared to that of the USA. Regarding AQI classes above the reference value, four countries differentiate greatly (USA, China, Brazil, and India), with five, five, three, and three classes, respectively. Five locations differentiate less above the reference value (Peru, Uruguay, the EU, Thailand, and the Republic of Korea), with two, two, one, one, and one class, respectively.
Since more recently being implemented, the standard for PM2.5 is variable from one country to another, ranging from 25 to 75 μg/m3. The USA standard is set at 35 μg/m3 as is the Korean and Uruguayan standard. Lower values were set by the EU, Canada, and Australia (around 25 μg/m3), whereas higher standards were set by China (75 μg/m3) and India (60 μg/m3). As observed in Figure 4a, the USA standard falls in the red (poor) European class and in the green (satisfactory) Indian class. Among the Asiatic countries, China defines as “excellent” the environmental conditions related to this value, and the Republic of Korea defines it as “moderate”.
The normalized PM2.5 values (Figure 4b) show that the situation below the value chosen as a reference value (USA standard of 35 µg/m3) is quite homogenous with most countries with one class (China) or two classes (USA, Thailand, Republic of Korea, and India). Only two countries have a more pronounced differentiation with three classes (Peru) or four classes (the EU).
In the upper levels, above the reference value, the countries that “pay major attention” to differentiating AQI classes are China (six classes), the USA (five classes), and India (four classes). These countries are counterposed to a group of countries that differentiate less, including Thailand (three classes), the Republic of Korea (two classes), and Peru (one class).
The first two classes of the US index are available only on an hourly basis (Figure 5a), whereas the opposite happens with the last two, which are available on an 8-h basis. The standard reported is the US one on an 8-h basis.
The USA and Chinese AQIs were developed considering hourly and 8-h averaging periods, but many others report only hourly averaged-based AQIs. The countries which have 8-h based indexes give a rather different evaluation of the environmental conditions related to this concentration being green associated in Uruguay, orange in Thailand and Peru, and yellow in India.
From the observation of the normalized O3 values (Figure 5b) it is evident that there is a quite homogenous number of classes below and above the level chosen as a reference value (USA standard of 70 ppb), ranging from two to three classes except in the case of the USA with five classes and one class for Peru above the reference value.
The CO subindex is normally referred to using 8-h averaging periods, and the standard reported as a reference is the US value (9 ppm) averaged over this timeframe (Figure 6a). The standard falls, almost everywhere in the yellow class, to in many cases the border with the orange one (Brazil, Peru, Australia, Thailand, and India). Where an hourly level was considered for the AQI, as in Canada and the Republic of Korea, it is placed in the safe green area. The opposite happens in China, where daily values were used to implement the AQI.
From the observation of the normalized CO values (Figure 6b), it is evident that there is a quite homogenous distribution of classes below and above the reference value (USA standard of 9 ppm), except for Peru, which has only one class above this value, thus differentiating less for the upper levels.
4. Discussion and Conclusions
From the analysis of the air quality indexes reported in the previous sections, it is quite clear that each country made different choices to find an easy way to communicate the main information on the air quality status to the public. Some global websites, listed at the end of the paper, report AQIs all over the world employing the same calculating expressions; it should be highlighted that these websites allow a direct comparison of AQI values of all countries, but the expressions used are not the ones officially issued by the national authorities.
Despite the widespread use of AQIs, there is, indeed, no internationally agreed methodology for their conception or design [39,40]. Many indexes are based on the USA Environmental Protection Agency AQI, as previously reported, but in some cases changes were made to the original index.
There are also differences in the air quality standards set in different areas of the world that are used as a reference to determine the different classes of the indexes, differences in the units of measurement, and the averaging periods selected for each pollutant; various methodologies are implemented to determine the values corresponding to the classes for which health messages are given to the public. It is therefore quite difficult to make comparisons between the indexes and obtain evaluations that can be applied everywhere to tackle air pollution action globally.
The choices made by countries show the possible approaches followed and some considerations also arise from such differences.
The classes associated with reassuring health messages correspond to quite low concentrations, always below the standard chosen as a reference. Most of the countries prefer to raise awareness on the possible negative impacts of air pollution on human health and give a message that it is important not to relax until the values will be decreased under those suggested by the WHO. It has to be underlined that the recently published WHO guidelines suggest lower values for most of the regulated pollutants and introduce also good practice recommendations for black carbon, elemental carbon, and ultrafine particles [1]. It is also clear from the comparison that most of the countries present, with few exceptions, have many classes above the reference value of the USA that result in better characterizations of the worse states of air quality. Instead, in the case of PM10 and PM2.5, some countries differentiated more at the lower levels, as expected, since the PM10 and PM2.5 24-h standard values, as said in Section 3.1 are lower than that of the USA.
Apart from the above-mentioned dissimilarities in air quality indexing systems, AQIs, as a tool, suffers per se from certain limitations due to conception and calculation methods. The indexes reported in the information media are usually determined by the value calculated for the highest concentration pollutant among the set of species chosen, but they can also be aggregated and thus obtained through calculation expressions involving more than one species. This last class of AQIs is less common and seldom found. After the analysis of the main AQIs, it is possible to observe that such a kind of index is used in Canada (AQHI), specifically for health protection, and attempts to integrate more than one pollutant can be found in Mexico (with the RESPIRA AQI) and the Republic of Korea.
The combination of pollutants is not the prevalent and most used way of conveying environmental information concerning the air quality to the general public. Nevertheless, the more extensive use of aggregated indexes could avoid some unrealistic information caused by the “eclipsing” effect due to reporting only the worst pollutant index, thus minimizing the perception of danger. This kind of simplified indexing may also lead to the unrealistic idea that individuals are exposed to a single pollutant at a time.
On the other hand, a false alarm concerning air quality, commonly indicated as “ambiguity”, can also be due to the peculiar features of the index employed [14,38].
These limitations can be overcome by aggregated indexes, which in many cases are provided by statistical treatment such as PCA or other data handling techniques (such as neural networks, fuzzy inference systems, etc.). Specifically, PCA is a reliable and well-known method applied to large sets of variables, which defines a new smaller set of variables that can summarize the information to make it easier to be analyzed and to be represented in a synthetic index. The environmental variables reported in an index, indeed, make up a big dataset that refers to different monitoring sites, pollutants, and time series. There are different ways to apply the statistical methods, as previously reported, that can produce several indexes.
Normally the AQIs based on these statistical treatments are not the ones disseminated through official media concerning air pollution management, since more simply conceived indexes are routinely employed. It should be emphasized that a few attempts were made by national institutional authorities to define a more sophisticated index (as the Canadian AQHI) better related to health issues, but most of the indexes are not yet directly related to health. As concluded in some research papers dealing with AQI definition through the methods previously reported, the research should also focus on the definition of adequate breakpoint values.
The topic of AQIs deserves an innovative approach in which the research of more concise and meaningful indexes should finally give as a result a newly designed index to be publicly disseminated and available to people.
Supplementary Materials
The following are available online at https://0-www-mdpi-com.brum.beds.ac.uk/article/10.3390/atmos12111524/s1, Table S1: Air Quality Index in United Kingdom, Table S2. Air Quality Index in Spain, Table S3: Air Quality Index in France, Table S4: Air Quality Index in Germany, Table S5: Harmonized Air Quality Index for the European Union, Table S6: Air quality standards for the protection of human health, as given in the European Ambient Air Quality Di-rectives, Table S7: Health messages associated to AQI, Table S8: USA National Air Quality Standards (NAAQS) for the regulated pollutants, Table S9: USA AQI levels and concentration pollutants breakpoints, Table S10: USA EPA AQI health messages, Table S11: National Ambient Air Quality Objectives & Guidelines in Canada, Table S12: Canadian Ambient Air Quality Standards (CAAQS), Table S13: Classification breakpoints for the Canadian AQI, Table S14: Canadian AQI health messages, Table S15: National Ambient Air Quality Standards in Mexico, Table S16: Mexico (Aire y Salud) index classes and breakpoints, Table S17: Limit values for the main pollutants in the city of Buenos Aires (GCABA, 2006) and WHO guidelines (2005), Table S18: Classification breakpoints of the Índice de Calidad de Aire (ICA) in Argentina, Table S19: Limit values for the main pollutants in Bolivia, Table S20: Air quality index classes and prevention indications in Bolivia, Table S21: Brazilian NAQS, ad-interim targets set in 2018. Values set in 1990 are also indicated, Table S22: Brazilian Limits for AQI determined in Resolution Number 491 (2018) and values used by SMAC and CETESB, Table S23: Air quality standards approved by CONAMA (25/04/2001) in Chile, Table S24: Levels that define critical episodes of contamination in Chile, Table S25: Classes of the ICAP index in Chile, Table S26: Maximum acceptable level of criteria air pollutants in Colombia, Table S27: Maximum acceptable level of toxic air pollutants in Colombia, Table S28: Indice de Calidad del Aire warning messages and breakpoints in Colombia, Table S29: Peruvian Air quality standards set by Supreme Decree Nº 003-2017-MINAM074-2001-PCM, Table S30: Classification breakpoints for the Índice de Calidad del Aire (INCA) in Peru, Table S31: Classification of the Índice de Calidad del Aire (INCA) and related warning messages in Peru, Table S32: Uruguayan Air quality standards set by Regulation 2020-14-1-0000343 till 31st December 2023, Table S33: ICAire classification in Uruguay, Table S34: Reference values employed in ICAire calculation in Uruguay, Table S35: India’s ambient air quality standards, Table S36: India’s AQI classification, Table S37: India’s AQI health statements, Table S38: Information available for India, Table S39: Republic of Korea’s ambient air quality standards, Table S40: Republic of Korea’s AQI classification, Table S41: Republic of Korea’s AQI health statements, Table S42: Information available for Republic of Korea, Table S43: China’s National Air Quality Standards, Table S44: China’s AQI classification, Table S45: Chinese Indicators for Air Quality Index, Table S46: Thailand’s ambient air quality standards, Table S47: Thailand’s AQI classification, Table S48: Thailand’s AQI Health messages, Table S49: Australia’s ambient air quality standards, Table S50: Air Quality Categories (AQC) cut-off values in New South Wales (Australia), Table S51: AQI health messages in New South Wales’s (Australia).
Funding
This research received no external funding.
Institutional Review Board Statement
Not applicable.
Informed Consent Statement
Not applicable.
Data Availability Statement
Not applicable.
Conflicts of Interest
The authors declare no conflict of interest. The funders had no role in the design of the study; in the collection, analyses, or interpretation of data; in the writing of the manuscript, or in the decision to publish the results.
Appendix A
This Appendix contains details and tables supplemental to the main text.
- Websites:
- Global Sites:
www.iqair.com (accessed on 18 October 2021).
Real-time Air Quality Index:
https://aqicn.org (accessed on 18 October 2021).
CalidadAire.Net:
https://www.calidadaire.net/america-del-sur.html (accessed on 18 October 2021).
Indice de Calidad del Aire (Puerto Rico):
https://www.drna.pr.gov/acai/aqi/ (accessed on 18 October 2021).
- Europe:
United Kingdom, Government Department for Environment Food and Rural Affairs
https://uk-air.defra.gov.uk/air-pollution/daqi?view=more-info (accessed on 18 July 2021)
Spain, Ministry for the Ecological Transition and the Demographic challenge
http://www.ica.miteco.es/ (accessed on 24 July 2021)
France, Fédération Atmo (Fédération des associations de surveillance de la qualité de l’air)
https://atmo-france.org/la-qualite-de-lair-dans-votre-region/ (accessed on 8 July 2021)
Germany, German Environment Agency
https://www.umweltbundesamt.de/en/data/air/air-data/air-quality/eJzrWJSSuMrIwMhQ18Bc18ByUUnmIkPTRXmpCxYVlyxYnOJWhJA0WpwSko-sNreKbVFuctPinMSS0w6eq-a9apQ7vjgnL_20g8o5F4dPFrMBS2Mkfw== (accessed on 8 July 2021)
European Union, European Environment Agency
https://www.eea.europa.eu/themes/air (accessed on 24 July 2021)
- USA:
EPA website:
http://airnow.gov/ (accessed on 12 October 2021)
USA AQI breakpoints:
https://aqs.epa.gov/aqsweb/documents/codetables/aqi_breakpoints.html (accessed on 12 October 2021)
Guidelines for Developing an Air Quality Forecasting Program:
https://www.epa.gov/technical-air-pollution-resources (accessed on 15 October 2021)
Air Sensor Toolbox for Citizen Scientists:
http://www.epa.gov/air-research/air-sensor-toolbox-citizen-scientists (accessed on 15 October 2021)
EPA’s Air Quality Flag Program:
https://www.airnow.gov/index.cfm?action=flag_program.index (accessed on 15 October 2021)
- Canada:
Government of Canada-Air Quality:
https://www.canada.ca/en/services/environment/weather/airquality.html (accessed on 15 October 2021)
Alberta-Ambient Air Quality Standards:
https://www.alberta.ca/canadian-ambient-air-quality-standards.aspx (accessed on 15 October 2021)
Ontario-Ministry of the Environment, Conservation and Parks:
http://www.airqualityontario.com/ (accessed on 15 October 2021)
Halton Region-Today’s Air Quality:
https://www.halton.ca/For-Residents/Environmental-Health/Outdoor-Air-Quality/Today%E2%80%99s-Air-Quality (accessed on 15 October 2021)
Public Health Ontario:
https://www.publichealthontario.ca/-/media/documents/a/2013/air-quality-health-index.pdf?sc_lang=en (accessed on 15 October 2021)
- Mexico:
Índice Metropolitano de la Calidad del Aire (IMECA):
http://www.sema.gob.mx/SGA-MONITOREO-INDICE.php (accessed on 15 October 2021)
Gobierno de la Ciudad de Mexico-Índice AIRE Y SALUD:
http://www.aire.cdmx.gob.mx/default.php (accessed on 15 October 2021)
- Argentina:
Argentina.gob.ar:
https://www.argentina.gob.ar/salud/ambiental/normativas (accessed on 15 October 2021)
Bahia-Municipio de Bahia Blanca:
https://www.bahia.gob.ar/cte/calidadaire/ (accessed on 15 October 2021)
Buenos Aires Ciudad Red de Monitoreo:
https://www.buenosaires.gob.ar/areas/med_ambiente/apra/calidad_amb/red_monitoreo/mapa.php?menu_id=32434 (accessed on 15 October 2021)
- Brazil:
Ministerio Nacional do Meio Ambiente—Conama:
http://www2.mma.gov.br/port/conama/legiabre.cfm?codlegi=740, (accessed on 18 October 2021)
Saopaulo.sp.gov.br- Qualidade do Ar:
https://cetesb.sp.gov.br/ar/padroes-de-qualidade-do-ar/, (accessed on 18 October 2021)
Indice de qualidade do Ar:
http://jeap.rio.rj.gov.br/je-metinfosmac/institucional/docs/entenda_iqa.pdf, (accessed on 18 October 2021).
MonitoArRio:
http://jeap.rio.rj.gov.br/je-metinfosmac/boletim, (accessed on 18 October 2021)
- Chile:
Ministerio del Medio Ambiente (Gobierno de Chile)-Sinca (Sistema de Informacion Nacional de Calidad del Aire)
https://sinca.mma.gob.cl/ (accessed on 18 October 2021)
Aire Santiago:
http://airesantiago.gob.cl/calidad-del-aire/ (accessed on 18 October 2021)
- Colombia:
Area Metropolitana Valle de Aburrá:
https://www.metropol.gov.co/ambiental/calidad-del-aire/Paginas/Generalidades/ICA.aspx (accessed on 18 October 2021)
Iboca (Indice Bogotano de Calidad del Aire):
http://iboca.ambientebogota.gov.co/mapa/ (accessed on 18 October 2021)
- Peru:
Info Aire—Peru Minsterio del Ambiente:
https://infoaireperu.minam.gob.pe/infoaire/ (accessed on 18 October 2021)
Sinia (Sistema Nacional de Informacio Ambiental):
https://sinia.minam.gob.pe/informacion/mapas (accessed on 18 October 2021)
- Uruguay:
Intendencia Montevideo—Calidad del Aire:
https://montevideo.gub.uy/areas-tematicas/ambiente/calidad-del-aire (accessed on 18 October 2021)
- India:
India National Clean Air Programme (NCAP). Available online: https://urbanemissions.info/blog-pieces/india-ncap-review/ (accessed on 10 September 2021).
Central Control Room for Air Quality Management. Available online: https://app.cpcbccr.com/ccr/#/login (accessed on 10 September 2021)
- Republic of Korea:
AirKorea, 2021. Real-Time Air Quality. Available online: https://www.airkorea.or.kr/eng (accessed on 8 September 2021).
- China:
Ministry of Ecology and Environment. Available online: http://english.mee.gov.cn/Resources/standards/Air_Environment/quality_standard1/201605/t20160511_337502.shtml (accessed on 6 September 2021).
- Thailand:
Pollution Control Department, the World Bank and the United States-Asia Environmental Partnership. Thailand Environment Monitor 2002, Available online: URL.https://documents1.worldbank.org/curated/en/710411468778515943/pdf/263950PAPER0English0Thailand0Env0Monitor.pdf (accessed on 6 September 2021).
EANET, ACID DEPOSITION MONITORING NETWORK IN EAST ASIA, 2020, THAILAND—Policies and Practices Concerning Acid Deposition URL https://www.eanet.asia/wp-content/uploads/2020/04/12-Thailand_Factsheet_compressed.pdf (accessed on 6 September 2021).
Bangkok Air Quality, 2021, Available online: https://bangkokairquality.com/bma/aqi?lang=en (accessed on 8 September 2021).
- Australia:
NEPM, National Environment Protection (Ambient Air Quality) Measure. Available online: https://www.legislation.gov.au/Details/F2021C00475/Download 2021 (accessed on 11 October 2021).
New South Wales (NSW), Government, 2021. Available online: https://www.environment.nsw.gov.au/topics/air/understanding-air-quality-data/air-quality-categories (accessed on 11 October 2021).
SOE, 2021. https://soe.environment.gov.au/theme/ambient-air-quality/topic/2016/air-quality-index (accessed on 11 October 2021).
References
- World Health Organization. WHO Global Air Quality Guidelines: Particulate Matter (PM2.5 and PM10), Ozone, Nitrogen Dioxide, Sulfur Dioxide and Carbon Monoxide; World Health Organization: Geneva, Switzerland, 2021; pp. 1–267. Available online: https://apps.who.int/iris/handle/10665/345329 (accessed on 10 October 2021).
- European Environment Agency. Air Quality in Europe—2020 report. EEA Rep. N 2020, 9, 1–160. [Google Scholar] [CrossRef]
- Karavas, Z.; Karayannis, V.; Moustakas, K. Comparative study of air quality indexes in the European Union towards adopting a common air quality index. Energy Environ. 2020, 32, 959–980. [Google Scholar] [CrossRef]
- Kowalska, M.; Ośródka, L.; Klejnowski, K.; Zejda, J.E.; Krajny, E.; Wojtylak, M. Air quality index and its significance in environmental health risk communication. Arch. Environ. Prot. 2009, 35, 13–21. [Google Scholar]
- Mirabelli, M.C.; Ebelt, S.; Damon, S.A. Air Quality Index and air quality awareness among adults in the United States. Environ. Res. 2020, 183, 109185. [Google Scholar] [CrossRef] [PubMed]
- Sharma, M.; Maheshwari, M.; Sengupta, B.; Shukla, B.P. Design of a website for dissemination of air quality index in India. Environ. Model. Softw. 2003, 18, 405–411. [Google Scholar] [CrossRef]
- Delmas, M.A.; Kohli, A. Can Apps Make Air Pollution Visible? Learning About Health Impacts Through Engagement with Air Quality Information. J. Bus. Ethics 2020, 161, 279–302. [Google Scholar] [CrossRef] [Green Version]
- Nikam, J.; Archer, D.; Nopsert, C. Air Quality in Thailand: Understanding the Regulatory Context; SEI Working Paper; Stockholm Environment Institute: Stockholm, Sweden, 2021; pp. 1–44. [Google Scholar]
- Perlmutt, L.; Stieb, D.; Cromar, K. Accuracy of quantification of risk using a single pollutant Air Quality Index. J. Expo. Sci. Environ. Epidemiol. 2017, 27, 24–32. [Google Scholar] [CrossRef]
- Tan, X.; Han, L.; Zhang, X.; Zhou, W.; Li, W.; Qian, Y. A review of current air quality indexes and improvements under the multi-contaminant air pollution exposure. J. Environ. Manage. 2021, 279, 111681. [Google Scholar] [CrossRef]
- Kumari, S.; Jain, M.K. A critical review on air quality index. Environ. Pollut. 2018, 77, 87–102. [Google Scholar]
- Monteiro, A.; Vieira, M.; Gama, C.; Miranda, A.I. Towards an improved air quality index. Air Qual. Atmos. Health 2017, 10, 447–455. [Google Scholar] [CrossRef]
- Kanchan, K.; Gorai, A.K.; Goyal, P. A Review on Air Quality Indexing System. Asian J. Atmos. Environ. 2015, 9, 101–113. [Google Scholar] [CrossRef] [Green Version]
- Plaia, A.; Di Salvo, F.; Ruggieri, M.; Agro’, G. A Multisite-Multipollutant Air Quality Index. Atmos. Environ. 2013, 70, 387–391. [Google Scholar] [CrossRef]
- Plaia, A.; Ruggieri, M. Air quality indexes: A review. Rev. Environ. Sci. Biotechnol. 2011, 10, 165–179. [Google Scholar] [CrossRef]
- Beaumont, R.; Hamilton, R.S.; Machin, N.; Perks, J.; Williams, I.D. Social awareness of air quality information. Sci. Total Environ. 1999, 235, 319–329. [Google Scholar] [CrossRef]
- Qian, X.; Xu, G.; Li, L.; Shen, Y.; He, T.; Liang, Y.; Yang, Z.; Zhou, W.W.; Xu, J. Knowledge and perceptions of air pollution in Ningbo, China. BMC Public Health 2016, 16, 1138. [Google Scholar] [CrossRef] [Green Version]
- Borbet, T.C.; Gladson, L.A.; Croma, K.R. Assessing air quality index awareness and use in Mexico City. BMC Public Health 2018, 18, 538. [Google Scholar] [CrossRef] [PubMed] [Green Version]
- Magaña-Villegas, E.; Díaz-López, M.C.; Ramos-Herrera, S.; Carrera-Velueta, J.M.; Vilchis-Peralta, O.J. Air quality trend and proposal of a web application for the atmospheric monitoring network in Tabasco, México. Tecciencia 2020, 15, 15–27. [Google Scholar] [CrossRef]
- Lokys, H.L.; Junk, J.; Krein, A. Making air quality indexes comparable—Assessment of 10 years of air pollutant levels in Western Europe. Int. J. Environ. Health Res. 2015, 25, 52–66. [Google Scholar] [CrossRef] [PubMed]
- Molina, L.T.; Velasco, E.; Retama, A.; Zavala, M. Experience from Integrated Air Quality Management in the Mexico City Metropolitan Area and Singapore. Atmosphere 2019, 10, 512. [Google Scholar] [CrossRef] [Green Version]
- Rodrigues, M. Brazil launches air-quality-monitoring program. Chem. Eng. News 2019, 97, 19. [Google Scholar] [CrossRef]
- Siciliano, B.; Dantas, G.; da Silva, C.M.; Arbilla, G. The updated Brazilian National Air Quality Standards: A critical review. J. Braz. Chem. Soc. 2020, 31, 523–535. [Google Scholar] [CrossRef]
- Jaramillo, M.; González, D.E.; Núñez, M.E.; Portilla, G. Integrated air quality index for Colombian cities. Rev. Fac. Ing. Univ. Antioq. 2013, 48, 97–106. [Google Scholar]
- CPCB. National Air Quality Index; Central Pollution Control Board (CPCB): New Delhi, India, 2014; pp. 1–55. Available online: https://app.cpcbccr.com/ccr_docs/FINAL-REPORT_AQI_.pdf (accessed on 7 September 2021).
- Ministry of Environmental Protection of the People’s Republic of China (MEP). National Ambient Air Quality Standard, GB 3095-2012; China Environmental Science Press: Beijing, China, 2012. Available online: http://english.mee.gov.cn/Resources/standards/Air_Environment/quality_standard1/201605/t20160511_337502.shtml (accessed on 8 September 2021).
- Chen, W.; Tang, H.; Zhao, H. Urban air quality evaluations under two versions of the national ambient air quality standards of China. Atmos. Pollut. Res. 2016, 7, 49–57. [Google Scholar] [CrossRef]
- Zhan, D.; Kwan, M.P.; Zhang, W.; Yu, X.; Meng, B.; Liu, Q. The driving factors of air quality index in China. J. Clean. Prod. 2018, 197, 1342–1351. [Google Scholar] [CrossRef]
- Phruksahiran, N. Improvement of air quality index prediction using geographically weighted predictor methodology. Urban. Clim. 2021, 38, 1–12. [Google Scholar] [CrossRef]
- Mayer, H.; Makra, L.; Kalberlah, F.; Ahrens, D.; Reuter, U. Air stress and air quality indexes. Meteoro. Z. 2004, 13, 395–403. [Google Scholar] [CrossRef]
- Swamee, P.K.; Tyagi, A. Formation of an air pollution index. J. Air Waste Manag. Assoc. 1999, 49, 88–91. [Google Scholar] [CrossRef] [PubMed]
- Kyrkilis, G.; Chaloulakou, A.; Kassomenos, P.A. Development of an aggregate Air Quality Index for an urban Mediterranean agglomeration: Relation to potential health effects. Environ. Int. 2007, 33, 670–676. [Google Scholar] [CrossRef]
- Cairncross, E.K.; John, J.; Zunckel, M. A novel air pollution index based on the relative risk of daily mortality associated with short-term exposure to common air pollutants. Atmos. Environ. 2007, 41, 8442–8454. [Google Scholar] [CrossRef]
- Murena, F. Measuring air quality over large urban areas: Development and application of an air pollution index at the urban area of Naples. Atmos. Environ. 2004, 38, 6195–6202. [Google Scholar] [CrossRef]
- Cheng, W. Revised air quality index derived from an entropy function. Atmos. Environ. 2004, 38, 383–391. [Google Scholar] [CrossRef]
- Bishoi, B.; Prakash, A.; Jain, V.A. Comparative Study of Air Quality Index Based on Factor Analysis and US-EPA Methods for an Urban Environment. Aerosol Air Qual. Res. 2009, 9, 1–17. [Google Scholar] [CrossRef]
- Bruno, F.; Cocchi, D. A unified strategy for building simple air quality indexes. Environ. Metr. 2002, 13, 243–261. [Google Scholar]
- Passamani, G.; Masotti, P.A. Synthetic Air Pollution Index Using a T2 Approach. Annali del Dipartimento di Metodi e Modelli per l’Economia, il Territorio e la Finanza. 2020. Available online: https://web.uniroma1.it/memotef/annali-memotef-2020-online-first (accessed on 16 September 2021).
- Maynard, R.L.; Coster, S.M. Informing the Public about Air Pollution. Air Pollution and Health; Academic Press: Cambridge, MA, USA, 1999; pp. 1019–1033. [Google Scholar]
- Stieb, D.M.; Burnett, R.T.; Smith-Doiron, M.; Brion, O.; Shin, H.H.; Economou, V. A new multipollutant, No-threshold air quality health index based on short-term associations observed in daily time-series analyses. J. Air Waste Manag. Assoc. 2008, 58, 435–450. [Google Scholar] [CrossRef] [PubMed] [Green Version]
Figure 1.
(a) NO2 concentration corresponding to AQI classes in different countries (on 1 h basis, except for China and India, which averaged over 24 h). The red line represents the USA standard. (b). Normalized NO2 AQI values (based on 1-h averaged concentrations).
Figure 1.
(a) NO2 concentration corresponding to AQI classes in different countries (on 1 h basis, except for China and India, which averaged over 24 h). The red line represents the USA standard. (b). Normalized NO2 AQI values (based on 1-h averaged concentrations).


Figure 2.
(a) SO2 concentration corresponding to AQI classes in different countries (above the bars, the daily averaging periods when applied). The red line represents the USA standard value. (b) Normalized SO2 AQI values (based on 1-h averaged concentrations).
Figure 2.
(a) SO2 concentration corresponding to AQI classes in different countries (above the bars, the daily averaging periods when applied). The red line represents the USA standard value. (b) Normalized SO2 AQI values (based on 1-h averaged concentrations).

Figure 3.
(a) PM10 concentration associated with AQI classes in different countries (above the bars, the averaging periods when different from 24 h). The red line represents the USA standard value. (b) Normalized PM10 AQI values (based on 24-h averaged concentrations).
Figure 3.
(a) PM10 concentration associated with AQI classes in different countries (above the bars, the averaging periods when different from 24 h). The red line represents the USA standard value. (b) Normalized PM10 AQI values (based on 24-h averaged concentrations).


Figure 4.
(a) PM2.5 concentration associated with AQI classes in different countries (above the bars, the averaging periods when different from 24 h). The red line represents the USA standard value. (b) Normalized PM2.5 AQI values (based on 24-h averaged concentrations).
Figure 4.
(a) PM2.5 concentration associated with AQI classes in different countries (above the bars, the averaging periods when different from 24 h). The red line represents the USA standard value. (b) Normalized PM2.5 AQI values (based on 24-h averaged concentrations).

Figure 5.
(a) O3 concentration corresponding to AQI classes in different countries (above the bars, the averaging periods when different from 1 h). The red line represents the USA standard value. (b) Normalized O3 AQI values (based on 8-h averaged concentrations).
Figure 5.
(a) O3 concentration corresponding to AQI classes in different countries (above the bars, the averaging periods when different from 1 h). The red line represents the USA standard value. (b) Normalized O3 AQI values (based on 8-h averaged concentrations).


Figure 6.
(a) CO concentration corresponding to AQI classes in different countries (above the bars, the averaging periods when different from 8 h). The red line represents the USA standard value. (b) Normalized CO AQI values (based on 8-h averaged concentrations).
Figure 6.
(a) CO concentration corresponding to AQI classes in different countries (above the bars, the averaging periods when different from 8 h). The red line represents the USA standard value. (b) Normalized CO AQI values (based on 8-h averaged concentrations).


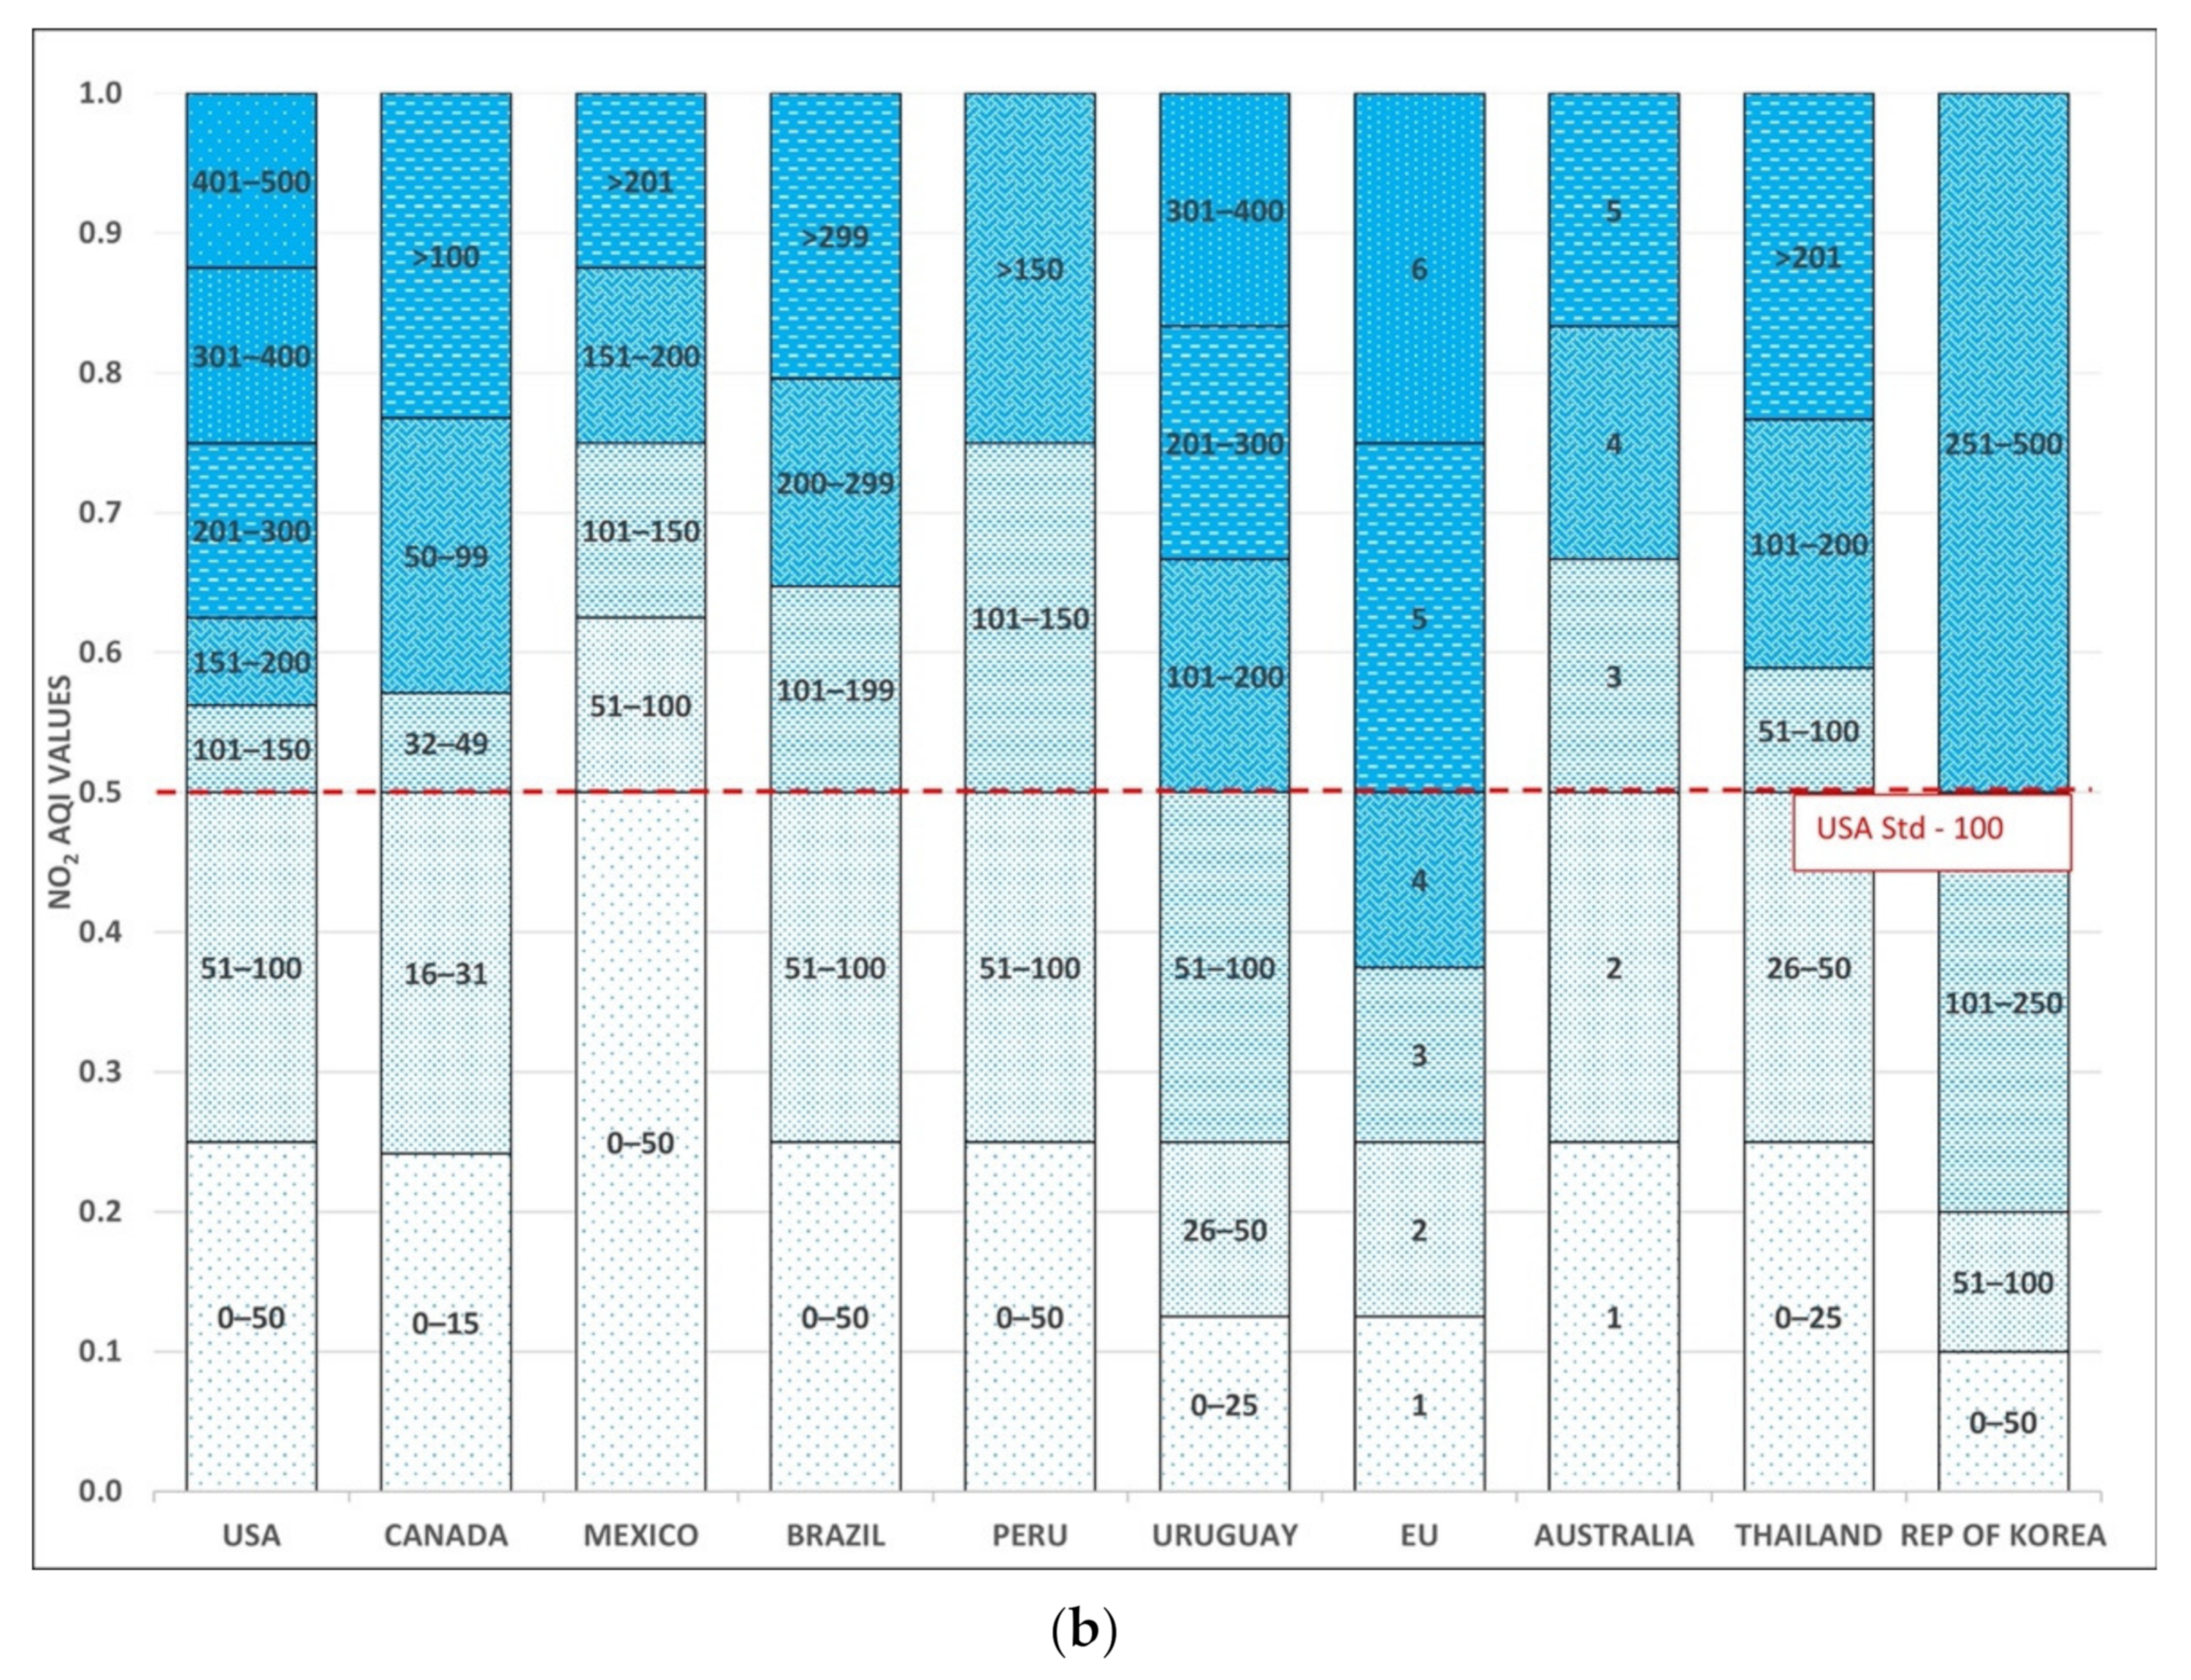
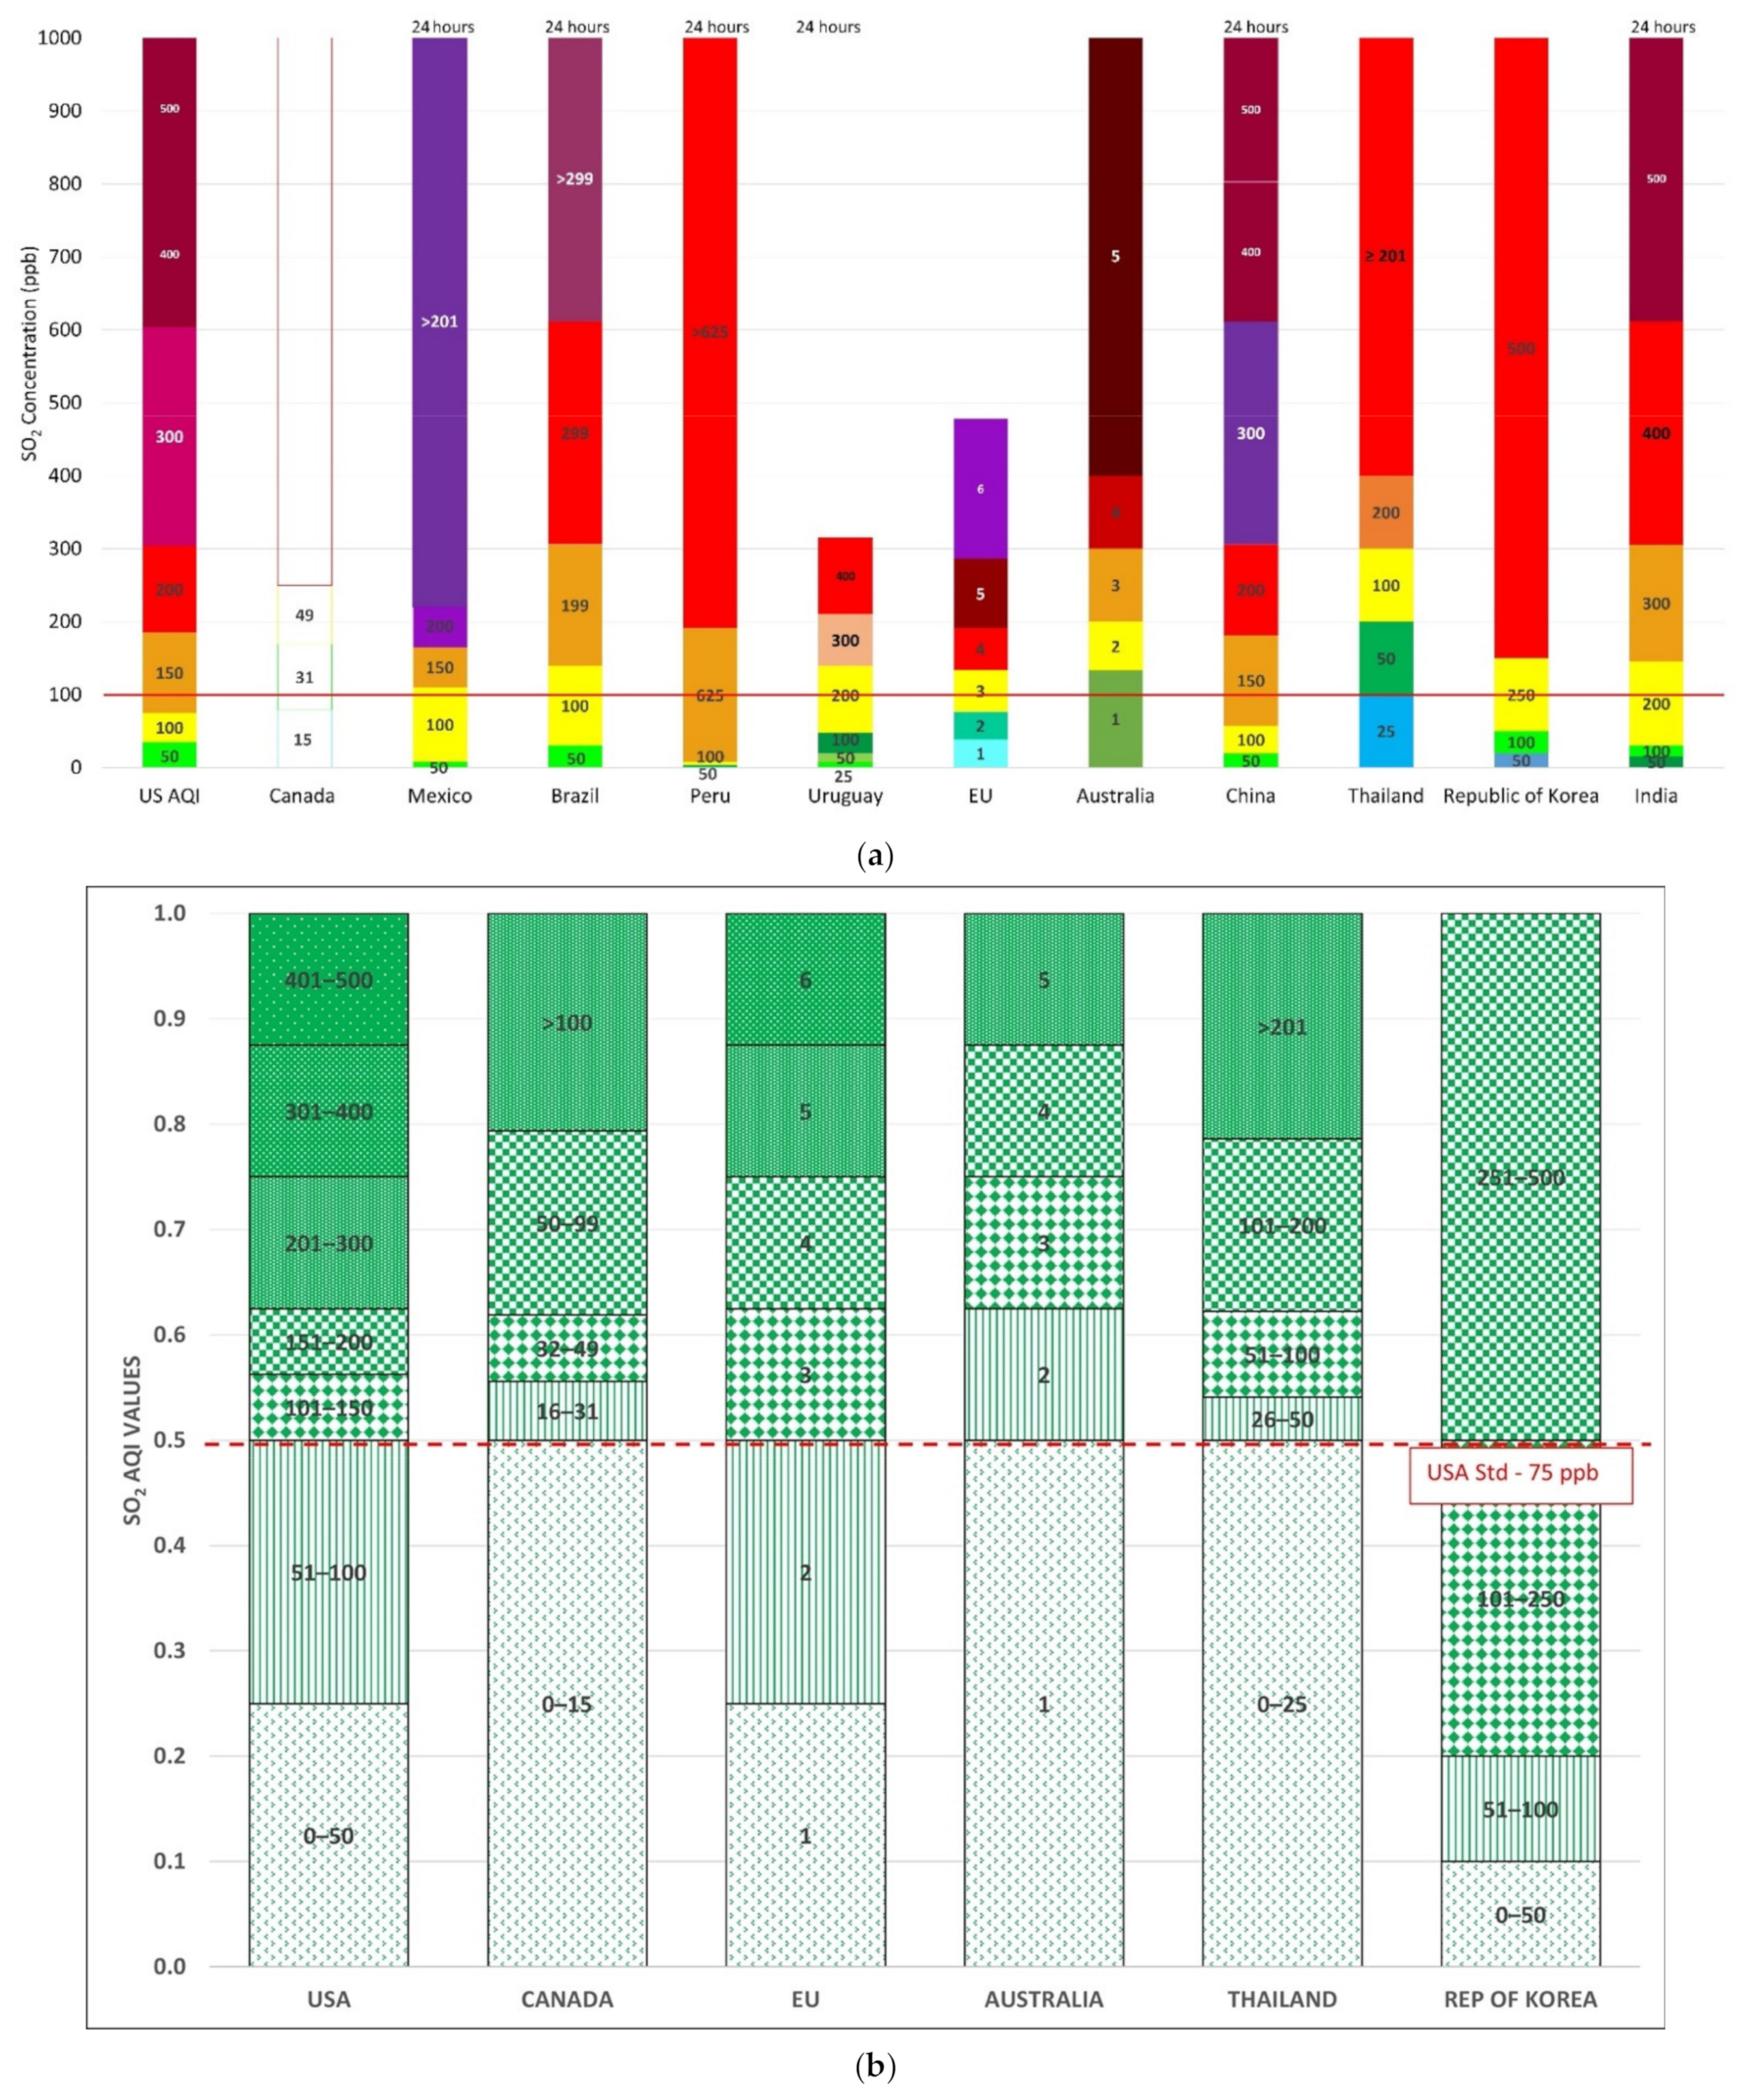
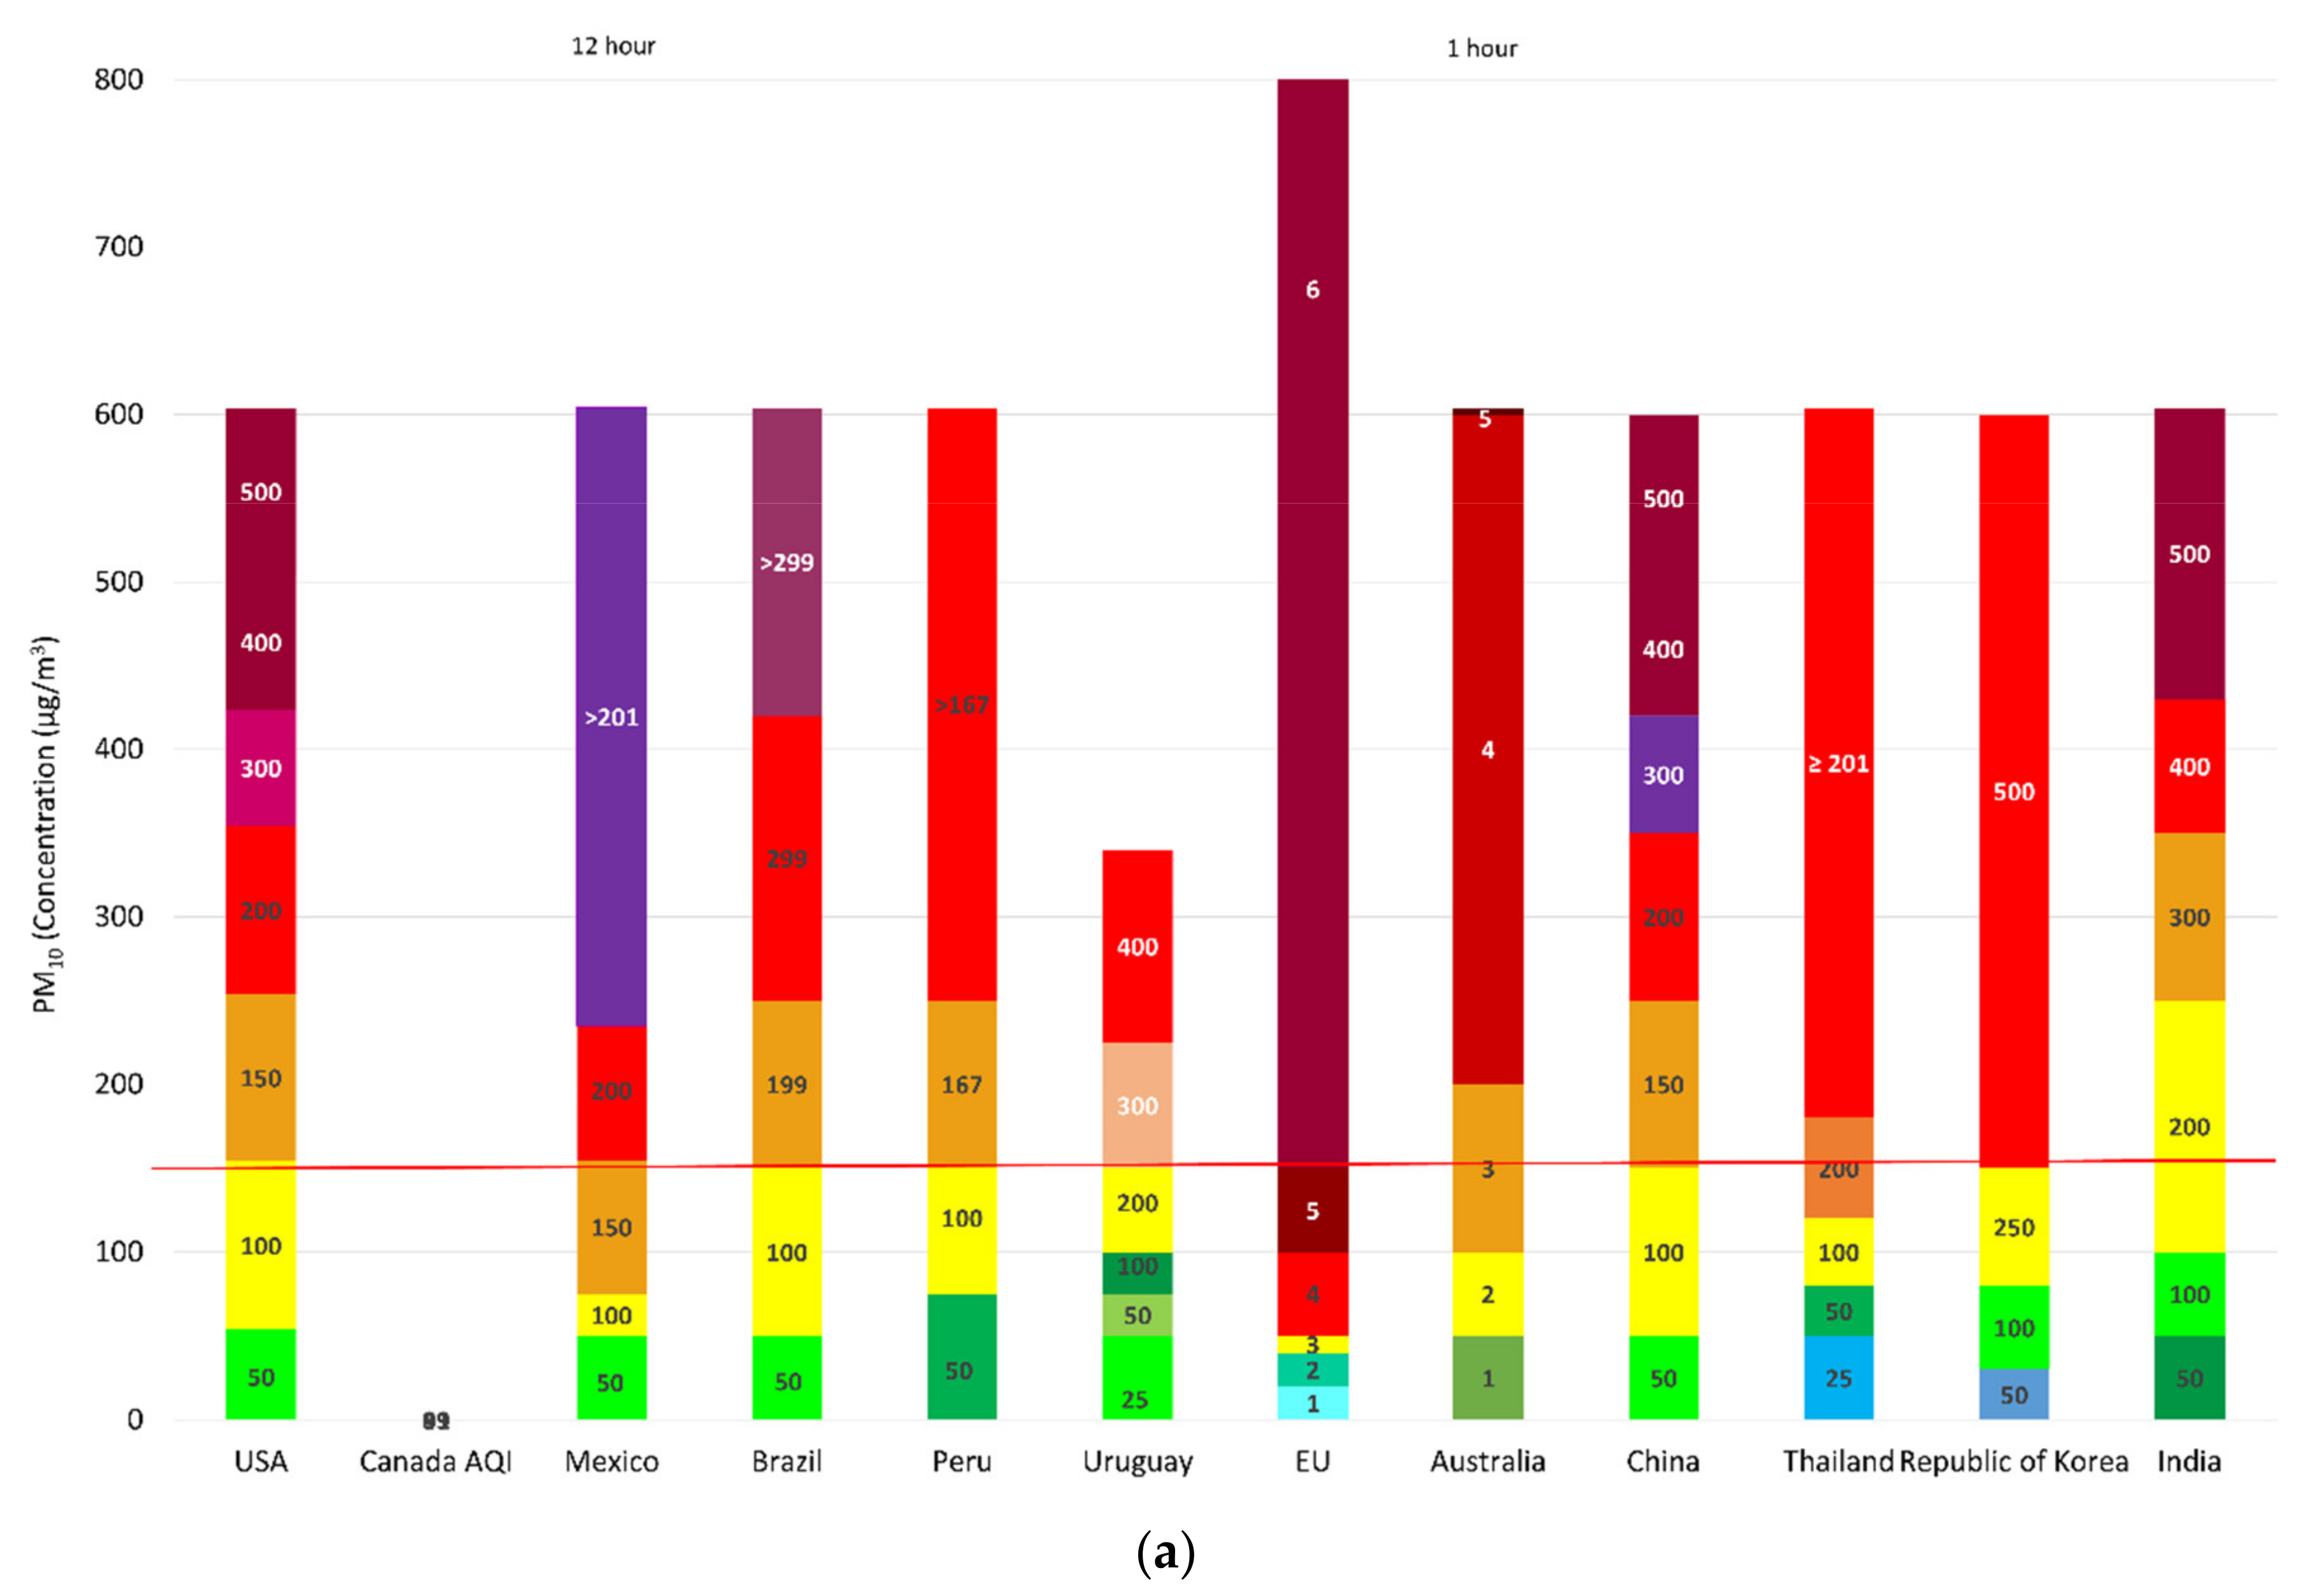
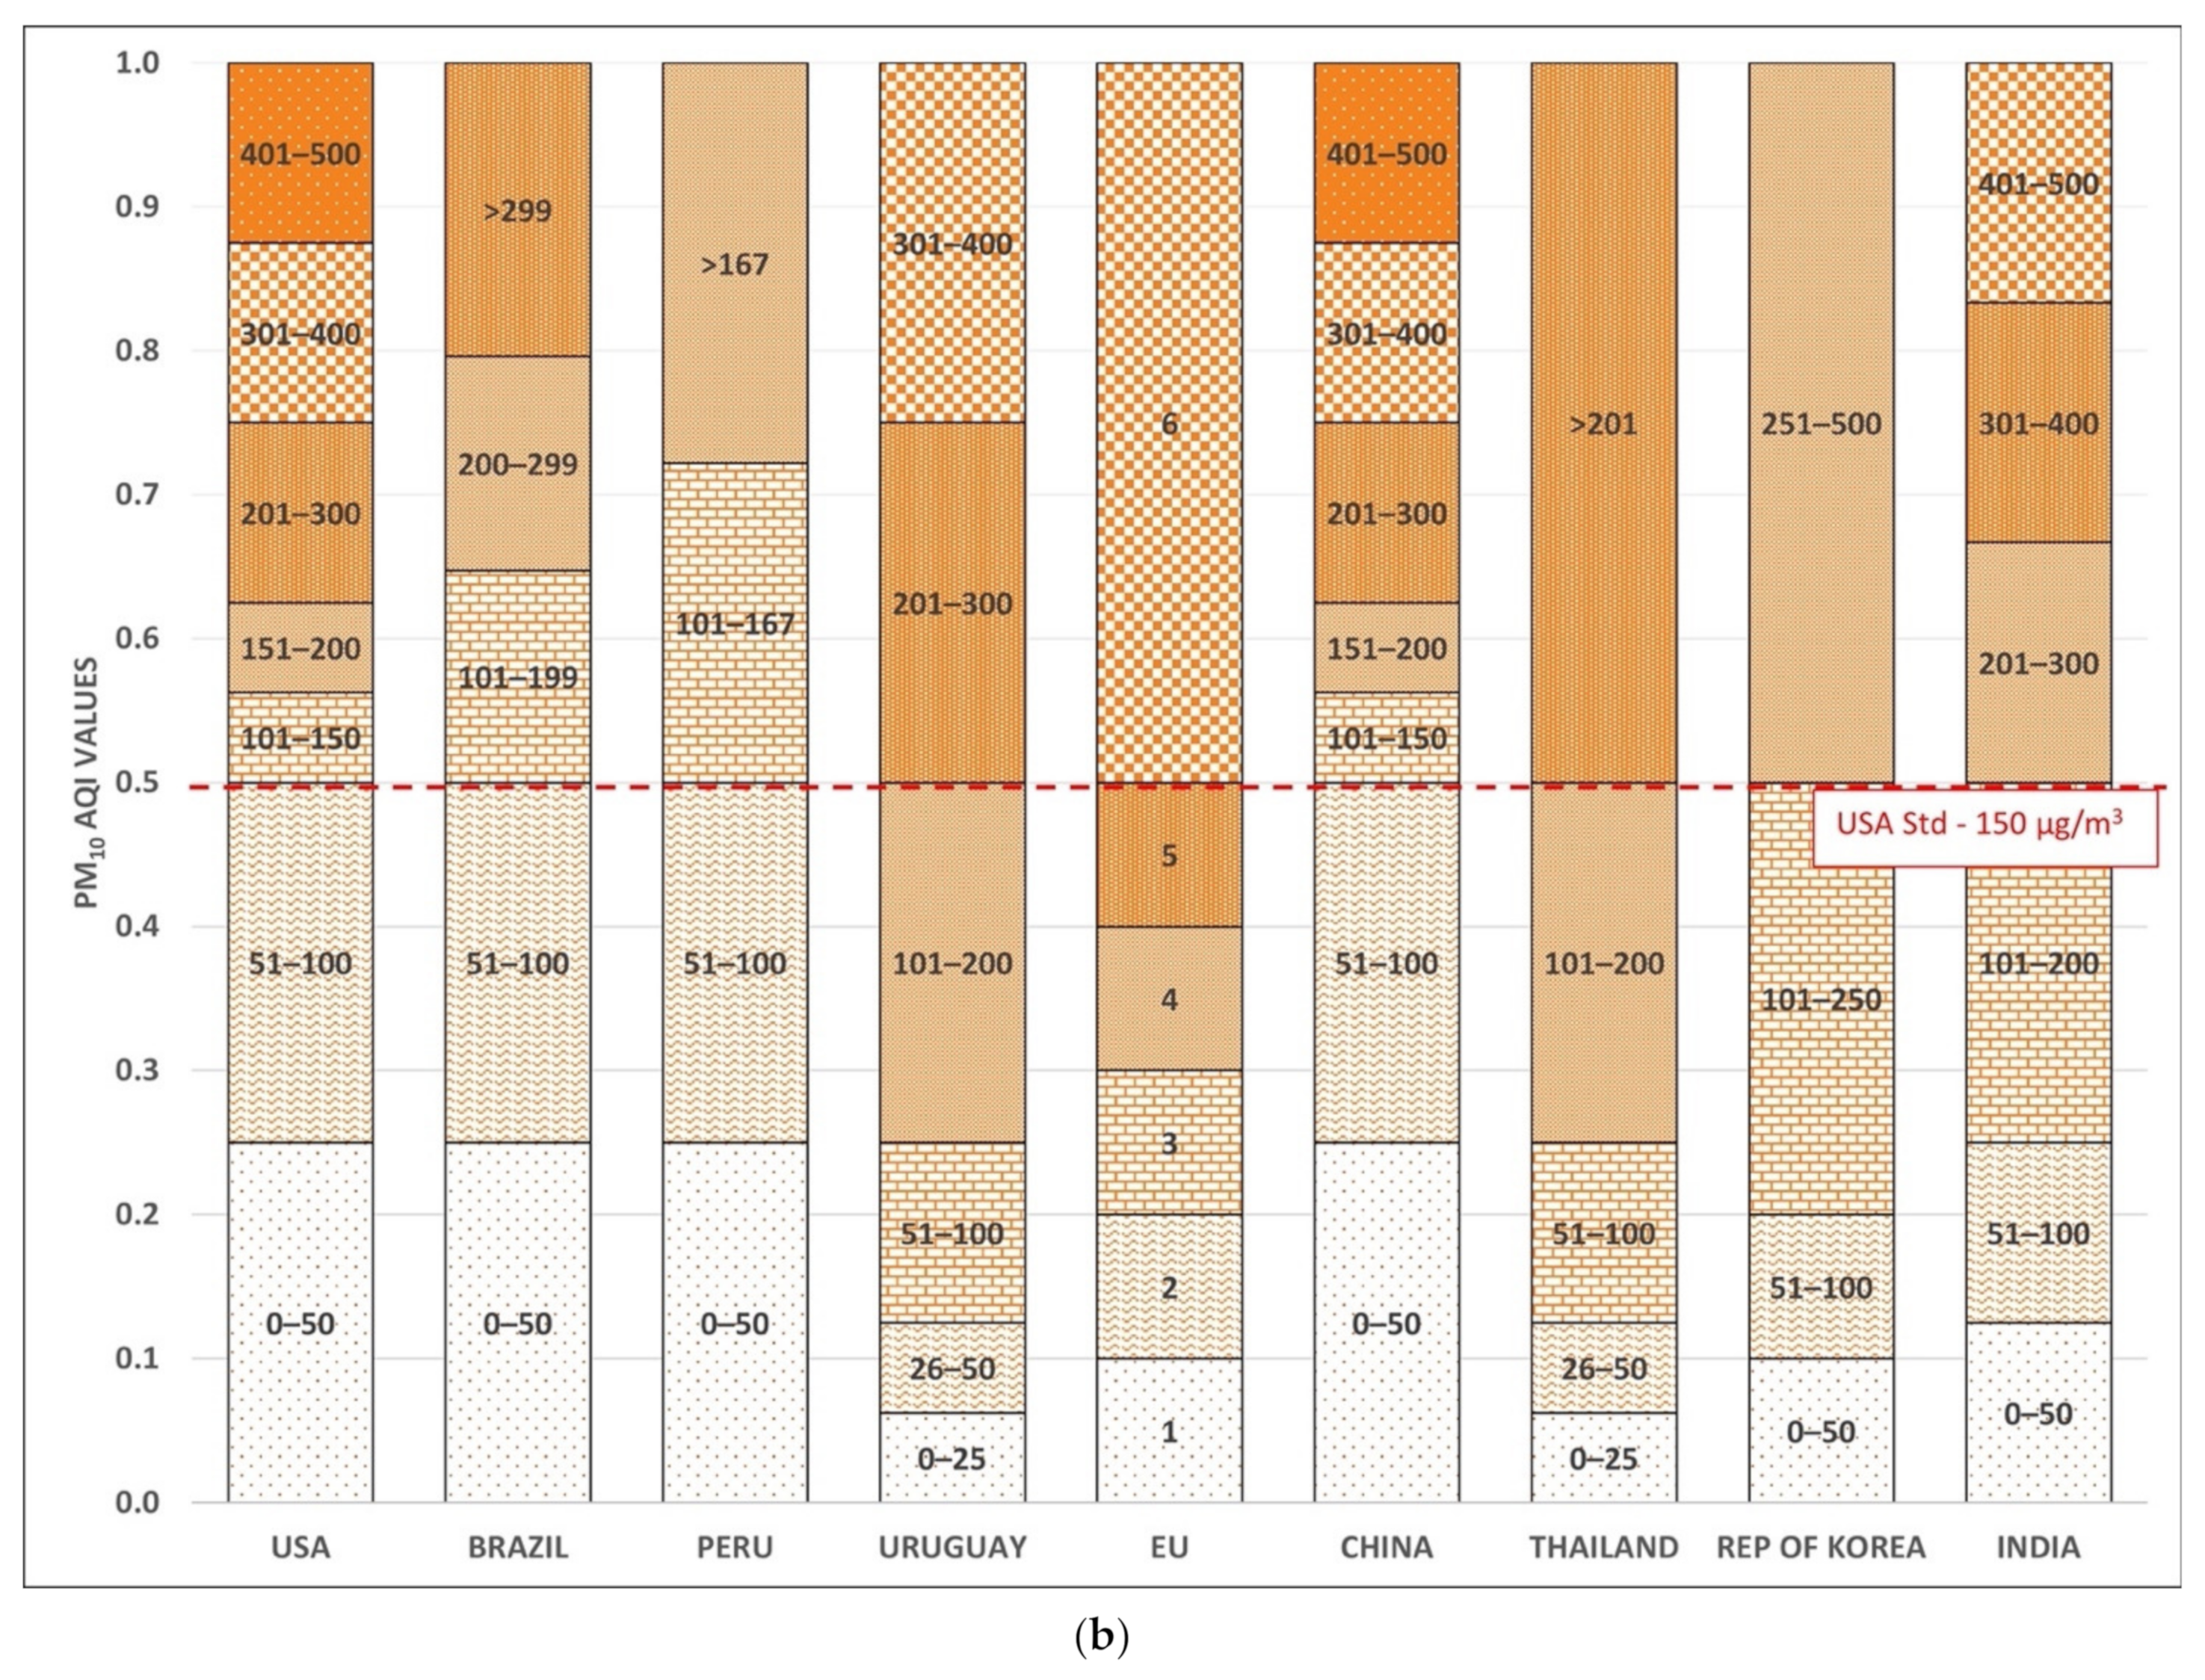
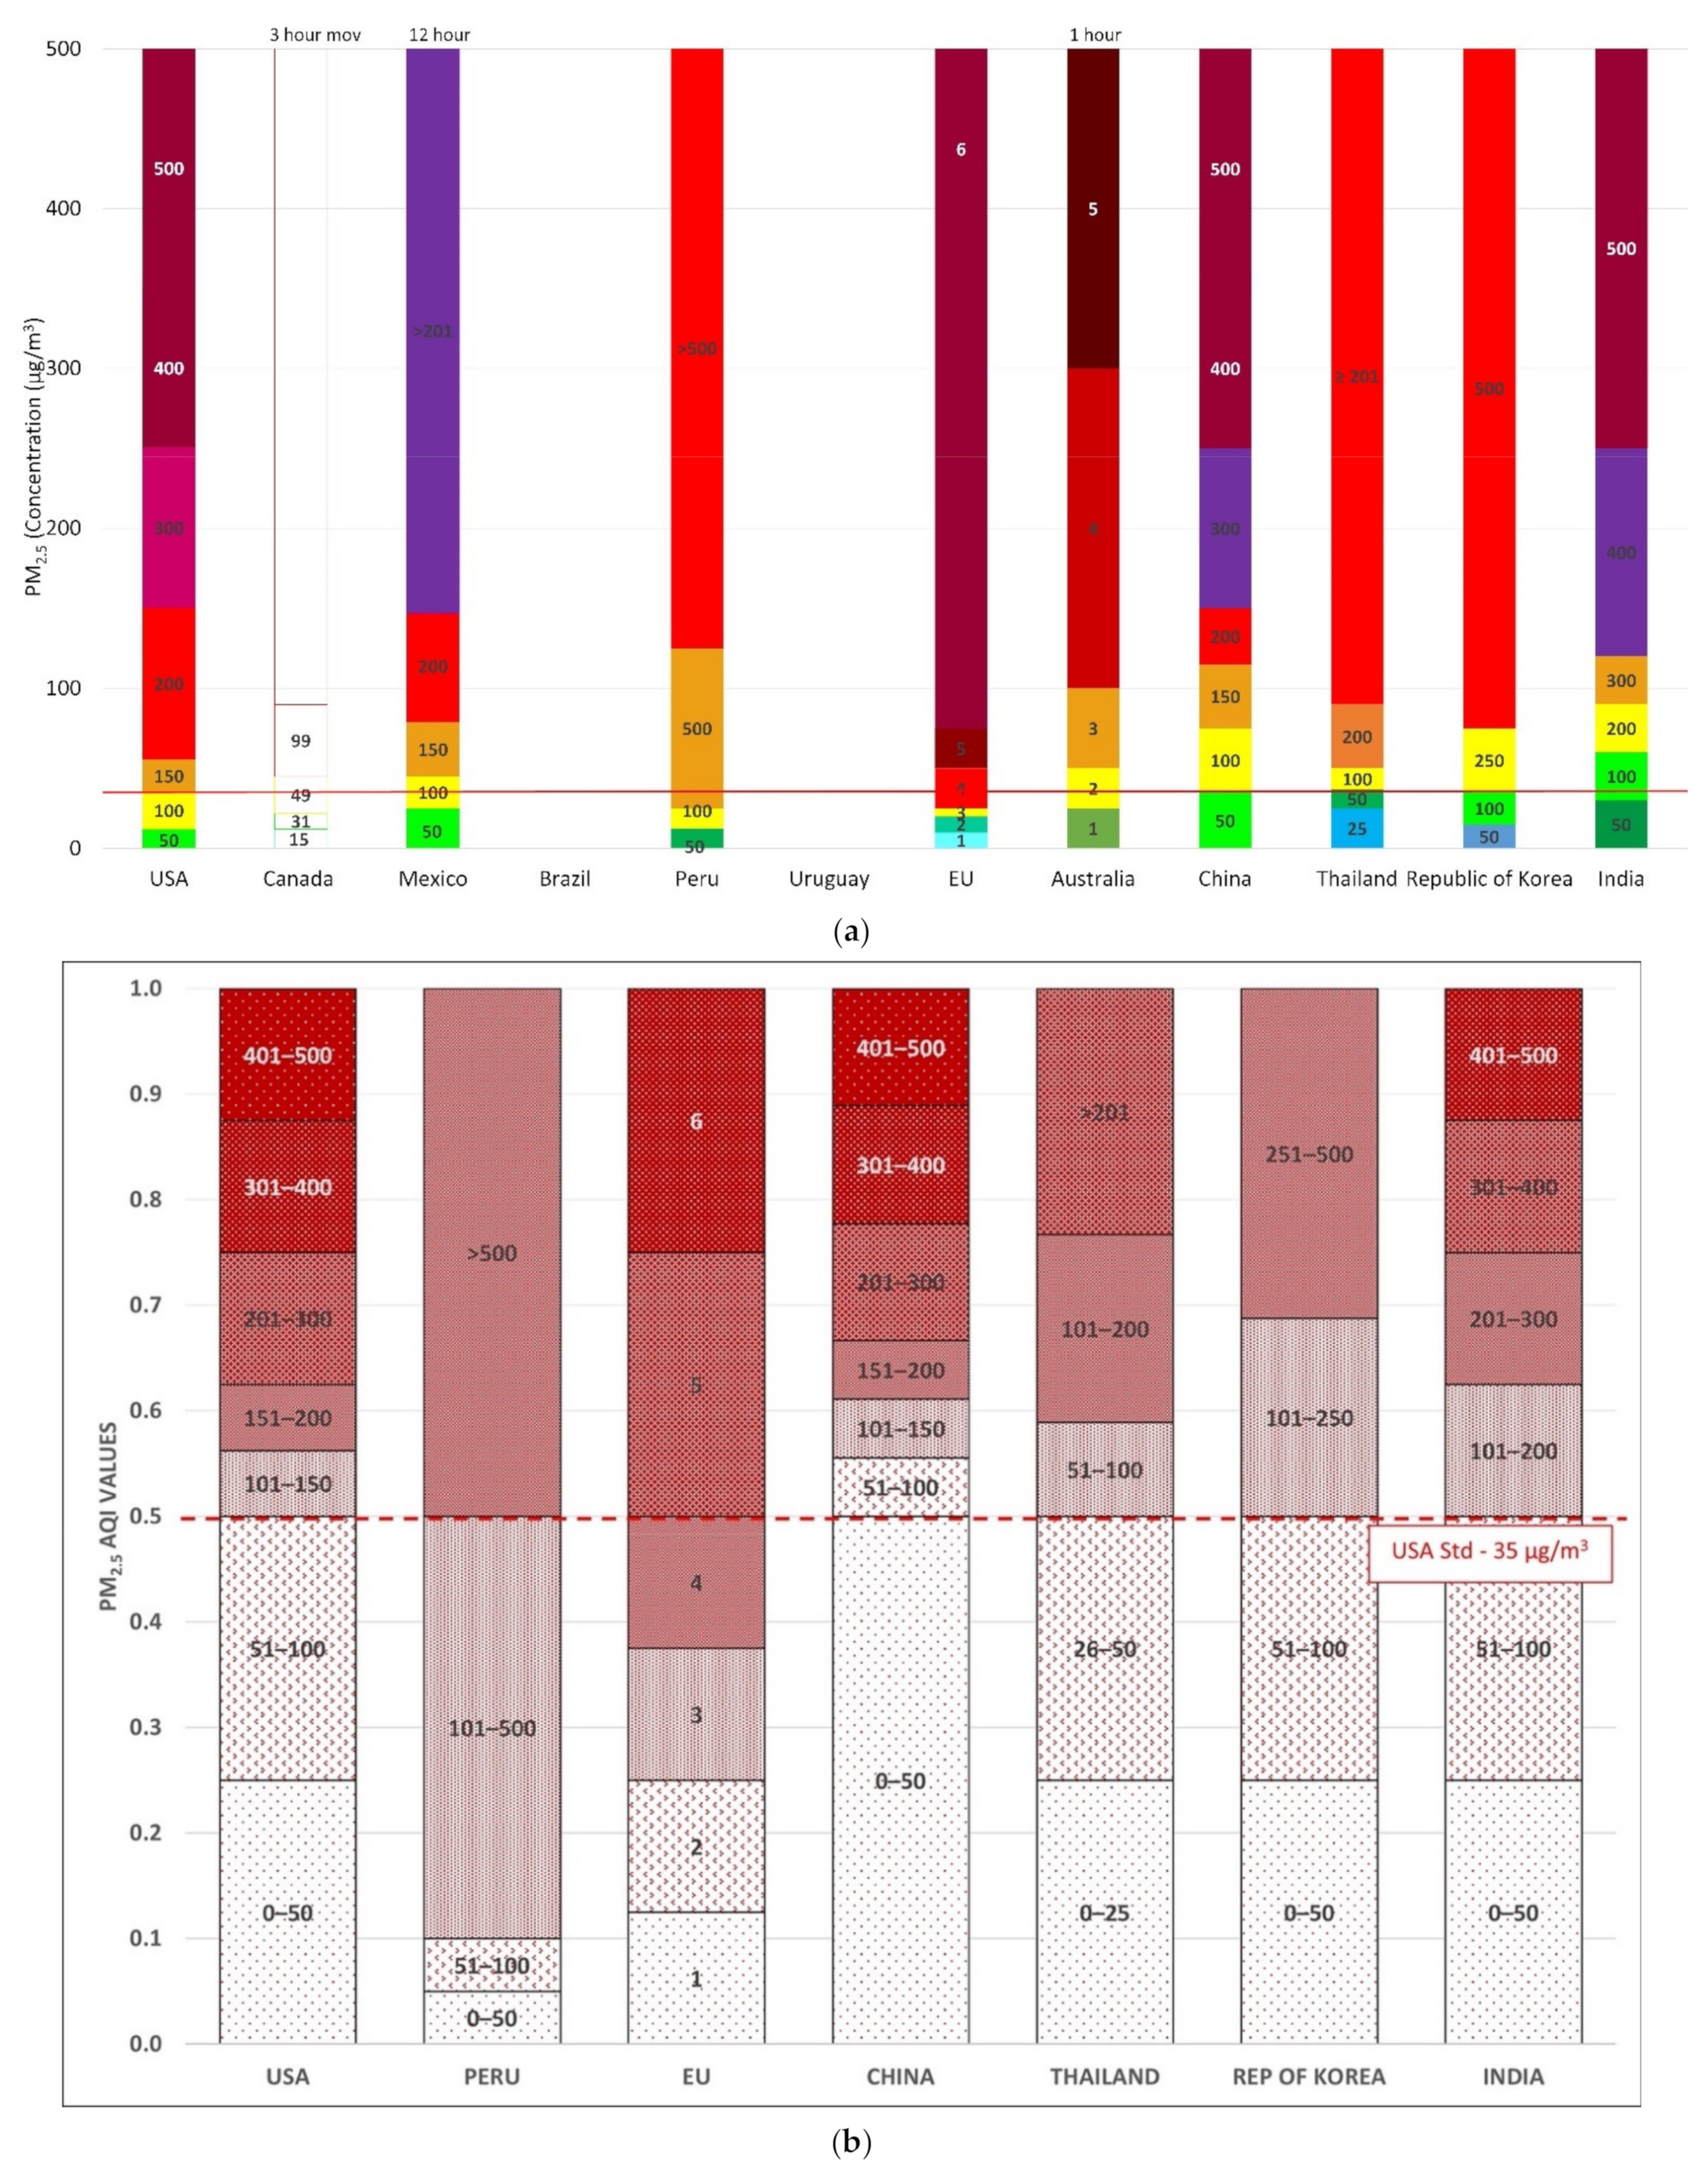
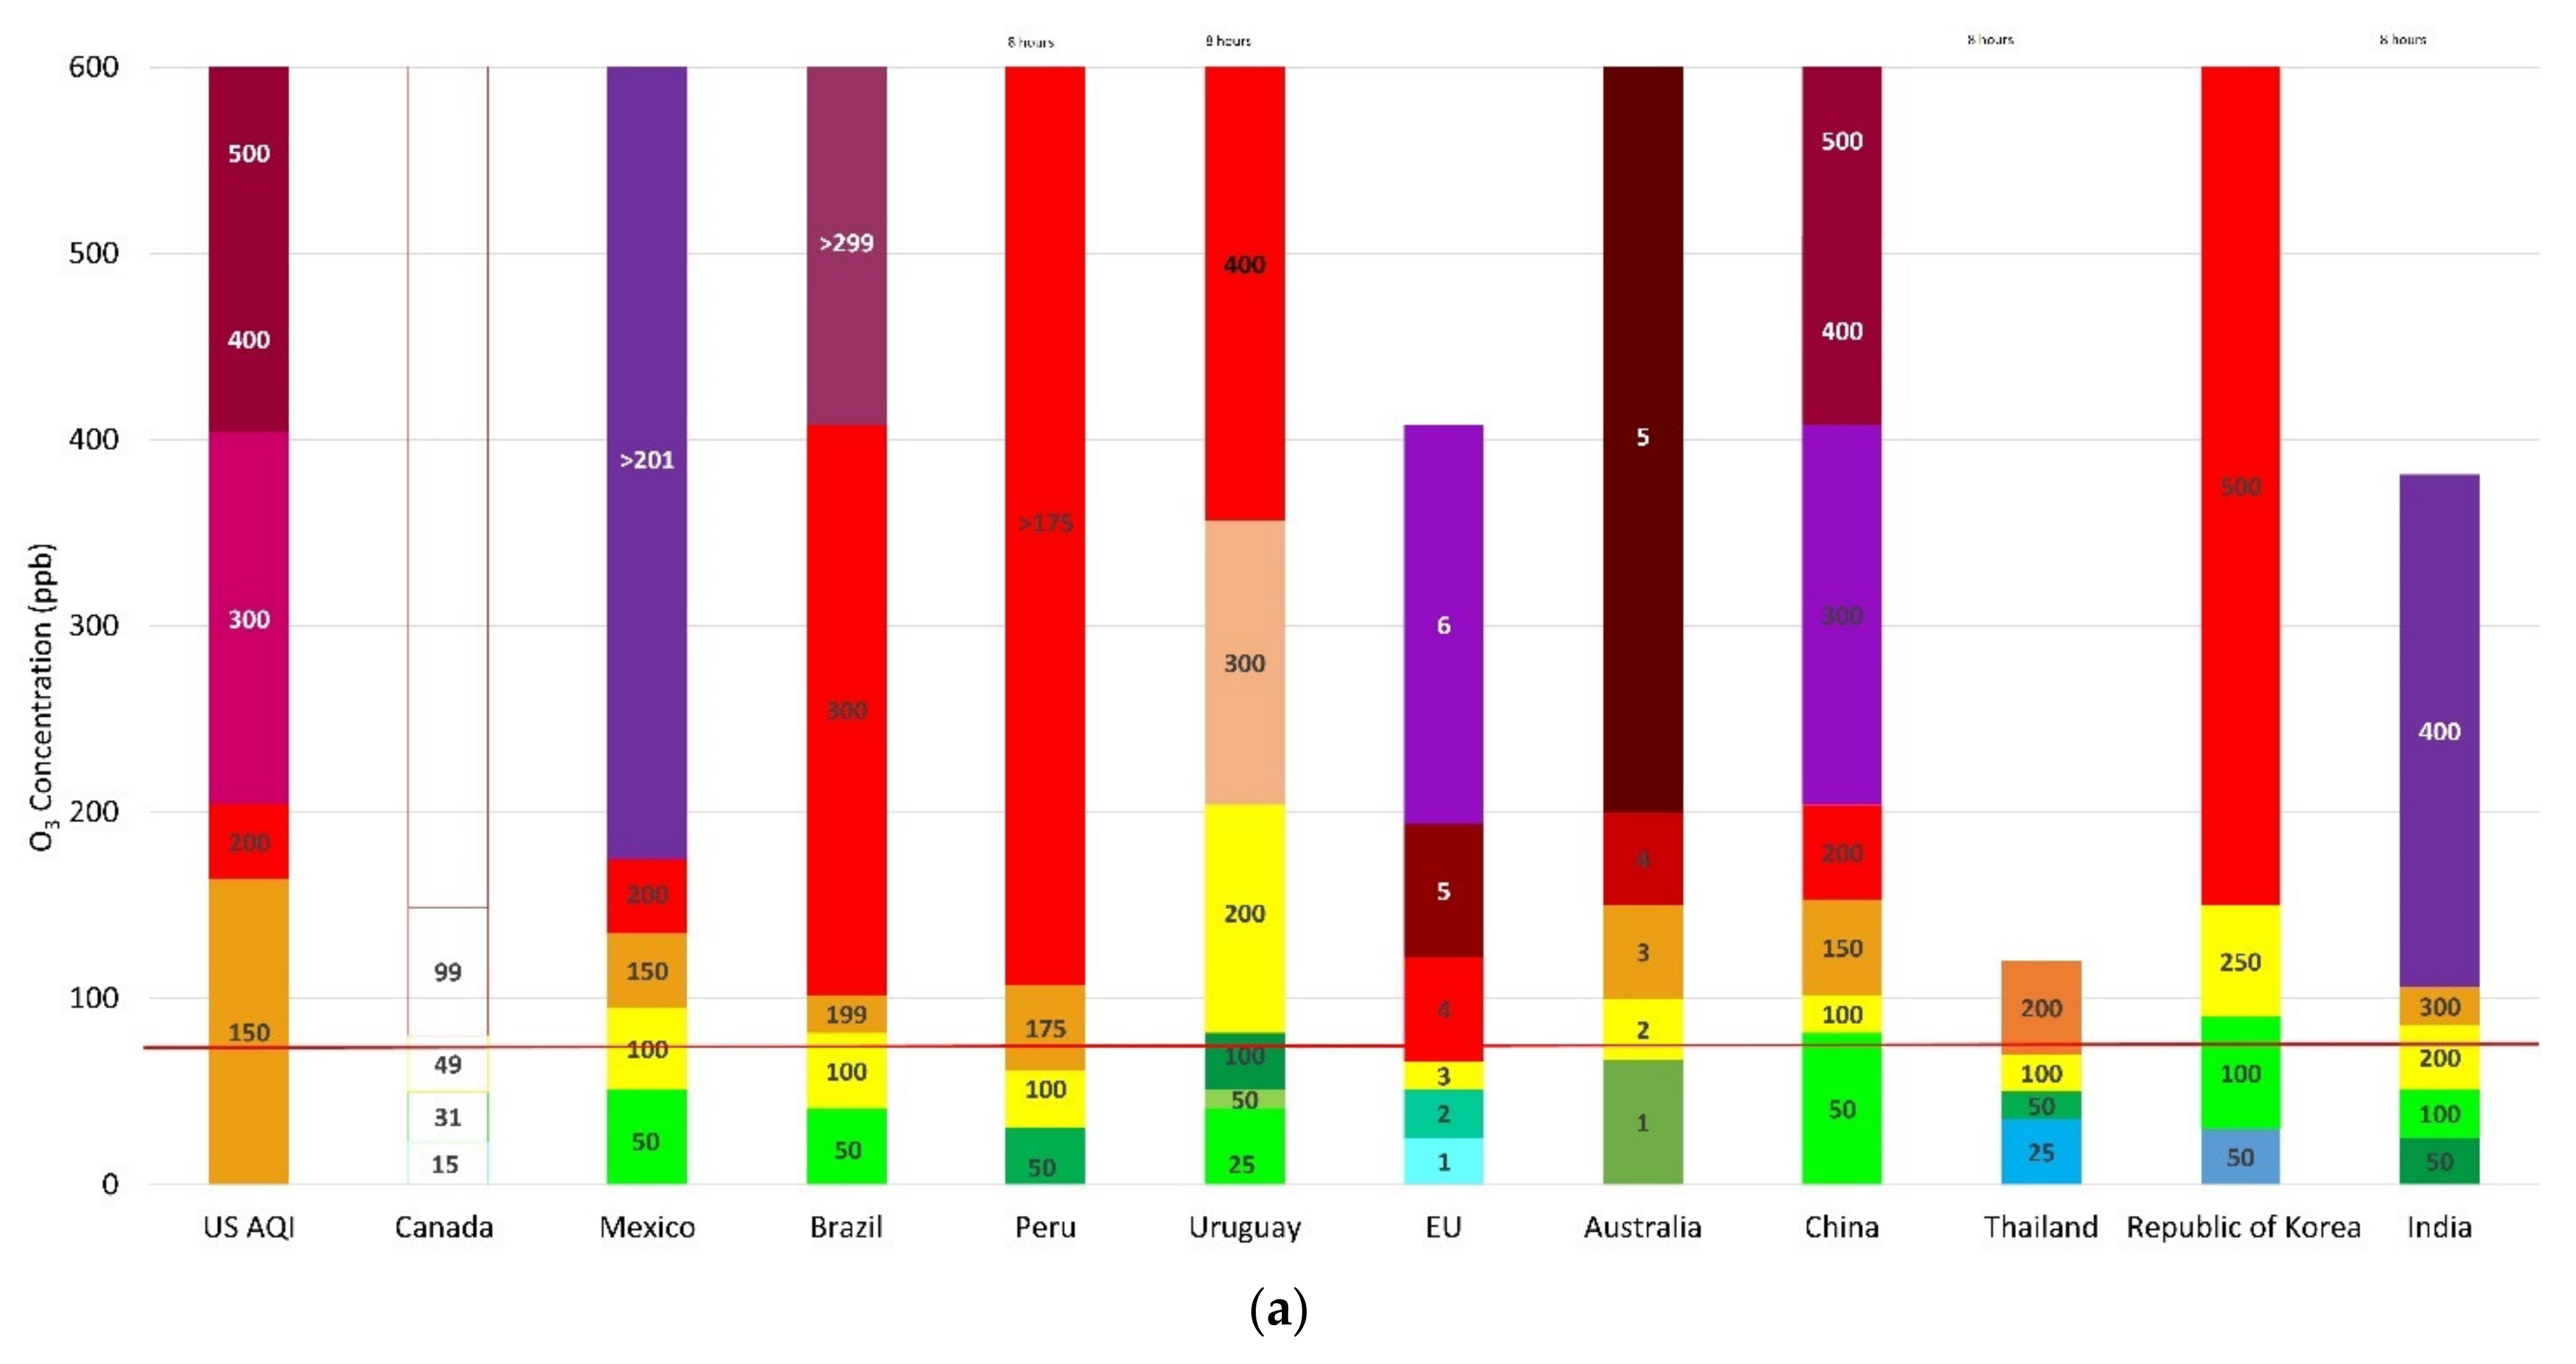
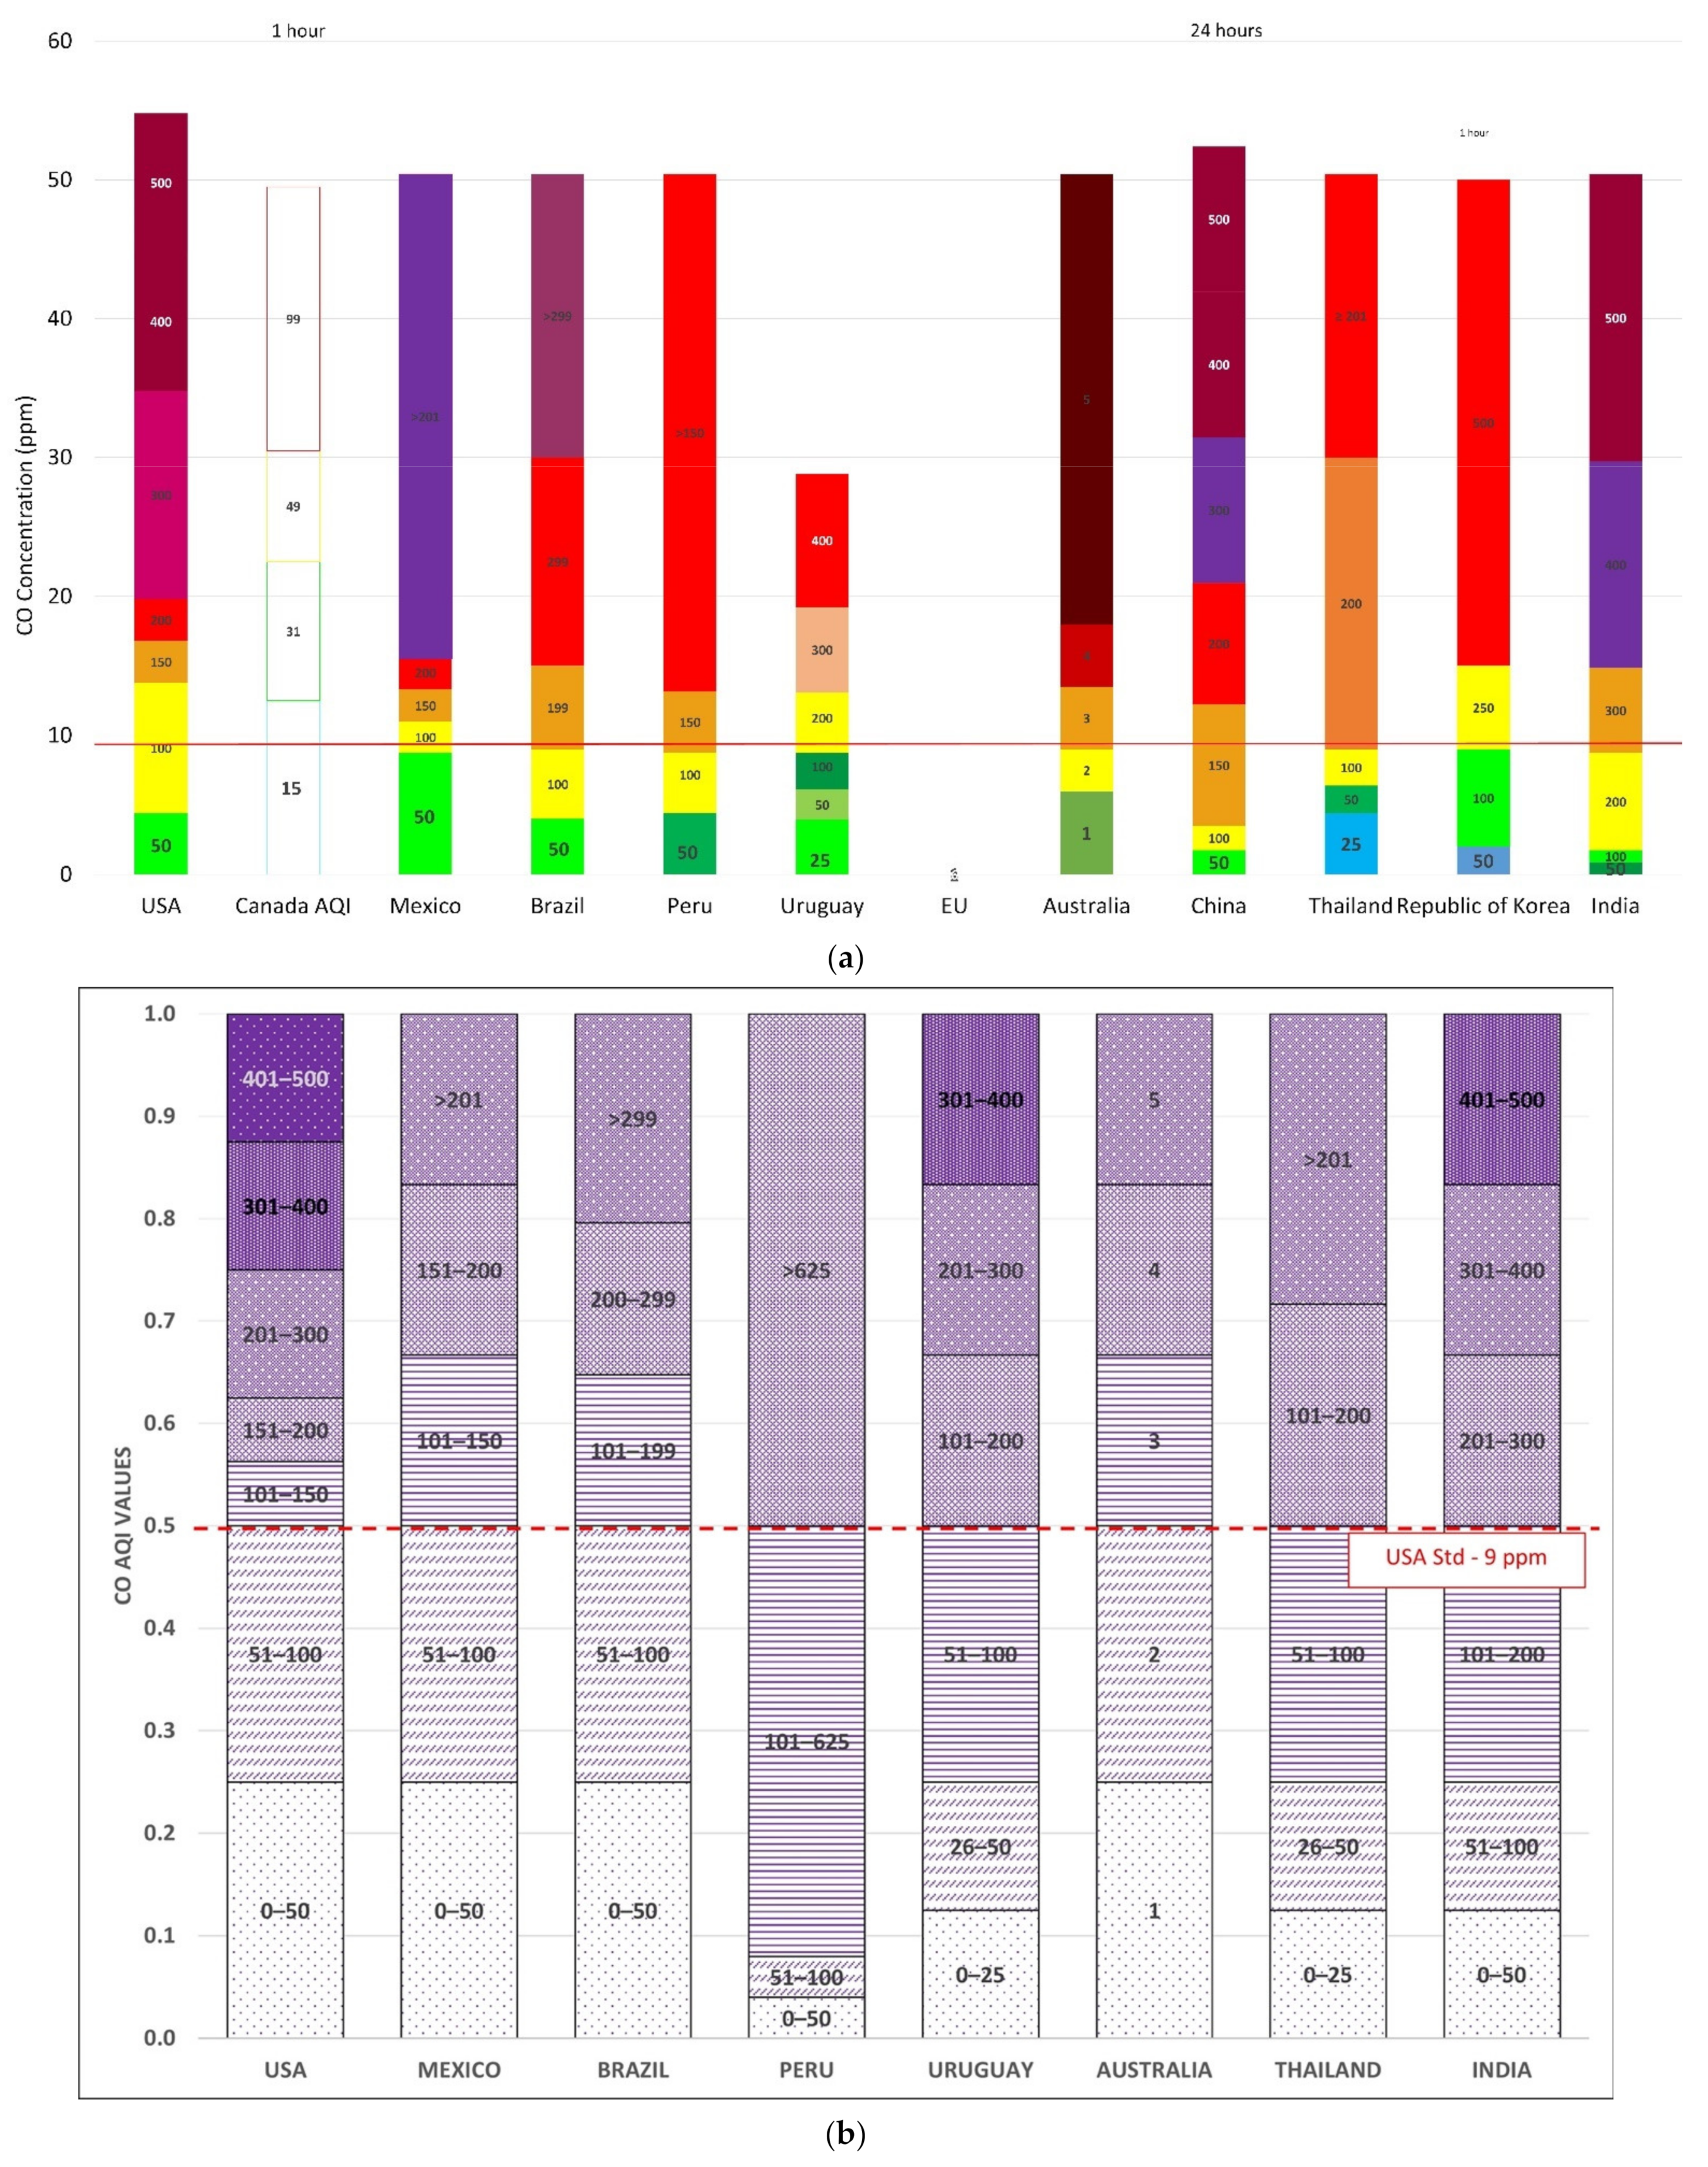
Table 1.
Air quality indexes calculating expressions and relative parameters.
| Source of Information | Country | Calculation Method | Pollutants (Averaging Times and Units of Measure) | |||||||
|---|---|---|---|---|---|---|---|---|---|---|
| SO2 | NO2 | NH3 | PM10 | CO | O3 | PM2.5 | ||||
| Chen et al., 2016 Zhan et al., 2018 | China | * | 24-h µg/m3 | 24-h µg/m3 | 24-h µg/m3 | 24-h mg/m3 | 1-h µg/m3 | 8-h µg/m3 | 24-h µg/m3 | |
| CPCB, 2014 | India | Lead (Pb) is included among pollutant | 24-h µg/m3 | 24-h µg/m3 | 24-h µg/m3 | 24-h µg/m3 | 8-h mg/m3 | 8-h µg/m3 | 24-h µg/m3 | |
| BangkokAirQuality, 2021 and Phruksahiran, 2021 | Thailand | 1-h ppb | 1-h ppb | 24-h µg/m3 | 8-h ppm | 8-h ppb | 24-h µg/m3 | |||
| https://www.airkorea.or.kr/eng, accessed on 8 September 2021 | Republic of Korea | 1-h ppm | 1-h ppm | 24-h µg/m3 | 1-h ppm | 1-h ppm | 24-h µg/m3 | |||
| EEA website: https://www.eea.europa.eu/themes/air/air-quality-index, accessed on 24 July 2021 | Europe | The index corresponds to the poorest level for any of five pollutants. Monitoring data are integrated by modelling (CAMS). | 1-h µg/m3 | 1-h µg/m3 | 24-h running means µg/m3 | 1-h µg/m3 | 24-h running means µg/m3 | |||
| Government Department for Environment Food and Rural Affairs: https://uk-air.defra.gov.uk/air-pollution/daqi?view=more-info, accessed on 18 July 2021 | United Kingdom | The overall index is determined by the highest concentration of the considered pollutants. * daily mean concentration for historical data, latest 24 h running mean for the current day. | 15-minutes µg/m3 | 1-h µg/m3 | 24-h * µg/m3 | running 8 h µg/m3 | 24-h * µg/m3 | |||
| Ministry for the Ecological Transition and the Demographic challenge: http://www.ica.miteco.es/, accessed on 24 July 2021 | Spain | Monitoring data can be supplemented, when necessary, by CAMS data. | 1-h µg/m3 | 1-h µg/m3 | latest 24 h running mean µg/m3 | running 8 h µg/m3 | latest 24 h running mean µg/m3 | |||
| Fédération Atmo France: https://atmo-france.org/la-qualite-de-lair-dans-votre-region/, accessed on 8 July 2021 | France | The index corresponds to the worst of the sub-indices calculated for each of the 5 considered pollutants. Data can be supplemented by modelling results. | maximum 1-h µg/m3 | maximum 1-h µg/m3 | 24-h µg/m3 | maximum 1-h µg/m3 | 24-h µg/m3 | |||
| German Environment Agency https://www.umweltbundesamt.de/en/data/air/air-data/air-quality/, accessed on 8 July 2021 | Germany | The pollutant with the worst index value determines the total index. | 1-h µg/m3 | hourly moving daily mean values µg/m3 | 1-h µg/m3 | |||||
| https://www.airnow.gov/, accessed on 12 October 2021 | USA | 1-h ppb | 1-h ppb | 24-h μg/m3 | 8-h ppm | 1-h ppm | 8-h ppm | 24-h μg/m3 | ||
| https://www.publichealthontario.ca/, accessed on 15 October 2021 | Canada | AQI = max{Bi * pollutanti} TRS (total reduced sulfur is included among pollutants | 1-h ppb | 1-h ppb | 1-h ppm | 1-h ppb | 3 h run. ave μg/m3 | |||
Approx with Taylor series:AQHI= 0.084 * NO2 + 0.052 * O3 + 0.047 * PM2.5 | Max 3 h run. ave ppb | Max 3 h run. ave ppb | Max 3 h run. ave μg/m3 | |||||||
| Ramos-Ibarra and Silva, 2020 | Mexico Aire y Salud (Metropolitan index of air quality) | * | 24-h run ave ppm | 1-h ppm | 12-h run ave. μg/m3 | 8-h run ave. ppm | 1-h ppm | 8-h ppm | 12-h run. ave. μg/m3 | |
| Argentina ICA (Índice de Calidad de Aire)As USA except for the highest class “dangerous” instead of “hazardous” | * | 1-h ppb | 1-h ppb | 24-h μg/m3 | 8-h ppm | 1-h ppm | 8-h ppm | 24-h μg/m3 | ||
| Bolivia (ICA) (Índice de la Contaminación Atmosférica | * | |||||||||
| Siciliano et al., 2020 | Brazil AQI determined in Resolution Number 491 (2018) | * | 24-h μg/m3 | 1-hμg/m3 | 24-h μg/m3 | 8-h ppm | 1-h μg/m3 | |||
| Chile ICAP (Indice de Calidad del Aire referred to Particles) | 24-h μg/m3 | |||||||||
| Resolucion Nr. 2254 of 1 November 2017 | Colombia As US AQI (apart from units) | * | 1-h μg/m3 | 1-h μg/m3 | 24-h μg/m3 | 8-h μg/m3 | 1-h μg/m3 | 8-h μg/m3 | 24-h μg/m3 | |
| Resolución Ministerial Nr.181 -2016 MinAm. 14 July 2016 | Peru INCA (Índice de Calidad del Aire) | I(PM10) = [PM10](100/150) I(PM2.5) = [PM2.5](100/25) I(SO2) = [SO2](100/20) I(NO2) = [NO2](100/200) I(CO) = [CO](100/10,000) I(O3) = [O3](100/120) I(H2S) = [H2S](100/150) | 24-h μg/m3 | 1-h μg/m3 | 24-h μg/m3 | 8-h μg/m3 | 8-h μg/m3 | 24-h run. ave. μg/m3 | ||
| Australian Government—NSW, 2020 | Australia (NSW) AQC | Comparison of air quality concentrations with AQC cut-off values. | 1-h pphm | 1-h pphm | 1-h µg/m3 | 8-h roll ppm | 1-h pphm | 4-h sroll pphm | 1-h µg/m3 | |
* The overall index is determined by the highest concentration among the considered pollutants.
Table 2.
AQI chromatic scales of the countries examined.
| USA | Canada | Mexico | Brazil | Peru | Uruguay | EU | Australia | China | Thailand | Republic of Korea | India |
|---|---|---|---|---|---|---|---|---|---|---|---|
| good | very good | good | good | good | very good | good | good | excellent | very good quality | good | good |
| moderate | good | acceptable | moderate | moderate | good | fair | fair | good | good quality | moderate | satisfactory |
| unh. for sensitives | moderate | bad | inadequate/unhealthy | bad | acceptable | moderate | poor | slight pollution | medium | unhealthy | moderate |
| unhealthy | poor | very bad | very unhealthy | alert threshold | inadequate | poor | very poor | moderate pollution | began to affect health | very unhealthy | poor |
| very unhealthy | very poor | extremely bad | hazardous | bad | very poor | extremely poor | heavy pollution | affecting health | very poor | ||
| hazardous | very bad | extremely poor | serious pollution | severe |
Publisher’s Note: MDPI stays neutral with regard to jurisdictional claims in published maps and institutional affiliations. |
© 2021 by the authors. Licensee MDPI, Basel, Switzerland. This article is an open access article distributed under the terms and conditions of the Creative Commons Attribution (CC BY) license (https://creativecommons.org/licenses/by/4.0/).
Share and Cite
MDPI and ACS Style
Fino, A.; Vichi, F.; Leonardi, C.; Mukhopadhyay, K. An Overview of Experiences Made and Tools Used to Inform the Public on Ambient Air Quality. Atmosphere 2021, 12, 1524. https://0-doi-org.brum.beds.ac.uk/10.3390/atmos12111524
AMA Style
Fino A, Vichi F, Leonardi C, Mukhopadhyay K. An Overview of Experiences Made and Tools Used to Inform the Public on Ambient Air Quality. Atmosphere. 2021; 12(11):1524. https://0-doi-org.brum.beds.ac.uk/10.3390/atmos12111524
Chicago/Turabian StyleFino, Alessandra, Francesca Vichi, Cristina Leonardi, and Krishnendu Mukhopadhyay. 2021. "An Overview of Experiences Made and Tools Used to Inform the Public on Ambient Air Quality" Atmosphere 12, no. 11: 1524. https://0-doi-org.brum.beds.ac.uk/10.3390/atmos12111524
Note that from the first issue of 2016, this journal uses article numbers instead of page numbers. See further details here.