
Monthly Rainfall Signatures of the North Atlantic Oscillation and East Atlantic Pattern in Great Britain


Centre for Water, Communities and Resilience, Department of Geography and Environmental Management, University of the West of England, Bristol BS16 1QY, UK
*
Author to whom correspondence should be addressed.
Atmosphere 2021, 12(11), 1533; https://0-doi-org.brum.beds.ac.uk/10.3390/atmos12111533
Submission received: 25 October 2021
/
Revised: 17 November 2021
/
Accepted: 18 November 2021
/
Published: 20 November 2021
(This article belongs to the Special Issue Atmospheric Teleconnection)
Abstract
:Atmospheric-oceanic circulations (teleconnections) have an important influence on regional climate. In Great Britain, the North Atlantic Oscillation (NAO) has long been understood as the leading mode of climate variability, and its phase and magnitude have been found to influence regional rainfall in previous research. The East Atlantic Pattern (EA) is also increasingly recognised as being a secondary influence on European climate. In this study we use high resolution gridded rainfall and Standardised Precipitation Index (SPI) time series data for Great Britain to map the monthly rainfall signatures of the NAO and EA over the period January 1950–December 2015. Our analyses show that the influence of the two teleconnections varies in space and time with distinctive monthly signatures observed in both average rainfall/SPI-1 values and incidences of wet/dry extremes. In the winter months the NAO has a strong influence on rainfall and extremes in the north-western regions. Meanwhile, in the southern and central regions stronger EA-rainfall relationships are present. In the summer months opposing positive/negative phases of the NAO and EA result in stronger wet/dry signatures which are more spatially consistent. Our findings suggest that both the NAO and EA have a prominent influence on regional rainfall distribution and volume in Great Britain, which in turn has implications for the use of teleconnection forecasts in water management decision making. We conclude that accounting for both NAO and EA influences will lead to an enhanced understanding of both historic and future spatial distribution of monthly precipitation.
1. Introduction
The North Atlantic Oscillation (NAO) has long been recognised as the first mode of climate variability in the North Atlantic region [1,2]. The NAO teleconnection is defined by the sea level pressure (SLP) variation between the Icelandic low-pressure action point and the Azores anticyclone. When the SLP difference between these two meridional dipoles is greater than normal, the NAO is described as being in a positive phase (NAO+), whilst a NAO negative phase (NAO−) represents a weaker than usual difference in SLP between the Icelandic Low and Azores High [3].
North Atlantic Oscillation Indices (NAOIs) are calculated to quantify the phase and magnitude of the NAO at monthly, seasonal and annual scales, and have been used to assess the influence of the NAO on spatial distributions and deviations in rainfall, temperature and other hydrometeorological variables. In Great Britain, significant correlations which vary in space and time have been found between the NAOI and measured and modelled rainfall. During the winter in the north-west of the country positive correlations are often reported, indicating that NAO+ phases result in higher rainfall in these regions, and NAO− phases result in drier conditions [4,5,6,7,8]. West et al. [9] used high resolution gridded rainfall datasets to quantify the deviation in average monthly rainfall under NAO+/− phases compared to weak NAO neutral conditions, finding that during the winter months deviations in average monthly rainfall volume can be as high as 200–300 mm in the north-west. Meanwhile in the southern and eastern regions weaker negative correlations between the NAOI and rainfall are found [8,10].
Typically, the magnitude of the NAOI is weaker in the summer months compared to winter [11]. Despite this, significant correlations between the summer NAOI and rainfall have also been reported. These correlations are typically negative for most of Great Britain [12,13], with NAO+ phases resulting in drier conditions and NAO− phases in wetter conditions [9]. Although it should be noted that NAOI-rainfall correlations can be sensitive to the method of NAOI calculation, notably the choice between indices derived from station-measured or modelled SLP data [14]. Additionally, studies have explored how these NAO-rainfall deviations variably propagate through catchments to influence streamflow [6,15,16,17], groundwater [18,19] and fluvial water temperatures [20].
However, West et al. [21] observe that whilst average and relatively consistent rainfall responses to the NAO across Great Britain can be observed in line with the above descriptions, there can also be significant spatio-temporal variability in regional NAO-rainfall responses. For example, whilst in the north-west of the country more consistent NAO+/− wet/dry rainfall responses in winter were found, significant NAO-rainfall variability can occur in the central, southern and eastern areas, with some regions having equal likelihood of wetter/drier conditions and extremes [21]. The spatial and temporal variability in the rainfall response to the NAO across Great Britain has been noted as a potentially limiting factor in the inclusion of even highly accurate monthly/seasonal NAO forecasts in water management decision making [13,21,22].
NAO-rainfall response variability may be associated with the phase and magnitude of other North Atlantic/European atmospheric-oceanic circulations which may enhance or moderate the effect of the NAO in influencing regional rainfall in Great Britain [13,21]. Research continues to highlight the importance of the East Atlantic Pattern (EA) in influencing European climate. The EA was first described by Wallace and Gutzler [23] and is cited as the second mode of climate variability in the North Atlantic following the NAO [24,25]. Barnston and Livezey [26] identified a well-defined EA monopole south of Iceland and west of the United Kingdom (approximately 55° N; 20–35° W), a definition frequently used in research [24,27,28] and by NOAA in the calculation of their EA teleconnection index [29].
The influence of the EA on rainfall distribution and deviations in Great Britain is less well defined than it is for the NAO; however, associations in both winter and summer have been identified. Significant positive correlations between the EA and rainfall have been reported across Great Britain [23,30] with precipitation anomalies in the central, southern and eastern regions possibly associated with varying phases of the EA [13]. Interestingly, these are the same regions West et al. [21] note as having greater variability in NAO-rainfall response. In the summer months positive EA-rainfall correlations persist, albethey of a weaker strength [13].
Given the variability that can be observed in NAO rainfall signatures [21,22], interactions between the NAO and EA and their combined effect on spatial rainfall distributions across the North Atlantic and Europe have been explored. Moore et al. [31,32] found that the EA has the potential to influence the location and magnitude of the NAO dipoles. Analysis using long-term indices derived from ship logbooks [33] shows that winter precipitation distribution and magnitude (and temperatures) across Europe is sensitive to the phase and strength of both the NAO and EA [28]. The EA in particular was identified as the dominant pattern in approximately 50% of winters in the last three centuries [28]. This reinforces Comas-Bru and McDermott [24] who suggested that through a combination of the NAO and EA we may be more able to accurately describe winter climate variability in Europe.
To date, studies which identify the combined effect of the NAO and EA on rainfall in Great Britain have been based on relatively coarse spatial resolution datasets (due to having a focus across the wider North Atlantic/European region) or have been temporally restricted to specific seasons (notably winter). This study aims to contribute to research seeking to identify the effect of the NAO and EA (and their interaction) on rainfall patterns in Great Britain by using relatively high resolution rainfall datasets to map the spatio-temporal monthly rainfall signatures of the NAO and EA over a 65-year period (January 1950–December 2015).
2. Materials and Methods
2.1. Data
Monthly indices for the NAO and EA were sourced from the NOAA Climate Prediction Center [29] for the time period January 1950–December 2015. This time period was chosen as it represents the longest period with available data for both the teleconnection indices and rainfall datasets (described below). The CPC use the rotated principal component analysis (RPCA) approach of Barnston and Livezey [26] to identify and quantify northern hemisphere teleconnection patterns at a monthly scale, including the NAO and EA. Teleconnection indices calculated through modelling approaches such as RPCA avoid the limitations associated with station-measured indices [14]. The modelled monthly teleconnection indices from the NOAA CPC are frequently used in similar research assessing the hydrometeorological and climatological impact of atmospheric-oceanic circulations globally [24,30,34,35,36,37].
Two precipitation datasets were used to assess the influence of the NAO and EA on regional rainfall in Great Britain. Monthly rainfall totals were obtained from the UK Centre for Ecology and Hydrology (CEH) Gridded Estimates of Areal Rainfall (GEAR) dataset [38] for the period January 1950–December 2015. This dataset has a spatial resolution of 1 km and is based on interpolation of rainfall observations from the Met Office national database [38]. Alongside the GEAR data, Standardised Precipitation Index (SPI) time series with a one-month accumulation period (SPI-1) were also downloaded for the study period from CEH. The SPI was calculated by fitting a gamma distribution to historical rainfall estimates with a standard period of 19612010, using the Met Office 5 km rainfall grids [39,40]. Two variants of the SPI-1 data were used in this analysis: a 5 km gridded monthly dataset [39], and aggregated monthly SPI-1 values for the Integrated Hydrological Unit Groups (IHU) of Great Britain [40]. In both variants of the SPI-1 dataset, positive values indicate wetter conditions, whilst negative values indicate drier conditions. The theoretical maximum/minimum of the dataset is 5/−5, representing significant wet/dry extremes; however, 95% of the values are within the range −2 to 2 [39,40].
2.2. IHU Group Correlation Analysis
Initially the relationships between the teleconnection indices and rainfall were explored individually, in other words the NAO-rainfall effect and EA-rainfall effect were analysed separately. Spearman correlation coefficients were calculated between the two teleconnections indices from the NOAA CPC and the SPI-1 values for the IHU Groups. Correlations were calculated for each calendar month and mapped. This correlation analysis allowed for the identification of the individual relationship between the NAO/EA and rainfall (represented by the IHU Group SPI-1 values) in Great Britain, and how these relationships vary in space and time.
2.3. Mean SPI-1 and Rainfall Analysis
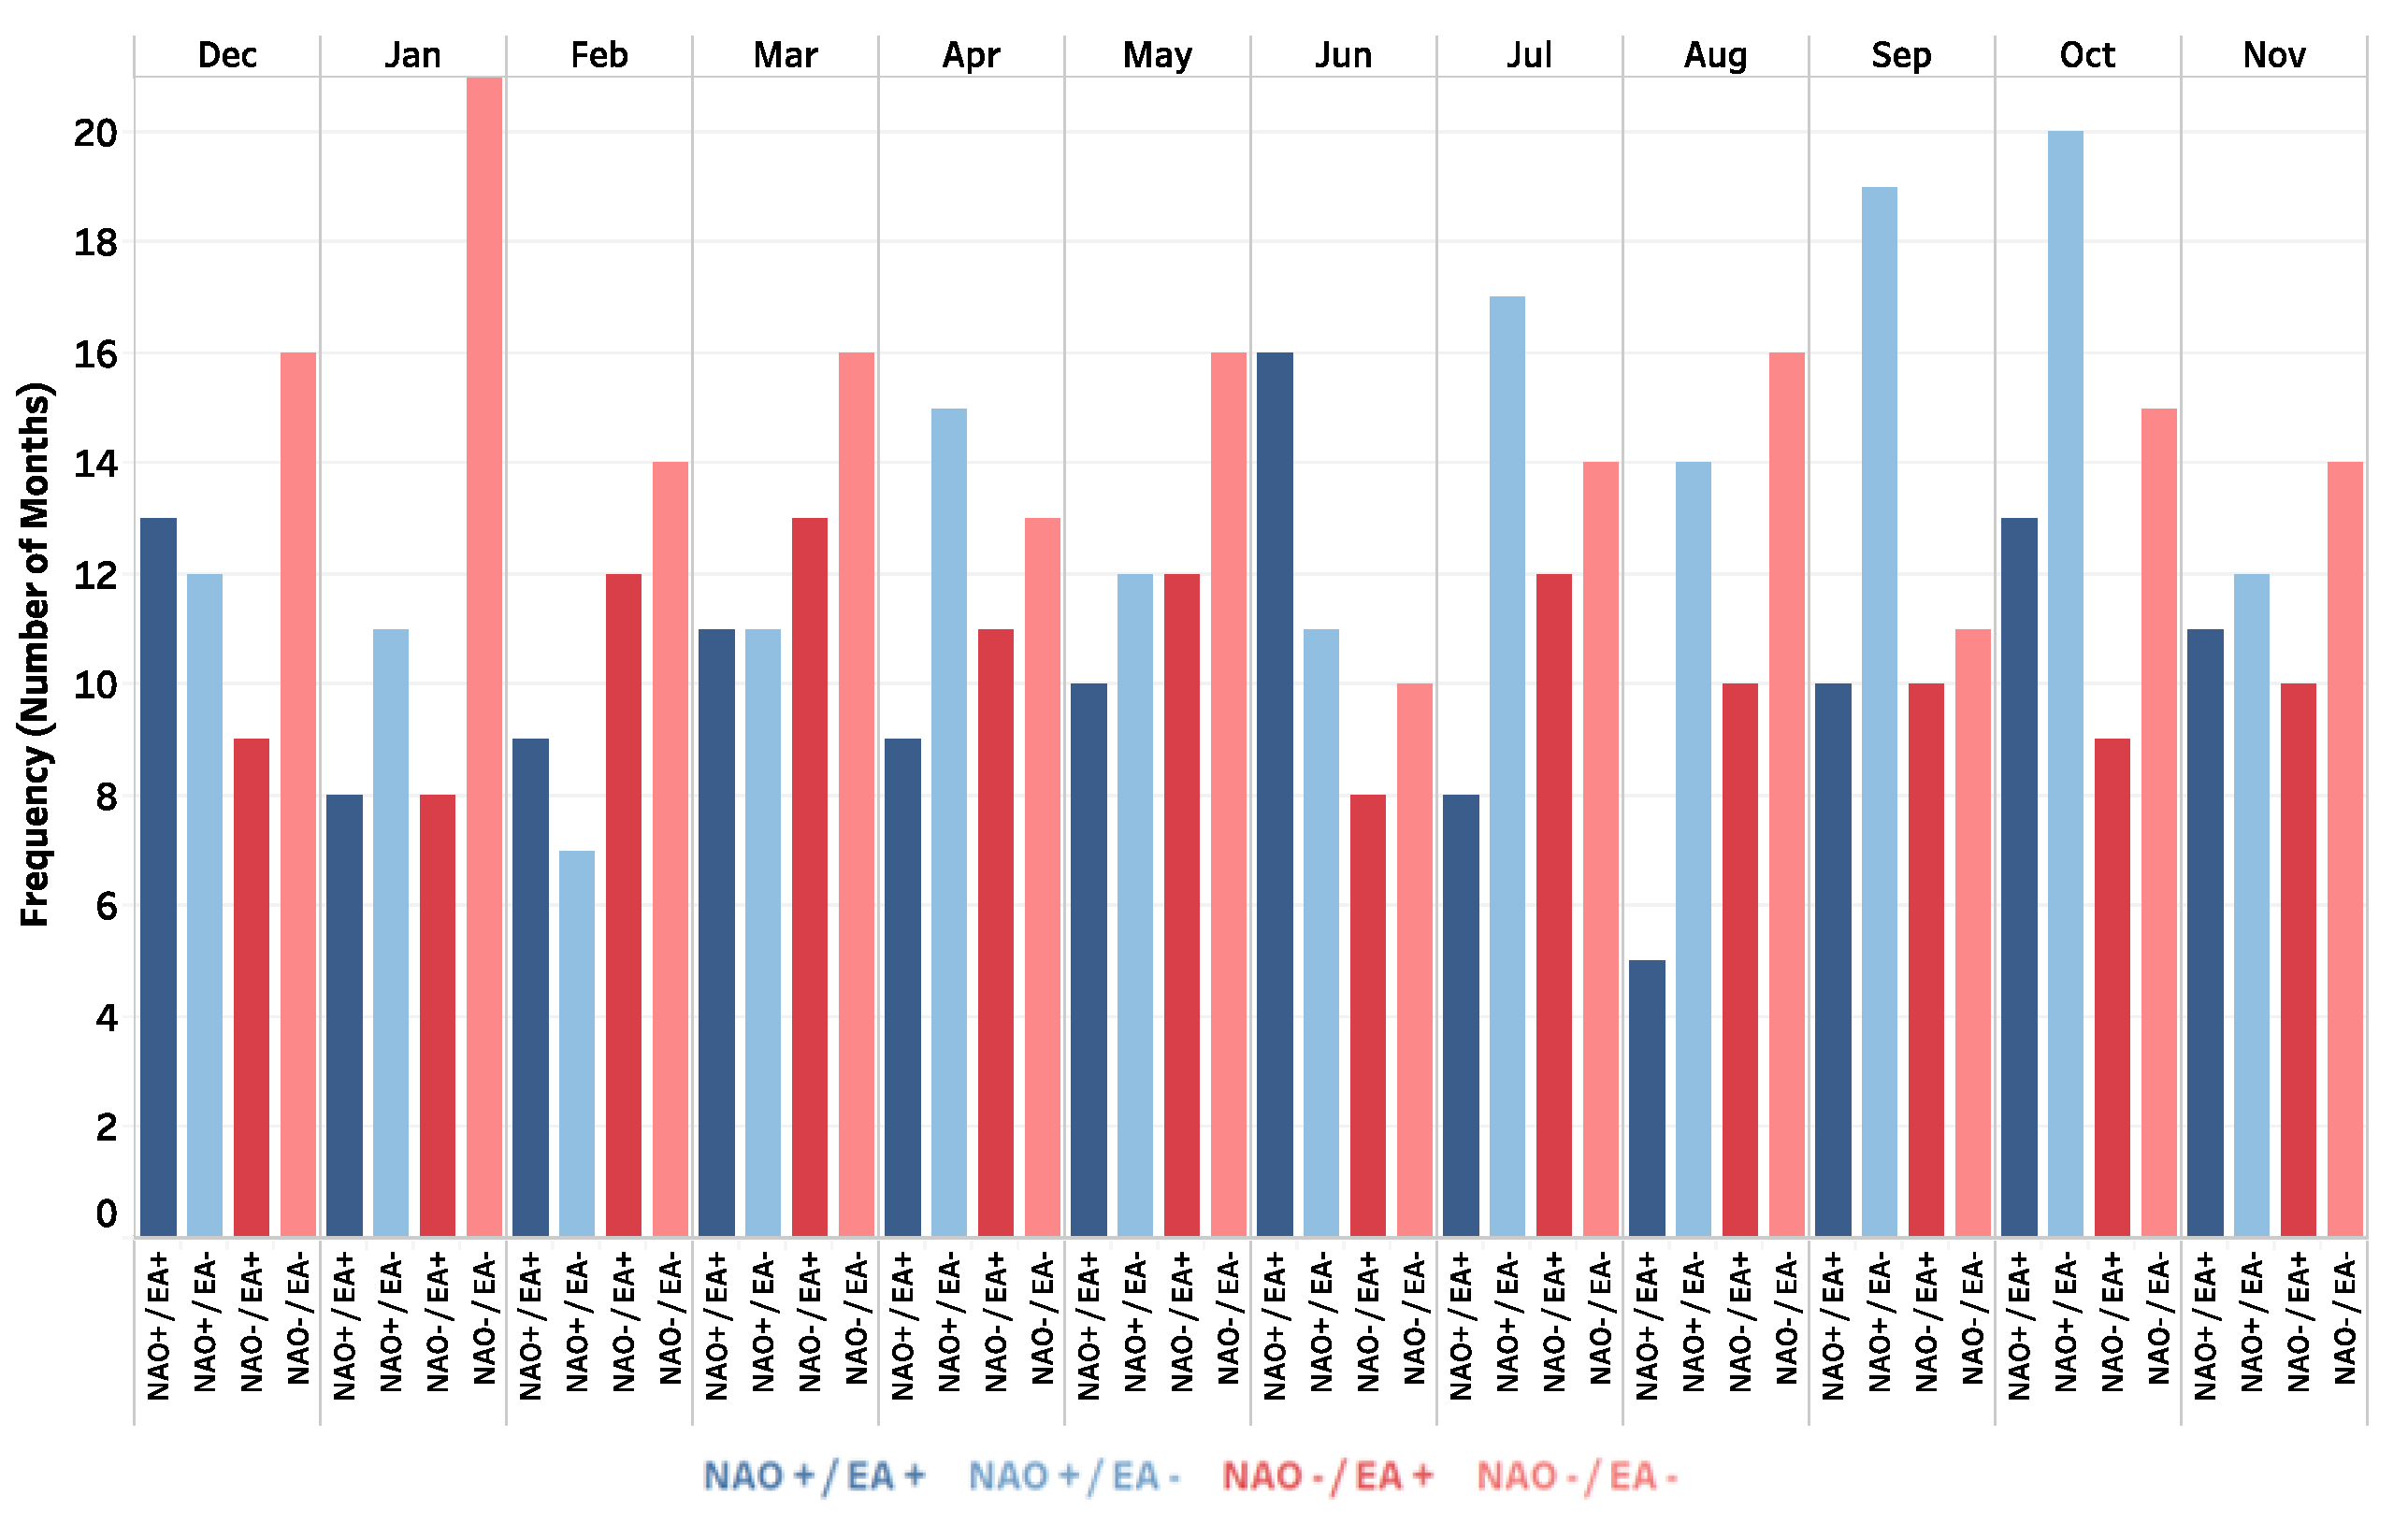
The phase of both the NAO and EA was identified for each calendar month across the study period (January 1950–December 2015). Removing these weak monthly teleconnection index values allowed for the identification of clear monthly NAO/EA phase-rainfall signatures [24,41]. NAO/EA Positive phases were identified where the respective teleconnection index was greater than 0.25, whilst NAO/EA Negative phases were identified where the index was less than −0.25. Months with either NAO or EA index values between these two thresholds were removed from subsequent analyses. Figure 1 shows the frequency of NAO/EA positive and negative phase combinations for each month.
Based on the monthly classification of teleconnection phases, we then explored the combined effect of the NAO and EA. For each month-phase combination (of both the same and opposing +/− sign) the average monthly rainfall from the CEH GEAR dataset (1 km gridded resolution) and average monthly SPI-1 value (5 km gridded resolution) was calculated. Descriptive statistics were also calculated for the nine Met Office Climate Districts. The Met Office Climate Districts were chosen as they represent areas of relatively homogenous climate and have been used as a spatial unit of analysis in similar studies [4,9,12].
2.4. SPI-1 Threshold Frequeny Analysis
The SPI-1 data is conveniently scaled between positive and negative values indicating wetness/dryness relative to a standard period (1961–2010 for the datasets used in this study). A common approach to interpreting the SPI, and similar standardised hydrometeorological/hydrological indices, is to classify the values using qualitative descriptors to indicate the severity of the wet/dry conditions (Table 1).
To identify the relationship between the NAO and EA and significant wet and dry meteorological events, we map the percentage of time for each NAO/EA phase combination different SPI-1 thresholds are exceeded (i.e., the frequency of occurrence divided by the number of times that NAO/EA phase combination occurs—see Figure 1). In this analysis we identified the percentage of time extremely wet, very wet, severely dry and extremely dry thresholds (Table 1) were exceeded. This was undertaken using the 5 km gridded SPI-1 dataset, identifying for each calendar month any spatial and temporal patterns in the distribution of extreme wet and dry events across Great Britain.
3. Results
3.1. IHU Group Correlation Analysis
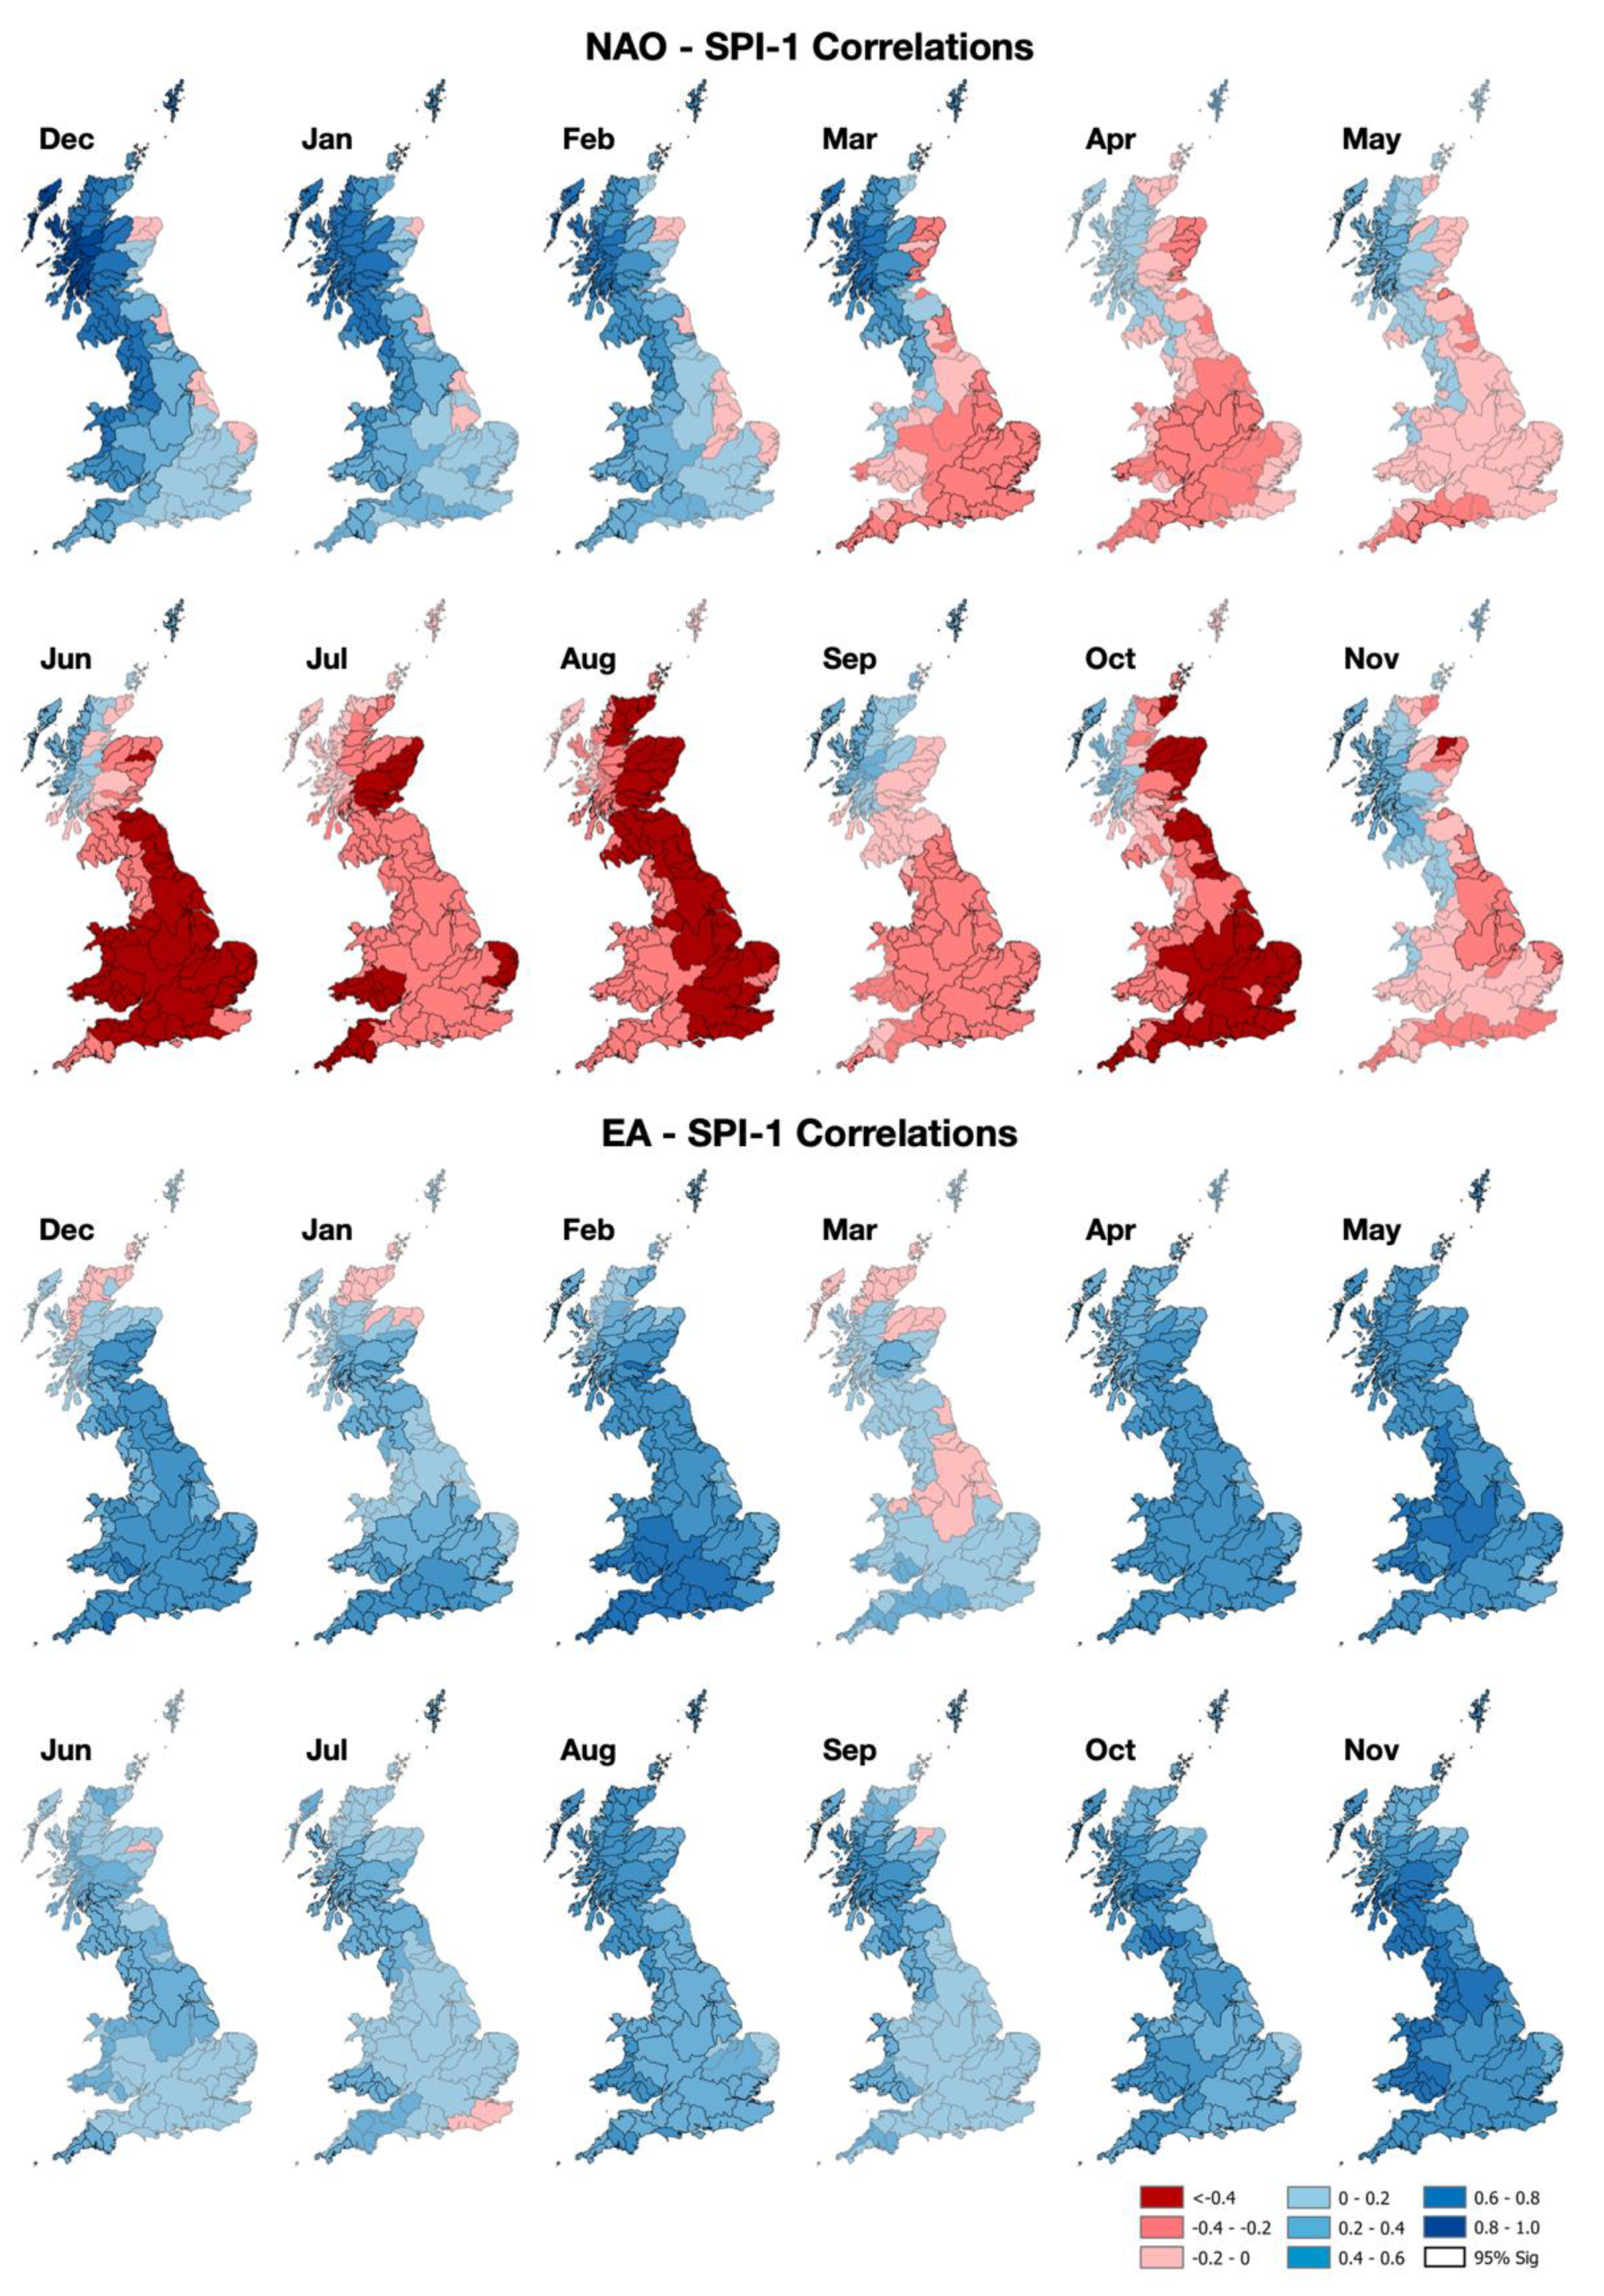
Figure 2 presents the results of the monthly correlation analyses between each of the teleconnection indices and the SPI-1 data at IHU Group level. In these correlation time series, positive correlations (shaded in blue) indicate that NAO/EA+ phases result in higher (wetter) SPI-1 values, meanwhile NAO/EA− phases result in lower (drier) SPI-1 values. Negative correlations (shaded in red) indicate the opposite teleconnection wet/dry relationship.
Noteworthy spatio-temporal differences can be observed between the NAO and EA correlation time series. In the winter months (DJF), strong positive correlations were found between the NAO and SPI-1 in the north-western regions of the country, with weaker and some negative correlations in the southern and eastern IHUs. Spring (MMA) is marked by a transition from positive to negative NAO/SPI-1 correlations, which persist and strengthen in the summer months (JJA). The negative correlations between the SPI-1 and NAO are significant in most IHUs, with the exception of the far north-west.
Whilst the NAO correlation time series are marked by the positive-negative winter-summer transition described above, the EA has a more consistent positive relationship with the IHU SPI-1 values across the year. Stronger correlations between the EA and SPI-1 were found in the winter months, particularly in the southern and central regions of the country. Winter EA correlations in the north-west, where the NAO was strongly positively correlated with SPI-1, were weak and non-significant. Fewer significant correlations were found in the summer months, with the exception of August; however, the relationship remains positive.
3.2. Average Monthly Rainfall and SPI-1 Analysis
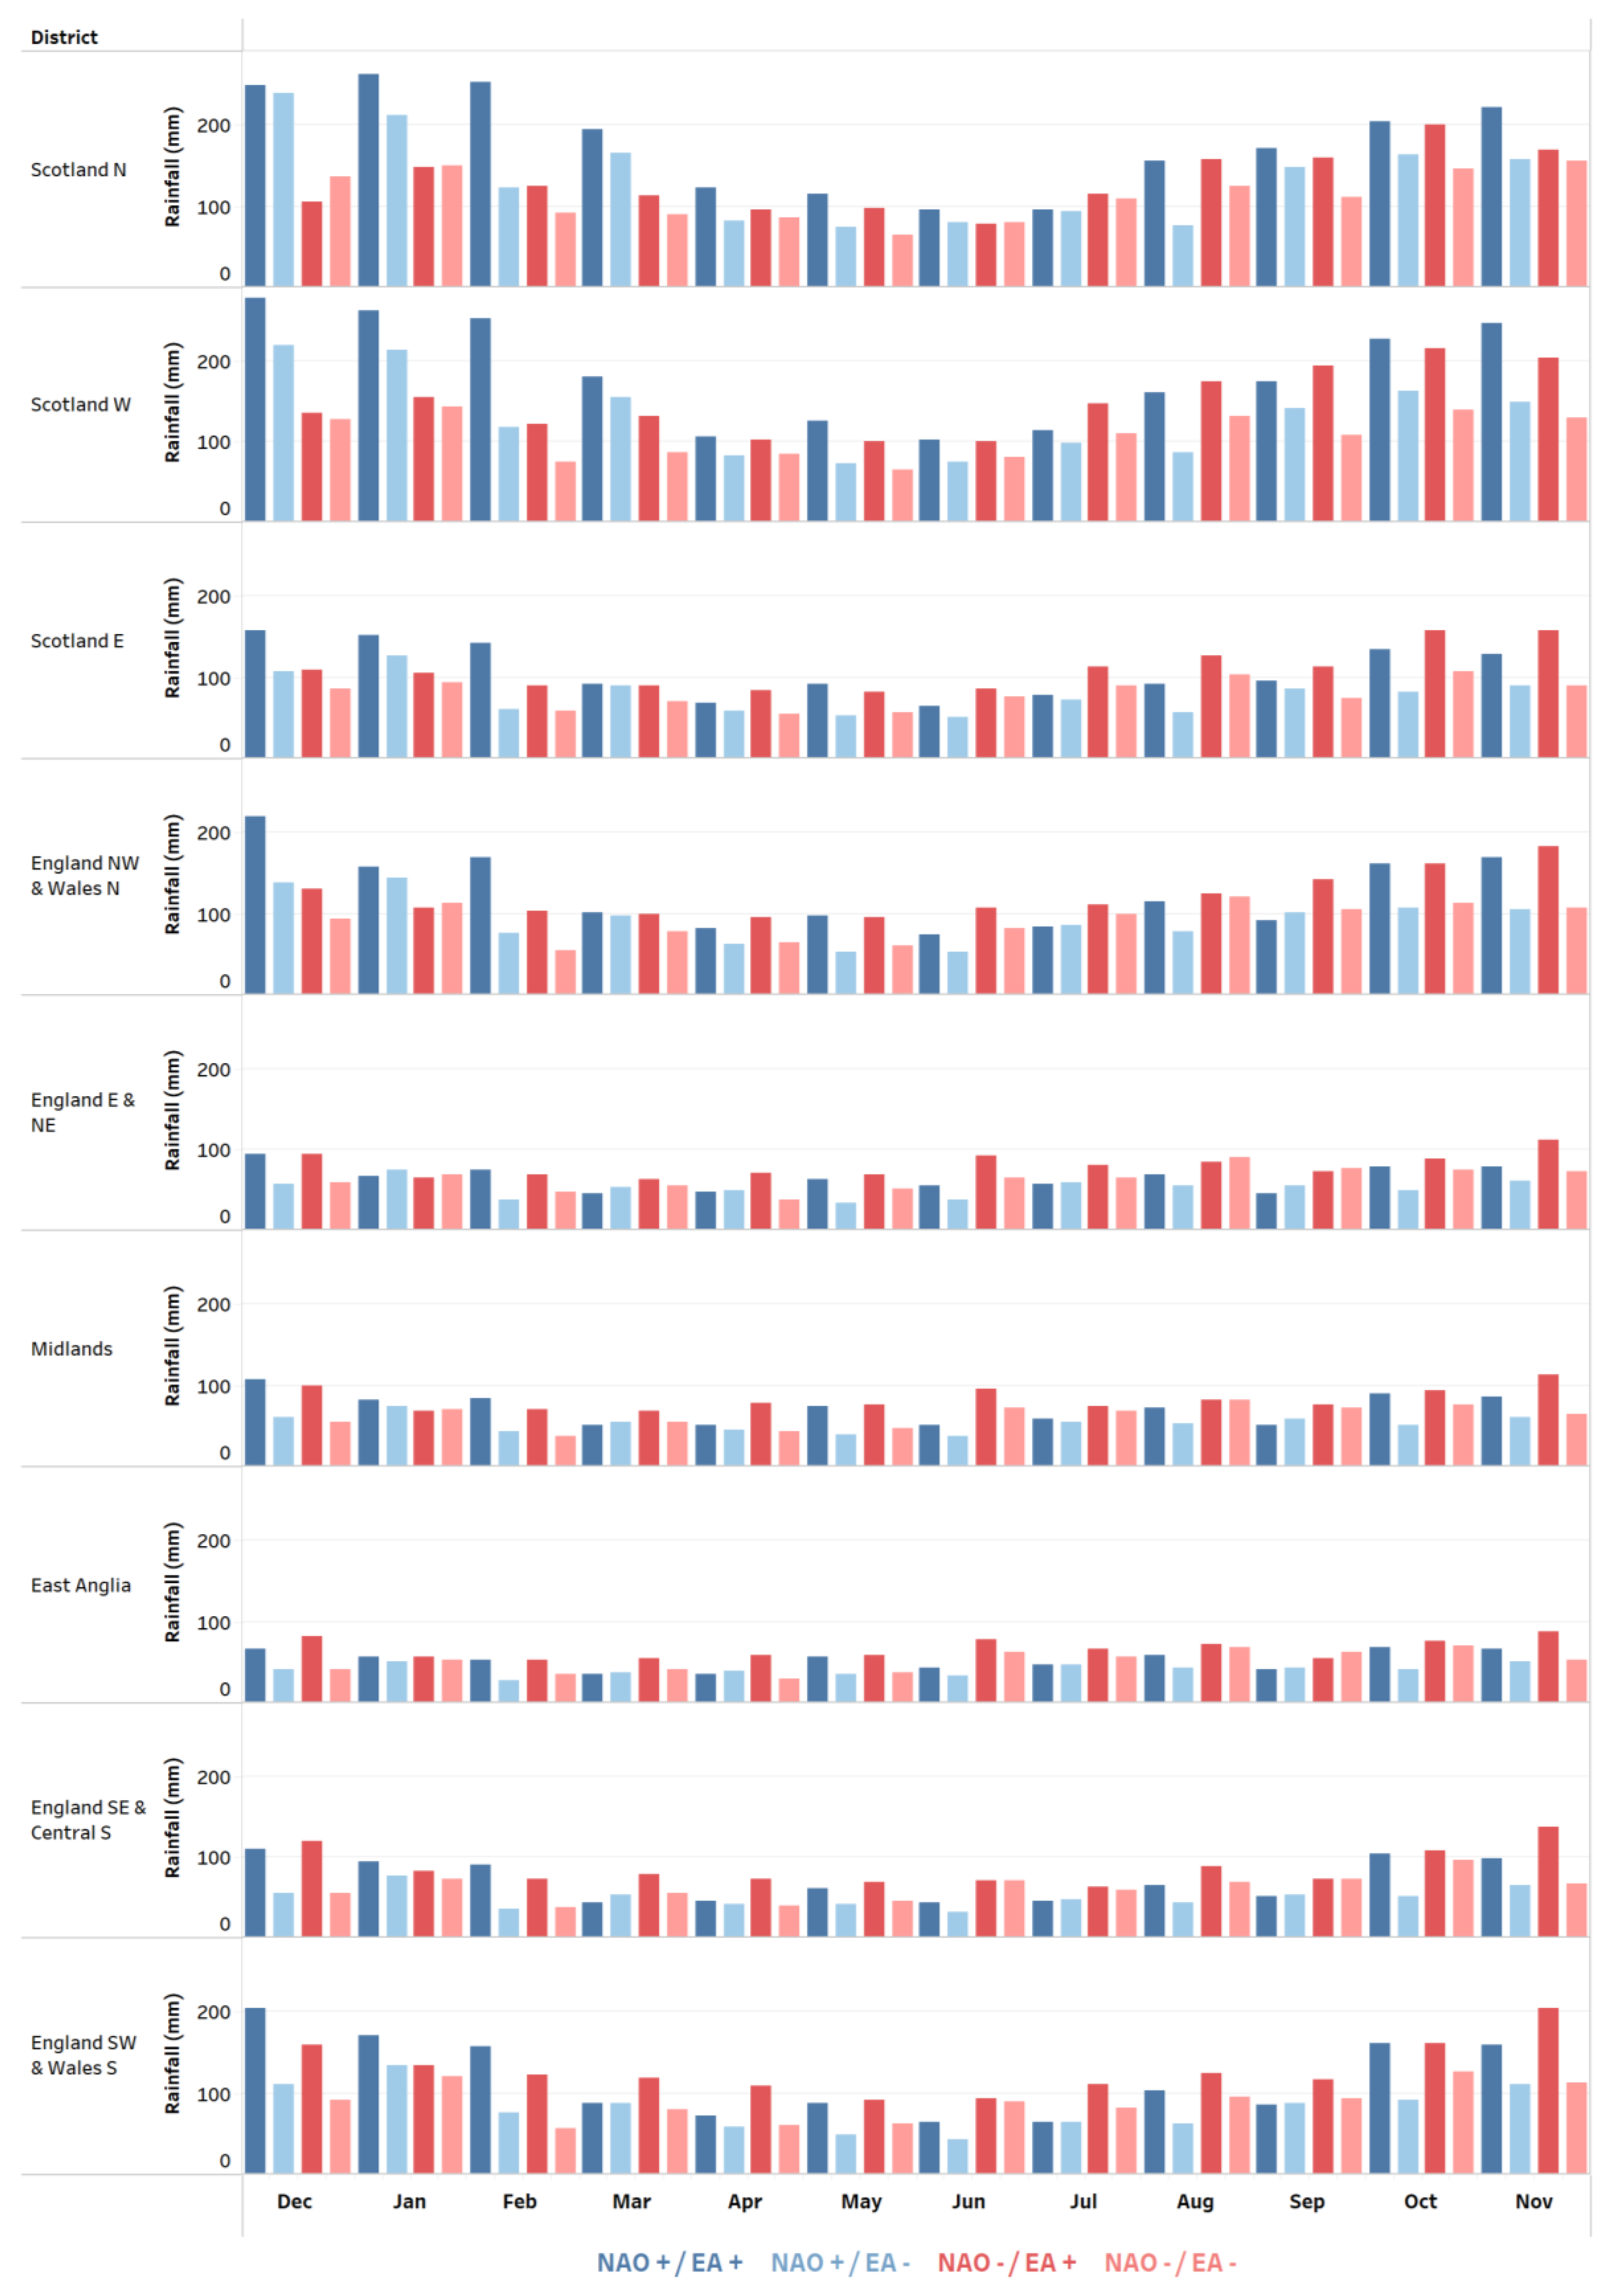
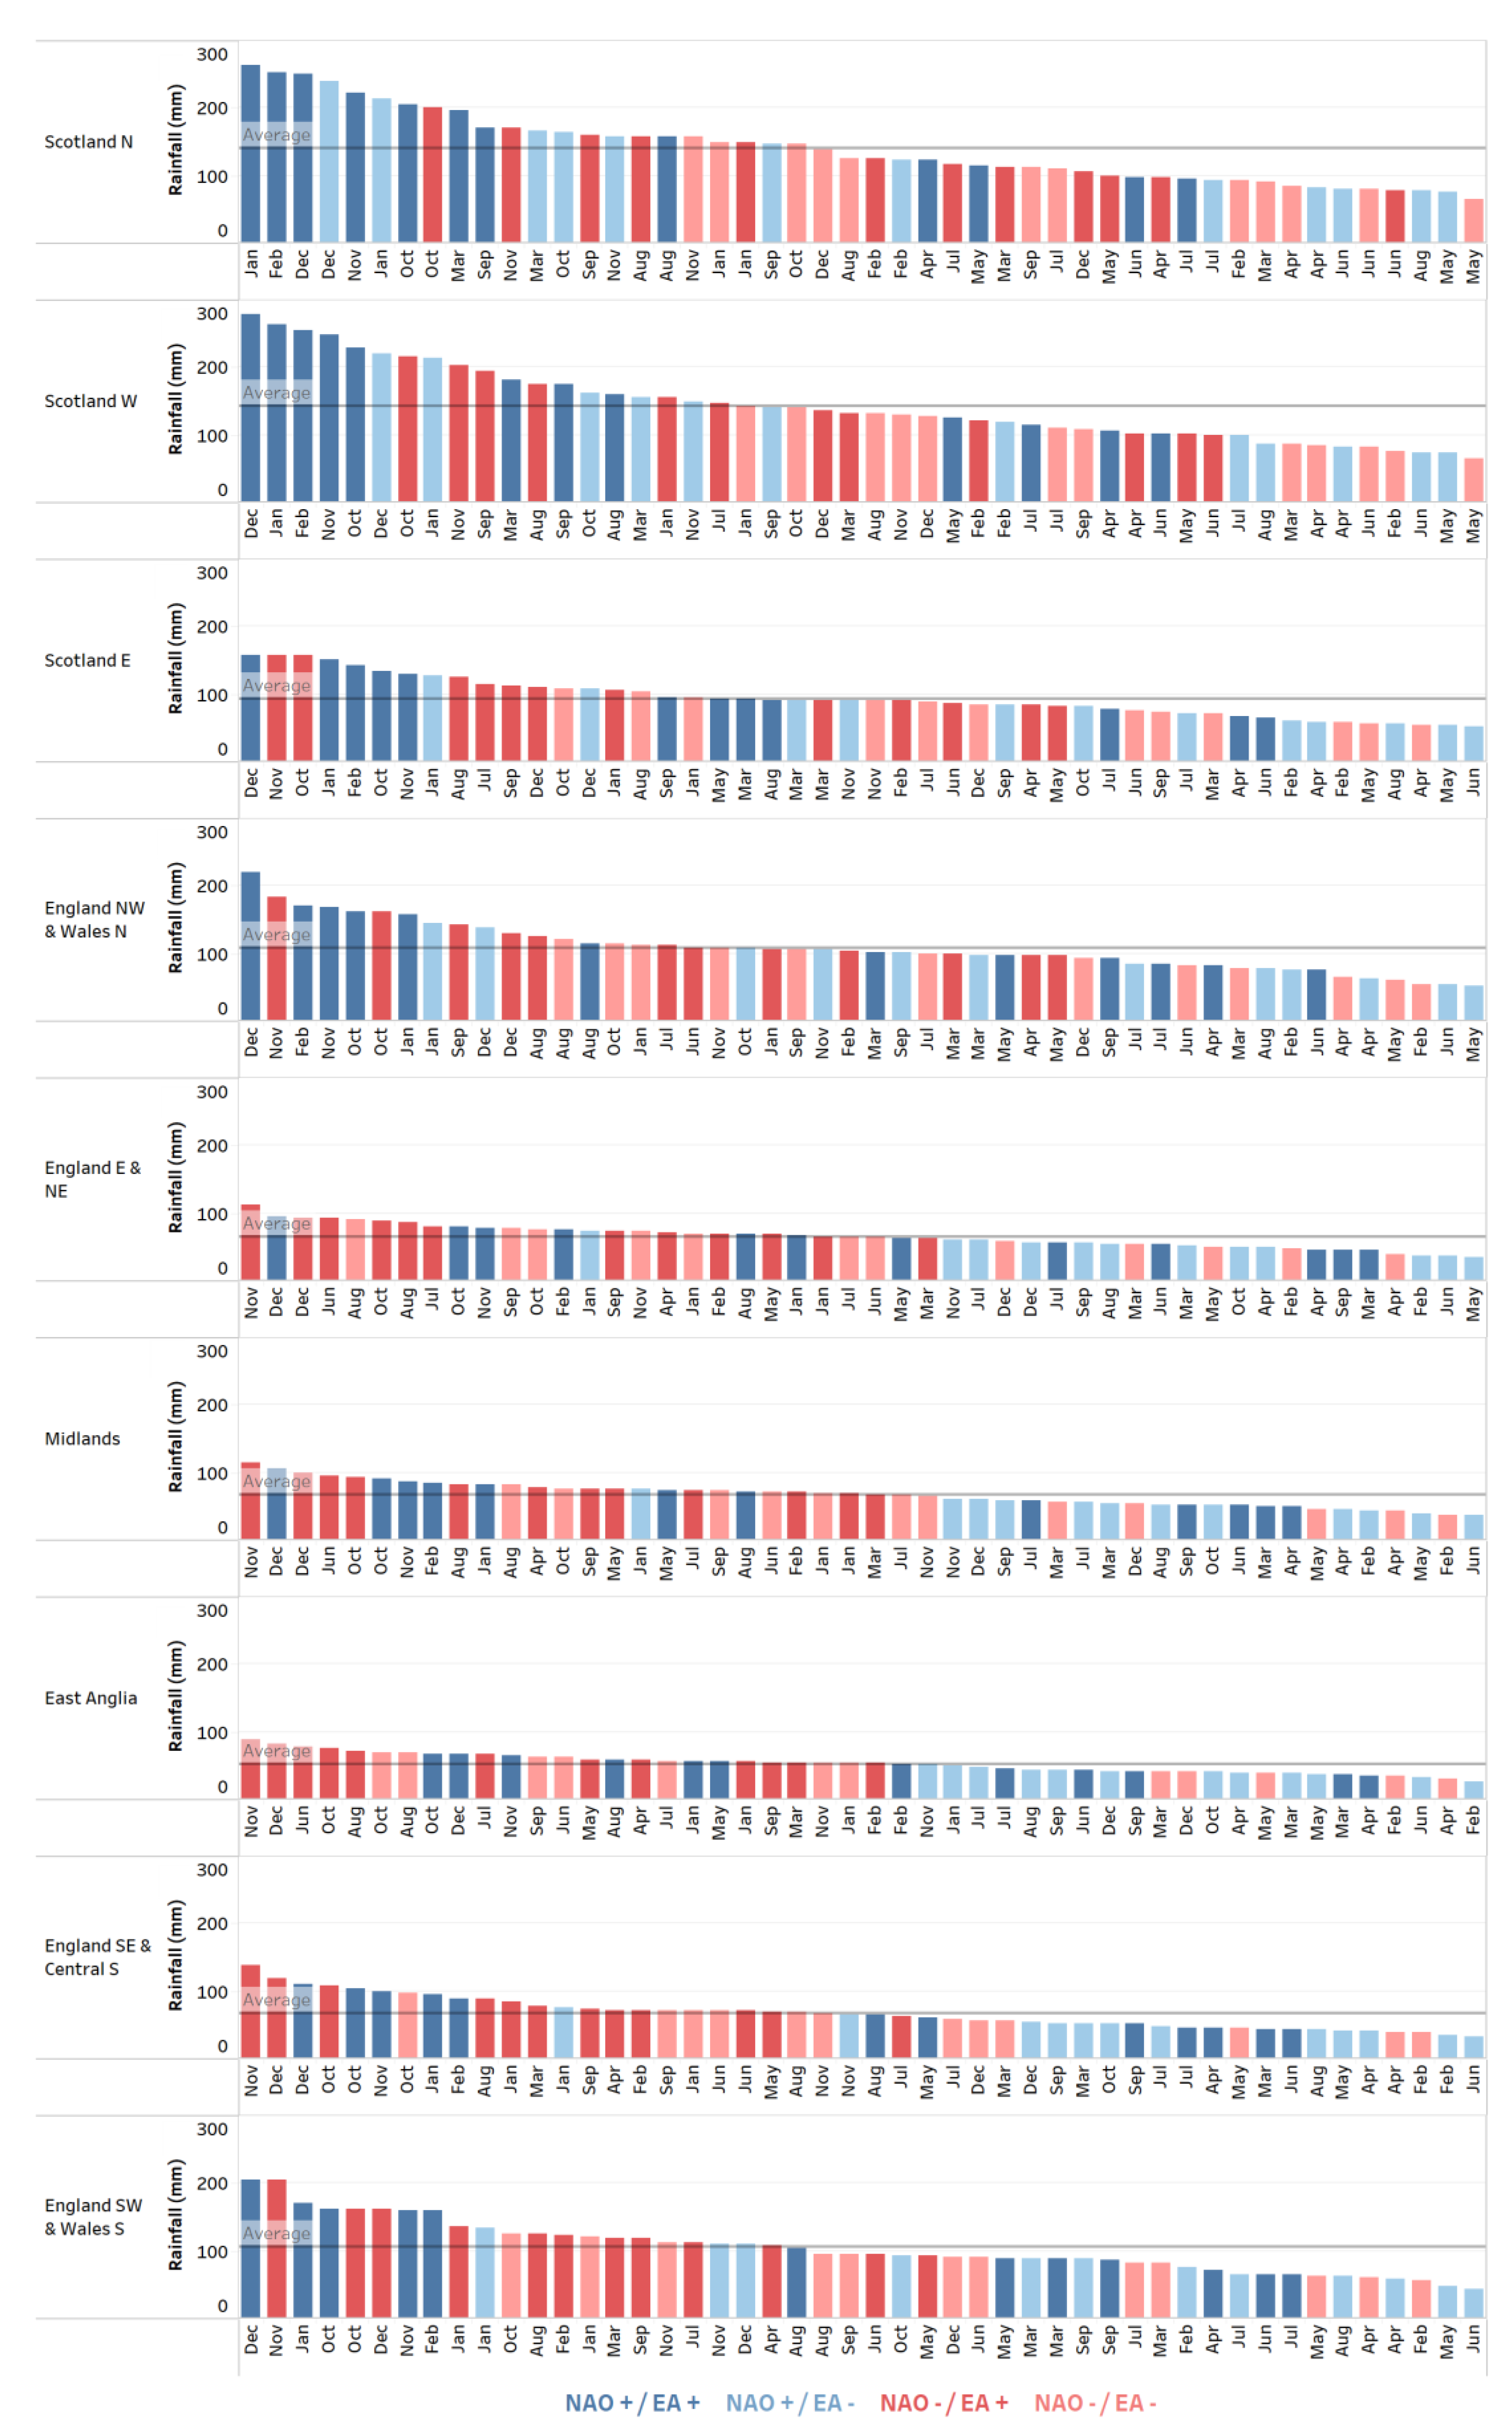
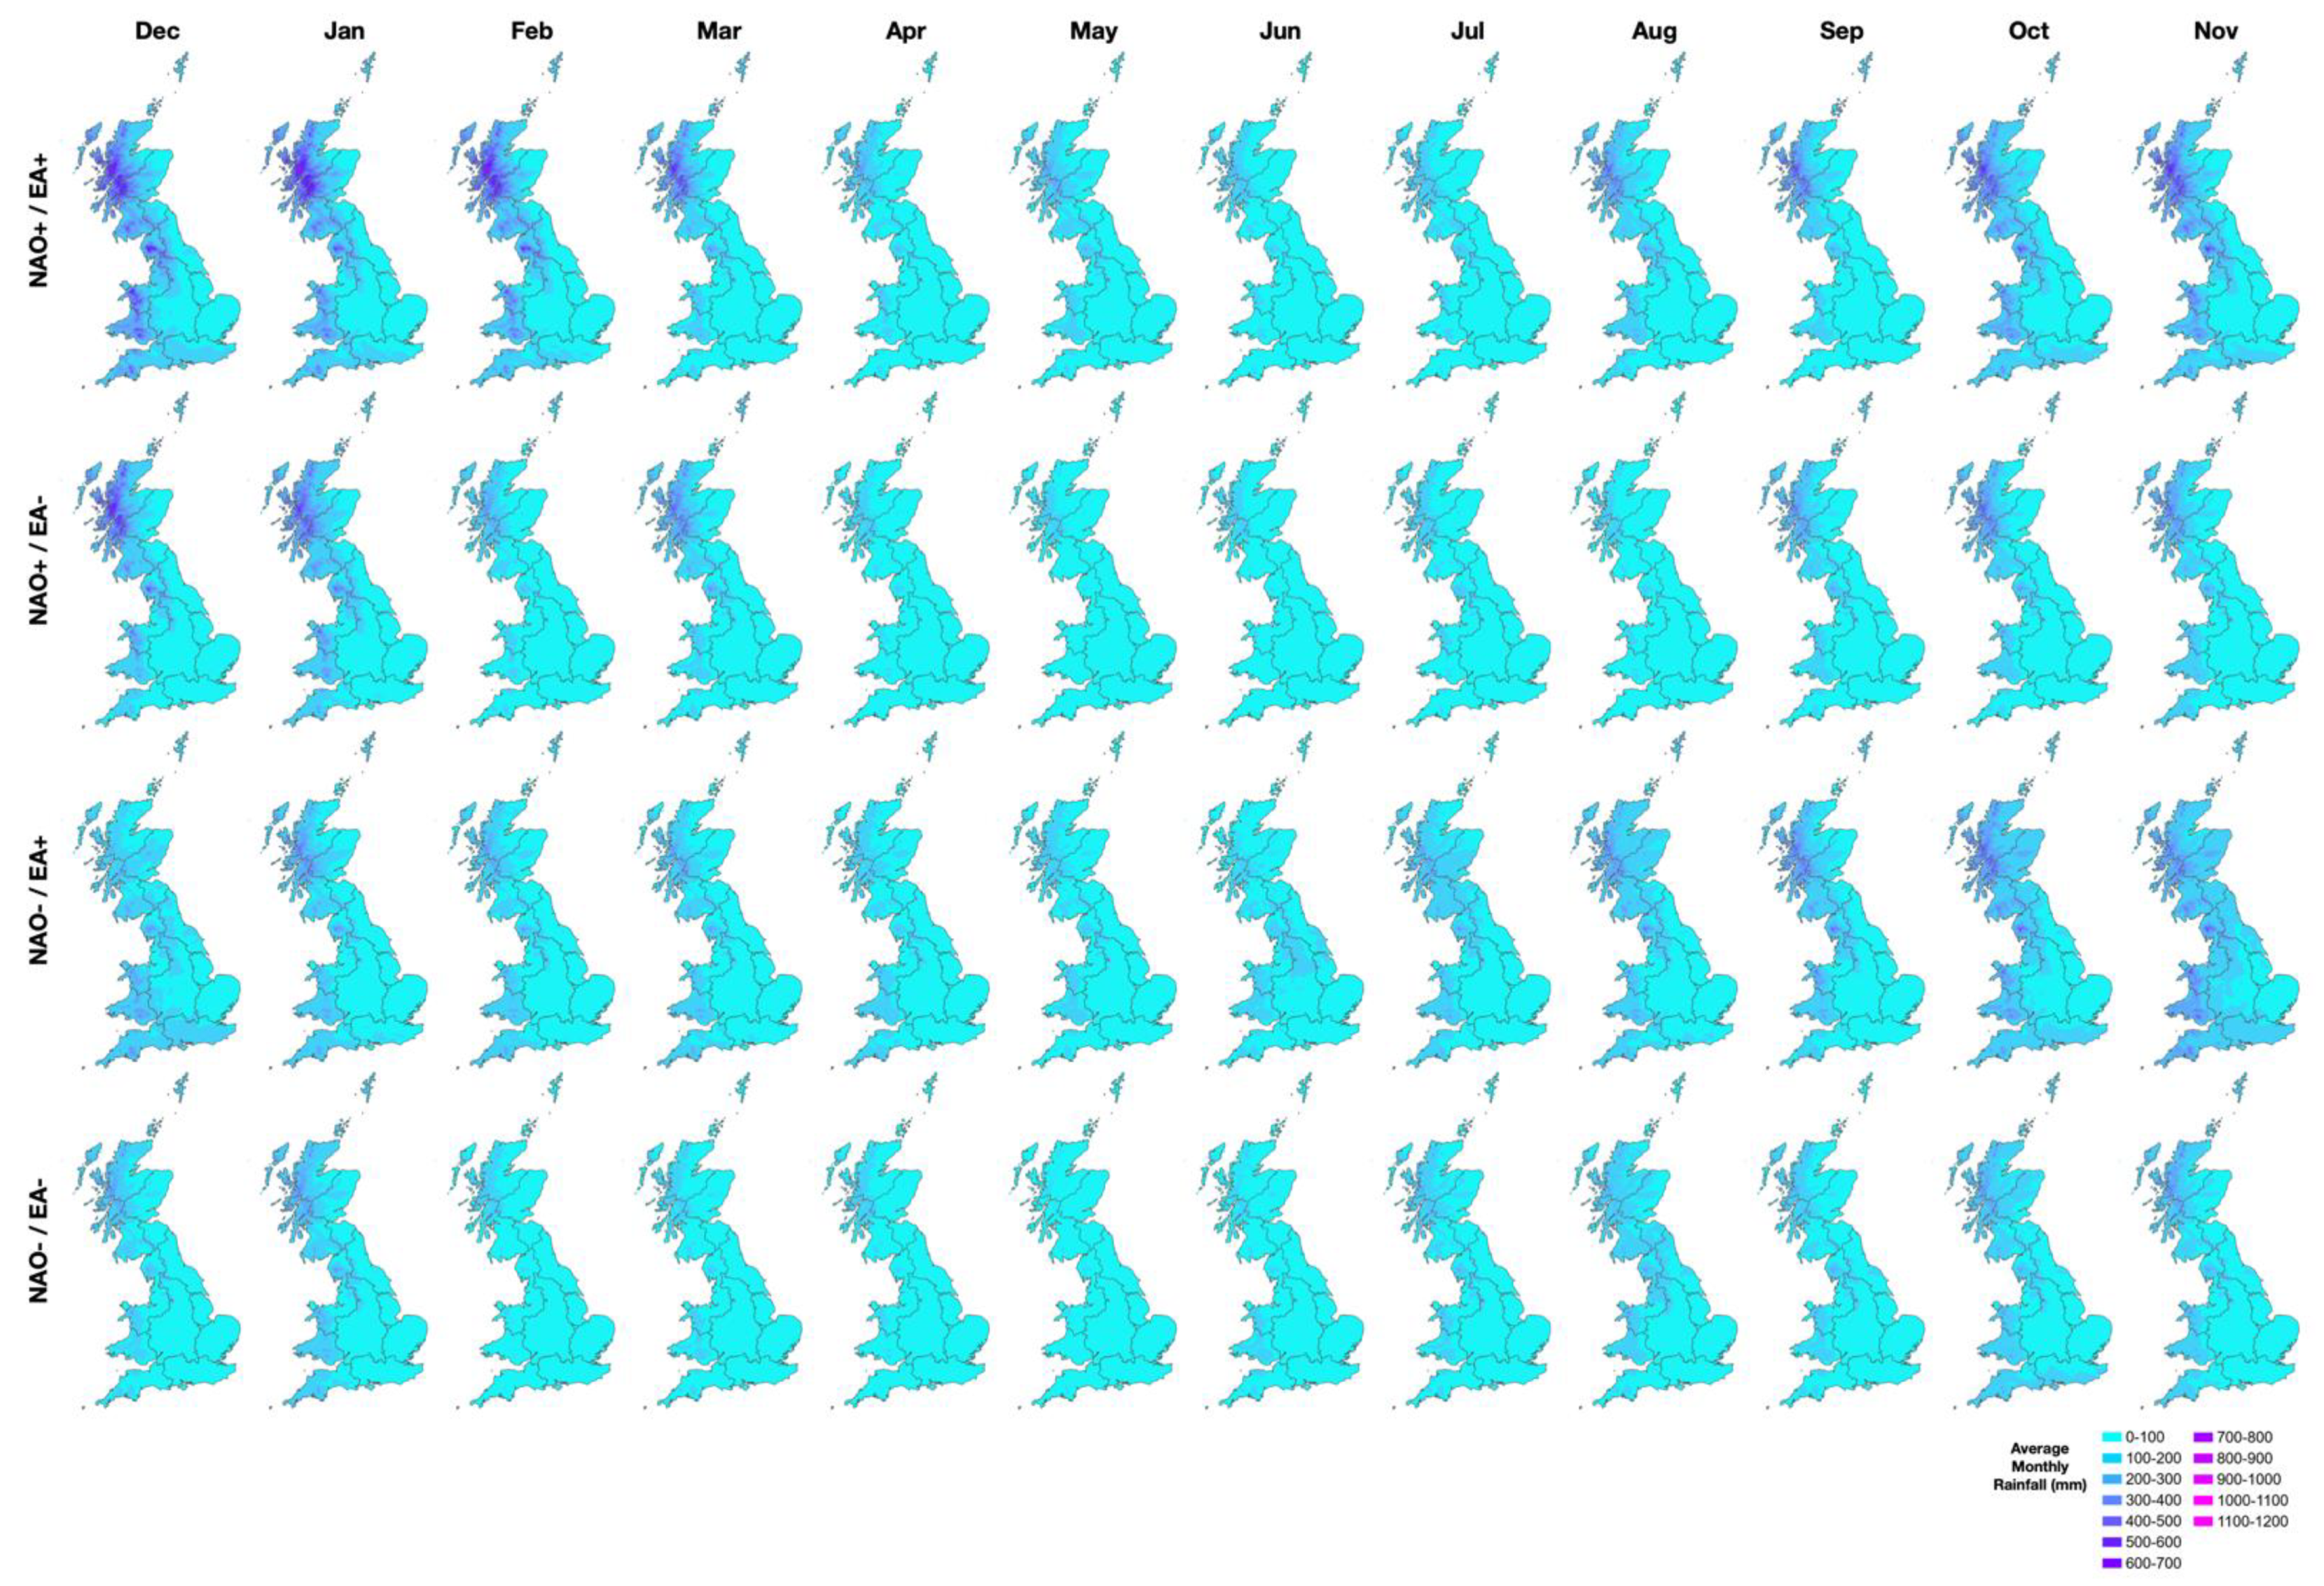
Figure 3 shows the average monthly rainfall based on the GEAR dataset under each NAO/EA phase combination for the nine Met Office Climate Districts for Great Britain. Figure 4 shows the same data; however, the months/phase combination are ranked from highest to lowest average monthly rainfall volume. Mapped averages of the 1 km GEAR dataset can be found in Appendix A. Figure 5 shows the average monthly SPI-1 value for each 5 km pixel, and Figure 6 plots the winter and summer NAO and EA monthly indices with the points symbolised based on the average SPI-1 value for that Climate District.
In the southern districts, such as East Anglia or England SW and Wales S, the months with the highest average rainfall also occur during late autumn and winter, but in association with EA+ phases (Figure 5, Figure 6 and Figure 7). For example, the five wettest months on average in East Anglia all occur under a phase combination of NAO− and EA+ conditions, and the nine wettest months on average (exceeding 150 mm) in England SW and Wales S occur when the EA is in a positive phase (Figure 4). Drier than average conditions in the southern and central climate districts are typically associated with EA− phases during the winter months (Figure 5, Figure 6 and Figure 7).
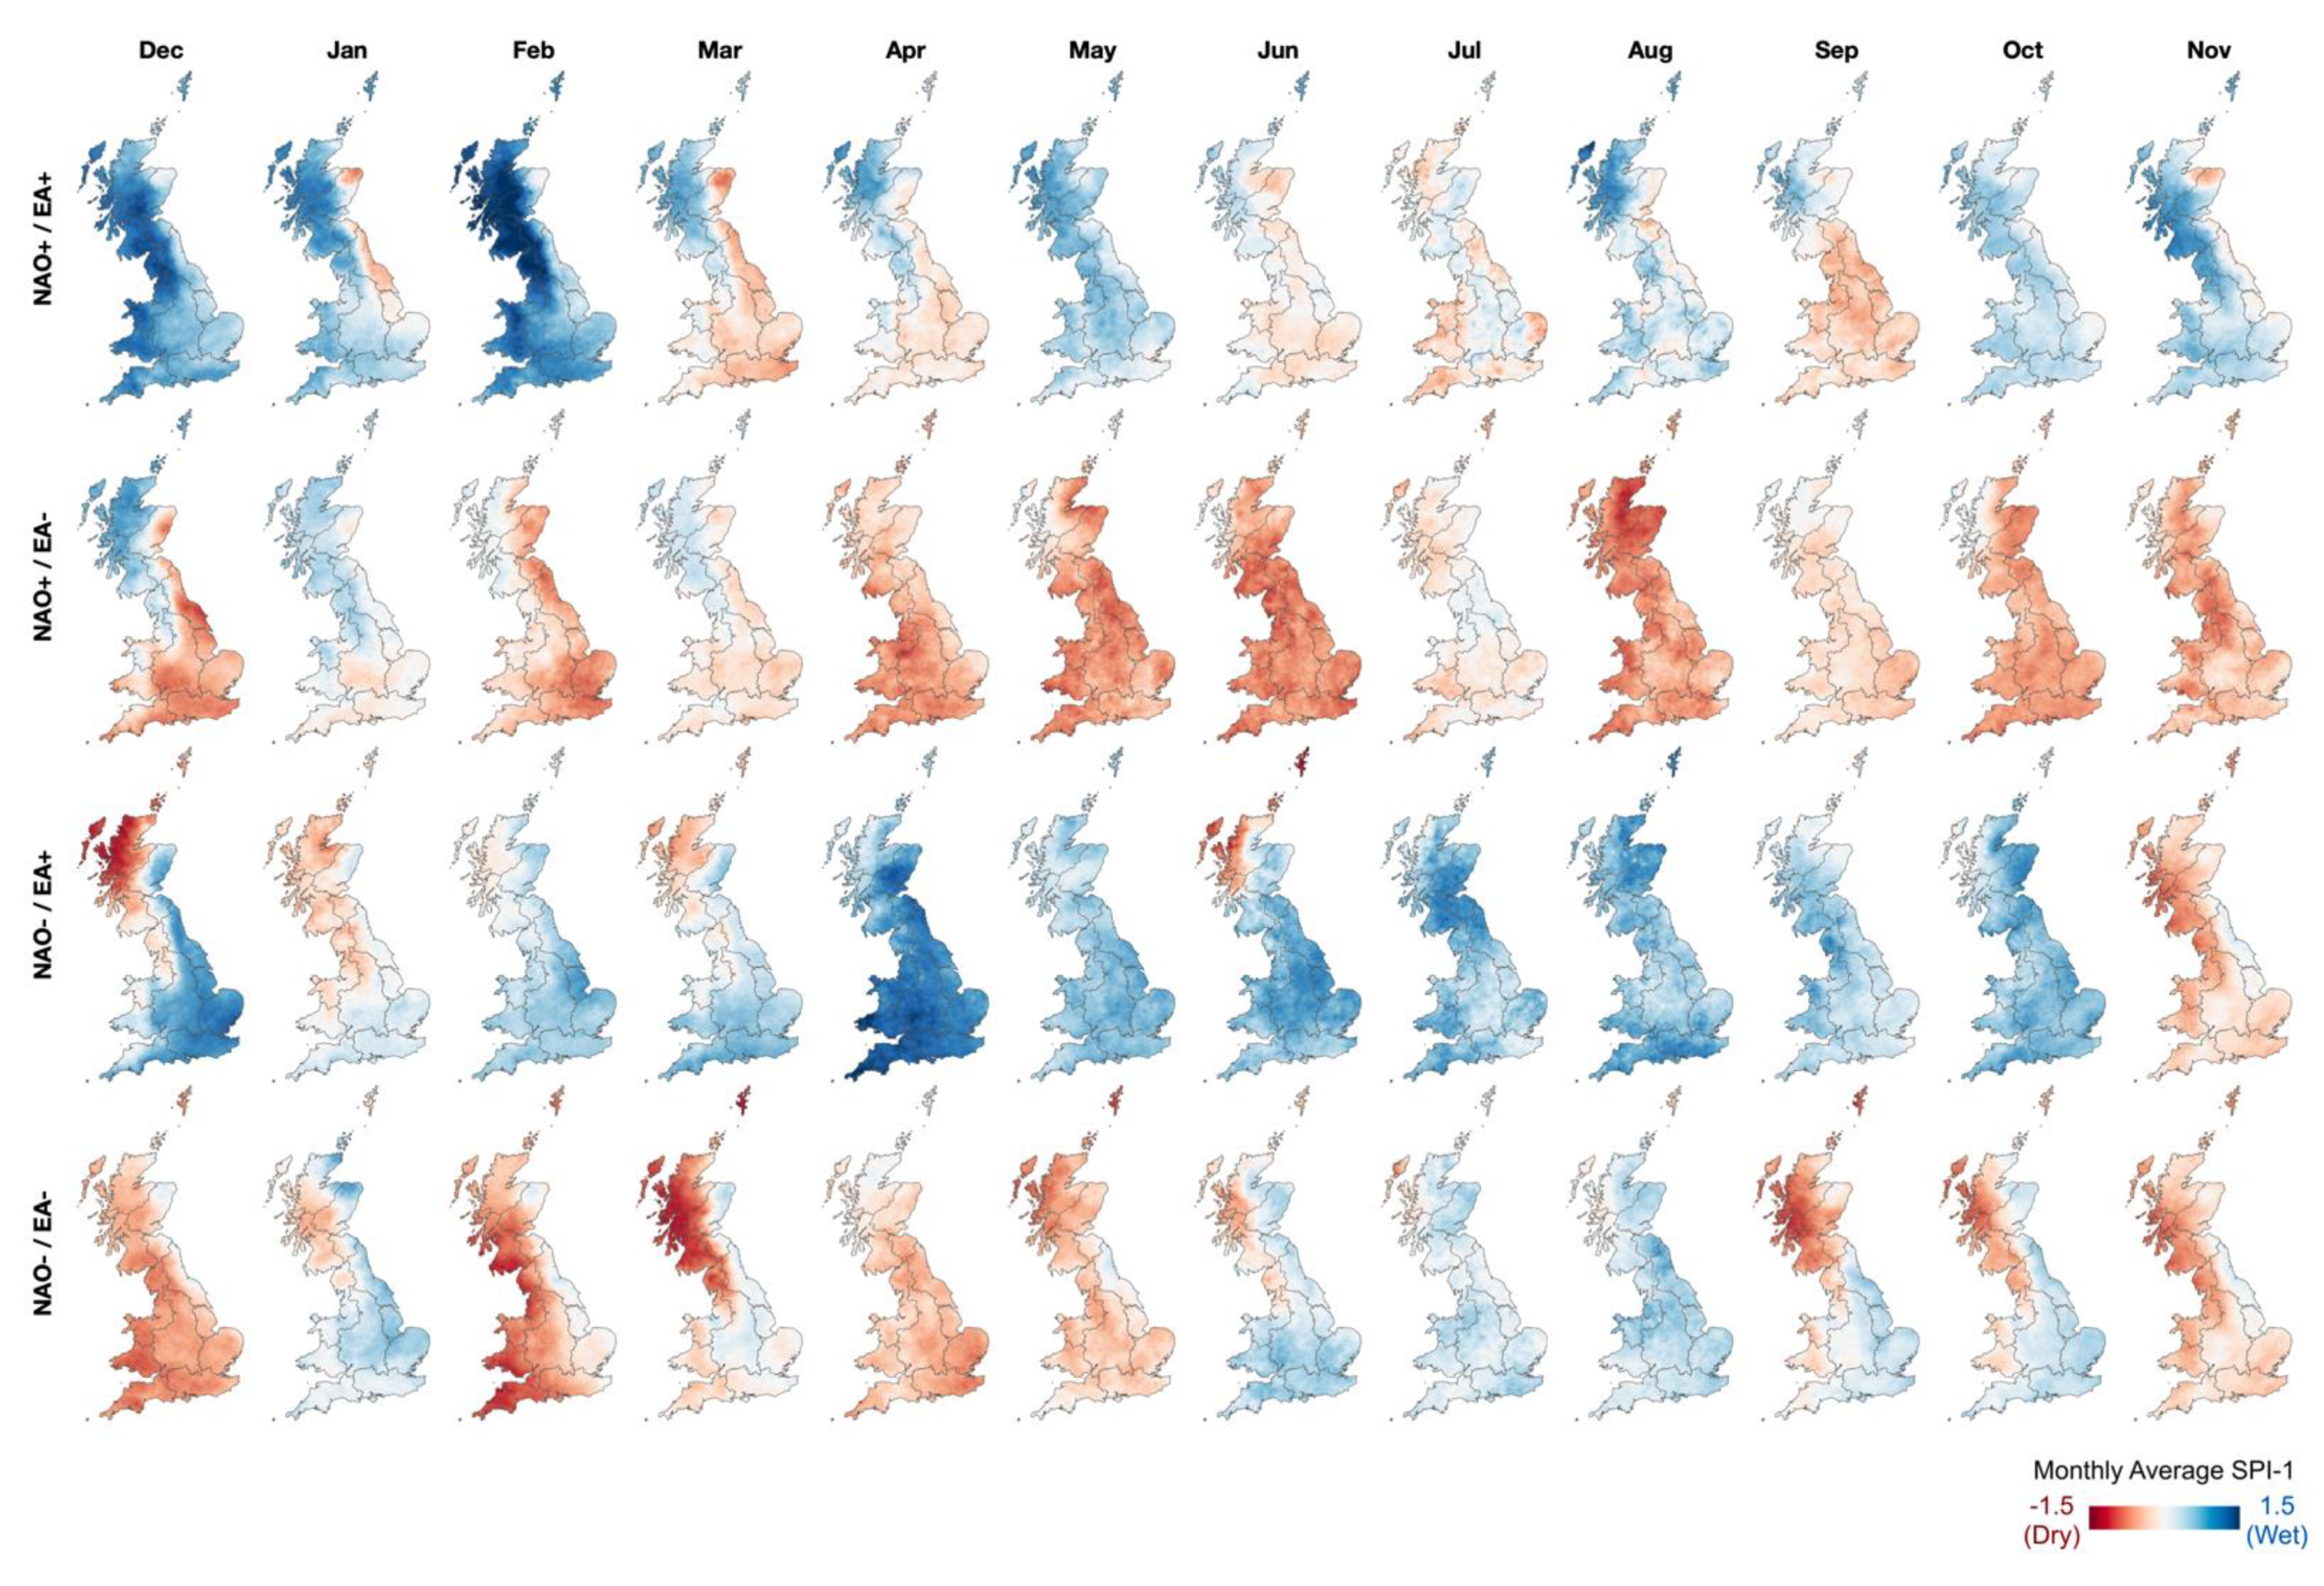
These findings suggest that during winter the NAO has a stronger influence on average wet/dry conditions in the northern and western regions, whilst the EA has a stronger influence on the central, southern and eastern regions. On average, wetter conditions across the country occur when both teleconnections are in a positive phase, and the driest average conditions when both are in a negative phase (Figure 5). Combinations of NAO/EA in opposing phases result in more marked spatial differences in wet/dry conditions between the north-west and south-east regions during winter (Figure 5).
In most Climate Districts, the months with the lowest average monthly rainfall (50–100 mm) occur in late spring and throughout summer and are generally associated with EA− phases and NAO+ phases (Figure 4). During the summer months both teleconnections have a more spatially consistent influence on rainfall than in winter. Typically, the driest summer months are associated with a combination of EA− and NAO+ phases (Figure 5), convergent with the inverse NAO/SPI-1 correlations presented in Figure 2. Wetter average conditions are associated with a combination of EA+ and NAO− phases (Figure 5). For example, average summer monthly rainfall is approximately half the depth under EA−/NAO+ phases as under EA+/NAO− phases in the England SW and Wales S Climate District (Figure 3). Smaller differences in wet/dry signals are found in the summer months when both teleconnections are in the same phase (Figure 5).
The convergence of the evidence presented in Figure 3, Figure 4, Figure 5, Figure 6 and Figure 7 allows us to consider how the NAO and EA interact to influence average monthly regional rainfall spatial distribution and volume in Great Britain. As with the correlation analysis in Figure 2, the relative influence of the two teleconnections clearly varies in space and time. In the northern Climate Districts of Scotland North and West, the months with the highest average monthly rainfall occur during late autumn and winter and are clearly associated with NAO+ phases (Figure 5), with average monthly rainfall exceeding 200 mm (Figure 3). The highest average rainfall volumes are found in these regions when both the NAO and EA are in positive phases (Figure 4). Drier average conditions occur in the north-west when the NAO is in a negative phase, with average monthly rainfall in the region of 100–150mm; approximately half the average monthly rainfall as under NAO+ phases (Figure 3). In these two Climate Districts the NAO has a notable influence on average wet/dry conditions during winter.
3.3. SPI-1 Threshold Frequency Analysis
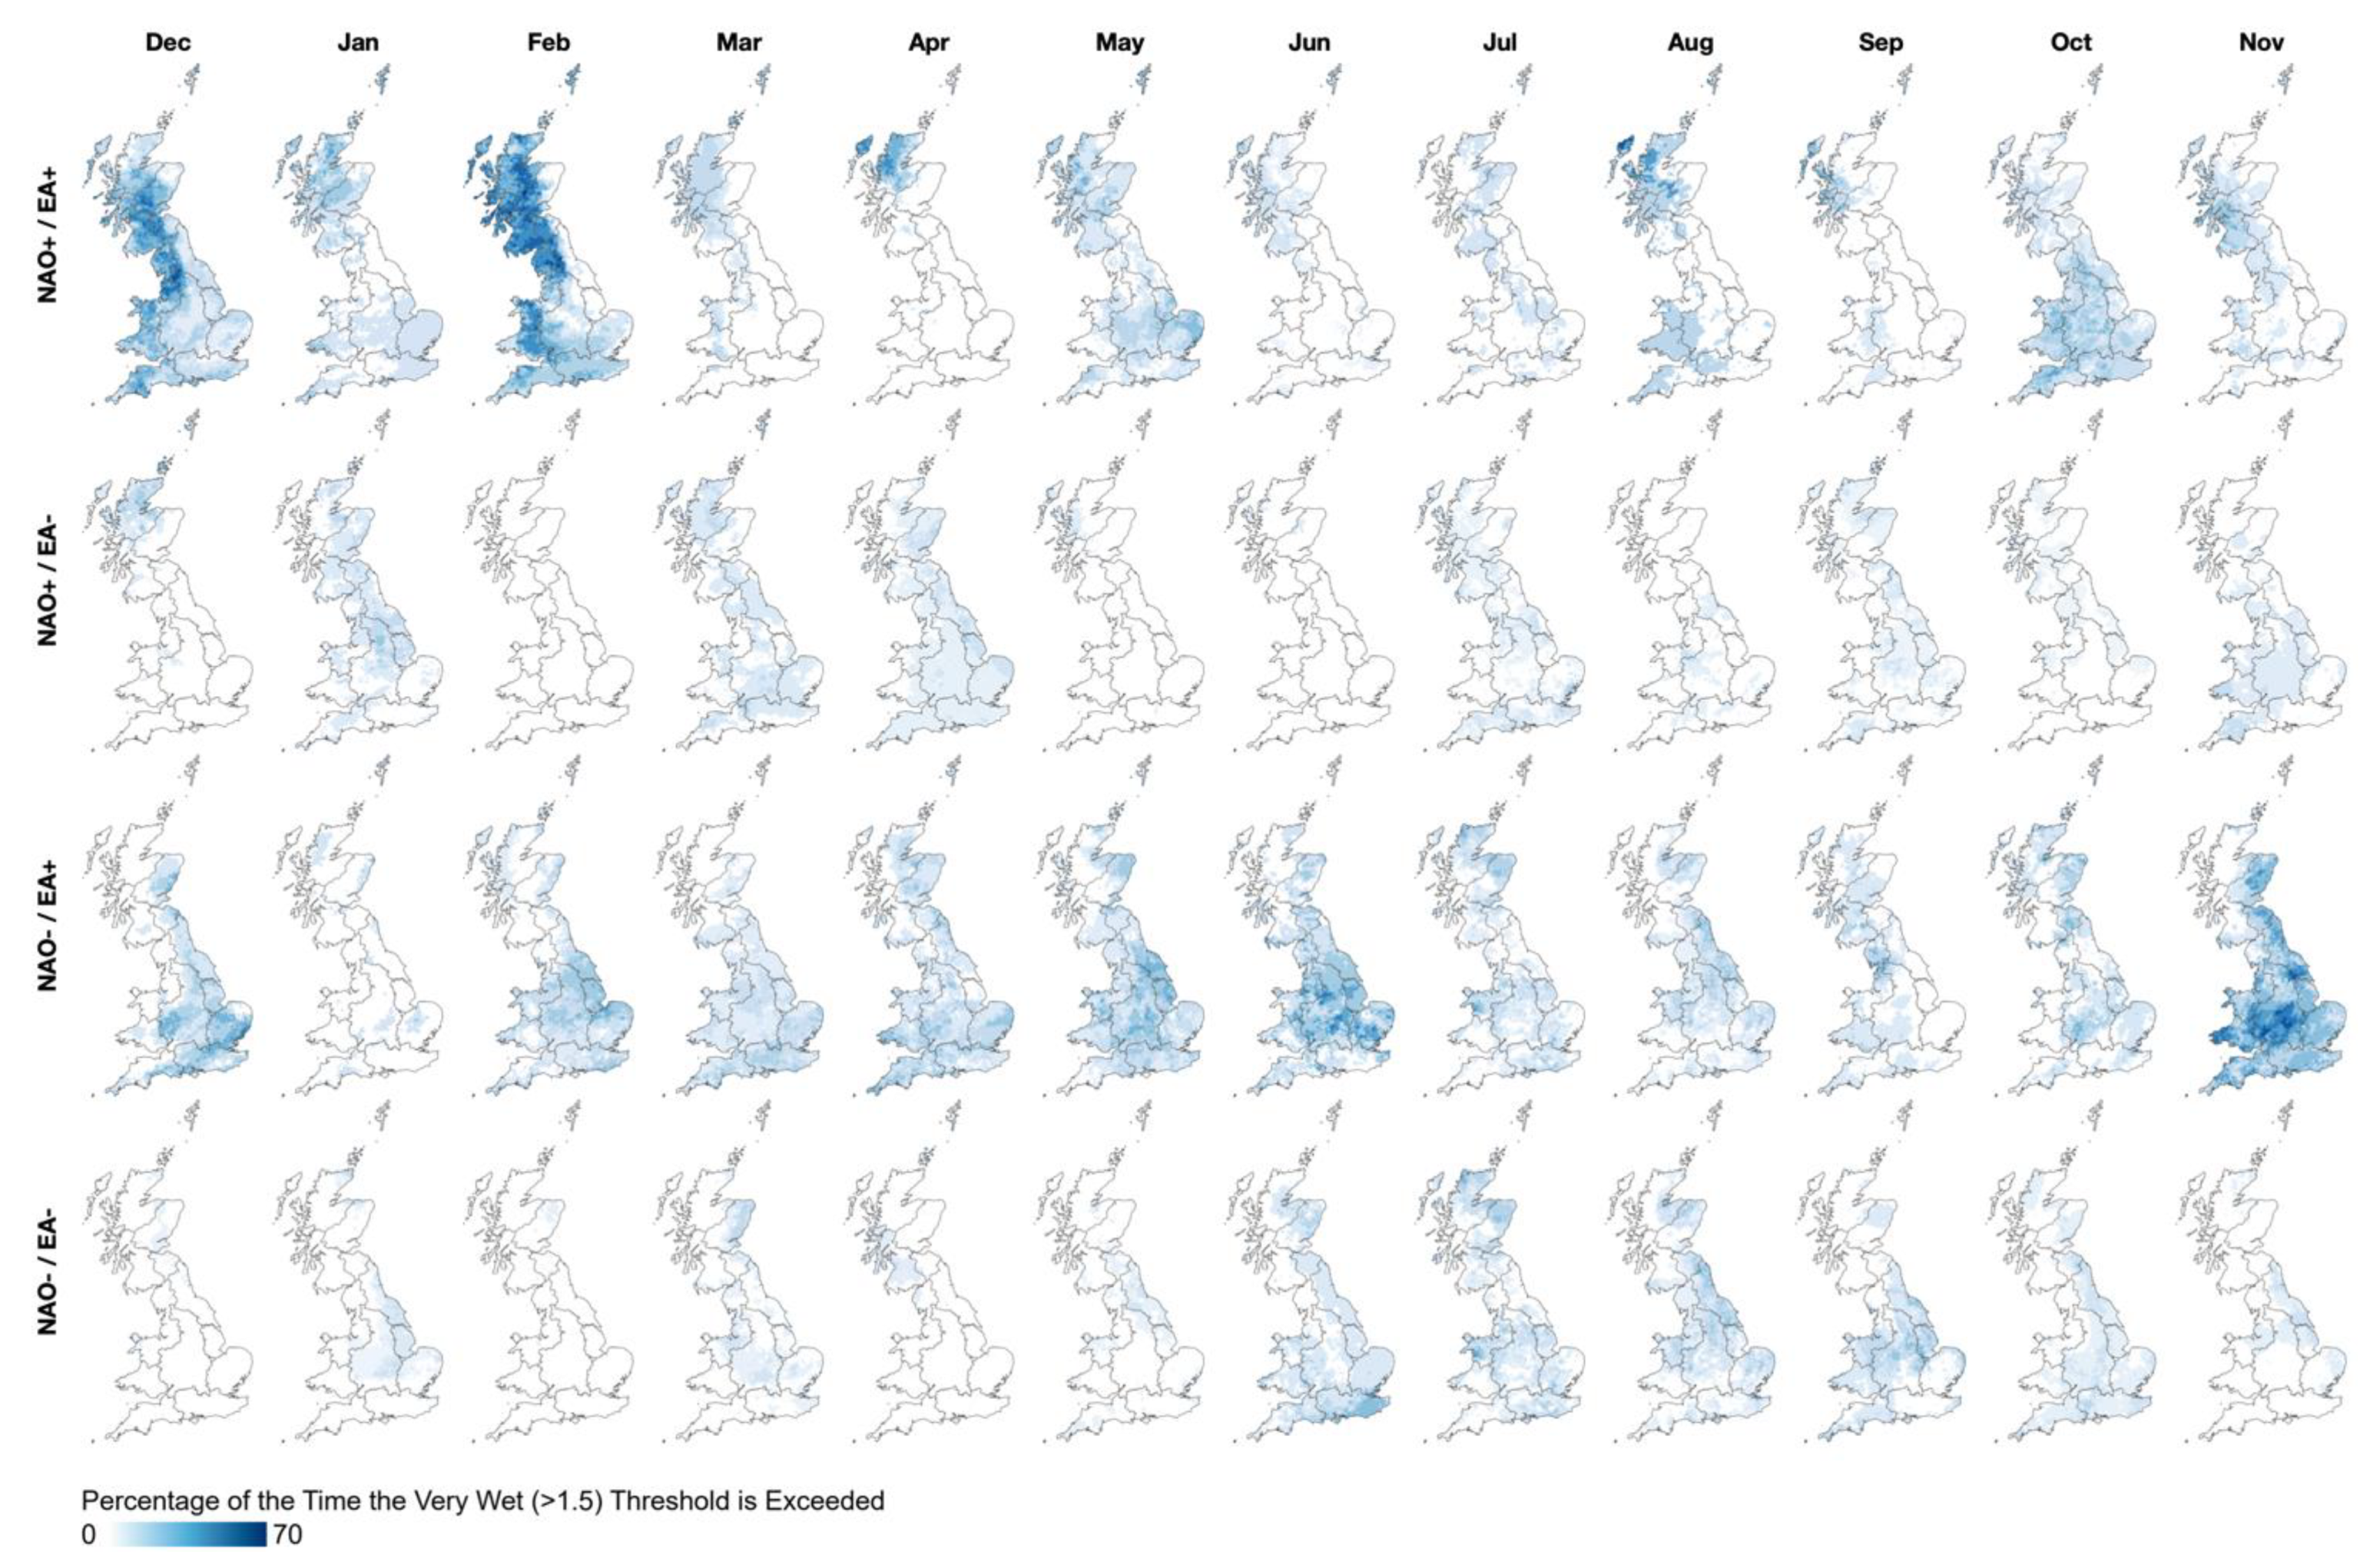
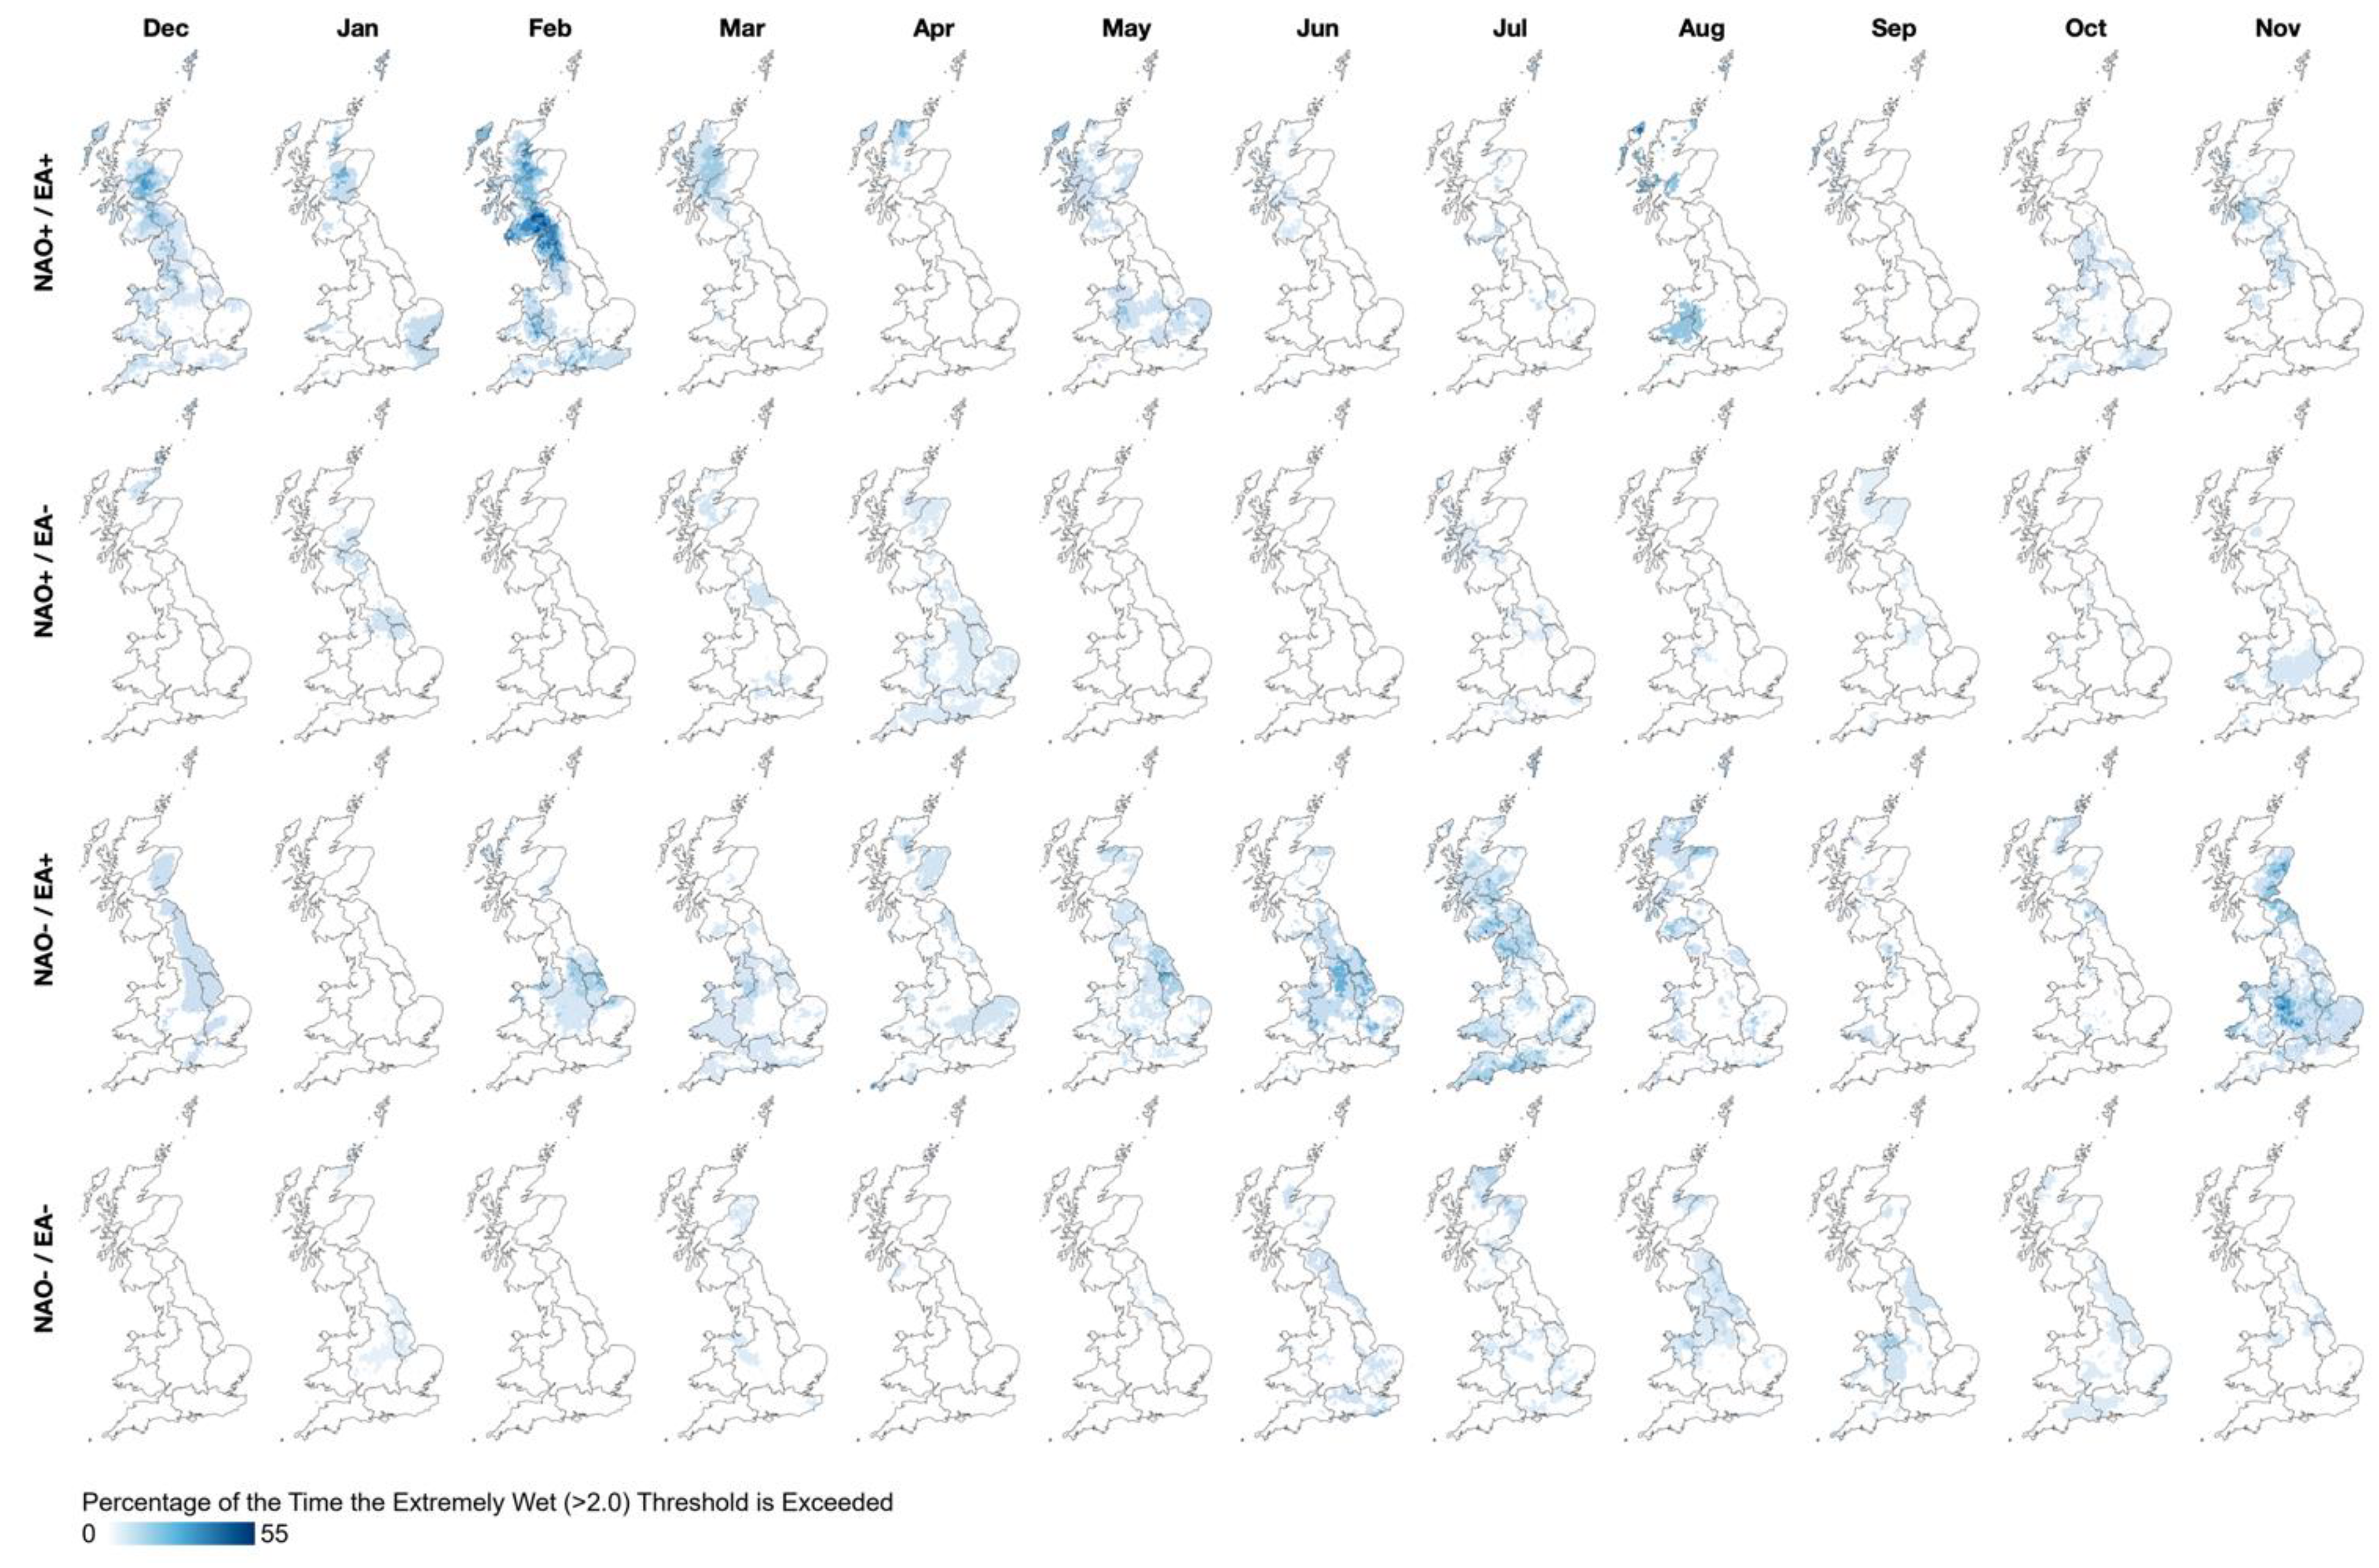
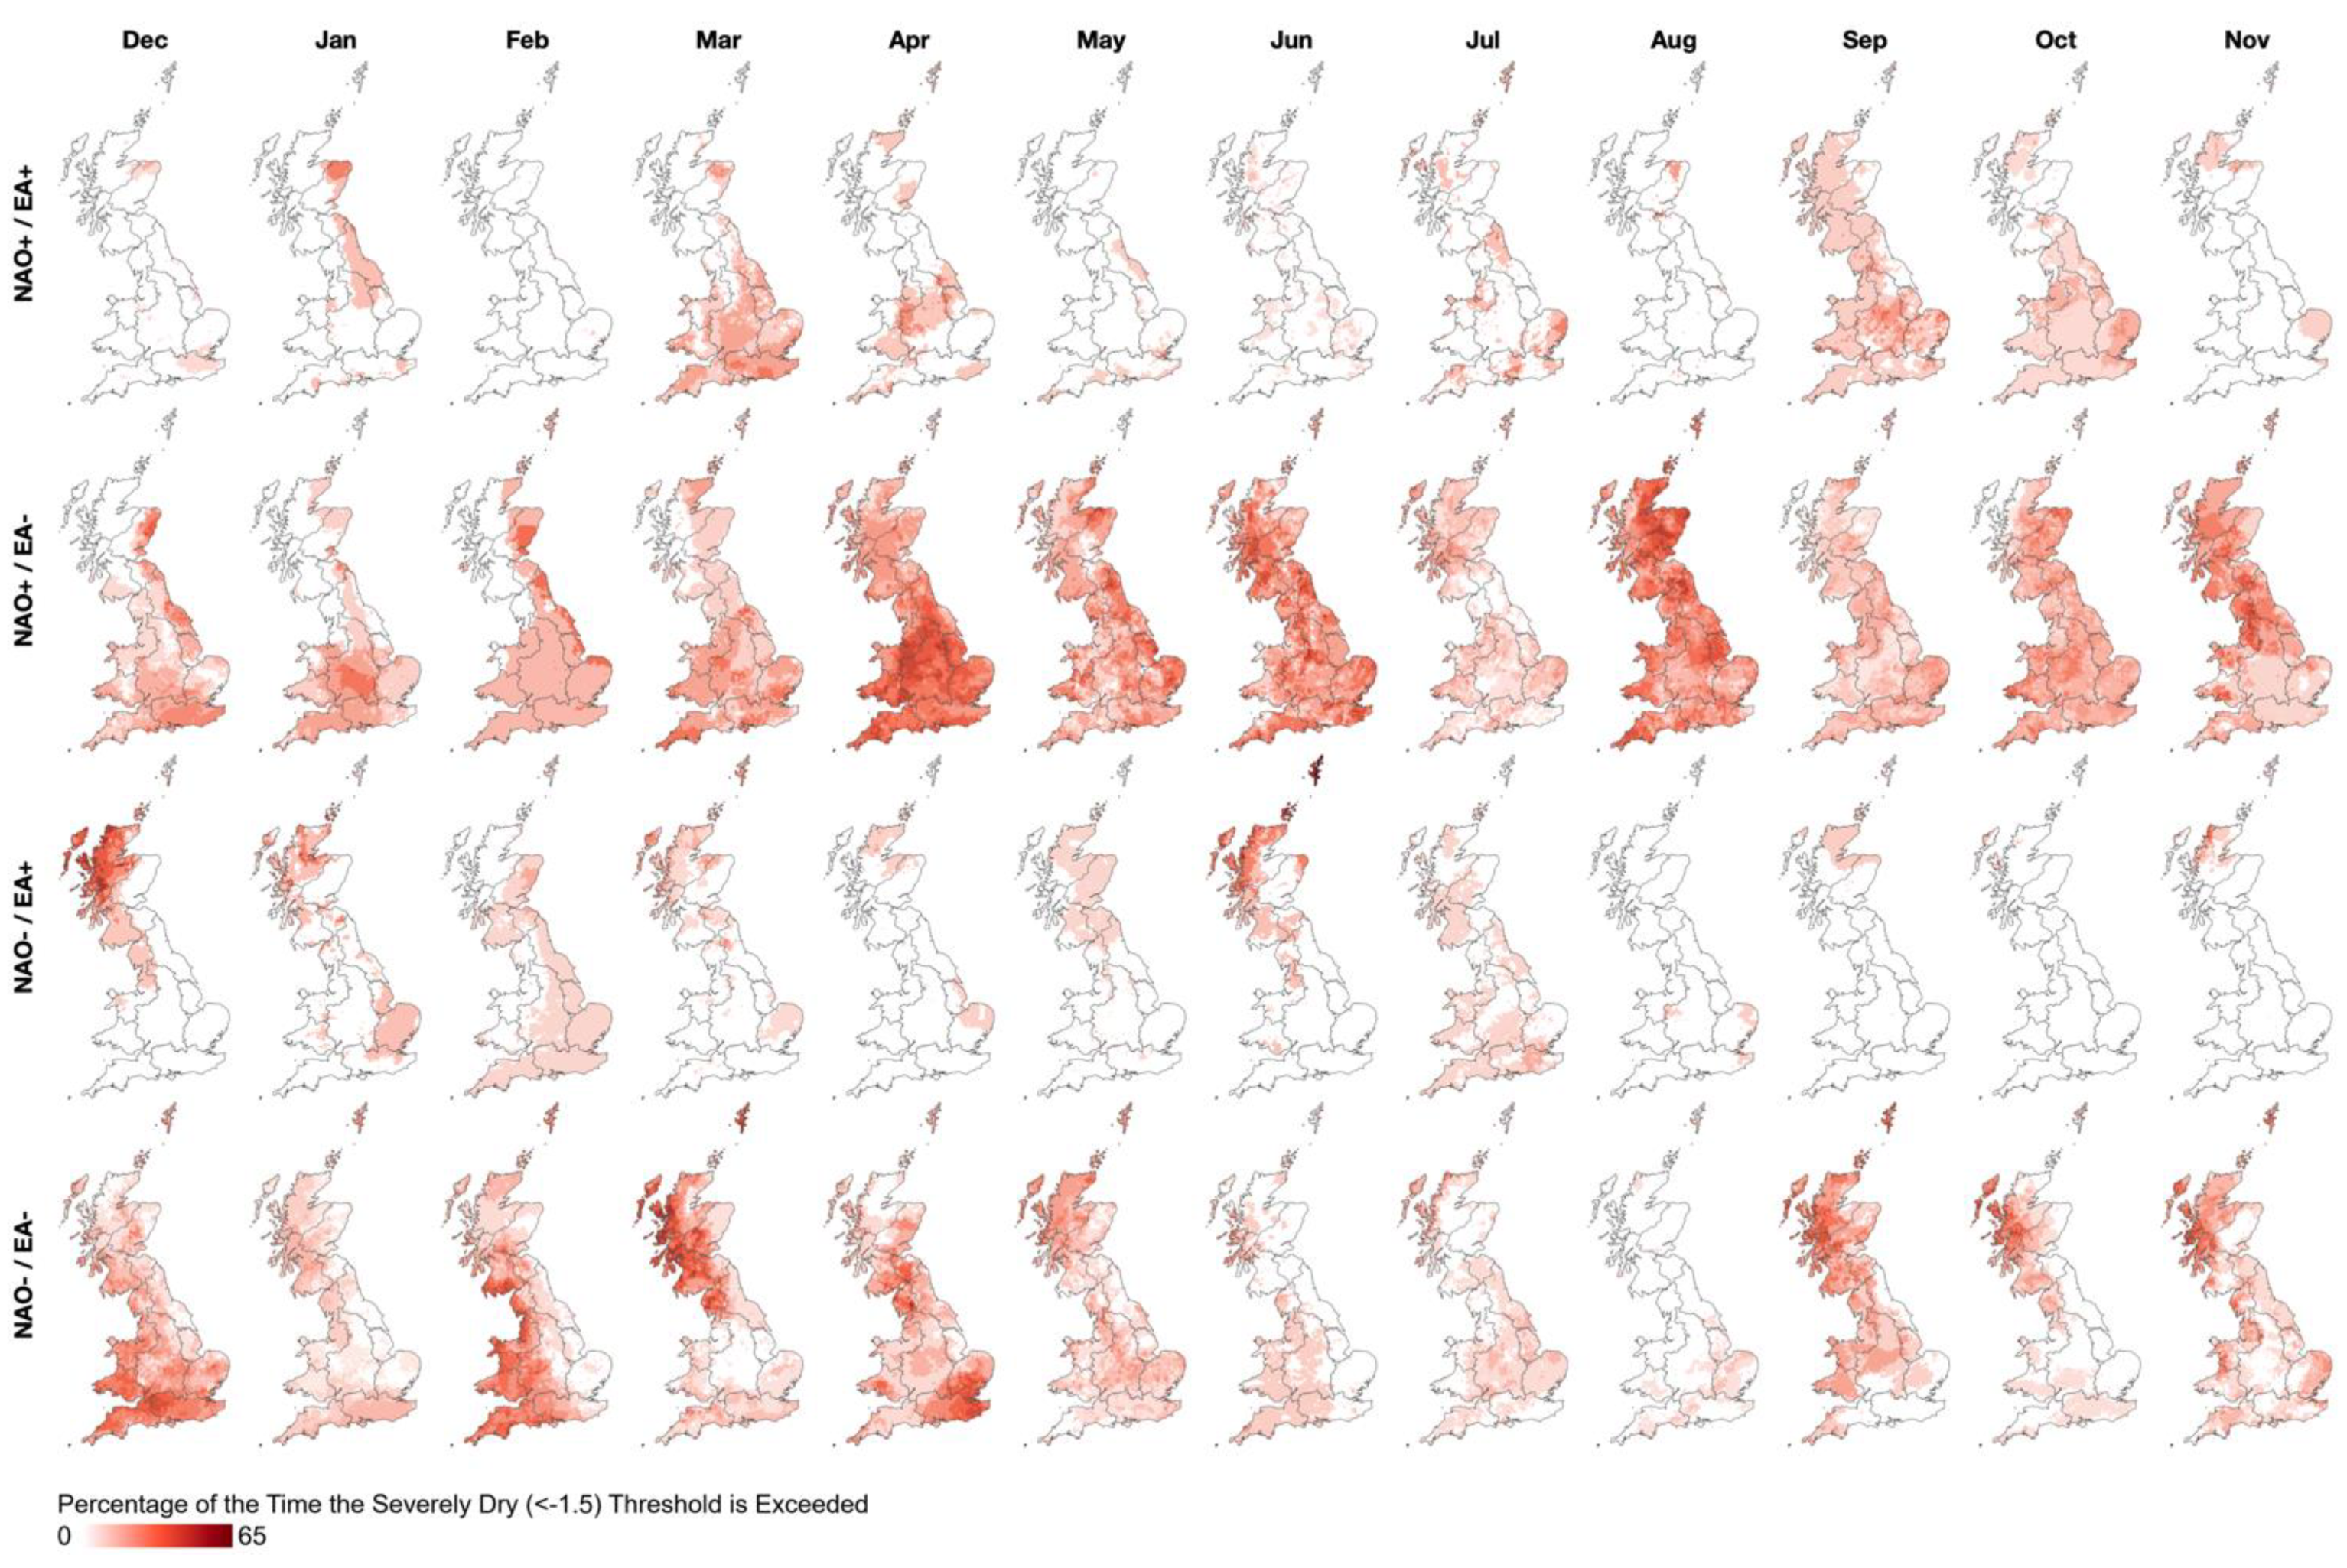
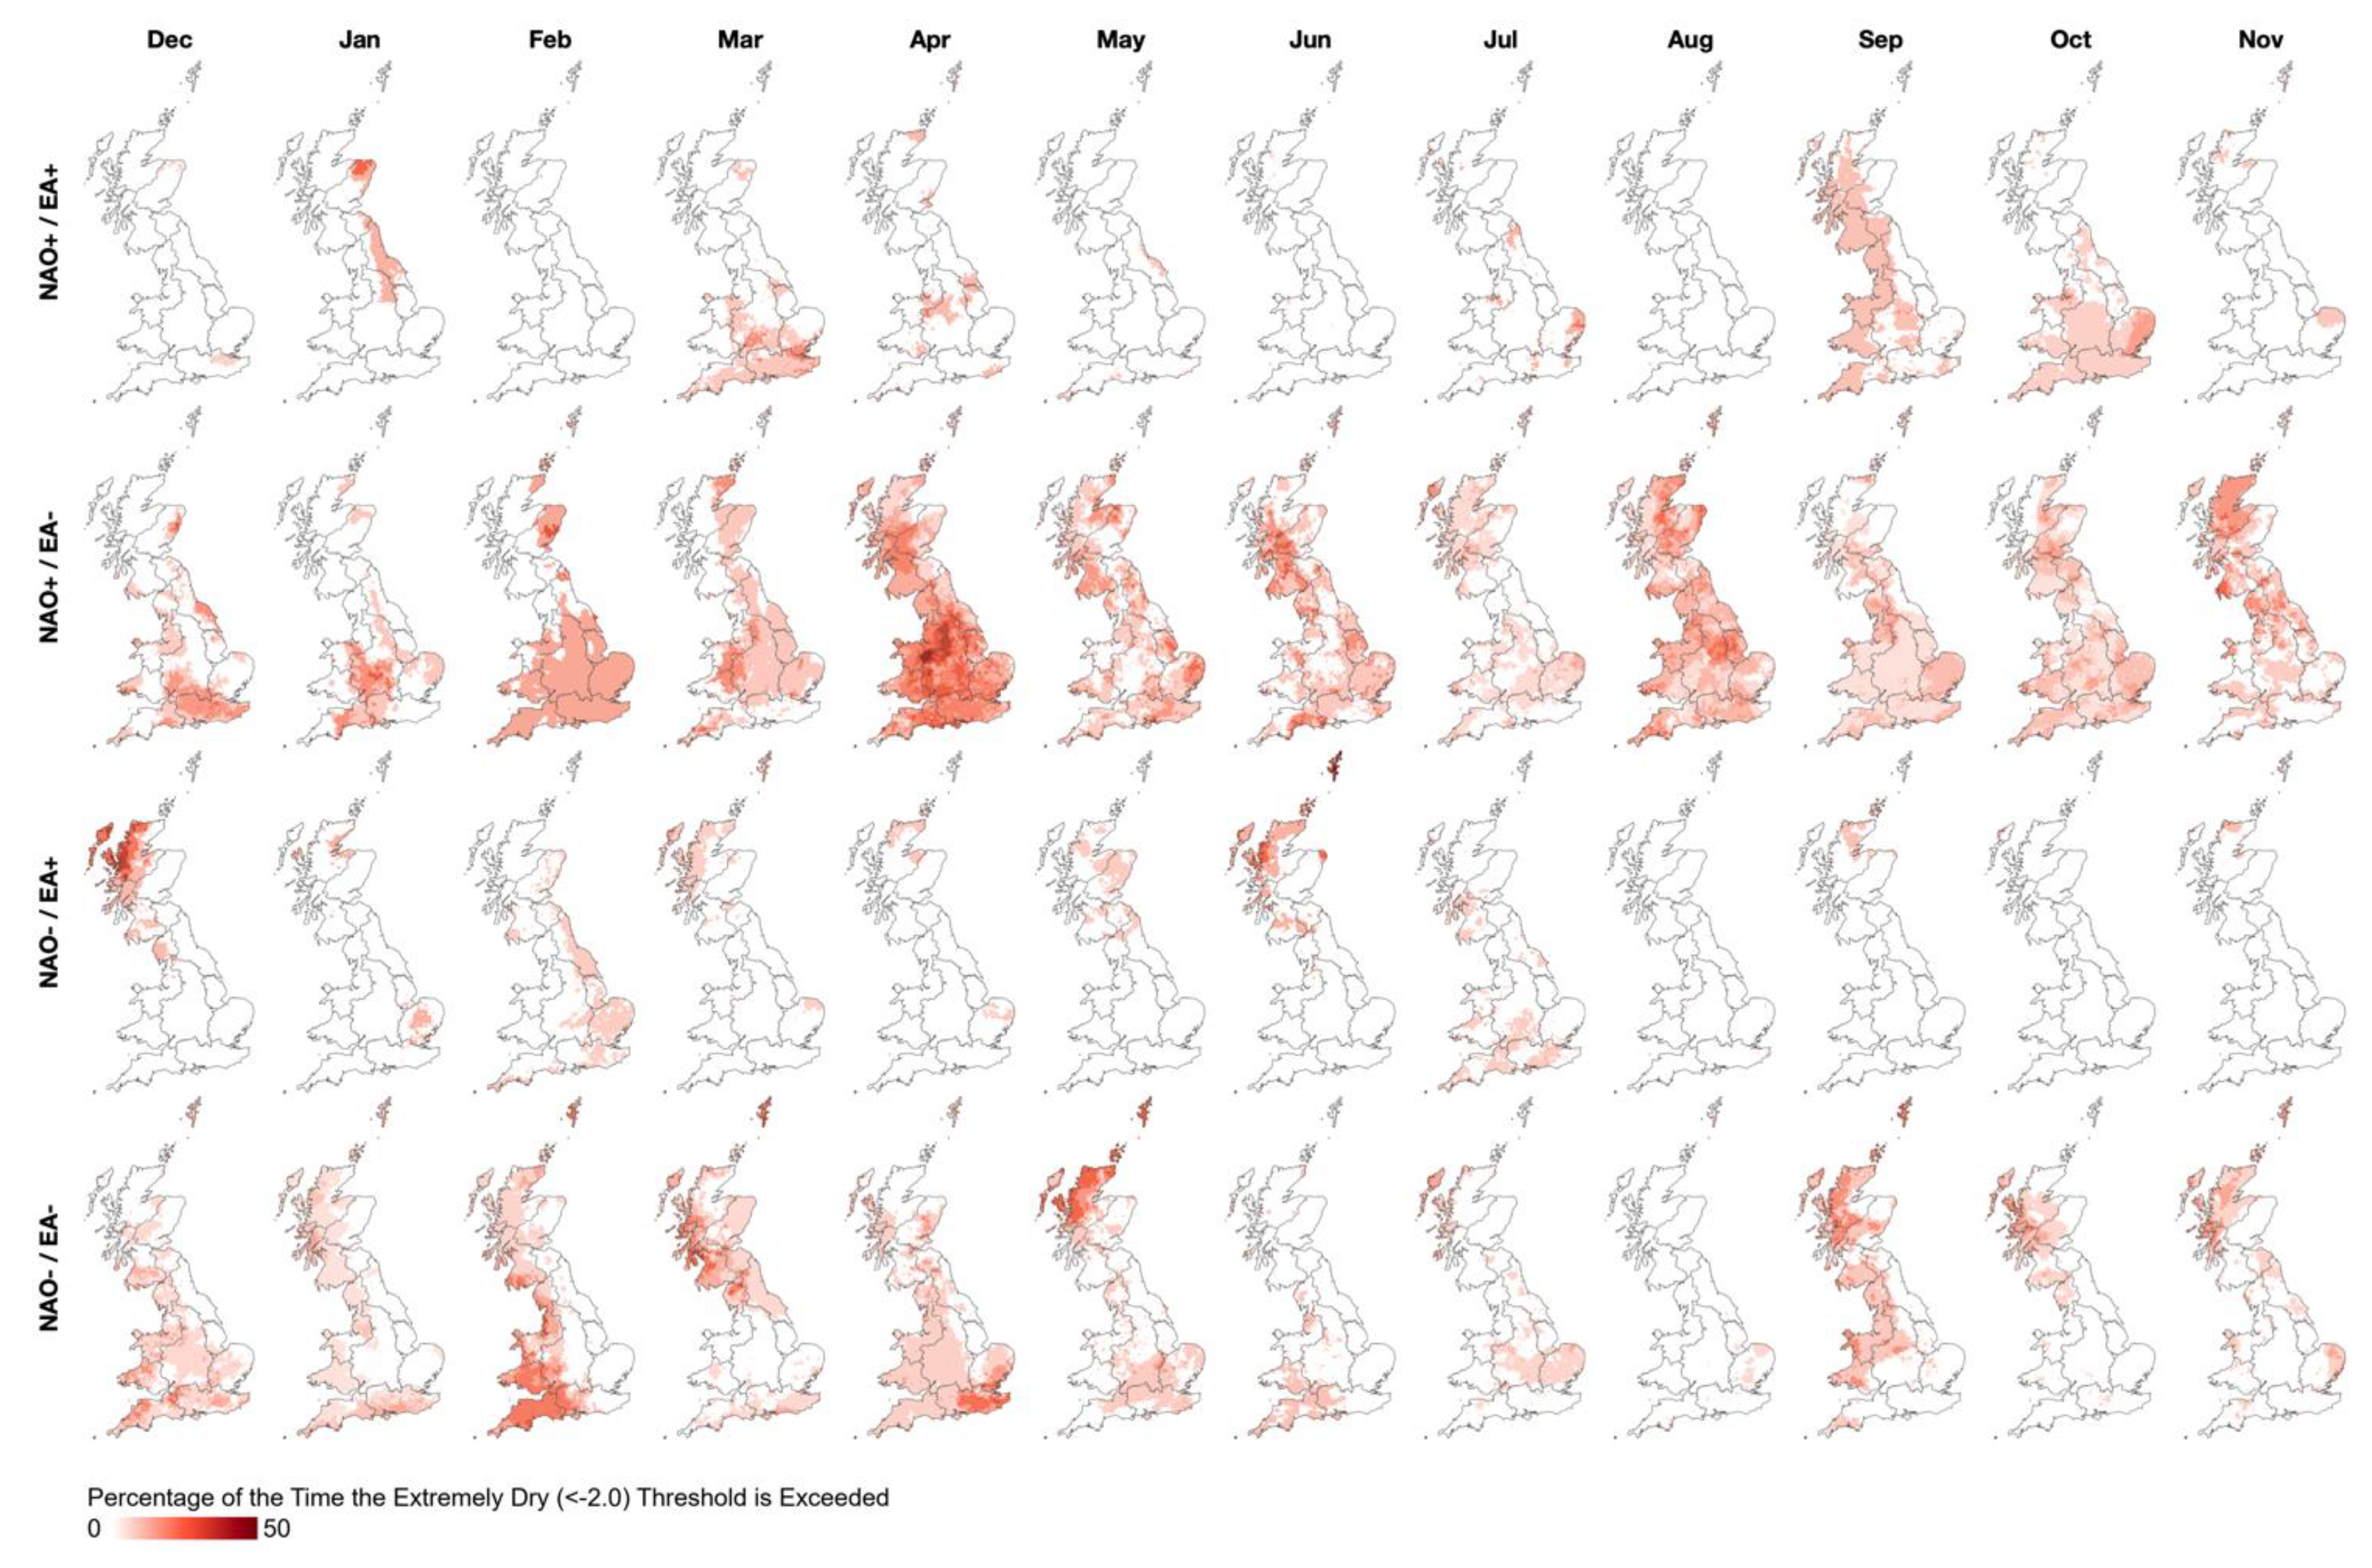
Figure 8 and Figure 9 show the percentage of time (Figure 1) the very wet (SPI-1 > 1.5) and extremely wet (SPI-1 > 2.0) SPI-1 class thresholds are exceeded for each calendar month across the study period. Figure 10 and Figure 11 show the percentage of time that severely dry (SPI-1< −1.5) and extremely dry (SPI-1 < −2.0) thresholds are exceeded.
The SPI-1 class frequency analysis shows spatio-temporal variability in the extent of wet/dry extremes relative to the combination phases of the NAO and EA teleconnections. Figure 8 and Figure 9 show that during the winter months the north-western areas have a higher incidence of very/extremely wet/dry conditions when both the NAO and EA are in a positive phase. Wetter conditions throughout the year are more likely in the southern, eastern and central regions when the EA is in a positive phase. In the summer months the phase combination of NAO− and EA+ is most likely to result in very wet conditions across most Climate Districts. The occurrence of very/extremely wet conditions in the summer months with NAO+ and EA− phases is very low.
Conversely, opposite patterns in the spatio-temporality of severe and extreme dry events are shown in Figure 10 and Figure 11. In the winter months there is a high incidence of severely dry conditions in the north-west under NAO− phases, independent of the phase of the EA. Meanwhile severely dry conditions have a higher frequency of occurrence in the southern regions when the EA is negative, a pattern which is present in most calendar months. In the summer months, the phase combination of NAO+ and EA− phases has the highest incidence of severe/extreme dry conditions across Great Britain. In the summer months, the incidence of severe/extreme dry conditions in other phase combinations is considerably less. These findings regarding the spatio-temporal variability in the occurrence of wet/dry extremes corroborate the correlation and average rainfall/SPI-1 analyses discussed above and demonstrate the combined role of both teleconnections in influencing the spatial distribution and frequency of wet/dry extremes.
4. Discussion
This study used high-resolution gridded rainfall datasets for Great Britain to map the spatially variable rainfall signatures of the NAO and EA atmospheric-oceanic circulations, contributing to research exploring the effect of and interactions between these two North Atlantic teleconnections.
Our correlation and analyses of high-resolution gridded rainfall and SPI-1 datasets presents a new understanding of the spatially variable influences of the NAO and EA on rainfall depth and distribution in Great Britain. During winter, we find that the NAO has a strong influence on regional rainfall in the north-western areas, with significant wet/dry conditions associated with NAO +/− phases (Figure 8, Figure 9, Figure 10 and Figure 11), a general relationship identified in previous research [4,6,7,8,9]. The effect of the EA in the north-western area during winter appears to be more limited. Conversely the southern, central and eastern regions show a stronger relationship between wet/dry events and the phase of the EA, with wetter conditions in these areas associated with EA+ conditions (Figure 8 and Figure 9), and drier conditions EA− (Figure 10 and Figure 11).
The typical NAO-rainfall response in Great Britain is often noted as being along a NW/SE gradient during the winter months, with opposing wet/dry responses observed in these two regions [9,21]. Our findings suggest that this spatially variable response is potentially dependent on the phase and strength of the EA, with the opposing NW/SE rainfall responses being conditional on whether the EA is in the same or opposite phase to the NAO (Figure 5). Less distinctive spatial differences in the relative influence of the NAO and EA were found in the summer months, with the NAO in particular having a more spatially homogenous signature [9,11,13]. The more spatially consistent rainfall signatures in the summer months may be associated with greater convective, rather than orographic, rainfall generation [6,9,21]. The wet/dry directionality of the rainfall response to the NAO is also inverted during the summer as the positive winter correlations become negative (Figure 2). These spatio-temporally variable effects of the NAO and EA were found in average rainfall/SPI-1 values (Figure 3, Figure 4, Figure 5, Figure 6 and Figure 7) and the analysis of extreme wet/dry event occurrence (Figure 8, Figure 9, Figure 10 and Figure 11).
Our analyses exploring the interaction between the phases of both the NAO and EA reveal the two teleconnections can either enhance or moderate the regional rainfall influence of each. For example, when both teleconnections are in a positive phase during the winter months, generally higher rainfall averages were found (Figure 5) and the occurrence of very/extremely wet conditions was high across the country (Figure 8 and Figure 9), although most notably in the north-west. Moore et al. [32] explored the combined effect of NAO/EA phases on winter mean SLP across the North Atlantic region (see their Figure 6); NAO+/EA+ phases result in a southwesterly movement and strengthening of the Icelandic Low, with lower SLP extending over the North Atlantic and Great Britain, increasing the likelihood of higher rainfall. Conversely under NAO−/EA− phases the Icelandic Low dipole experiences higher than average SLP, resulting in an extended area of higher pressure over Great Britain [32], producing drier conditions. When the NAO and EA are in opposing +/− phases this results in a northeasterly movement of the two dipoles and a more marked difference in SLP between Iceland and the Azores [32]. This manifests in our analysis as a clear NW/SE rainfall signature across Great Britain (Figure 5).
In our analysis, the combination of NAO+ and EA− phases results in the driest average conditions during the summer months (Figure 5) and the highest probably of severe dry conditions occurring (Figure 10). Conversely NAO− phases were found to be typically associated with wetter conditions (Figure 5). Folland et al. [11] identified that a positive summer NAO is associated with a northward movement of the North Atlantic storm track, and easterly winds bringing warm air from continental Europe. Conversely, a negative summer NAO is associated with a southward movement of the storm track [11] resulting in higher rainfall across Great Britain.
Our analyses also show how the EA can have a moderating effect on the regional NAO-rainfall response. For example, during the summer months more diluted rainfall signatures (Figure 5) and lower occurrence rates of wet/dry extremes (Figure 8, Figure 9, Figure 10 and Figure 11) were found when both the NAO and EA were in the same phase. This may be associated with the effect of the summer NAO N/S movement of the storm track [11] being either moderated or enhanced by the EA (as is the case during the winter months [32]).
West et al. [21] analysed the spatio-temporal variability in the regional rainfall response to the NAO in Great Britain, finding that whilst more consistent responses were found in the north-west during winter, in the southern, central and eastern regions more wet/dry variability can be observed. Based on the results presented in this study, we suggest that some of this wet/dry variability is potentially associated with the phase and strength of the EA, which has consistent positive correlations with SPI-1 values in the southern and central regions throughout the year (Figure 2). Comas-Bru and McDermott [24] suggest that through a combination of both the NAO and EA we may be able to describe winter climate variability more accurately; our analyses support this observation and highlight that this is also true in the summer months.
The findings of this study also have implications for the inclusion of monthly and seasonal NAO forecasts in water management decision making, which is potentially limited due to NAO-rainfall response variability [22]. Whilst NAO forecasts may contain useful information for the north-western areas during the winter months, they are likely to be less useful in the south [21]. This implies that even highly accurate NAO forecasts are not enough to fully predict regional rainfall across Great Britain [13]. Our analyses reveals that the phase and strength of the EA might, to an extent, explain NAO-rainfall response variability. EA indices might therefore serve as a useful addition to regional hydrometeorological forecasting research, and predictions of both the NAO and EA several months in advance might be of practical use to water resource managers. However, as far as we are aware, no EA forecasting skill improvements have been reported in recent years, as has been the case with the winter NAO [43,44].
In this study we used monthly modelled teleconnection indices from NOAA [29] to quantity the NAO and EA, with positive/negative phases defined by a threshold of ±0.25. It is important to note that there is no fixed approach to defining the phases of atmospheric circulations [45], and there is scope for future work to examine the sensitivity of the rainfall signatures identified in this study to the method of phase definition. There is also scope for future research to apply the high-resolution rainfall products used in this study to examine the influence of and interactions between other atmospheric-oceanic circulations not considered in this analysis, which may include the Scandinavian Pattern [24,46,47] and East Atlantic/West Russia Pattern [48,49,50] which have also been associated with variability in European climate. There is also scope to explore at a high resolution the influence of phases of the NAO/EA on the location and strength of the Icelandic Low and Azores High meridional dipoles, and how the relationship between the NAO/EA and rainfall might have changed over time, especially given the winter EA index positive trend which has been found in some studies [25].
5. Conclusions
This study used high-resolution gridded rainfall and SPI-1 datasets to map the monthly rainfall signatures of the North Atlantic Oscillation (NAO) and East Atlantic Pattern (EA) in Great Britain, with the aim of contributing to research exploring the interaction between these two atmospheric-oceanic circulations. Our findings show that the influence of the two teleconnections varies in space and time with distinctive signatures observed in both average rainfall/SPI-1 values and wet/dry extremes. In the winter months our analyses show the strong influence of the NAO on average monthly rainfall and extreme wet/dry events in the north-western regions of Great Britain. Meanwhile, in the southern, central and eastern regions stronger EA-rainfall relationships were present, which is significant given that these regions have been reported as having more variable NAO-rainfall responses in previous research. In the summer months we find that opposing +/− phases of the NAO and EA indices produce stronger wet/dry signatures, with average conditions when the two teleconnections are in the same phase being more diluted, resulting in a lower probability of wet/dry extremes.
Our findings suggest both the NAO and EA have a prominent influence on regional rainfall distribution and volume in Great Britain, which has implications for the use of teleconnection forecasts in water management decision making. We conclude that accounting for both NAO and EA influences will lead to an enhanced understanding of both historic and future spatial distribution of monthly precipitation.
Author Contributions
Conceptualisation, H.W., N.Q. and M.H.; methodology, H.W., N.Q. and M.H.; software, H.W.; validation, H.W., N.Q. and M.H.; formal analysis, H.W.; investigation, H.W.; resources, H.W.; data curation, H.W.; writing—original draft preparation, H.W.; writing—review and editing, H.W., N.Q. and M.H.; visualisation, H.W., N.Q. and M.H.; supervision, N.Q. and M.H.; project administration, H.W. and N.Q. All authors have read and agreed to the published version of the manuscript.
Funding
This research received no external funding and the Article Processing Charge was kindly waived by MDPI.
Institutional Review Board Statement
Not applicable.
Informed Consent Statement
Not applicable.
Data Availability Statement
Not applicable.
Conflicts of Interest
The authors Decemberlare no conflict of interest.
Appendix A
Figure A1.
Maps of average monthly rainfall (based on the CEH GEAR dataset) under different phase combinations of the NAO and EA.
Figure A1.
Maps of average monthly rainfall (based on the CEH GEAR dataset) under different phase combinations of the NAO and EA.

References
- Hurrell, J.W.; Van Loon, H. Decadal variations in climate associated with the North Atlantic Oscillation. Clim. Chang. 1997, 36, 301–326. [Google Scholar] [CrossRef]
- Rodwell, M.J.; Rowell, D.P.; Folland, C.K. Oceanic forcing of the wintertime North Atlantic Oscillation and European climate. Nature 1999, 398, 320–323. [Google Scholar] [CrossRef]
- Hurrell, J.W.; Kushnir, Y.; Ottersen, G.; Visbeck, M. An overview of the North Atlantic Oscillation. In The North Atlantic Oscillation: Climate Significance and Environmental Impact; American Geophysical Union: Washington, DC, USA, 2003; pp. 1–36. [Google Scholar]
- Wilby, R.L.; O’Hare, G.; Barnsley, N. The North Atlantic Oscillation and British Isles climate variability. Weather 1997, 52, 266–276. [Google Scholar] [CrossRef]
- Folwer, H.J.; Kilsby, C.G. Precipitation and the North Atlantic Oscillation: A study of climate variability in Northern England. Int. J. Climatol. 2002, 22, 843–866. [Google Scholar]
- Burt, T.; Howden, N. North Atlantic Oscillation amplifies orographic precipitation and river flow in upland Britain. Water Resour. Res. 2013, 49, 3504–3515. [Google Scholar] [CrossRef]
- Afzal, M.; Gagnon, A.S.; Mansell, M.G. Changes in the variability and periodicity of precipitation in Scotland. Theor. Appl. Climatol. 2015, 119, 135–159. [Google Scholar] [CrossRef]
- Rust, W.; Holman, I.; Corstanje, R.; Bloomfield, J.; Cuthbert, M. A conceptual model for climatic teleconnection signal control on groundwater variability in Europe. Earth-Sci. Rev. 2018, 177, 164–174. [Google Scholar] [CrossRef]
- West, H.; Quinn, N.; Horswell, M. Regional rainfall response to the North Atlantic Oscillation (NAO) across Great Britain. Hydrol. Res. 2019, 50, 1549–1563. [Google Scholar] [CrossRef] [Green Version]
- Kosanic, A.; Harrison, S.; Anderson, K.; Kavcic, I. Present and historical climate variability in South West England. Clim. Chang. 2014, 124, 221–237. [Google Scholar] [CrossRef]
- Folland, C.K.; Knight, J.; Linderholm, H.W.; Fereday, D.; Ineson, S.; Hurrell, J.W. The summer North Atlantic Oscillation: Past, present and future. J. Clim. 2009, 22, 1082–1103. [Google Scholar] [CrossRef]
- Simpson, I.R.; Jones, P.D. Analysis of UK precipitation extremes derived from Met Office Gridded Data. Int. J. Climatol. 2014, 34, 2438–2449. [Google Scholar] [CrossRef]
- Hall, R.J.; Hanna, E. North Atlantic circulation indices: Links with summer and winter temperature and precipitation and implications for seasonal forecasting. Int. J. Climatol. 2018, 38, 660–667. [Google Scholar] [CrossRef]
- Pokorná, L.; Huth, R. Climate impacts of the NAO are sensitive to how the NAO is defined. Theor. Appl. Climatol. 2015, 119, 639–652. [Google Scholar] [CrossRef]
- Lavers, D.; Prudhomme, C.; Hannahm, D.M. Large-scale climate, precipitation and British river flows: Identifying hydrological connections and dynamics. J. Hydrol. 2010, 395, 242–255. [Google Scholar] [CrossRef]
- Rust, W.; Cuthbert, M.; Bloomfield, J.; Corstanje, R.; Howden, N.; Holman, I. Exploring the role of hydrological pathways in modulating multi-annual climate teleconnection periodicities from UK rainfall to streamflow. Hydrol. Earth Syst. Sci. 2021, 25, 2233–2237. [Google Scholar] [CrossRef]
- Phillips, I.D.; McGregor, G.R.; Wilson, C.J.; Bower, D.; Hannah, D.M. Regional climate and atmospheric circulation controls on the discharge of two British rivers. Theor. Appl. Climatol. 2003, 76, 141–164. [Google Scholar] [CrossRef]
- Lavers, D.; Hannah, D.M.; Bradley, C. Connecting large-scale atmospheric circulation, river flow and groundwater levels in a chalk catchment in Southern England. J. Hydrol. 2015, 523, 179–189. [Google Scholar] [CrossRef]
- Rust, W.; Holman, I.; Bloomfield, J.; Cuthbert, M.; Corstanje, R. Understanding the potential of climate teleconnections to project future groundwater drought. Hydrol. Earth Syst. Sci. 2019, 23, 3233–3245. [Google Scholar] [CrossRef] [Green Version]
- Wilby, R.L.; Johnson, M.F. Climate Variability and Implications for Keeping Rivers Cool in England. Clim. Risk Manag. 2020, 30, 100259. [Google Scholar] [CrossRef]
- West, H.; Quinn, N.; Horswell, M. Spatio-Temporal Variability in North Atlantic Oscillation (NAO) Monthly Rainfall Signatures in Great Britain. Atmosphere 2021, 12, 763. [Google Scholar] [CrossRef]
- Rust, W.; Bloomfield, J.; Cuthbert, M.; Corstanje, R.; Holman, I. Non-stationary control of the NAO on European rainfall and its implications for water resource management. Hydrol. Process. 2021, 35, e14099. [Google Scholar] [CrossRef]
- Wallace, J.M.; Gutzler, D.S. Teleconnections in the geopotential height field during the Northern Hemisphere winter. Mon. Weather Rev. 1981, 109, 784–812. [Google Scholar] [CrossRef]
- Comas-Bru, L.; McDermott, F. Impacts of the EA and SCA patterns on the European twentieth century NAO–winter climate relationship. Q. J. R. Meteorol. Soc. 2014, 140, 354–363. [Google Scholar] [CrossRef]
- Mikhailova, N.V.; Yurovsky, A.V. The East Atlantic Oscillation: Mechanism and Impact on the European Climate in Winter. Phys. Oceanogr. 2016, 2016, 25–33. [Google Scholar] [CrossRef] [Green Version]
- Barnston, A.G.; Livezey, R.E. Classification, seasonality and persistence of low-frequency atmospheric circulation patterns. Mon. Weather Rev. 1987, 115, 1083–1126. [Google Scholar] [CrossRef]
- Moore, G.W.K.; Renfrew, I.A. Cold European winters: Interplay between the NAO and the East Atlantic mode. Atmos. Sci. Lett. 2012, 13, 1–8. [Google Scholar] [CrossRef]
- Mellado-Cano, J.; Barriopedro, D.; Garcia-Herrera, R.; Trigo, R.M.; Hernandez, A. Examining the North Atlantic Oscillation, East Atlantic Pattern jet variability since 1685. J. Clim. 2019, 32, 6285–6298. [Google Scholar] [CrossRef]
- NOAA Climate Prediction Centre—East Atlantic Pattern. Available online: https://www.cpc.ncep.noaa.gov/data/teledoc/ea.shtml (accessed on 17 March 2021).
- Casanueva, A.; Rodríguez-Puebla, C.; Frías, M.D.; González-Reviriego, N. Variability of extreme precipitation over Europe and its relationships with teleconnections patterns. Hydrol. Earth Syst. Sci. 2014, 18, 709–725. [Google Scholar] [CrossRef] [Green Version]
- Moore, G.W.K.; Pikart, R.S.; Renfrew, I.A. Complexities in the climate of the subpolar North Atlantic: A case study from the winter of 2007. Q. J. R. Meteorol. Soc. 2011, 137, 757–767. [Google Scholar] [CrossRef]
- Moore, G.W.K.; Renfrew, I.A.; Pickart, R.S. Multidecadal mobility of the North Atlantic Oscillation. J. Clim. 2013, 26, 2453–2466. [Google Scholar] [CrossRef] [Green Version]
- Mellado-Cano, J.; Barriopedro, D.; Garcia-Herrera, R.; Trigo, R.M. New observation insights into the atmospheric circulation over the Euro-Atlantic sector since 1685. Clim. Dyn. 2020, 54, 823–841. [Google Scholar] [CrossRef] [Green Version]
- Irannezhad, M.; Haghihgi, A.T.; Chen, D.; Kløve, B. Variability in dryness and wetness in central Finland and the role of teleconnection patterns. Theor. Appl. Climatol. 2015, 122, 471–486. [Google Scholar] [CrossRef]
- Bednorz, E.; Czernecki, B.; Tomczyk, A.M.; Półrolniczak, M. If not NAO then what? Regional circulation patterns governing summer air temperatures in Poland. Theor. Appl. Climatol. 2018, 136, 1325–1337. [Google Scholar] [CrossRef] [Green Version]
- Amini, M.; Ghadami, M.; Fathian, F.; Modarres, R. Teleconnections between oceanic-atmospheric indices over Iran using quantile regressions. Hydrol. Sci. J. 2020, 65, 2286–2295. [Google Scholar] [CrossRef]
- Bednorz, E.; Tomczyk, A.M. Influence of macroscale and regional circulation patterns on low- and high-frequency sea level variability in the Baltic Sea. Theor. Appl. Climatol. 2021, 144, 115–125. [Google Scholar] [CrossRef]
- Tanguy, M.; Dixon, H.; Prosdocimi, I.; Morris, D.G.; Keller, V.D.J. Gridded Estimates of Daily and Monthly Areal Rainfall for the United Kingdom (1890–2015) [CEH GEAR]; NERC Environmental Information Centre: Lancaster, UK, 2016. [Google Scholar] [CrossRef]
- Tanguy, M.; Fry, M.; Svensson, C.; Hannaford, J. Historic Gridded Standarised Precipitation Index for the United Kingdom 1862–2015 (Generated Using Gamma Distribution with a Standard Period 1961–2010); NERC Environmental Information Centre: Lancaster, UK, 2017. [Google Scholar] [CrossRef]
- Tanguy, M.; Fry, M.; Svensson, C.; Hannaford, J. Historic Standardised Precipitation Index Time Series for IHU Groups (1862–2015); NERC Environmental Information Centre: Lancaster, UK, 2017. [Google Scholar] [CrossRef]
- Berton, R.; Driscoll, C.T.; Adamowski, J.F. The near-term prediction of drought and flooding conditions in the northeastern United States based on extreme phases of AMO and NAO. J. Hydrol. 2017, 552, 130–141. [Google Scholar] [CrossRef]
- McKee, T.B.; Doesken, N.J.; Kleist, J. The relationship of drought frequency and duration to time scales. In Proceedings of the 8th Conference on Applied Climatology, Anaheim, CA, USA, 17–22 January 1993; Volume 17, pp. 179–183. [Google Scholar]
- Smith, D.M.; Scaife, A.A.; Eade, R.; Athanasiadis, P.; Bellucci, A.; Bethke, I.; Bilbao, R.; Borchert, L.F.; Caron, L.-P.; Counillon, F.; et al. North Atlantic climate far more predictable than models imply. Nature 2020, 583, 796–800. [Google Scholar] [CrossRef] [PubMed]
- Athanasiadis, P.J.; Yeager, S.; Kwon, Y.-O.; Bellucci, A.; Smith, D.W.; Tibaldi, S. Decadal predictability of North Atlantic blocking and the NAO. NPJ Clim. Atmos. Sci. 2020, 3, 1–10. [Google Scholar] [CrossRef]
- Hurrell, J.W.; Deser, C. North Atlantic climate variability: The role of the North Atlantic Oscillation. J. Mar. Syst. 2009, 78, 28–41. [Google Scholar] [CrossRef]
- Bueh, C.; Nakamura, H. Scandinavian pattern and its climatic impact. Q. J. R. Meteorol. Soc. 2007, 133, 2117–2131. [Google Scholar] [CrossRef]
- Zubiate, L.; McDermott, F.; Sweenet, C.; O’Malley, M. Spatial variability in winter NAO-wind speed relationships in western Europe linked to concomitant states of the East Atlantic and Scandinavian patterns. Q. J. R. Meteorol. Soc. 2017, 143, 552–562. [Google Scholar] [CrossRef] [Green Version]
- Krichak, S.O.; Alpert, P. Decadal trends in the East Atlantic-West Russia Pattern and Mediterranean precipitation. Int. J. Climatol. 2005, 25, 183–192. [Google Scholar] [CrossRef]
- Ionita, M. The impact of the East Atlantic/Western Russia Pattern on the Hydroclimatology of Europe from Mid-Winter to Late Spring. Climate 2014, 2, 296–309. [Google Scholar] [CrossRef] [Green Version]
- Lim, Y.-K. The East Atlantic/West Russia (EA/WR) teleconnection in the North Atlantic: Climate impact and relation to Rossby wave propagation. Clim. Dyn. 2015, 44, 3211–3222. [Google Scholar] [CrossRef]
Figure 1.
Frequency Analysis of NAO/EA Positive and Negative Phases.

Figure 2.
Monthly correlation coefficients for the period January 1950–December 2015 between the NAO and EA teleconnection indices and the SPI-1 values at the IHU Group level. IHUs with a darker outline indicate 95% significance (p value ≤ 0.05).
Figure 2.
Monthly correlation coefficients for the period January 1950–December 2015 between the NAO and EA teleconnection indices and the SPI-1 values at the IHU Group level. IHUs with a darker outline indicate 95% significance (p value ≤ 0.05).

Figure 3.
Monthly average rainfall (based on the CEH GEAR dataset) for each NAO/EA phase combination for the nine Met Office Climate Districts.
Figure 3.
Monthly average rainfall (based on the CEH GEAR dataset) for each NAO/EA phase combination for the nine Met Office Climate Districts.

Figure 4.
As per Figure 3, however, with the monthly NAO/EA phase combinations ranked in descending order based on the spatially averaged rainfall value. The average line on the individual graphs represents the annual (12-month) average rainfall for the Climate District.
Figure 4.
As per Figure 3, however, with the monthly NAO/EA phase combinations ranked in descending order based on the spatially averaged rainfall value. The average line on the individual graphs represents the annual (12-month) average rainfall for the Climate District.

Figure 5.
Average monthly SPI-1 values under different phase combinations of the NAO and EA.

Figure 6.
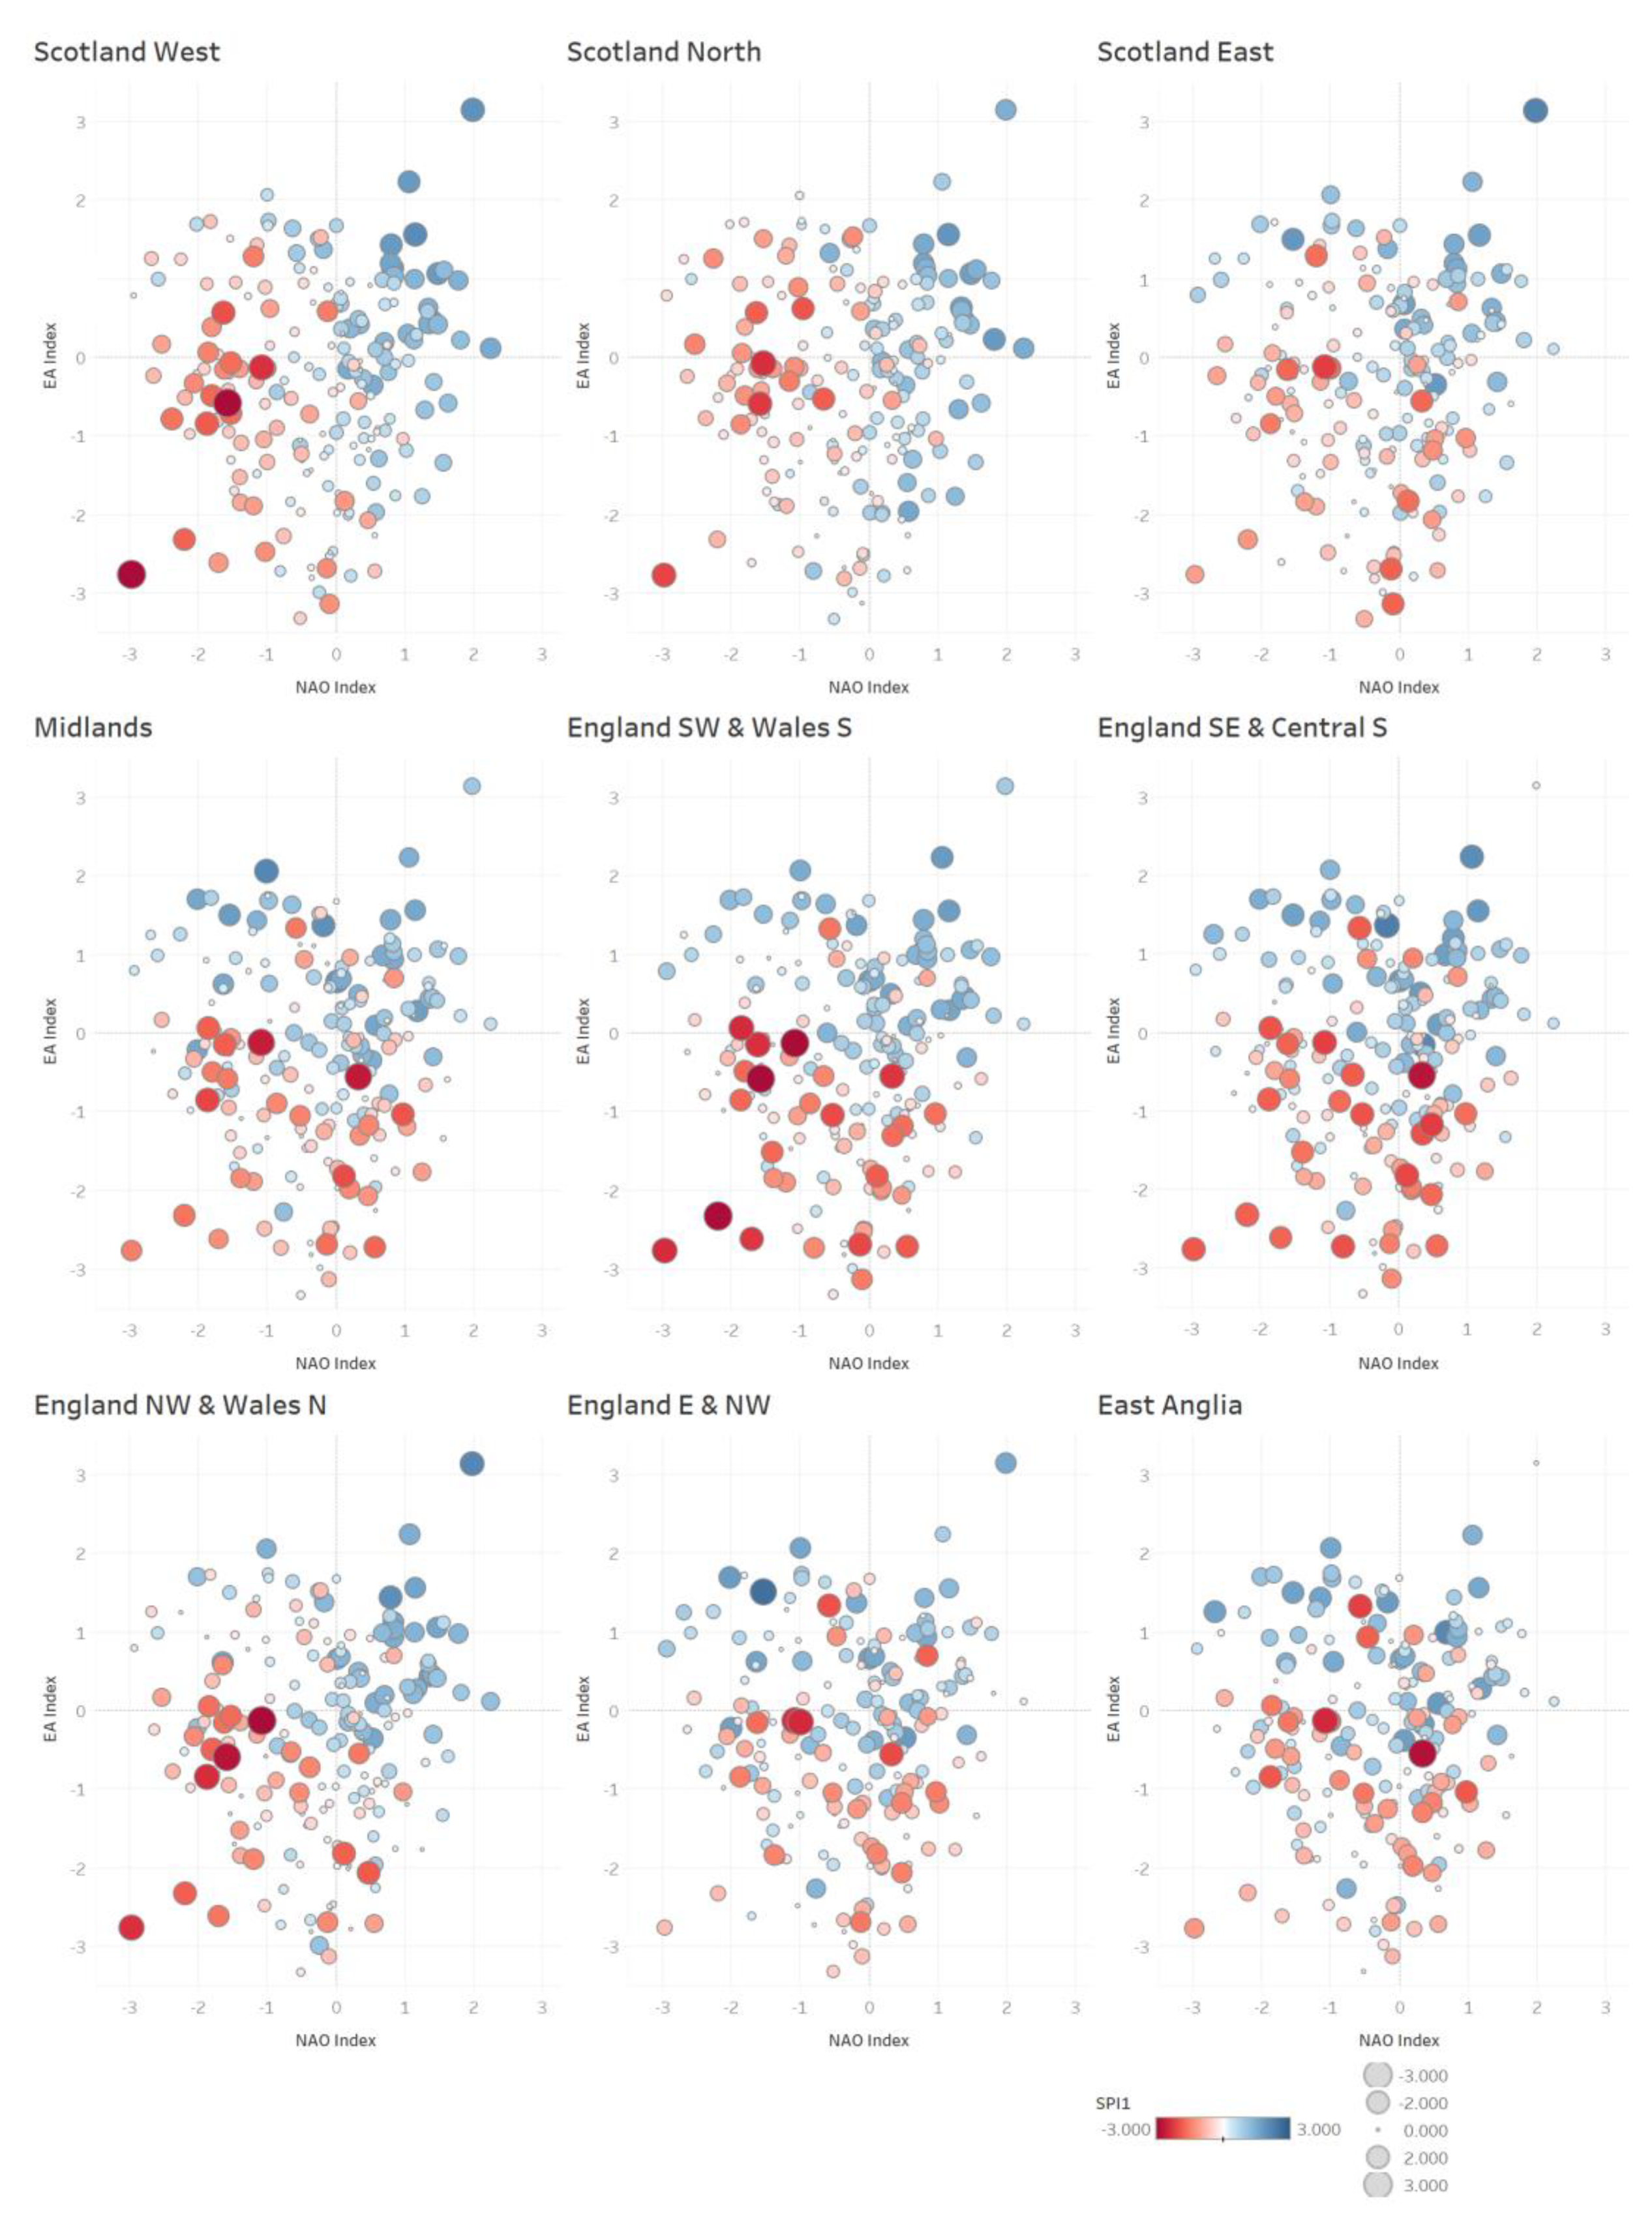
Scatter plots of the NAO and EA indices for the winter (DJF) months with points symbolised based on the Climate District average SPI-1 value. Quadrants with majority red/blue points indicate a drying/wetting tendency associated with that NAO/EA phase combination.
Figure 6.
Scatter plots of the NAO and EA indices for the winter (DJF) months with points symbolised based on the Climate District average SPI-1 value. Quadrants with majority red/blue points indicate a drying/wetting tendency associated with that NAO/EA phase combination.

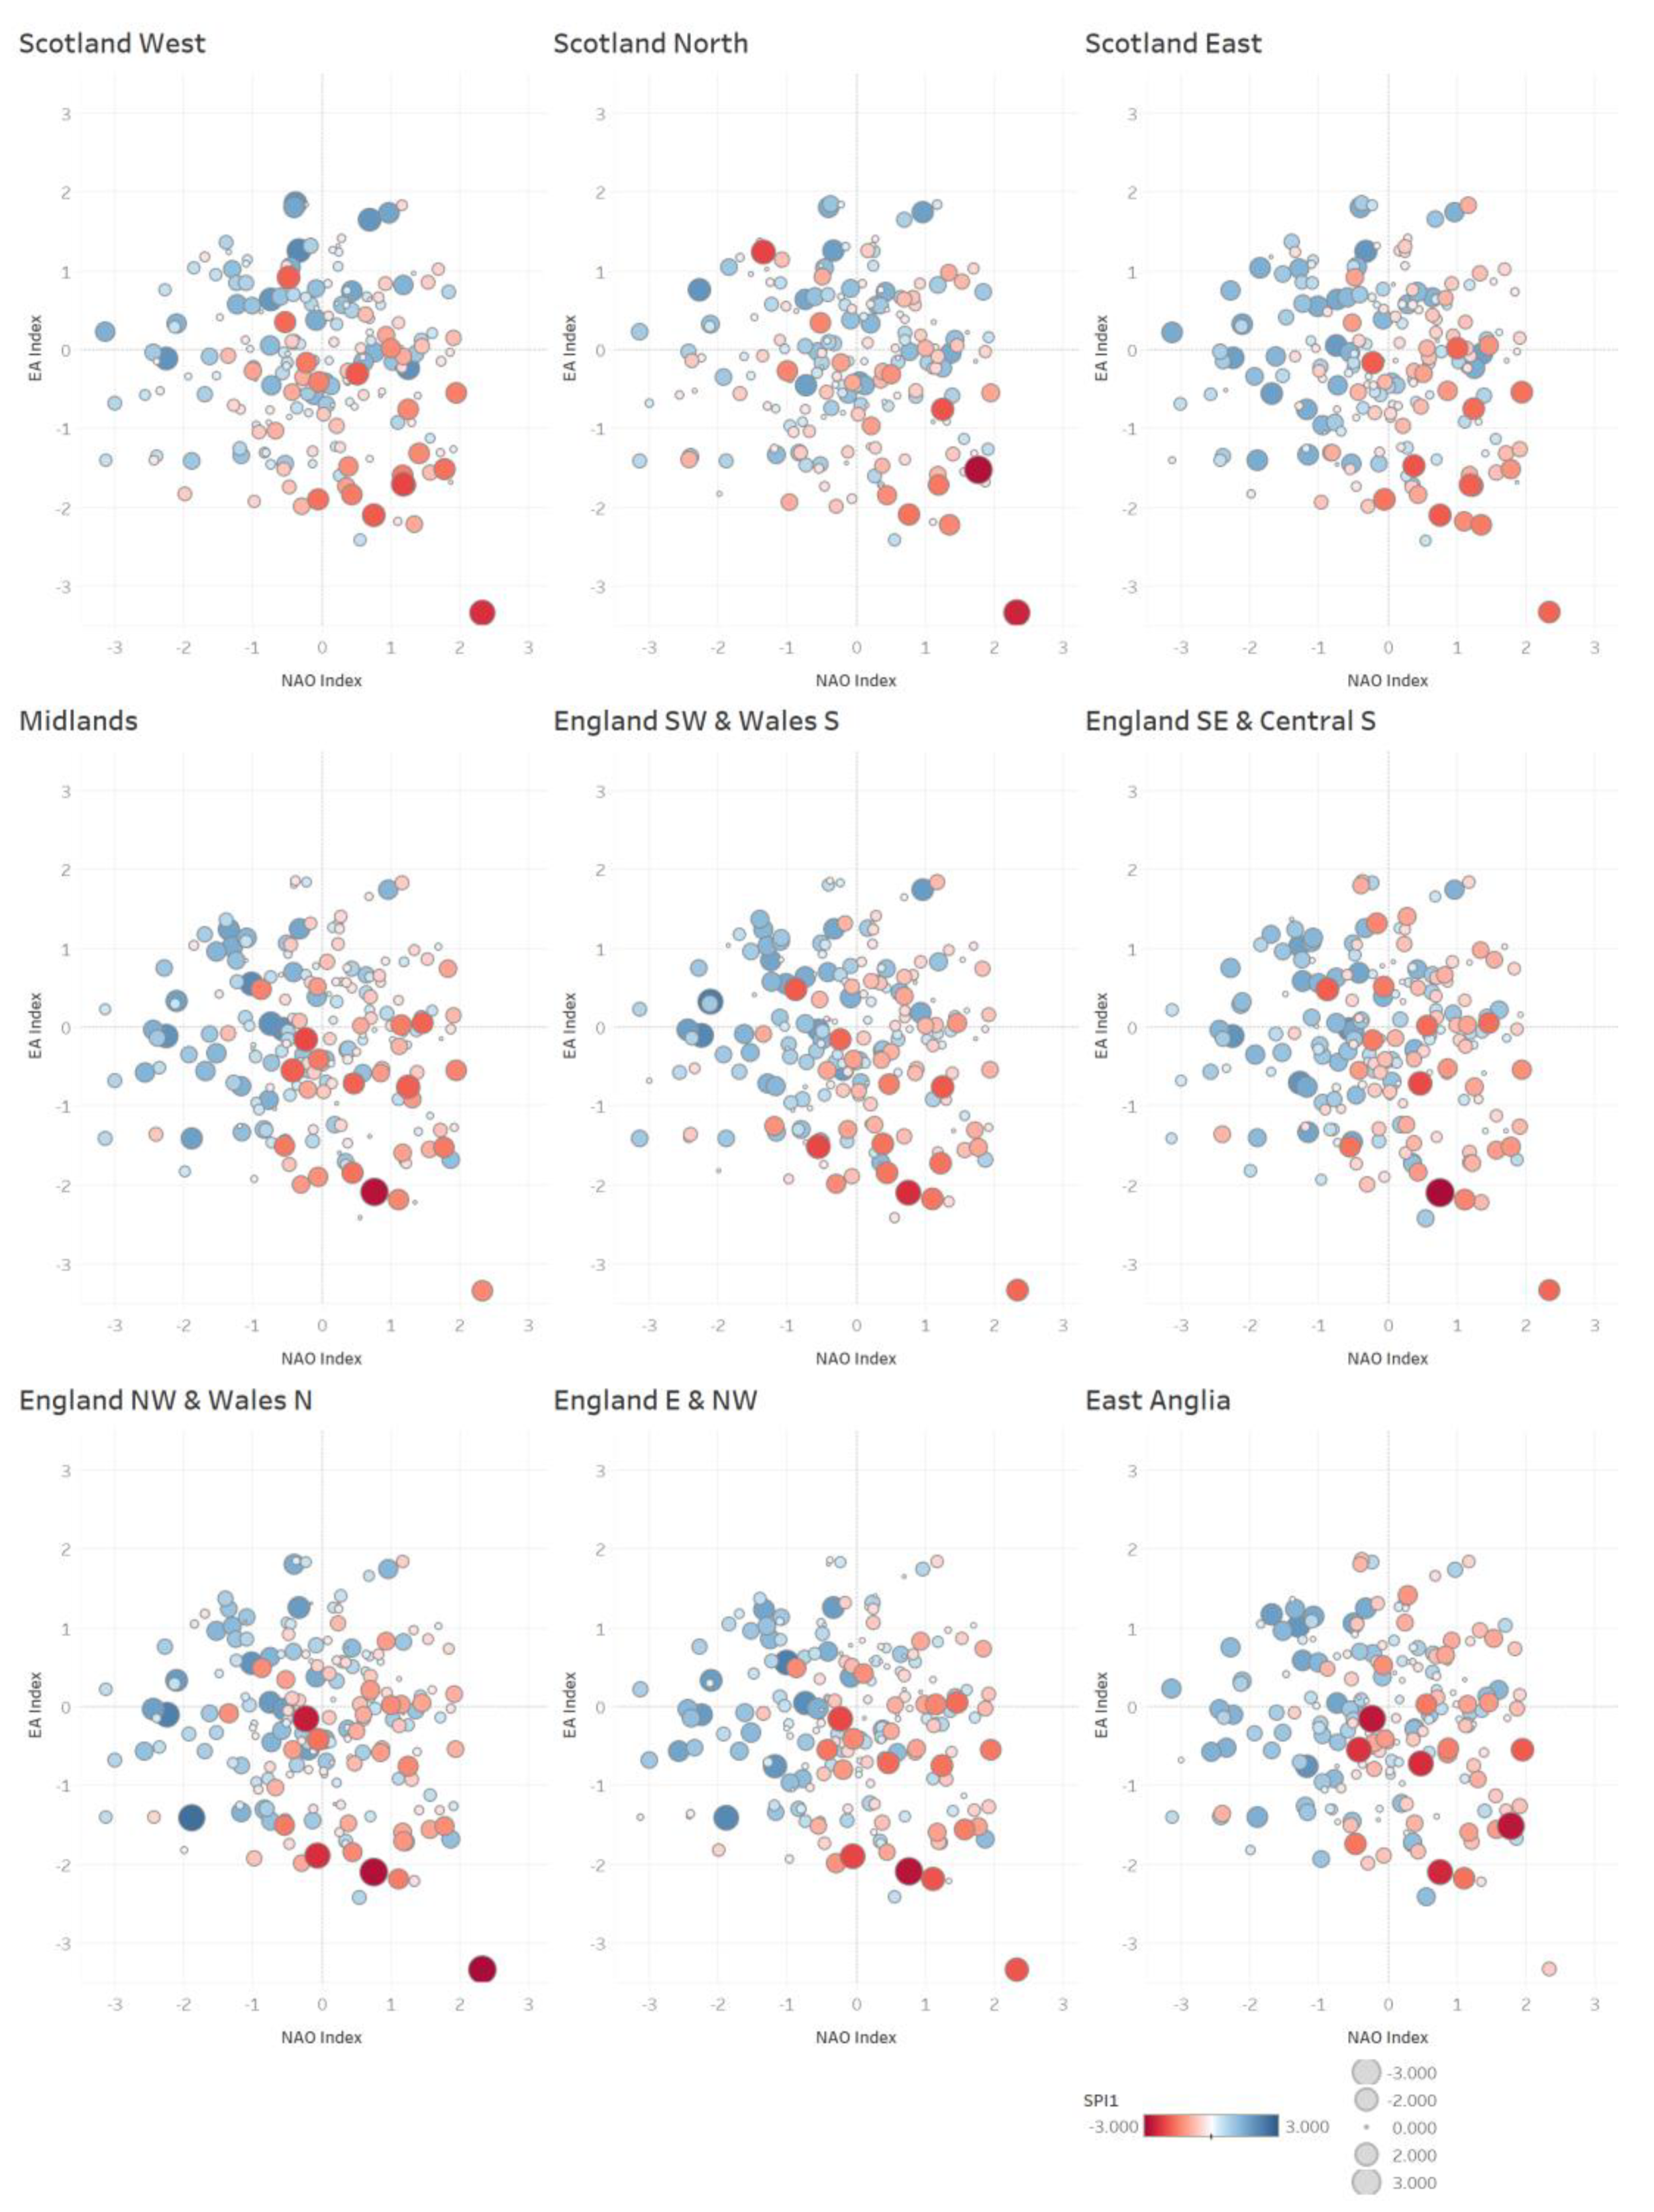
Figure 7.
As per Figure 6; however showing the NAO and EA indices for the summer (JJA) months.
Figure 7.
As per Figure 6; however showing the NAO and EA indices for the summer (JJA) months.

Figure 8.
Percentage of time the very wet (SPI-1 > 1.5) SPI-1 class threshold is exceeded under different phase combinations of the NAO and EA.
Figure 8.
Percentage of time the very wet (SPI-1 > 1.5) SPI-1 class threshold is exceeded under different phase combinations of the NAO and EA.

Figure 9.
As per Figure 7 but for the extremely wet (SPI-1 > 2.0) SPI-1 class.
Figure 9.
As per Figure 7 but for the extremely wet (SPI-1 > 2.0) SPI-1 class.

Figure 10.
As per Figure 7 but for the severely dry (SPI-1 < −1.5) SPI-1 class.
Figure 10.
As per Figure 7 but for the severely dry (SPI-1 < −1.5) SPI-1 class.

Figure 11.
As per Figure 7 but for the extremely dry (SPI-1 < −2.0) SPI-1 class.
Figure 11.
As per Figure 7 but for the extremely dry (SPI-1 < −2.0) SPI-1 class.


Table 1.
Qualitative Descriptors and Associated SPI-1 Value Classification [42].
Table 1.
Qualitative Descriptors and Associated SPI-1 Value Classification [42].
| Qualitative Descriptor | SPI-1 Value Range |
|---|---|
| Extremely Wet | ≥2.0 |
| Very Wet | 1.5–1.99 |
| Moderately Wet | 1.0–1.49 |
| Near Normal | −0.99–0.99 |
| Moderately Dry | −1.49–−0.99 |
| Severely Dry | −1.99–−1.5 |
| Extremely Dry | ≤−2.0 |
Publisher’s Note: MDPI stays neutral with regard to jurisdictional claims in published maps and institutional affiliations. |
© 2021 by the authors. Licensee MDPI, Basel, Switzerland. This article is an open access article distributed under the terms and conditions of the Creative Commons Attribution (CC BY) license (https://creativecommons.org/licenses/by/4.0/).
Share and Cite
MDPI and ACS Style
West, H.; Quinn, N.; Horswell, M. Monthly Rainfall Signatures of the North Atlantic Oscillation and East Atlantic Pattern in Great Britain. Atmosphere 2021, 12, 1533. https://0-doi-org.brum.beds.ac.uk/10.3390/atmos12111533
AMA Style
West H, Quinn N, Horswell M. Monthly Rainfall Signatures of the North Atlantic Oscillation and East Atlantic Pattern in Great Britain. Atmosphere. 2021; 12(11):1533. https://0-doi-org.brum.beds.ac.uk/10.3390/atmos12111533
Chicago/Turabian StyleWest, Harry, Nevil Quinn, and Michael Horswell. 2021. "Monthly Rainfall Signatures of the North Atlantic Oscillation and East Atlantic Pattern in Great Britain" Atmosphere 12, no. 11: 1533. https://0-doi-org.brum.beds.ac.uk/10.3390/atmos12111533
Note that from the first issue of 2016, this journal uses article numbers instead of page numbers. See further details here.