Article

Precipitation in the Czech Republic in Light of Subjective and Objective Classifications of Circulation Types

1
Institute of Geography, Masaryk University, 611 37 Brno, Czech Republic
2
Global Change Research Institute of the Czech Academy of Sciences, 603 00 Brno, Czech Republic
3
Czech Academy of Sciences, Institute of Atmospheric Physics, 141 00 Praha, Czech Republic
4
Department of Agrosystems and Bioclimatology, Mendel University in Brno, 613 00 Brno, Czech Republic
5
Czech Hydrometeorological Institute, 616 67 Brno, Czech Republic
*
Author to whom correspondence should be addressed.
Submission received: 14 October 2021 / Revised: 12 November 2021 / Accepted: 19 November 2021 / Published: 21 November 2021

Abstract

:
Many studies in Europe have investigated the relationship between climatological variables and circulation patterns expressed by various classifications of circulation types. This study provides new insights based on an analysis of precipitation in the western (Bohemia—BOH) and eastern (Moravia and Silesia—M&S) parts of the Czech Republic with respect to the subjective classification of the Czech Hydrometeorological Institute and objective classification based on the flow strength, flow direction, and vorticity during the 1961–2020 period. Circulation types are investigated in regard to their contributions to the total precipitation, mean daily precipitation totals, and precipitation probability (daily totals ≥ 1.0 mm). Types with a westerly airflow and a trough over Central Europe exhibit the highest proportions in precipitation totals. Types with a cyclone over Central Europe, especially combined with a northwestern (BOH) or northeastern (M&S) airflow, result in the highest daily mean totals and precipitation probability. Types with a southwestern airflow transport more precipitation to BOH, while those with a northeastern airflow transport more precipitation to M&S, with a slight seasonal shift in the gradient axis between winter and summer. Circulation types under both classifications are examined from the perspective of their precipitation representation in BOH and M&S and the differences between these two regions. In addition, the suitability of both classifications for precipitation analysis is investigated.

1. Introduction

The use of different classifications of circulation (synoptic) types has become a basis of analysis in synoptic climatology [1]. At the earliest stage, these classifications were based on the application of weather maps with subjectively evaluated pressure fields regarding the positions of pressure systems, airflow characteristics, and weather types in the area of interest. In Europe, the classification of Grosswetterlagen (GWL), developed by P. Hess and H. Brezowsky for Central Europe [2,3,4], has been the most widely adopted classification. This classification has been applied in many climatological studies (e.g., Refs. [5,6,7,8]). In a number of other countries, similar classifications, better fitted to a given territory, have been developed and employed in climatological studies, for example, in Poland (e.g., Refs. [9,10,11,12,13,14]) or Hungary (e.g., Refs. [15,16,17,18,19]).
Objective classifications involve the application of automated systems to distinguish atmospheric processes by type. These classifications are based on the use of several methods, such as correlation methods, cluster analysis methods, nonlinear methods, neural network methods, and other methods (e.g., Refs. [7,20]). For example, Bissolli and Dittmann [21] based their objective classification for Germany on numerical indices derived from the advection of air masses, cyclonality, and humidity of the troposphere. James [22], considering ERA40 and NCEP reanalysis data originating from 1948, applied pattern correlation analysis to create an objective GWL catalogue based on the original Hess–Brezowsky classification. Piotrowski [23] developed an objective classification for Poland based on data at the 925 hPa level according to NCEP/NCAR reanalysis with the method proposed by Jenkinson and Collison [24]. Belušić Vozila et al. [25] created an objective classification to study near-surface winds in the Adriatic region. Certain papers have compared subjective and objective classifications, for example, Piotrowski [26] in Poland. Broderick and Fealy [27] employed 16 classification schemes and studied the synoptic and climatological applicability of these schemes in Ireland.
The GWL classification of Hess and Brezowsky has also been broadly adopted in studies in former Czechoslovakia (e.g., Refs. [28,29]) or more recently [30]. However, because this classification is valid for the western part (in addition to Germany), a new classification was developed by a team of authors associated with the Hydrometeorological Institute [31]. This classification has been employed in many studies on different climatological elements and characteristics (e.g., Refs. [32,33,34,35,36,37,38,39]). The other classification applicable to former Czechoslovakia established by Konček and Rein [40], supposedly for implementation in dynamic climatology, has not achieved broader applications in publications (e.g., Refs. [41,42]). Similarly, this has also been observed for the classification proposed by J. Štekl, which has been applied, for example, in precipitation analysis (e.g., Refs. [43,44]). In recent years, new objective classification of circulation types has been reported in several papers on different climatological characteristics (e.g., Refs. [45,46,47]).
This study aims to analyze the relationships between precipitation in the western and eastern parts of the Czech Republic and circulation types based on two classifications created via subjective and objective approaches over the 1961–2020 period. Section 2 describes the area analyzed, precipitation data, principles of both classifications of circulation types, and methods of analysis. Section 3 addresses the frequency of individual circulation types, their proportions in precipitation totals, mean daily totals and precipitation probability, and the spatial distribution of precipitation under the selected circulation types. Section 4 examines different aspects of the results, particularly in regard to differences between the western and eastern parts of the Czech Republic and between the two classifications adopted. The last section gives a short summary of the main results.

2. Materials and Methods
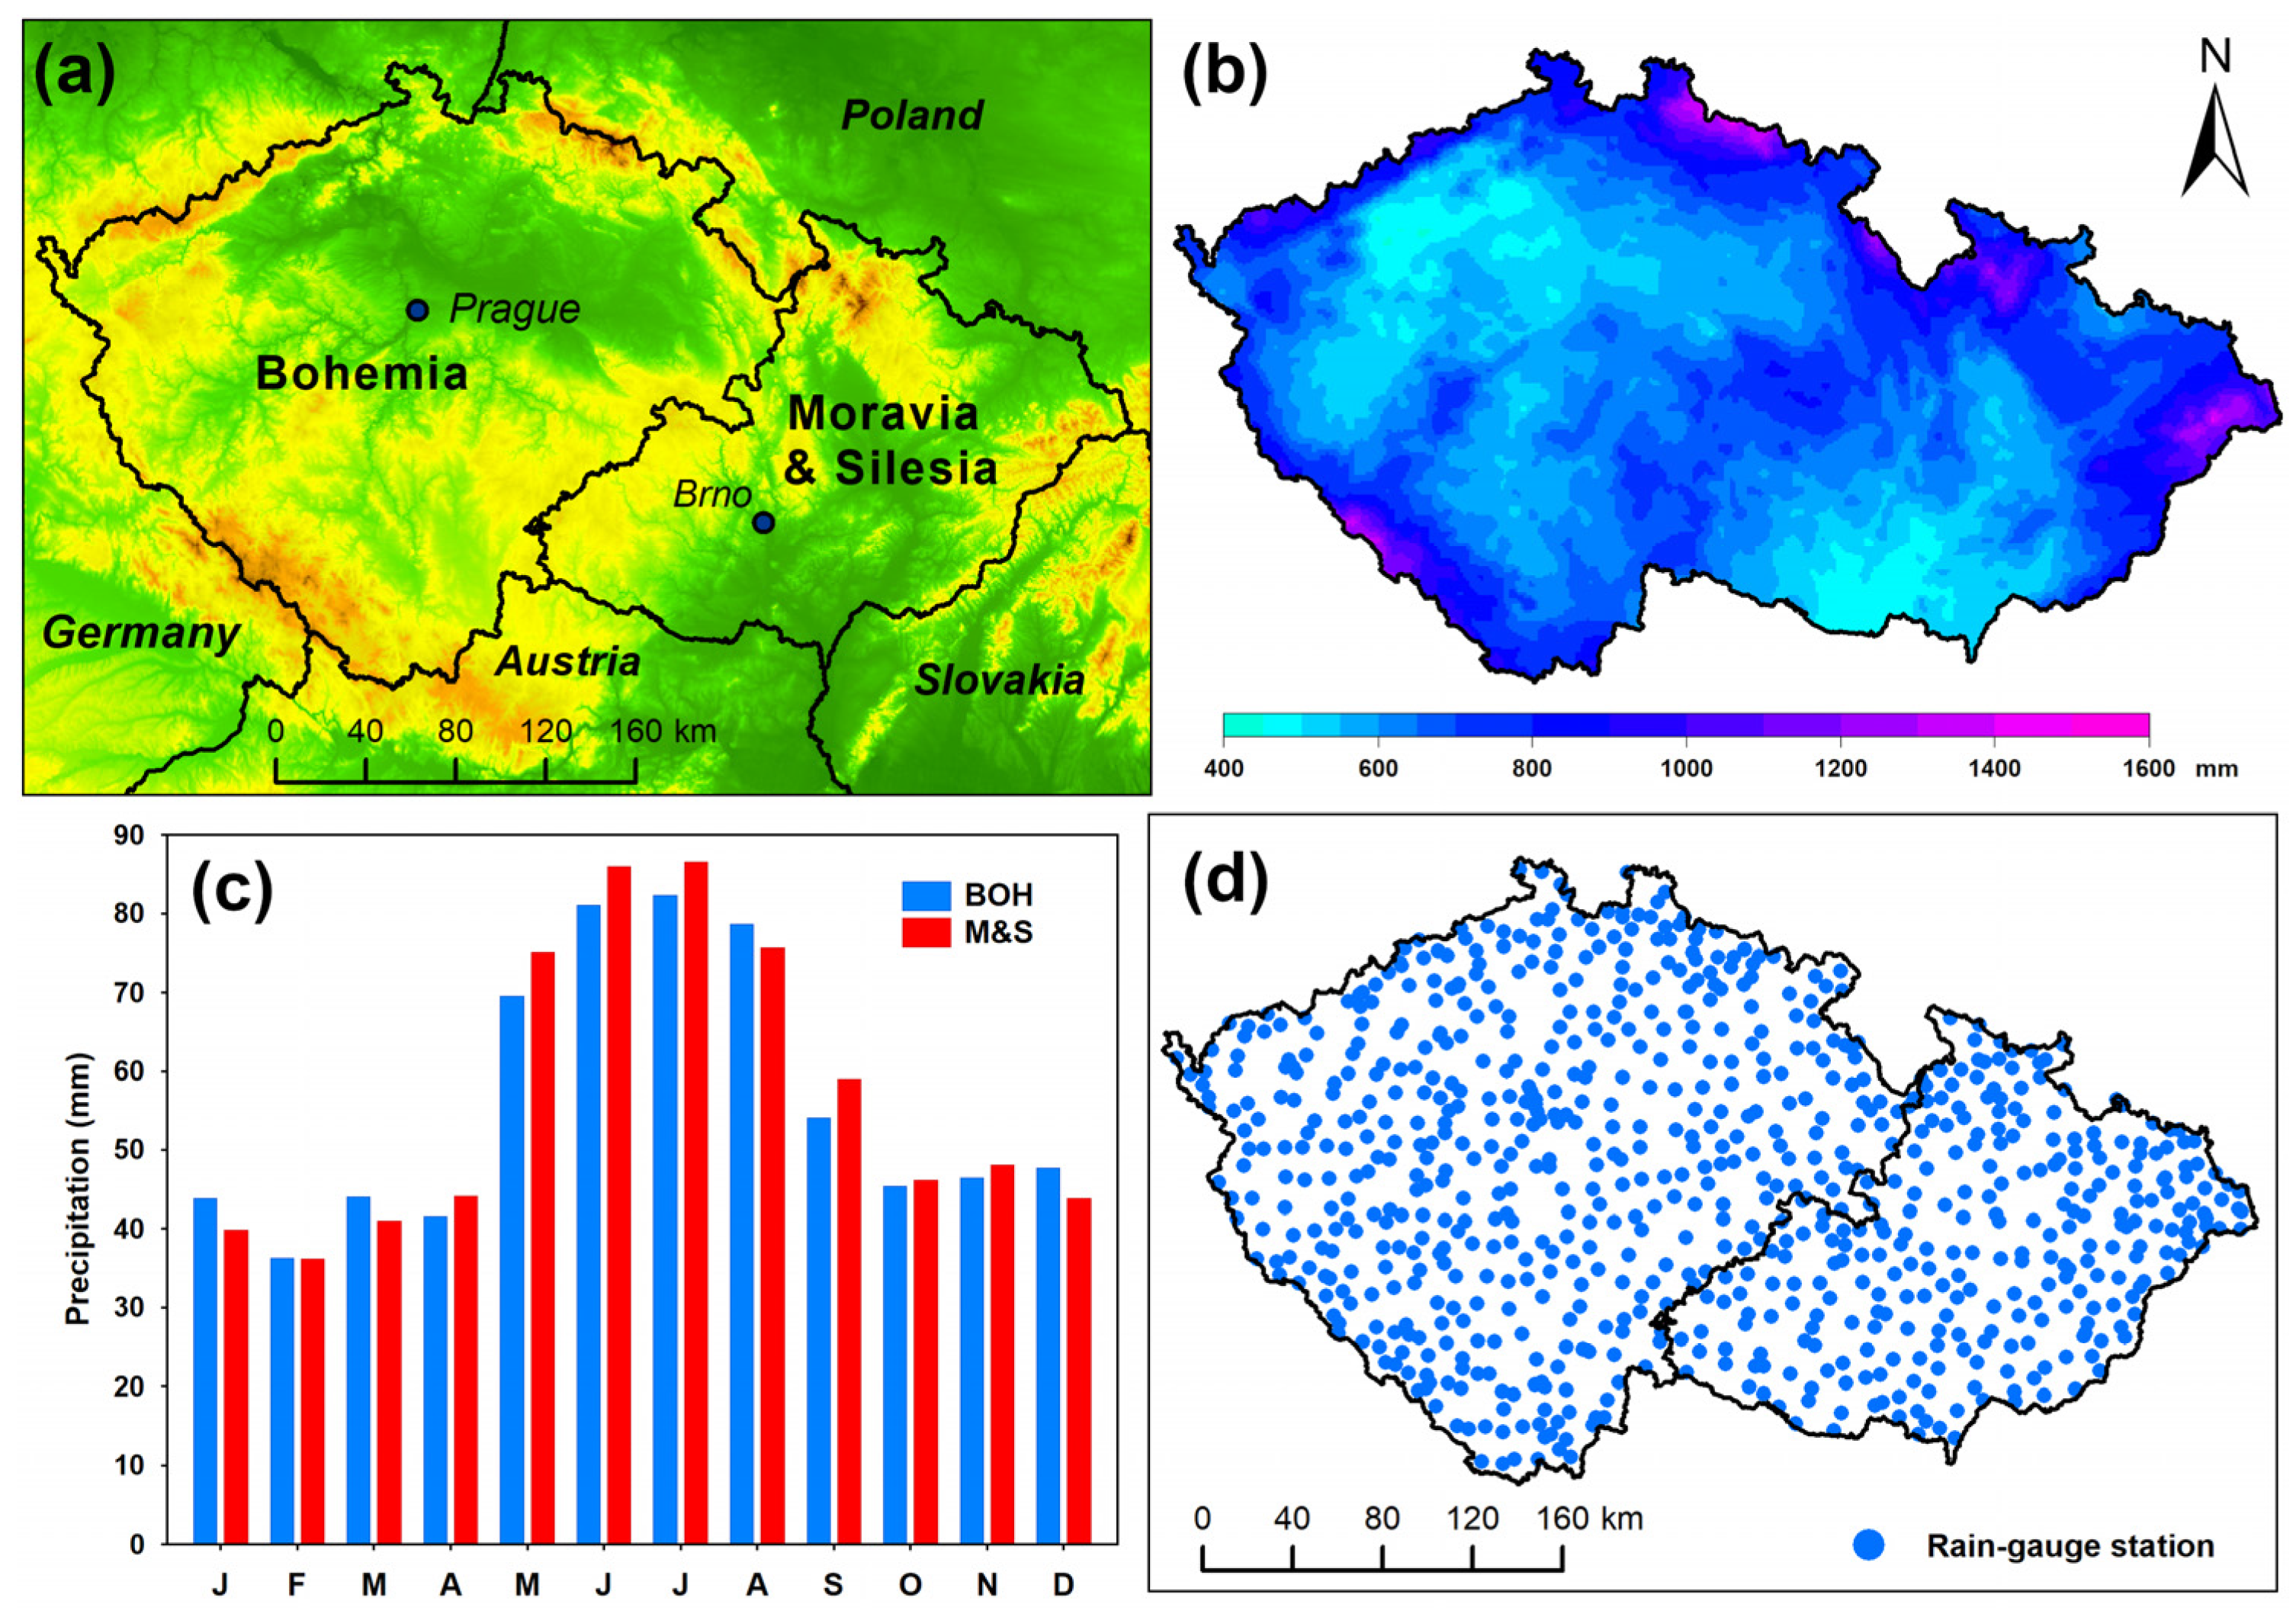
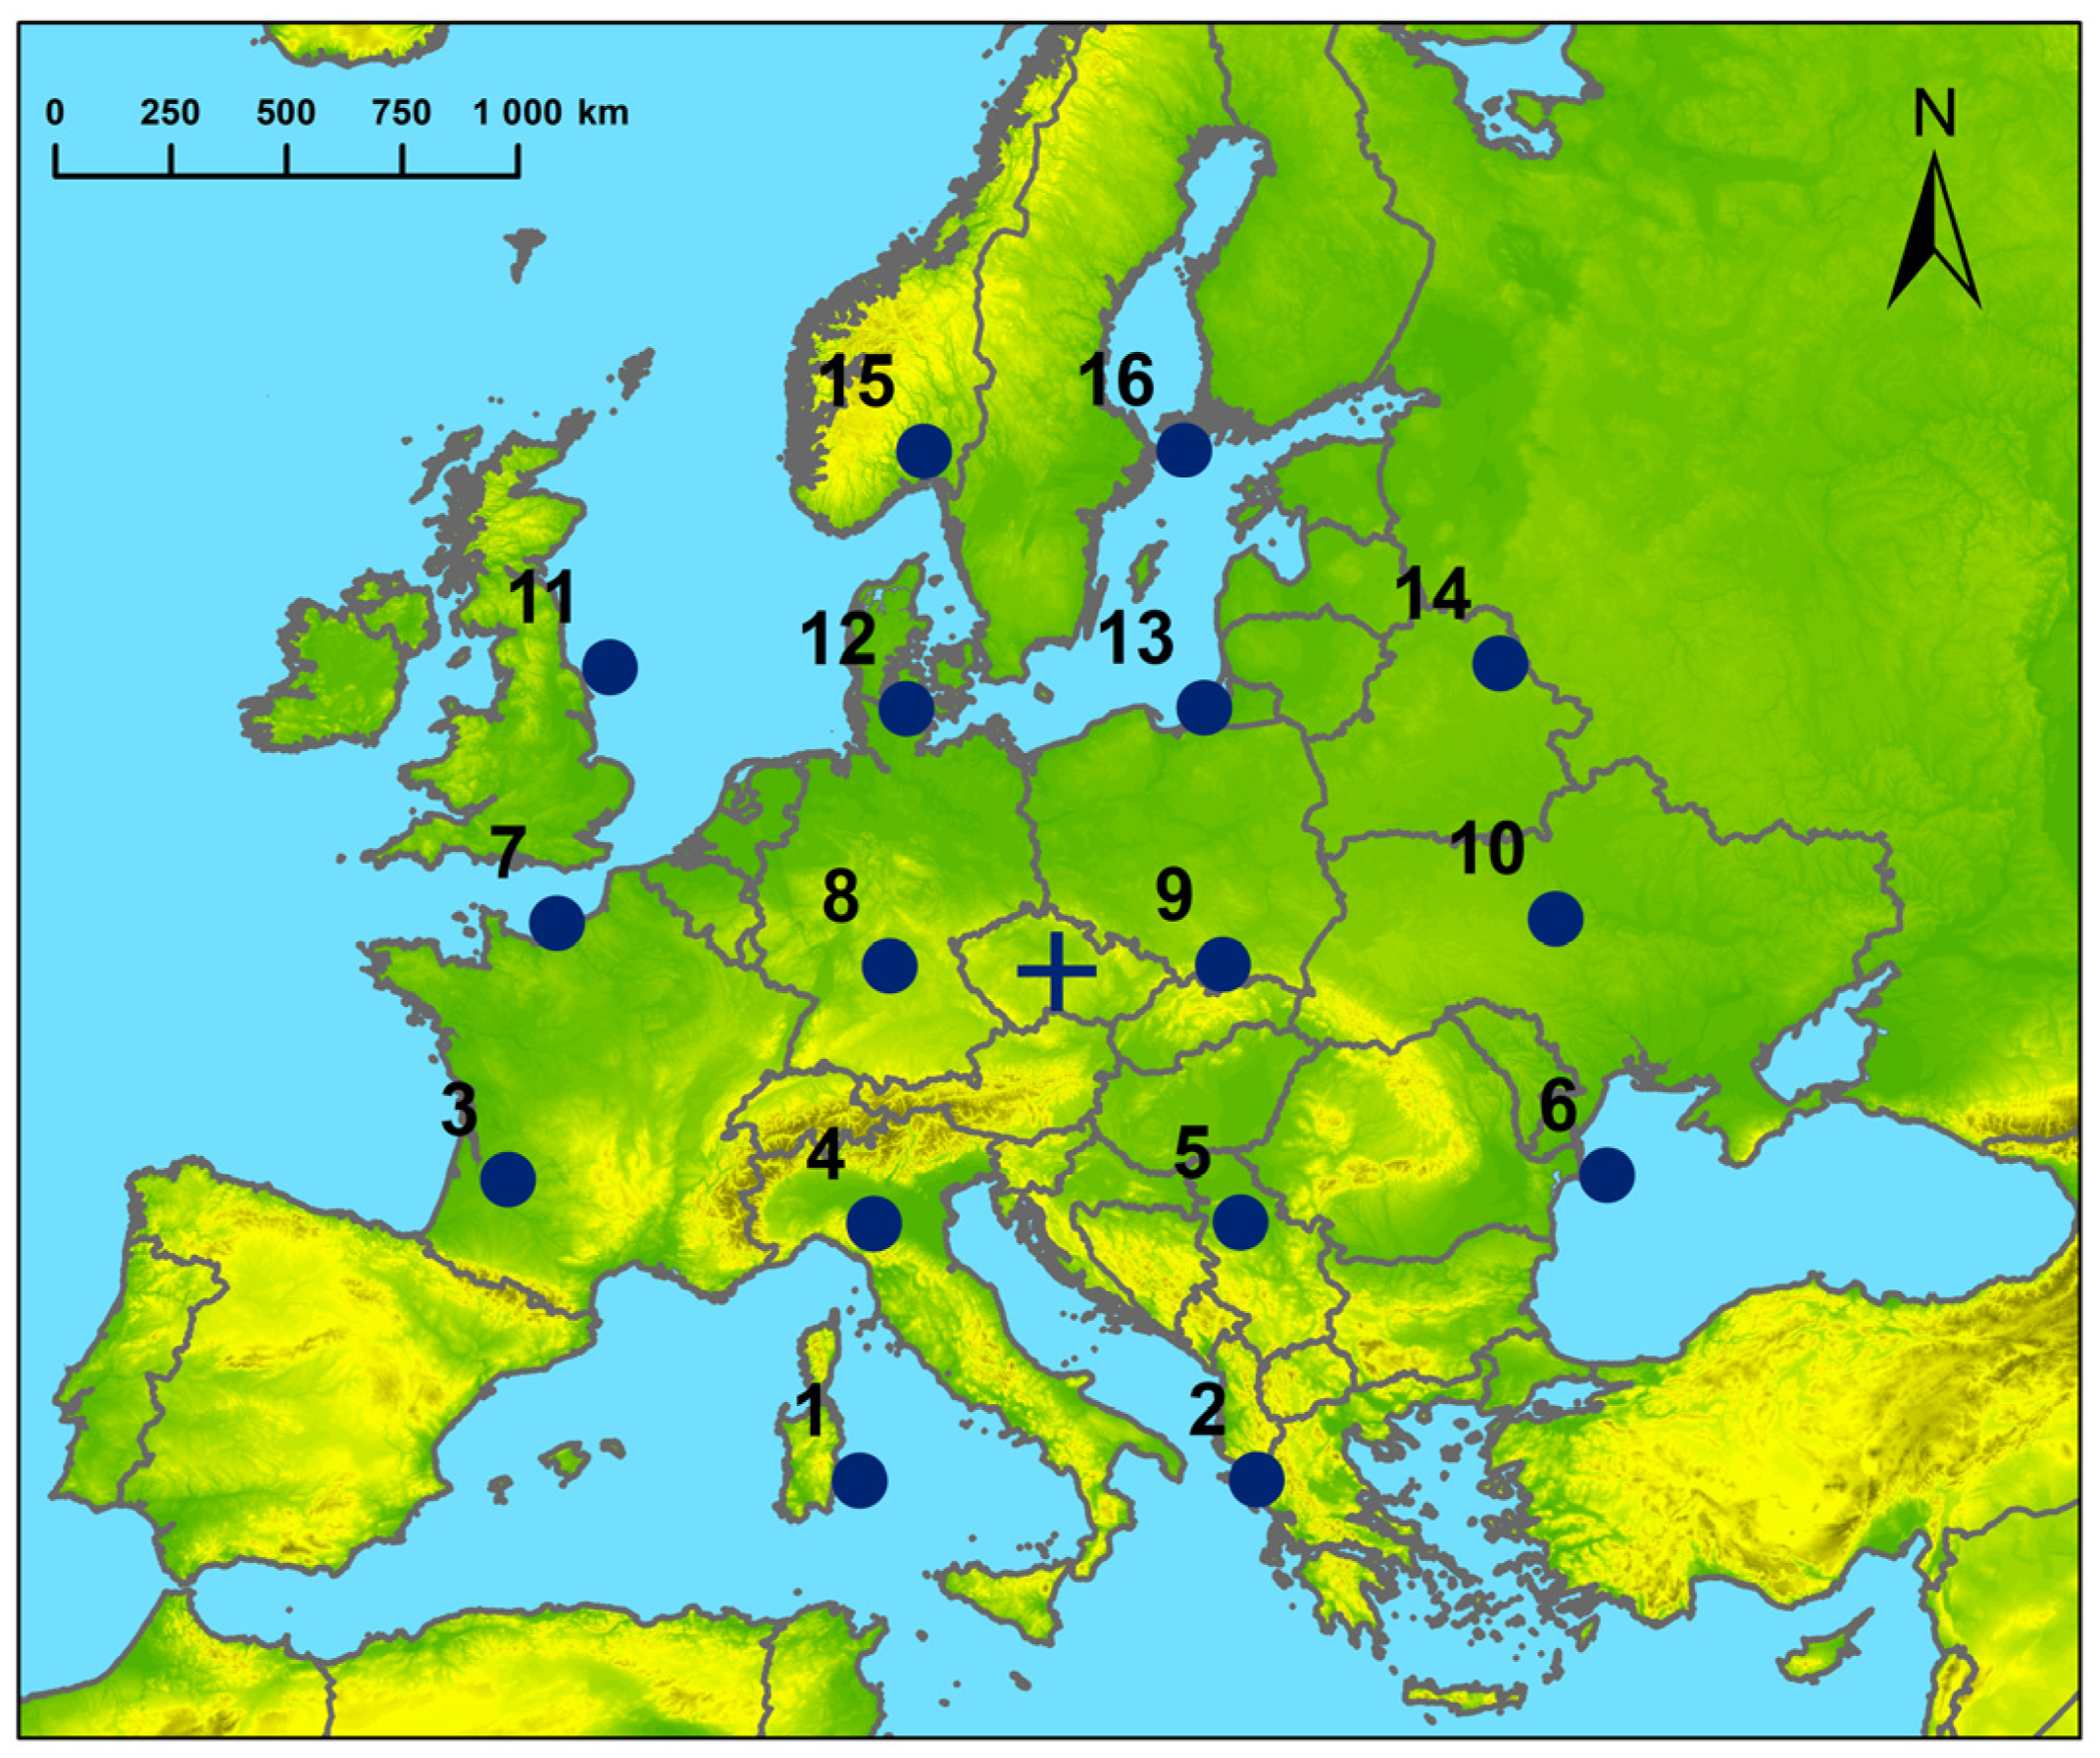
2.1. Study Area

The Czech Republic is located in Central Europe and covers a total area of 78,866 km2 (Figure 1a). This territory is divided into a western part, Bohemia (BOH), covering 66% of the entire area, and an eastern part, Moravia and Silesia (M&S), covering 34% of the entire area. This division approximately follows attribution of the territory to the watershed of Labe River (BOH) and the Danube and Odra Rivers (M&S). Because of the influence of orography on the spatial distribution of precipitation (altitude and leeward and windward effects), Figure 1a further shows altitudinal patterns, ranging from 115 to 1603 m across the Czech territory (mean altitude: 390 m a.s.l.). While lower precipitation totals occur at lowland locations, the mountains surrounding particular border areas of BOH and north and northeast of M&S are characterized by higher totals (Figure 1b). In the annual distribution, the highest totals occur in July (closely followed by June) and the lowest in February. Mean monthly totals of December, January, March, and August are higher in BOH than in M&S, while in May–July and in September–November, the situation is opposite (Figure 1c; for more details, please refer to [34]).

2.2. Precipitation Data

Daily precipitation totals originating from almost 800 rain-gauge stations (Figure 1d) of the Czech Hydrometeorological Institute (CHMI), which underwent thorough quality control and homogenization, were interpolated by means of regression kriging (considering latitude, longitude, elevation, and other terrain characteristics, such as slope and exposition, as predictors) into 500 m × 500 m grids across the territory of the Czech Republic during the entire 1961–2020 period. These data were again aggregated in both considered parts of the Czech Republic (BOH and M&S), based on the arithmetical mean of the grid points included.

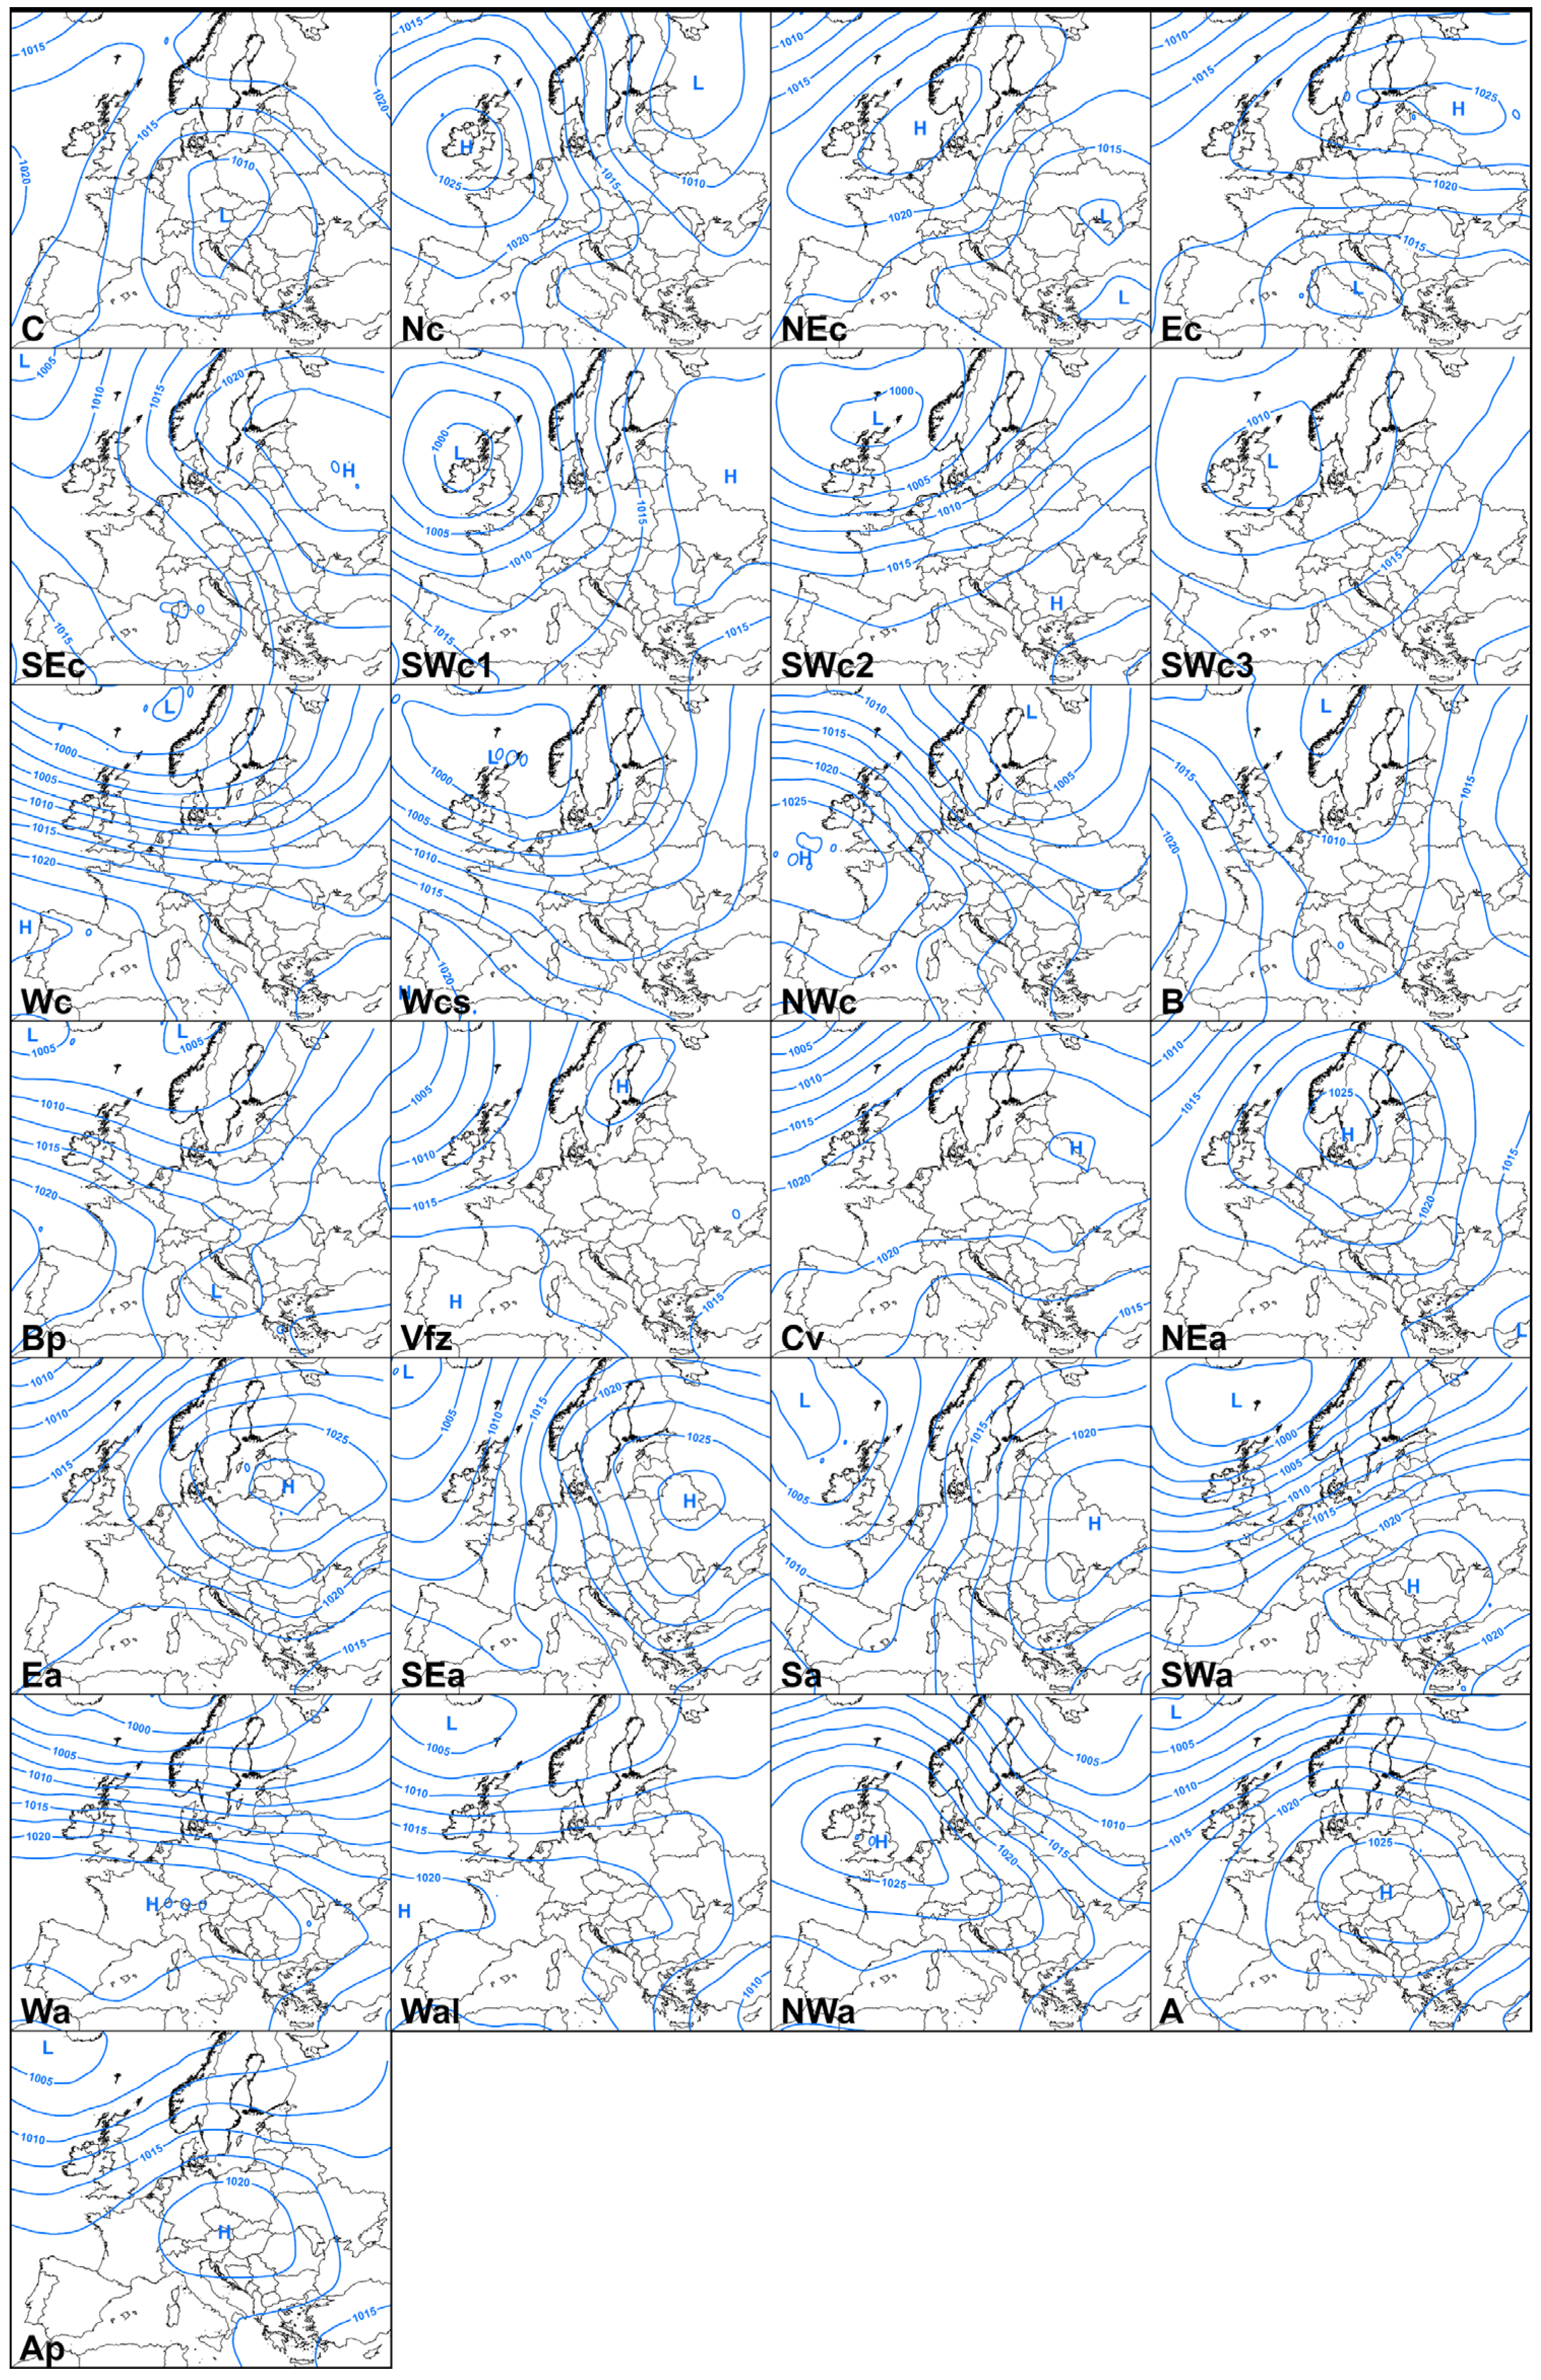
2.3. Classifications of the Circulation Types

The first subjective classification of synoptic types of the CHMI [28], based on the previous study by Brádka et al. [48], was retrospectively compiled to 1946 until recent times [49]. Originally developed by the synoptic meteorologists at the CHMI (since 1993 together with those associated with the Slovak Hydrometeorological Institute), this classification is generally based on the direction of airflow and the cyclonic/anticyclonic character of weather patterns, while a few specific circulation types are also defined by the characteristic shape, position, and movement of pressure highs or lows. This classification includes 28 synoptic (circulation) types, of which 15 are cyclonic types (Wc, Wcs, NWc, Nc, NEc, Ec, SEc, SWc1, SWc2, SWc3, B, Bp, and Vfz) and 13 are anticyclonic types (Wa, Wal, NWa, NEa, Ea, SEa, Sa, SWa, A, Ap1, Ap2, Ap3, and Ap4) (for abbreviations see Figure A1). Types Ap1 to Ap4 were grouped into a single Ap type in this paper. All types are schematically expressed in Appendix A (Figure A1).
The second objective classification of circulation types is based on the flow strength, flow direction, and vorticity [24,45]. Calculation of the circulation types considers the sea level pressure (SLP) in NCEP/NCAR (National Centers for Environmental Prediction / National Center for Atmospheric Research) reanalysis [50] at 16 points centered onto the geographic midpoint of the Czech Republic with coordinates 49.74° N and 15.33° E (Figure 2). An SLP value at a given point was obtained as the inverse distance weighted mean of the SLP values at the nine closest NCEP/NCAR grid points. This classification defines 27 circulation types, of which nine types are anticyclonic types (A, AN, ANE, AE, ASE, AS, ASW, AW, and ANW), nine are cyclonic types (C, CN, CNE, CE, CSE, CS, CSW, CW, and CNW), and eight are directional types (N, NE, E, SE, S, SW, W, and NW) (for abbreviations see Figure A2), while the remaining unclassified types are attributed to type U (please refer to Ref. [46] for more details on this classification). The individual circulation types are schematically expressed in Appendix A (Figure A2).

2.4. Methods

The daily precipitation totals in 500 m × 500 m grids during the 1961–2020 period separately aggregated for BOH and M&S and the daily circulation types according to the CHMI and objective classifications were considered to describe the connections between precipitation and circulation patterns during the year and four standard seasons (DJF: December–February; MAM: March–May; JJA: June–August; and SON: September–November) based on several precipitation characteristics. The precipitation proportions of individual circulation types were calculated as precipitation percentages attributed to a given type in the overall precipitation total (Section 3.2). Because this characteristic combines the frequency of the individual types and the intensity of precipitation, the mean daily precipitation totals for each circulation type were further calculated (Section 3.3). As a third characteristic, the probability of days with a daily precipitation total ≥1.0 mm under the individual circulation types was calculated (Section 3.4). In contrast to the daily mean totals, this characteristic is not influenced by any randomly high totals observed, for example, during convective storms. All three characteristics were calculated separately for the two parts of the Czech Republic (BOH and M&S). The differences in precipitation characteristics between these two regions were tested under each circulation type via the two-proportion Z-test [51] at a significance level of 0.05. All precipitation characteristics were analyzed not only for the individual circulation types but also for their groups (the cyclonic and anticyclonic types under the CHMI classification and the anticyclonic, cyclonic, and directional types under the objective classification).
The gridded (500 m × 500 m) daily precipitation totals were further employed to investigate the spatial distribution of precipitation under the individual circulation types across the territory of the Czech Republic. Mean daily precipitation totals under a given circulation type were expressed in each grid as anomalies in regard to the corresponding overall annual or seasonal daily means calculated over the 1961–2020 period. The obtained anomalies were used to create corresponding maps of the individual circulation types, and only those circulation types with the largest positive and negative differences between BOH and M&S throughout the year and during the four seasons are presented in Section 3.5 (see Figures 11 and 12).

3. Results

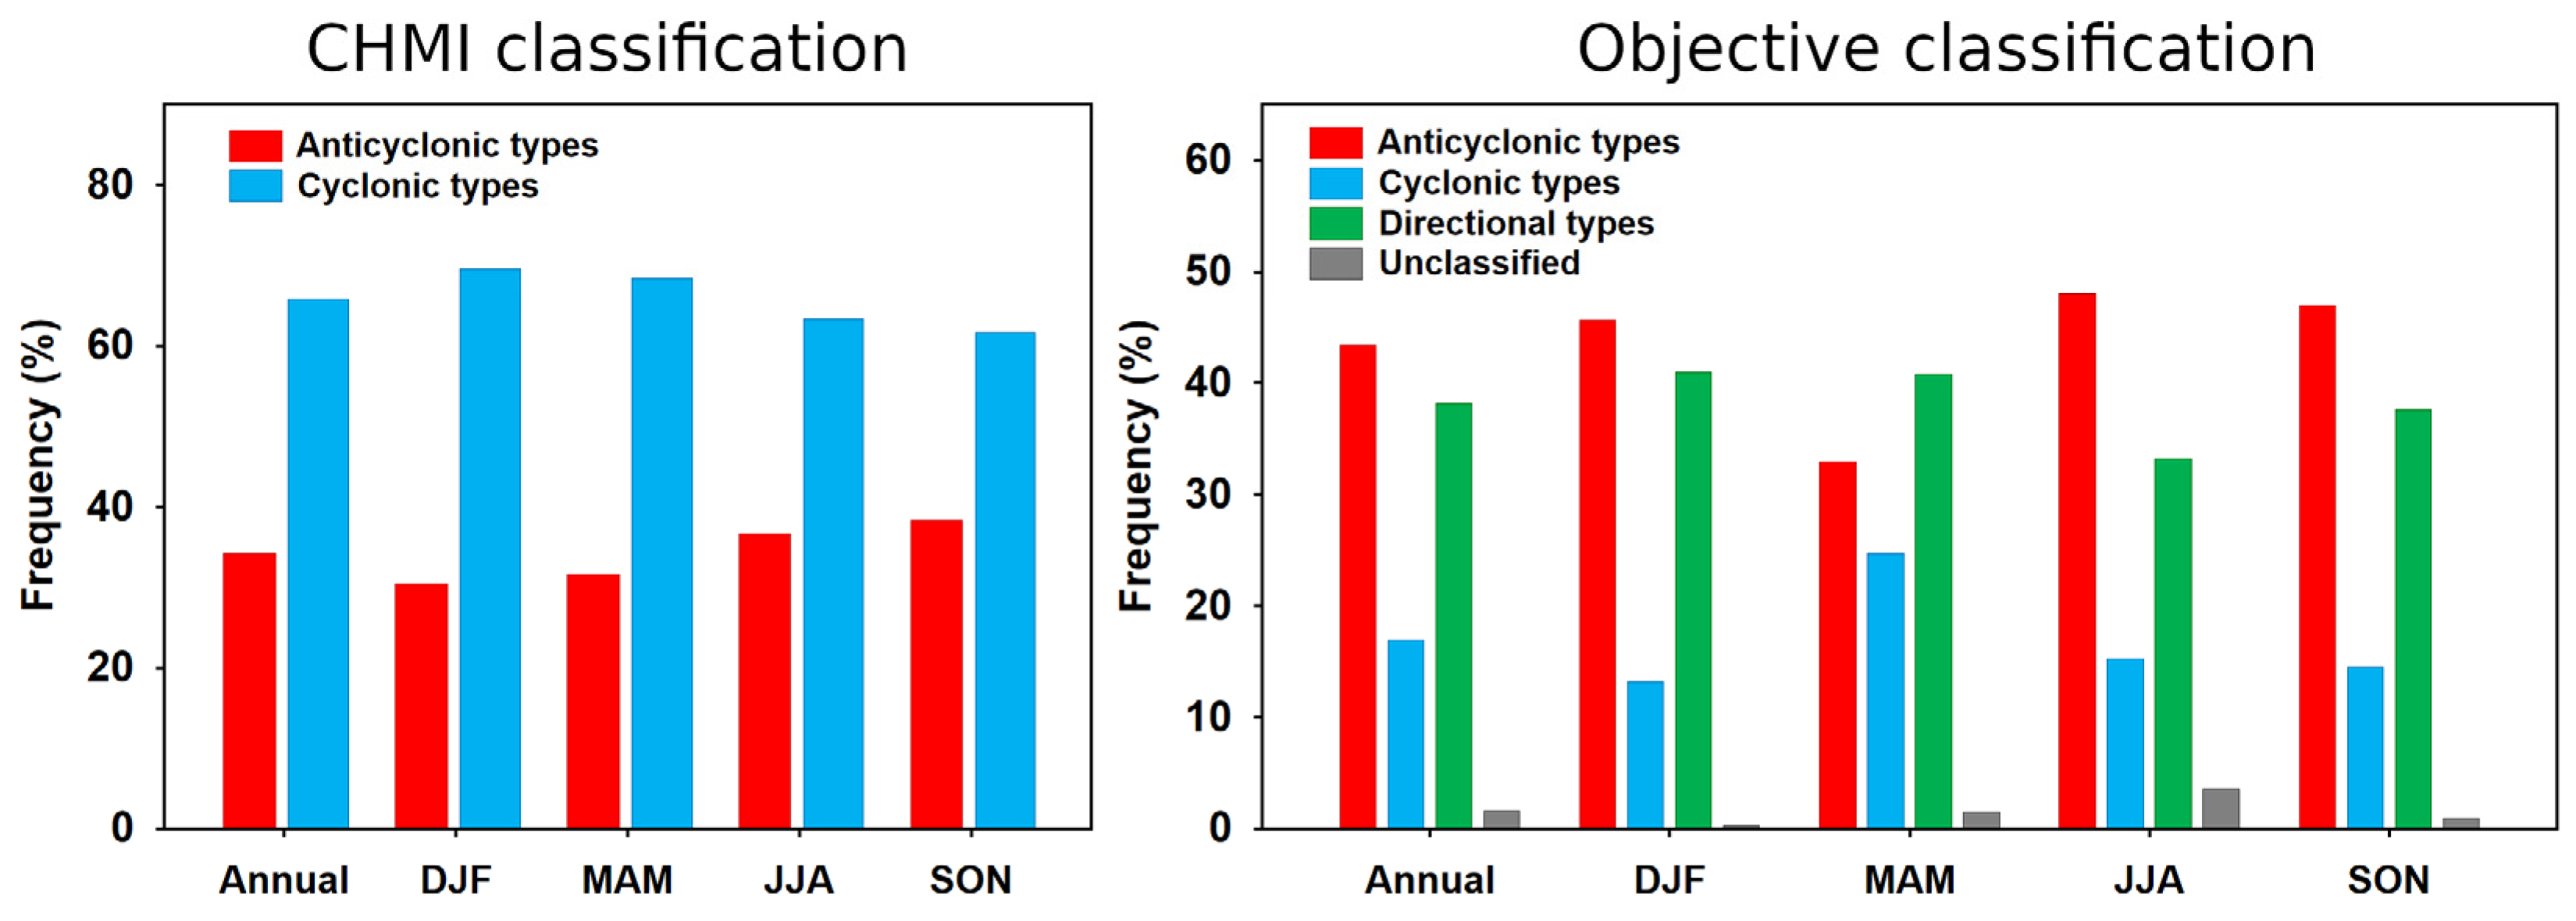
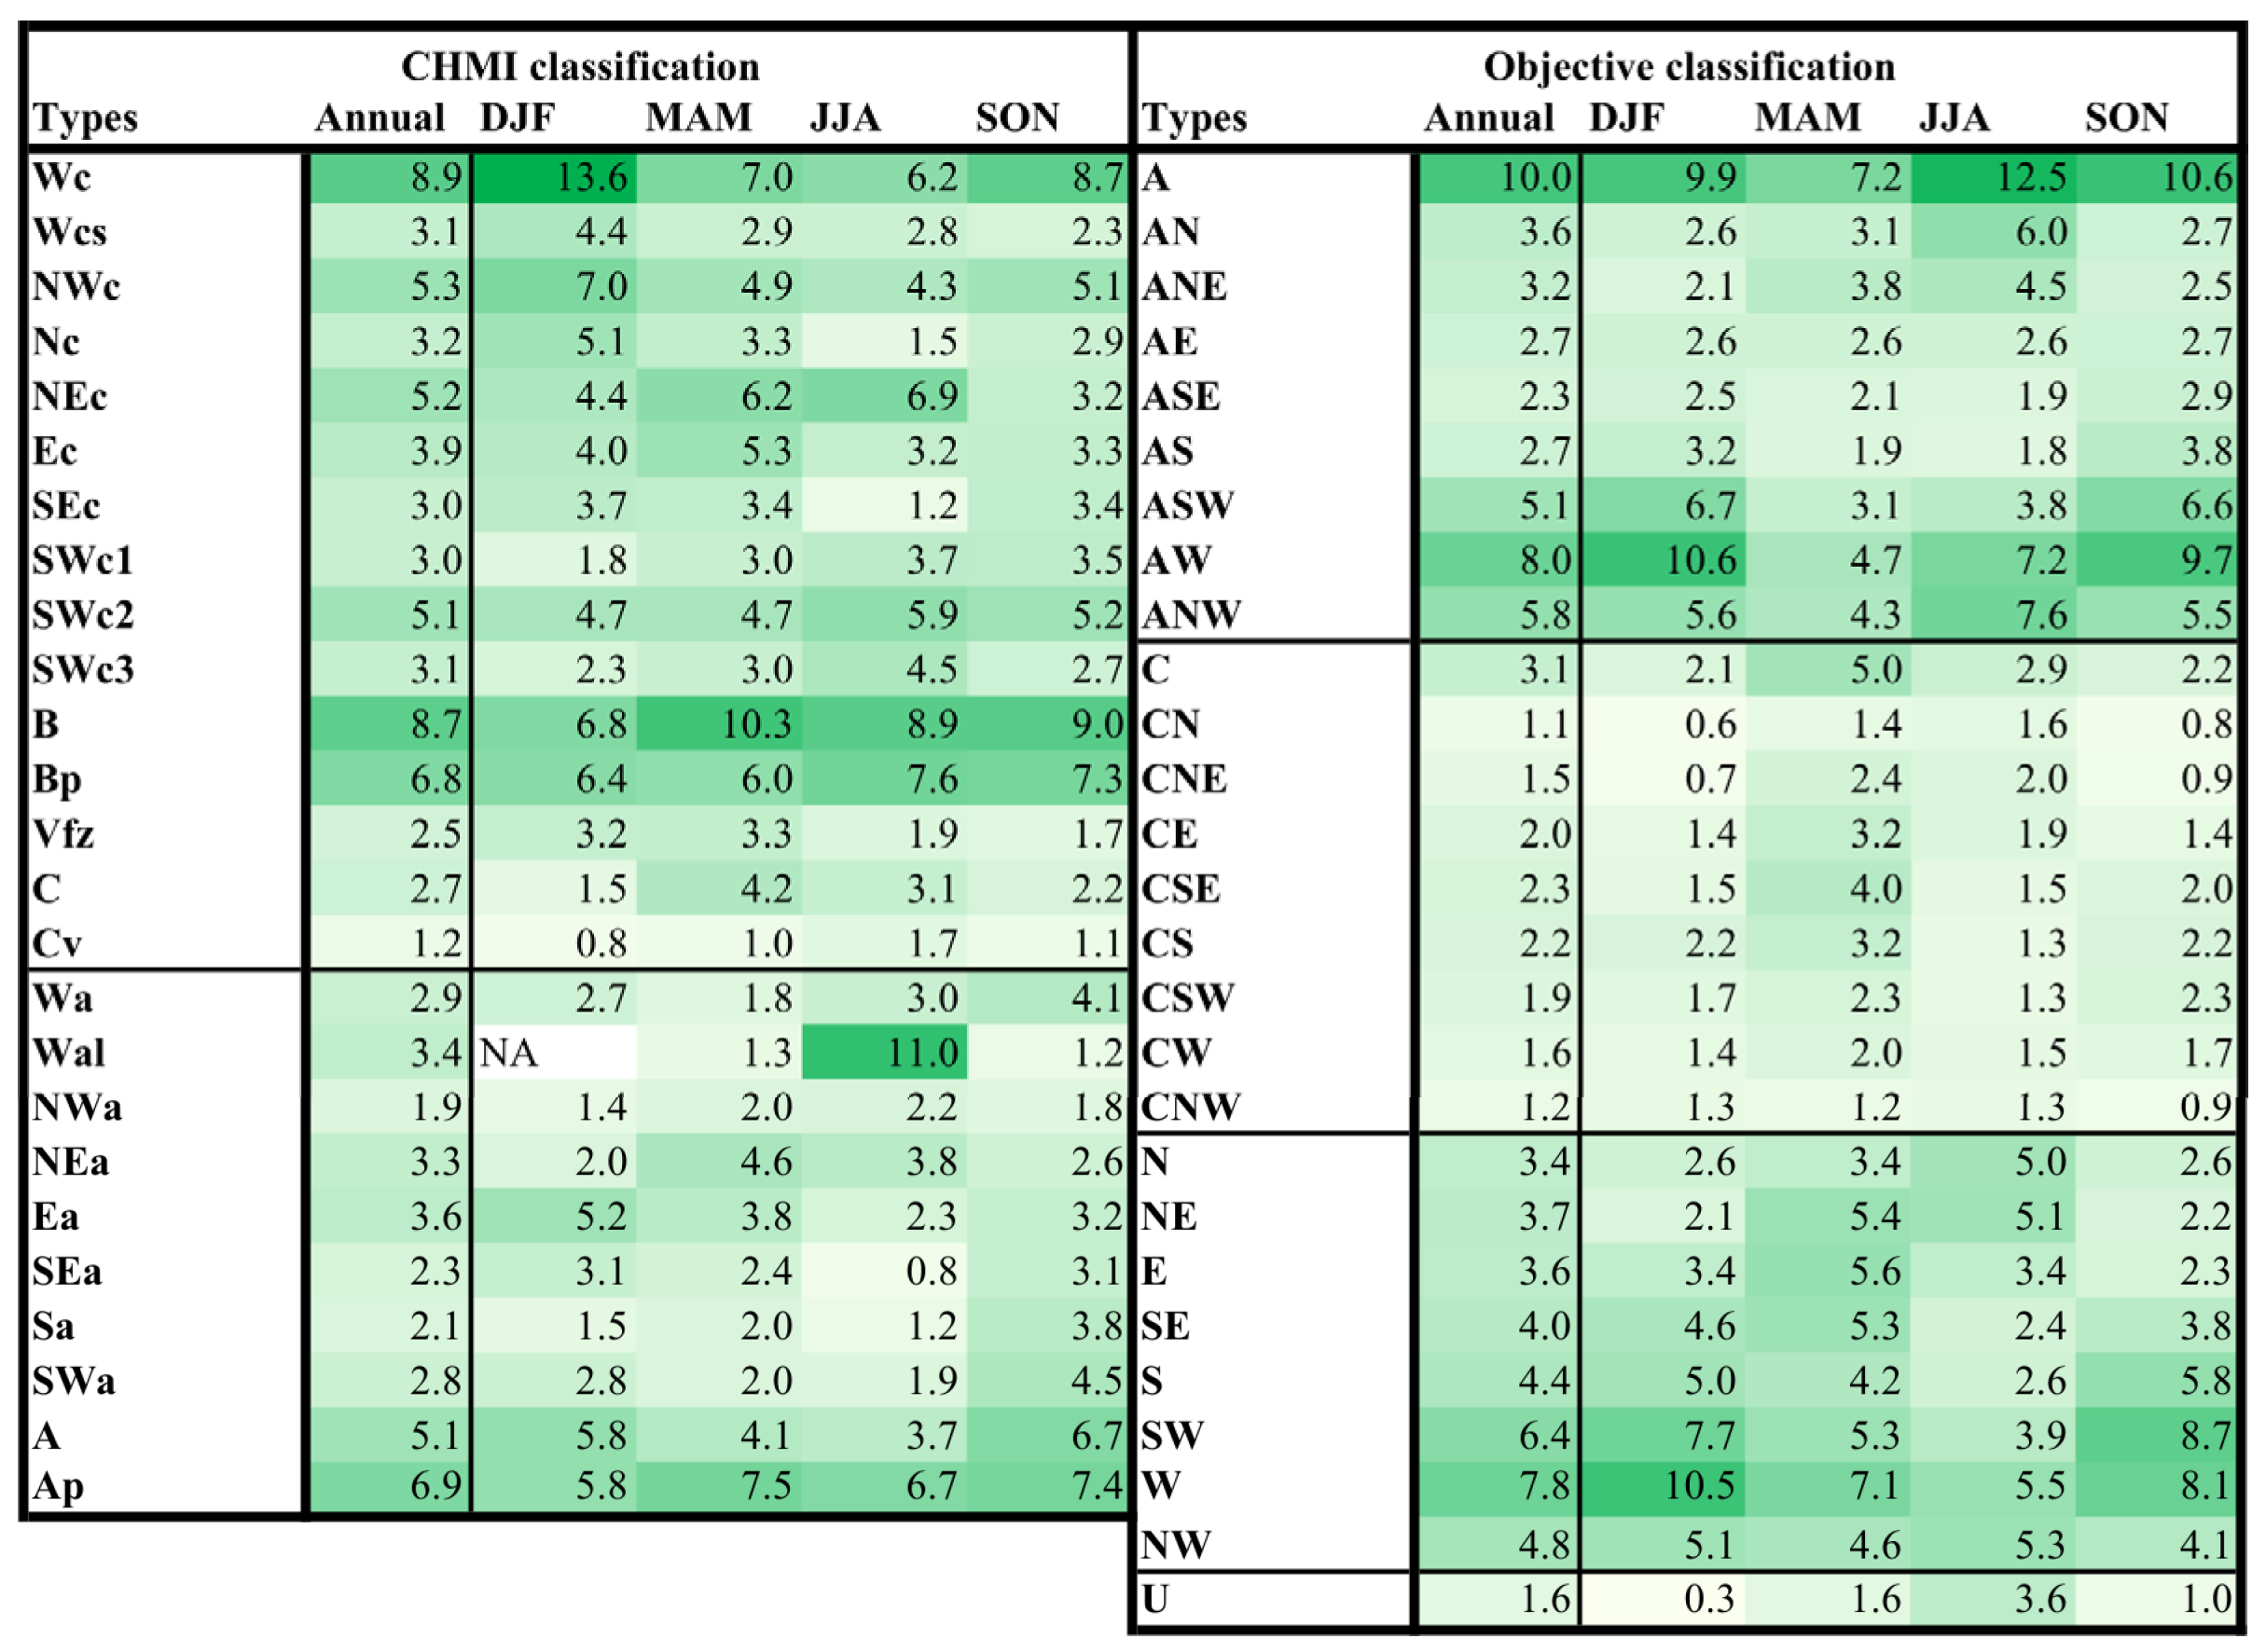
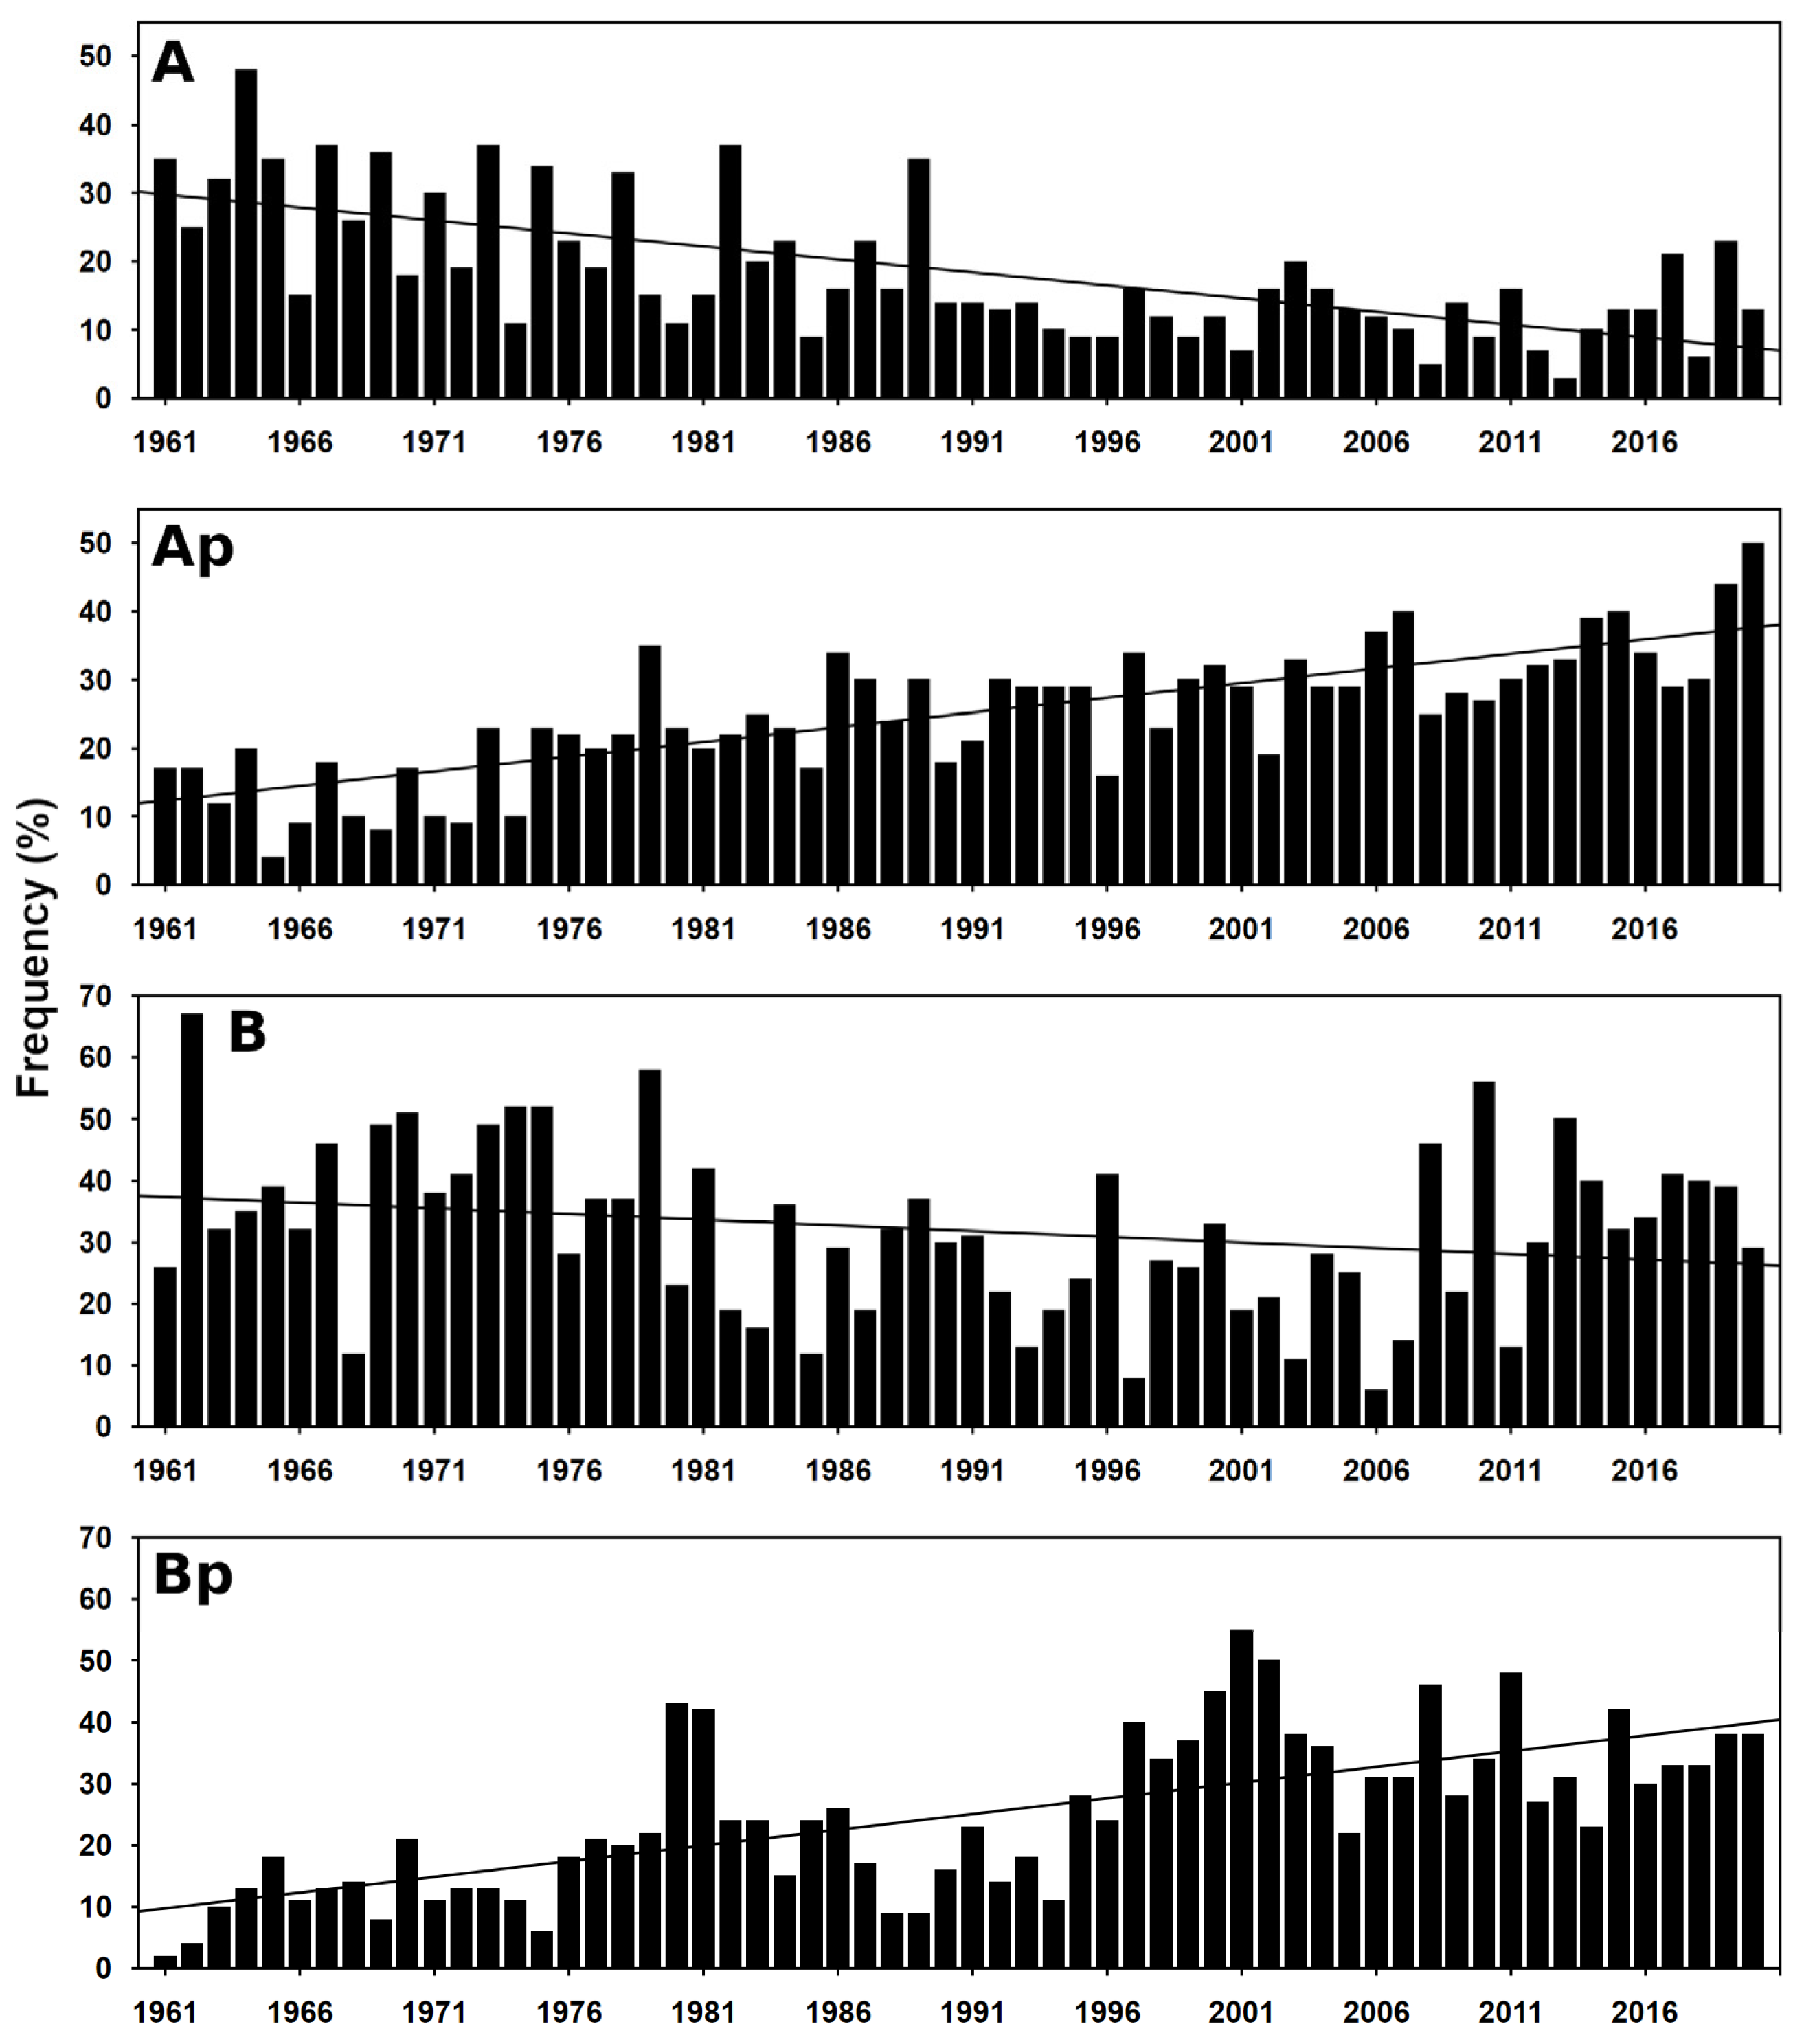
3.1. Frequency of the Circulation Types

To describe the circulation patterns during the 1961–2020 period, the relative annual and seasonal occurrence frequencies of the individual circulation types under both classifications are shown in Figure 3 and Figure 4, respectively. Under the CHMI classification, cyclonic types occur the most frequently at the annual and seasonal scales (Figure 3). The annual values account for 65.8% of all days, with the highest proportion in DJF (69.6%) and the lowest proportion in SON (61.7%). The frequencies of the anticyclonic types are relatively higher in JJA and SON and lower in DJF and MAM. In terms of the individual types (Figure 4), the Wc type occurred the most frequently throughout the year (8.9%) and in DJF (13.6%). The Wal type, occurring only during the summer half-year (April–September), was the most frequent in JJA (11.0%). In MAM and SON, type B occurred the most frequently (at 10.3% and 9.0%, respectively).
In contrast to the CHMI classification, anticyclonic types occurred the most frequently under the objective classification due to the different classification approach (Section 2.3). Under the objective classification, 43.4% of all days exhibited anticyclonic circulation types, followed by directional (38.1%) and cyclonic (16.9%) circulation types. Unclassified cases accounted for 1.6% of all days (Figure 3). Except for MAM, which exhibited the highest frequency of directional types (40.8%), anticyclonic types dominated throughout the year and in the three remaining seasons (the highest frequency of 48.0% occurred in JJA). Cyclonic types with a maximum frequency in MAM (24.7%) greatly differed from the frequencies of the anticyclonic and directional types. In regard to the individual circulation types (Figure 4), type A was the most frequent throughout the year (10.0%) and in MAM (7.2%), JJA (12.5%), and SON (10.6%). In DJF, the AW and W types (10.6% and 10.5%, respectively) occurred the most frequently, reflecting the more pronounced westerly airflow during this season.

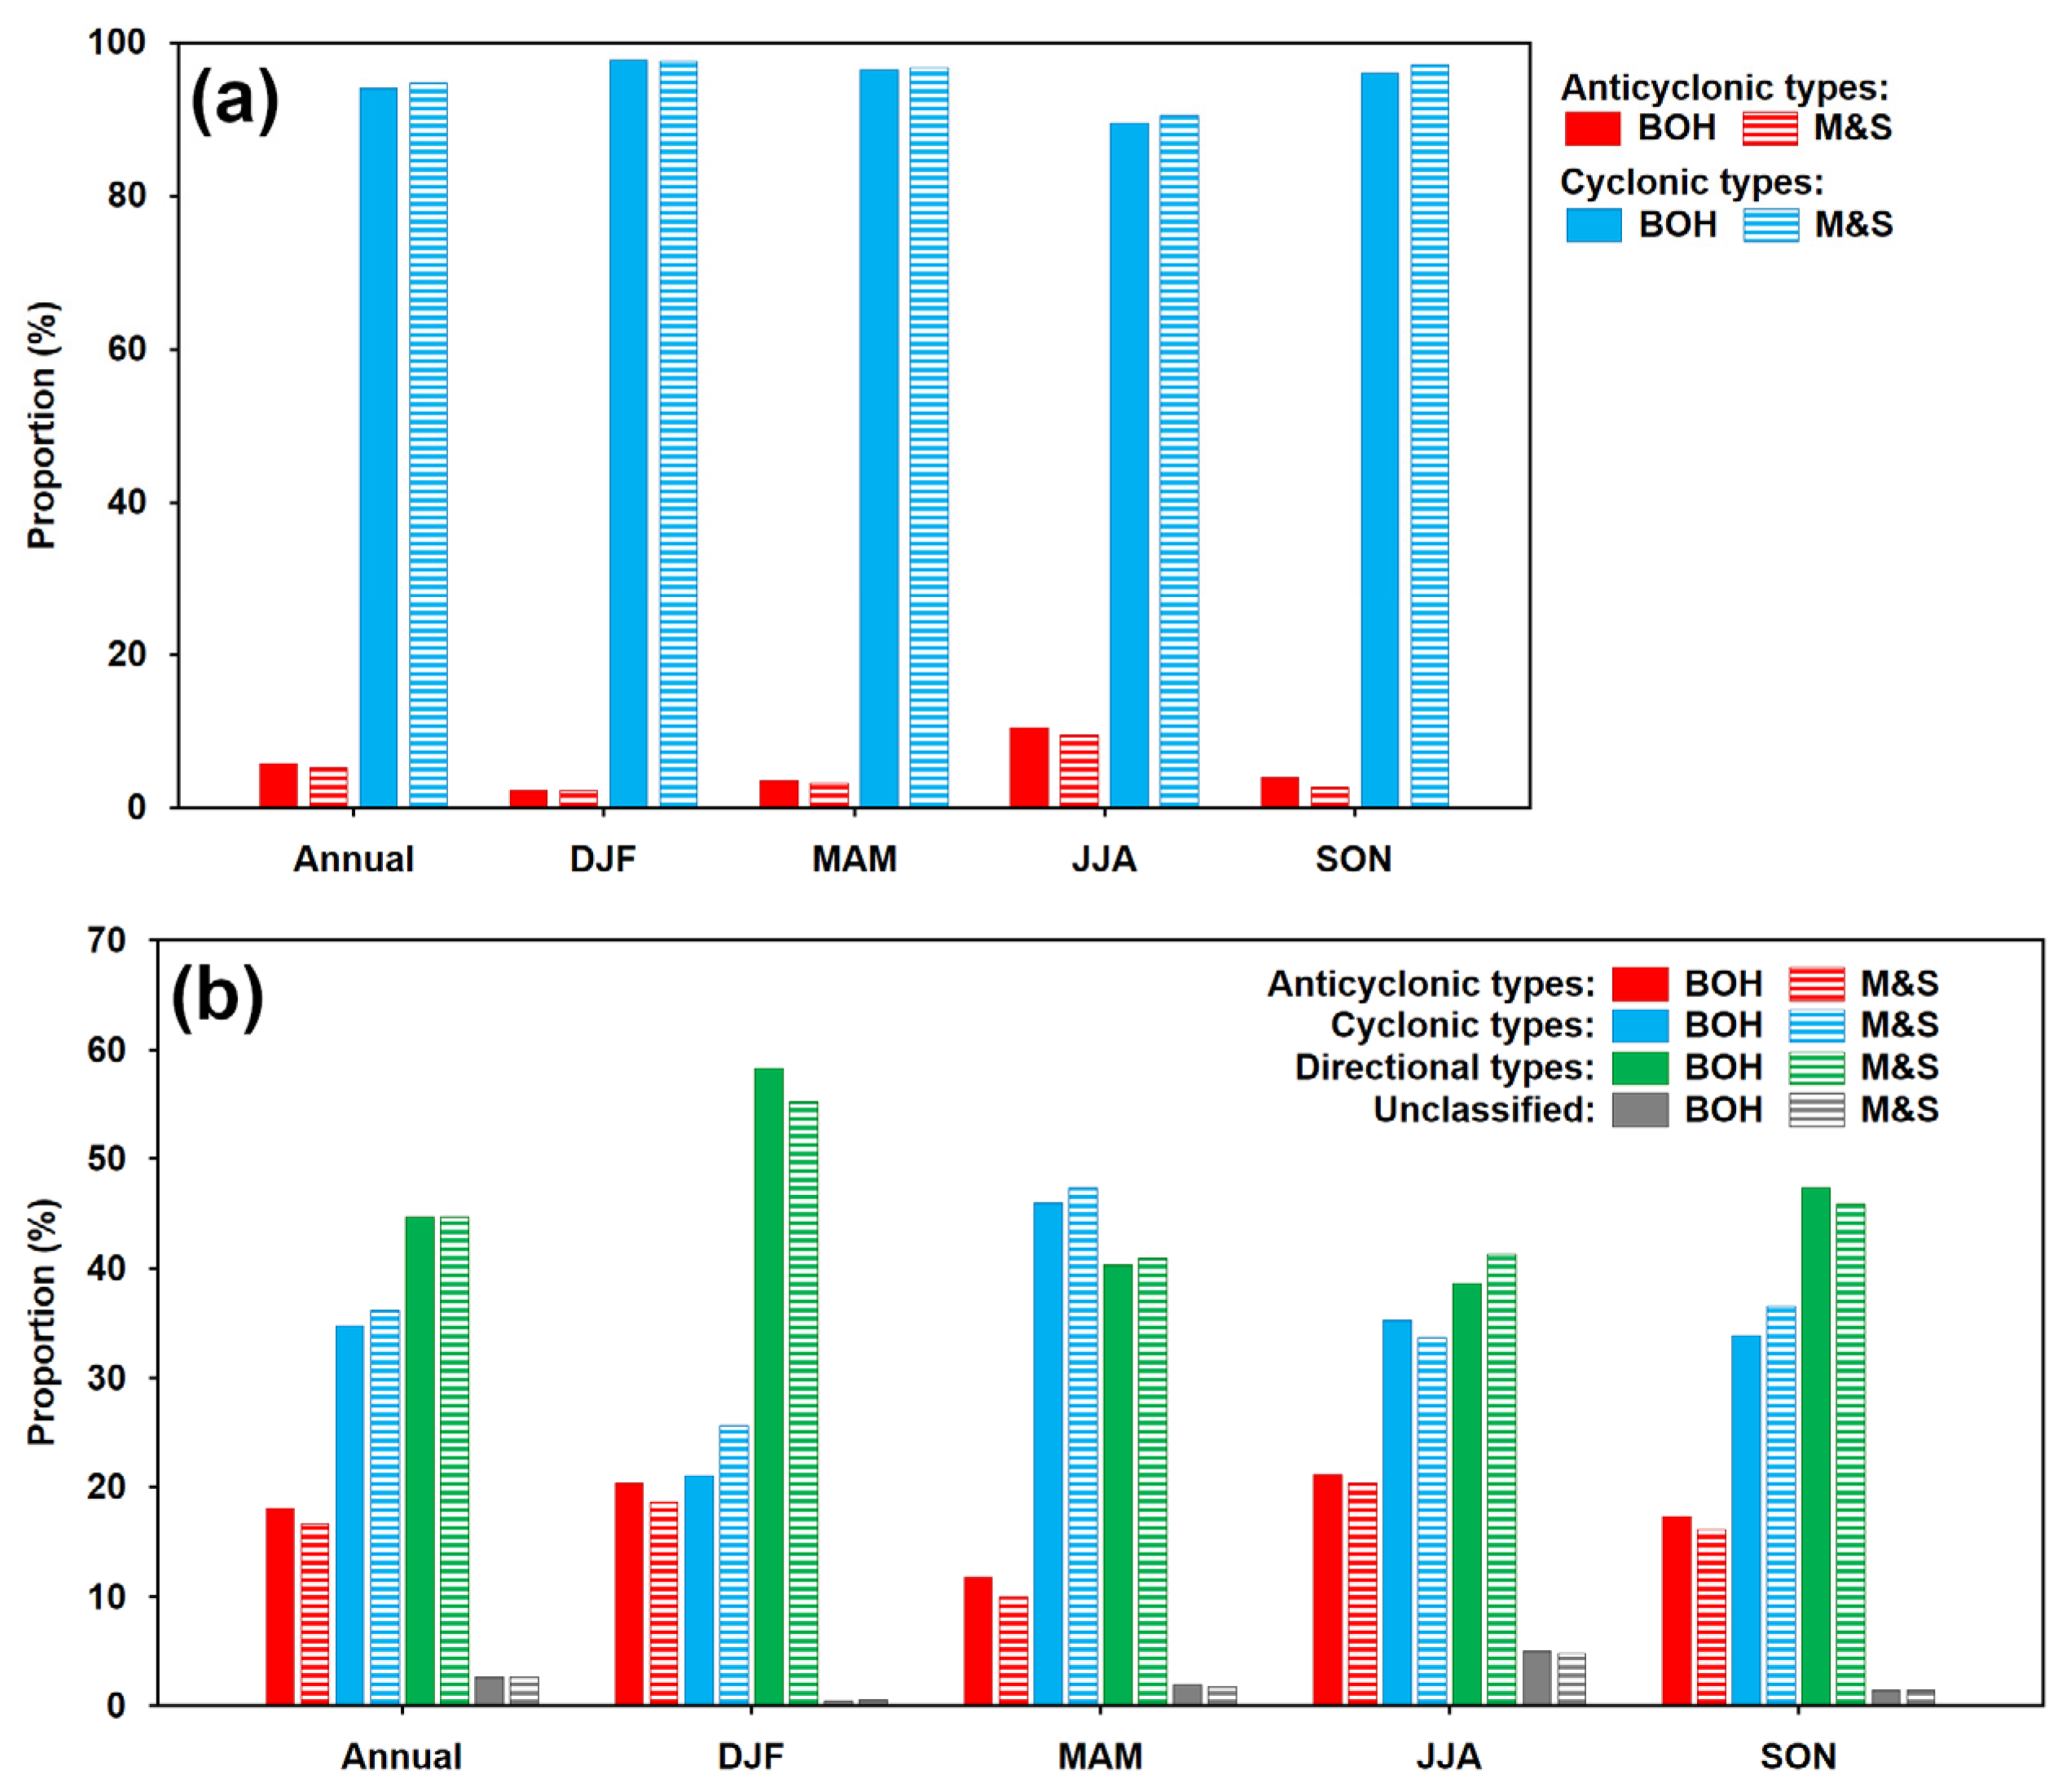
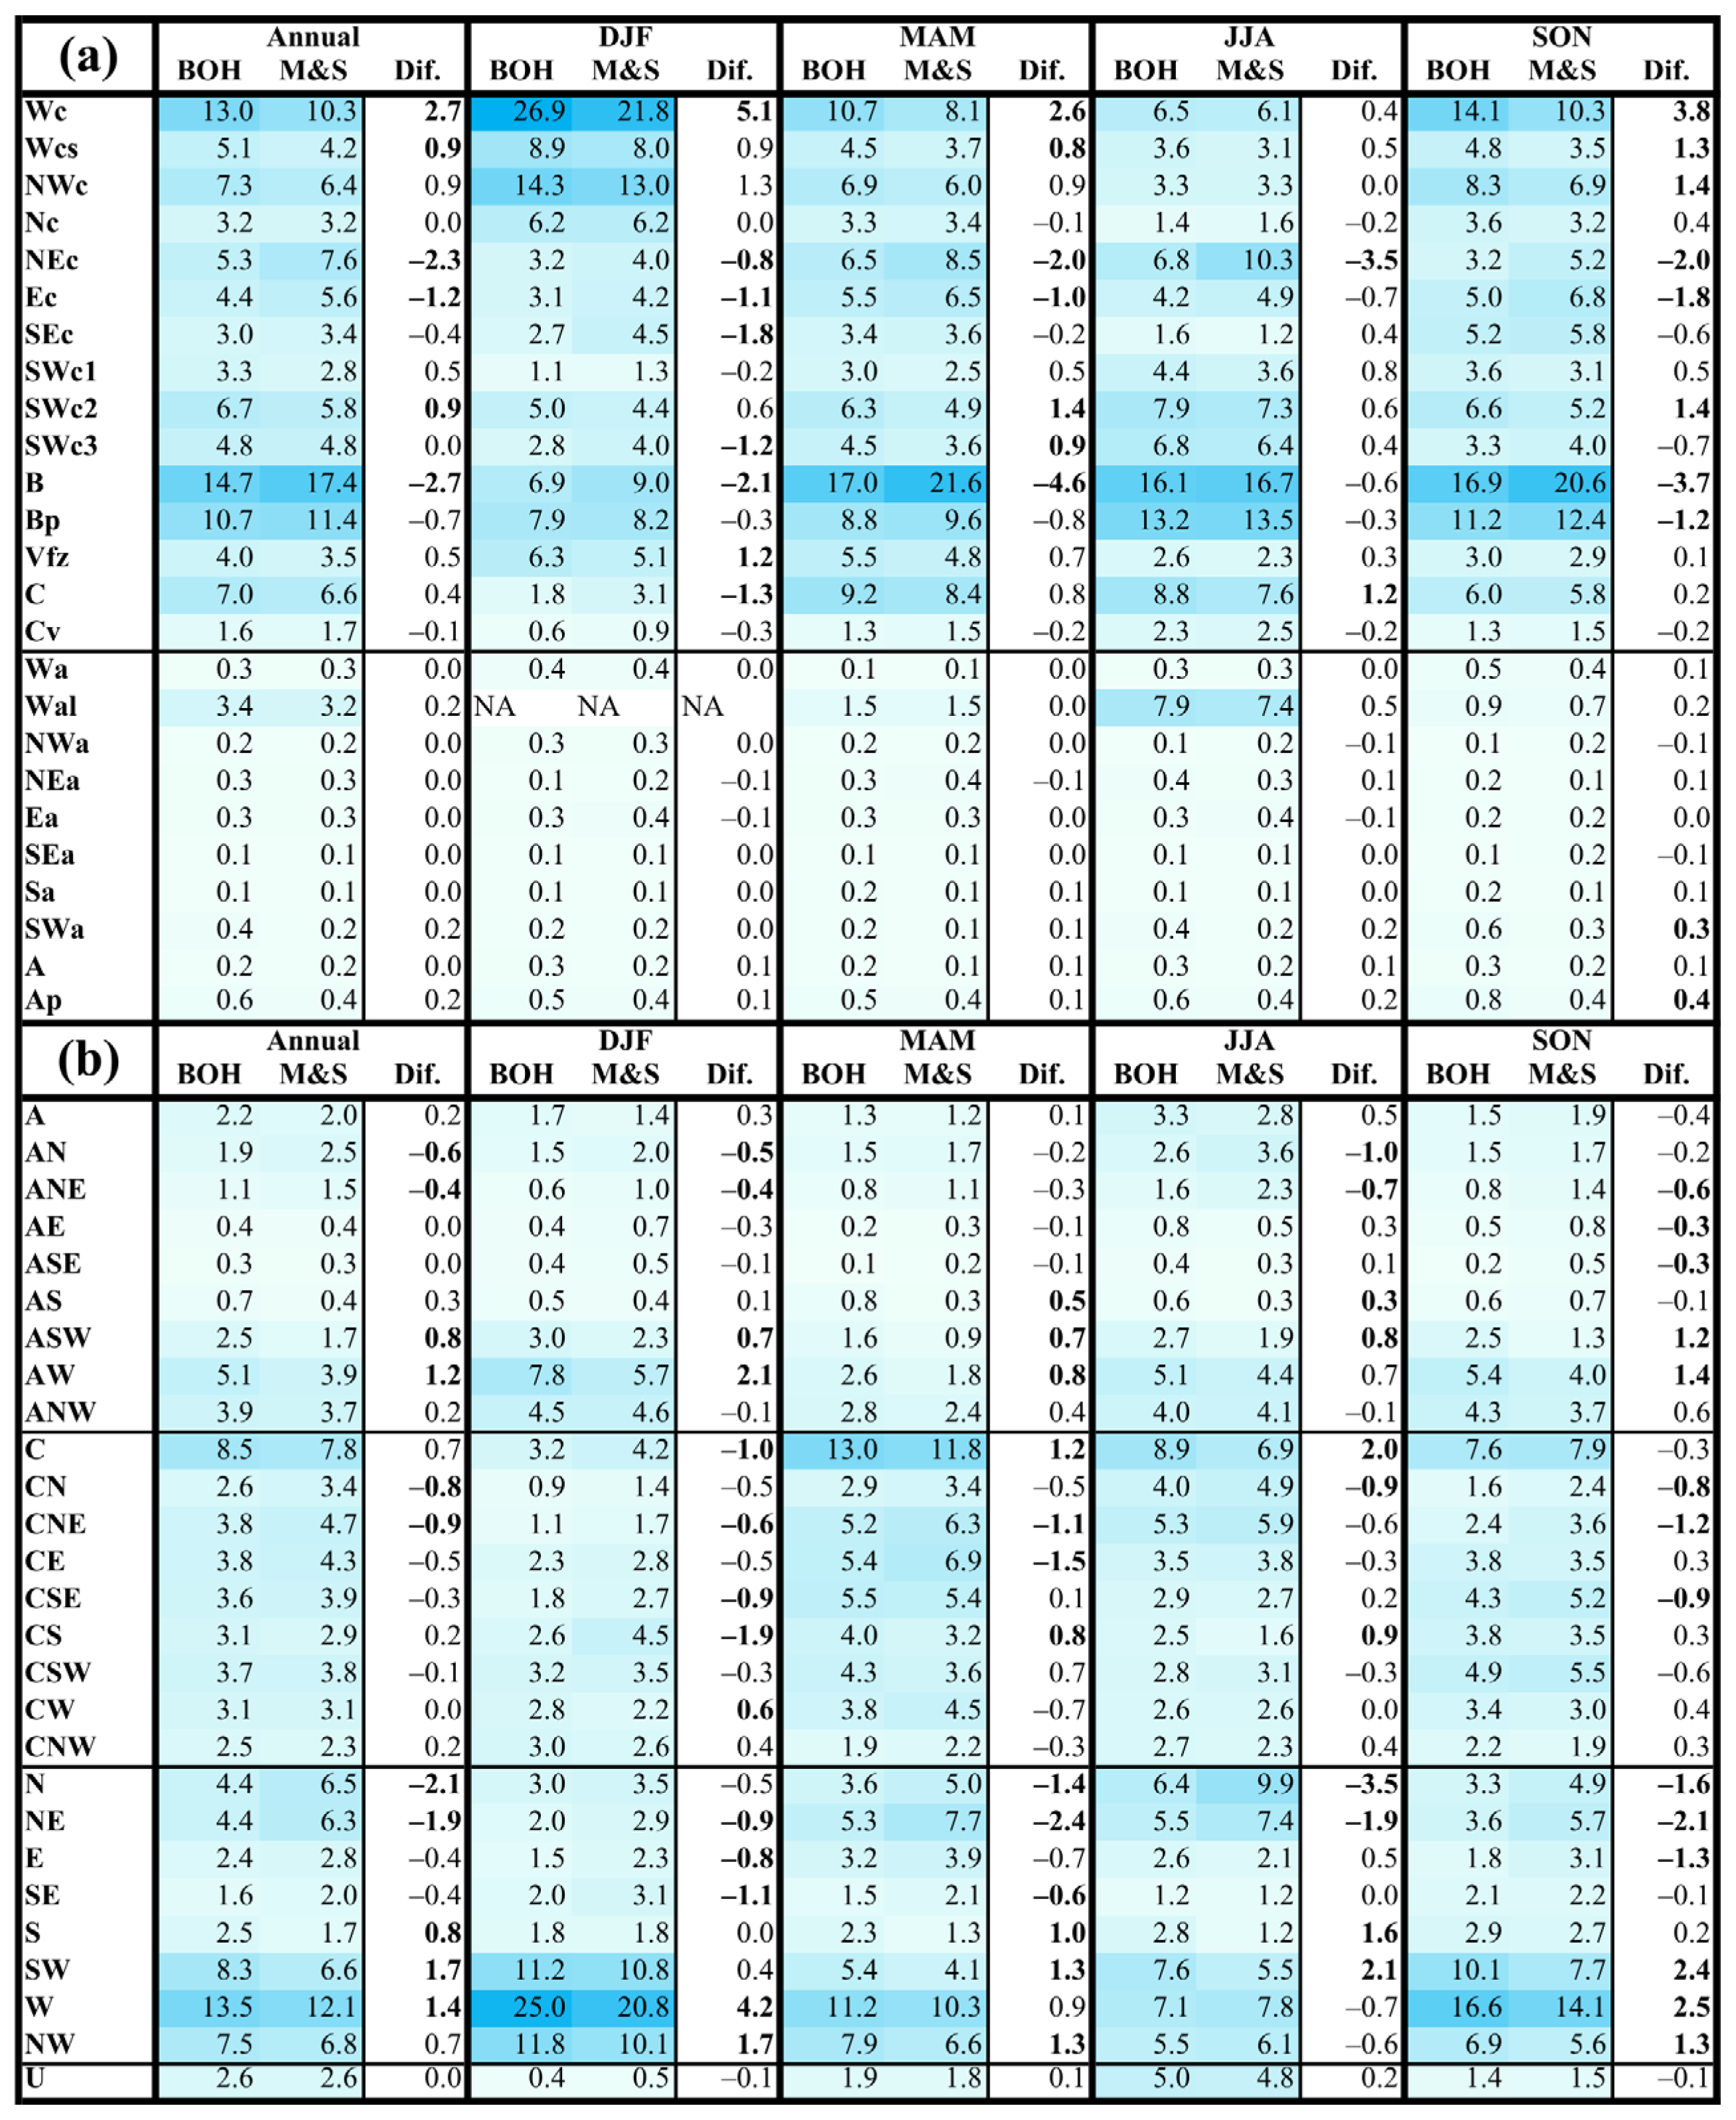
3.2. Precipitation Proportions of the Circulation Types

The group of cyclonic types under the CHMI classification produced 94.1% of the annual precipitation totals in BOH and 94.7% in M&S (Figure 5a). In the various seasons, the proportions fluctuated between 89.5% (JJA) and 97.7% (DJF) in BOH and between 90.5% (JJA) and 97.7% (DJF) in M&S. The proportions of the anticyclonic types in the precipitation totals were negligible except for type Wal in JJA (7.9% in BOH and 7.4% in M&S), while in MAM and SON, the proportion was lower than 2%.
In terms of the proportions of the individual circulation types in the annual totals (Figure 6a), the highest values were observed for types Wc and B, exhibiting notable seasonality. Type Wc attained the highest precipitation proportion in DJF (26.9% in BOH and 21.8% in M&S), representing the highest seasonal value among the individual types and the largest difference between these two regions. In the three remaining seasons, type B exhibited the highest proportions, which were higher in M&S than those in BOH (with the largest difference in MAM: 21.6% in M&S and 17.0% in BOH). Statistically significant differences in the proportions of the individual types between these two regions throughout the year were detected for types Wc, Wcs, and SWc1 (larger proportions in BOH) and for types NEc, Ec, and B (larger proportions in M&S). Type C was remarkable based on the determined statistically significant differences in favor of M&S in DJF and in favor of BOH in JJA.
Regarding the objective classification, the group of directional types dominated the precipitation proportions in both regions, producing 44.7% of the precipitation totals annually, while the less frequent cyclonic types achieved 34.7% in BOH and 36.1% in M&S (Figure 5b). The most frequent anticyclonic types achieved only 18.0% of the precipitation totals in BOH and 16.6% in M&S. A similar situation was also observed during the individual seasons except MAM, in which the cyclonic types dominated (46.0% in BOH and 47.4% in M&S). In the three remaining seasons, the proportions of the directional types were the highest, with a maximum in DJF (58.3% and 55.2%, respectively) and a minimum in JJA (38.6% and 41.3%).
In regard to the proportions of the individual types in the annual precipitation totals (Figure 6b), type W attained the highest values, with 13.5% in BOH and 12.1% in M&S. The seasonal maximum value for this type reached 25.0% (DJF) and 20.8% (SON) in BOH. In MAM, type C attained the highest proportions (13.0% in BOH and 11.8% in M&S). This type also exhibited the highest proportion in JJA in BOH (8.9%), while in M&S, type N achieved the highest proportion (9.9%). Statistically significant annual differences in the proportions of the individual types were detected for types ASW, AW, S, SW, and W (higher proportions in BOH) and for types AN, NE, CN, CNE, N, and NE (higher proportions in M&S). This indicated the importance of types with a southwestern airflow for precipitation in BOH and those with a northeastern airflow in M&S. Among the directional types, which are strongly connected to the airflow direction, the main contrast between these two regions was observed along the west–east axis in DJF (types W, NW, NE, E, and SE exhibited significant differences between BOH and M&S), but this difference was shifted more towards the north–south axis in JJA (types S, SW, N, and NE). Type C behaved similarly to the corresponding type under the CHMI classification.

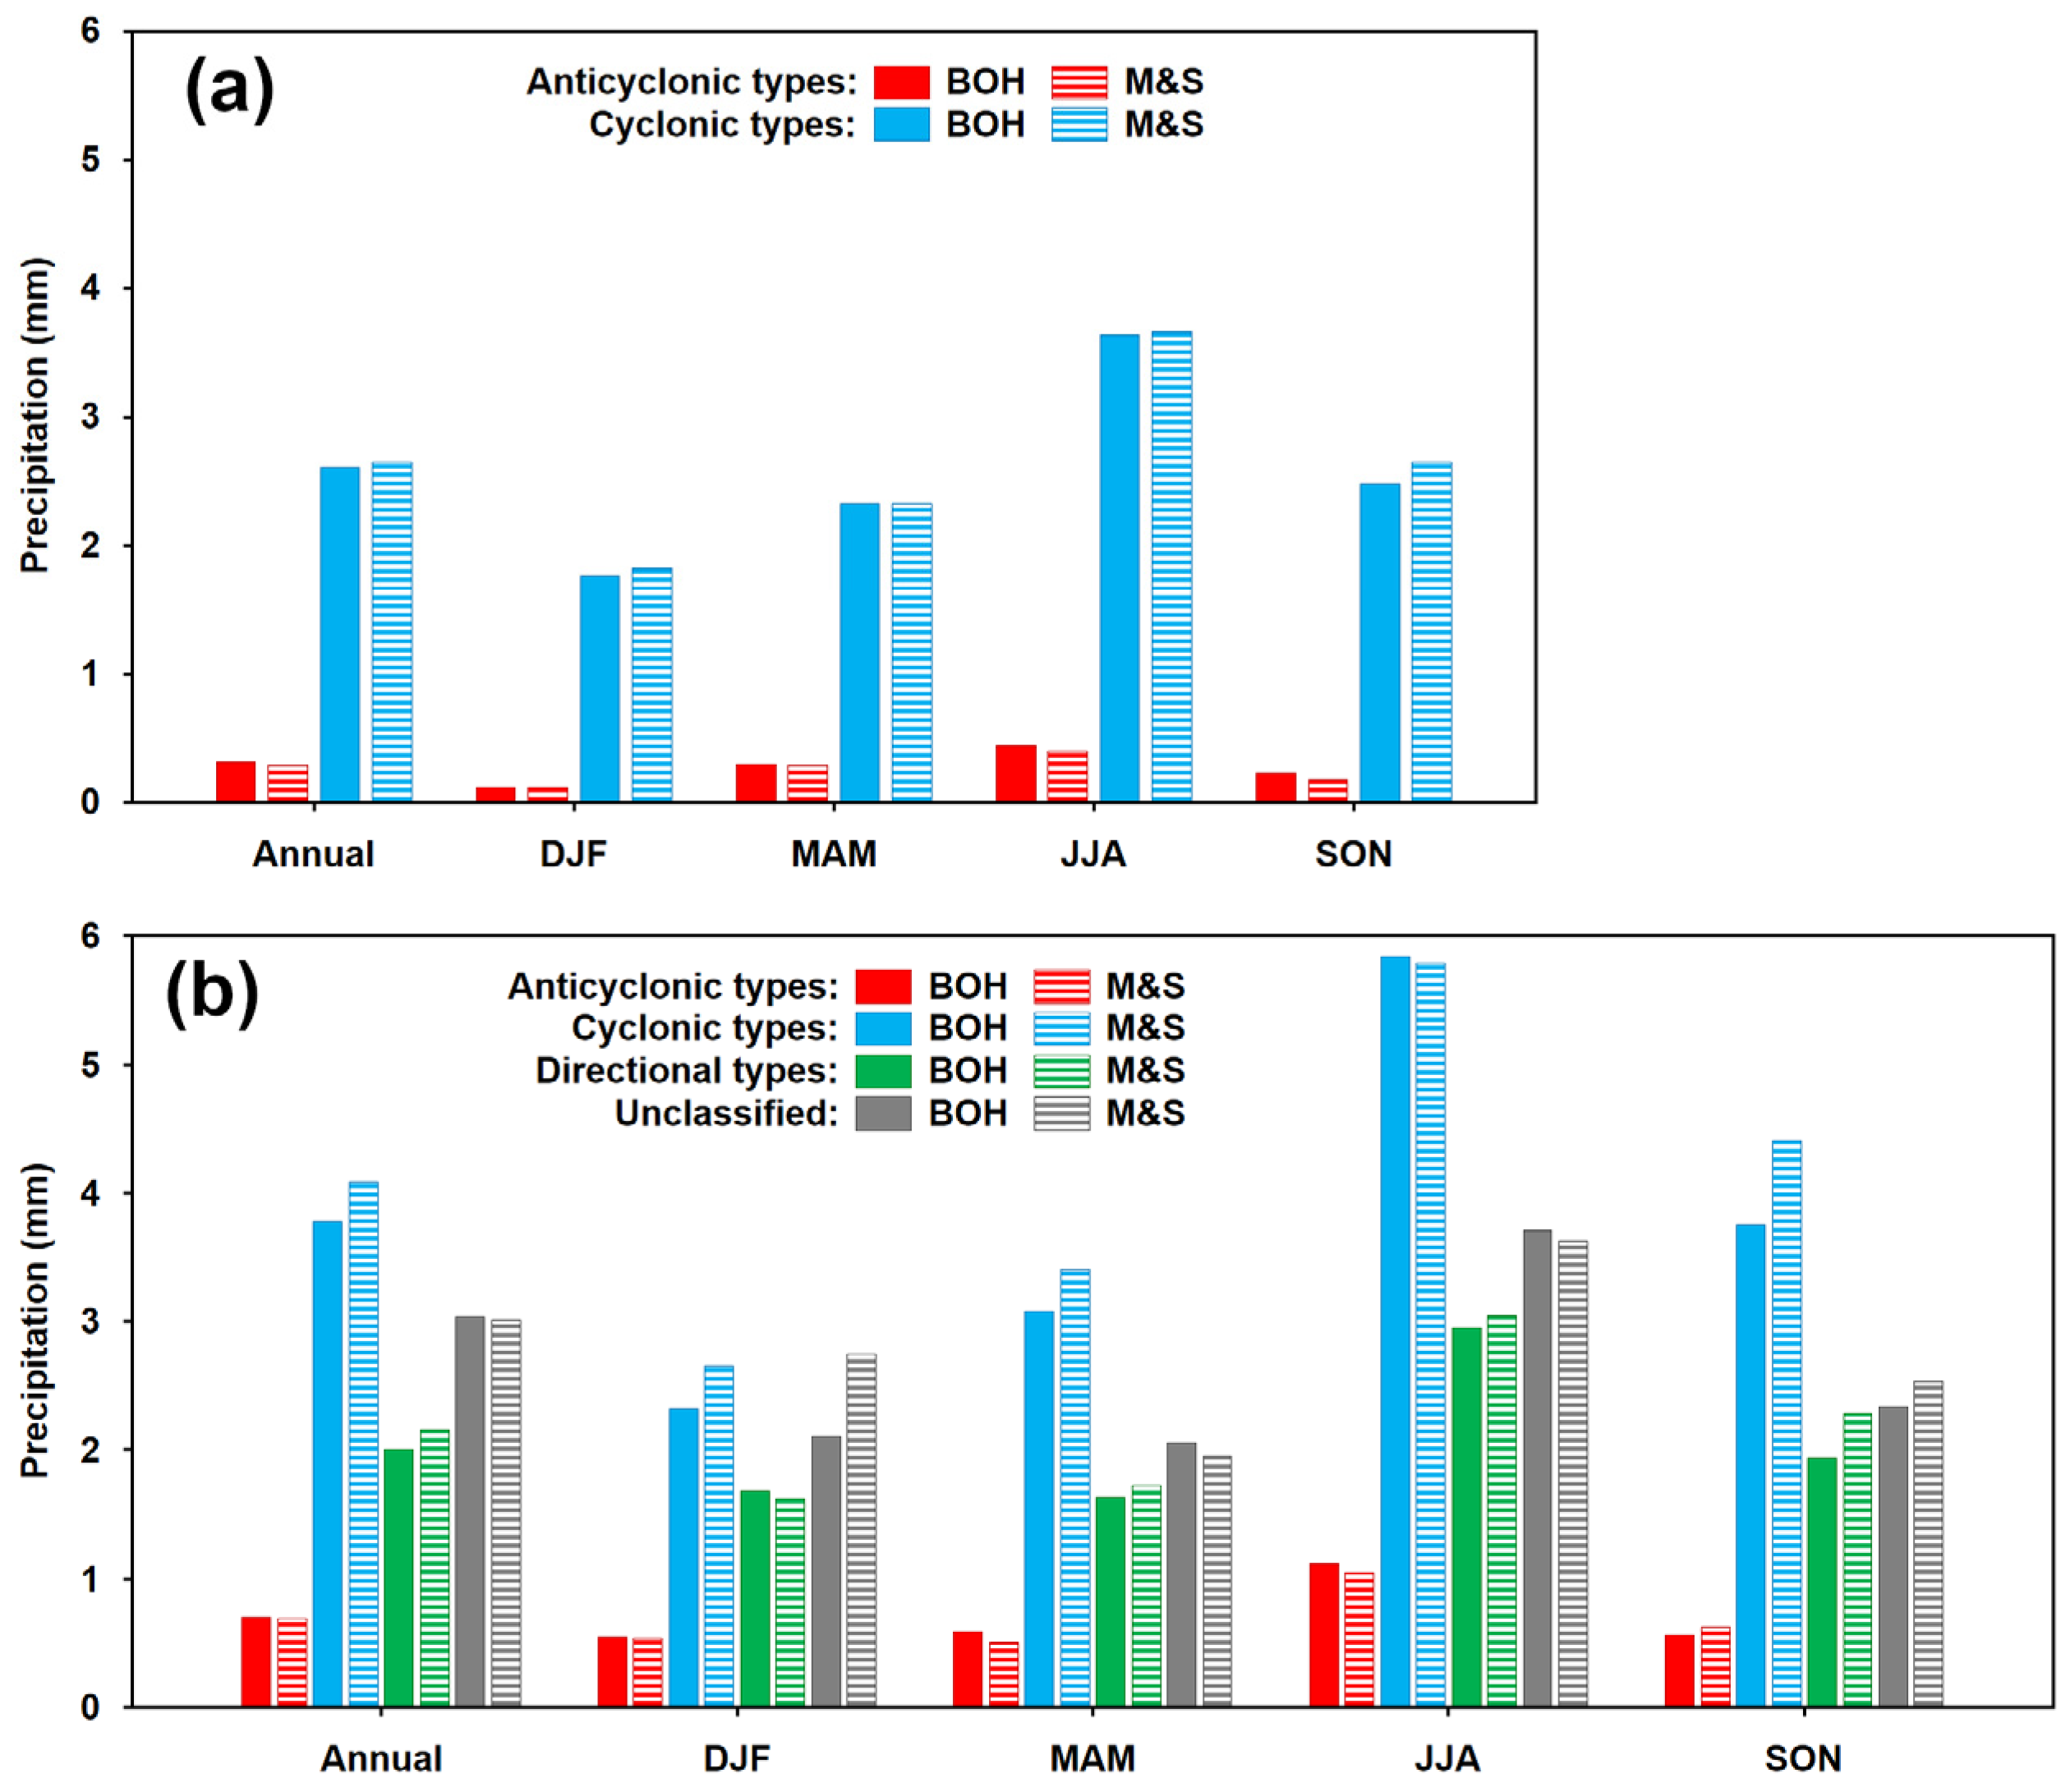
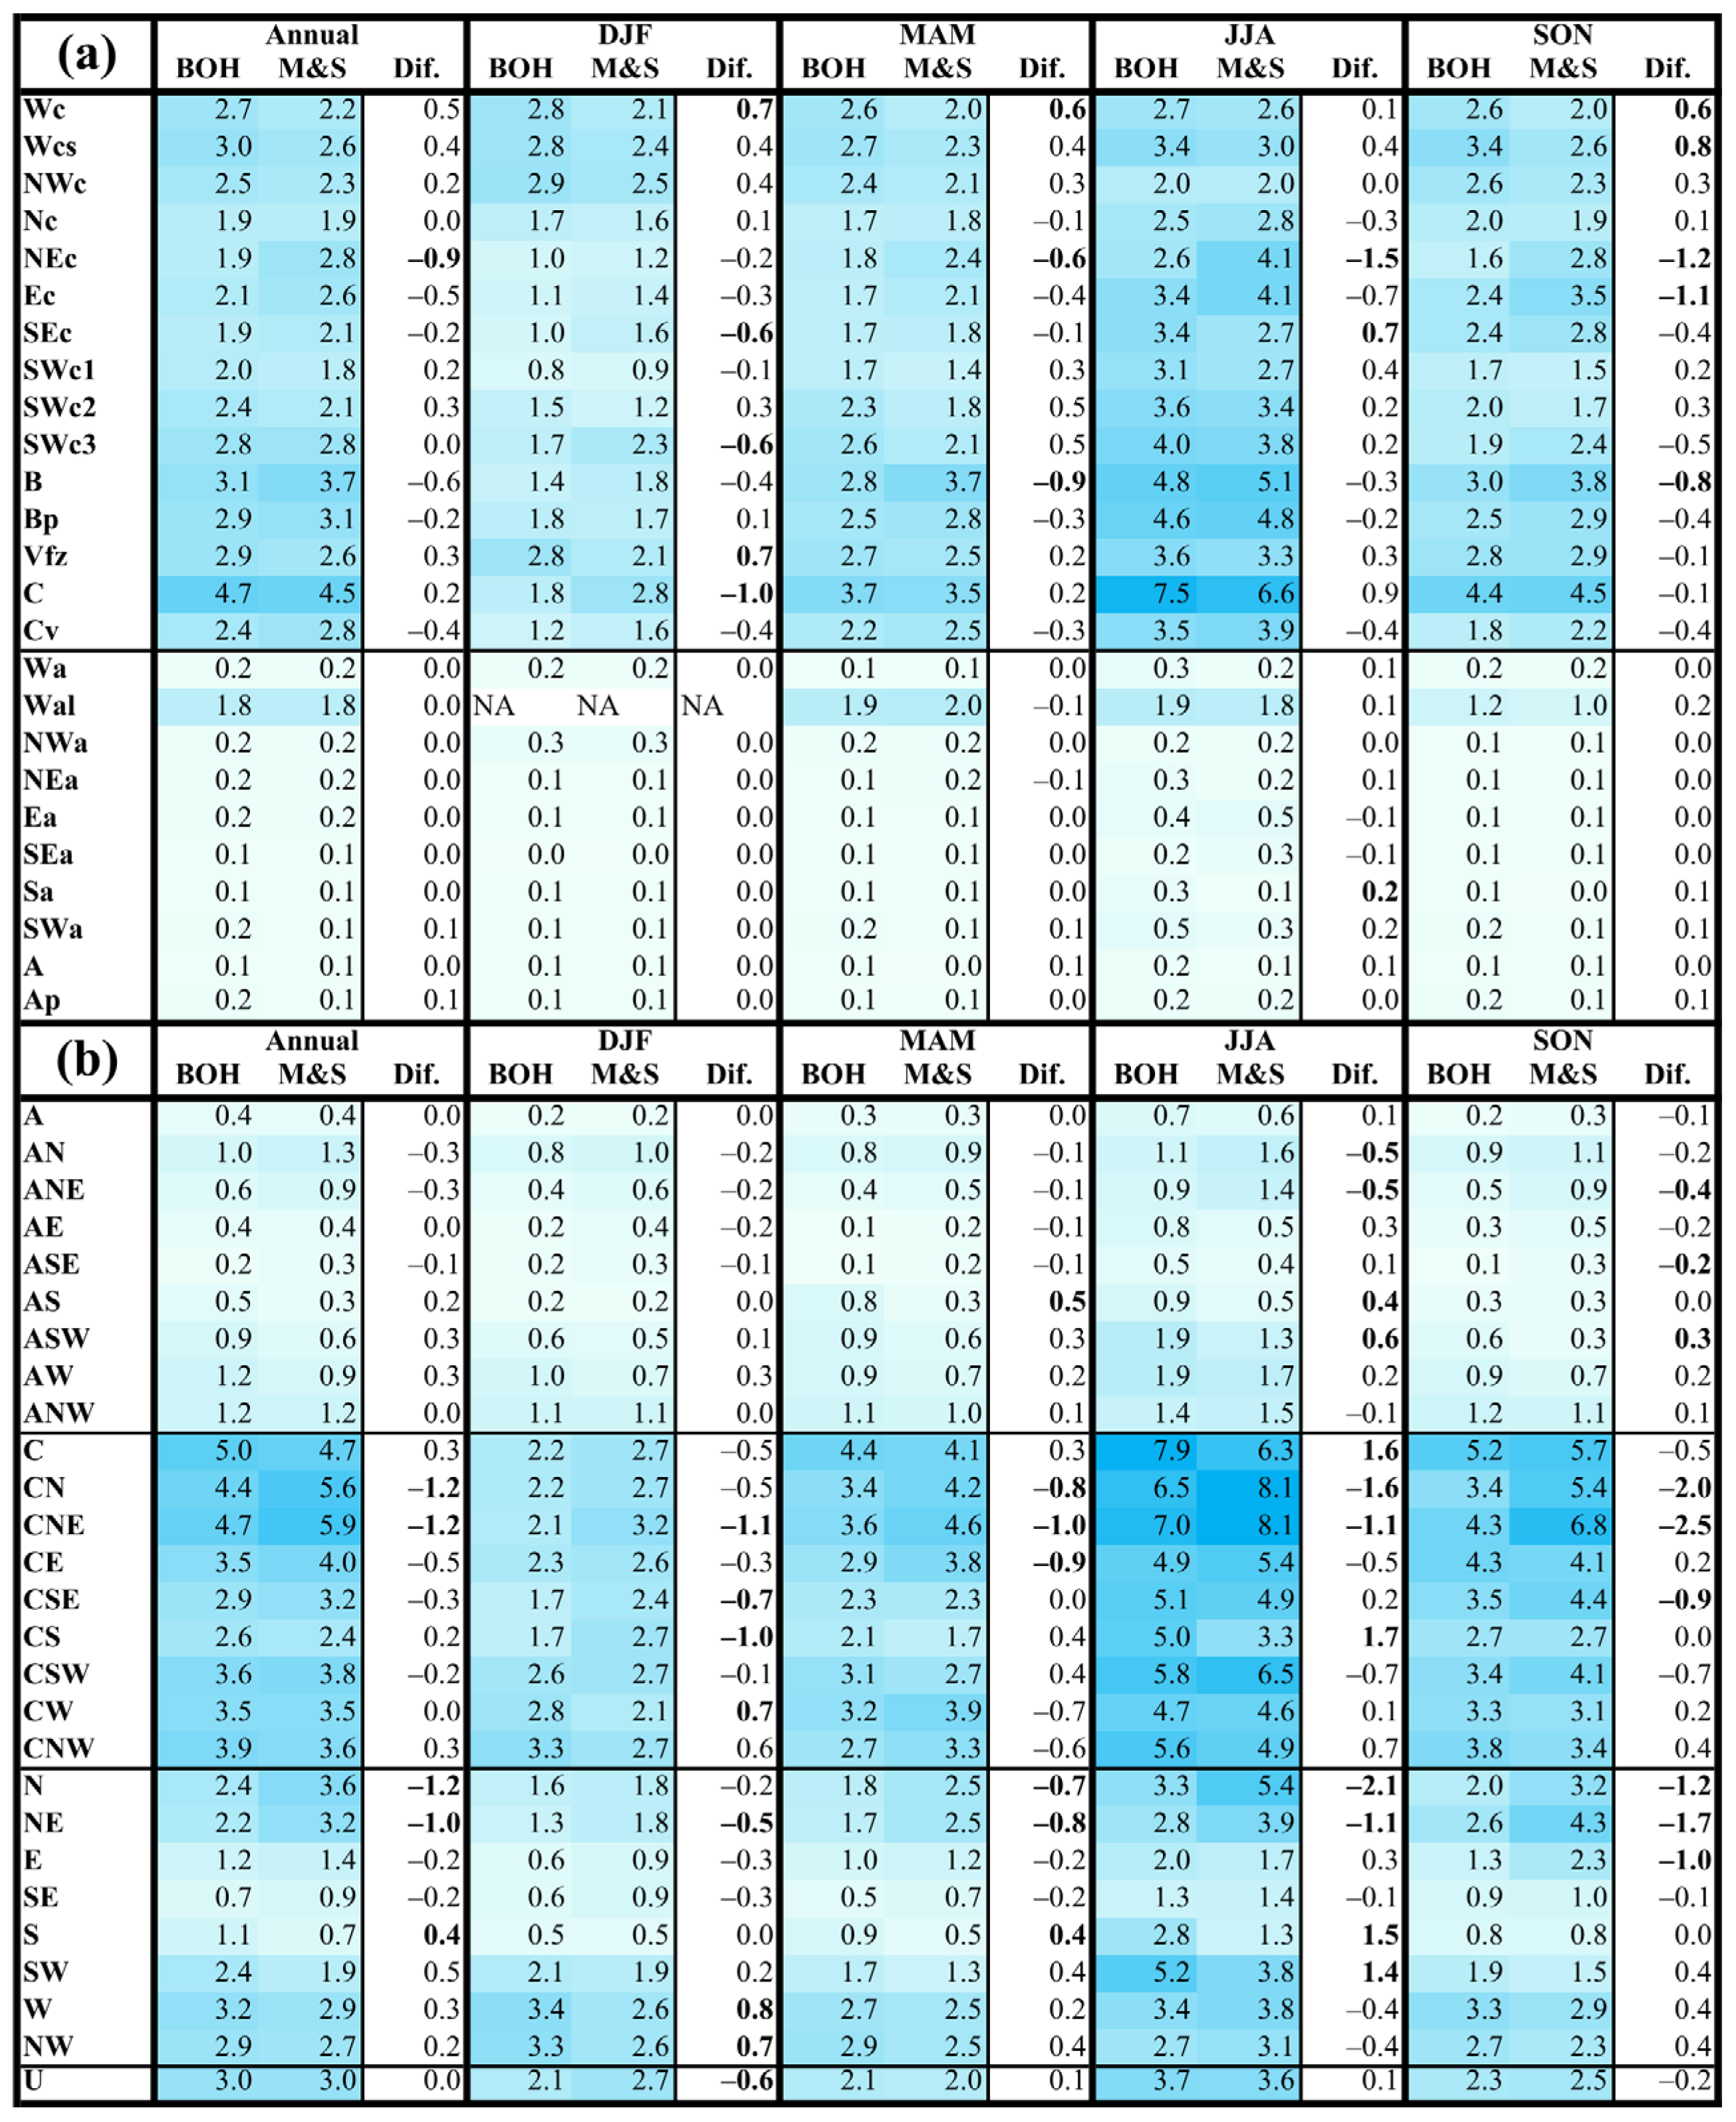
3.3. Mean Daily Precipitation of the Circulation Types

According to the CHMI classification, the mean daily precipitation total for the cyclonic types reached 2.6 mm in BOH and 2.7 mm in M&S (Figure 7a), while for the anticyclonic types, the total amount reached only 0.3 mm. In the various seasons, the mean totals for the cyclonic types fluctuated between 1.7 mm (DJF) and 3.6 mm (JJA) in BOH and between 1.8 mm (DJF) and 3.7 mm (JJA) in M&S. The mean daily totals for the individual anticyclonic types remained below 0.5 mm (except for type Wal with mean totals ranging from 1.0–2.0 mm).
Type C attained the highest daily totals throughout the year, at 4.7 mm in BOH and 4.5 mm in M&S (Figure 8a). The NWc, Wcs, Wc, and Vfz types exhibited the highest DJF mean daily totals in BOH, while in the other three seasons, type C dominated, followed mainly by types B, Bp, Vfz, and westerly cyclonic types. In M&S, type C attained the highest values in all seasons except MAM, when it was narrowly surpassed by type B. In addition to types B and Bp, types NEc and Ec attained high precipitation totals in JJA and SON, while westerly cyclonic types did so in DJF. Statistically significant annual differences in the mean daily precipitation totals between these two regions were detected only for the NEc type (higher totals in M&S), but in the individual seasons, statistically significant differences occurred for multiple types, particularly for the Wc type in DJF, MAM, and SON (higher in BOH) and the NEc type in MAM and JJA (higher totals in M&S).
Regarding the objective classification, the group of cyclonic types achieved the highest mean daily totals throughout the year (3.8 mm in BOH and 4.1 mm in M&S) and in all seasons except DJF, when the unclassified type U attained almost the same value in M&S (Figure 7b). The directional circulation types exhibited lower means (2.0 mm in BOH and 2.2 mm in M&S annually), with the values reaching roughly half of daily totals for the cyclonic types in all seasons, except in DJF when the totals for the directional types were closer to those for the cyclonic types. The anticyclonic types yielded mean daily totals of approximately 1.0 mm in JJA and approximately 0.5 mm in the remaining seasons.
In terms of the mean daily totals for the individual types (Figure 8b), type C exhibited the highest annual value of 5.0 mm in BOH, and type CNE attained the highest annual value of 5.9 mm in M&S. Both types also dominated in all seasons with a few exceptions. The highest means in DJF were achieved for types W, NW, and CNW in BOH, while in JJA, the CNE type was supplemented by the CN type in M&S. Statistically significant annual differences in the mean daily totals were detected for type S (larger differences in BOH) and for types CN, CNE, N, and NE (larger differences in M&S). Among the directional types, the significant differences detected for types NE, W, and NW in DJF and for types N, NE, S, and SW in JJA confirmed the importance of the southwest/northeast axes, as reported in Section 3.2.

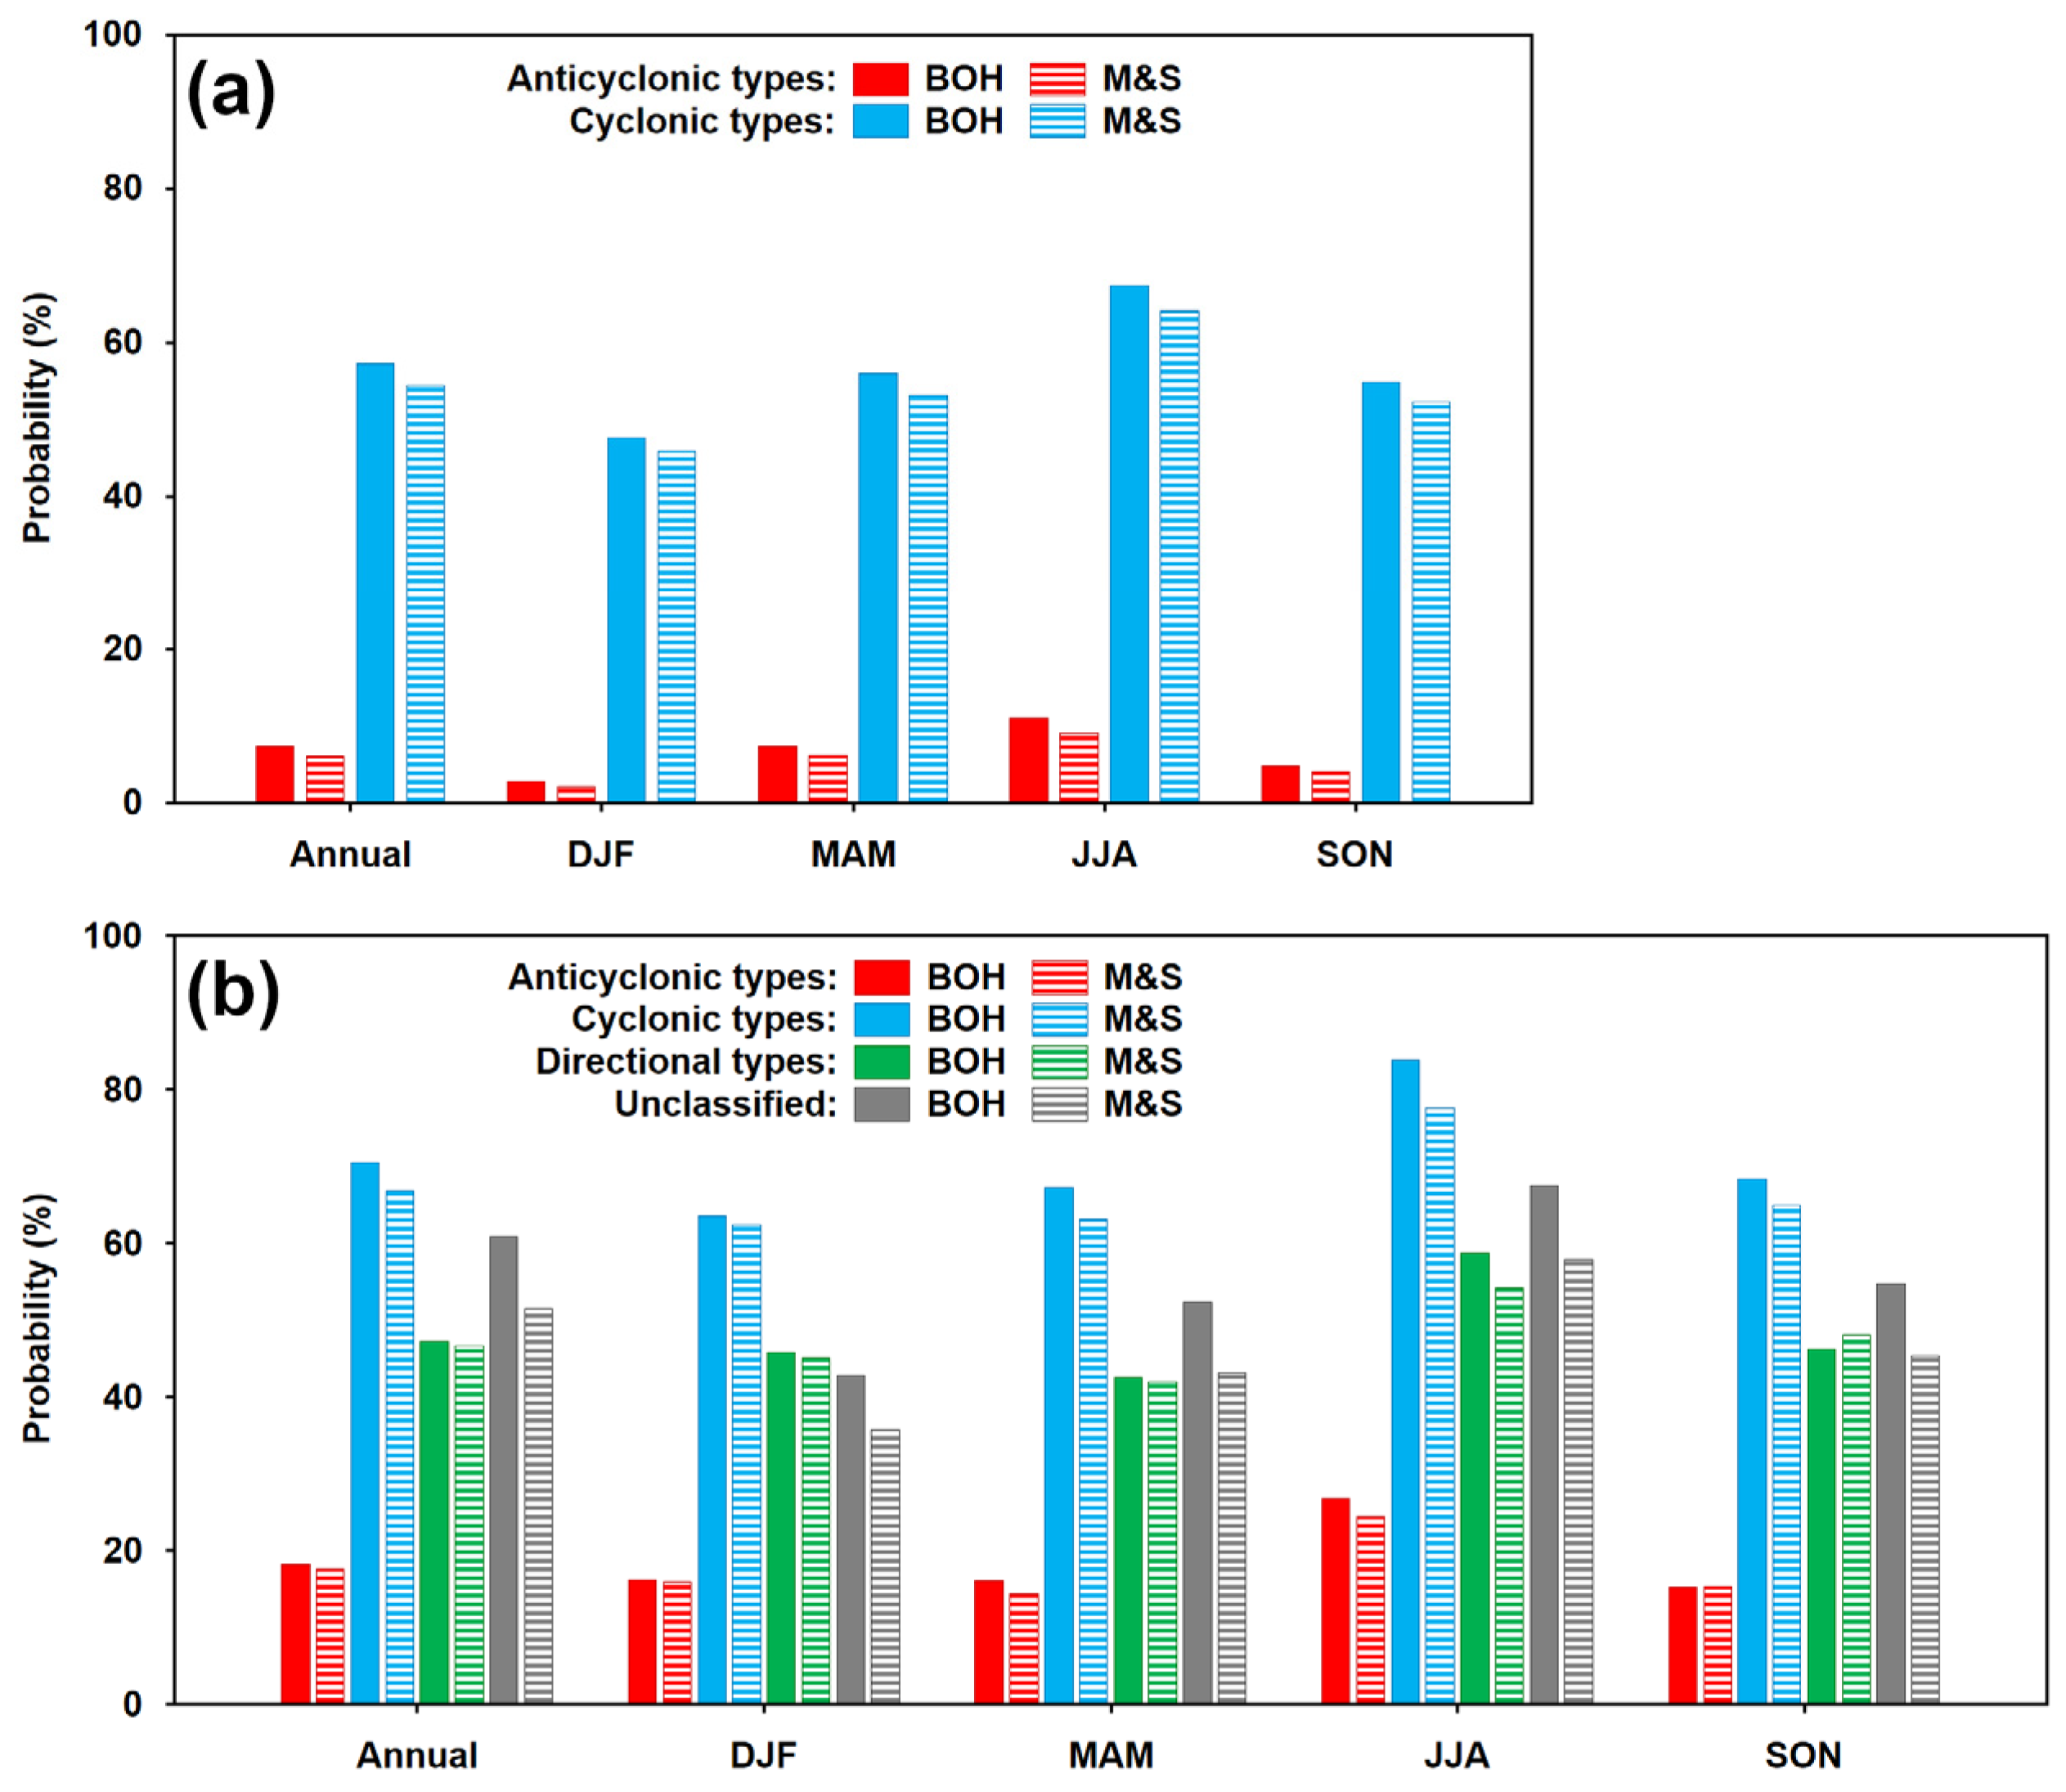
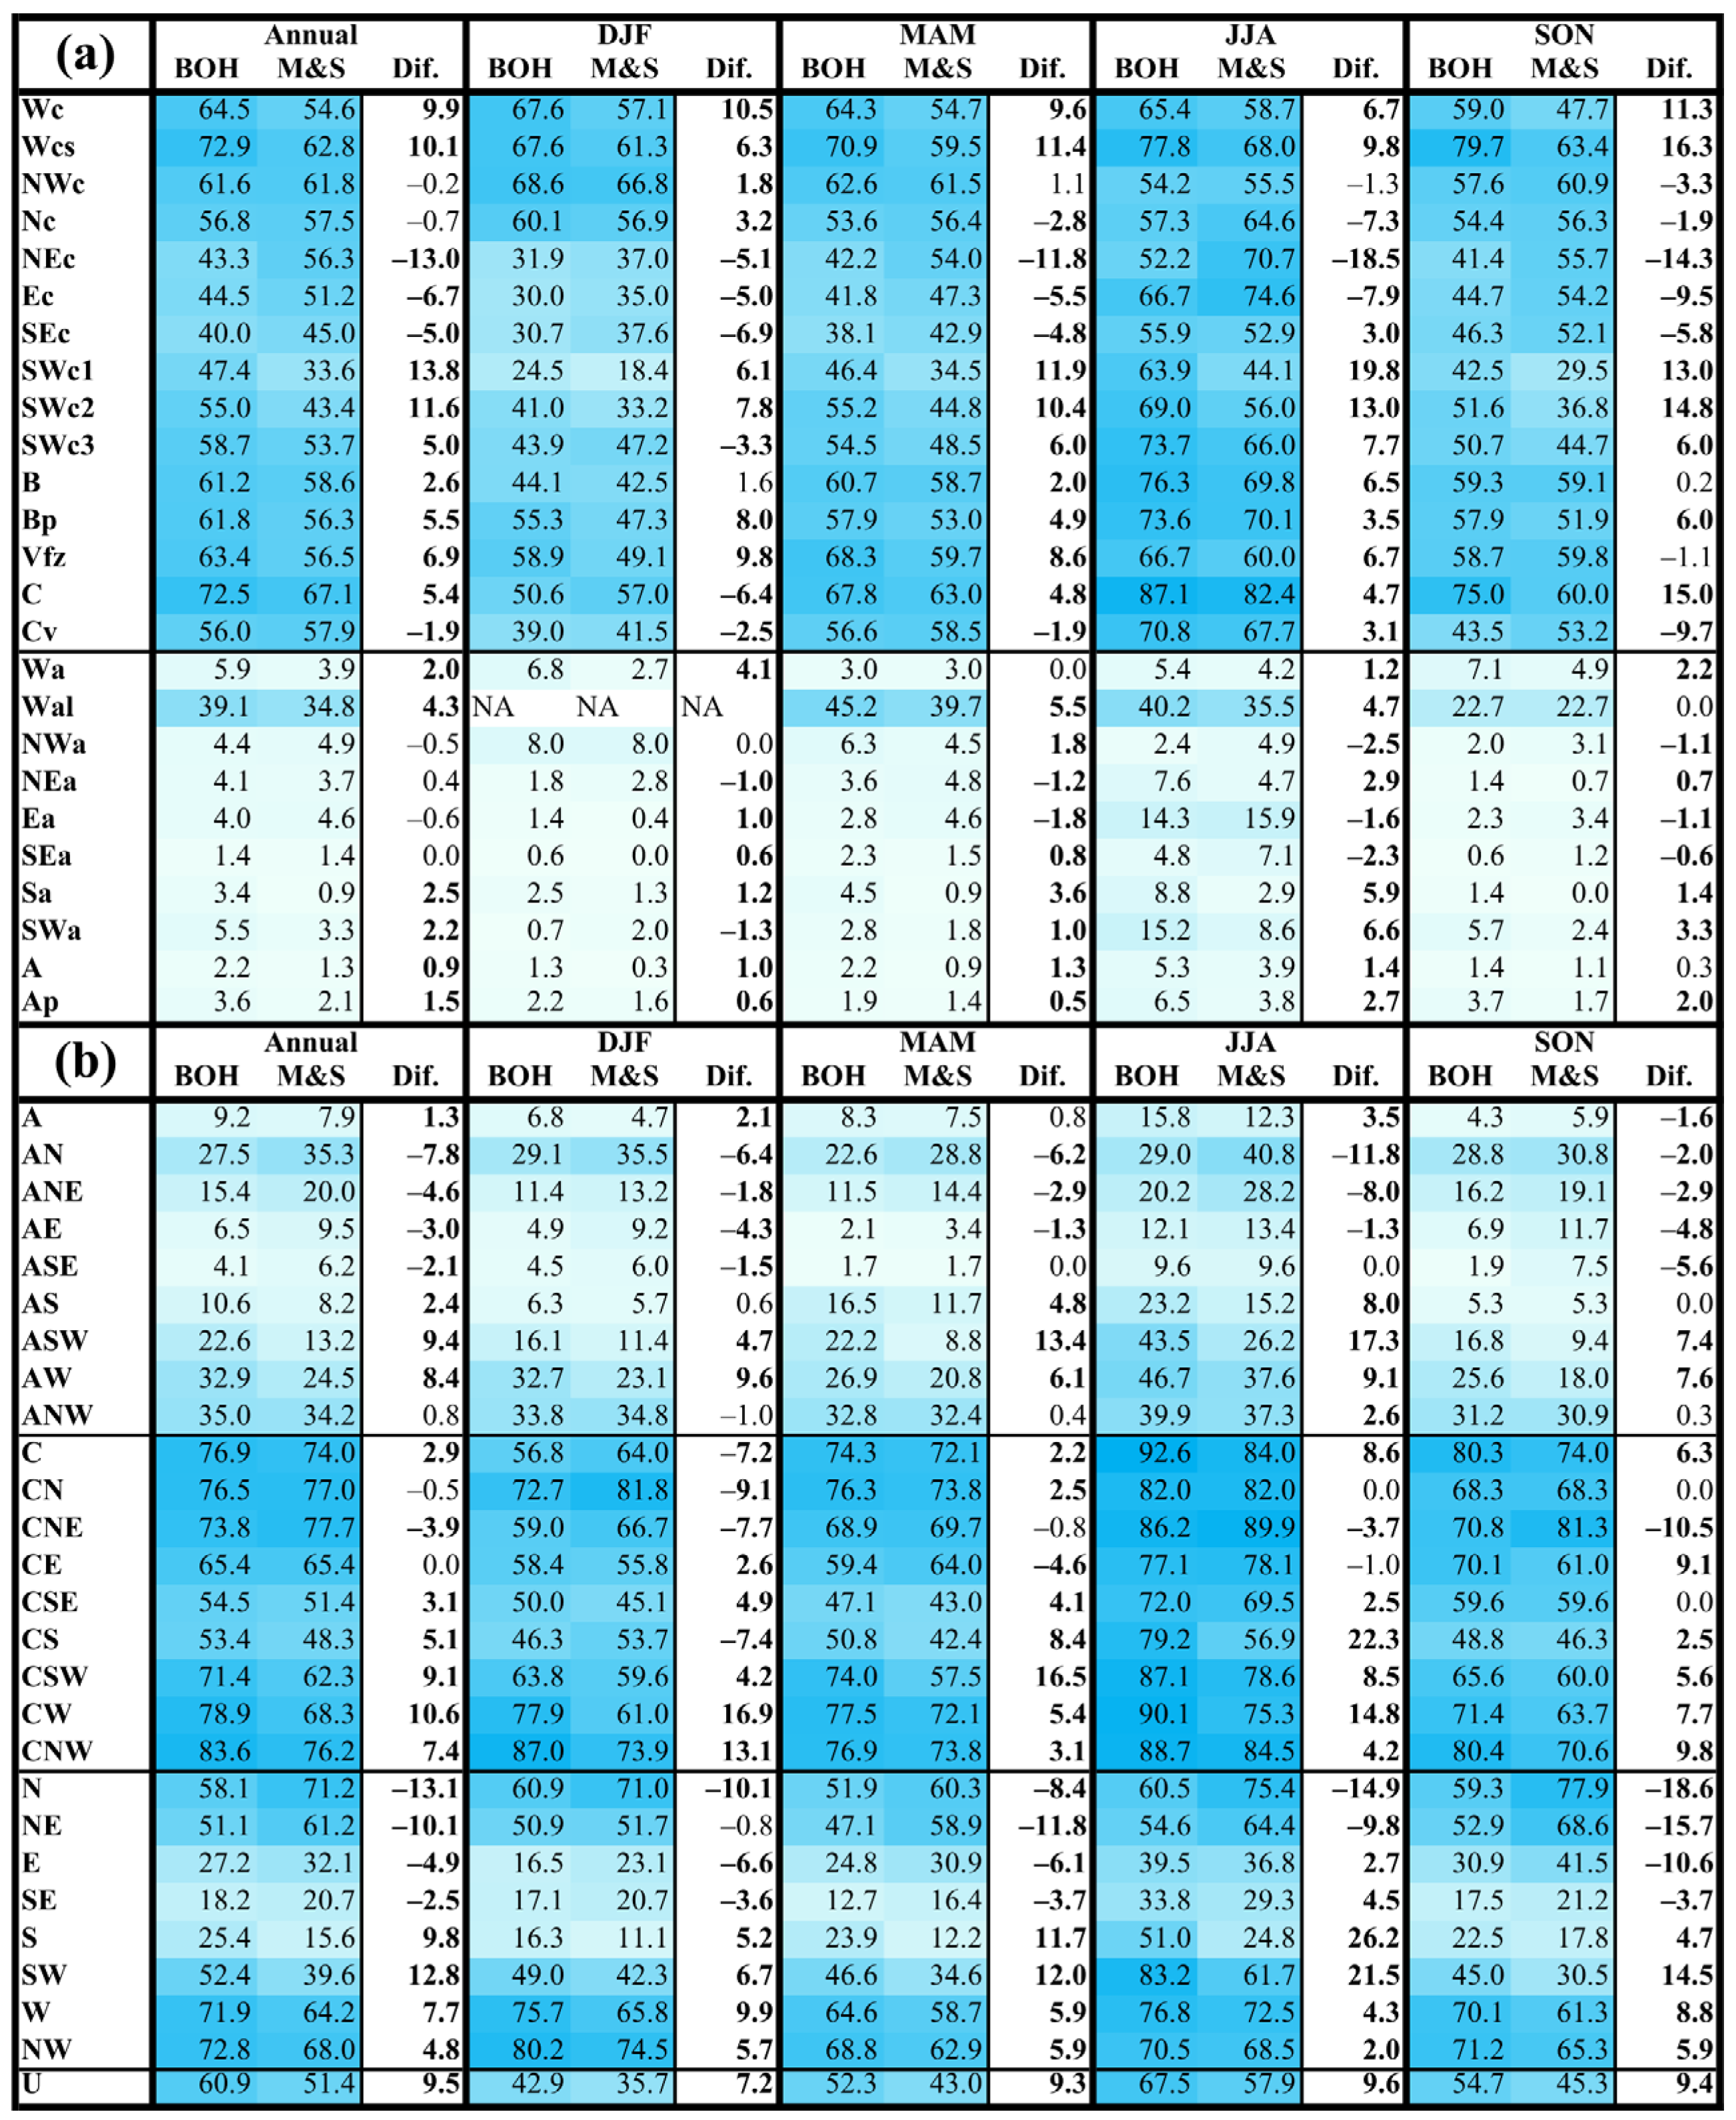
3.4. Precipitation Probability of the Circulation Types

The probabilities of days with precipitation totals ≥1.0 mm under the cyclonic types according to the CHMI classification reached 57.3% in BOH and 54.4% in M&S (Figure 9a), while under the anticyclonic types, the values were only 7.4% and 6.1%, respectively. In the various seasons, the precipitation probability under the cyclonic types fluctuated between 47.6% (DJF) and 67.4% (JJA) in BOH and between 45.9% (DJF) and 64.1% (JJA) in M&S. The precipitation probability for the individual anticyclonic types was lower than 20%, except for the Wal type, ranging from 22.7 to 45.2% (Figure 10a). In BOH, the highest annual precipitation probability was observed for the Wcs type (72.9%), while in M&S, the highest probability was observed for the C type (67.1%). The precipitation probability in DJF was the highest for the NWc type in both regions (though closely followed by types Wc and Wcs in BOH). Agreement between these two regions was also observed for the C type in JJA and the Wcs type in SON. Type Wcs also attained the highest precipitation probability during MAM in BOH, while type C dominated in M&S. The differences in the precipitation probability were the most distinct in JJA for the SWc1 and SWc2 types (higher by 19.8% and 13.0% in BOH) and for the NEc type (higher by 18.5% in M&S).
The group of cyclonic types under the objective classification attained the highest precipitation probability throughout the year (70.5% in BOH and 66.7% in M&S) and in all seasons (Figure 9b). Not considering the unclassified U type, the directional types attained the second highest annual precipitation probability (47.1% in BOH and 46.6% in M&S), while for the anticyclonic types, the precipitation probability reached only 18.2% and 17.7%, respectively. Among the individual circulation types, maximum values were achieved for the CNW type (83.6%) in BOH and for the CNE type (77.7%) in M&S. The differences between BOH and M&S were the most notable for the directional types, confirming the reported southwest/northeast contrast between BOH and M&S (Figure 10b). The majority of the differences in precipitation probability among the individual circulation types was statistically significant. The largest annual differences occurred for the SW, CW, and S types (higher probabilities in BOH) and for the N, NE, and AN types (higher probabilities in M&S). In the individual seasons, the largest differences in favor of BOH occurred in JJA, with maximum values of 26.2% (type S), 22.3% (type CS), and 21.5% (type SW). The largest differences in favor of M&S occurred in SON, with maximum values of 18.6% (type N) and 15.7% (type NE).

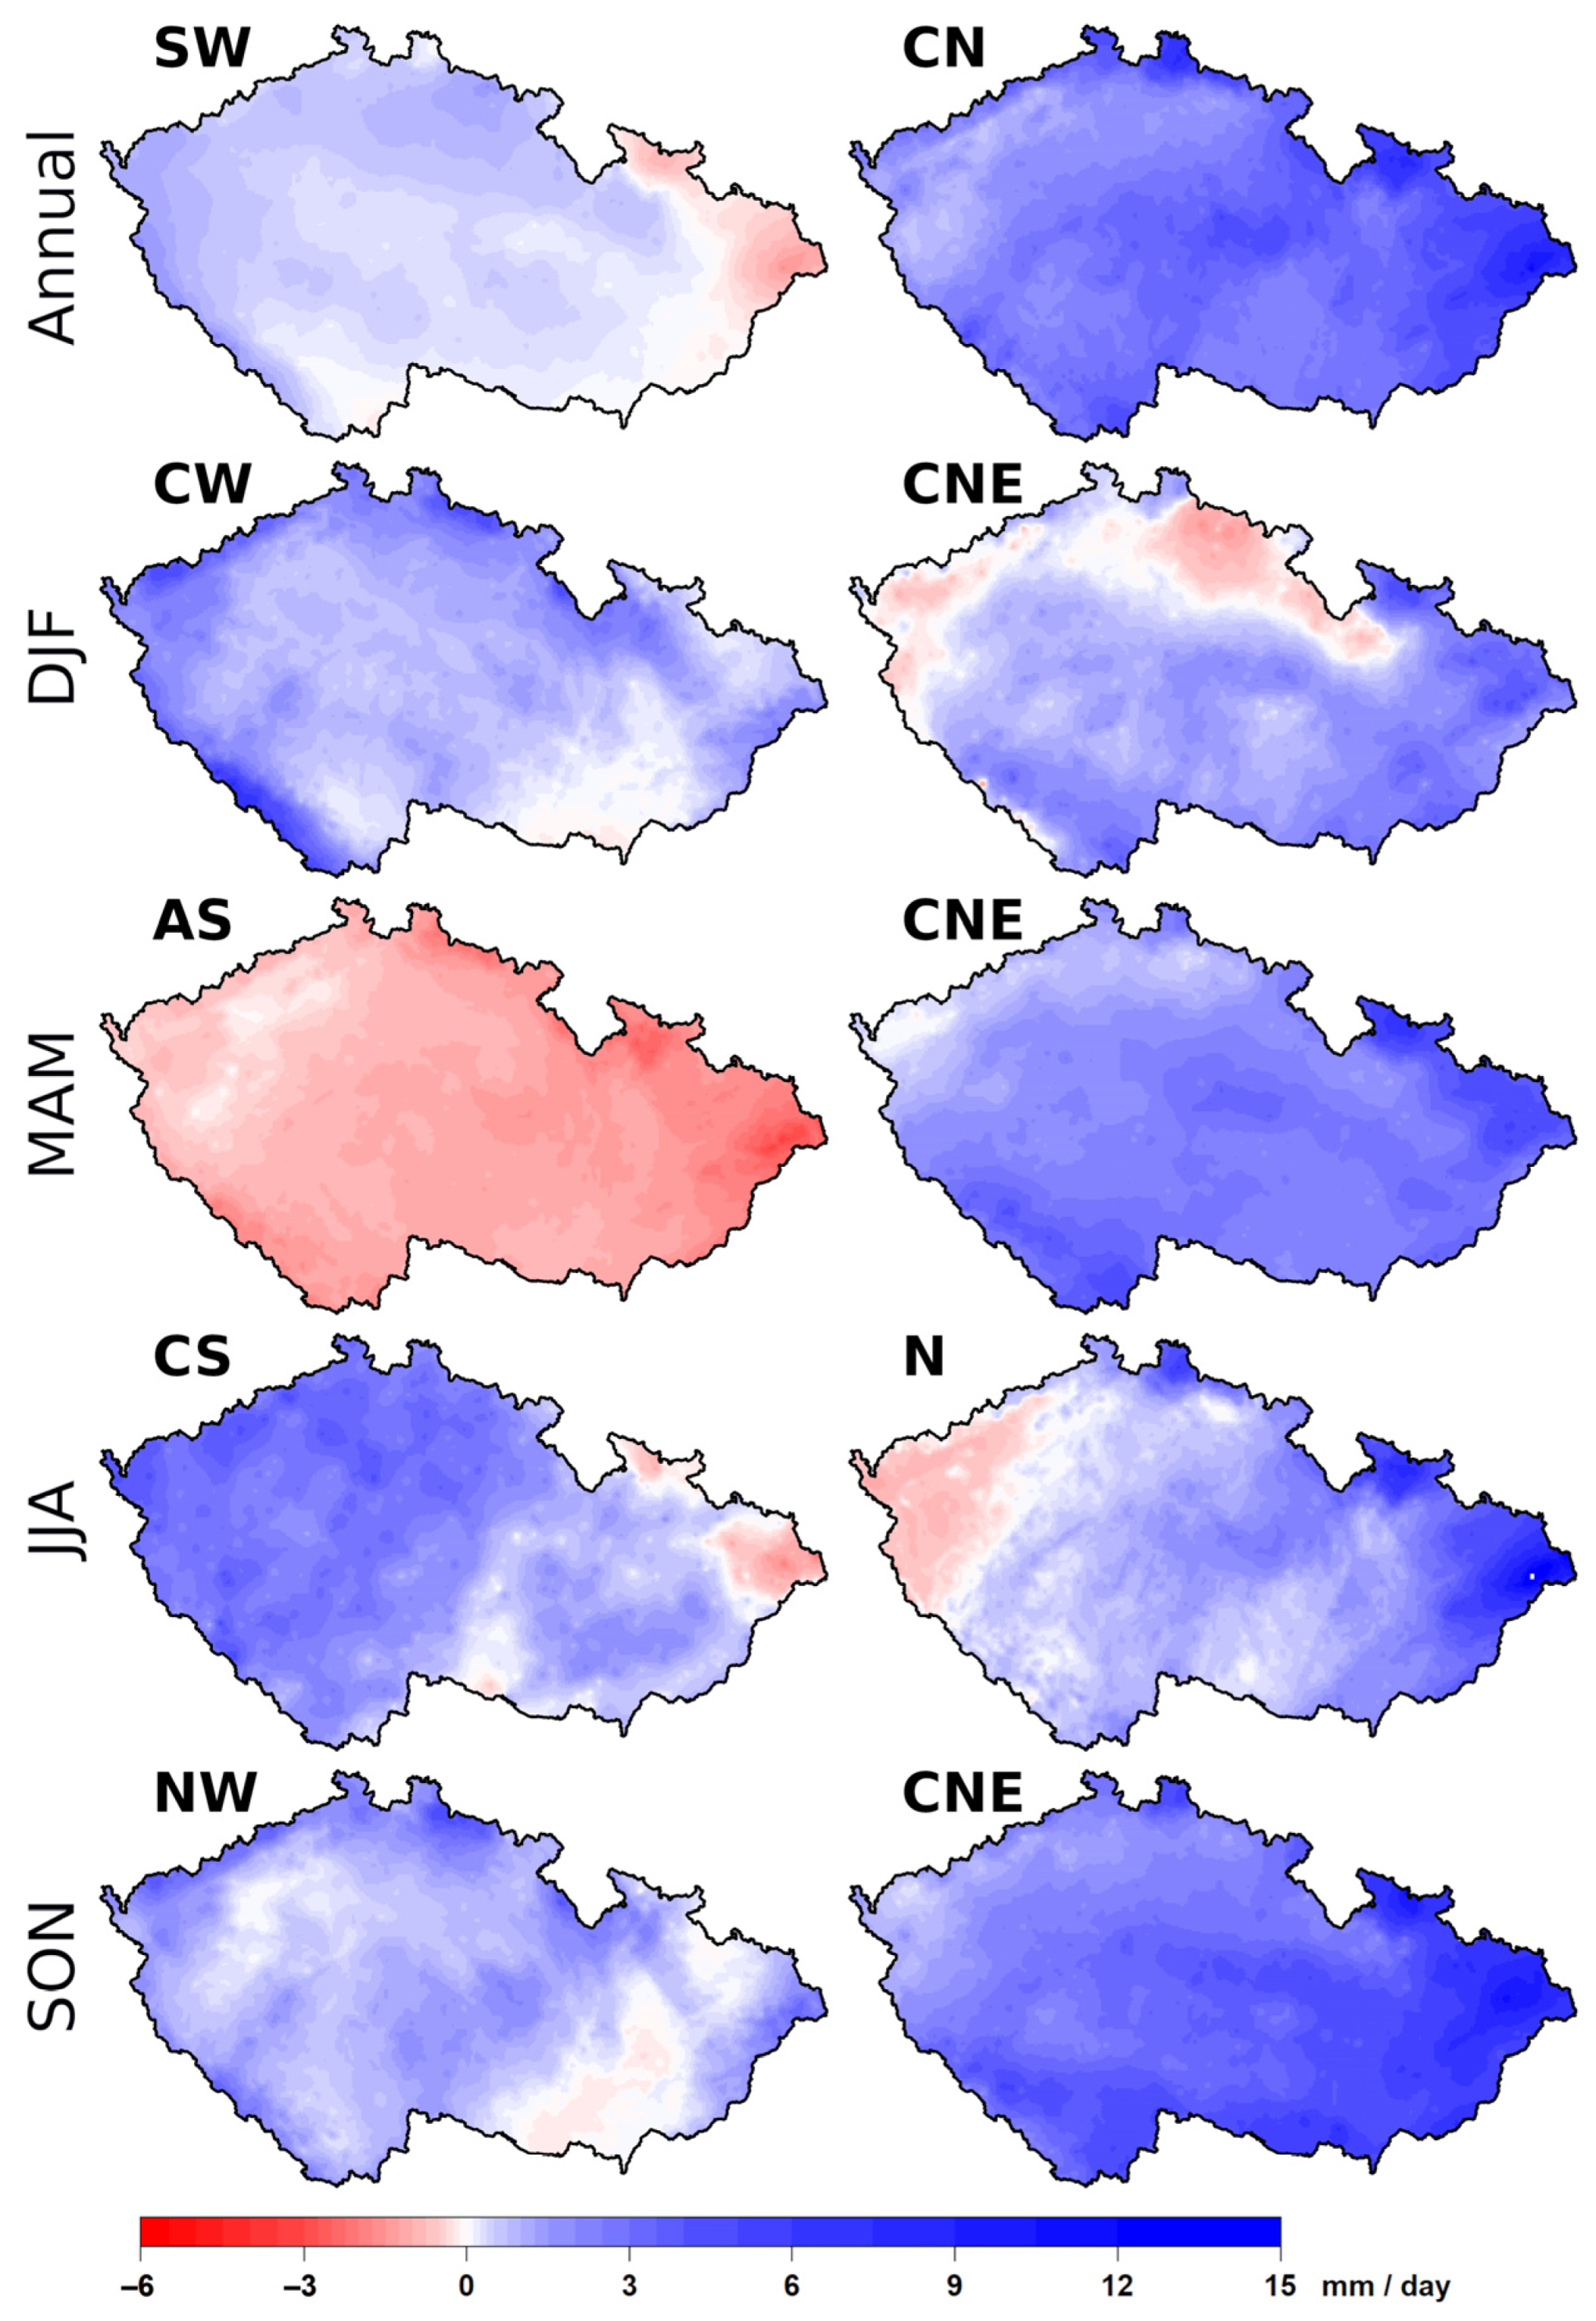
3.5. Spatial Distribution of Precipitation

To reveal the differences in the spatial distribution of the mean daily precipitation totals between BOH and M&S for the individual circulation types, those with the largest positive and negative differences between both regions throughout the year and in the four seasons under both classifications were selected (Table 1; Figure 11 and Figure 12).
Concerning the circulation types under the CHMI classification (Figure 11), type Wc caused the highest annual precipitation anomaly in the mountains in northern and southwestern BOH (please refer to Figure 1a for the physical geography of the Czech Republic), and the lowest anomaly was observed in the leeward areas with respect to the western airflow, especially in northeastern M&S. In contrast, the NEc type produced the highest anomalies, largely in the mountains in northern and northeastern M&S, while large areas with negative anomalies were observed in western and northwestern BOH.
Type Wc exhibited the largest differences in the mean daily totals in favor of BOH in DJF and MAM with a similar spatial distribution to that throughout the year, although there occurred a higher anomaly in DJF in general, and negative values were only detected in a small area (Figure 11). In addition, the NEc type caused the largest difference in favor of M&S in JJA and SON with a similar distribution to the annual distribution, but with a higher west–east gradient in JJA. Type C revealed different patterns of the spatial distribution between the two parts of the Czech Republic. In DJF, a much higher anomaly occurred in M&S with a more homogeneous spatial distribution, and the lowest anomalies were observed in the mountains and western part of BOH. In contrast, type C transported more precipitation to BOH in JJA, with the lowest anomalies observed in the lowlands of M&S. Slight effects of the orography occurred for type B in MAM, favoring the daily totals in M&S, producing above-mean totals across the entire Czech Republic, but an increasing west–east precipitation gradient was generated. The Wcs type, causing the largest difference in favor of BOH during SON, exhibited a very similar spatial distribution to that of the Wc type but with slightly higher values of the anomalies.
Among the circulation types under the objective classification (Figure 12), the SW type, producing above-mean annual totals across BOH, exhibited the highest anomalies near the western and northern borders, while the lowest negative anomalies occurred in northeastern M&S. The CN type, with generally much higher annual anomalies in M&S, exhibited the lowest anomalies in the leeward parts of the mountains along the northwestern border of BOH, while the highest anomalies occurred in windward mountain ranges and in the lowlands of eastern M&S.
Four circulation types favored BOH over M&S in the individual seasons (Figure 12). In DJF, the CW type exhibited positive precipitation anomalies everywhere except in southern M&S with around-mean values. The anomalies were the highest in the windward mountain areas of BOH and slightly lower in the mountains of M&S. In MAM, the AS type yielded below-mean totals everywhere except certain areas in western BOH. The lowest anomalies occurred in northeastern M&S. In JJA, the CS type exhibited relatively evenly distributed and notably above-mean totals across BOH, while the lower anomalies detected in M&S indicated local maxima in the central part and negative anomalies in northeastern areas, located leeward of the southern airflow. In SON, the NW type exhibited good orographic effects characterized by the lowest anomalies near zero in the lowlands of M&S and the highest anomalies in the northern mountains of BOH.
Among the individual seasons, the most remarkable circulation type was the CNE type, favoring M&S (Figure 12). In DJF, this type contributed to the highest anomalies in both eastern and northeastern M&S but with comparable values in south BOH, while negative anomalies occurred in the northern and western parts of BOH. A similar spatial distribution also occurred in MAM, but the anomalies were generally higher, and the orographic gradients were lower, with around-mean precipitation totals at the western edge of BOH but above-mean totals elsewhere. An analogous pattern also characterized the daily precipitation for this type in SON, but the anomalies detected in eastern M&S were even higher. Only in JJA did type N dominate, indicating the most distinct west–east gradient with below-mean daily totals in western BOH and extremely high anomalies in the mountains and lowlands of the northern and northeastern part of M&S.

4. Discussion

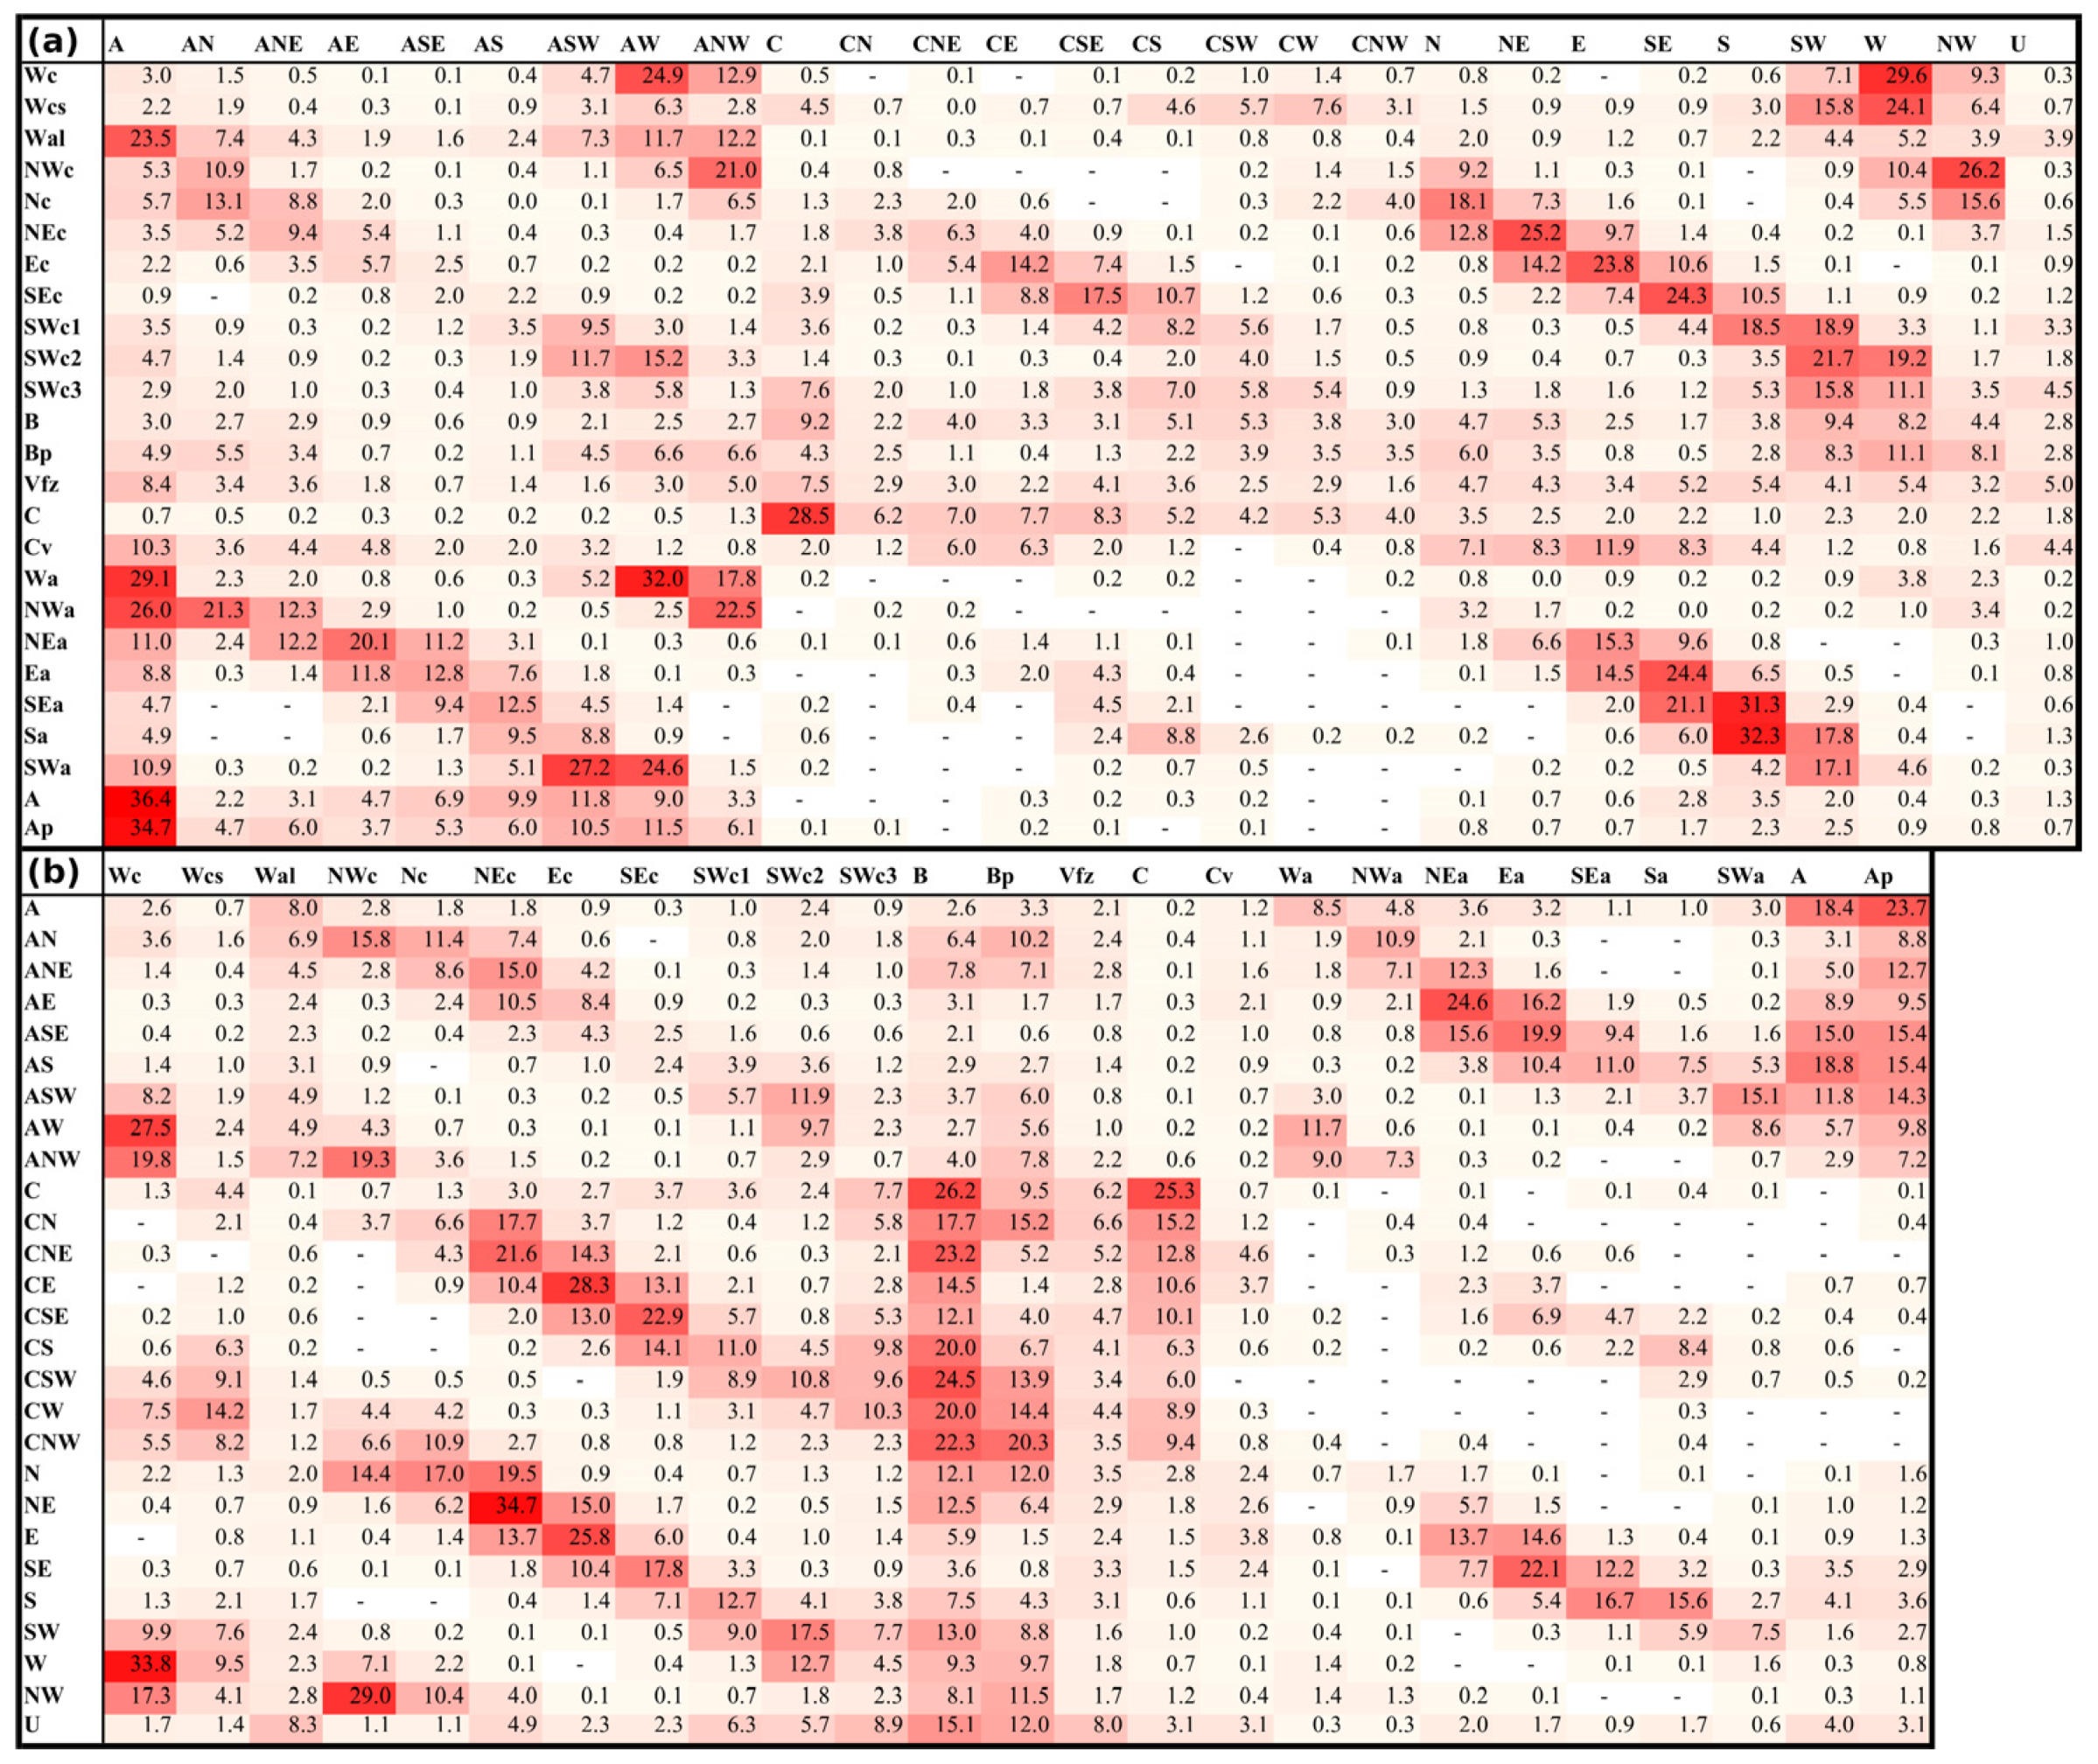
4.1. Comparison of the Subjective and Objective Classifications

To identify coinciding circulation types between the two classifications used, the daily occurrence of the groups of anticyclonic and cyclonic types under the CHMI classification was compared to that of the group of circulation types under the objective classification (Table 2). Based on 7505 days with anticyclonic types under the CHMI classification, more than two-thirds of these days (70.7%) agreed with the anticyclonic types under the objective classification, while one-quarter of these days (25.0%) was classified as directional types. More days characterized by cyclonic types under the CHMI classification (14,393 days, i.e., 65.7% of all days during the 1961–2020 period) were split particularly into directional types (44.9%), followed by anticyclonic (29.2%) and cyclonic (24.0%) types under the objective classification. In contrast, the vast majority of days characterized by cyclonic types (93.4%) under the objective classification was also characterized by cyclonic types under the CHMI classification. Concerning the directional types, 77.5% of the corresponding days agreed with days characterized by cyclonic types under the CHMI classification. The most remarkable phenomenon was the division of days characterized by anticyclonic types under the objective classification into days characterized by anticyclonic types (55.8%) and cyclonic types (44.2%) under the CHMI classification.
Considering the schematic maps of the individual circulation types (Figure A1 and Figure A2), many of the CHMI cyclonic types exhibited a mean SLP field very similar to that of a corresponding directional type, e.g., NEc vs. NE or NWc vs. NW. However, this similarity could be misleading because only 44.9% of the days characterized by CHMI cyclonic types coincided with the directional types (Table 2). Considering the individual types, the coincidence was even lower. For example, in terms of the CHMI NEc type, only 25.2% of the corresponding days were classified as the NE type under the objective classification (Figure 13a) and in the case of NWc type, 25.2% of the corresponding days were classified as the NW type under the objective classification. This suggests that the similarity in the mean SLP field between the CHMI-based cyclonic and objective classification-based directional types was partially the result of the broad definition of the CHMI-based cyclonic types. This included those days classified into any of the groups under the objective classification, which averaged the SLP field for the CHMI-based cyclonic types with similar compositions to those of a much smaller group of days characterized by the objective classification-based directional types. As presented in Section 3.2, Section 3.3 and Section 3.4, the CHMI approach allowed us to divide all types into two groups of precipitation-rich (the cyclonic and Wal types) and precipitation-poor circulation types (the remaining anticyclonic types). This was achieved by classifying every situation with a frontal system reaching the Czech Republic as a cyclonic circulation system, even when an anticyclone center was located closer to the Czech Republic than was a cyclone center and the isobars were convex in the area. This raises the question whether this approach overly categorizes different synoptic situations into one circulation type. The differences between low-, moderate-, and high-precipitation situations cannot be considered.
Concerning the individual types under the CHMI classification, a few types did not follow the basic scheme of the airflow direction and (anti)cyclonality. Type Wal (the summer variant of the western anticyclonic type) was the only precipitation-rich anticyclonic type, occurring only in the summer half-year (April–September), with a higher occurrence frequency only in JJA (11.0%, Figure 4). In 23.5% of all cases, the Wal type coincided with the A type under the objective classification, while in 12.2% of all cases, it coincided with the ANW type, and in 11.7% of all cases, it coincided with the AW type (Figure 13a). This corresponds to a mean SLP map (Figure A1) with a higher-pressure area near the Czech Republic but with the anticyclone center located more to the west. One reason for the high precipitation totals under this anticyclonic type entails the frequent convective activities when a more humid airflow stemming from the west is combined with higher temperatures, typical of the anticyclonic types in JJA.
The other specific CHMI types, type B (trough over Central Europe) and type Bp (travelling trough), typically included situations with a higher pressure both east and west of Central Europe and a low-pressure trough across Central Europe. Both types jointly contributed to 25.4% of the precipitation totals in BOH and 28.8% in M&S (Figure 6). An absence of comparable types under the objective classification could be considered a flaw. In contrast, the variability in situations classified as either type B or Bp was very high, including those with a cyclone located north (more frequent) and south of the Czech Republic. The high variability in objective classification-based circulation types coinciding with types B and Bp (Figure 13a) indicated that these types were not delimited as very homogenous types. This agrees with James [22], who found systematic differences between the objective and original GWL Hess–Brezowsky series. While the original series was strongly focused on Central Europe and attained a certain level of subjectivity, the objective series viewed regimes on a larger spatial scale. Similarly, the CHMI classification also included very locally specific types, in contrast to the objective classification.
The CHMI Cv type (upper cyclone) is the only type considering pressure systems in the upper layers of the troposphere. This occurs most often during eastern airflows (the highest coincidence was observed with types E, A, NE, and SE under the objective classification, as shown in Figure 13a). This helped to eliminate precipitation-rich situations from the group of anticyclonic types under the CHMI classification. However, only one circulation type was defined based on pressure systems in the upper layers, while the remaining classification only relied on the SLP field composition, which could be considered a nonsystematic classification approach.
Contrary to the CHMI classification, the types under the objective classification were more evenly distributed into groups. The cyclonic types occurred less frequently than did the anticyclonic and directional types because only situations with a cyclone located very close to the territory of the Czech Republic were included (Figure A2), which happened less frequently. The individual types were defined systematically by an algorithm, thereby leaving 1.6% as the unclassified U type in cases when both the airflow strength and vorticity were very low [46]. This occurred most often in JJA (3.6%), which was related to the generally lower-pressure gradients during this period. Type U mostly included situations with very indistinct SLP fields (as shown in Figure A2). However, in 77.1% of all cases, this type coincided with the CHMI cyclonic types, often types with less distinct mean SLP fields (types B, Vfz, and SWc3; Figure A1), and with the Wal type (Figure 13b). This explains why type U attained quite high mean daily precipitation totals (Section 3.3).
While the objective classification, which relied on an algorithm to calculate relevant parameters based on SLP fields, guaranteed consistency throughout the entire 60-year period, under the CHMI classification, this was more difficult. This classification was developed with the traditional subjective approach involving synoptic situation assessments by several generations of synoptic meteorologists under possible shifts in classification procedures and without retrospective reclassification of the whole period. Considering the 1961–2020 period, for example, disputable behavior was observed between two couples of similar circulation types (Figure 14). Type A (anticyclone over Central Europe) exhibited a statistically significant decreasing linear trend (according to a t-test at the 0.05 significance level) of −3.8 days/10 years during this period, while type Ap (travelling anticyclone) attained a statistically significant increasing trend of 4.3 days/10 years. Similarly, type B exhibited a decreasing linear trend of −1.9 days/10 years, while type Bp attained a statistically significant increasing trend of 5.1 days/10 years. Because the only difference between these couples involved whether the related pressure system was labelled as a travelling system, it could not be excluded that this occurred due to the inconsistency in classification between these types. Although our study did not identify any serious problems, this aspect should be considered when applying the CHMI types to calculate long-term trends in circulation patterns.

4.2. Precipitation Differences between Bohemia and Moravia and Silesia

As mentioned by Brázdil et al. [52], the variability in precipitation totals across the territory of the Czech Republic is influenced by a number of meteorological and physical–geographical factors. In the first group of factors, the pathways of weather systems (highs, lows, and fronts), origin of the air-mass inflow (the Atlantic Ocean, the Mediterranean, or Eurasia) and type of precipitation (continuous rain or intermittent showers) are worthy of particular consideration. In the second group, the location of a given place with respect to the airflow and the orography (altitude, leeward and windward effects) are particularly important. More consistent circulation effects with prevailing stratiform precipitation occurred in months of the winter half-year, while in months of the summer half-year, less stable circulation and a higher proportion of convective precipitation were typical. According to Rulfová et al. [53], stratiform precipitation predominates over convective precipitation in the Czech Republic in all seasons except JJA. Moreover, the totals of stratiform precipitation typically increase with increasing altitude at a far higher rate than do the totals of convective precipitation in nearly all seasons.
Comparing the precipitation in BOH and M&S during the 1961–2020 period, a slightly higher precipitation continentality was observed based on the index of precipitation seasonality proposed by Markham [54], namely, 17.6% in BOH and 20.1% in M&S. However, the percentage seasonal differences in their annual totals were relatively negligible (0.4% in MAM and 0.3% in JJA in favor of M&S, and 0.2% in SON in favor of BOH). Only the DJF totals were 1.4% higher in BOH than those in M&S.
According to the objective classification, the main precipitation differences between BOH and M&S were primarily evident along the west–east axis in DJF, shifting more towards the north–south axis in JJA. This is documented by the precipitation characteristics provided in Section 3.2, Section 3.3 and Section 3.4, with the most distinct differences found in the case of the directional types. This shift could be related to the more frequent zonal circulation in DJF [37]. Statistically significant differences between BOH and M&S were more frequently detected for the circulation types under the objective classification than for those under the CHMI classification, which is generally less focused on the airflow direction. Precipitation under the CHMI types with the largest differences often revealed similar spatial distribution patterns to those exhibited by the types under the objective classification (Section 3.5). The mountain areas exhibited the largest precipitation deviations, but their leeward effects on the large mid-lowland areas were often even more important in terms of the overall precipitation totals in BOH or M&S. Despite the differences between these two regions, the spatial distribution can be more complicated in the neighboring areas. This suggests that the lowland–mountain gradient partially coincides with the western–eastern gradient and reduces the overall BOH–M&S differences.
An unusual pattern was observed for type C (cyclone over Central Europe) under both classifications, causing much higher totals in M&S during DJF and much higher totals in BOH during JJA. This could be explained by the humidity of the transported air masses. In DJF, Mediterranean air masses carried by a cyclonic system were wetter than those originating from the Atlantic Ocean. The opposite situation occurred in JJA. In the case of cyclones travelling across the territory of the Czech Republic, a frontal boundary between these two air masses was often located over the Czech Republic. Changes in the spatial distribution of precipitation between the seasons also occurred for the other circulation types but were not as pronounced as those for type C.

5. Conclusions

The results of precipitation analysis in the eastern and western parts of the Czech Republic in regard to the subjective and objective classifications of circulation types during the 1961–2020 period can be summarized as follows:
(i) The highest precipitation proportions were observed for types Wc and B under the CHMI classification and for types W and SW under the objective classification. All of these types exhibited a strong seasonality. Statistically significant differences in the precipitation proportions between BOH and M&S were more frequently detected for the circulation types under the objective classification than for those under the CHMI classification.
(ii) According to the CHMI classification, the mean daily precipitation totals were the highest for type C in both regions. Under the objective classification, this applied only to BOH, while the CNE type was the most important in M&S.
(iii) The probability of days with daily precipitation totals ≥ 1.0 mm was the highest for type C under the CHMI classification, while under the objective classification, the probabilities were the highest for the CNW type in BOH and the CNE type in M&S.
(iv) The main precipitation differences between BOH and M&S occurred on the west–east axis during DJF but were shifted more towards the north–south axis during JJA. Generally, the types with a southwestern airflow transported more precipitation to BOH, while those with a northeastern airflow transported more precipitation to M&S. This pattern was more distinct under the objective classification, while the CHMI classification further suggested specific (locally focused) types with a trough in Central Europe, causing more precipitation in M&S than in BOH.
(v) The windward/leeward effects in the mountain areas were prominent in determining the spatial distribution of precipitation for the individual circulation types, causing most of the difference between BOH and M&S.
(vi) The CHMI classification suitably distinguished precipitation-rich and precipitation-poor types but did not distinguish these types in detail according to the position of pressure systems and did not sufficiently capture the effect of the airflow direction on precipitation. Because of concerns regarding the consistency of the classification process, the CHMI classification seems to be less suitable for the study of long-term changes in circulation patterns. The circulation types under the objective classification, divided into three groups, are structured more clearly and consistently to suitably express the effects of the airflow direction on precipitation. However, the objective classification does not define specific, locally focused circulation types.

Author Contributions

Conceptualization, J.Ř. and R.B.; methodology, J.Ř., R.B. and O.L.; formal analysis, J.Ř.; data curation, J.B., P.Š. and P.Z.; writing, review, and editing, J.Ř., R.B., O.L. and M.T.; visualization, J.Ř. All authors have read and agreed to the published version of the manuscript.

Funding

This research was funded by the Ministry of Education, Youth and Sports of the Czech Republic for SustES—Adaptation strategies for sustainable ecosystem services and food security under adverse environmental conditions project ref. CZ.02.1.01/0.0/0.0/16_019/0000797. J.Ř. also received funding from Masaryk University within the MUNI/A/1570/2020.

Data Availability Statement

Data set available on request to corresponding authors.

Conflicts of Interest

The authors declare no conflict of interest.

Appendix A

Figure A1. Mean SLP fields for the 25 circulation types under the CHMI classification [31,49] created for the 1961–2020 period. Types: C, cyclone over Central Europe; Nc, north cyclonic; NEc, northeast cyclonic; Ec, east cyclonic; SEc, southeast cyclonic; SWc1, southwest cyclonic of the 1st type; SWc2, southwest cyclonic of the 2nd type; SWc3, southwest cyclonic of the 3rd type; Wc, west cyclonic; Wcs, west cyclonic with southern pathway; NWc, northwest cyclonic; B, trough over Central Europe; Bp, travelling trough; Vfz, entry of the frontal zone; Cv, upper cyclone; NEa, northeast anticyclonic; Ea, east anticyclonic; SEa, southeast anticyclonic; Sa, south anticyclonic; SWa, southwest anticyclonic; Wa, west anticyclonic; Wal, west anticyclonic of summer type; NWa, northwest anticyclonic; A, anticyclone over Central Europe; Ap, travelling anticyclone.
Atmosphere 12 01536 g0a1
Figure A2. Mean SLP fields for the 27 objectively derived circulation types (centered on the geographic midpoint of the Czech Republic—red point) created for the 1961–2020 period. Types: A, centered anticyclone; AN, anticyclonic northern; ANE, anticyclonic northeastern; AE, anticyclonic eastern; ASE, anticyclonic southeastern; AS, anticyclonic southern; ASW, anticyclonic southwestern; AW, anticyclonic western; ANW, anticyclonic northwestern; C, centered cyclone; CN, cyclonic northern; CNE, cyclonic northeastern; CE, cyclonic eastern; CSE, cyclonic southeastern; CS, cyclonic southern; CSW, cyclonic southwestern; CW, cyclonic western; CNW, cyclonic northwestern; N, directional northern; NE, directional northeastern; E, directional eastern; SE, directional southeastern; S, directional southern; SW, directional southwestern; W, directional western; NW, directional northwestern; U, unclassified.
Atmosphere 12 01536 g0a2

References

  1. Stryhal, J.; Huth, R. Klasifikace atmosférické cirkulace (Classification of atmospheric circulation). Geografie 2016, 121, 300–323. [Google Scholar] [CrossRef]
  2. Hess, P.; Brezowsky, H. Katalog der Grosswetterlagen Europas; Berichte des Deutschen Wetterdienstes in US-Zone 33; Deutscher Wetterdienst: Bad Kissingen, Germany, 1952.
  3. Gerstengarbe, F.W.; Werner, P.C. Katalog der Grosswetterlagen Europas nach Paul Hess and Helmuth Brezowski 1881–1992; Berichte des Deutschen Wetterdienstes 113; Deutscher Wetterdienst Publisher: Offenbach am Main, Germany, 1993.
  4. Werner, P.C.; Gerstengarbe, F.W. Katalog der Großwetterlagen Europas (1881–2009) nach Paul Hess und Helmut Brezowsky. 7. verbesserte und ergänzte Auflage; PIK Report No. 119; Potsdam Institute for Climate Impact Research: Potsdam, Germany, 2010. Available online: https://www.pik-potsdam.de/research/publications/pikreports/.files/pr119.pdf (accessed on 10 October 2021).
  5. Kyselý, J.; Domonkos, P. Recent increase in persistence of atmospheric circulation over Europe: Comparison with long-term variations since 1881. Int. J. Climatol. 2006, 26, 461–483. [Google Scholar] [CrossRef] [Green Version]
  6. Planchon, O.; Quénol, H.; Dupont, N.; Corgne, S. Application of the Hess-Brezowsky classification to the identification of weather patterns causing heavy winter rainfall in Brittany (France). Nat. Hazards Earth Syst. Sci. 2009, 9, 1161–1173. [Google Scholar] [CrossRef] [Green Version]
  7. Khokhlov, V.; Umanska, O. European atmospheric circulation classifications. J. Geogr. Env. Earth Sci. Inter. 2018, 16, 1–8. [Google Scholar] [CrossRef]
  8. Sýkorová, P.; Huth, R. The applicability of the Hess–Brezowsky synoptic classification to the description of climate elements in Europe. Theor. Appl. Climatol. 2020, 142, 1295–1309. [Google Scholar] [CrossRef]
  9. Osuchowska-Klein, B. Katalog typów cyrkulacji atmosferycznej (Catalogue of Types of Atmospheric Circulation); Wyd. Komunikacji i Lączności: Warszawa, Poland, 1978. [Google Scholar]
  10. Ustrnul, Z. Kalendarze typów cyrkulacji—próba oceny (Calendars of circulation types—attempt of evaluation). Ann. UMCS 2001, LV/LVI, 347–356. [Google Scholar]
  11. Ustrnul, Z.; Czekierda, D. Circulation background of the atmospheric precipitation in the Central Europe (based on the Polish example). Meteorol. Z. 2001, 10, 103–111. [Google Scholar] [CrossRef]
  12. Ustrnul, Z.; Wypych, A.; Czekierda, D. Composite circulation index of weather extremes (the example for Poland). Meteorol. Z. 2013, 22, 551–559. [Google Scholar] [CrossRef]
  13. Wypych, A.; Ustrnul, Z.; Czekierda, D.; Palarz, A.; Sulikowska, A. Extreme precipitation events in the Polish Carpathians and their synoptic determinants. Időjárás 2018, 122, 145–158. [Google Scholar] [CrossRef]
  14. Niedźwiedź, T.; Ustrnul, Z. Change of Atmospheric Circulation. In Climate Change in Poland; Springer Climate; Falarz, M., Ed.; Springer: Berlin/Heidelberg, Germany, 2021; pp. 123–150. [Google Scholar] [CrossRef]
  15. Péczely, G. Catalogue of the Macrosynoptic Types for Hungary (1881–1983). Hung. Meteorol. Serv. 1983, 53, 116. [Google Scholar]
  16. Károssy, C. Catalogue of the Péczely’s macro-synoptic types (1983–1987). Légkör 1987, 32, 28–30. [Google Scholar]
  17. Makra, L.; Mika, J.; Bartzokas, A.; Beczi, R.; Sümeghy, Z. Comparison of objective air-mass types and the Peczely weather types and their ability to classify levels of air pollutants in Szeged, Hungary. Int. J. Environ. Pollut. 2009, 36, 81–98. [Google Scholar] [CrossRef]
  18. Károssy, C. Catalogue of Péczely’s macro-synoptic types for the Carpathian Basin, 1881–2015. Légkör 2018, 63, 11–40. [Google Scholar]
  19. Mika, J.; Károssy, C.; Lakatos, L. Variations in the Peczely macro-synoptic types (1881–2020) with attention to weather extremes in the Pannonian Basin. Atmosphere 2021, 12, 1071. [Google Scholar] [CrossRef]
  20. Hansen, F.; Belušić, D. Tailoring circulation type classification outcomes. Int. J. Climatol. 2021, 41, 6145–6161. [Google Scholar] [CrossRef]
  21. Bissolli, P.; Dittmann, E. The objective weather type classification of the German Weather Service and its possibilities of application to environmental and meteorological investigations. Meteorol. Z. 2001, 10, 253–260. [Google Scholar] [CrossRef]
  22. James, P. An objective classification method for Hess and Brezowsky Grosswetterlagen over Europe. Theor. Appl. Climatol. 2007, 88, 17–42. [Google Scholar] [CrossRef]
  23. Piotrowski, P. Obiektywna metoda klasyfikacji cyrkulacji atmosferycznej dla Polski (An objective method of atmospheric circulation classification for Poland). Acta Univ. Lodz. Folia Geogr. Phys. 2009, 10, 216. [Google Scholar]
  24. Jenkinson, A.F.; Collison, F.P. An Initial Climatology of Gales over the North Sea; Synoptic Climatology Branch Memorandum No. 62; Meteorological Office: Bracknell, UK, 1977.
  25. Belušić Vozila, A.; Telišman Prtenjak, M.; Güttler, I. A weather-type classification and its application to near-surface wind climate change projections over the Adriatic Region. Atmosphere 2021, 12, 948. [Google Scholar] [CrossRef]
  26. Piotrowski, P. Comparison between objective and subjective method of classification of atmospheric circulation for area of Poland. Acta Agrophysica. Rozpr. Monogr. 2010, 5, 44–54. [Google Scholar]
  27. Broderick, C.; Fealy, R. An analysis of the synoptic and climatological applicability of circulation type classifications for Ireland. Int. J. Climatol. 2015, 35, 481–505. [Google Scholar] [CrossRef] [Green Version]
  28. Brázdil, R. Yanvarskiye osadki na territorii TchSSR (January precipitation on the territory of the CSSR). Scr. Fac. Sci. Nat. Univ. Purk. Brun. 1975, 5, 49–72. [Google Scholar]
  29. Brůžek, V. Průběh srážek ve vztahu k cirkulaci (Precipitation course in relation to circulation). Meteorol. Zpr. 1987, 40, 20–25. [Google Scholar]
  30. Trnka, M.; Kyselý, J.; Možný, M.; Dubrovský, M. Changes in Central-European soil-moisture availability and circulation patterns in 1881–2005. Int. J. Climatol. 2009, 29, 655–672. [Google Scholar] [CrossRef]
  31. Kolektiv pracovníků synoptické a letecké služby HMÚ. Katalog povětrnostních situací pro území ČSSR (Catalogue of Weather Situations over the Territory of the CSSR); HMÚ: Praha, Czechoslovakia, 1967. [Google Scholar]
  32. Brádka, J. Srážky na území ČSSR při jednotlivých typech povětrnostní situace (Precipitation over the territory of the CSSR. for individual types of weather situation). Sbor. Prac. Hydrometeorol. Úst. 1972, 18, 8–62. [Google Scholar]
  33. Brázdil, R. Vliv Atlantského oceánu a Středozemního moře na srážkové poměry léta na území ČSSR (The influence of the Atlantic Ocean and the Mediterranean on the precipitation conditions of the summer on the territory of the CSSR). Scr. Fac. Sci. Nat. Univ. Purk. Brun. 1980, 10, 201–210. [Google Scholar]
  34. Kopecká, V. Srážky ve východních Čechách při vybraných situacích (Precipitation in eastern Bohemia during selected situations). Meteorol. Zpr. 1985, 38, 174–184. [Google Scholar]
  35. Křivancová, S.; Vavruška, F. Základní meteorologické prvky v jednotlivých povětrnostních situacích na území České republiky v období 1961–1990 (Basic Meteorological Elements in Individual Weather Situations over the Territory of the Czech Republic in the 1961–1990 Period); Národní klimatický program Česká republika: Praha, Czech Republic, 1997. [Google Scholar]
  36. Řezníčková, L.; Brázdil, R.; Tolasz, R. Meteorological singularities in the Czech Republic in the period 1961–2002. Theor. Appl. Climatol. 2007, 88, 179–192. [Google Scholar] [CrossRef]
  37. Tolasz, R.; Míková, T.; Valeriánová, A.; Voženílek, V. Atlas podnebí Česka (Climate Atlas of Czechia). Český hydrometeorologický ústav; Univerzita Palackého v Olomouci: Olomouc, Czech Republic, 2007. [Google Scholar]
  38. Zahradníček, P.; Trnka, M.; Brázdil, R.; Možný, M.; Štěpánek, P.; Hlavinka, P.; Žalud, Z.; Malý, A.; Semerádová, D.; Dobrovolný, P.; et al. The extreme drought episode of August 2011–May 2012 in the Czech Republic. Int. J. Climatol. 2015, 35, 3335–3352. [Google Scholar] [CrossRef]
  39. Řehoř, J.; Brázdil, R.; Trnka, M.; Řezníčková, L.; Balek, J.; Možný, M. Regional effects of synoptic situations on soil drought in the Czech Republic. Theor. Appl. Climatol. 2020, 141, 1383–1400. [Google Scholar] [CrossRef]
  40. Konček, M.; Rein, F. Katalog der Witterungstypen für Mitteleuropa. Acta Fac. Rer. Nat. Univ. Comen. Meteorol. IV 1971, 4, 1–33. [Google Scholar]
  41. Ostrožlík, M. Niektoré charakteristiky námrazy na Chopku a na Lomnickém štíte za rôznych typov počasia (Some characteristics of rime at Chopok and Lomnický štít in different weather types). Meteorol. Zpr. 1973, 26, 59–63. [Google Scholar]
  42. Ostrožlík, M. Pravděpodobnosť výskytu námrazy na Chopku a na Lomnickom štíte za rôznych typov počasia (Probability of the rime occurrence at Chopok and Lomnický štít in different weather types). Meteorol. Zpr. 1974, 27, 60–62. [Google Scholar]
  43. Brázdil, R.; Štekl, J. Cirkulační procesy a atmosférické srážky v ČSSR (Circulatory Processes and Atmospheric Precipitation on the Territory of the CSSR.); Univerzita J. E. Purkyně: Brno, Czechoslovakia, 1986. [Google Scholar]
  44. Štekl, J.; Brázdil, R.; Kakos, V.; Jež, J.; Tolasz, R.; Sokol, Z. Extrémní denní srážkové úhrny na území ČR v období 1879–2000 a jejich synoptické příčiny (Extreme Daily Precipitation Totals during 1879–2000 in the Czech Territory and Their Synoptic Causes); Národní klimatický program České republiky 31; CHMÚ: Praha, Czech Republic, 2001. [Google Scholar]
  45. Plavcová, E.; Kyselý, J. Evaluation of daily temperatures in Central Europe and their links to large-scale circulation in an ensemble of regional climate models. Tellus 2011, 63A, 763–781. [Google Scholar] [CrossRef] [Green Version]
  46. Řehoř, J.; Brázdil, R.; Trnka, M.; Lhotka, O.; Balek, J.; Možný, M.; Štěpánek, P.; Zahradníček, P.; Mikulová, K.; Turňa, M. Soil drought and circulation types in a longitudinal transect over central Europe. Int. J. Climatol. 2021, 41 (Suppl. S1), E2834–E2850. [Google Scholar] [CrossRef]
  47. Zahradníček, P.; Brázdil, R.; Řehoř, J.; Lhotka, O.; Dobrovolný, P.; Štěpánek, P.; Trnka, M. Temperature extremes and circulation types in the Czech Republic, 1961–2020. Int. J. Climatol. 2021. in review. [Google Scholar]
  48. Brádka, J.; Dřevikovský, A.; Gregor, Z.; Kolesár, J. Počasí na území Čech a Moravy v typických povětrnostních situacích (Weather on the Territory of Bohemia and Moravia in Typical Weather Situations); Hydrometeorologický ústav: Praha, Czechoslovakia, 1961. [Google Scholar]
  49. Typizace povětrnostních situací pro území České republiky (Classification of Synoptic Situations for the Czech Republic). Available online: http://portal.chmi.cz/historicka-data/pocasi/typizace-povetrnostnich-situaci (accessed on 12 October 2021).
  50. Kalnay, E.; Kanamitsu, M.; Kistler, R.; Collins, W.; Deaven, D.; Gandin, L.; Iredell, M.; Saha, S.; White, G.; Woollen, J.; et al. The NCEP/NCAR 40-year reanalysis project. Bull. Am. Meteorol. Soc. 1996, 77, 437–471. [Google Scholar] [CrossRef] [Green Version]
  51. Sprinthall, R.C. Basic Statistical Analysis, 9th ed.; American International College: New York, NY, USA, 2011. [Google Scholar]
  52. Brázdil, R.; Zahradníček, P.; Dobrovolný, P.; Štěpánek, P.; Trnka, M. Observed changes in precipitation during recent warming: The Czech Republic, 1961–2019. Int. J. Climatol. 2021, 41, 3881–3902. [Google Scholar] [CrossRef]
  53. Rulfová, Z.; Beranová, R.; Kyselý, J. Charakteristiky konvekčních a vrstevnatých srážek na stanicích v České republice v letech 1982–2016 (Characteristics of convective and stratiform precipitation at stations in the Czech Republic over 1982–2016 period). Meteorol. Zpr. 2019, 72, 11–18. [Google Scholar]
  54. Markham, C.G. Seasonality of precipitation in the United States. Ann. Assoc. Am. Geogr. 1970, 60, 593–597. [Google Scholar] [CrossRef]
Figure 1. (a) Physical–geographical map of the Czech Republic with its division into Bohemia and Moravia and Silesia; (b) mean annual precipitation totals within the territory of the Czech Republic during the 1961–2020 period; (c) annual variations in mean monthly precipitation totals in Bohemia (BOH) and Moravia and Silesia (M&S) during the 1961–2020 period; (d) spatial distribution of used rain-gauge stations of the Czech Hydrometeorological Institute.
Atmosphere 12 01536 g001
Figure 2. Position of the 16 SLP points as inputs for the calculation of circulation indices (the geographic center of the Czech Republic is indicated by a cross).
Atmosphere 12 01536 g002
Figure 3. Relative annual and seasonal (DJF: December–February; MAM: March–May; JJA: June–August; and SON: September–November) occurrence frequencies (%) of the groups of circulation types under the CHMI (cyclonic and anticyclonic) and objective (anticyclonic, cyclonic, directional, and type U) classifications in the Czech Republic during the 1961–2020 period.
Atmosphere 12 01536 g003
Figure 4. Relative annual and seasonal (DJF: December–February; MAM: March–May; JJA: June–August; and SON: September–November) occurrence frequencies (%) of the individual circulation types under the CHMI and objective classifications in the Czech Republic during the 1961–2020 period. The values are highlighted by the color scale of green shades.
Atmosphere 12 01536 g004
Figure 5. Relative annual and seasonal (DJF: December–February; MAM: March–May; JJA: June–August; and SON: September–November) proportions (%) of the groups of circulation types under the CHMI (a) and objective (b) classifications in the overall precipitation totals in Bohemia (BOH) and Moravia and Silesia (M&S) during the 1961–2020 period.
Atmosphere 12 01536 g005
Figure 6. Relative annual and seasonal (DJF: December–February; MAM: March–May; JJA: June–August; and SON: September–November) proportions (%) of the individual circulation types under the CHMI (a) and objective (b) classifications in the overall precipitation totals in Bohemia (BOH) and Moravia and Silesia (M&S) and differences (Dif) during the 1961–2020 period. Statistically significant differences at the 0.05 significance level are denoted in bold type. The values are highlighted by the color scale of blue shades.
Atmosphere 12 01536 g006
Figure 7. Mean annual and seasonal (DJF: December–February; MAM: March–May; JJA: June–August; and SON: September–November) daily precipitation totals (mm) for the groups of circulation types under the CHMI (a) and objective (b) classifications in Bohemia (BOH) and Moravia and Silesia (M&S) during the 1961–2020 period.
Atmosphere 12 01536 g007
Figure 8. Mean annual and seasonal (DJF: December–February; MAM: March–May; JJA: June–August; and SON: September–November) daily precipitation totals (mm) for the individual circulation types under the CHMI (a) and objective (b) classifications in Bohemia (BOH) and Moravia and Silesia (M&S) and differences (Dif) during the 1961–2020 period. Statistically significant differences at the 0.05 significance level are denoted in bold type. The values are highlighted by the color scale of blue shades.
Atmosphere 12 01536 g008
Figure 9. Annual and seasonal (DJF: December–February; MAM: March–May; JJA: June–August; and SON: September–November) probabilities of days with precipitation totals ≥ 1.0 mm for the groups of circulation types under the CHMI (a) and objective (b) classifications in Bohemia (BOH) and Moravia and Silesia (M&S) during the 1961–2020 period.
Atmosphere 12 01536 g009
Figure 10. Annual and seasonal (DJF: December–February; MAM: March–May; JJA: June–August; and SON: September–November) probabilities of days with precipitation totals ≥ 1.0 mm for the individual circulation types under the CHMI (a) and objective (b) classifications in Bohemia (BOH) and Moravia and Silesia (M&S) and differences (Dif) during the 1961–2020 period. Statistically significant differences at the 0.05 significance level are denoted in bold type. The values are highlighted by the color scale of blue shades.
Atmosphere 12 01536 g010
Figure 11. Anomalies of the annual and seasonal daily mean precipitation (the 1961–2020 reference period) for the circulation types under CHMI classification with the largest difference in the daily mean precipitation in favor of BOH (left column) and M&S (right column). Included types: Wc, west cyclonic; NEc, northeast cyclonic; C, cyclone over central Europe; B, trough over central Europe; Wcs, west cyclonic with southern pathway.
Atmosphere 12 01536 g011
Figure 12. Anomalies of the annual and seasonal daily mean precipitation (the 1961–2020 reference period) for the circulation types under the objective classification with the largest difference in the daily mean precipitation favoring BOH (left column) and M&S (right column). Included types: SW, directional southwestern; CN, cyclonic northern; CW, cyclonic western; CNE, cyclonic northeastern; AS, anticyclonic southern; N, directional northern; NW, directional northwestern.
Atmosphere 12 01536 g012
Figure 13. Relative occurrence frequencies of the individual circulation types under the objective classification to the occurrence frequencies of the individual types under the CHMI classification (a) and vice versa (b) during the 1961–2020 period. The values are highlighted by the color scale of red shades.
Atmosphere 12 01536 g013
Figure 14. Fluctuations in the occurrence frequencies of the CHMI types (A) (anticyclone over Central Europe), (Ap) (travelling anticyclone), (B) (trough over Central Europe), and (Bp) (travelling trough) and their linear trends during the 1961–2020 period.
Atmosphere 12 01536 g014
Table 1. Circulation types under the CHMI and objective classifications with the largest positive and negative differences (Dif) in the mean daily precipitation totals between Bohemia (BOH) and Moravia and Silesia (M&S) and anomalies (Anom) in the mean daily totals for a given type in regard to the corresponding overall annual (Ann) and seasonal (DJF: December–February; MAM: March–May; JJA: June–August; and SON: September–November) means from 1961–2020.
PeriodCHMI ClassificationObjective Classification
TypeMean (mm)Anom (mm)TypeMean (mm)Anom (mm)
BOHM&SDifBOHM&SBOHM&SDifBOHM&S
AnnWc2.72.20.50.90.3SW2.41.90.50.60.1
NEc1.92.8–0.90.00.9CN4.45.6–1.42.53.8
DJFWc2.82.10.71.40.8CW2.82.10.81.40.7
C1.82.8–1.00.31.5CNE2.13.2–1.10.71.8
MAMWc2.62.00.60.90.3AS0.80.30.5–0.9–1.4
B2.83.7–0.91.11.9CNE3.64.6–1.01.92.8
JJAC7.56.60.94.93.9CS5.03.31.72.30.6
NEc2.64.1–1.50.01.4N3.35.4–2.10.72.7
SONWcs3.42.60.81.80.9NW2.72.30.41.10.6
NEc1.62.8–1.20.01.1CNE4.36.8–2.52.75.2
Table 2. Relative agreement (%) in frequencies of the occurrence of the anticyclonic, cyclonic, directional, and unclassified types under the objective classification during the occurrence of the anticyclonic and cyclonic types under the CHMI classification (a) and vice versa (b) in the 1961–2020 period.
CHMI Classification TypesObjective Classification Types
AnticyclonicCyclonicDirectionalUnclassified
abababab
anticyclonic70.755.83.26.625.022.51.122.9
cyclonic29.244.224.093.444.977.51.977.1
Publisher’s Note: MDPI stays neutral with regard to jurisdictional claims in published maps and institutional affiliations.

