
A Decade of Poland-AOD Aerosol Research Network Observations

 , , , , , , , , , , , , , , ,
Abstract
:1. Introduction
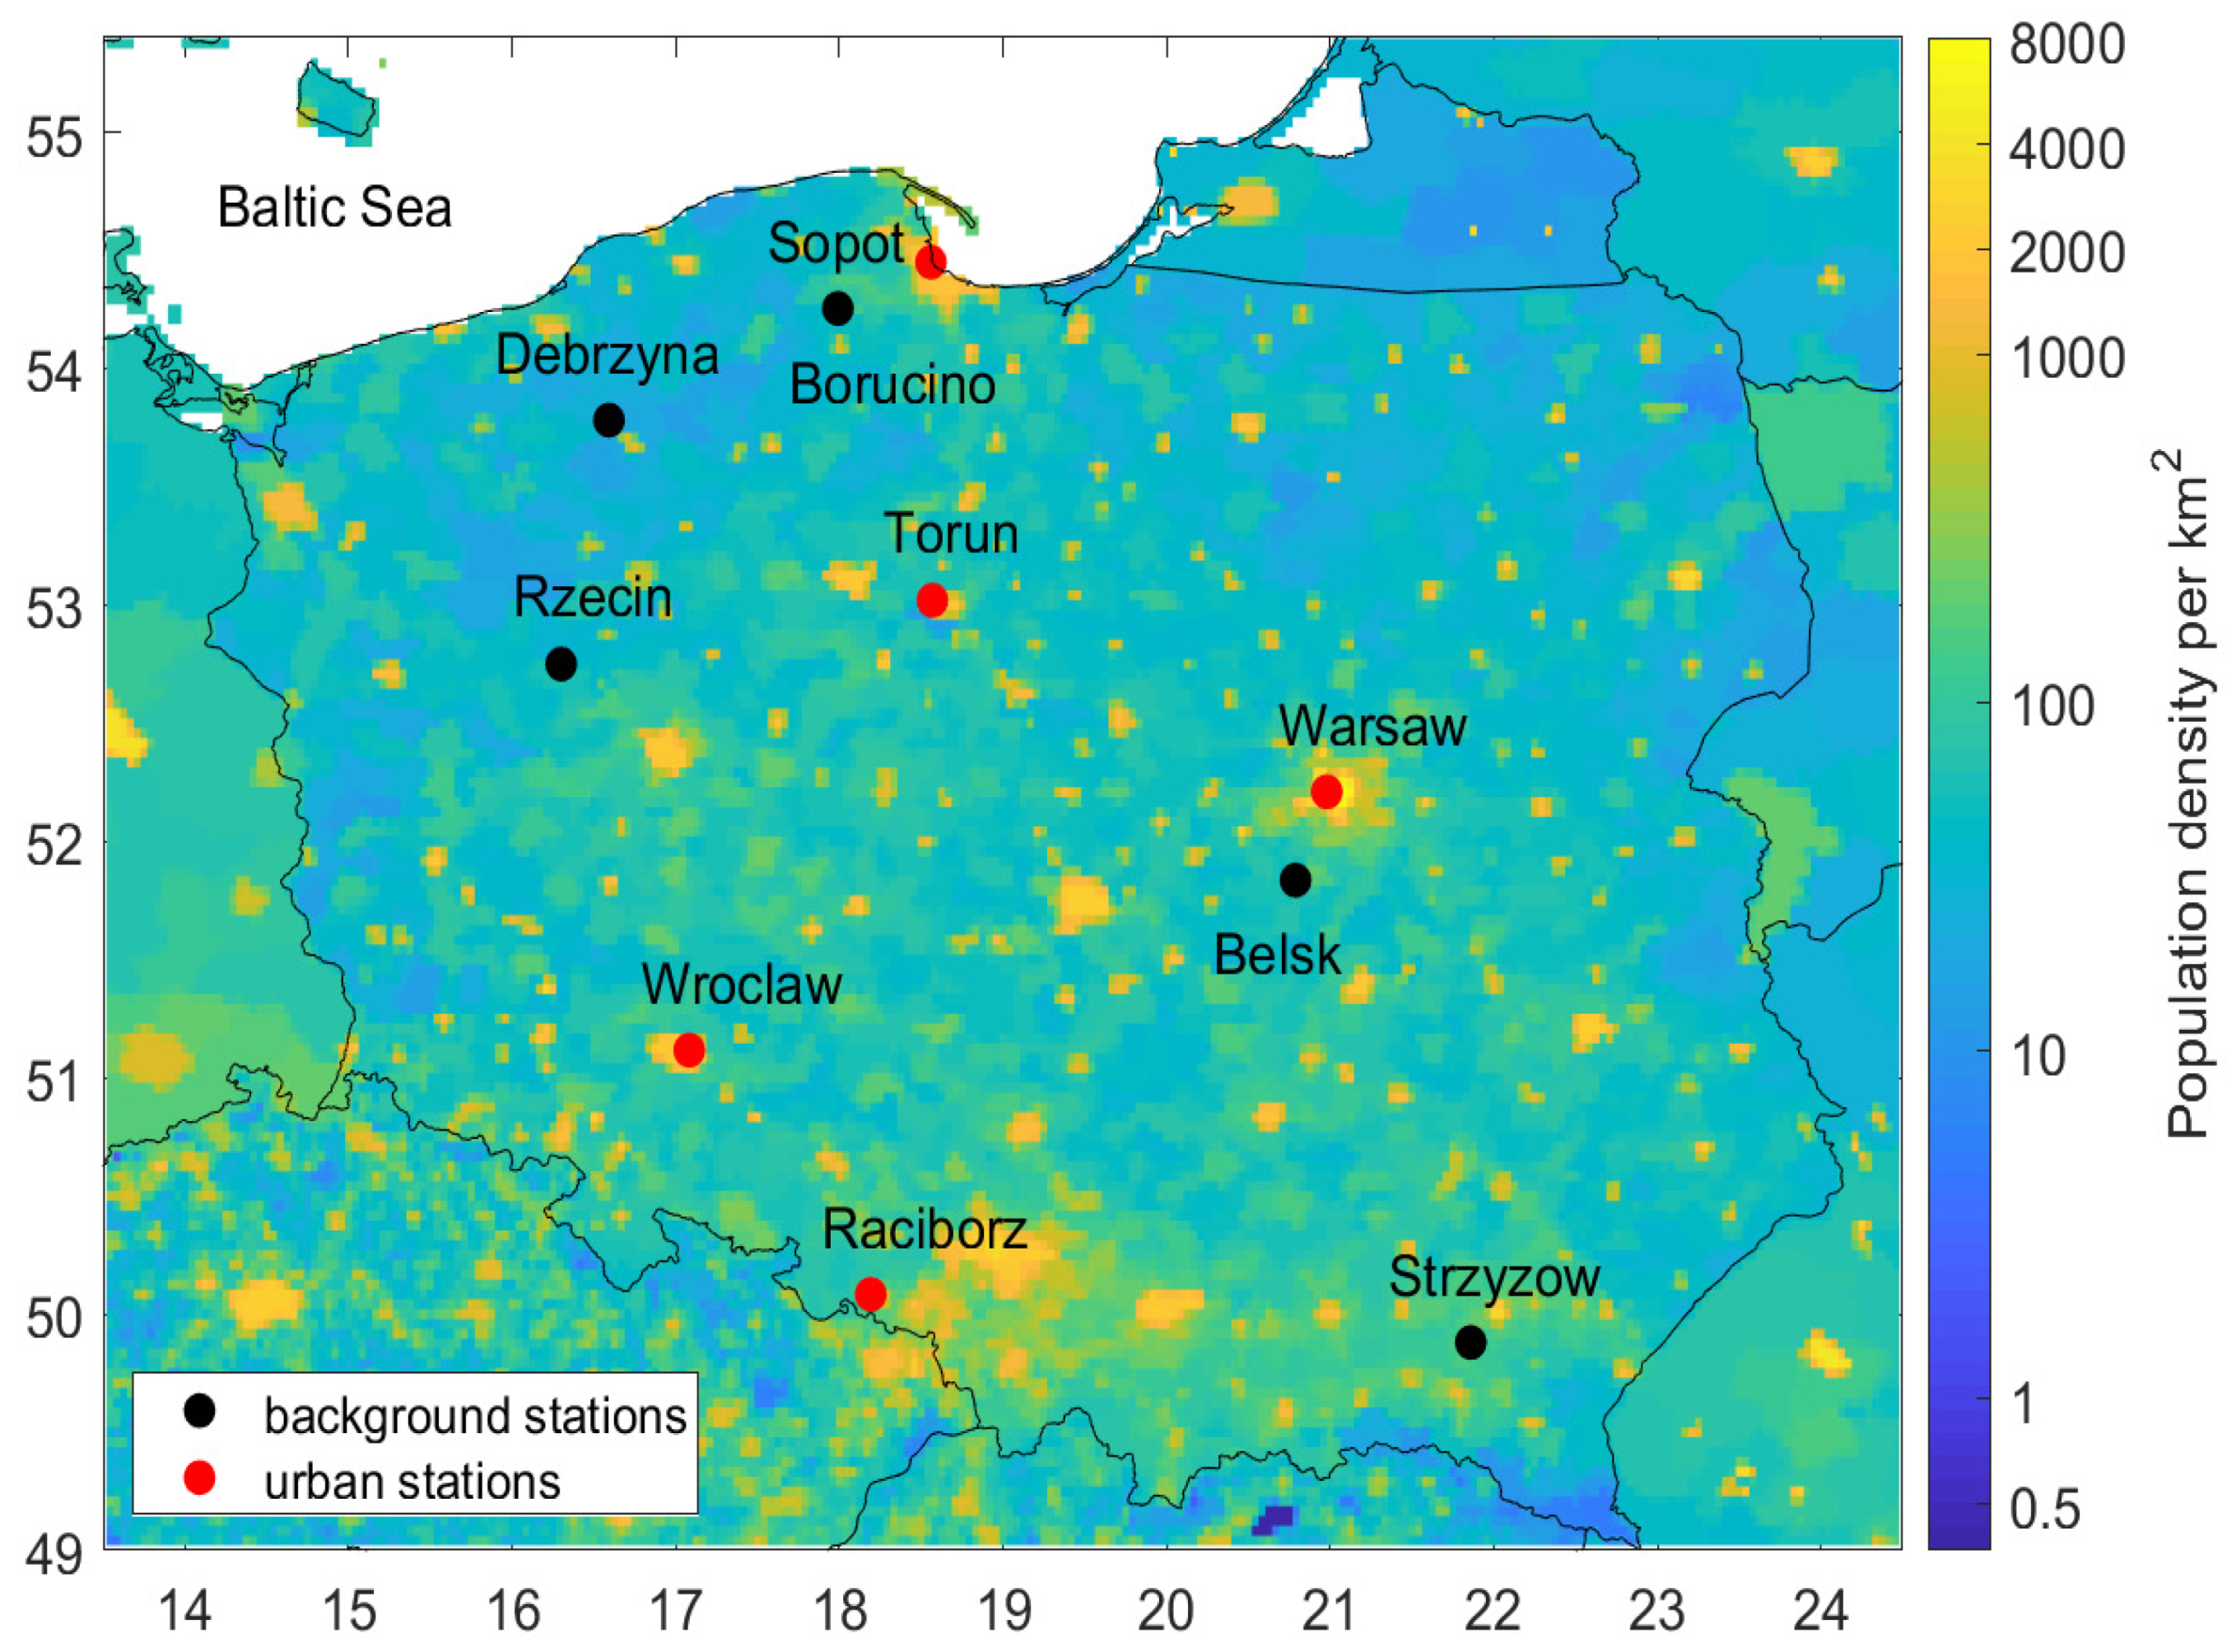
2. Network Overview
- -
- experimental studies and modelling of direct aerosol effect (at ground level and the top of the atmosphere),
- -
- improvement of knowledge about long-term trends in aerosol optical properties and aerosol radiative forcing,
- -
- understanding of the transformation of aerosol optical properties over Poland and the impact of urban emissions on columnar and surface aerosol optical properties,
- -
- validation of indirect retrievals to determine AOD and SSA using satellite data and ground-based measurements,
- -
- validation of aerosol transport models (e.g., GEM-AQ, WRF-Chem, NAAPS)
- -
- developing new methodologies for observation and modelling of aerosol properties, including in situ and remote sensing technologies.
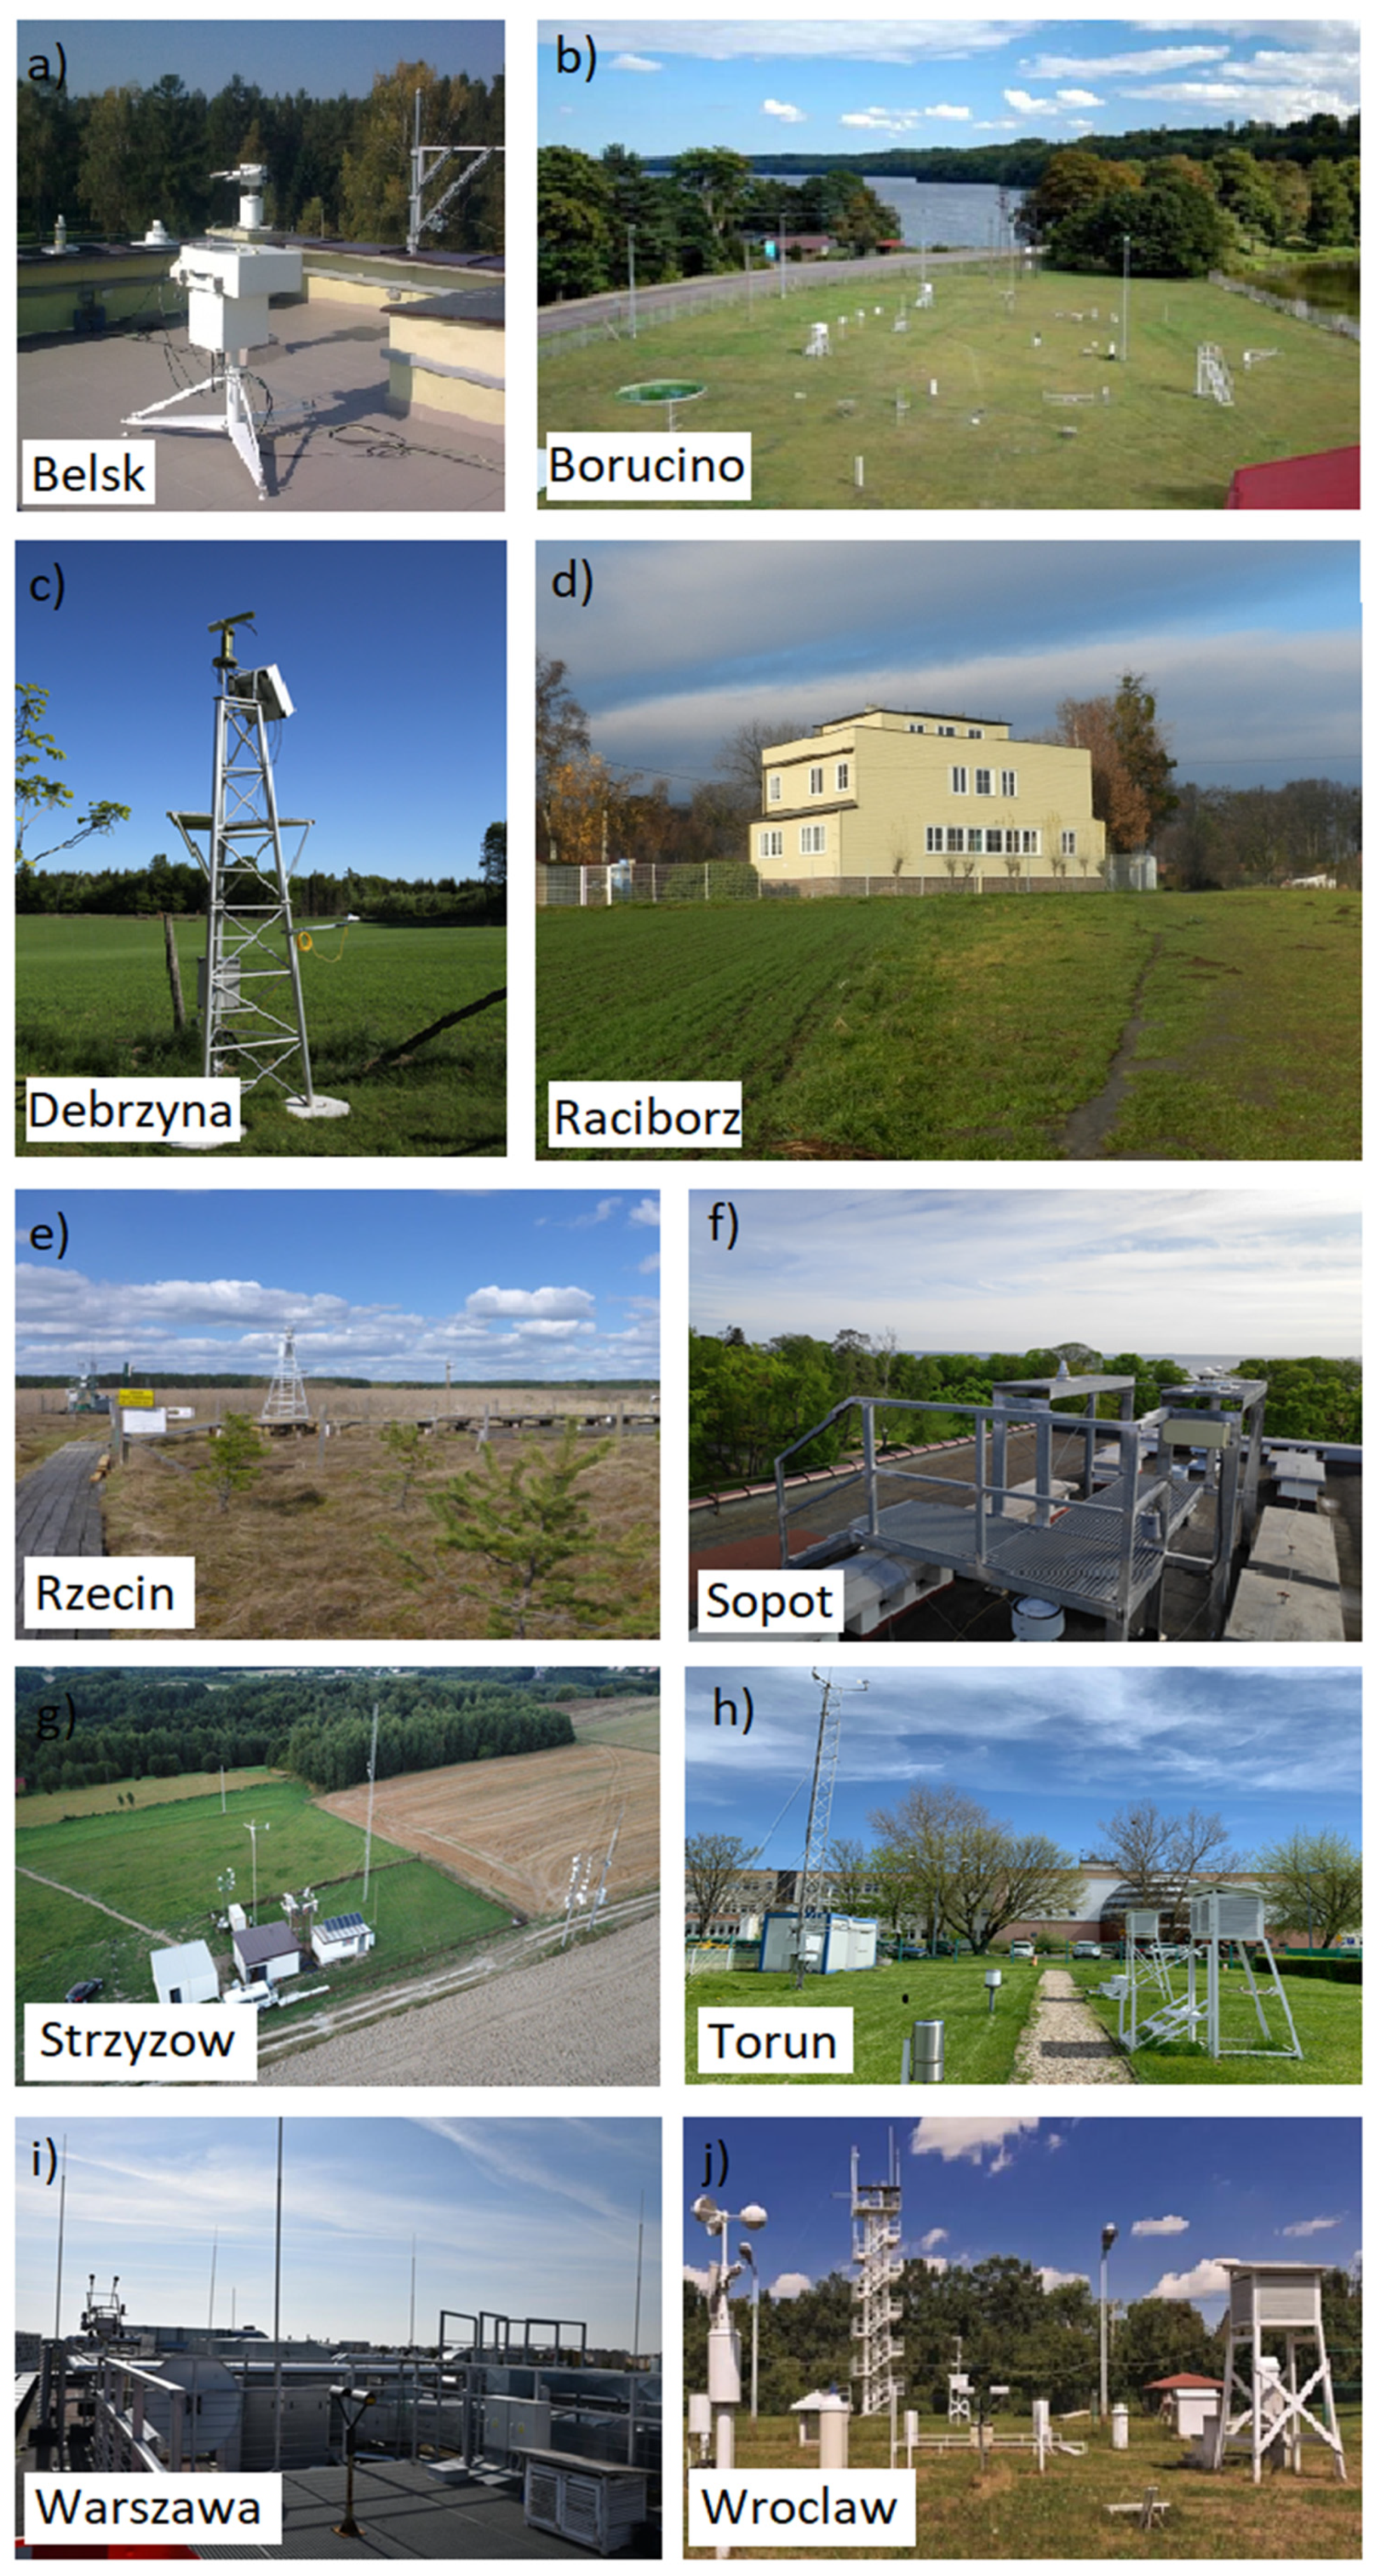
3. Research Stations
4. Calibration
5. Data Processing
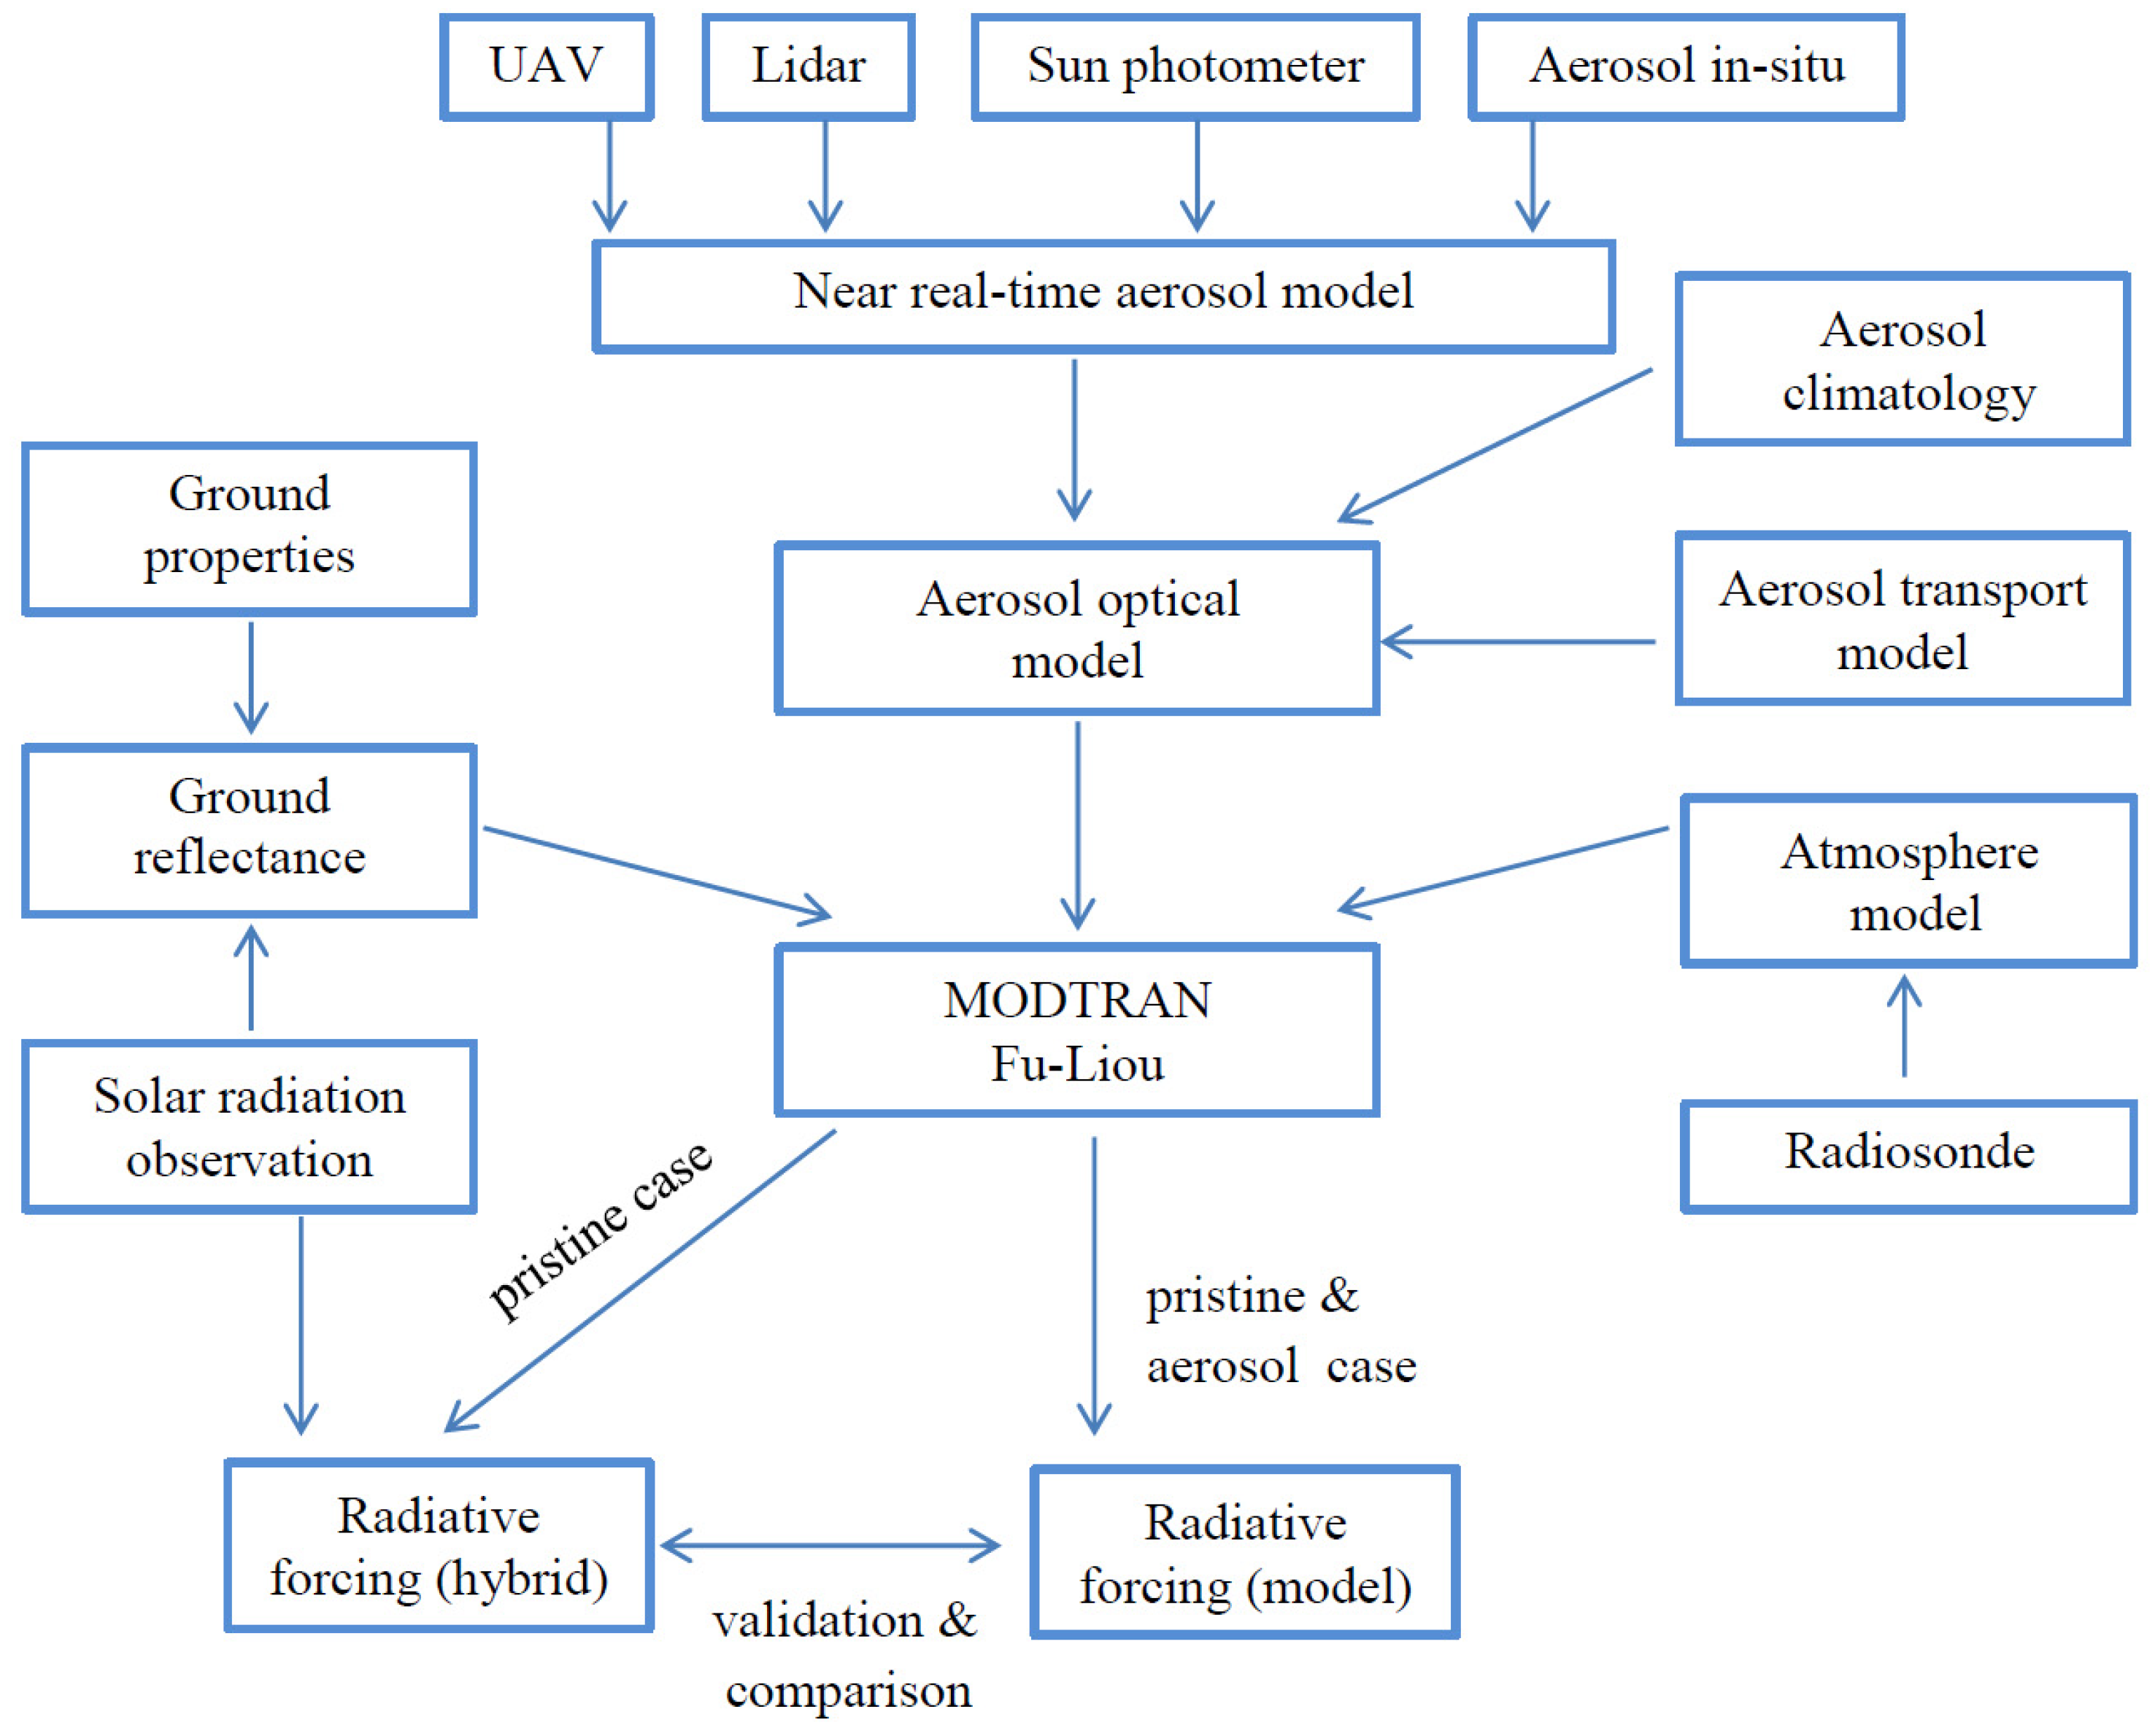
6. Integration of Aerosol Measurements with ATM
7. Field Campaign Activity
8. A Brief Overview of Poland-AOD Network Results
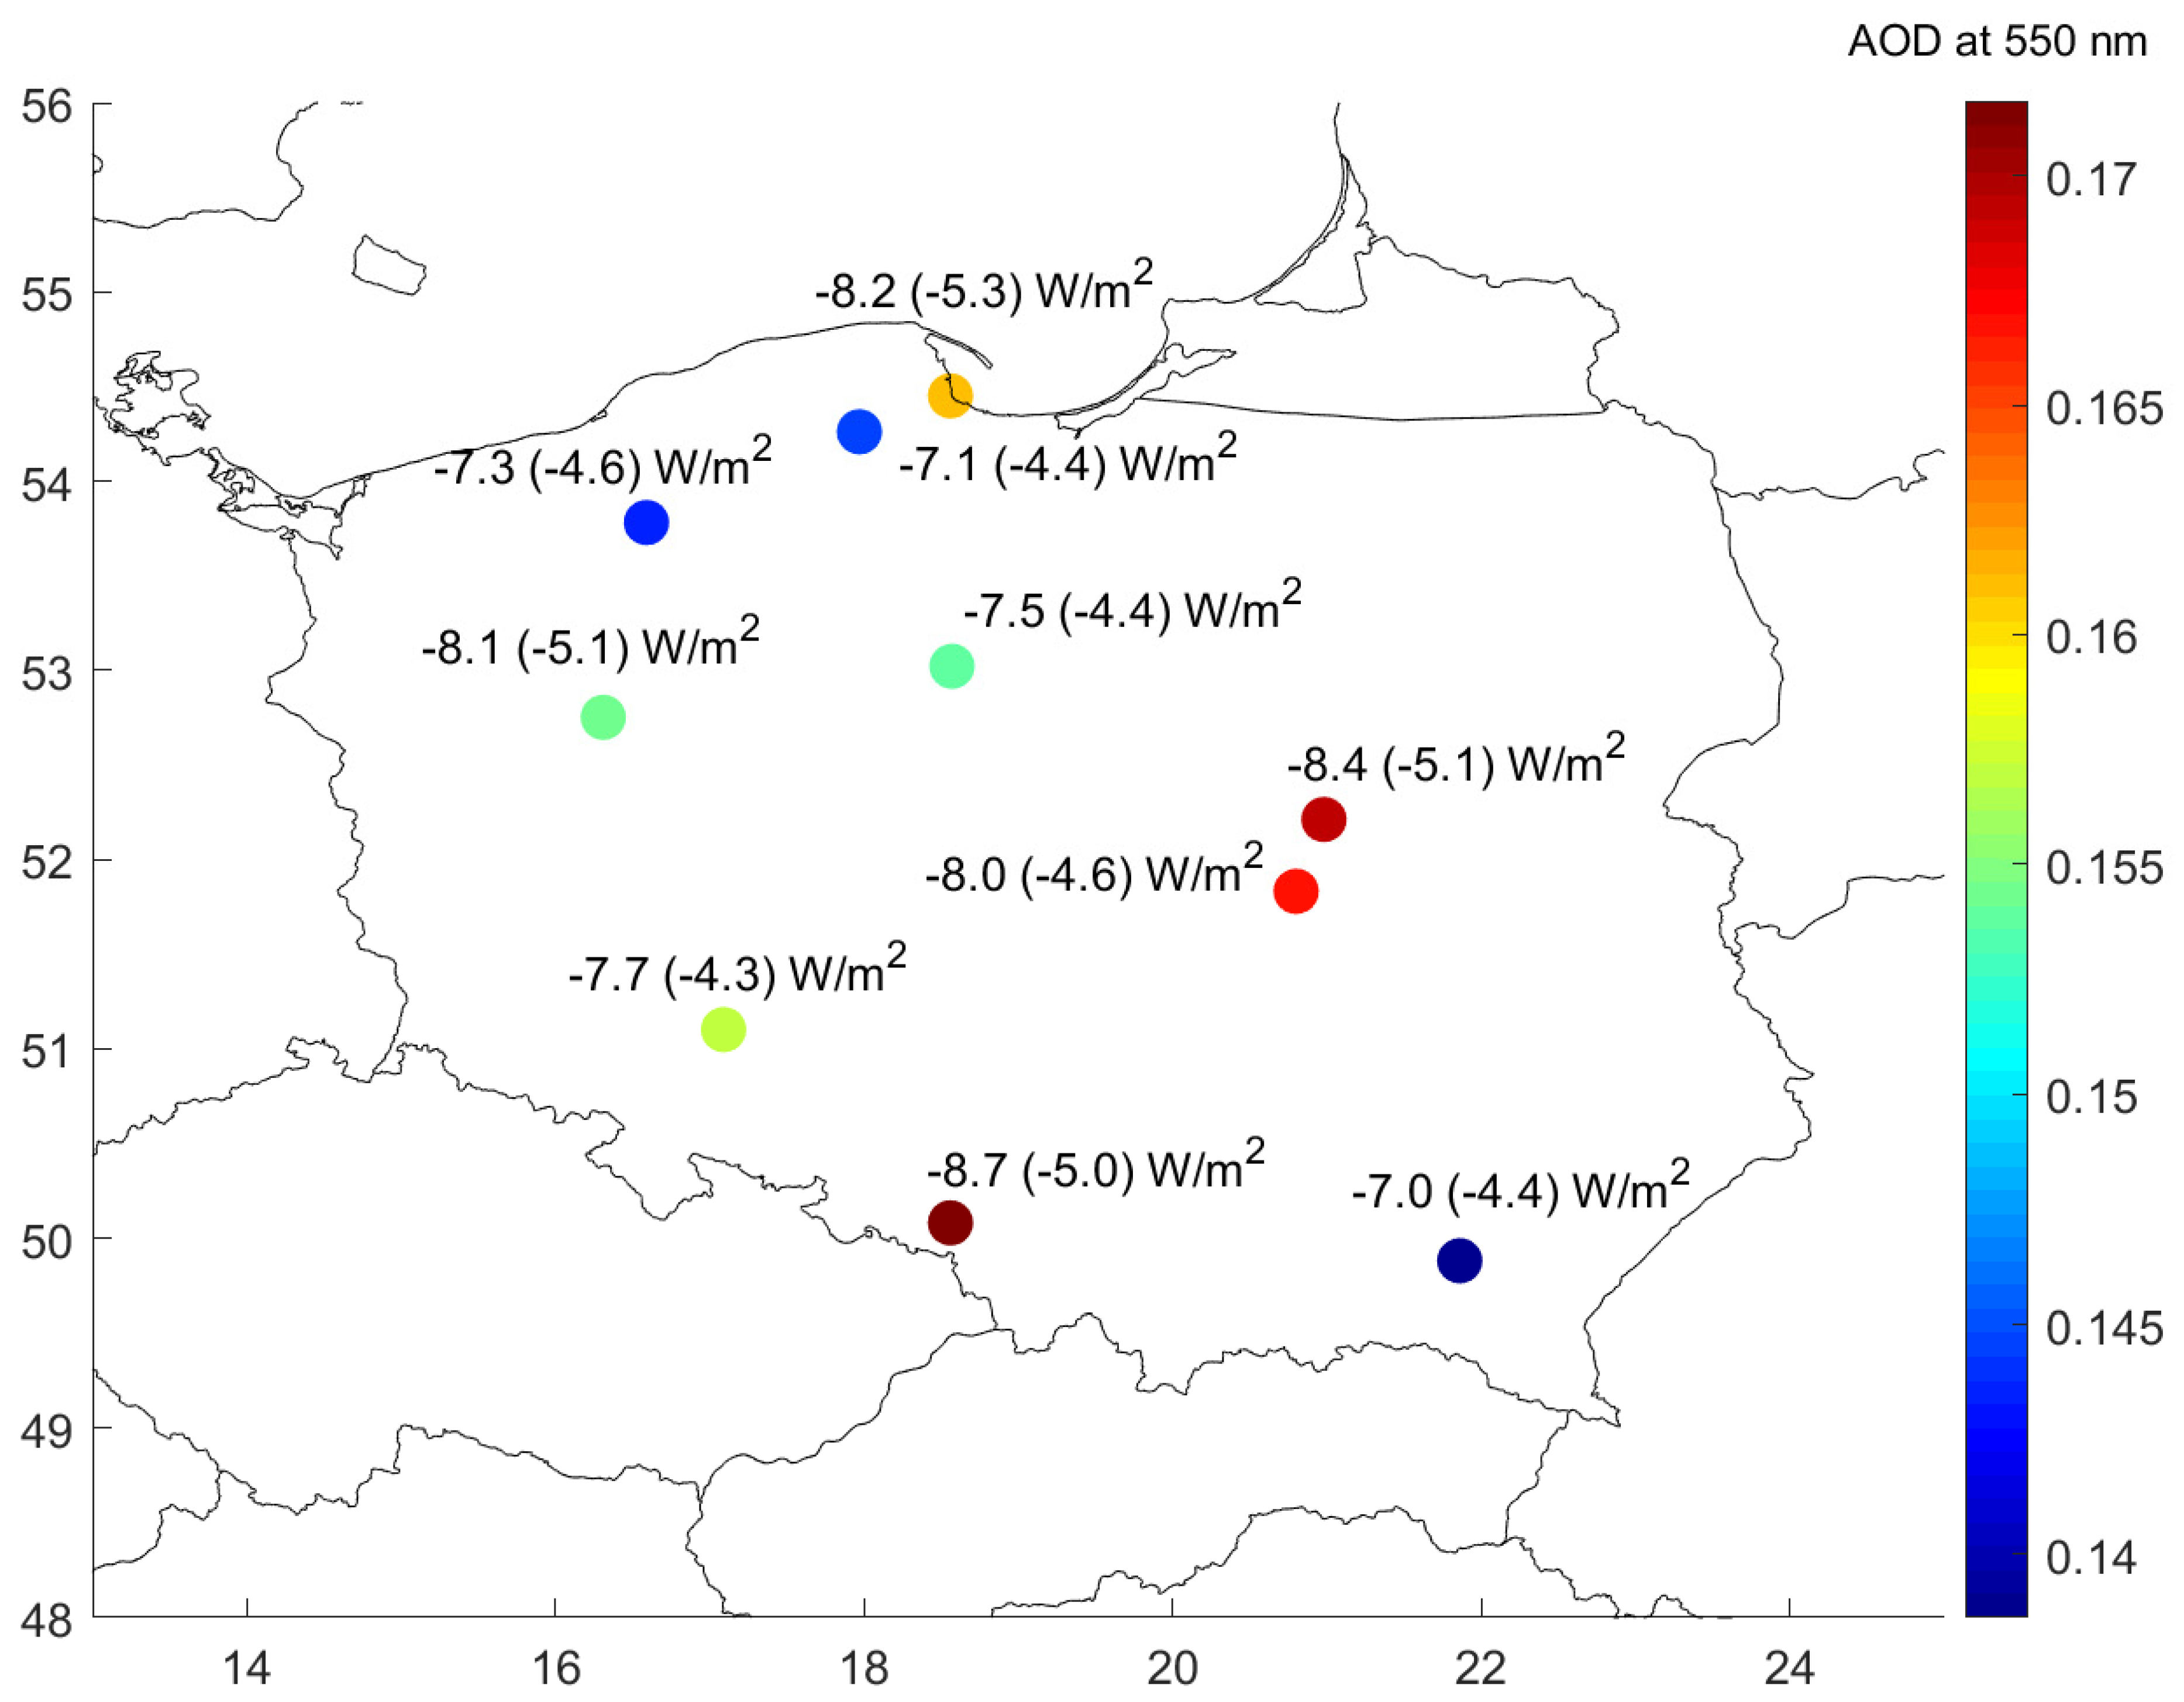
9. AOD and ARF Results
10. Conclusions and Summary
- Long-range transport of biomass burning and mineral dust;
- Air mass transformation;
- The effect of the megacity on aerosol optical properties;
- Relationships between columnar and surface optical properties;
- Temporal variability of the aerosol mixing layer;
- Long-term variability of aerosol properties and ARF;
- Integration of UAV, cable cars, lidar, and sun photometer observations;
- Aerosol-cloud typing.
- Improving the knowledge on the vertical structure of optical and microphysical aerosol properties, especially in the surface (smog) layer during the winter season.
- The surface smog layer usually has a depth ranging from several dozen to a few hundred metres and is poorly represented in aerosol transport models.
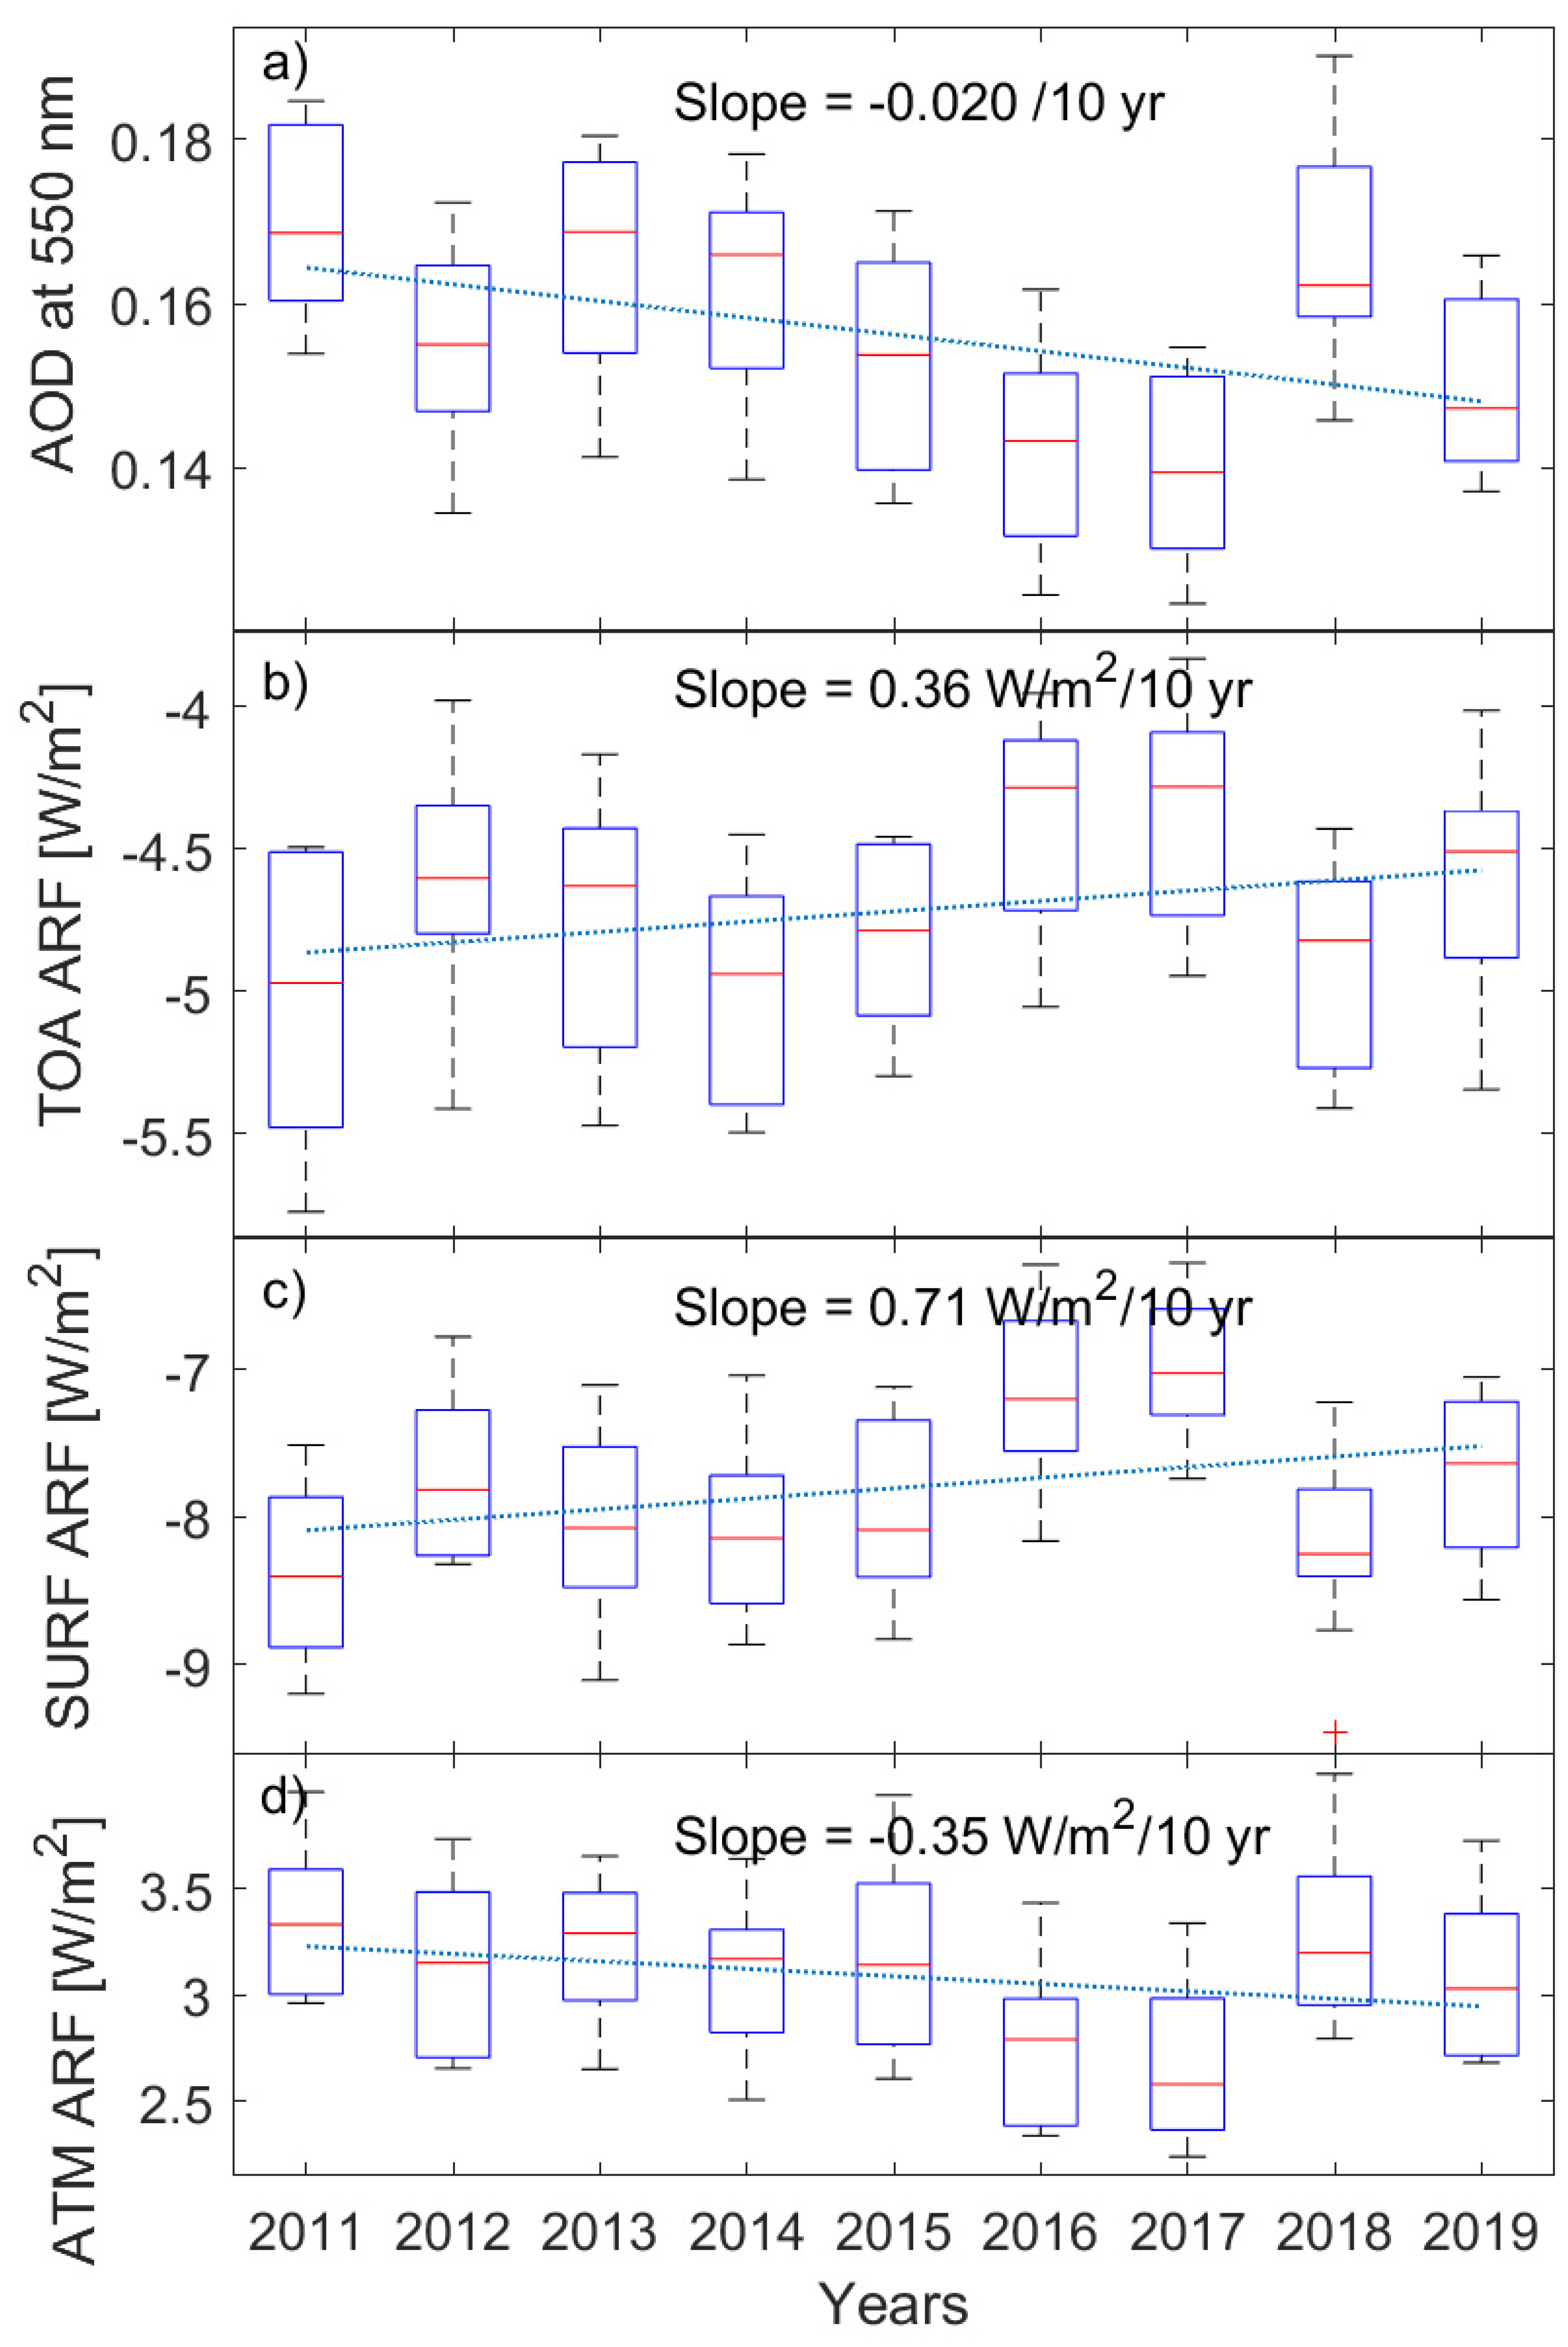
- Simulation of direct clear-sky ARF shows a continuation of positive trends at TOA and the Earth’s surface because of AOD reduction (about 0.02 per decade). Less negative ARF contributes to climate warming by increasing the net solar flux at the surface and decreasing reflected solar radiation at the TOA.
- Smaller AOD trend at high mountain station (Kasprowy Wierch) can be explained by reduction in the anthropogenic emissions rather than natural emissions.
- Several case studies of aerosol long-range transport were used to define optical and microphysical particle properties (mainly biomass burning and mineral dust) as well their effect on the radiative budget and sensible and latent heat fluxes.
- During biomass burning events, the intrusion of particles into the urban boundary layer is observed and confirmed by the decrease in surface air quality.
- The fraction of the fine and coarse mode dust particles for long-range transported mineral dust and local agricultural dust is distinctly different.
- Intrusion of anthropogenic pollution via long range transport into urban boundary layer can result in enhancing boundary layer height.
- Continuation of integration of data from different instruments and platforms (including lidars, sun photometers, UAV, cable cars, satellite detectors);
- Extension (to the middle troposphere) of the vertical range of the UAV profiles, which until now has been limited to approximately 1 km, and automation of such measurements;
- Reduction in noise in low-cost sensors (especially under clean conditions) to improve sensor calibration and compensation of instrument artefacts due to UAV vibrations, airflow, and temporal variability of relative humidity in micro aethalometers (e.g., AE-51, AM-200);
- Data assimilation to aerosol transport models (GEM-AQ, WRF-Chem and EMEP4PL) including columnar and vertical profile data;
- Model validation and improvement of air quality forecast during low-level inversion conditions;
- Aerosol hygroscopicity covering in situ and remote sensing methods;
- Development of new instruments, especially a miniaturized sun photometer onboard the UAV to validate profiles of aerosol extinction and AE in the lower troposphere;
- Exploring synergies of different lidar types used for aerosol flux determination within boundary layer;
- Building the database for estimations of the impact of atmospheric optics on ecosystem functioning.
Supplementary Materials
Author Contributions
Funding
Institutional Review Board Statement
Informed Consent Statement
Data Availability Statement
Acknowledgments
Conflicts of Interest
References
- Myhre, G.; Myhre, C.E.L.; Samset, B.H.; Storelvmo, T. Aerosols and their Relation to Global Climate and Climate Sensitivity. Nat. Educ. Knowl. 2013, 4, 7. [Google Scholar]
- Stocker, T.F.; Qin, D.; Plattner, G.-K.; Tignor, M.; Allen, S.K.; Boschung, J.; Nauels, A.; Xia, Y. Climate Change 2013: The Physical Science Basis. Contribution of Working Group I to the Fifth Assessment Report of the Intergovernmental Panel on Climate Change; Bex, V., Midgley, P.M., Eds.; Cambridge University Press: Cambridge, UK; New York, NY, USA, 2013; p. 1535. [Google Scholar] [CrossRef] [Green Version]
- Aas, W.; Mortier, A.; Bowersox, V.; Cherian, R.; Faluvegi, G.; Fagerli, H.; Hand, J.; Klimont, Z.; Galy-Lacaux, C.; Lehmann, C.M.B.; et al. Global and regional trends of atmospheric sulfur. Sci. Rep. 2009, 9, 953. [Google Scholar] [CrossRef]
- Bergin, M.S.; West, J.J.; Keating, T.J.; Russel, A.G. Regional atmospheric pollution and transboundary air quality management. Annu. Rev. Environ. Resour. 2005, 30, 1–37. [Google Scholar] [CrossRef]
- Holben, B.N.; Eck, T.F.; Slutsker, I.; Tanré, D.; Buis, J.P.; Setzer, A.; Vermote, E.; Reagan, J.A.; Kaufman, Y.J.; Nakajima, T.; et al. AERONET—A federated instrument network and data archive for aerosol characterization. Remote Sens. Environ. 1998, 66, 1–16. [Google Scholar] [CrossRef]
- Smirnov, A.; Holben, B.N.; Slutsker, I.; Giles, D.M.; McClain, C.R.; Eck, T.F.; Sakerin, S.M.; Macke, A.; Croot, P.; Zibordi, G.; et al. Maritime Aerosol Network as a component of Aerosol Robotic Network. J. Geophys. Res. 2009, 114, D06204. [Google Scholar] [CrossRef] [Green Version]
- Takamura, T.; Nakajima, T. Overview of SKYNET and its activities. Opt. Pura Apl. 2004, 37, 3303–3308. [Google Scholar]
- Pappalardo, G.; Amodeo, A.; Apituley, A.; Comeron, A.; Freudenthaler, V.; Linné, H.; Ansmann, A.; Bösenberg, J.; D’Amico, G.; Mattis, I.; et al. EARLINET: Towards an advanced sustainable European aerosol lidar network. Atmos. Meas. Tech. 2014, 7, 2389–2409. [Google Scholar] [CrossRef] [Green Version]
- Welton, E.J.; Campbell, J.R.; Spinhirne, J.D.; Scott, V.S. Global monitoring of clouds and aerosols using a network of micro-pulse lidar systems. Proc. SPIE 2001, 4153, 151–158. [Google Scholar]
- Sugimoto, N.; Nishizawa, T.; Shimizu, A.; Matsui, I.; Jin, Y. Characterization of aerosols in East Asia with the Asian Dust and aerosol lidar observation network (AD-Net). Proc. SPIE 2014, 9262, 92620K. [Google Scholar] [CrossRef]
- Che, H.; Zhang, X.Y.; Chen, H.B.; Damiri, B.; Goloub, P.; Li, Z.Q.; Zhang, X.C.; Wei, Y.; Zhou, H.G.; Dong, F.; et al. Instrument calibration and aerosol optical depth validation of the China Aerosol Remote Sensing Network. J. Geophys. Res. 2009, 114, D03206. [Google Scholar] [CrossRef]
- Dao, X.; Lin, Y.; Cao, F.; Di, S.; Hong, Y.; Xing, G.; Li, J.; Fu, P.; Zhang, Y. Introduction to the National Aerosol Chemical Composition Monitoring Network of China: Objectives, Current Status, and Outlook. Bull. Am. Meteorol. Soc. 2019, 100, ES337–ES351. [Google Scholar]
- Laj, P.; Bigi, A.; Rose, C.; Andrews, E.; Lund Myhre, C.; Collaud Coen, M.; Lin, Y.; Wiedensohler, A.; Schulz, M.; Ogren, J.A.; et al. A global analysis of climate-relevant aerosol properties retrieved from the network of Global Atmosphere Watch (GAW) near-surface observatories. Atmos. Meas. Tech. 2020, 13, 4353–4392. [Google Scholar] [CrossRef]
- Wielgosiński, G.; Czerwińska, J. Smog Episodes in Poland. Atmosphere 2020, 11, 277. [Google Scholar] [CrossRef] [Green Version]
- Markowicz, K.M.; Chiliński, M.T.; Lisok, J.; Zawadzka, O.; Stachlewska, I.S.; Janicka, L.; Rozwadowska, A.; Makuch, P.; Pakszys, P.; Zieliński, T.; et al. Study of aerosol optical properties during long-range transport of biomass burning from Canada to Central Europe in July 2013. J. Aerosol Sci. 2016, 101, 156–173. [Google Scholar] [CrossRef]
- Stachlewska, I.S.; Samson, M.; Zawadzka, O.; Harenda, K.M.; Janicka, L.; Poczta, P.; Szczepanik, D.; Heese, B.; Wang, D.; Borek, K.; et al. Modification of Local Urban Aerosol Properties by Long-Range Transport of Biomass Burning Aerosol. Remote Sens. 2018, 10, 412. [Google Scholar] [CrossRef] [Green Version]
- Stachlewska, I.S.; Zawadzka, O.; Engelmann, R. Effect of Heat Wave Conditions on Aerosol Optical Properties Derived from Satellite and Ground-Based Remote Sensing over Poland. Remote Sens. 2017, 9, 1199. [Google Scholar] [CrossRef] [Green Version]
- Papayannis, A.; Amiridis, V.; Mona, L.; Tsaknakis, G.; Balis, D.; Bösenberg, J.; Chaikovski, A.; De Tomasi, F.; Grigorov, I.; Mattis, I.; et al. Systematic lidar observations of Saharan dust over Europe in the frame of EARLINET (2000–2002). J. Geophys. Res. 2008, 113, D10204. [Google Scholar] [CrossRef] [Green Version]
- Morys, M.; Mims, F.M.; Hagerup, S.; Anderson, S.E.; Baker, A.; Kia, J.; Walkup, T. Design, calibration, and performance of MICROTOPS II handheld ozone monitor and Sun photometer. J. Geophys. Res. 2001, 106, 14573–14582. [Google Scholar] [CrossRef] [Green Version]
- Serrano, A.; Sanchez, G.; Cancillo, M.L. Correcting Daytime Thermal Offset in Unventilated Pyranometers. J. Atmos. Ocean. Technol. 2015, 32, 2088–2099. [Google Scholar] [CrossRef]
- Michalsky, J.J.; Kutchenreiter, M.; Long, C.N. Significant Improvements in Pyranometer Nighttime Offsets Using High-Flow DC Ventilation. J. Atmos. Ocean. Technol. 2017, 34, 1323–1332. [Google Scholar] [CrossRef]
- Markowicz, K.M.; Chiliński, M.T. Evaluation of Two Low-Cost Optical Particle Counters for the Measurement of Am-942 bient Aerosol Scattering Coefficient and Ångström Exponent. Sensors 2020, 20, 2617. [Google Scholar] [CrossRef]
- Smirnov, A.; Holben, B.N.; Eck, T.F.; Dubovik, O. Cloud-screening and quality control algorithms for the AERONET database. Remote Sens. Environ. 2000, 73, 337–349. [Google Scholar] [CrossRef]
- Alexandrov, M.D.; Marshak, A.; Cairns, B.; Lacis, A.A.; Carlson, B.E. Automated cloud screening algorithm for MFRSR data. Geophys. Res. Lett. 2004, 31, L04118. [Google Scholar] [CrossRef]
- Justus, C.G.; Paris, M.V. A model for solar spectral irradiance and radiance at the bottom and top of a cloudless atmosphere. J. Clim. Appl. Meteorol. 1985, 24, 193–205. [Google Scholar] [CrossRef] [Green Version]
- Müller, T.; Laborde, M.; Kassell, G.; Wiedensohler, A. Design and performance of a three-wavelength LED-based total scatter and backscatter integrating nephelometer. Atmos. Meas. Tech. 2011, 4, 1291–1303. [Google Scholar] [CrossRef] [Green Version]
- Anderson, T.L.; Covert, D.S.; Marshall, S.F.; Laucks, M.L.; Charlson, R.J.; Waggoner, A.P.; Ogren, J.A.; Caldow, R.; Holm, R.L.; Quant, F.R.; et al. Performance characteristics of a high-sensitivity, three-wavelength, total scatter/backscatter nephelometer. J. Atmos. Ocean. Technol. 1996, 13, 967–986. [Google Scholar] [CrossRef] [Green Version]
- Collaud Coen, M.; Weingartner, E.; Apituley, A.; Ceburnis, D.; Fierz-Schmidhauser, R.; Flentje, H.; Henzing, J.S.; Jennings, S.G.; Moerman, M.; Petzold, A.; et al. Minimizing light absorption measurement artifacts of the Aethalometer: Evaluation of five correction algorithms. Atmos. Meas. Tech. 2010, 3, 457–474. [Google Scholar] [CrossRef] [Green Version]
- Baars, H.; Kanitz, T.; Engelmann, R.; Althausen, D.; Heese, B.; Komppula, M.; Preißler, J.; Tesche, M.; Ansmann, A.; Wandinger, U.; et al. An overview of the first decade of PollyNET: An emerging network of automated Raman-polarization lidars for continuous aerosol profiling. Atmos. Chem. Phys. 2016, 16, 5111–5137. [Google Scholar] [CrossRef] [Green Version]
- Wang, D.; Stachlewska, I.S.; Delanoë, J.; Ene, D.; Song, X.; Schüttemeyer, D. Spatio-temporal discrimination of molecular, aerosol and cloud scattering and polarization using a combination of a Raman lidar, Doppler cloud radar and microwave radiometer. Opt. Express 2020, 28, 20117–20134. [Google Scholar] [CrossRef]
- Freudenthaler, V. About the effects of polarising optics on lidar signals and the Δ90 calibration. Atmos. Meas. Tech. 2016, 9, 4181–4255. [Google Scholar] [CrossRef] [Green Version]
- Engelmann, R.; Kanitz, T.; Baars, H.; Heese, B.; Althausen, D.; Skupin, A.; Wandinger, U.; Komppula, M.; Stachlewska, I.S.; Amiridis, V.; et al. The automated multiwavelength Raman polarization and water-vapor lidar PollyXT: The neXT generation. Atmos. Meas. Tech. 2016, 9, 1767–1784. [Google Scholar] [CrossRef] [Green Version]
- Veselovskii, I.; Kolgotin, A.; Griaznov, V.; Müller, D.; Franke, K.; Whiteman, D.N. Inversion of multiwavelength Raman lidar data for retrieval of bimodal aerosol size distribution. Appl. Opt. 2004, 43, 1180–1195. [Google Scholar] [CrossRef] [PubMed]
- Janicka, L.; Stachlewska, I.S.; Veselovskii, I.; Baars, H. Temporal variations in optical and microphysical properties of mineral dust and biomass burning aerosol derived from daytime Raman lidar observations over Warsaw, Poland. Atmos. Environ. 2017, 169, 162–174. [Google Scholar] [CrossRef]
- Böckmann, C.; Mironova, I.; Müller, D.; Schneidenbach, L.; Nessler, R. Microphysical aerosol parameters from multiwavelength lidar. J. Opt. Soc. Am. 2005, 22, 518–528. [Google Scholar] [CrossRef]
- Ortiz-Amezcua, P.; Guerrero-Rascado, J.L.; Granados-Muñoz, M.J.; Benavent-Oltra, J.A.; Böckmann, C.; Samaras, S.; Stachlewska, I.S.; Janicka, Ł.; Baars, H.; Bohlmann, S.; et al. Microphysical characterization of long-range transported biomass burning particles from North America at three EARLINET stations. Atmos. Chem. Phys. 2017, 17, 5931–5946. [Google Scholar] [CrossRef] [Green Version]
- Stachlewska, I.S.; Costa-Suros, M.; Althausen, D. Raman lidar water vapor profiling over Warsaw, Poland. Atmos. Res. 2017, 194, 258–267. [Google Scholar] [CrossRef]
- Wang, D.; Stachlewska, I.S.; Song, X.; Heese, B.; Nemuc, A. Variability of the Boundary Layer Over an Urban Continental Site Based on 10 Years of Active Remote Sensing Observations in Warsaw. Remote Sens. 2020, 12, 340. [Google Scholar] [CrossRef] [Green Version]
- Stachlewska, I.; Piądłowski, M.; Migacz, S.; Szkop, A.; Zielińska, A.; Swaczyna, P. Ceilometer observations of the boundary layer over Warsaw, Poland. Acta Geophys. 2012, 60, 1386–1412. [Google Scholar] [CrossRef]
- Szczepanik, D.; Stachlewska, I.S.; Tetoni, E.; Althausen, D. Properties of Saharan Dust versus Local Urban Dust—A case study. Earth Space Sci. 2021, 8, e2021EA001816. [Google Scholar] [CrossRef]
- Berk, A.; Anderson, G.P.; Acharya, P.K.; Bernstein, L.S.; Muratov, L.; Lee, J.; Fox, M.J.; Adler-Golden, S.M.; Chetwynd, J.H.; Hoke, M.L.; et al. MODTRAN5: A reformulated atmospheric band model with auxiliary species and practical multiple scattering options, Proc. SPIE 5655. Multispectr. Hyperspectr. Remote Sens. Instrum. Appl. II 2005, 5655, 88–95. [Google Scholar] [CrossRef]
- Fu, Q.; Liou, K.N. On the correlated k-distribution method for radiative transfer in nonhomogeneous atmospheres. J. Atmos. Sci. 1992, 49, 2139–2156. [Google Scholar] [CrossRef] [Green Version]
- Conant, W.C. An observational approach for determining aerosol surface radiative forcing: Results from the first field phase of INDOEX. J. Geophys. Res. 2000, 105, 15347–15360. [Google Scholar] [CrossRef]
- Karlsson, K.-G.; Anttila, K.; Trentmann, J.; Stengel, M.; Fokke Meirink, J.; Devasthale, A.; Hanschmann, T.; Kothe, S.; Jääskeläinen, E.; Sedlar, J.; et al. CLARA-A2: The second edition of the CM SAF cloud and radiation data record from 34 years of global AVHRR data. Atmos. Chem. Phys. 2017, 17, 5809–5828. [Google Scholar] [CrossRef] [Green Version]
- Markowicz, K.M.; Ritter, C.; Lisok, J.; Makuch, P.; Stachlewska, I.S.; Cappelletti, D.; Mazzola, M.; Chilinski, M.T. Vertical variability of aerosol single-scattering albedo and black carbon concentration based on in-situ and remote sensing techniques during iAREA campaigns in Ny-Ålesund. Atmos. Environ. 2017, 164, 431–447. [Google Scholar] [CrossRef] [Green Version]
- Markowicz, K.M.; Zawadzka, O.; Lisok, J.; Chilinski, M.T.; Xian, P. Impact of moderate absorbing aerosol on surface sensible, latent and net radiative fluxes during summer of 2015 over Central Europe. J. Aerosol Sci. 2020, 151, 105627. [Google Scholar] [CrossRef]
- Zieliński, T.; Petelski, T.; Makuch, P.; Strzałkowska, A.; Ponczkowska, A.; Markowicz, K.M.; Chourdakis, G.; Georgoussis, G.; Kratzer, S. Studies of Aerosols Advected to Coastal Areas with the Use of Remote Techniques. Acta Geophys. 2012, 60, 1359–1385. [Google Scholar] [CrossRef]
- Zawadzka, O.; Makuch, P.; Markowicz, K.M.; Zieliński, T.; Petelski, T.; Ulevicius, V.; Strzałkowska, A.; Rozwadowska, A.; Gutowska, D. Studies of Aerosol Optical Depth with the Use of Microtops II Sun Photometers and MODIS Detectors in Coastal Areas of the Baltic Sea. Acta Geophys. 2014, 62, 400–422. [Google Scholar] [CrossRef]
- Zawadzka, O.; Markowicz, K.M. Retrieval of Aerosol Optical Depth from Optimal Interpolation Approach Applied to SEVIRI Data. Remote Sens. 2014, 6, 7182–7211. [Google Scholar] [CrossRef] [Green Version]
- Krówczyńska, M.; Wilk, E.; Pabjanek, P.; Zagajewski, B.; Meuleman, K. Mapping asbestos-cement roofing with the use of APEX hyperspectral airborne imagery: Karpacz area, Poland—A case study. Misc. Geogr. 2016, 20, 41–46. [Google Scholar] [CrossRef] [Green Version]
- Chiliński, M.T.; Markowicz, K.M.; Zawadzka, O.; Stachlewska, I.S.; Kumala, W.; Petelski, T.; Makuch, P.; Westphal, D.L.; Zagajewski, B. Modelling and observation of mineral dust optical properties over Central Europe. Acta Geophys. 2016, 64, 2550–2590. [Google Scholar] [CrossRef]
- Markuszewski, P.; Petelski, T.; Zielinski, T. Marine aerosol fluxes determined by simultaneous measurements of eddy covariance and gradient method. Environ. Eng. Manag. J. 2018, 17, 261–265. [Google Scholar] [CrossRef]
- Makuch, P.; Sitarek, S.; Markuszewski, P.; Petelski, T.; Stacewicz, T. Lidar observation of aerosol transformation in the atmospheric boundary layer above the Baltic Sea. Oceanologia 2021, 63, 238–246. [Google Scholar] [CrossRef]
- Chilinski, M.T.; Markowicz, K.M.; Markowicz, J. Observation of vertical variability of black carbon concentration in lower troposphere on campaigns in Poland. Atmos. Environ. 2016, 137, 155–170. [Google Scholar] [CrossRef]
- Chilinski, M.T.; Markowicz, K.M.; Kubicki, M. UAS as a support for atmospheric aerosols research. Pure Appl. Geophys. 2018, 175, 3325–3342. [Google Scholar] [CrossRef] [Green Version]
- Zawadzka, O.; Posyniak, M.; Nelken, K.; Markuszewski, P.; Chiliński, M.T.; Czyżewska, D.; Lisok, J.; Markowicz, K.M. Study of the vertical variability of the aerosol properties based on cable cars in-situ measurements. Atmos. Pollut. Res. 2017, 8, 968–978. [Google Scholar] [CrossRef]
- Posyniak, M.; Markowicz, K.M.; Czyżewska, D.; Chiliński, M.; Makuch, P.; Zawadzka-Manko, O.; Kucięba, S.; Kulesza, K.; Kachniarz, K.; Mijal, K.; et al. Experimental study of smog microphysical and optical vertical structure in the mountain area—Poland. J. Pollut. Res. 2021, 12, 101171. [Google Scholar] [CrossRef]
- Wang, D.; Szczepanik, D.; Stachlewska, I.S. Interrelations between surface, boundary layer, and columnar aerosol properties over a continental urban site. Atmos. Chem. Phys. 2019, 19, 13097–13128. [Google Scholar] [CrossRef] [Green Version]
- Wang, D.; Stachlewska, I.S. Stratospheric Smoke Properties Based on Lidar Observations in Autumn 2017 Over Warsaw. EPJ Web Conf. 2020, 237, 02033. [Google Scholar] [CrossRef]
- Markowicz, K.M.; Zawadzka-Manko1, O.; Posyniak, M. A large reduction of direct aerosol cooling over Poland in the last decades. Int. J. Climatol. 2021. [Google Scholar]
- Posyniak, M.; Szkop, A.; Pietruczuk, A.; Podgórski, J.; Krzyścin, J. The Long-Term (1964–2014) Variability of Aerosol Optical Thickness and its Impact on Solar Irradiance Based on the Data Taken at Belsk, Poland. Acta Geophys. 2016, 64, 1858–1874. [Google Scholar] [CrossRef] [Green Version]
- Markowicz, K.M.; Zawadzka, O.; Posyniak, M.; Uscka-Kowalkowska, J. Long-term variability of aerosol optical depth in the Tatra Mountains region of the Central Europe. J. Geophys. Res. 2019, 124, 3464–3475. [Google Scholar] [CrossRef]
- Markowicz, K.M.; Uscka-Kowalkowska, J. Long-term and seasonal variability of the aerosol optical depth at Mt. Kasprowy Wierch (Poland). J. Geophys. Res. 2015, 120, 1865–1879. [Google Scholar] [CrossRef]
- Chiliński, M.T.; Markowicz, K.M.; Zawadzka, O.; Stachlewska, I.S.; Lisok, J.; Makuch, P. Comparison of columnar, surface and UAS profiles of absorbing aerosol optical depth and single scattering albedo. Atmosphere 2019, 10, 446. [Google Scholar] [CrossRef] [Green Version]
- Harenda, K.M.; Samson, M.; Juszczak, R.; Markowicz, K.M.; Stachlewska, I.S.; Kleniewska, M.; MacArthur, A.; Schüttemeyer, D.; Chojnicki, B.H. Impact of Atmospheric Optical Properties on Net Ecosystem Productivity of Peatland in Poland. Remote Sens. 2021, 13, 2124. [Google Scholar] [CrossRef]
- Pietruczuk, A.; Chaikovsky, A. Variability of aerosol properties during the 2007–2010 spring seasons over central Europe. Acta Geophys. 2012, 60, 1338–1358. [Google Scholar] [CrossRef]
- Szczepanik, D.; Markowicz, K.M. The relation between columnar and surface aerosol optical properties in a background environment. Atmos. Pollut. Res. 2018, 9, 246–256. [Google Scholar] [CrossRef]
- Zawadzka, O.; Markowicz, K.M.; Pietruczuk, A.; Zielinski, T.; Jarosławski, J. Impact of urban pollution emitted in Warsaw on aerosol properties. Atmos. Environ. 2013, 69, 15–28. [Google Scholar] [CrossRef]
- Sokół, P.; Stachlewska, I.S.; Ungureanu, I.; Stefan, S. Evaluation of the Boundary Layer Morning Transition Using the CL-31 Ceilometer Signals. Acta Geophys. 2014, 62, 367–380. [Google Scholar] [CrossRef]
- Petelski, T. Marine aerosol fluxes over open sea calculated from vertical concentration gradients. J. Aerosol Sci. 2003, 34, 359–371. [Google Scholar] [CrossRef]
- Petelski, T.; Markuszewski, P.; Makuch, P.; Jankowski, A.; Rozwadowska, A. Studies of vertical coarse aerosol fluxes in the boundary layer over the Baltic Sea. Oceanologia 2014, 56, 697–710. [Google Scholar] [CrossRef] [Green Version]
- Markuszewski, P.; Kosecki, S.; Petelski, T. Sea spray aerosol fluxes in the Baltic Sea region: Comparison of the WAM model with measurements. Estuar. Coast. Shelf Sci. 2017, 195, 16–22. [Google Scholar] [CrossRef]
- Massel, S.R. Chapter 9 Marine aerosol fluxes. In Ocean Waves Breaking and Marine Aerosol Fluxes; Springer: New York, NY, USA, 2007; p. 229e246. [Google Scholar]
- Nilsson, E.D.; Rannik, Ü.; Swietlicki, E.; Leck, C.; Aalto, P.P.; Zhou, J.; Norman, M. Turbulent aerosol fluxes over the Arctic Ocean: 2. Wind-driven sources from the sea. J. Geophys. Res. Atmos. 2001, 106, 32139–32154. [Google Scholar] [CrossRef]
- Nilsson, E.D.; Hultin, K.A.; Mårtensson, E.M.; Markuszewski, P.; Rosman, K.; Krejci, R. Baltic Sea Spray Emissions: In Situ Eddy Covariance Fluxes vs. Simulated Tank Sea Spray. Atmosphere 2021, 12, 274. [Google Scholar] [CrossRef]
- Markuszewski, P.; Klusek, Z.; Nilsson, E.D.; Petelski, T. Observations on relations between marine aerosol fluxes and surface-generated noise in the southern Baltic Sea. Oceanologia 2020, 62, 413–427. [Google Scholar] [CrossRef]
- Kaminski, J.W.; Neary, L.; Struzewska, J.; McConnell, J.C.; Lupu, A.; Jarosz, J.; Toyota, K.; Gong, S.L.; Liu, X.; Chance, K.; et al. GEM-AQ, an on-line global multiscale chemical weather modelling system: Model description and evaluation of gas phase chemistry processes. Atmos. Chem. Phys. 2008, 8, 3255–3281. [Google Scholar] [CrossRef] [Green Version]
- Struzewska, J.; Kaminski, J.W.; Jefimow, M. Application of model output statistics to the GEM-AQ high resolution air quality forecast. Atmos. Res. 2016, 181, 186–199. [Google Scholar] [CrossRef]
- Werner, M.; Kryza, M.; Guzikowski, J. Can data assimilation of surface PM2.5 and Satellite AOD improve WRF-Chem Forecasting? A case study for two scenarios of particulate air pollution episodes in Poland. Remote Sens. 2019, 11, 2364. [Google Scholar] [CrossRef] [Green Version]
- Lynch, P.; Reid, J.S.; Westphal, D.L.; Zhang, J.; Hogan, T.F.; Hyer, E.J.; Curtis, C.A.; Hegg, D.A.; Shi, Y.; Campbell, J.R.; et al. An 11-year global gridded aerosol optical thickness reanalysis (v1.0) for atmospheric and climate sciences. Geosci. Model Dev. 2017, 9, 1489–1522. [Google Scholar] [CrossRef] [Green Version]
- Markowicz, K.M.; Flatau, P.J.; Remiszewska, J.; Witek, M.; Reid, E.A.; Reid, J.S.; Bucholtz, A.; Holben, B. Observations and Modeling of the Surface Aerosol Radiative Forcing during UAE2. J. Atmos. Sci. 2008, 65, 2877–2891. [Google Scholar] [CrossRef]


| Station | Coordinates Lat., Lon., Alt. | Type of Station | Additional Information | Year Established |
|---|---|---|---|---|
| Belsk (IG PAS) | 51.83 N, 20.80E, 180 m | Rural | EARLINET (2000) AERONET (2002) | 1965 |
| Borucino (UG) | 54.26 N, 17.97 E, 163 m | Rural | - | 1961 |
| Debrzyna (PULS) | 53.78 N, 16.59 E, 158 m | Rural | AERONET (2020) | 2020 |
| Raciborz (IG PAS) | 50.08 N, 18.19 E, 230 m | Urban | AERONET (2015) | 2015 |
| Rzecin (PULS) | 52.75 N, 16.31 E, 57 m | Rural | AERONET (2016) | 2016 |
| Sopot (IO PAS) | 54.45 N, 18.56 E, 10 m | Costal-Urban | - | 2011 |
| Strzyzow (SolarAOT, FUW) | 49.88 N, 21.86 E, 444 m | Rural-Mount | AERONET (2013) | 2004 |
| Torun | 53.02 N, 18.57 E, 58 m | Urban | - | 2009 |
| Warsaw (FUW) | 52.21 N, 20.98 E, 115 m | Urban | PollyNET (2013) EARLINET (2015) AERONET (2018) | 2005 |
| Wroclaw (UWr) | 51.10 N, 17.09 E, 116 m | Urban | - | 1946 |
Publisher’s Note: MDPI stays neutral with regard to jurisdictional claims in published maps and institutional affiliations. |
© 2021 by the authors. Licensee MDPI, Basel, Switzerland. This article is an open access article distributed under the terms and conditions of the Creative Commons Attribution (CC BY) license (https://creativecommons.org/licenses/by/4.0/).
Share and Cite
Markowicz, K.M.; Stachlewska, I.S.; Zawadzka-Manko, O.; Wang, D.; Kumala, W.; Chilinski, M.T.; Makuch, P.; Markuszewski, P.; Rozwadowska, A.K.; Petelski, T.; et al. A Decade of Poland-AOD Aerosol Research Network Observations. Atmosphere 2021, 12, 1583. https://0-doi-org.brum.beds.ac.uk/10.3390/atmos12121583
Markowicz KM, Stachlewska IS, Zawadzka-Manko O, Wang D, Kumala W, Chilinski MT, Makuch P, Markuszewski P, Rozwadowska AK, Petelski T, et al. A Decade of Poland-AOD Aerosol Research Network Observations. Atmosphere. 2021; 12(12):1583. https://0-doi-org.brum.beds.ac.uk/10.3390/atmos12121583
Chicago/Turabian StyleMarkowicz, Krzysztof M., Iwona S. Stachlewska, Olga Zawadzka-Manko, Dongxiang Wang, Wojciech Kumala, Michal T. Chilinski, Przemyslaw Makuch, Piotr Markuszewski, Anna K. Rozwadowska, Tomasz Petelski, and et al. 2021. "A Decade of Poland-AOD Aerosol Research Network Observations" Atmosphere 12, no. 12: 1583. https://0-doi-org.brum.beds.ac.uk/10.3390/atmos12121583