
Dynamics of Vegetation Net Primary Productivity and Its Response to Drought in the Mongolian Plateau

1
College of Geographical Science, Inner Mongolia Normal University, Hohhot 010022, China
2
Inner Mongolia Key Laboratory of Disaster and Ecological Security on the Mongolian Plateau, Inner Mongolia Normal University, Hohhot 010022, China
3
Inner Mongolia Key Laboratory of Remote Sensing and Geographic Information Systems, Inner Mongolia Normal University, Hohhot 010022, China
*
Author to whom correspondence should be addressed.
Atmosphere 2021, 12(12), 1587; https://0-doi-org.brum.beds.ac.uk/10.3390/atmos12121587
Submission received: 2 November 2021
/
Revised: 24 November 2021
/
Accepted: 25 November 2021
/
Published: 29 November 2021
(This article belongs to the Special Issue Vegetation and Climate Relationships)
Abstract
:Vegetation net primary productivity (NPP) is an important aspect of the global carbon cycle, and its change is closely related to climate change. This study analyzed the spatial-temporal variation of the standardized precipitation evapotranspiration index (SPEI) and NPP in the Mongolian Plateau, and investigated the effect of drought on NPP. To this end, NPP was simulated using the Carnegie-Ames-Stanford Approach (CASA) model. The results showed that from 1982 to 2014, NPP exhibited an upward trend in different seasons, and a significant increasing trend in most areas in the growing season and spring. The degree of drought also showed an increasing trend in each season. Moreover, the decrease in NPP and SPEI in Mongolia was larger than that in Inner Mongolia. Vegetation showed a positive correlation with SPEI in the growing season and summer, but a negative correlation in the other seasons. Moreover, the impact of drought on vegetation in the growing season showed a lag effect, whereas the lag response was inconspicuous during the early stages of the growing season. Different vegetation NPP responded strongly to the SPEI of the current month and the previous month.
1. Introduction
With the aggravation of global warming and drying, the frequency of droughts has increased sharply, posing a significant threat to human survival [1,2,3]. The Six Assessment Report (AR6) of the Intergovernmental Panel on Climate Change (IPCC) has claimed that since 1850–1900, the global average surface temperature has increased by about 1 °C. Moreover, from the average temperature changes over the next 20 years, global warming is expected to reach or exceed 1.5 °C [4,5,6]. Chinese and international scholars have studied the problem of drought in recent years and reported that drought events are characterized by high frequency and large impact range, seriously affecting national economies [7,8,9]. Moreover, with climate warming and the intensification of human activities, droughts have caused many ecological problems [10]. Studying the causes and changes in drought is significant for solving the problem of drought. As a system for human survival and development, the terrestrial ecosystem has gradually become a hot topic in climate change research [11,12]. Vegetation is the main component of terrestrial ecosystems and plays a crucial role in global climate change [13]. The productivity of vegetation affects human production and life. Net primary productivity (NPP) is the organic matter accumulated by plants in unit time and area, that is, the organic carbon fixed by photosynthesis, minus the part consumed by plant respiration [14]. NPP is not only an important basis for regulating terrestrial ecological processes and an important variable characterizing vegetation activity, it also reflects the dynamic response of the carbon cycle to global climate change [12]. Therefore, NPP has become an indispensable index and the focus in studies on the impact of climate change on terrestrial ecosystems [15]. Quantitative analysis of the spatial and temporal changes of NPP is of great significance for understanding changes in ecosystems.
In recent years, domestic and foreign scholars have been focusing on the study of drought and NPP. Zhao et al. [16] studied the impact of global drought events on NPP from 2002 to 2009, and found that large-scale drought directly led to the decline of plant community productivity. Based on MODIS17A2H data, Yu et al. [17] concluded that the occurrence of drought events would significantly reduce the net primary productivity of grasslands in Northeast China. Chen et al. [18] analyzed the effects of drought on NPP at a global scale, and found a positive correlation between NPP and the Standardized Precipitation Evapotranspiration Index (SPEI) in arid and semi-arid areas, especially in areas at 20–50° N, where vegetation is more sensitive to drought. Lai et al. [19] analyzed the spatial and temporal distribution of NPP and the impact of drought on NPP in mainland China during 1982–2015, and found a positive correlation between NPP and SPEI, with NPP being mainly affected by drought in most areas. Yang et al. [20] found that the state of vegetation growth in North China was highly consistent with the spatial distribution of drought, and that SPEI was highly correlated with NPP; they reported that vegetation loss will increase with the increase in the scope and duration of drought. Sun et al. [21] analyzed the main influencing factors of NPP in Northeast China, and found that temperature and drought were the main drivers of changes in NPP. Under the condition of long and serious drought events, NPP showed a downward trend.
The Mongolian Plateau, which is located in the northern Hemisphere, mid-latitude, is an important geomorphic tectonic unit of Eurasia with a large north–south span, and belongs to a typical arid and semi-arid climate transition zone and fragile ecosystem zone [22]. The Mongolian Plateau has a typical arid and semi-arid climate type. With its unique geographical location and geomorphic characteristics, as well as the joint influence of the summer monsoon, winter monsoon and west wind, the climate system is extremely complex. Under the influence of global warming and drying phenomena, droughts occur frequently in the region, and the ecosystem is unbalanced. Studies have shown that droughts are the main reason for the decline of NPP in the global terrestrial ecosystem [23]. In recent years, many researchers have studied the relationship between vegetation and drought in the Mongolian Plateau. Most of them have mainly focused on the response of the normalized vegetation index (NDVI) to the climate, or its impact on drought, or separately studied drought and vegetation. For example, some scholars have found that due to successive droughts after 2000, the ecosystem of the Mongolian Plateau had offset 40% of the carbon sink accumulated in the 20th century [24]. Cao et al. [25] found that the areas where frequent and extreme drought events mainly occurred in the Mongolian Plateau had sparse vegetation and scarce precipitation. Tong et al. [26] showed that there was a large area of drought in the years with poor vegetation growth in the Mongolian Plateau, and that vegetation growth was the best in the years with a low degree of drought. However, few scholars have conducted research on the correlation between vegetation NPP and the SPEI of different vegetation types in the Mongolian Plateau.
Therefore, in this study, we used remote sensing data and meteorological data to simulate NPP by the Carnegie-Ames-Stanford Approach (CASA) model. Combining the NPP simulation and the standardized precipitation evapotranspiration index (SPEI) with Sen analysis and correlation analysis methods, droughts and changes in NPP over the Mongolian Plateau were analyzed, and the impact of drought on NPP was explored. The findings are expected to contribute crucial information for formulating corresponding drought prevention countermeasures and ecosystem restoration measures in the Mongolian Plateau.
2. Data and Methodology
2.1. Study Area
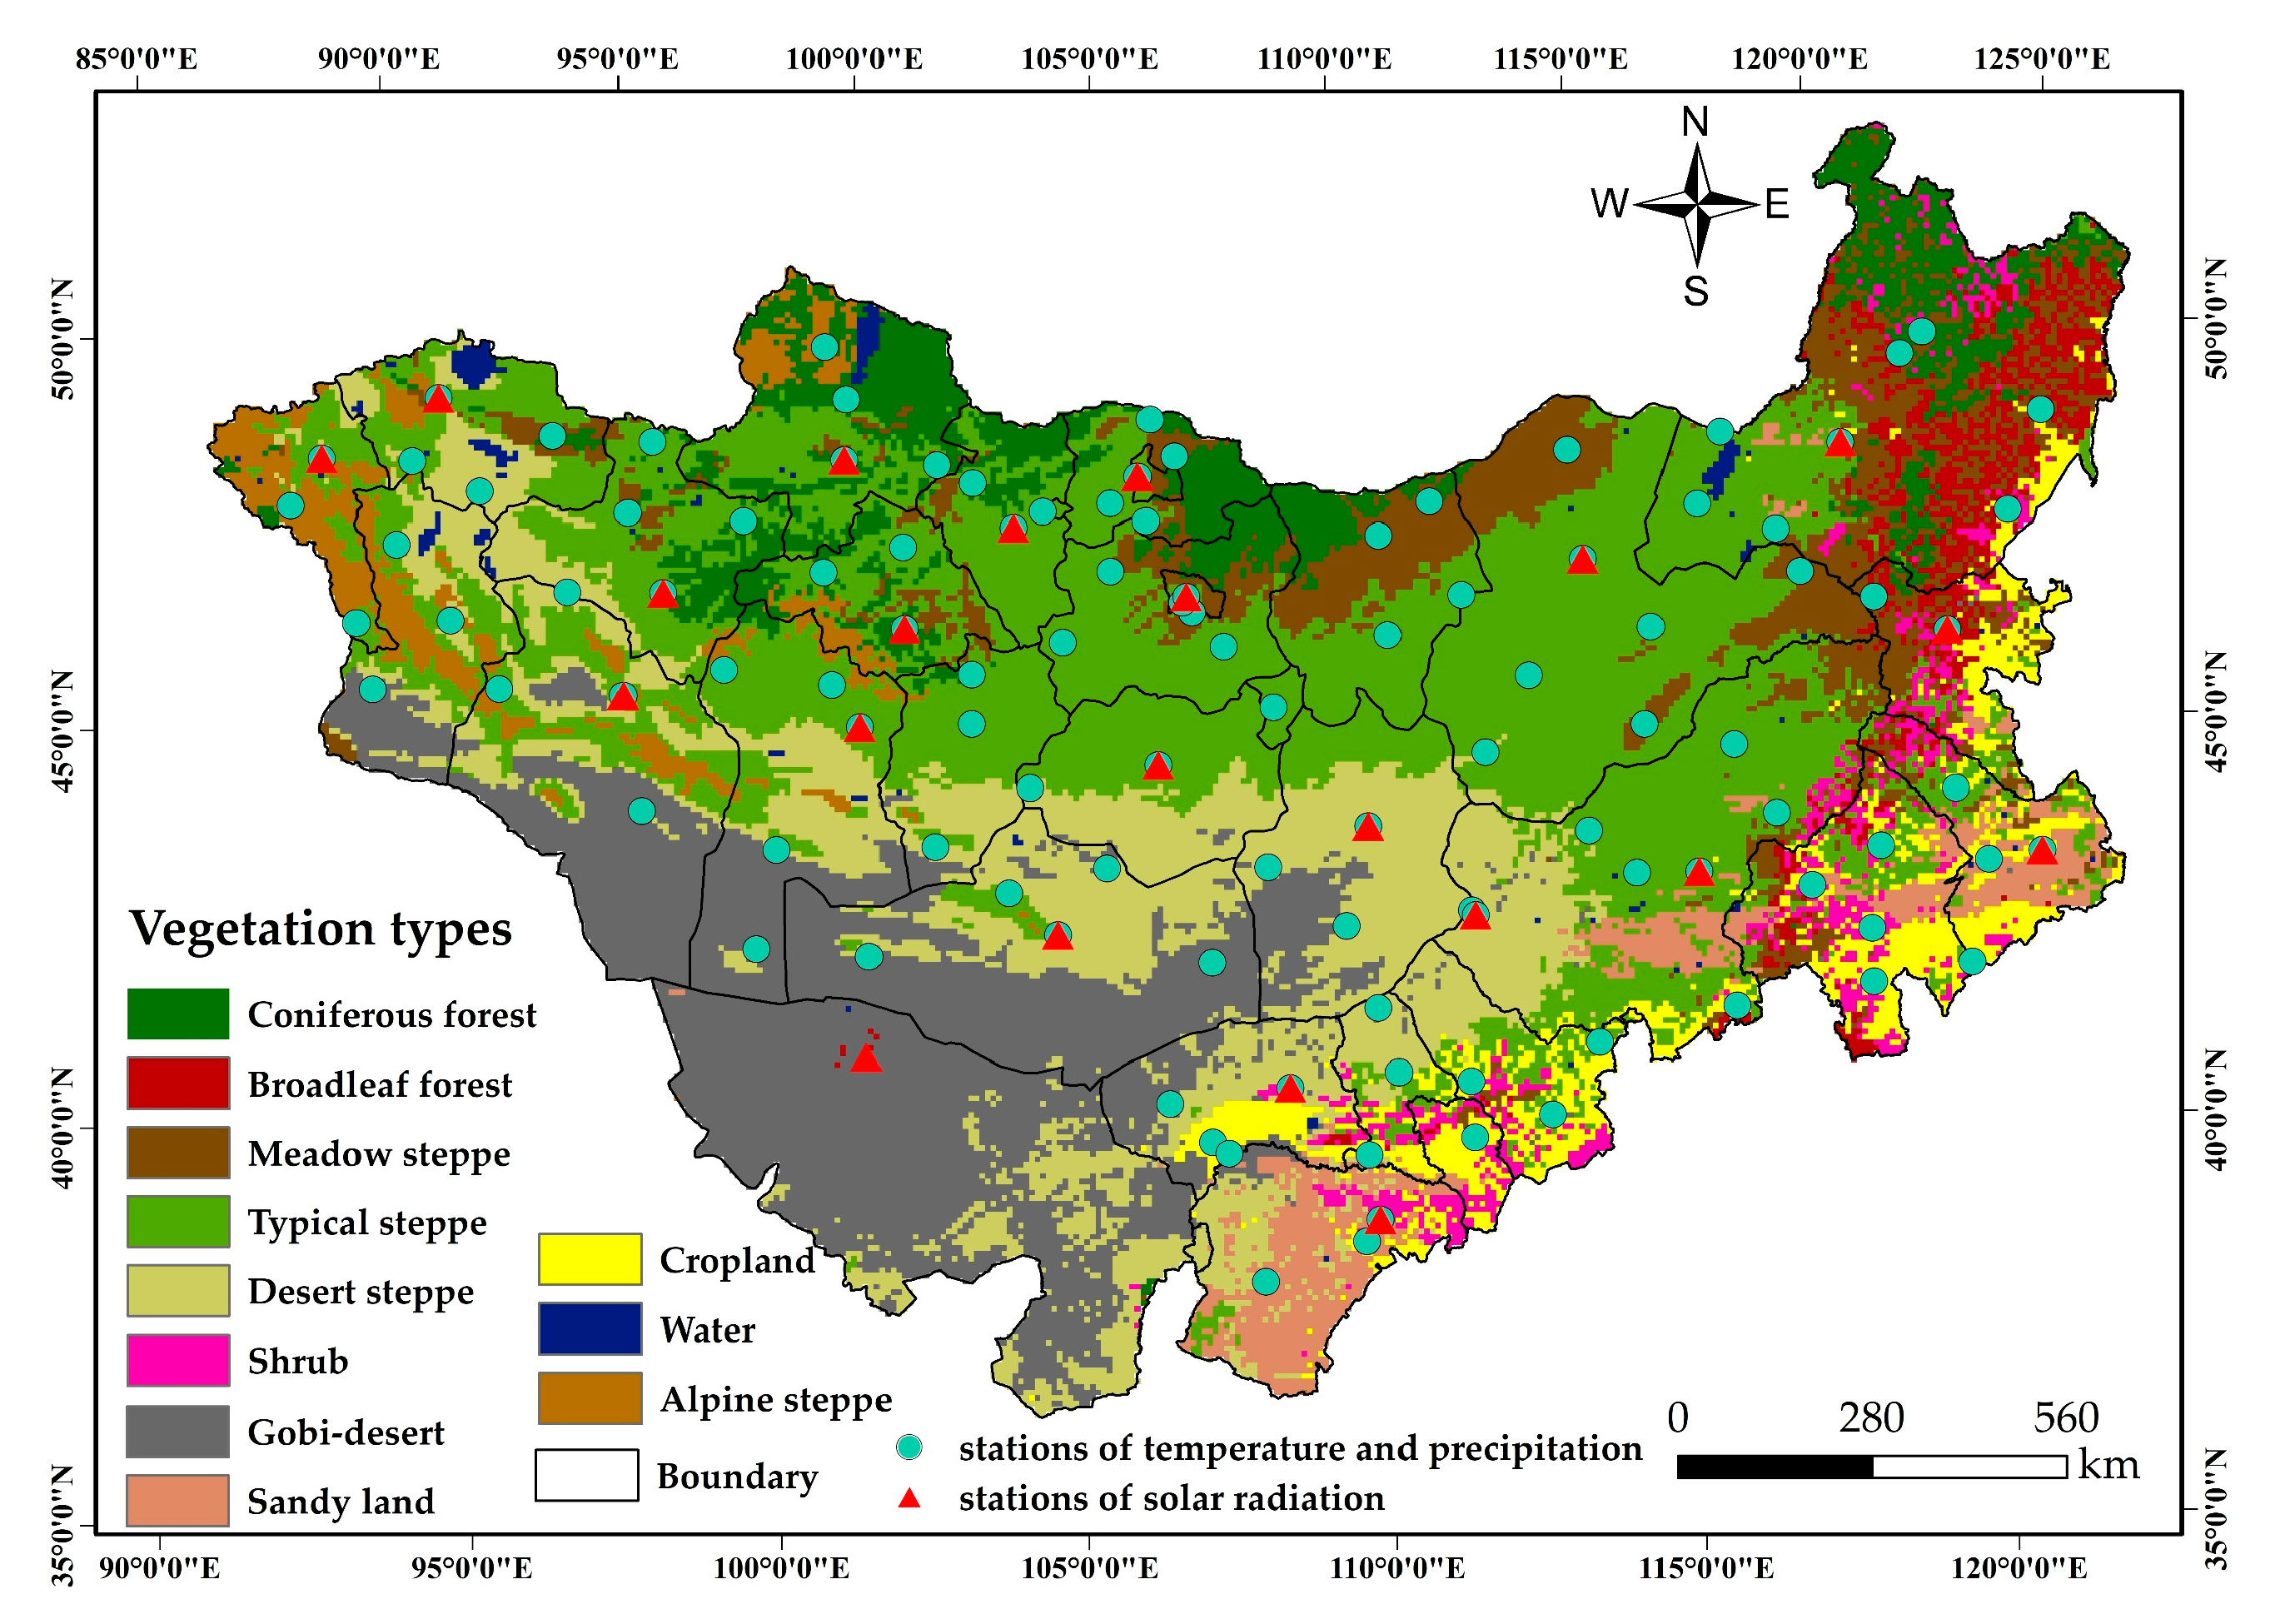
The Mongolian Plateau mainly comprises Mongolia and the Inner Mongolia of China. Its coordinates are 87.5–126.5° E and 32.5–53.5° N (Figure 1). As an inland plateau located far from the ocean, the Mongolian Plateau reaches the Great Khingan Mountains in the east, the Altai Mountains in the west, the Sayan Mountains, Kent hill and Yablonov Mountains in the north, and the Yinshan Mountains in the south [27]. The overall terrain decreases gradually from west to east. There are many mountains in the northwest and the vast Gobi in the southwest. The plateau is located in a mid-to-high latitude arid and semi-arid climate zone and is dominated by a temperate continental climate, which is highly sensitive to climate change. Figure 1 shows the distribution of vegetation types, meteorological stations and solar radiation stations in the Mongolian Plateau.
2.2. Datasets
Vegetation type data were obtained from the vegetation map of the Mongolian Plateau with a scale of 1:1,000,000, the vegetation map was first scanned, geometrically corrected, mosaicked, and digitized using the ArcGIS software and was then generated with a spatial resolution of 0.083°. Vegetation types in the study area can be divided into eleven categories: coniferous forest; broadleaf forest; meadow steppe; typical steppe; desert steppe; shrub; sandy land; cropland; alpine steppe; water, and the Gobi-desert, as shown in Figure 1. As vegetation is almost non-existent in the Gobi-desert and water types, only the nine other vegetation types were considered in this study.
In this study, the normalized difference vegetation index (NDVI) dataset was obtained from the Global Inventory Monitoring and Modelling Studies (GIMMS) of the National Aeronautics and Space Administration (NASA) (http://ecocast.arc.nasa.gov/data/pub/gimms/3g/, (accessed on 8 August 2020)). The meteorological data, such as monthly precipitation, monthly average temperature and monthly solar radiation during the period 1982–2014, came from the China Meteorological Science Data Sharing Service network (http://data.cma.cn/, (accessed on 8 August 2020)) and the Meteorological Bureau of Mongolia. Then, these data were interpolated by the Kriging method, to match the resolution with NPP data. We calculated NPP by applying the Carnegie-Ames-Stanford Approach (CASA) model, using the GIMMS NDVI data, temperature, precipitation, solar radiation, and vegetation classification data.
Moderate Resolution Imaging Spectroradiometer (MODIS) NPP data during 2000–2014 from the MOD17A3 dataset provided by NASA (https://ladsweb.modaps.eosdis.nasa.gov/, (accessed on 6 October 2020)) were used to validate the inversion of CASA NPP. The product included the net primary productivity, calculated on the basis of the Biome-BGC model, with a spatial resolution of 500 m and a yearly temporal resolution. To facilitate subsequent analysis, ArcGIS was used for resampling and projection conversion; all data were resampled to 8 km through the same resampling method in ArcGIS.
2.3. Methodology
2.3.1. Carnegie-Ames-Stanford Approach (CASA) Model
The CASA model is a process model based on the principle of light energy utilization efficiency. This model calculates NPP by considering the absorption of photosynthetically active radiation (APAR) by plants, and the actual light energy utilization (ε) [28,29]. With the advantages of easy application and rapid calculation, it is widely used to assess global and regional NPP [30,31]. The photosynthetic effective radiation absorbed by vegetation depends on the total solar radiation, and the proportion of photosynthetic active radiation absorbed by vegetation. The actual utilization rate of light energy relates to the efficiency of vegetation to convert the absorbed photosynthetically active radiation into organic carbon. The calculation formula is as follows:
In Equation (1), represents month; represents geographic location; is the photosynthetically active radiation absorbed by vegetation at pixel in month (MJ/m2/month); the calculation of APAR referred to the data of Zhu et al. [28] and Bao et al. [32], in which the APAR is determined by the total solar radiation amount and the absorption proportion of vegetation with photosynthetically active radiation (PAR); is the actual light energy utilization rate of vegetation at pixel in month (gC/MJ). In this study, the maximum light energy utilization rate of coniferous forest, broadleaf forest, and shrub was 0.485, 0.692, and 0.429, respectively. The maximum light energy utilization rate of other vegetation types was 0.542, which referred to the simulation results of Zhu et al. [33] and Bao et al. [34]. is the net primary productivity (gC/m2/ month) of vegetation at pixel in month (gC/m2/month).
2.3.2. Standardized Precipitation Evapotranspiration Index (SPEI)
SPEI is an index of meteorological drought conditions proposed by Vicente Serrano et al. [35]. The higher the SPEI value, the better the water condition, and vice versa. It comprehensively considers precipitation, evapotranspiration (ET) and temperature, and is widely used in drought research. Moreover, the Thornthwaite model was used to calculate the ET, which used air temperature and latitude to estimate evapotranspiration [36].
To reveal the specific situation of drought in the study area, SPEI values at different time scales were calculated. The SPEI values of the three-month time scale SPEI (SPEI3) in May, August and November were selected as representative values of seasonal drought, that is, spring (March–May), summer (June–August) and autumn (September–November). For drought in the growing season, the seven-month time scale SPEI (SPEI7) in October were selected.
2.3.3. Sen’s Trend Analysis
We adopted Sen’s method to analyze the trend of the time series of SPEI in the study area. Sen’s trend analysis [37,38] is an important method for assessing the trend of long time series data. This method does not require the data to follow a certain distribution, but considers the median value of the calculated sequence. It can effectively reduce noise interference, but cannot assess the significance of the sequence trend by itself. Therefore, we employed the Pearson and Mann–Kendall methods for the significance test.
In this study, Sen’s trend degree was used to represent the change trend of the time series. The calculation formula is as follows:
In Equation (2), 1 < j < i < n, Median is the median function, β is Sen’s trend degree, which is used to represent the degree of rise and fall of the {SPEIi} trend. When β > 0, {SPEIi} shows an upward trend, the larger β value, the more prominent the upward trend is. When β < 0, {SPEIi} shows a downward trend, the smaller the value of β, the more prominent the downward trend is.
2.3.4. Correlational Analysis Method
To investigate the response of NPP to drought in the Mongolian Plateau, the correlation coefficient between drought and NPP was determined. The significance of the correlation coefficient was tested using the Pearson method. The calculation formula of the correlation coefficient is as follows:
In Equation (3), n is the number of years in the study period, and x and y are the two variables of the correlation analysis, and are their sample values.
3. Results
3.1. Spatial-Temporal Variations of NPP in the Mongolian Plateau
3.1.1. Model Validation
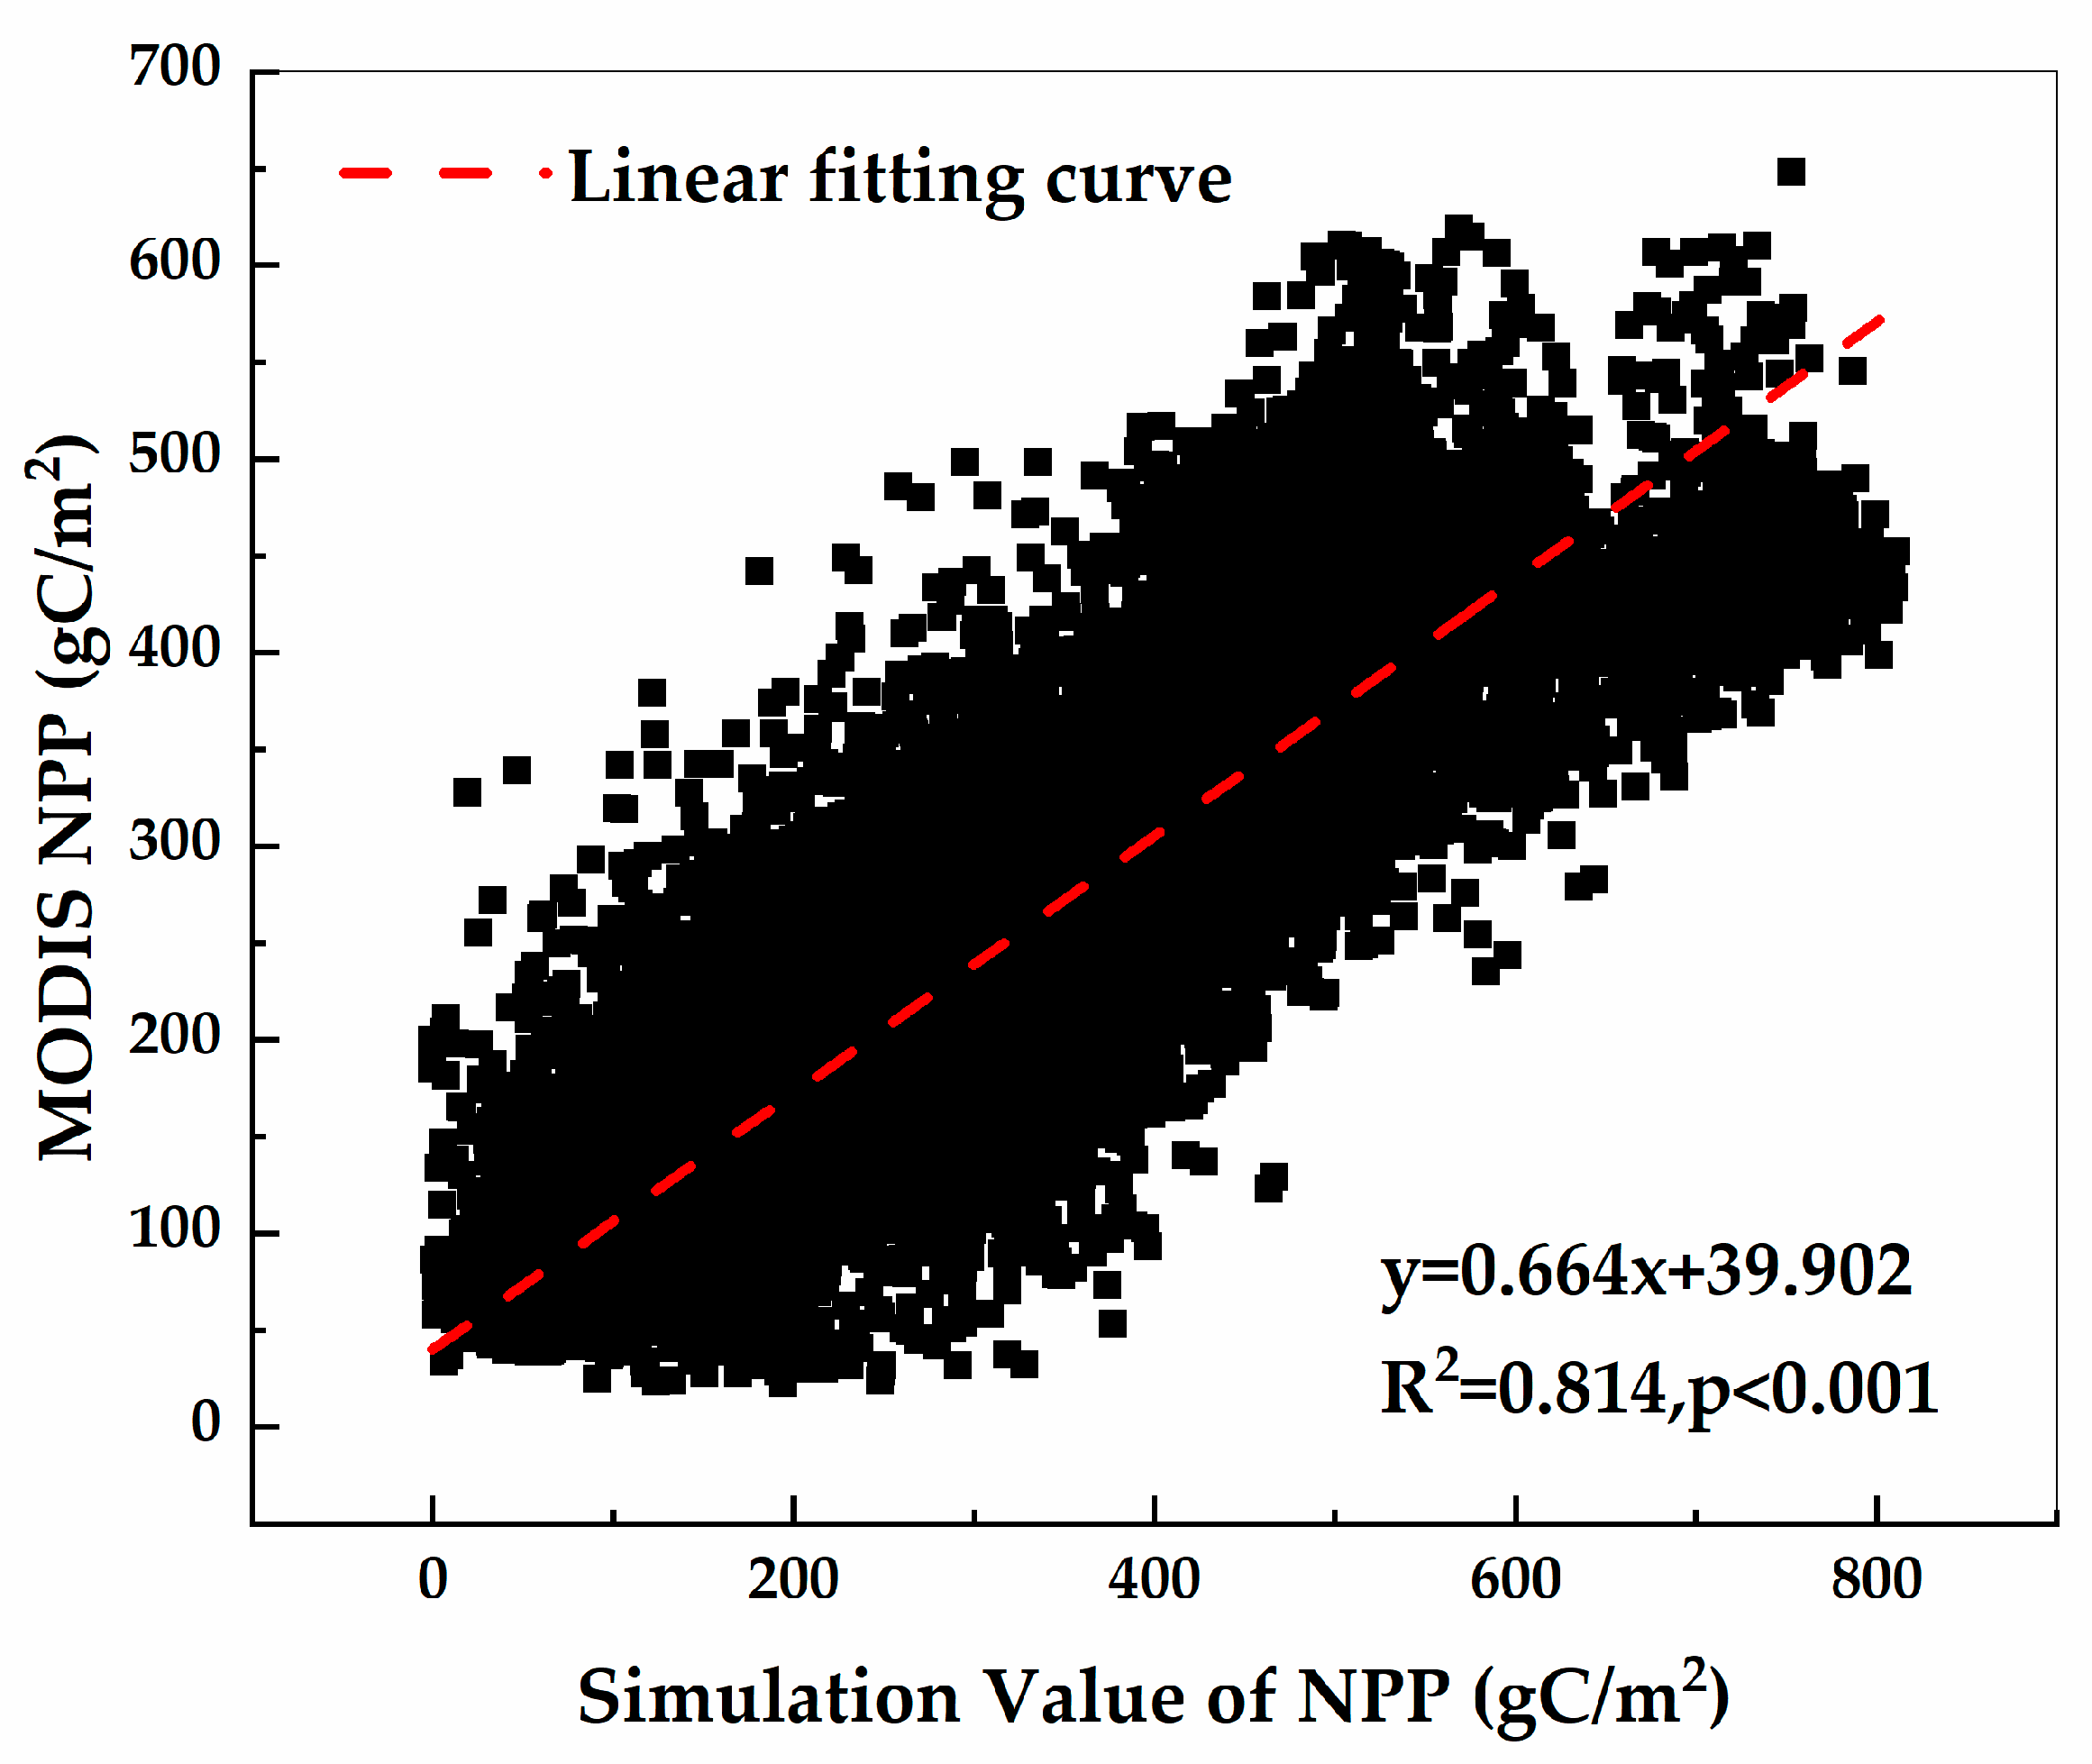
Although the CASA model is a mature model and has been widely used to calculate global and regional NPP [19,39], its simulation results still need to be verified. However, model validation is restricted by the lack of large-scale biomass monitoring data. Nevertheless, MOD17A3 NPP data are also representative, and can be used to reflect the NPP of vegetation over the Mongolian Plateau. Therefore, the model was validated by comparing the simulated NPP value with MODIS NPP. As shown in Figure 2, the NPP estimated by the model is in good agreement with MODIS NPP (2000–2014). The coefficient of determination (R2) was 0.814 (p < 0.001), showing a significant correlation. These results indicated that the CASA model is suitable for estimating the NPP of the Mongolian Plateau.
3.1.2. Temporal Changes in NPP
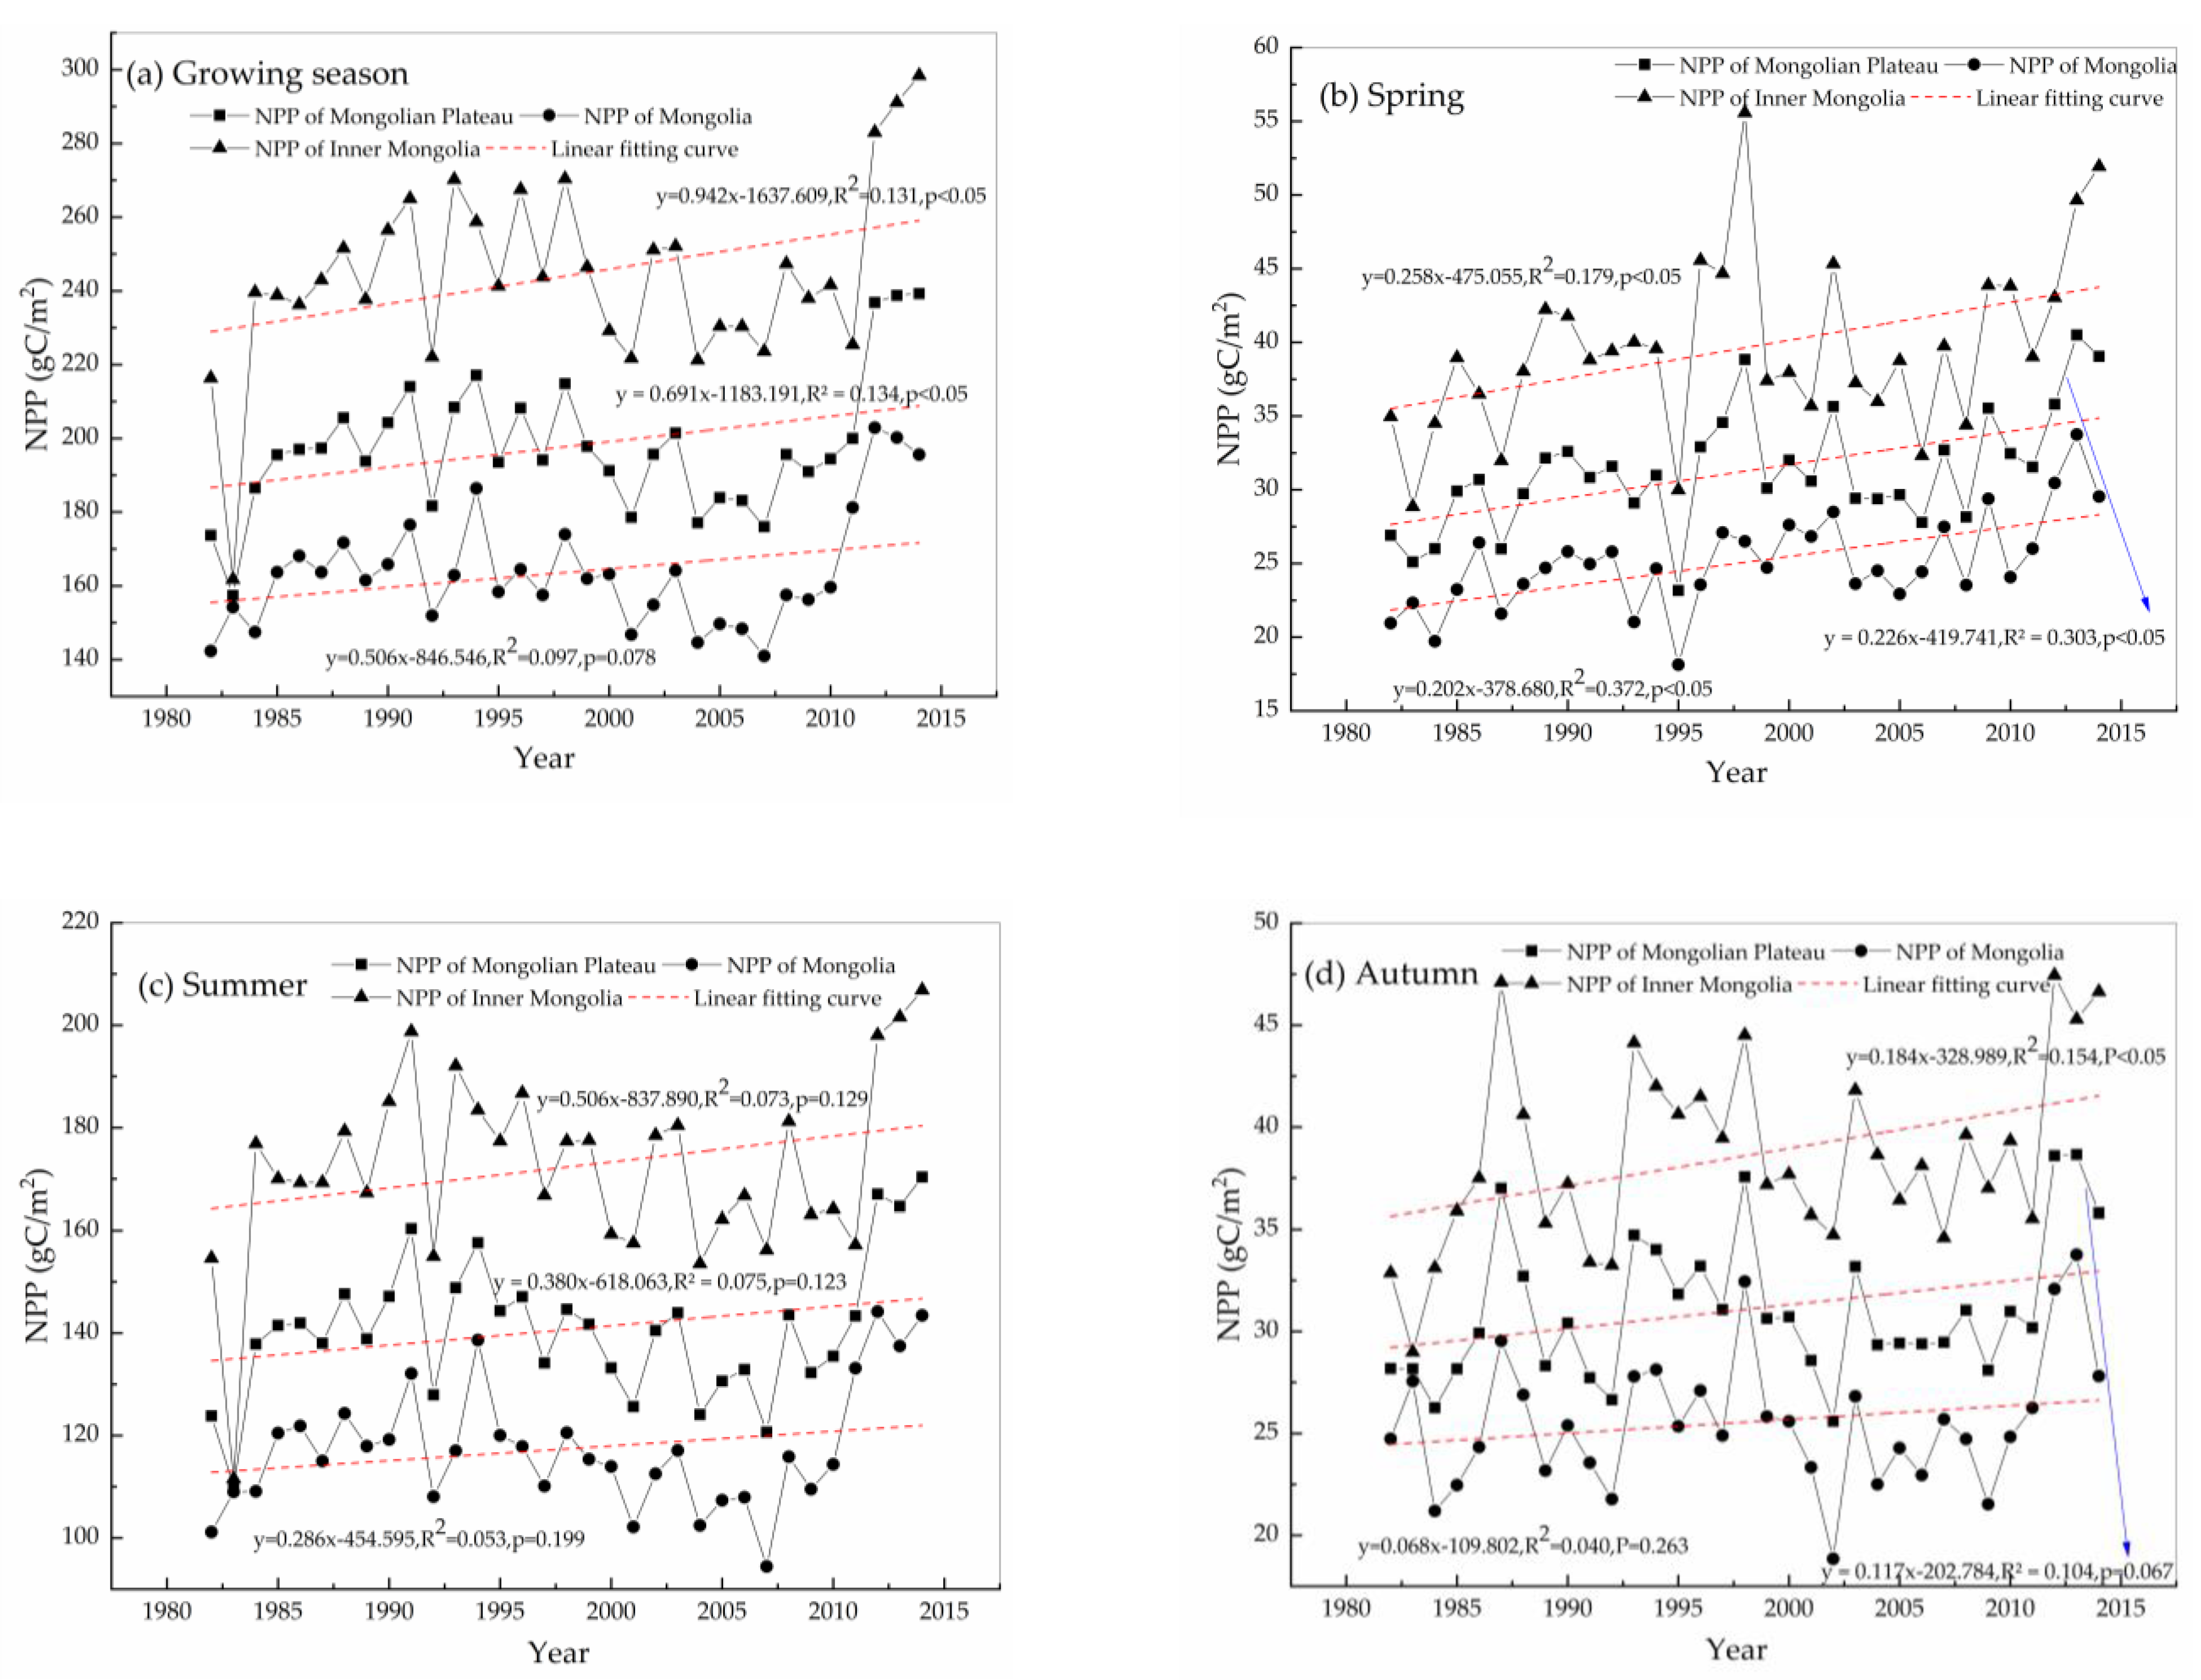
To explore the spatial distribution pattern of NPP over the Mongolian Plateau, the NPP values of the Mongolian Plateau from 1982 to 2014 were simulated based on the CASA model. Figure 3 shows the multi-year mean line chart of NPP in the growing season, spring, summer, and autumn. Figure 3a shows the broken line chart of NPP during the growing season. NPP showed a significant upward trend at a rate of 6.91/10a in the Mongolian Plateau, and its variation range was between 157.392 gC/m2 and 239.244 gC/m2. The maximum value was reached in 2014, and the minimum value appeared in 1983. NPP showed an upward trend at a rate of 9.42/10a in Inner Mongolia, and reached the maximum in 2014, whereas it showed an upward trend at a rate of 5.06/10a in Mongolia, and reached the maximum in 2012. Figure 3b shows the changes in NPP in spring. NPP showed a significant upward trend at a rate of 2.26/10a in the Mongolian Plateau. The maximum value of 40.505 gC/m2 was reached in 2013, and the minimum value of 23.165 gC/m2 appeared in 1995. The variation range of NPP was large in Inner Mongolia, with a significant increase at a rate of 2.58/10a, and the maximum value being reached in 1998. On the other hand, NPP showed a significant upward trend at a rate of 2.02/10a in Mongolia. Figure 3c shows the variation of the mean values of NPP in summer. NPP showed an upward trend at a rate of 3.80/10a in the Mongolian Plateau, with the maximum value of 170.370 gC/m2 in 2014, and the minimum value of 110.065 gC/m2 in 1983. NPP showed an upward trend at a rate of 5.06/10a in Inner Mongolia, and showed an upward trend at a rate of 2.86/10a in Mongolia. Figure 3d shows changes in NPP in autumn, during which NPP exhibited a large variation range and increased at a rate of 1.17/10a. The maximum value was 38.652 gC/m2 in 2013, and the minimum value was 25.594 gC/m2 in 2002. NPP showed a significant upward trend at a rate of 1.84/10a in Inner Mongolia, and showed an upward trend at a rate of 0.68/10a in Mongolia.
Overall, the value and increasing tendency of NPP in Inner Mongolia was larger than Mongolia. Moreover, the increasing trend of NPP was the largest in Inner Mongolia, and the variation range of NPP was the largest in the growing season, followed by summer, spring and autumn.
3.1.3. Spatial Variation of NPP
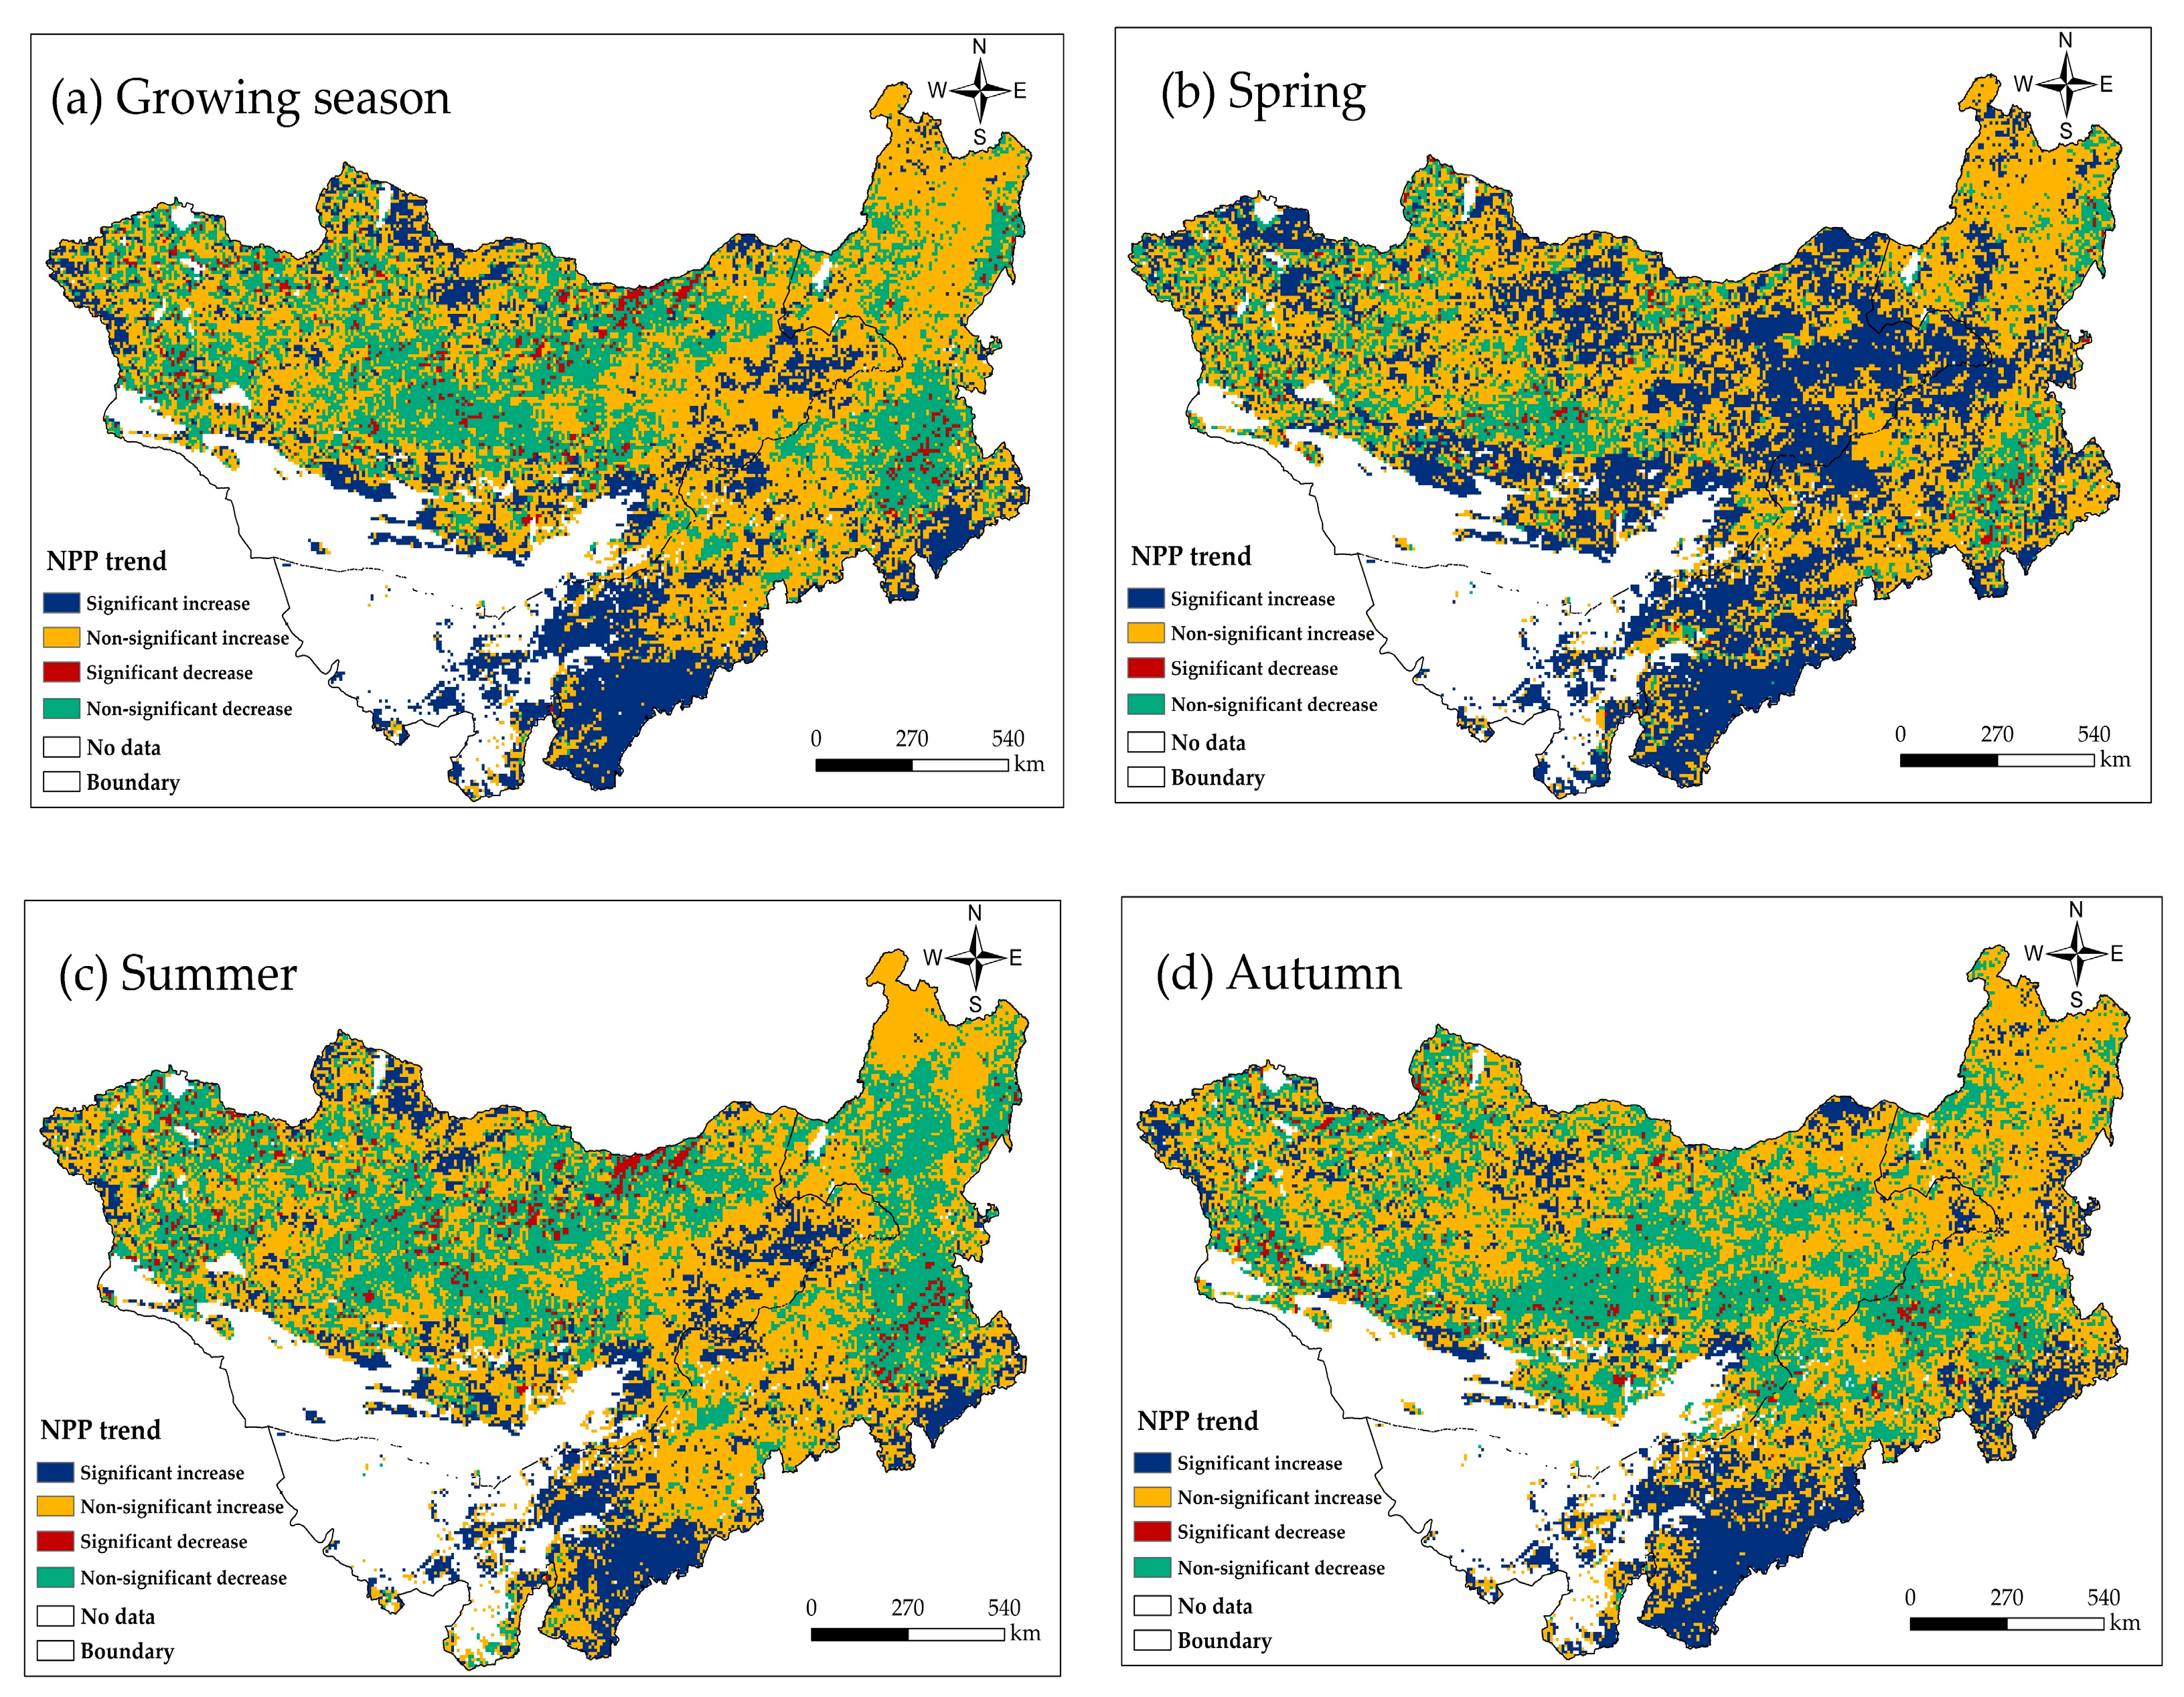
Figure 4a–d and Figure 5 show the spatial patterns of, and percentage of significance of average for NPP, determined through the Mann–Kendall test in the growing season, spring, summer, and autumn, during the study period. On the whole, the distribution was scattered. Figure 4a shows the significance of the NPP trend in the growing season. In the growing season, the NPP of coniferous forest, meadow steppe, and typical steppe generally showed an increasing trend. Areas with significant decreasing trends were mostly distributed in meadow steppe and typical steppe, which are located in the northern part of the Mongolian Plateau. Overall, the significant decrease was mostly distributed in Mongolia, accounting for 3.37% of Mongolia, whereas the NPP slope in Inner Mongolia generally showed an insignificant upward trend in the growing season, accounting for 50.87% of the Inner Mongolia area (Figure 5a). NPP, in most parts of the Mongolian Plateau, showed an increasing trend in the growing season, accounting for 71.50% of the total area.
Figure 4b shows the significance of the NPP slope in spring. The NPP of coniferous forest, broadleaf forest, and typical steppe generally showed a significant increasing trend in spring, accounting for 39.05% of the total area (Figure 5b). Areas with decreasing trends were mostly distributed in typical steppe, shrub, and alpine steppe, although the significant trend was less, accounting for only 1.11% of the total area. In general, large areas of western Mongolia and southeastern Inner Mongolia showed NPP decrease in spring, whereas NPP showed a significant increasing trend in the Mongolian Plateau, accounting for 85.73%, of which the significant increase accounted for a large part.
In summer (Figure 4c), NPP in most areas of the Mongolian Plateau showed no significant increases, accounting for 49.62%, mainly distributed in coniferous forest, typical steppe, desert steppe, cropland, and alpine steppe. Areas with decreasing trends were mostly distributed in coniferous forest, meadow steppe, and typical steppe, located in northern Mongolia and northeastern Inner Mongolia, accounting for 33.53% of the total area (Figure 5c), while sparsely distributed in desert steppe and shrub.
Figure 4d shows the significance of the NPP slope in autumn. In terms of vegetation type, NPP increased in most areas of the Mongolian Plateau, mainly distributed in coniferous forest, broadleaf forest, typical steppe, shrub, sandy land, and cropland, accounting for 68.58% of the total area (Figure 5d). Areas with decreasing trends were mostly distributed in coniferous forest, typical steppe, and desert steppe, located in the eastern area of Mongolia and the central area of Inner Mongolia, accounting for 31.42% of the total area. However, the western part of Inner Mongolia showed a significant increase, accounting for 27.29% of the Inner Mongolia area.
On the whole, NPP in most areas of the Mongolian Plateau showed an increasing trend, and most of the significant increasing trends were distributed in Inner Mongolia. Moreover, the decreasing of NPP in Mongolia was larger than that in Inner Mongolia over the past 33 years.
3.2. Spatial-Temporal Variations of Drought in the Mongolian Plateau
3.2.1. Temporal Variation of Drought
Figure 6 shows the variation of SPEI in the growing season and three seasons of the Mongolian Plateau from 1982 to 2014. Figure 6a shows changes in SPEI during the growing season. SPEI showed a downward trend at a rate of −0.11/10a in the Mongolian Plateau, ranging from −0.66 to 0.49. On the whole, drought increased in the growing season during the 33 years. Specifically, from 1984 to 1995, the SPEI value was mostly positive and the whole region was in a relatively wet period, whereas from 1996 to 2002 and 2004 to 2014, the SPEI value was negative and in a dry period. Among them, 2000 was the driest year in the growing season of the Mongolian Plateau with the SPEI value reaching −0.66, although the NPP value was also close to the minimum in this year. Moreover, 2003 was the wettest year, with the SPEI value reaching 0.49, whereas the NPP value was close to the maximum. SPEI showed a significant downward trend at a rate of −0.18/10a in Mongolia, and reached −0.79 in 2000. SPEI showed a downward trend at a rate of −0.03/10a in Inner Mongolia, and 1983 was the driest year with the SPEI value reaching −1.02. NPP in this year also reached the minimum value.
Figure 6b–d show changes in SPEI in spring, summer, and autumn. As shown in Figure 6b, SPEI showed a decreasing trend in spring with a slope of −0.01/10a in the Mongolian Plateau, indicating the aggravation of drought. From 1996 to 2009, SPEI was mostly negative, and the drought was aggravated. In 2009, the SPEI value reached −1.58, reflecting the most severe drought. In 2010, it reached 2.14, reflecting the wettest period. The SPEI showed a trend of drought aggravation in Mongolia and Inner Mongolia at rates of −0.03/10a and −0.02/10a, respectively. As shown in Figure 6c,d, the SPEI showed a trend of drought aggravation in summer and autumn at rates of −0.29/10a and −0.16/10a in the Mongolian Plateau, respectively. The SPEI showed a significant downward trend at rates of −0.40/10a and −0.31/10a in Mongolia, respectively, and a downward trend at rates of −0.13/10a and −0.05/10a in Inner Mongolia, respectively.
In general, the decrease in the SPEI in Mongolia was larger than that in Inner Mongolia, and drought was the most severe in summer.
3.2.2. Spatial Variation of Drought
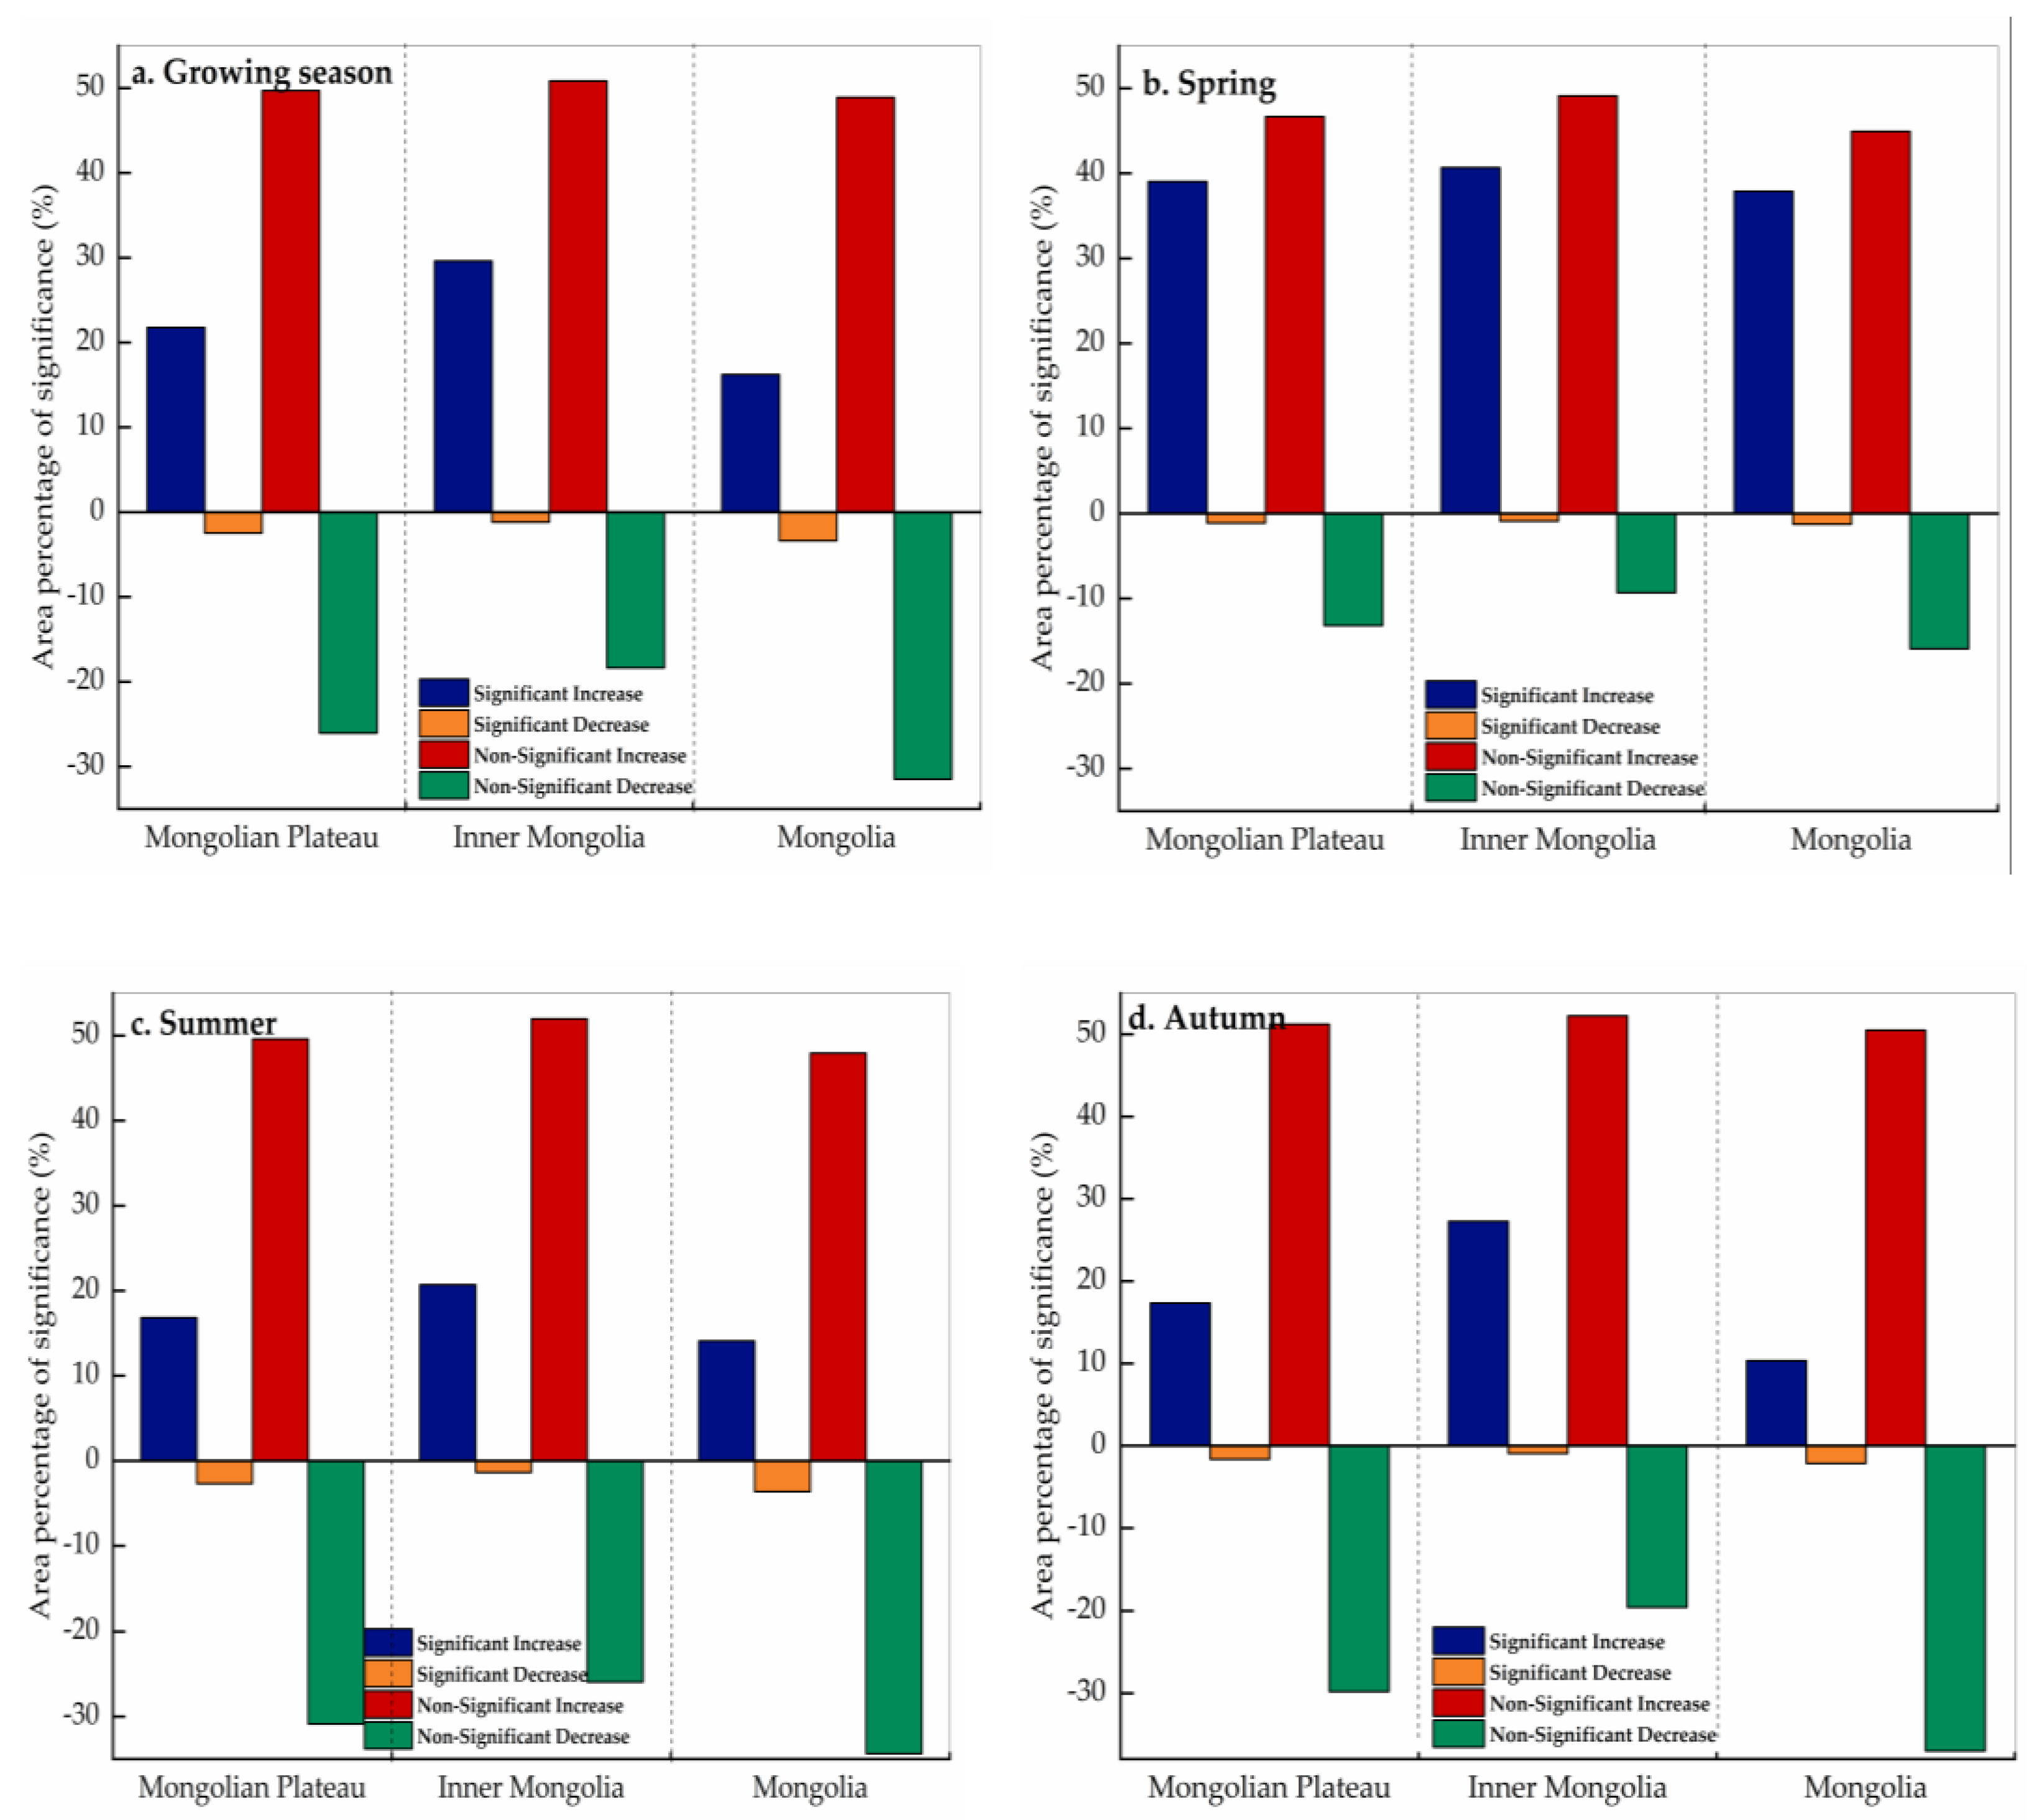
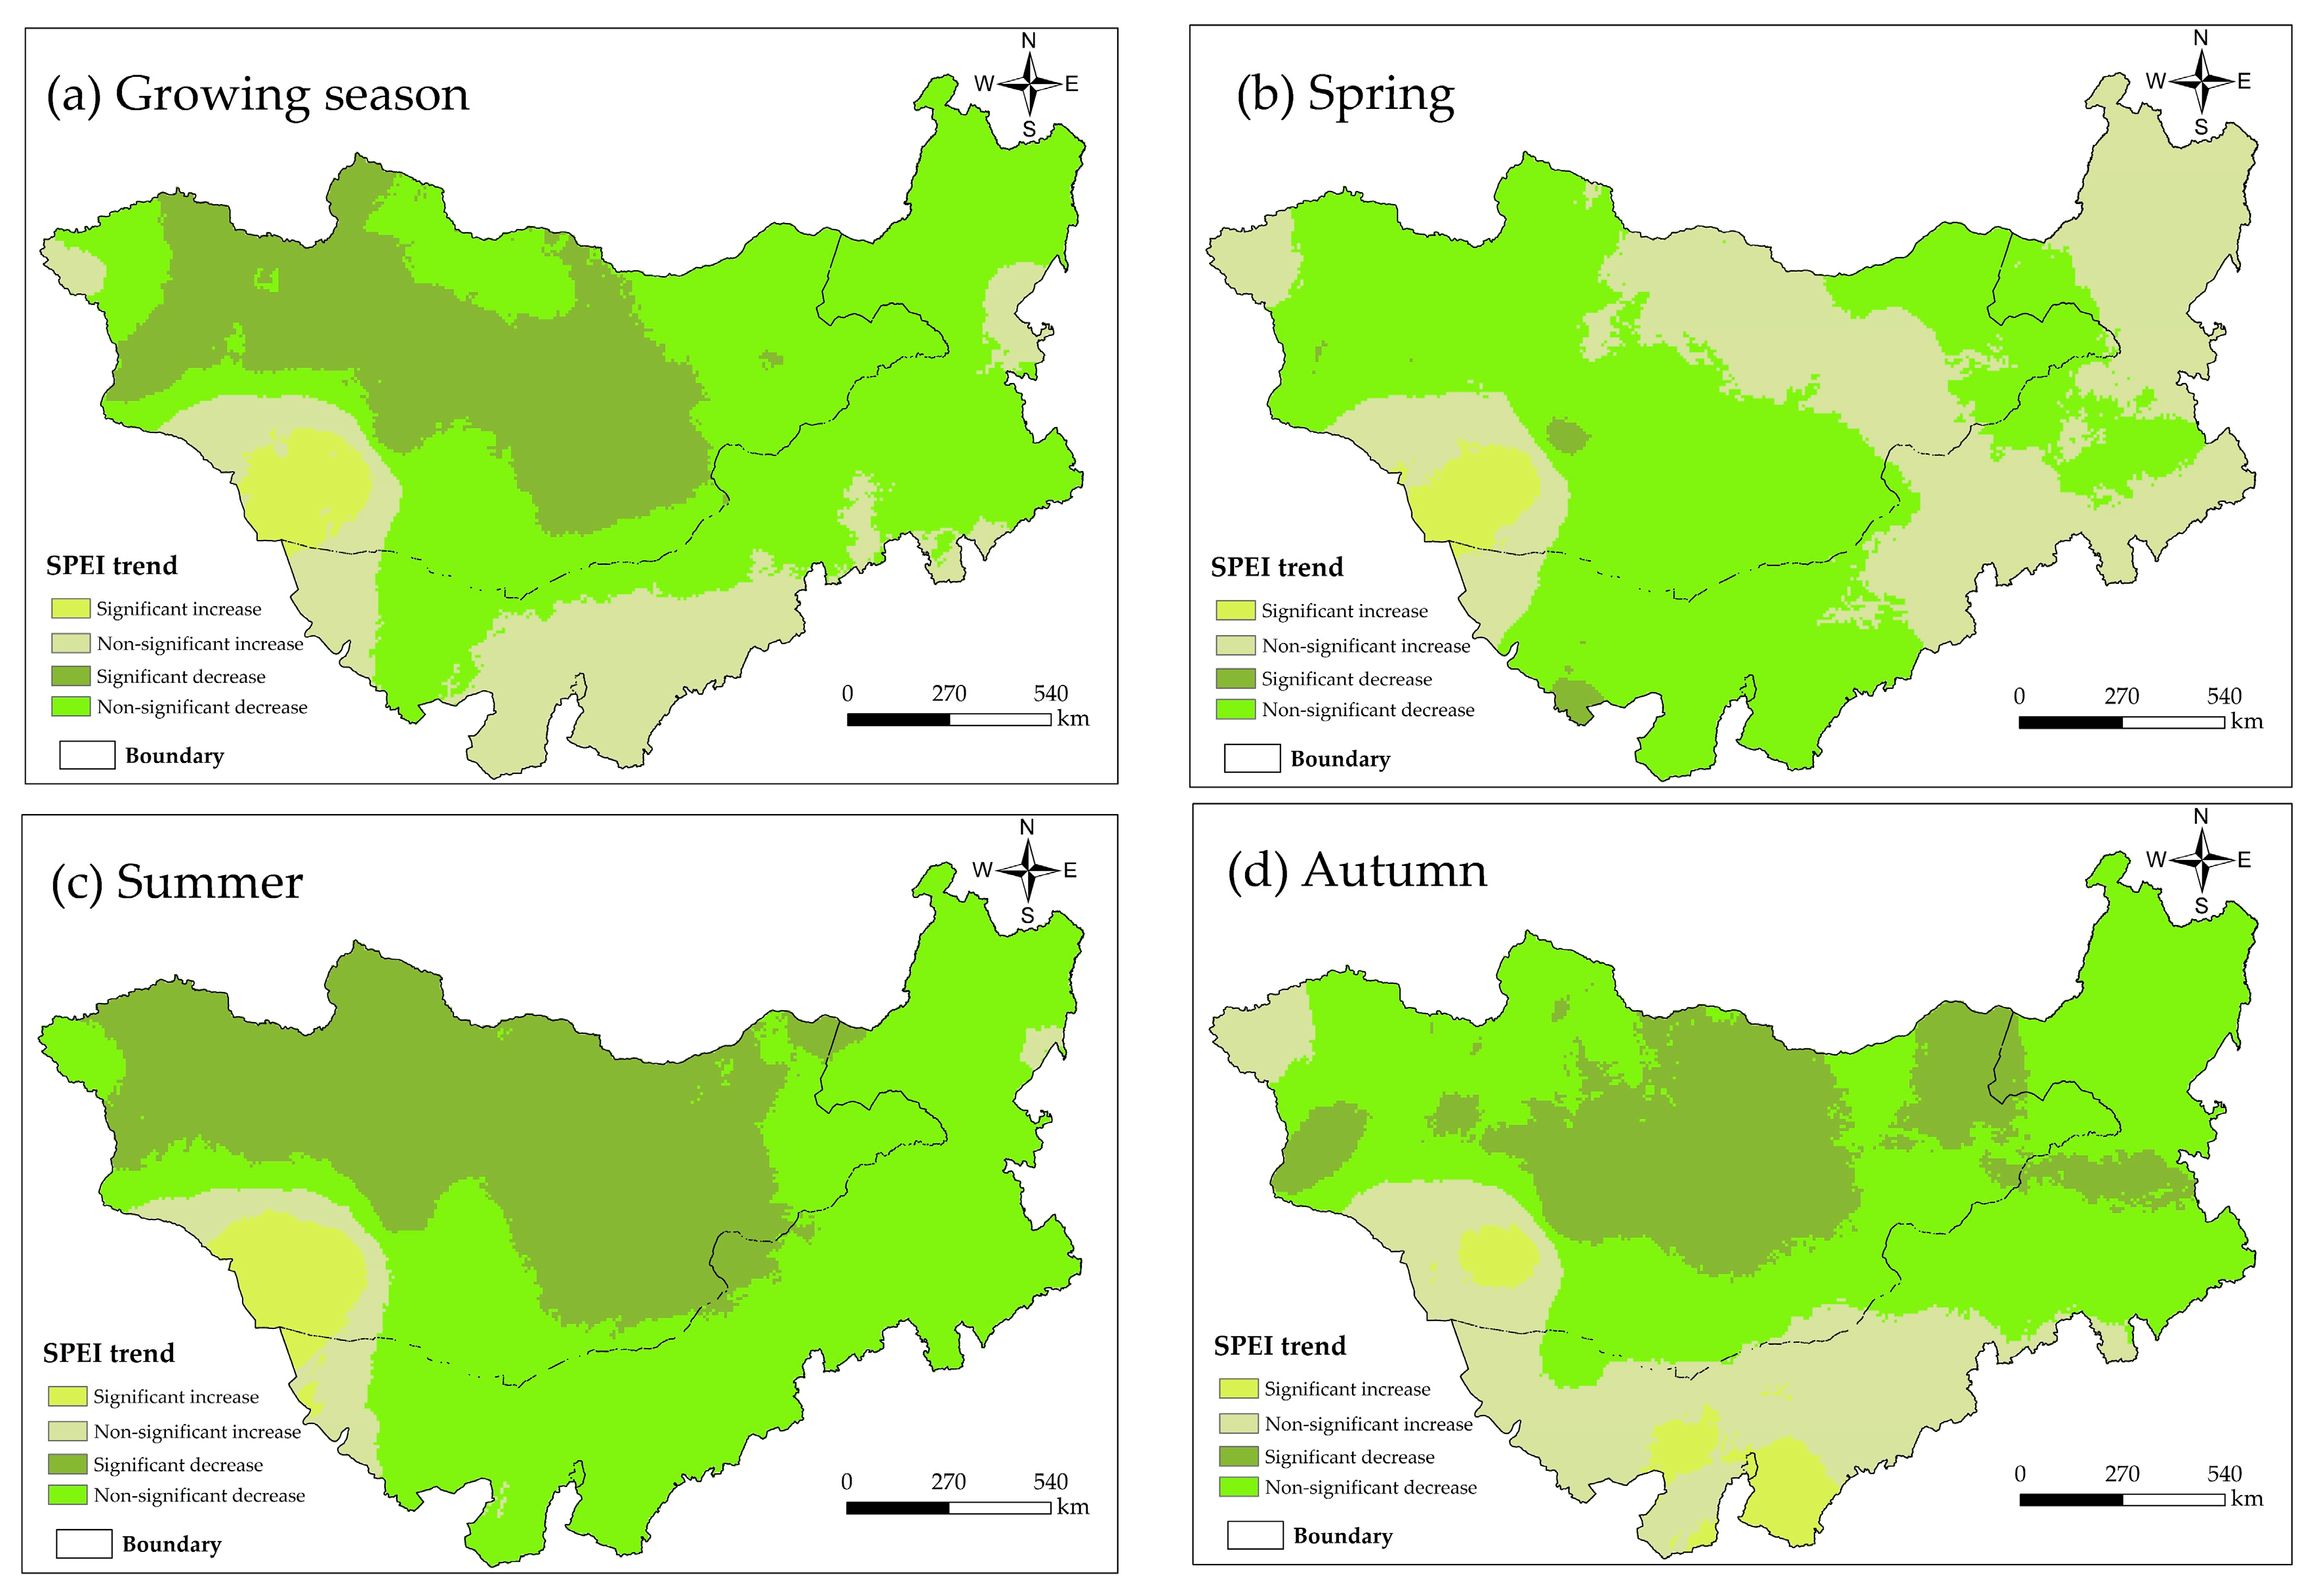
Figure 7a–d and Figure 8 show the significance of and percentage of change in SPEI, during the growing season and three seasons over the Mongolian Plateau, in which significance was tested by the Pearson method. According to the significance of the growing season in Figure 7a, small parts of broadleaf forest, meadow steppe, typical steppe, desert steppe, Gobi-desert, and sandy land showed an increasing trend in the SPEI of the growing season, accounting for 21.70% of the Mongolian Plateau area. This indicated drought reduction, although the increase was mostly not significant, accounting for only 3.01% of the total area. The SPEI slope of coniferous forest, meadow steppe, typical steppe, and Gobi-desert generally showed a downward trend in the growing season, indicating drought intensification. In terms of the region, a small part of southwest Mongolia showed drought reduction in the growing season, whereas most of central Mongolia showed a significant decrease in SPEI, indicating drought aggravation, accounting for 44.15% of Mongolia. In most areas of western Inner Mongolia, the SPEI slope showed an increasing trend in the growing season, indicating drought reduction, whereas the degree of aridity increased in the eastern part. On the whole, the SPEI slope of the Mongolian Plateau displayed a decreasing trend in the growing season, indicating drought aggravation.
In spring (Figure 7b)—except for most areas of meadow steppe and some parts of coniferous forest—broadleaf forest, typical steppe, Gobi-desert, cropland, and alpine steppe showed an insignificant increase in SPEI. Drought was aggravated in typical steppe, desert steppe, Gobi-desert and a small part of meadow steppe, accounting for 58.51% of the total area. In general, northwest, southwest, and eastern Mongolia mostly showed an increasing trend in the SPEI in spring, indicating drought reduction, accounting for 33.76% of Mongolia. In addition, compared with the western region, eastern Inner Mongolia showed a mostly positive SPEI, indicating drought reduction.
In summer (Figure 7c), in terms of vegetation type, a small part of desert steppe, Gobi-desert, and cropland exhibited an increased SPEI, accounting for 8.52% of the total area, of which 3.96% were showing significant increases, indicating drought reduction. In contrast, most areas of coniferous forest, typical steppe, desert steppe, and alpine steppe showed a significantly decreased SPEI, indicating drought aggravation. In the study area, the SPEI slope was mostly negative in summer, indicating drought aggravation accounting for 91.48%. Except for the southwest part of Mongolia, most parts of Mongolia showed a significant trend of increasing drought. Most parts of Inner Mongolia showed aggravated drought, accounting for 94.05% of Inner Mongolia area, except for the northwest.
In autumn (Figure 7d), the SPEI increased in autumn in typical steppe, desert steppe, Gobi-desert, and sandy land, indicating drought reduction, accounting for 27.03% of the total area. In contrast, the SPEI significantly decreased in most of the typical steppe and desert steppe, and part of alpine steppe, indicating drought aggravation, accounting for 23.82%. Most parts of the Mongolian Plateau showed an aggravating trend of drought in autumn, accounting for 72.97% of the total area, mainly distributed in the central and eastern areas of Mongolia and Inner Mongolia.
Overall, the SPEI has shown a downward trend in most areas of the Mongolian Plateau in each season, indicating drought aggravation. Compared with other seasons, summer drought accounted for the largest increase in area, and spring drought accounted for the least significant increase in area.
3.3. Relationship between NPP and SPEI in the Mongolian Plateau
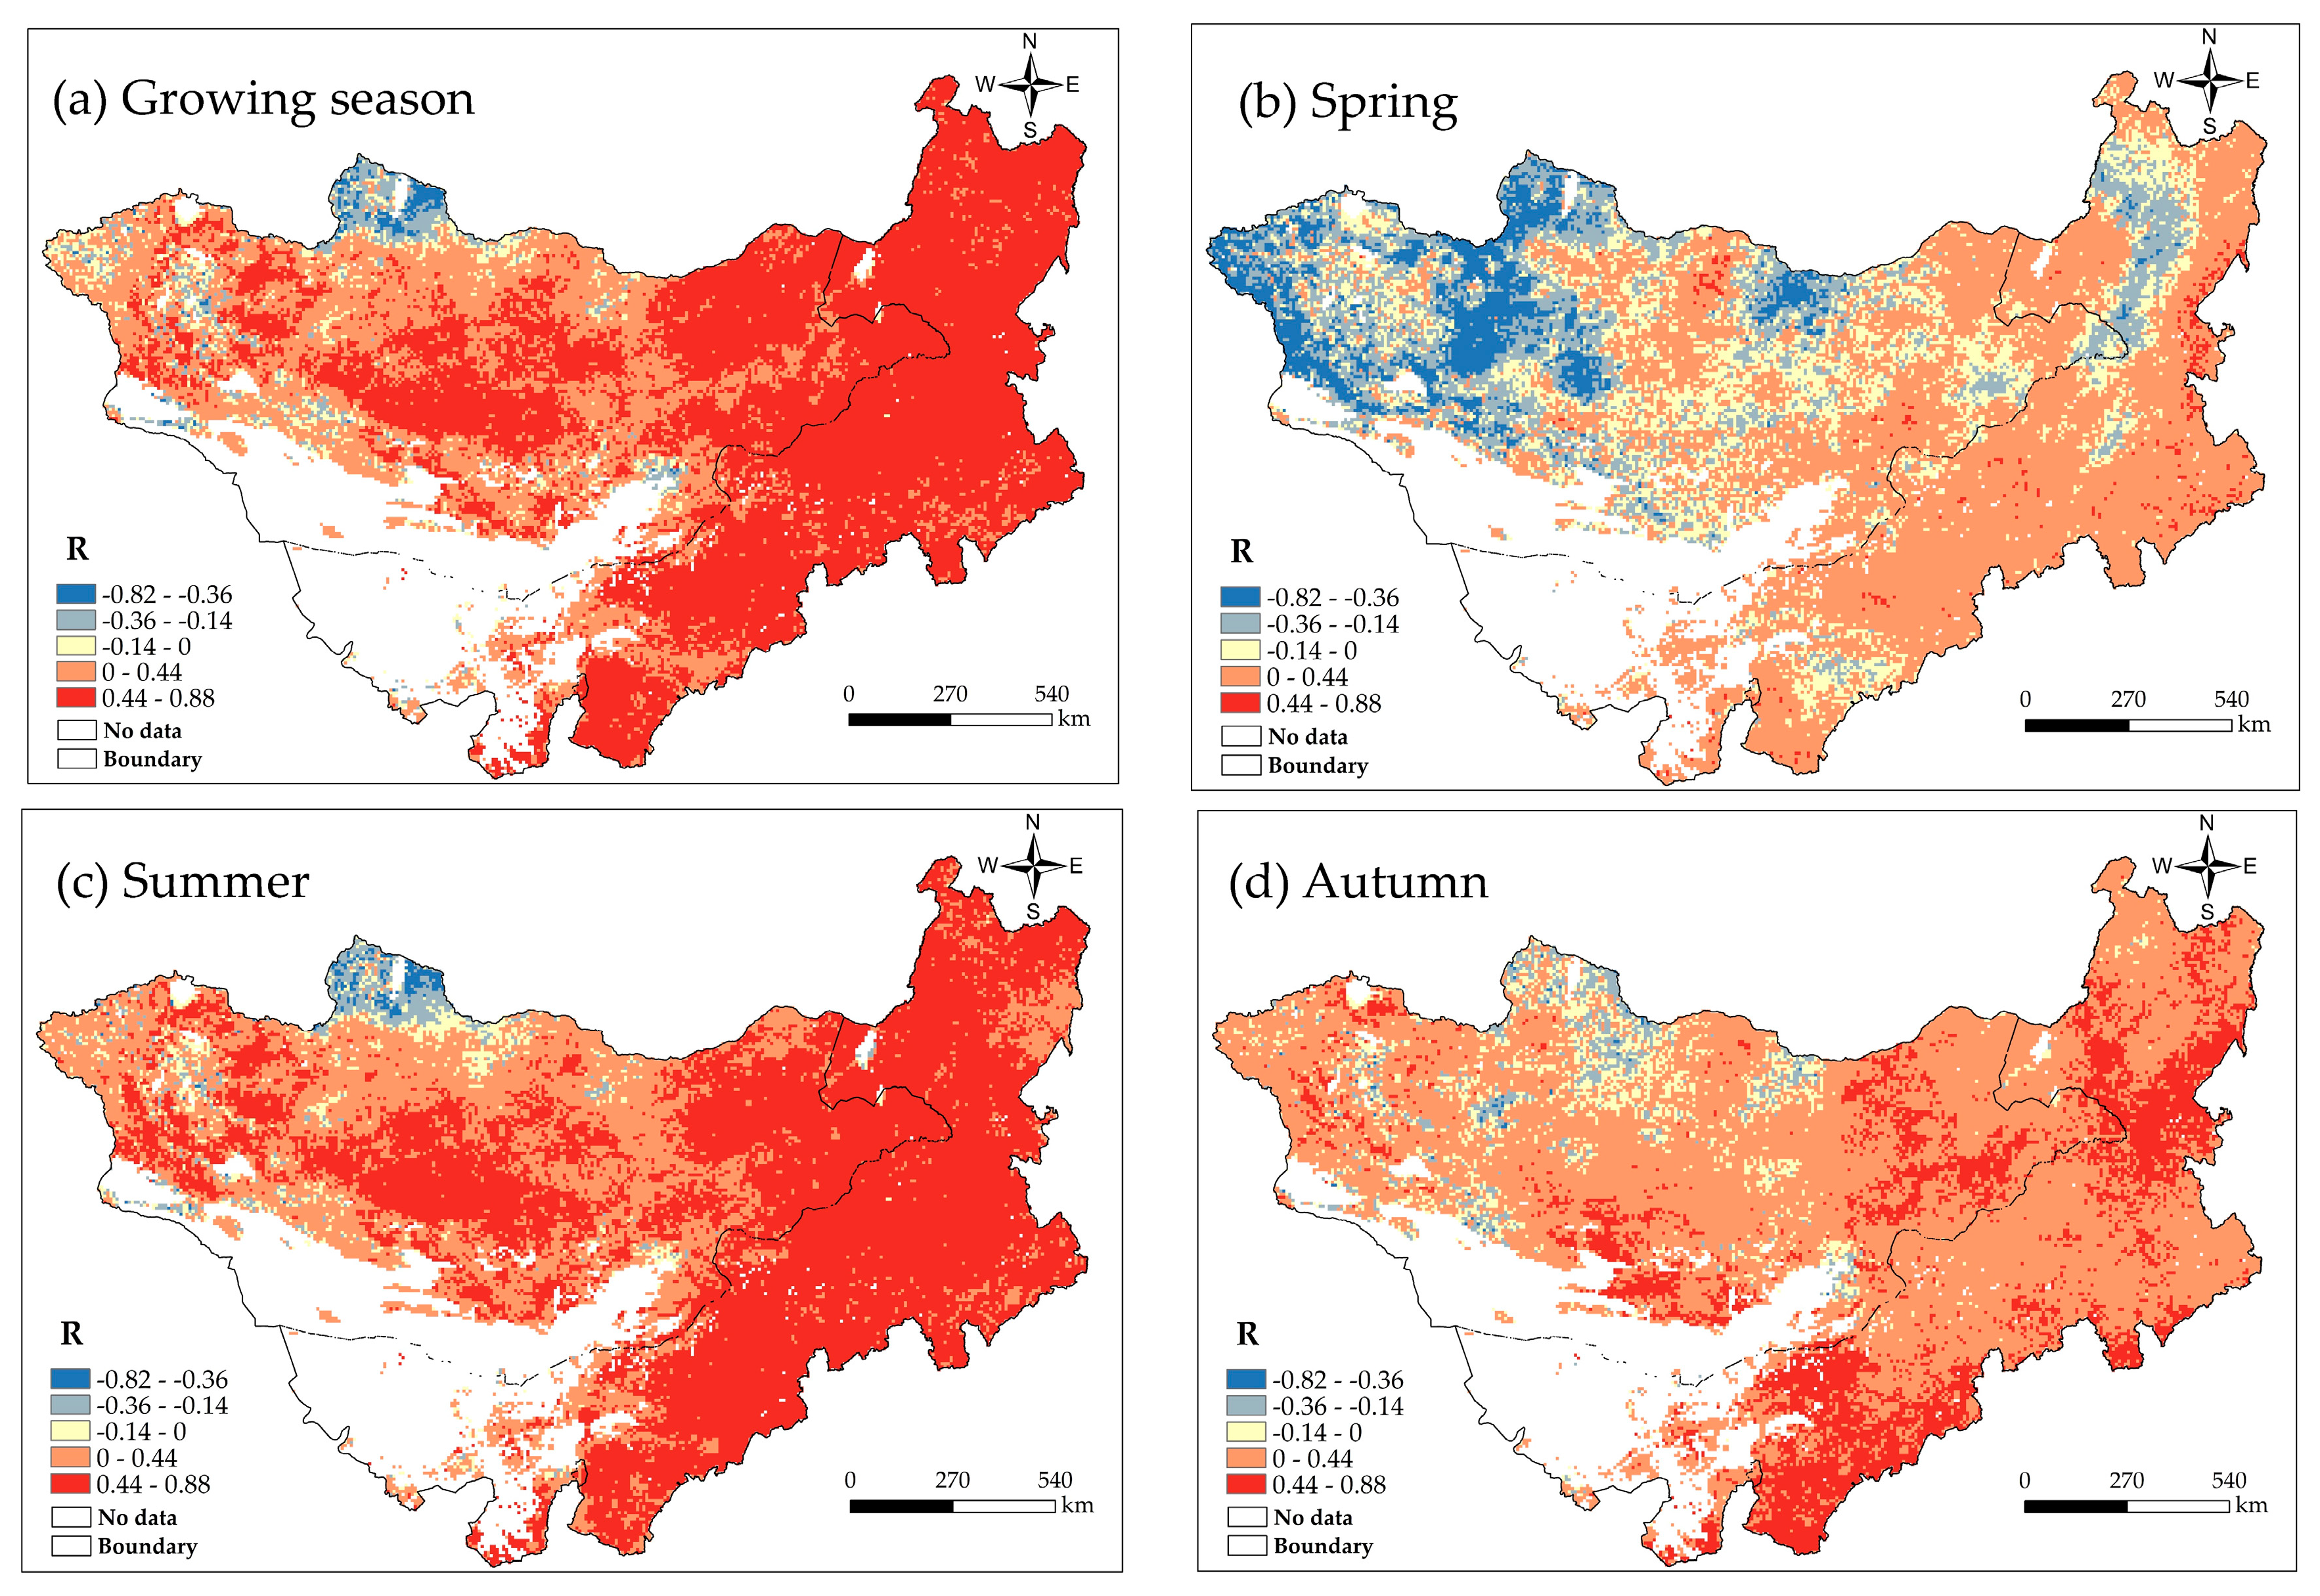
Figure 9 shows the spatial distribution of the correlation between NPP and SPEI in the growing season, spring, summer, and autumn. Table 1 lists the percentage of the correlation coefficient between NPP and the SPEI. According to the distribution of the correlation between NPP and the SPEI in the growing season (Figure 9a), areas with negative correlation accounted for a small part of coniferous forest, desert steppe, and alpine steppe, whereas most of the remaining areas showed a positive correlation. On the whole, western Mongolia and a small area of western Inner Mongolia showed a negative correlation, accounting for 8.14% of the total area of the Mongolian Plateau, whereas the other areas showed mostly positive correlations, accounting for 91.86% of the total area, of which 20.89% were significantly positive.
Figure 9b–d summarizes the seasonal relationship between NPP and SPEI in the Mongolian Plateau. In spring (Figure 9b), some areas of coniferous forest, broadleaf forest, meadow steppe, typical steppe, desert steppe, sandy land, and alpine steppe showed a negative correlation coefficient, accounting for 46.73% of the total area, of which 37.71% were significantly negative, whereas other areas showed mostly positive correlations. On the whole, NPP and SPEI in spring were positively correlated in most areas of eastern Mongolia and central and western Inner Mongolia, accounting for 53.27% of the total area, of which 47.96% were significantly positive. In summer (Figure 9c), areas with negative correlation accounted for a small part of coniferous forest, desert steppe, and alpine steppe. In the remaining regions, NPP and SPEI were positively correlated and accounted for 93.48% of the total area, of which 21.26% were significantly positive. In general, northwest Mongolia and a small part of western Inner Mongolia showed a negative correlation, accounting for only 6.52% of the total area, of which 5.87% were significantly negative. In autumn (Figure 9d), a small area of coniferous forest, meadow steppe, and typical steppe showed a negative correlation, accounting for 10.50% of the total area, of which 10.26% were significantly negative, whereas most other areas showed a positive correlation. In general, areas with a negative correlation were mostly distributed in the northwest of Mongolia, and areas with positive correlation were widely distributed throughout the Mongolian Plateau, accounting for 89.50% of the total area, of which 50.27% were significantly positive.
3.4. Response of Different Vegetation NPP to Drought
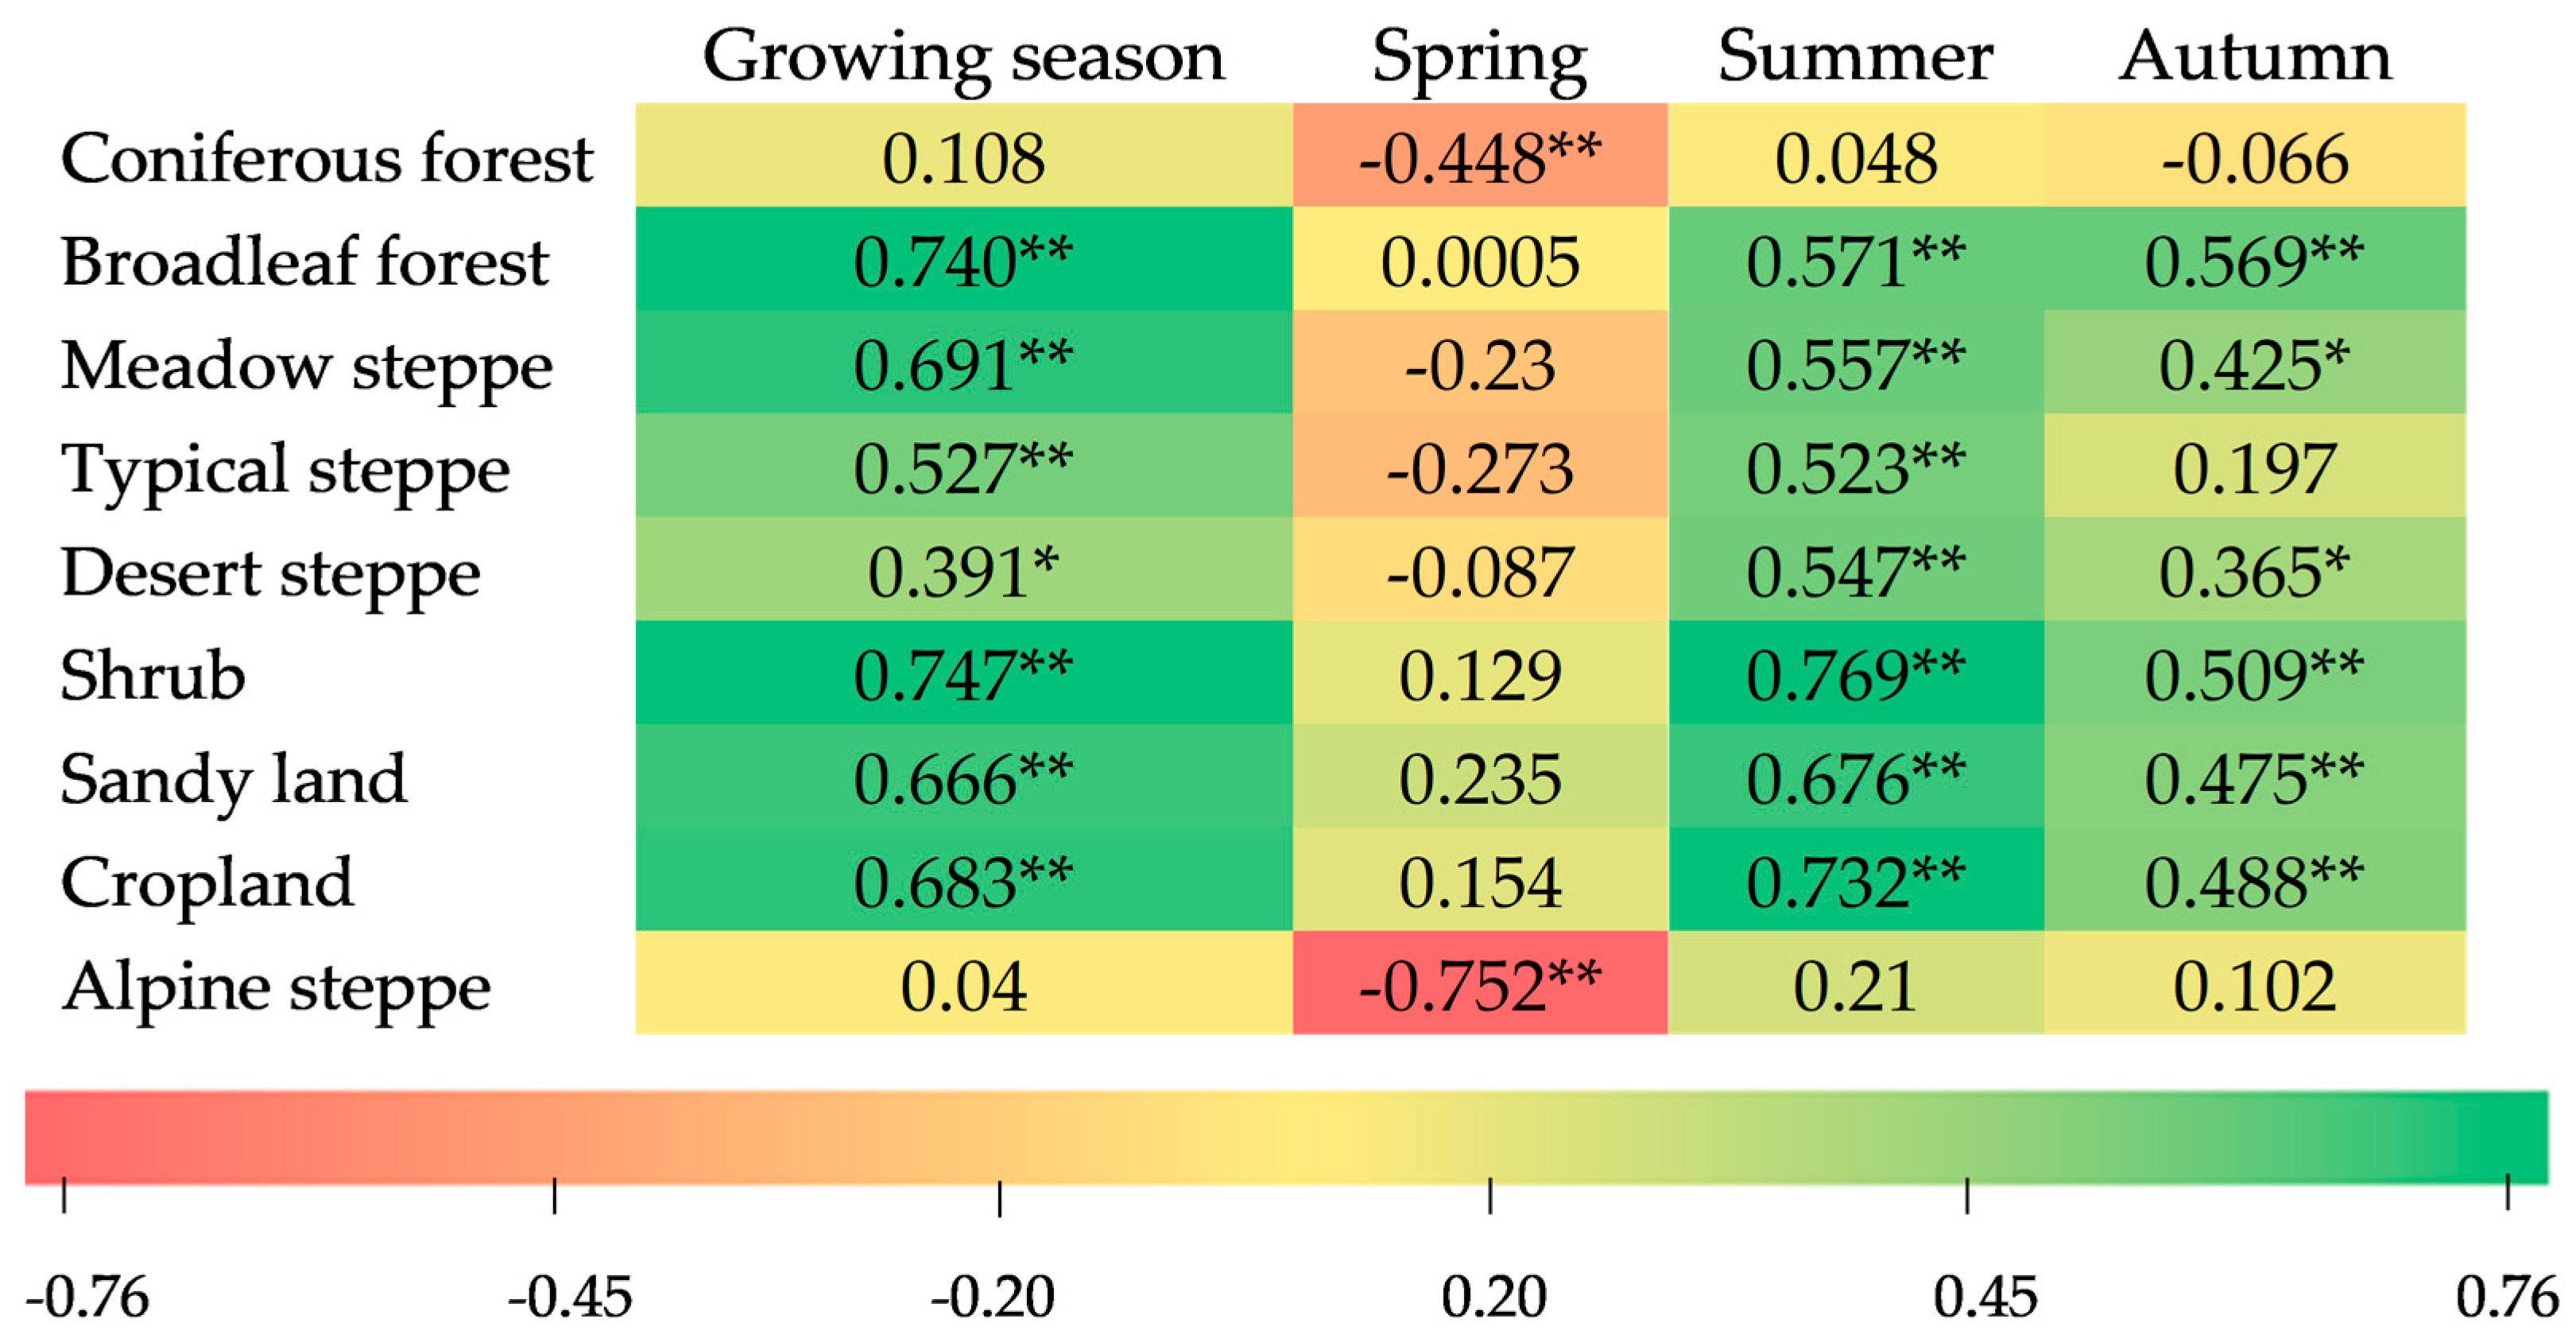
By analyzing the relationship between the NPP and the SPEI of different vegetation types in the Mongolian Plateau (Figure 10), the NPP of different vegetation types was found to respond differently to drought in different seasons. In the growing season and summer, the effects of SPEI on NPP were mostly significant and widely varied, but the SPEI and NPP of different vegetation were positively correlated. In the growing season, shrub showed the strongest response, whereas the NPP of coniferous forest and alpine steppe had a weak positive correlation with the SPEI. The NPP of other vegetation types showed a significant positive correlation with the SPEI. In spring, the alpine steppe showed the strongest response to the SPEI; however, the NPP and SPEI of the alpine steppe and coniferous forests showed a significant negative correlation, whereas most of the other vegetation types showed a positive correlation. The shrub type exhibited the same correlation between summer and the growing season, with the largest response and significant positive correlation. Most other vegetation types also showed a significant positive correlation. In autumn, broadleaf forest showed the highest correlation between SPEI and NPP, and the influence on drought and NPP was also the strongest. A negative correlation was only observed for coniferous forest. In general, NPP and SPEI were positively correlated for most vegetation types, and shrub showed the strongest responses to drought in the growing season and the summer. The most negative correlations were observed in spring, with coniferous forest and alpine steppe showing a significant negative correlation. In autumn, only coniferous forest showed a negative correlation.
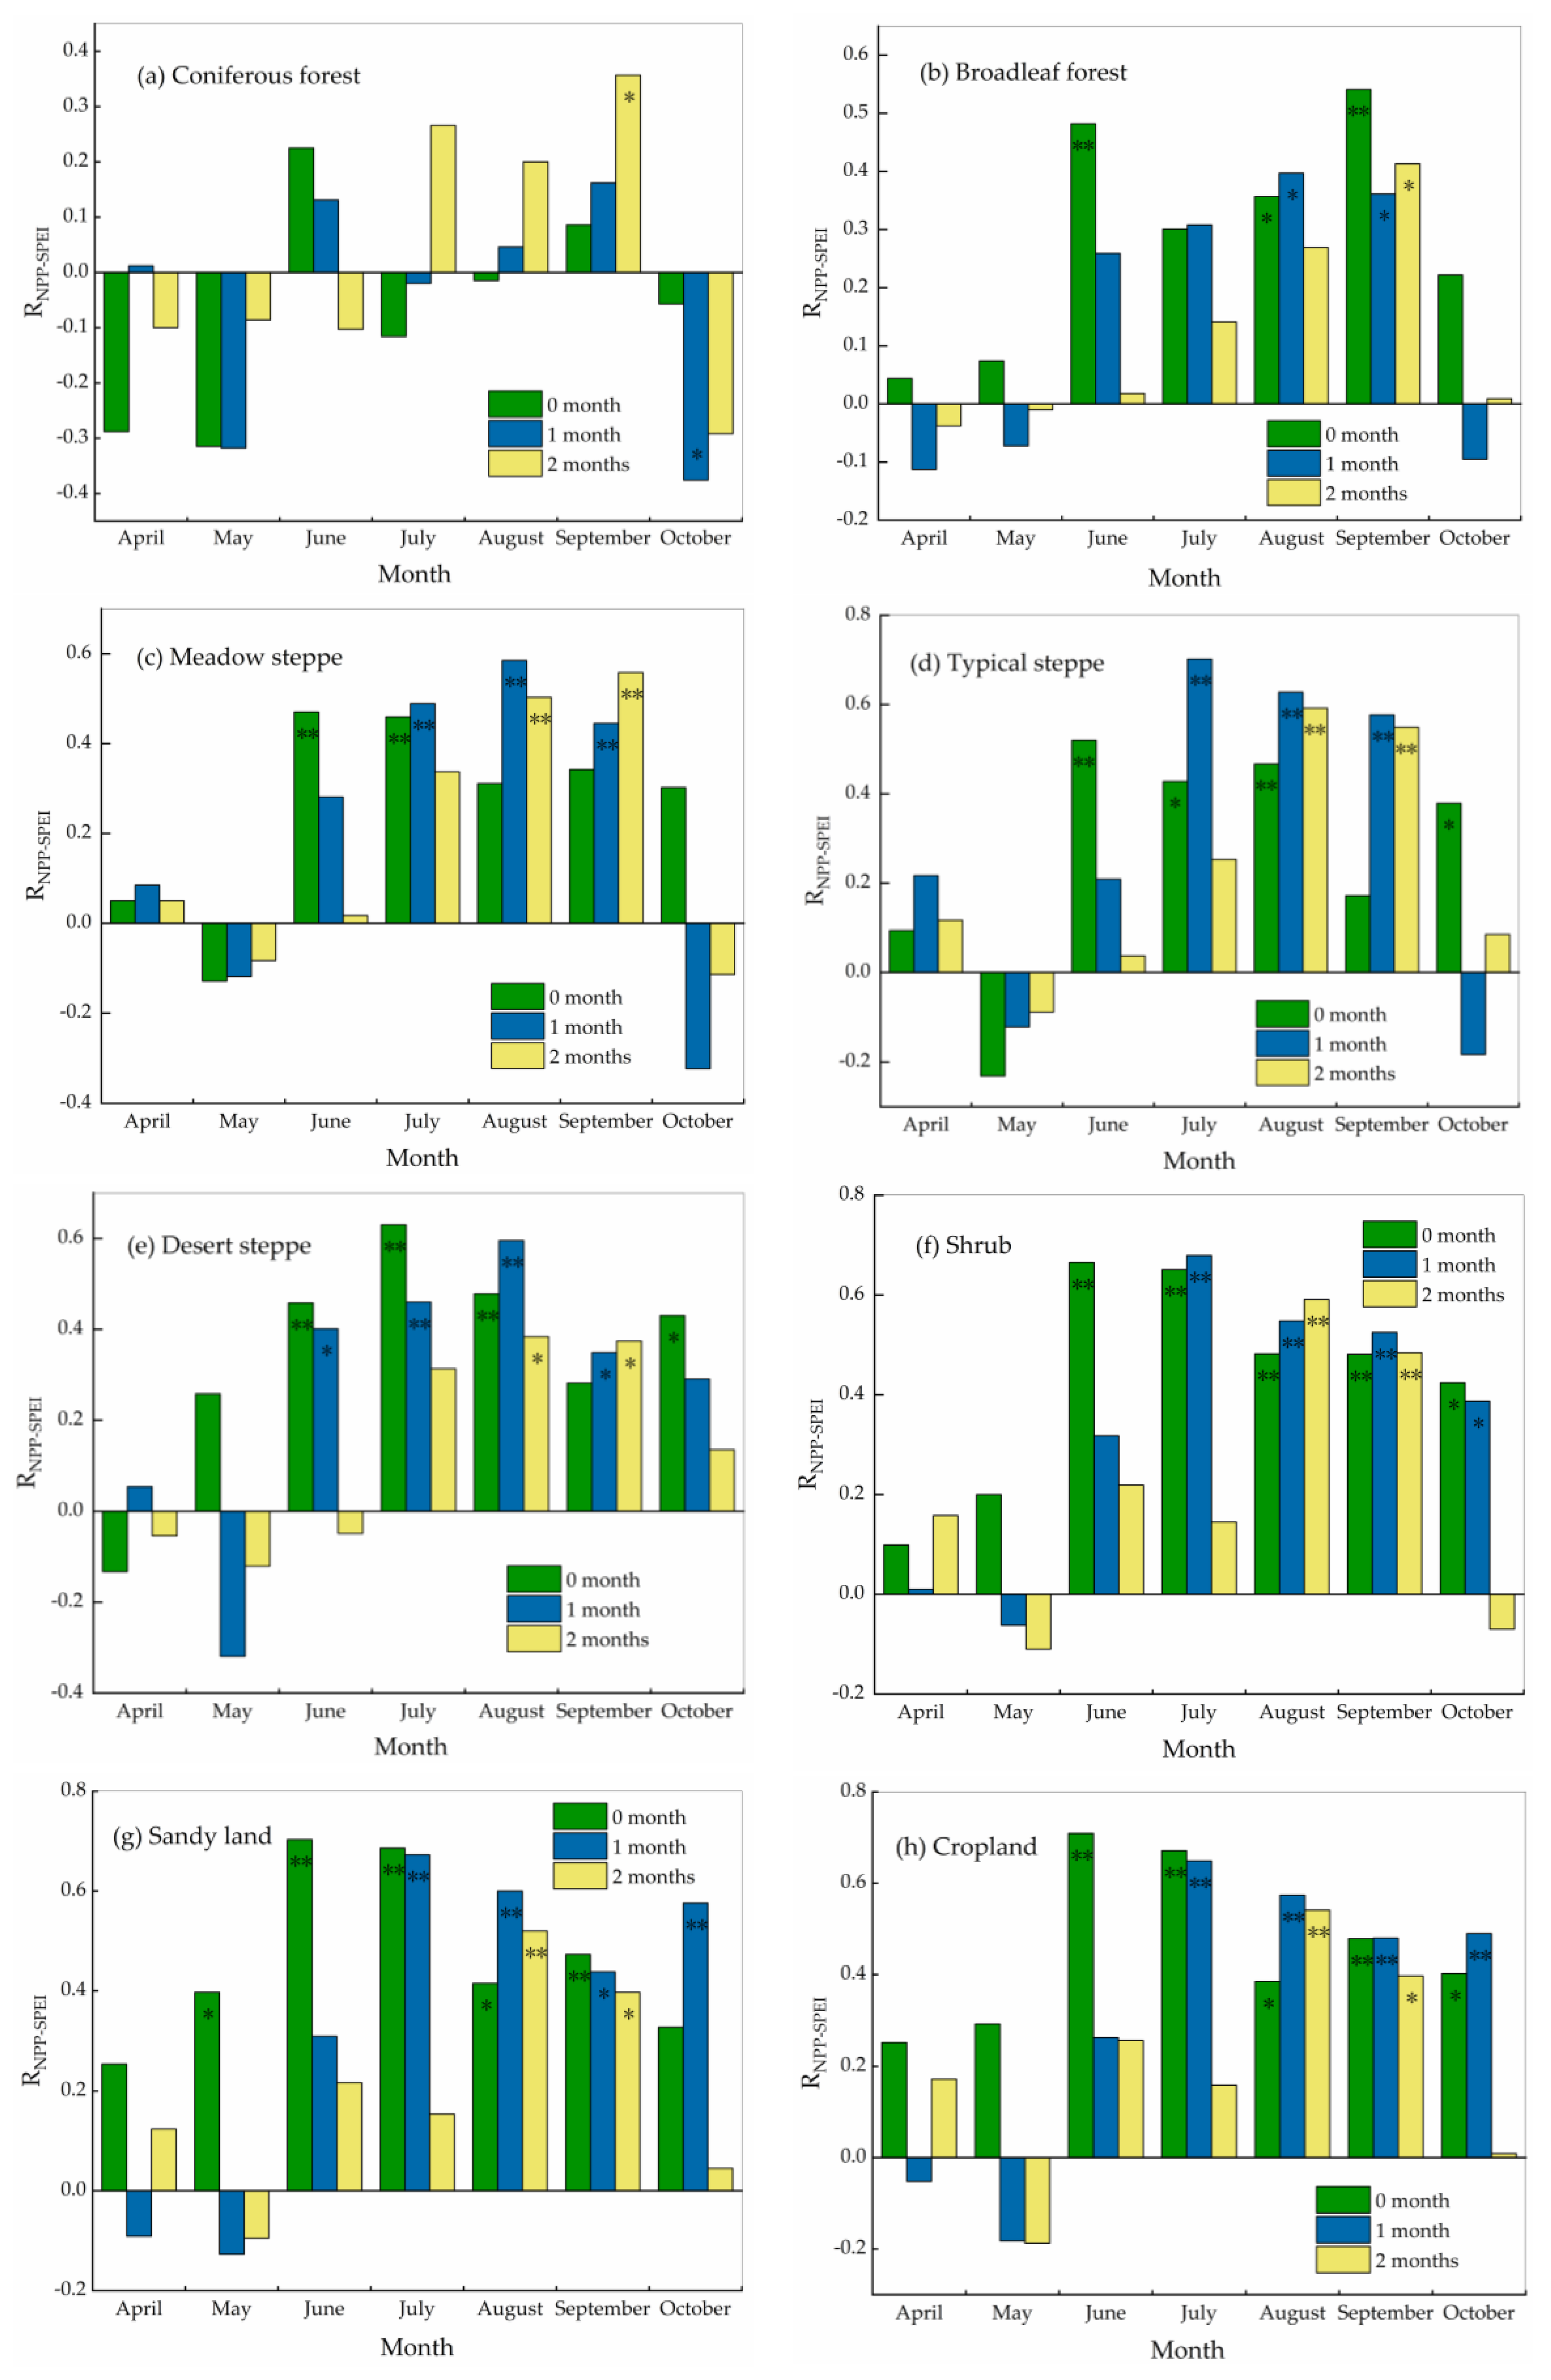
Figure 11 shows the response of different vegetation types to drought at different temporal scales. The coefficients of the correlation between the NPP and the SPEI in coniferous forests are shown in Figure 11a. The correlation was not significant in April, but it increased in May. Vegetation began to develop and entered the growing season in May, and thus, the drought response continuously increased. The NPP of the coniferous forest in June showed a strong correlation with the SPEI, and the NPP of the coniferous forest was more sensitive to drought. The NPP in July and the SPEI of the previous two months, and the NPP in August and SPEI of the previous two months, showed a large positive correlation. Moreover, the NPP in September and the SPEI of the previous two months showed a significant positive correlation, showing that vegetation positively responded to early drought during these months, and that drought had a lag effect on vegetation. Better correlations were achieved for the SPEI of the previous month, showing a possible lag in the response of NPP on coniferous forests in October.
The results of the correlation analysis between the NPP and the SPEI of broadleaf forest are shown in Figure 11b. In contrast with coniferous forest, the NPP of broadleaf forests was highly correlated with the SPEI on different time scales, and the correlation was mostly positive. The correlation between the NPP and the SPEI was non-significant in the early period of the growth for broadleaf forest. From June to September, NPP and SPEI were positively correlated. In June and September, NPP showed a significant positive correlation with the SPEI of 0 month. In July, NPP showed a significant positive correlation with the SPEI of the previous month, and in August, the NPP showed a significant positive correlation with the SPEI of the previous month. Thus, the impact of drought on broadleaf forest was lagging.
The relationship between the NPP and the SPEI of meadow steppe and typical steppe are shown in Figure 11c,d, respectively. The correlation between the NPP and the SPEI of meadow steppe and typical steppe was not significant in April and May. In June, the NPP of meadow steppe and typical steppe was significantly positively correlated with the SPEI of the current month, and the NPP of meadow steppe and typical steppe was more susceptible to drought. The NPP of July and the SPEI of the previous month, and the NPP of August and the SPEI of the previous month, were all significantly positively correlated. The difference was that the NPP in September was significantly positively correlated with the SPEI of the previous two months, and there was no significant correlation between the NPP and the SPEI of October, for meadow steppe. The NPP in September was significantly positively correlated with the SPEI of the previous month, and the NPP in October was significantly positively correlated with the SPEI of the current month, for typical steppe. In general, better correlations were achieved for the previous drought, showing a possible lag in the response of NPP on meadow steppe and typical steppe.
The correlation between NPP and SPEI in desert steppe is shown in Figure 11e. The correlation was small and non-significant in April and May. The NPP in June, July, and October had a significant positive correlation with the SPEI of the current month. There was a significant positive correlation between the NPP in August and the SPEI in the previous month, and the NPP in September and the SPEI of the two previous months. Thus, the response of desert steppe to drought was also lagging.
The correlation between the NPP and SPEI of shrub is shown in Figure 11f. Overall, the NPP and the SPEI were positively correlated. The NPP in June and October was significantly positively correlated with the SPEI of the current month. The NPP in July and the SPEI of the previous month, the NPP in August and the SPEI of the previous two months, and the NPP in September and the SPEI of the previous month, all had strong and significant positive correlations. Thus, the effect of drought on shrub also lagged.
The correlation between the NPP and the SPEI of sandy land and cropland is shown in Figure 11g,h, respectively. The correlation was not significant in April, but it was significantly positive in June and July. The NPP in August and October showed a high positive correlation with the SPEI of one month prior. Thus, the response of sandy land and cropland to drought was lagging. The difference was that the correlation was not significant for cropland in May, and the NPP in September was significantly positively correlated with the SPEI of the previous month. The NPP in May and September for sandy land were significantly positively correlated with the SPEI of the current month.
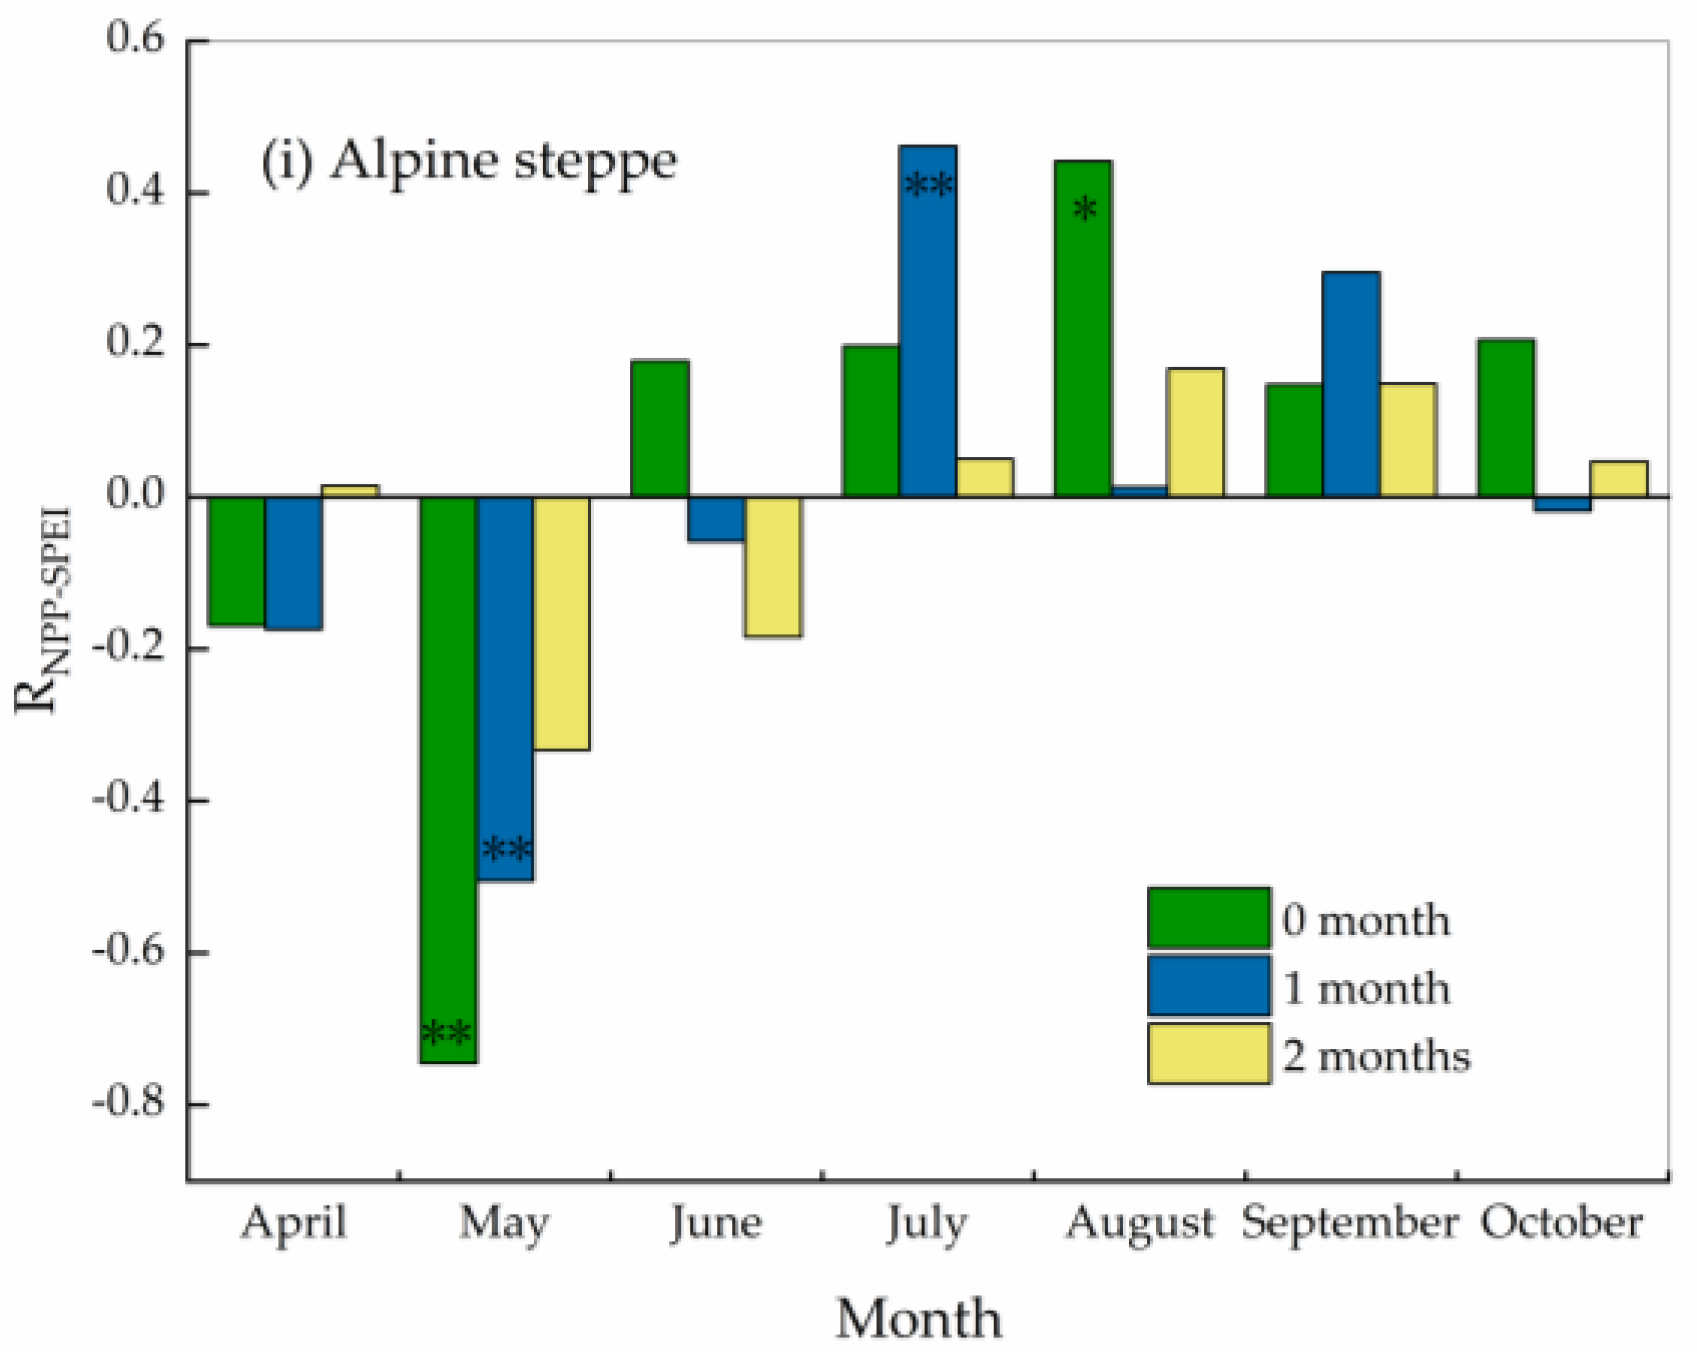
The correlation between the NPP and the SPEI of alpine steppe is shown in Figure 11i. There was no significant correlation in April. The NPP in May showed a significant negative correlation with the SPEI of the current month. The NPP in June had a negative but non-significant correlation with the SPEI of the previous two months, and the NPP in July had a significant positive correlation with the SPEI of the previous month. The correlation was significantly positive in August. The correlation was not significantly positive between the NPP in September and the SPEI of the previous month, and the NPP in October and the SPEI of the current month, indicating that vegetation in June, July and September had a greater response to the previous drought.
Overall, different vegetation in the Mongolian Plateau showed different responses to the SPEI in the growing season, and the response was inconspicuous during the early stage of the growing season. The NPP responded strongly to the SPEI of the current month and the previous month.
4. Discussion
In the study, MODIS data were used to verify the NPP simulated by the CASA model, and the results proved that the CASA model could effectively reflect the productivity status of vegetation in the Mongolian Plateau. Bao [32] and Huang et al. [27] also proved that NPP simulated by the CASA model was highly applicable for the Mongolian Plateau. In the Mongolian Plateau, the NPP showed an increasing trend from 1982 to 2014, indicating that the Mongolian Plateau is playing an increasingly important role as a global carbon sink. In spring, the NPP showed a significant increase, which is consistent with the conclusions of Piao et al. [40] that NPP increases in spring in the Northern Hemisphere. In Figure 4, the NPP of vegetation in Ordos showed a significant increasing trend, which may be due to the impact of human activities in recent years, as well as the implementation of desertification control and ecological restoration projects [41,42,43,44].
Based on the SPEI, we analyzed the spatial pattern of meteorological drought in the Mongolian Plateau during 1982–2014. Changes in meteorological drought over the Mongolian Plateau have been extensively studied. Tong et al. [45] used the SPEI–PM (Standardized Precipitation Evapotranspiration Index–Penman Monteith) model to study the spatial-temporal distribution of drought in the Mongolian Plateau from 1980 to 2014, and found that the severity of drought was increasing. Cao et al. [46] analyzed the changes in drought over the Mongolian Plateau from 1981 to 2012, based on the temperature vegetation dryness index (TVDI), and also concluded that the degree of drought was increasing. Narisu et al. [47] used the Palmer Drought Severity Index (PDSI) to study drought changes in the Mongolian Plateau, and found that the area affected by the severity of drought was gradually increasing. These conclusions are consistent with the conclusions of this paper. During the period from 1982 to 2014, drought increased, and NPP also showed an increasing trend. This may be due to the vegetation growth in the Mongolian Plateau, caused by the combined effects of climate change and human activities. In recent years, the reduction of fire disasters, fence-blocked grazing, and improvements in cultivation techniques and other measures also had increased vegetation productivity [42].
According to the correlation analysis between NPP and the SPEI, many areas in the Mongolian Plateau exhibited positive correlation. Shouvik Jha et al. [48] used the SPEI to analyze the correlation between NPP and SPEI in arid and semi-arid areas from 2001 to 2013, and found a strong positive correlation, which is consistent with the conclusion of this paper. However, their study did not discuss the response of different vegetation types to the SPEI, but divided different agroclimatic zones for discussion, which is worth identifying in our future research. In this paper, we further studied the response of different vegetation NPP to drought, and found that the response of NPP to the SPEI was different in different vegetation types. A notable feature was the strong correlation between NPP and SPEI in broadleaf forests. This may be due to the large leaf area and strong transpiration of most broadleaf forests, which require more water than coniferous forests. Thus, broadleaf forest had a greater correlation with the SPEI. The weaker sensitivity of the coniferous forest and the SPEI may be due to the strong water storage capacity of coniferous forests, which have less water evaporation and lower transpiration rates than that of broadleaf forests, resulting in less impact of drought in coniferous forests. Different vegetation may have different responses to drought due to their different ecological characteristics [49]. However, drought is not the only factor affecting NPP. Studies have shown that the decline of NPP in Europe in 2003 was caused by high temperature and drought [50], which indicates that extreme high temperature also limits NPP. Nevertheless, some studies have shown that during drought, the increase in solar radiation due to the decrease in cloud cover will eventually promote vegetation productivity [51]. These factors should be considered more comprehensively in future studies.
5. Conclusions
In this study, based on the CASA model and the SPEI, we studied the impact of drought on NPP in the Mongolian Plateau from 1982 to 2014, and analyzed the temporal and spatial distribution characteristics and correlation between NPP and drought. The main conclusions of this study can be summarized as follows:
1. On the whole, the results of NPP estimated using the CASA model were satisfactory. During the period of 1982–2014, NPP in the growing season and spring increased significantly, NPP in summer showed a rapid increasing trend, and NPP in autumn showed a slow increasing trend. Among these, NPP increased the most during the growing season. Among the different regions, Inner Mongolia had the largest increase in NPP. On the spatial scale, the slope of NPP increased significantly in the growing season and the spring, accounting for most areas of the Mongolian Plateau. NPP also increased in most areas in summer and autumn, but not significantly.
2. Based on the SPEI, the temporal and spatial variation of drought in the Mongolian Plateau over the last 33 years was analyzed. The results showed that, on the temporal scale, the severity of drought was increasing in each season, and the decrease in the SPEI in Mongolia was larger than that in Inner Mongolia. Spatially, the degree of drought increased in most areas of the Mongolian Plateau during the growing season, spring, summer, and autumn, although a non-significant increase in drought accounted for a relatively large area. Compared with other seasons, the area with a significant increase in drought in the spring accounted for the least, and the summer drought was the most severe.
3. In the Mongolian Plateau, the NPP and the SPEI were more positively correlated in different seasons, of which summer had a large proportion. The largest proportion of areas with significant negative correlation was observed in spring. The NPP and SPEI of various vegetation types were positively correlated in the growing season and the summer, whereas the correlation was the most negative in the spring. In autumn, only coniferous forest showed a negative correlation. The impact of drought on vegetation in the Mongolian Plateau had a lag effect in the growing season, and the lag response of different vegetation NPP to drought was not significant in the early stages of the growing season.
In general, over the past 33 years, the vegetation growth in Inner Mongolia was better than that in Mongolia, with a higher increasing tendency, and the drought in Mongolia was more serious than in Inner Mongolia. Moreover, it can be concluded that different vegetation NPP had a strong response to the SPEI of the current month and the previous month. This can provide reference for the sustainable development of the terrestrial ecosystem, preventing drought disaster and the impact of climate change on the Mongolian Plateau.
Author Contributions
All of the authors contributed significantly to this manuscript. Theoretical aspects, Y.B.; data collection and preprocessing, S.T., J.R. and X.G.; methodology, H.Y.; writing—original draft preparation, X.G. and S.T. All authors have read and agreed to the published version of the manuscript.
Funding
This research was supported by the National Natural Science Foundation of China (No. 42061070), the High-level introduction of talent research start-up fund in Inner Mongolia Normal University (2019YJRC002), and the Key Program of National Natural Science Foundation of China (No.61631011).
Institutional Review Board Statement
Not applicable.
Informed Consent Statement
Not applicable.
Data Availability Statement
Not applicable.
Conflicts of Interest
The authors declare no conflict of interest.
References
- Liu, S.L.; Zhang, Y.Q.; Cheng, F.Y.; Hou, X.Y.; Zhao, S. Response of Grassland Degradation to Drought at Different Time-Scales in Qinghai Province: Spatio-Temporal Characteristics, Correlation, and Implications. Remote Sens. 2017, 9, 1329. [Google Scholar] [CrossRef] [Green Version]
- Gang, C.C.; Wang, Z.Q.; Chen, Y.Z.; Yang, Y.; Li, J.L.; Cheng, J.M.; Qi, J.G.; Odeh, I. Drought-induced dynamics of carbon and water use efficiency of global grasslands from 2000 to 2011. Ecol. Indic. 2016, 67, 788–797. [Google Scholar] [CrossRef]
- Dai, A.G. Increasing drought under global warming in observations and models. Nat. Clim. Chang. 2013, 3, 52–58. [Google Scholar] [CrossRef]
- Jiang, D.B.; Wang, X.X. A brief interpretation of drought change from IPCC Sixth Assessment Report. Trans. Atmos. Sci. 2021, 44, 650–653. [Google Scholar]
- Sun, Y. Human Influence on the Climate System—An Interpretation of WGI Report of IPCC AR6. Trans. Atmos. Sci. 2021, 44, 654–657. [Google Scholar]
- IPCC. Climate Change 2021: The Physical Science Basis. In China Meteorological News; Sixth Assessment Report Working Group I; IPCC: Geneva, Switzerland, 2021; Volume 1. [Google Scholar]
- Trenberth, K.E.; Dai, A.G.; van der Schrier, G.; Jones, P.D.; Barichivich, J.; Briffa, K.R.; Sheffield, J. Global warming and changes in drought. Nat. Clim. Chang. 2014, 4, 17–22. [Google Scholar] [CrossRef]
- Keyantash, J.; Dracup, J.A. The quantification of drought: An evaluation of drought indices. Bull. Am. Meteorol Soc. 2002, 83, 1167–1180. [Google Scholar] [CrossRef]
- Porter, S.C.; Hallet, B.; Wu, X.H.; An, Z.S. Dependence of Near-Surface Magnetic Susceptibility on Dust Accumulation Rate and Precipitation on the Chinese Loess Plateau. Quat. Res. 2001, 55, 271–283. [Google Scholar] [CrossRef]
- Sternberg, T. Regional drought has a global impact. Nature 2011, 472, 169. [Google Scholar] [CrossRef]
- Kong, R.; Zhang, Z.; Zhang, F.; Tian, J.; Chang, J.; Jiang, S.; Zhu, B.; Chen, X. Increasing carbon storage in subtropical forests over the Yangtze River basin and its relations to the major ecological projects. Sci. Total. Environ. 2020, 709, 136–163. [Google Scholar] [CrossRef]
- Chen, T.; Li, P.; Shao, Q.L.; Wang, Q. Spatio-temporal Pattern of Net Primary Productivity in Hengduan Mountains area, China: Impacts of Climate Change and Human Activities. Chin. Geogr. Sci. 2017, 27, 948–962. [Google Scholar] [CrossRef] [Green Version]
- Ren, H.; Shang, Y.; Zhang, S. Measuring the spatiotemporal variations of vegetation net primary productivity in Inner Mongolia using spatial autocorrelation. Ecol. Indic. 2020, 112, 106–108. [Google Scholar] [CrossRef]
- Wang, J.; Brown, D.G.; Chen, J.Q. Drivers of the dynamics in net primary productivity across ecological zones on the Mongolian Plateau. Landsc. Ecol. 2013, 28, 725–739. [Google Scholar] [CrossRef]
- Ersahin, S.; Bilgili, B.; Dikmen, U.; Ercanli, I. Net Primary Productivity of Anatolian Forests in Relation to Climate, 2000–2010. Forest Sci. 2016, 62, 698–709. [Google Scholar] [CrossRef]
- Zhao, M.; Running, S.W. Drought-induced reduction in global terrestrial net primary production from 2000 through 2009. Science 2010, 329, 940–943. [Google Scholar] [CrossRef] [PubMed] [Green Version]
- Yu, C.L.; Liu, D. Response in productivity of natural vegetation to drought in northeast China based on MODIS. Acta Ecologica Sinica. 2019, 39, 3978–3990. [Google Scholar]
- Chen, T.; Werf, G.R.; Jeu, R.A.M.; Wang, G.; Dolman, A.J. A global analysis of the impact of drought on net primary productivity. Hydrol. Earth Syst. Sci. 2013, 17, 3885–3894. [Google Scholar] [CrossRef] [Green Version]
- Lai, C.G.; Li, J.; Wang, Z.; Wu, X.; Zeng, Z.; Chen, X.; Lian, Y.; Yu, H.; Wang, P.; Bai, X. Drought-Induced Reduction in Net Primary Productivity across Mainland China from 1982 to 2015. Remote Sens. 2018, 10, 1433. [Google Scholar] [CrossRef] [Green Version]
- Yang, S.Y.; Meng, D.; Li, X.J.; Wu, X.L. Multi-scale responses of vegetation changes relative to the SPEI meteorological drought index in North China in 2001–2014. Acta Ecol. Sin. 2018, 38, 1028–1039. [Google Scholar]
- Sun, B.; Zhao, H.; Wang, X. Effects of drought on net primary productivity: Roles of temperature, drought intensity, and duration. Chin. Geogr. Sci. 2016, 26, 270–282. [Google Scholar] [CrossRef] [Green Version]
- John, R.; Chen, J.Q.; Ou-Yang, Z.-T.; Xiao, J.F.; Becker, R.; Samanta, A.; Ganguly, S.; Yuan, W.P.; Batkhishig, O. Vegetation response to extreme climate events on the Mongolian Plateau from 2000 to 2010. Environ. Res. Lett. 2013, 8, 035033. [Google Scholar] [CrossRef]
- Huang, L.; He, B.; Chen, A.; Wang, H.; Liu, J.; Lu, A.; Chen, Z. Drought dominates the interannual variability in global terrestrial net primary production by controlling semi-arid ecosystems. Sci. Rep. 2016, 6, 554. [Google Scholar]
- Lu, C.Q.; Tian, H.Q.; Zhang, J.; Yu, Z.; Pan, S.F.; Dangal, S.; Zhang, B.; Yang, J.; Pederson, N.; Hessl, A. Severe Long-Lasting Drought Accelerated Carbon Depletion in the Mongolian Plateau. Geophys. Res. Lett. 2019, 46, 5303–5312. [Google Scholar] [CrossRef]
- Cao, X.M.; Feng, Y.M.; Shi, Z.J. Spatio-temporal variations in drought with remote sensing from the Mongolian Plateau during 1982–2018. Chin Geogr Sci. 2020, 30, 1081–1094. [Google Scholar] [CrossRef]
- Tong, S.Q.; Liu, G.X.; Bao, Y.H.; Bao, G. Drought Monitoring in Mongolia Plateau from 1982 to 2006. In Proceedings of the Sixth Annual Meeting of Risk Analysis Committee of China Disaster Prevention Association, Hohhot, China, 23 August 2014; Volume 5. [Google Scholar]
- Huang, D.C. Estimation of Net Primary Productivity in the Mongolian Plateau Based on CASA Model. Master’s Thesis, Liaoning Technical University, Fuxin, China, 2014. [Google Scholar]
- Zhu, W.Q. Estimation of Net Primary Productivity of Chinese Terrestrial Vegetation Based on Remote Sensing and Its Relationship with Global Climate Change. Ph.D. Thesis, Beijing Normal University, Beijing, China, 2005. [Google Scholar]
- Zhu, W.Q.; Pan, Y.Z.; Zhang, J.S. Estimation of net primary productivity of Chinese terrestrial vegetation based on remote sensing. J. Plant Ecol. 2007, 31, 413–424. [Google Scholar]
- Pei, F.S.; Li, X.; Liu, X.P.; Wang, S.J.; He, Z.J. Assessing the differences in net primary productivity between pre-and post-urban land development in China. Agric. For. Meteorol. 2013, 171, 174–186. [Google Scholar] [CrossRef]
- Pei, F.S.; Li, X.; Liu, X.P.; Lao, C.H. Assessing the impacts of droughts on net primary productivity in China. J. Environ. Manag. 2013, 114, 362–371. [Google Scholar] [CrossRef]
- Bao, G.; Chen, J.Q.; Chopping, M.; Bao, Y.H.; Bayarsaikhan, S.; Dorjsuren, A.; Tuya, A.; Jirigala, B.; Qin, Z. Dynamics of net primary productivity on the Mongolian Plateau: Joint regulations of phenology and drought. Int. J. Appl. Earth Obs. Geoinf. 2019, 81, 85–97. [Google Scholar] [CrossRef]
- Zhu, W.Q.; Pan, Y.Z.; He, H.; Yu, D.Y.; Hu, H.B. Simulation of maximum light utilization efficiency of typical vegetation in China. Chin Sci Bull. 2006, 6, 700–706. [Google Scholar]
- Bao, G.; Bao, Y.H.; Qin, Z.H.; Xin, X.P.; Bao, Y.L.; Bayarsaikan, S.; Zhou, Y.; Chuntai, B. Modeling net primary productivity of terrestrial ecosystems in the semi-arid climate of the Mongolian Plateau using LSWI-based CASA ecosystem model. Int. J. Appl. Earth Obs. Geoinf. 2016, 46, 84–93. [Google Scholar] [CrossRef]
- Vicente-Serrano, S.M.; Beguería, S.; López-Moreno, J.I. A multi-scalar drought index sensitive to global warming: The standardized precipitation evapotranspiration index. J. Clim. 2010, 23, 1696–1718. [Google Scholar] [CrossRef] [Green Version]
- Rusnam, R.; Yanti, N.R. Potential Evapotranspiration Uses Thornthwaite Method to the Water Balance in Padang City. In IOP Conference Series: Earth and Environmental Science; IOP Publishing: Bristol, UK, 2021; Volume 757. [Google Scholar]
- Fensholt, R.; Langanke, T.; Rasmussen, K.; Reenberg, A.; Prince, S.; Tucker, C.; Scholes, R.; Le, Q.; Bondeau, A.; Eastman, R.; et al. Greenness in semi-arid areas across the globe 1981–2007—An Earth Observing Satellite based analysis of trends and drivers. Remote Sens Environ. 2012, 121, 144–158. [Google Scholar] [CrossRef]
- Sen, P.K. Estimates of the regression coefficient based on Kendall’s tau. J. Am. Stat. Assoc. 1968, 63, 1379–1389. [Google Scholar] [CrossRef]
- Piao, S.L.; Fang, J.Y.; Chen, A.P. Seasonal Dynamics of Terrestrial Net Primary Production in Response to Climate Changes in China. Acta Botanica Sinica 2003, 3, 269–275. [Google Scholar]
- Piao, S.L.; Fang, J.Y.; Guo, Q.H. Application of CASA model to the estimation of Chinese terrestrial net primary productivity. Acta Phytoecol. Sin. 2001, 25, 603–608. [Google Scholar]
- Tian, H.J.; Cao, C.X.; Chen, W.; Bao, S.N.; Yang, B.; Myneni, R.B. Response of vegetation activity dynamic to climatic change and ecological restoration programs in Inner Mongolia from 2000 to 2012. Ecol. Eng. 2015, 82, 276–289. [Google Scholar] [CrossRef]
- Ma, W.Y.; He, L.; Zhao, C.Y. Desertification dynamics in Alxa League over the period of 2000–2012. J. Lanzhou Univ. 2015, 51, 55–60. [Google Scholar]
- Tong, S.; Zhang, J.; Bao, Y.; Lai, Q.; Lian, X.; Li, N.; Bao, Y.B. Analyzing vegetation dynamic trend on the Mongolian Plateau based on the Hurst exponent and influencing factors from 1982–2013. J. Geogr. Sci. 2018, 28, 5. [Google Scholar] [CrossRef] [Green Version]
- Tong, S.; Zhang, J.; Bao, Y. Spatial and temporal variations of vegetation cover and the relationships with climate factors in Inner Mongolia based on GIMMS NDVI3g data. J. Arid. Land. 2017, 9, 394–407. [Google Scholar] [CrossRef] [Green Version]
- Tong, S.; Lai, Q.; Zhang, J.; Bao, Y.; Lusi, A.; Ma, Q.; Li, X.; Zhang, F. Spatiotemporal drought variability on the Mongolian Plateau from 1980–2014 based on the SPEI-PM, intensity analysis and Hurst exponent. Sci. Total Environ. 2017, 615, 1557–1565. [Google Scholar] [CrossRef]
- Cao, X.M.; Feng, Y.M.; Wang, J.L.; Gao, Z.; Ning, J.; Gao, W. The study of the spatio-temporal changes of drought in the Mongolian Plateau in 40 years based on TVDI. SPIE Int. 2014, 9221, 92210X. [Google Scholar]
- Narisu, N.; Bao, Y.; Bao, Y. Drought Temporal Variation Characteristics Analysis Based on the PDSI Data in Mongolian Plateau. In Meeting of Risk Analysis Council of China Association for Disaster Prevention; Atlantis Press: Paris, France, 2016; pp. 843–848. [Google Scholar]
- Jha, S.; Srivastava, R. Impact of drought on vegetation carbon storage in arid and semi-arid regions. Remote Sens. Appl. 2018, 11, 22–29. [Google Scholar] [CrossRef]
- Zhao, J. The Responses to Drought and Drought-Resistant Characteristics of Nature Vegetation in Huang-Huai-Hai River Basion. Master’s Thesis, Donghua University, Shanghai, China, 2015. [Google Scholar]
- Ciais, P.; Reichstein, M.; Viovy, N.; Granier, A.; Ogee, J.; Allard, V.; Aubi-Net, M.; Buchmann, N.; Bernhofer, C.; Carrara, A. Europe-wide reduction in primary productivity caused by the heat and drought in 2003. Nature 2005, 437, 529–533. [Google Scholar] [CrossRef] [PubMed]
- Saleska, S.R.; Didan, K.; Huete, A.R.; da Rocha, H.R. Amazon forests green-up during 2005 drought. Science 2007, 318, 612. [Google Scholar] [CrossRef] [PubMed] [Green Version]
Figure 1.
Distribution of vegetation types, solar radiation and meteorological stations on the Mongolian Plateau.
Figure 1.
Distribution of vegetation types, solar radiation and meteorological stations on the Mongolian Plateau.

Figure 2.
Verification of NPP (the horizontal axis represents the simulation value of NPP, and the vertical axis represents the MODIS NPP).
Figure 2.
Verification of NPP (the horizontal axis represents the simulation value of NPP, and the vertical axis represents the MODIS NPP).

Figure 3.
Temporal trend of NPP for (a) the growing season, (b) spring, (c) summer, and (d) autumn over the Mongolian Plateau, Mongolia and Inner Mongolia during 1982–2014 at different seasons.
Figure 3.
Temporal trend of NPP for (a) the growing season, (b) spring, (c) summer, and (d) autumn over the Mongolian Plateau, Mongolia and Inner Mongolia during 1982–2014 at different seasons.

Figure 4.
Spatial patterns of NPP trend for (a) the growing season, (b) spring, (c) summer, and (d) autumn in the Mongolian Plateau during 1982–2014.
Figure 4.
Spatial patterns of NPP trend for (a) the growing season, (b) spring, (c) summer, and (d) autumn in the Mongolian Plateau during 1982–2014.

Figure 5.
Area percentage of significance of NPP for (a) the growing season, (b) spring, (c) summer, and (d) autumn in the Mongolian Plateau, Mongolia, and Inner Mongolia.
Figure 5.
Area percentage of significance of NPP for (a) the growing season, (b) spring, (c) summer, and (d) autumn in the Mongolian Plateau, Mongolia, and Inner Mongolia.

Figure 6.
Temporal variation trends in the SPEI for (a) the growing season, (b) spring, (c) summer, and (d) autumn of the Mongolian Plateau, Mongolia, and Inner Mongolia.
Figure 6.
Temporal variation trends in the SPEI for (a) the growing season, (b) spring, (c) summer, and (d) autumn of the Mongolian Plateau, Mongolia, and Inner Mongolia.

Figure 7.
Spatial significance variation of the SPEI for (a) the growing season, (b) spring, (c) summer, and (d) autumn in the Mongolian Plateau.
Figure 7.
Spatial significance variation of the SPEI for (a) the growing season, (b) spring, (c) summer, and (d) autumn in the Mongolian Plateau.

Figure 8.
Area percentage of significance in the SPEI for (a) the growing season, (b) spring, (c) summer, and (d) autumn of the Mongolian Plateau, Mongolia and Inner Mongolia.
Figure 8.
Area percentage of significance in the SPEI for (a) the growing season, (b) spring, (c) summer, and (d) autumn of the Mongolian Plateau, Mongolia and Inner Mongolia.

Figure 9.
Spatial distribution of the correlation coefficient between NPP and the SPEI for (a) the growing season, (b) spring, (c) summer, and (d) autumn of the Mongolian Plateau from 1982 to 2014.
Figure 9.
Spatial distribution of the correlation coefficient between NPP and the SPEI for (a) the growing season, (b) spring, (c) summer, and (d) autumn of the Mongolian Plateau from 1982 to 2014.

Figure 10.
Correlation between the SPEI and the NPP of different vegetation types in the Mongolian Plateau (* indicates a significance level of 0.05, whereas ** indicates a significance level of 0.01.).
Figure 10.
Correlation between the SPEI and the NPP of different vegetation types in the Mongolian Plateau (* indicates a significance level of 0.05, whereas ** indicates a significance level of 0.01.).

Figure 11.
Correlation between the NPP and the SPEI of nine vegetation types (a) coniferous forest, (b) broadleaf forest, (c) meadow steppe, (d) typical steppe, (e) desert steppe, (f) shrub, (g) sandy land, (h) cropland, (i) alpine steppe on different time scales (the horizontal axis represents the month, and the vertical axis represents the Pearson correlation coefficient of the SPEI and the NPP; * indicates a significance level of 0.05, whereas ** indicates a significance level of 0.01, 0 month indicates the correlation between the NPP and the SPEI of the current month, 1 month indicates the correlation between the NPP and the SPEI of the previous month, and 2 month indicates the correlation between the NPP and the SPEI of the previous two months).


Table 1.
Area percentage of the correlation between NPP and the SPEI of the Mongolian Plateau during 1982–2014.
Table 1.
Area percentage of the correlation between NPP and the SPEI of the Mongolian Plateau during 1982–2014.
| Time Scale | Positive Correlation (%) | Significantly Positive Correlation (%, p < 0.05) | Negative Correlation (%) | Significantly Negative Correlation (%, p < 0.05) |
|---|---|---|---|---|
| Growing season | 91.86 | 20.89 | 8.14 | 7.29 |
| Spring | 53.27 | 47.96 | 46.73 | 37.71 |
| Summer | 93.48 | 21.26 | 6.52 | 5.87 |
| Autumn | 89.50 | 50.27 | 10.50 | 10.26 |
Publisher’s Note: MDPI stays neutral with regard to jurisdictional claims in published maps and institutional affiliations. |
© 2021 by the authors. Licensee MDPI, Basel, Switzerland. This article is an open access article distributed under the terms and conditions of the Creative Commons Attribution (CC BY) license (https://creativecommons.org/licenses/by/4.0/).
Share and Cite
MDPI and ACS Style
Guo, X.; Tong, S.; Ren, J.; Ying, H.; Bao, Y. Dynamics of Vegetation Net Primary Productivity and Its Response to Drought in the Mongolian Plateau. Atmosphere 2021, 12, 1587. https://0-doi-org.brum.beds.ac.uk/10.3390/atmos12121587
AMA Style
Guo X, Tong S, Ren J, Ying H, Bao Y. Dynamics of Vegetation Net Primary Productivity and Its Response to Drought in the Mongolian Plateau. Atmosphere. 2021; 12(12):1587. https://0-doi-org.brum.beds.ac.uk/10.3390/atmos12121587
Chicago/Turabian StyleGuo, Xiaomeng, Siqin Tong, Jinyuan Ren, Hong Ying, and Yuhai Bao. 2021. "Dynamics of Vegetation Net Primary Productivity and Its Response to Drought in the Mongolian Plateau" Atmosphere 12, no. 12: 1587. https://0-doi-org.brum.beds.ac.uk/10.3390/atmos12121587
Note that from the first issue of 2016, this journal uses article numbers instead of page numbers. See further details here.