
The Possible Impacts of Different Global Warming Levels on Major Crops in Egypt


Natural Resources Department, Faculty of African Postgraduate Studies, Cairo University, Giza 12613, Egypt
*
Author to whom correspondence should be addressed.
Atmosphere 2021, 12(12), 1589; https://0-doi-org.brum.beds.ac.uk/10.3390/atmos12121589
Submission received: 15 November 2021
/
Revised: 27 November 2021
/
Accepted: 28 November 2021
/
Published: 29 November 2021
(This article belongs to the Special Issue Adaptation for Crop Production and Sustainable Agriculture in a Changing Climate)
Abstract
:Climate change implications are a severe risk to food security and the economy. Global warming could disturb the production of both rainfed and irrigated agriculture thru the amplify of yield water requests in many areas. In this study, the fast-track projections available through the Inter-Sectors Impact Model Intercomparison Project (ISI-MIP) were presented and analyzed to assess the effects of two global warming (GW) levels (1.5 and 2.0 °C) on the maize and wheat yields in Egypt. Outcomes proposed spatial variations in the effects of temperature change on crop yield. Compared with the referenced situation, an observed national average change in wheat yield about 5.0% (0.0% to 9.0%) and 5.0% (−3.0% to 14.0%) under GW1.5 and GW2.0 respectively. While for maize yield, the change in national average about −1.0% (−5.0% to 3.0%) and −4.0% (−8.0% to 2.0%) under GW1.5 and GW2.0 respectively. GW1.5 could be helpful for wheat yield, but the positive effect decayed when the warming level reached 2.0 °C overhead the pre-industrial level. Nevertheless, the possible deviations to Egypt’s maize production under the GW1.5 and GW2.0 scenarios are unclear where the models do not agree with the sign of change. Adjusting the temperature rise within 1.5 °C would diminish the yield reduction, as it is an extraordinary priority to safeguard crop production. To achieve Progress of innovative agronomic managing plans and swapping to additional drought-resistant crops may be valuable for coping with climate change in regions vulnerable to yield decline.
1. Introduction
The mean global temperature increased between 0.74 °C and 0.85 °C throughout the period from 1880 to 2012 [1,2,3], with an average of 0.2 °C ± 0.1 °C/decade [4]. Climate change is assumed to be one of the main challenges facing regional and global crop production [3,5,6], and population growth added to global food security [7].
The agricultural system is still one of the most sensitive systems to climate change [8,9], because agricultural production is greatly dependent on weather conditions and climate, as both provide energy and materials for crop growth and are vital in controlling the effective operation of agricultural technologies [10]. High temperatures, frost, dense rainfall, and drought can severely reduce crop yield and quality [11,12], or cause total crop damage, especially in severe cases of heat stress or prolonged drought [13]. It also affects soil water accessibility and carbon-storing [14]; and increases food shortages [15].
To cope with the threats of climate change, the United Nations Paris Agreement adopted efforts to limit global warming to only 1.5 °C above preindustrial levels [16]. The goal of limiting temperature rise to 1.5 degrees Celsius is a critical constraint for nations that can only be met by reducing greenhouse gas emissions [17]. Meanwhile, global warming is currently approaching 1.5 degrees Celsius [18]. All countries must predict the impact of global warming and adopt the necessary adaptation actions.
Globally, 760 million tonnes of wheat (Triticum aestivum L.) are cultivated on the world’s farmland [19]. It is the most widely cultivated cereal, accounting for nearly 30% and 50% of global grain production and trade, respectively [20]. Global wheat production is being hampered by global warming, water scarcity, and rainfall variations [21,22,23]. Consequently, the susceptibility of wheat production in the future has become a key anxiety factor as certain areas could experience a reduction in yield, while others could experience an increase in yield [24,25]. An increase in temperature by 1 °C would cause a 6% drop in wheat yield production globally, based on an ensemble of 30 different wheat models over 30 worldwide sites [23].
In Egypt, wheat is the major crop in bread production. The wheat stock was sufficient to provide 175 kg per capita in the 1980s, corresponding to a world average of less than 60–75 kg per capita [26]. In 2012, consumption jumped from 100 kg per capita to 200 kg per year [27]. Most of the wheat cultivated area lies in the Nile Delta (57%) and smaller zones in Middle and Upper Egypt (18 and 17%, respectively) [28]. Maize is a dual-purpose crop for feed and food, and it has become an important element of global food security [29]. Maize is one of the three chief summer crops in Egypt, competing for the accessible arable space with rice and cotton, where the cultivated part of maize is the most cultivated amongst these three crops [28].
Early work reported a reduction in wheat and maize ranging between 19-23% [30,31] using the MAGICC/SCENGEN model. A change in wheat around −18.0% [32], and a reduction in maize by 14.0% [33], and 19.0% [32] based on the Special Report on Emissions Scenarios (SRES) developed by the IPCC [34]. Likewise, projected losses of about (10–12%) and (13–15%) in 2030 for wheat and maize respectively using the RCP6.0 emission scenario simulated by the CCSM4 global climate model [35].
Prediction of crop yields under future climate emission scenarios is vital for evaluating food security [36]. Modeling is the main tool to discover agricultural impacts and alterations to climate change [37]. Crop growth models were used in studies all over the world to assess the effects of climate variation on crop yields and production [38,39]. The Inter-Sectoral Impact Model Intercomparison Project (ISI-MIP) is a global collaboration of climate-impact researchers to measure cross-sectoral climate influences under different global warming levels, such as 1.5 °C and 2 °C related to the preindustrial situation [40].
This paper aimed to introduce and analyze the fast-track simulations of the ISI-MIP impact models according to global warming levels of 1.5 °C and 2.0 °C for wheat and maize production across diverse planting zones in Egypt. The goals of this study were to: (1) quantify the changes in seasonal maximum and minimum temperatures and evapotranspiration caused by 1.5 °C and 2.0 °C increases in air temperature; (2) explain the spatial variation of the projected impacts of 1.5 °C and 2.0 °C global warming on wheat and maize yields in different cultivation regions of Egypt; and (3) quantify the spatial variation of the projected impacts of 1.5 °C and 2.0 °C global warming on wheat and maize yields in different cultivation regions of Egypt.
2. Materials and Methods
2.1. The Study Area
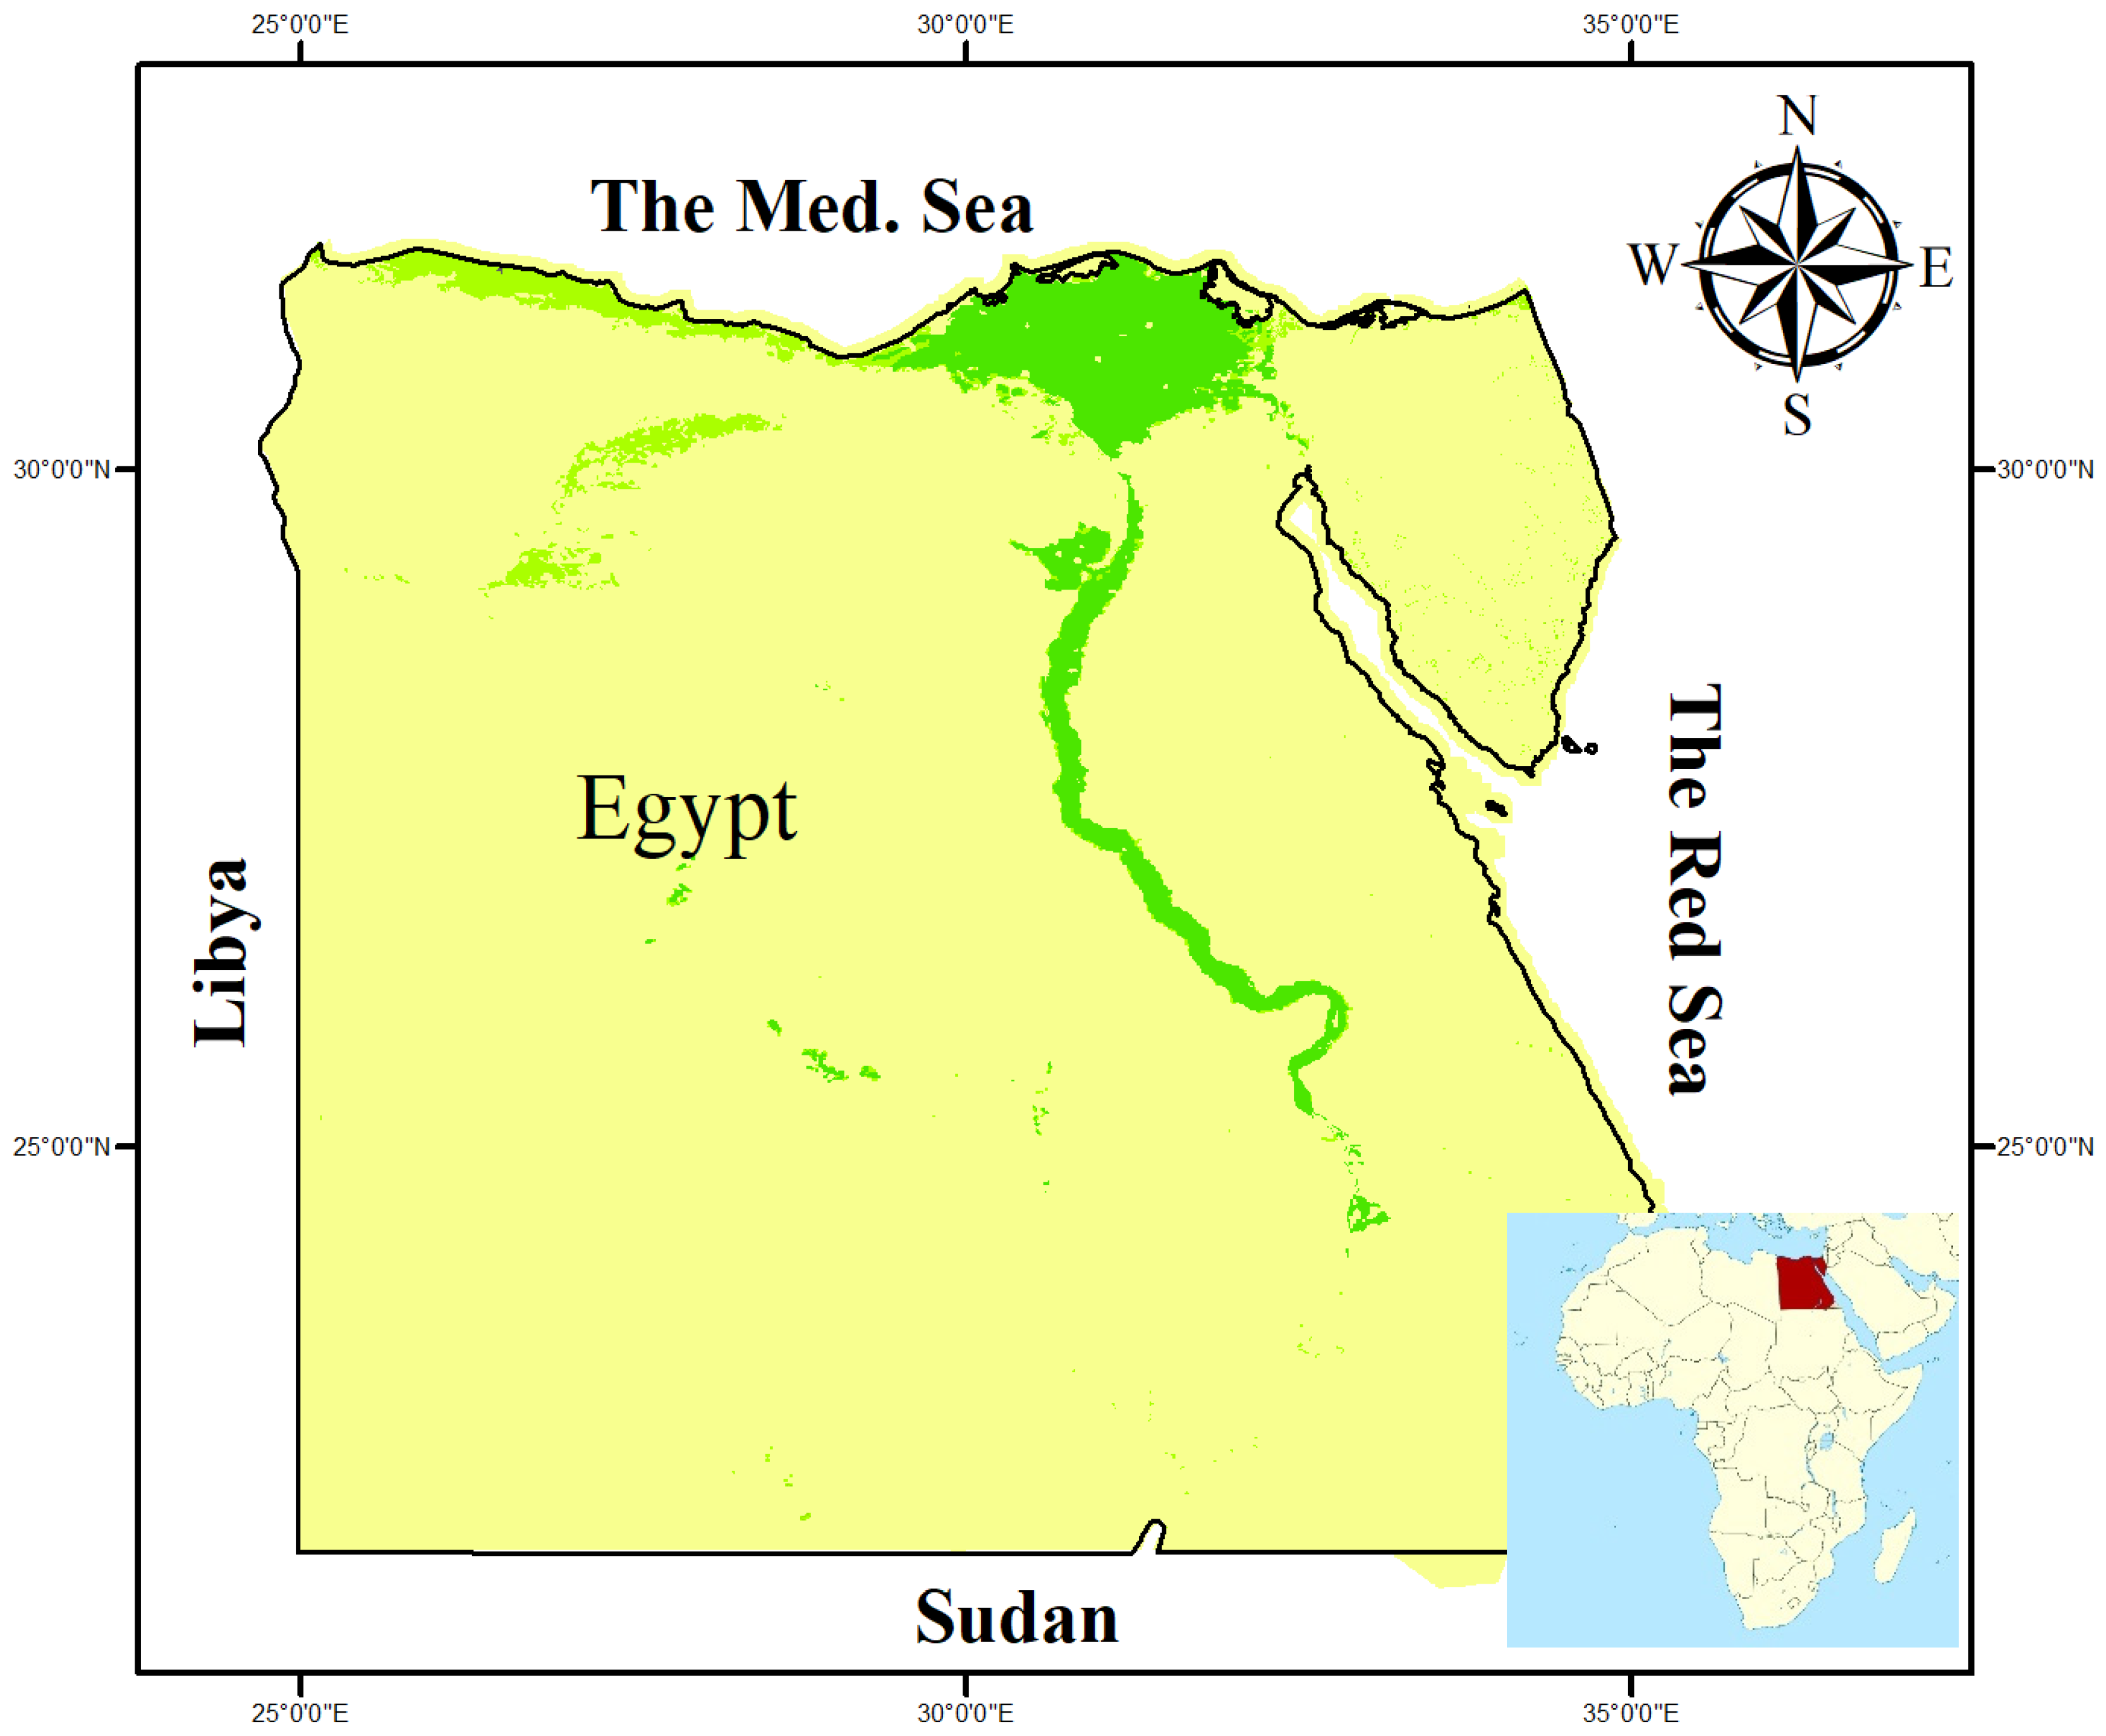
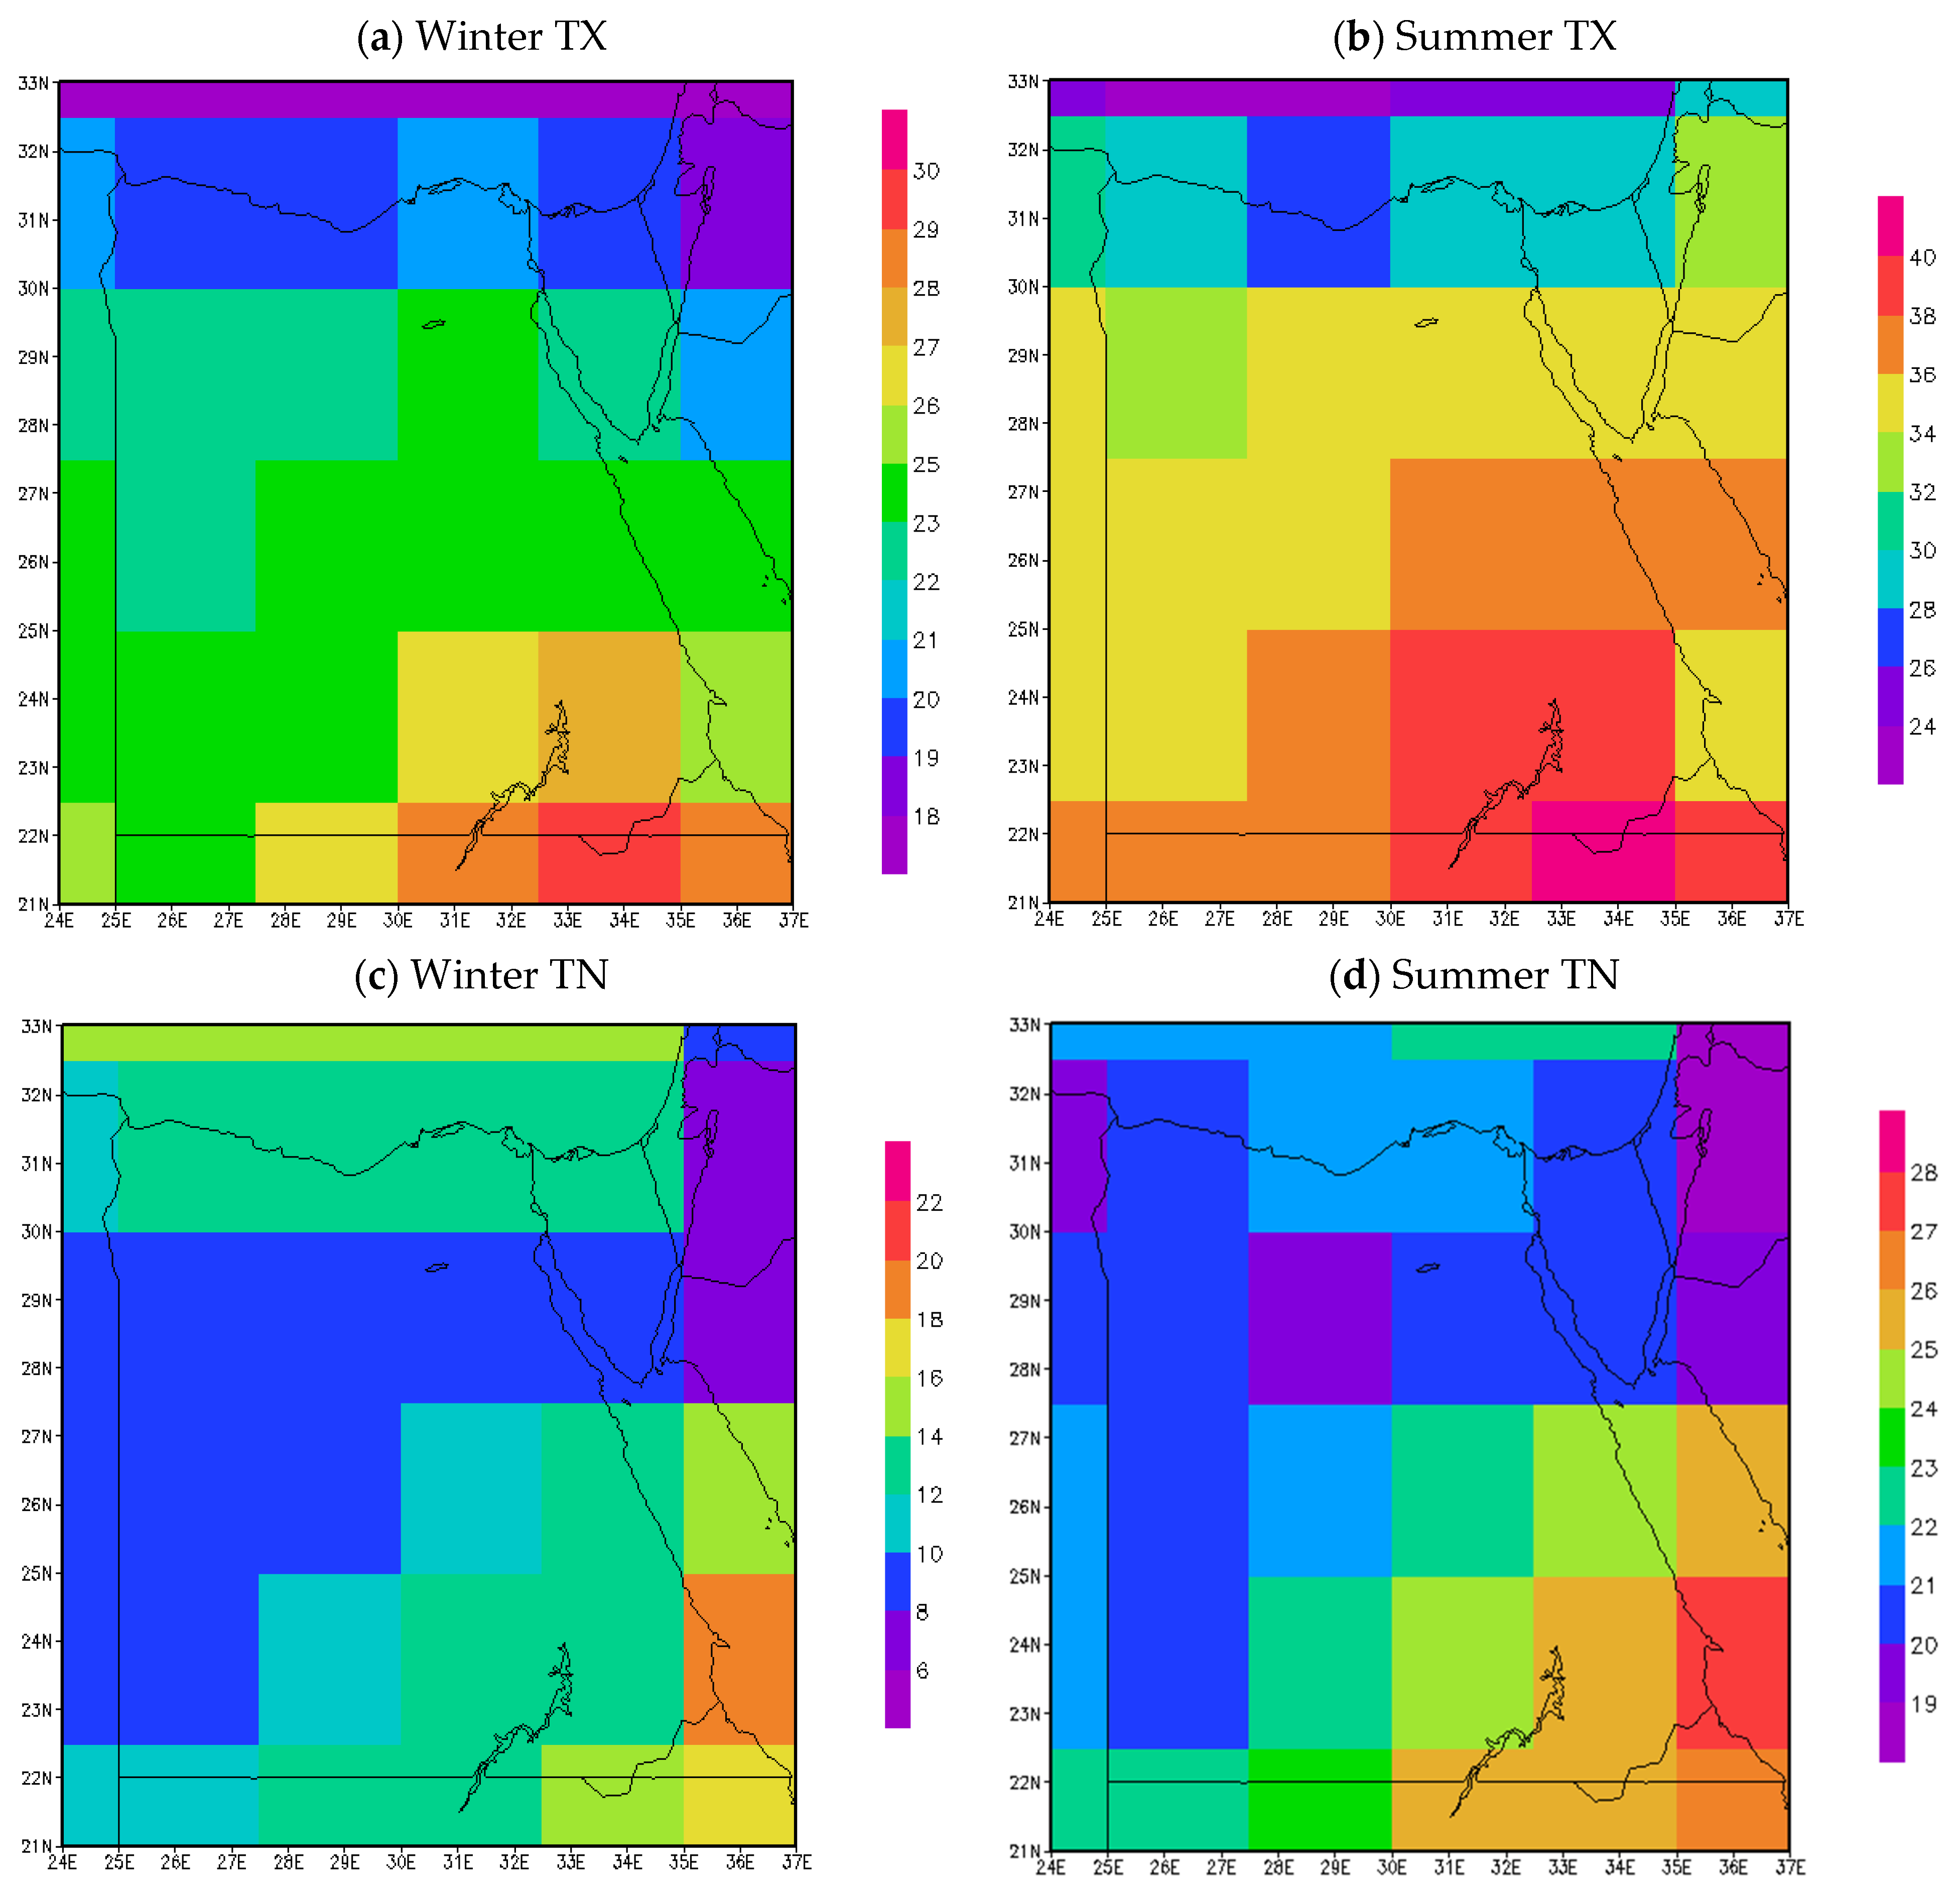
Egypt is in the north-eastern corner of Africa, between latitudes 22°and 32° N and between longitudes 24°and 37° E. It is surrounded by the Mediterranean Sea to the north, and the Red Sea in the East, Libya to the west, and Sudan to the south (Figure 1). The total area of Egypt is close to 1.0 million km2, which includes a massive desert plateau perturbed by the Nile Delta and Valley that occupy nearly 4% of the total Egyptian area [41]. Because of scarce rainfall, Egypt’s agricultural land is limited and covers about 3% of the total Egyptian area. This agricultural area is limited to the narrow Nile Valley from Aswan to Cairo and the Delta to the north [42]. Egypt is characterized by a very high ratio (95%) of crop production using some form of irrigation [43], with land being cultivated more than once per year. The seasonal mean of maximum and minimum temperatures for the two growing seasons for wheat and maize during the referenced period (1986–2005) are presented in Figure 2. The winter season for wheat is from November to April, and the summer season for maize is from May to October. The seasonal mean maximum temperature (TX) during the winter season, (Figure 2a) ranged between 20–22 °C on the Mediterranean coastline and about 23–25 °C along the Red Sea. In the Middle of Egypt, it ranges from 26 to 28 °C up to the south to Aswan. During the summer season (Figure 2b), TX increases from about 26–28 °C on the Mediterranean coastline to about 34 °C on the Red Sea shoreline. In Cairo, it is about 40 °C and higher going farther south to Aswan. The minimum temperature (TN) ranges from is 10 to 14 °C (Figure 2c), and from 20 to 26 °C (Figure 2d), going from north to south for winter and summer seasons, respectively.
Recently, the area was affected by numerous climatic hazards [44,45] as the extreme drought periods, especially in the northeastern area in Egypt. According to IPCC representative concentration pathways, RCP4.5 and RCP8.5 (RCP4.5 and RCP8.5 are correspondingly a medium-low and high radiative forcing scenarios. The two scenarios have the radiative forcing topping at 4.5 and 8.5 Wm-2 by 2100 individually) emissions scenarios [3], the area will experience intense drought events by the 2050s. The future projections of both warm and cold temperature extremes indices such as the percentage of warm days and nights (the percentage of warm days and nights) will increase or decrease according to different emissions scenarios [46,47], also the cultivated area will reduce by 7.0% and 19.0% for wheat and maize respectively in 2030 [48].
2.2. The Inter-Sectoral Impact Model Intercomparison Project (ISI-MIP) Simulations
ISI-MIP was launched in 2012 with the ISI-MIP Fast Track, which brought together about 35 impact models [39]. The focus of this first phase was future projections of global impacts for multiple impact sectors (agriculture [49], water [50], biomes [51,52], malaria [53], and coastal infrastructure [54,55] based on CMIP5 GCM simulations [56].
In this study we used the simulations computed from the ISI-MIP Fast-Track archive based on six global gridded crop models (GGCM) listed in Table 1, driven by five global climate models from CMIP5 listed in Table 2. These results were accessed from (https://climateanalytics.org/tools/, accessed on 23 October 2021) through the online tool RegioCrop. The ISI-MIP dataset covers the period from 1950 to 2099 and is spatially interpolated on a horizontal resolution with 0.5° × 0.5° [57]. The input data sets for the ISI-MIP Fast Track include socio-economic data, land-cover, topographic data, and climate data presented in Table 3.
The GGCMI phase 1 protocol is applied to aggregate the spatial modeling responses of maize, rice, soybeans, and wheat to 0.5° × 0.5° grids. Sowing dates and the length of the growing season were obtained from [58].

Table 1.
The GCCM global crop climate models and their sources.
| GCCM Model | The Institution | Reference |
|---|---|---|
| EPIC | BOKU, University of Natural Resources and Life Sciences, Vienna | [59] |
| GEPIC | EAWAG Swiss Federal Institute of Aquatic Science and Technology | [60] |
| pDSSAT | University of Chicago Computation Institute | [61] |
| PEGASUS | Tyndall Centre, University of East Anglia UK/McGill University, Canada | [62] |
| LPJmL | Lund Potsdam Jena managed land | [63,64,65] |
| LPJ-GUESS | Lund Potsdam Jena General Ecosystem Simulator | [66] |
Table 2.
The CMIP5 global climate models and their sources.
| GCM Model | The Institution | Resolution (lat × lon) | Reference |
|---|---|---|---|
| GFDL-ESM2M | NOAA Geophysical Fluid Dynamics Laboratory, NOAA GFDL | 2.5 × 2.0 | [67,68] |
| HadGEM2-ES | Met Office Hadley Centre, MOHC | 1.9 × 1.2 | [69] |
| IPSL-CM5A-LR | Institute Pierre-Simon Laplace, IPSL | 2.5 × 1.3 | [70] |
| MIROC-ESM-CHEM | Japan Agency for Marine-Earth Science and Technology | 2.8 × 2.8 | [71] |
| NorESM1-M | Norwegian Climate Centre, NCC | 2.5 × 1.9 | [72,73] |
Table 3.
The climate parameters involved in ISI-MIP climate data.
| Surface air temperature (average, minimum and maximum) |
| Precipitation |
| Surface radiation (Short and longwave downwelling) |
| Near-surface wind speed |
| Surface air pressure |
| Near-surface relative humidity |
| CO2 concentration |
3. Results
The episodes of global warming contiguous to 1.5 °C and 2.0 °C above the pre-industrial level for 20 years were set in 2020–2039 under RCP2.6 and 2040–2059 under RCP4.5 respectively [74,75].
3.1. The Climate Variables under GW1.5 and GW2.0
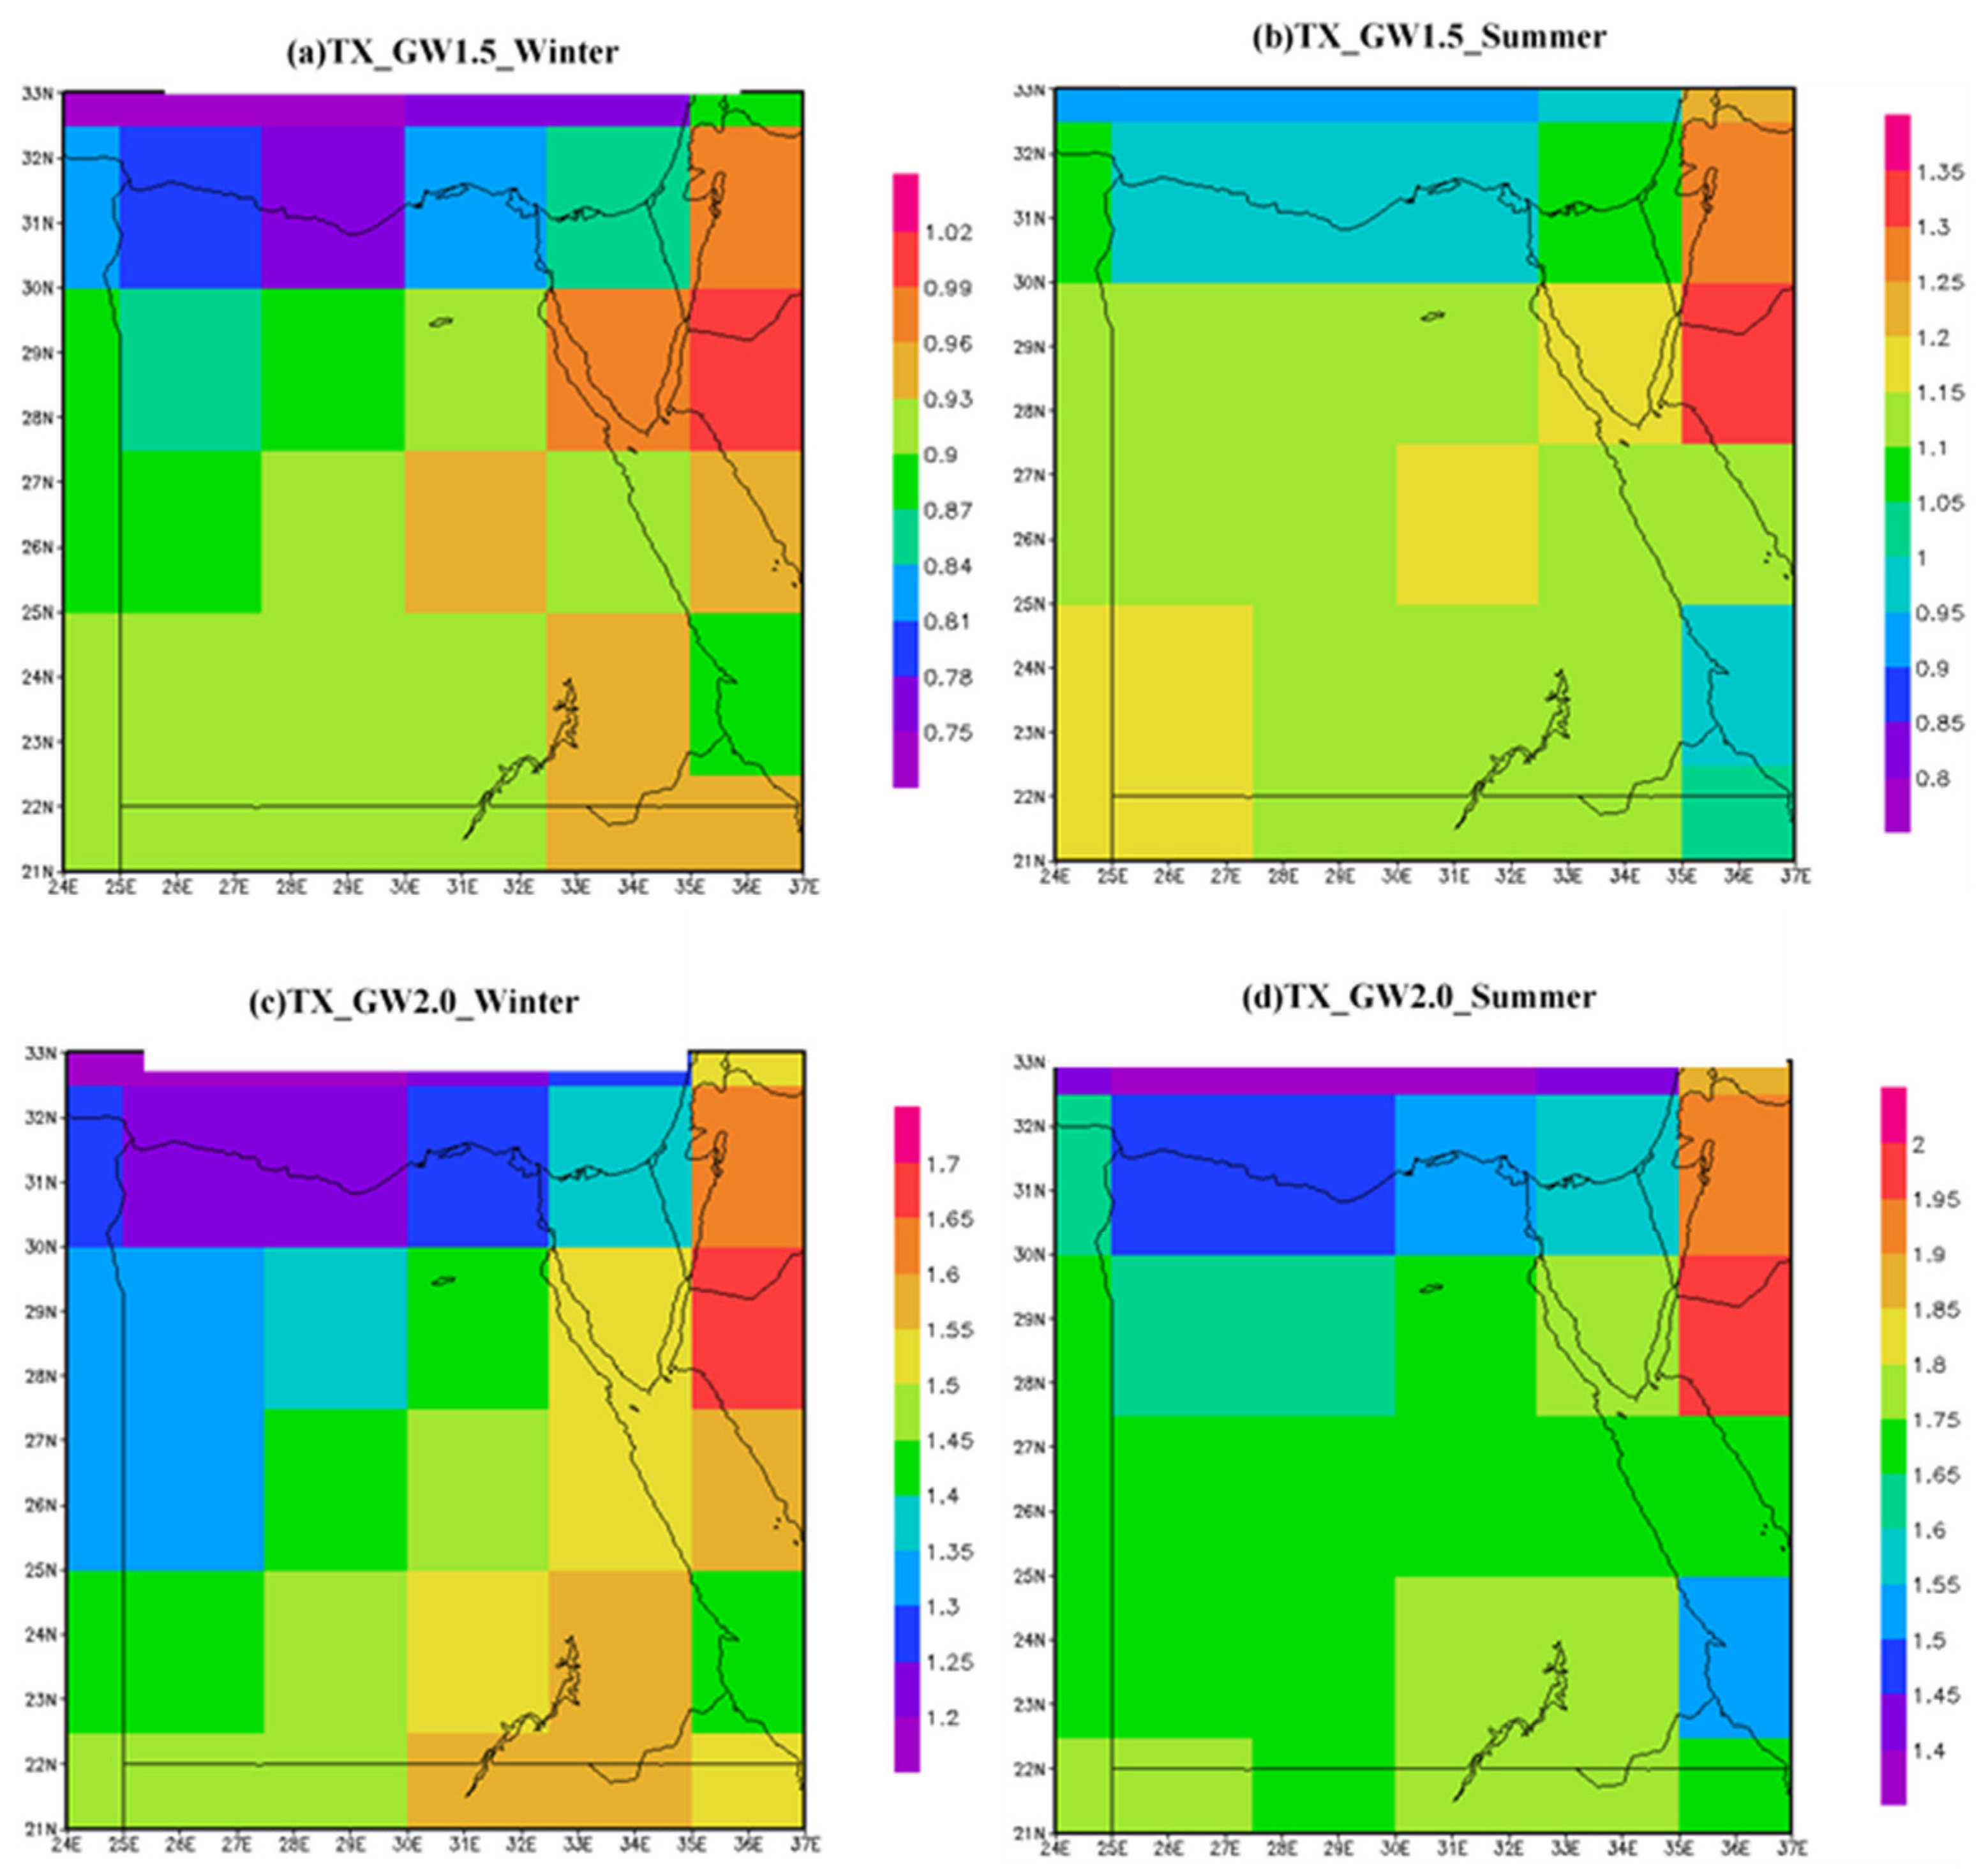
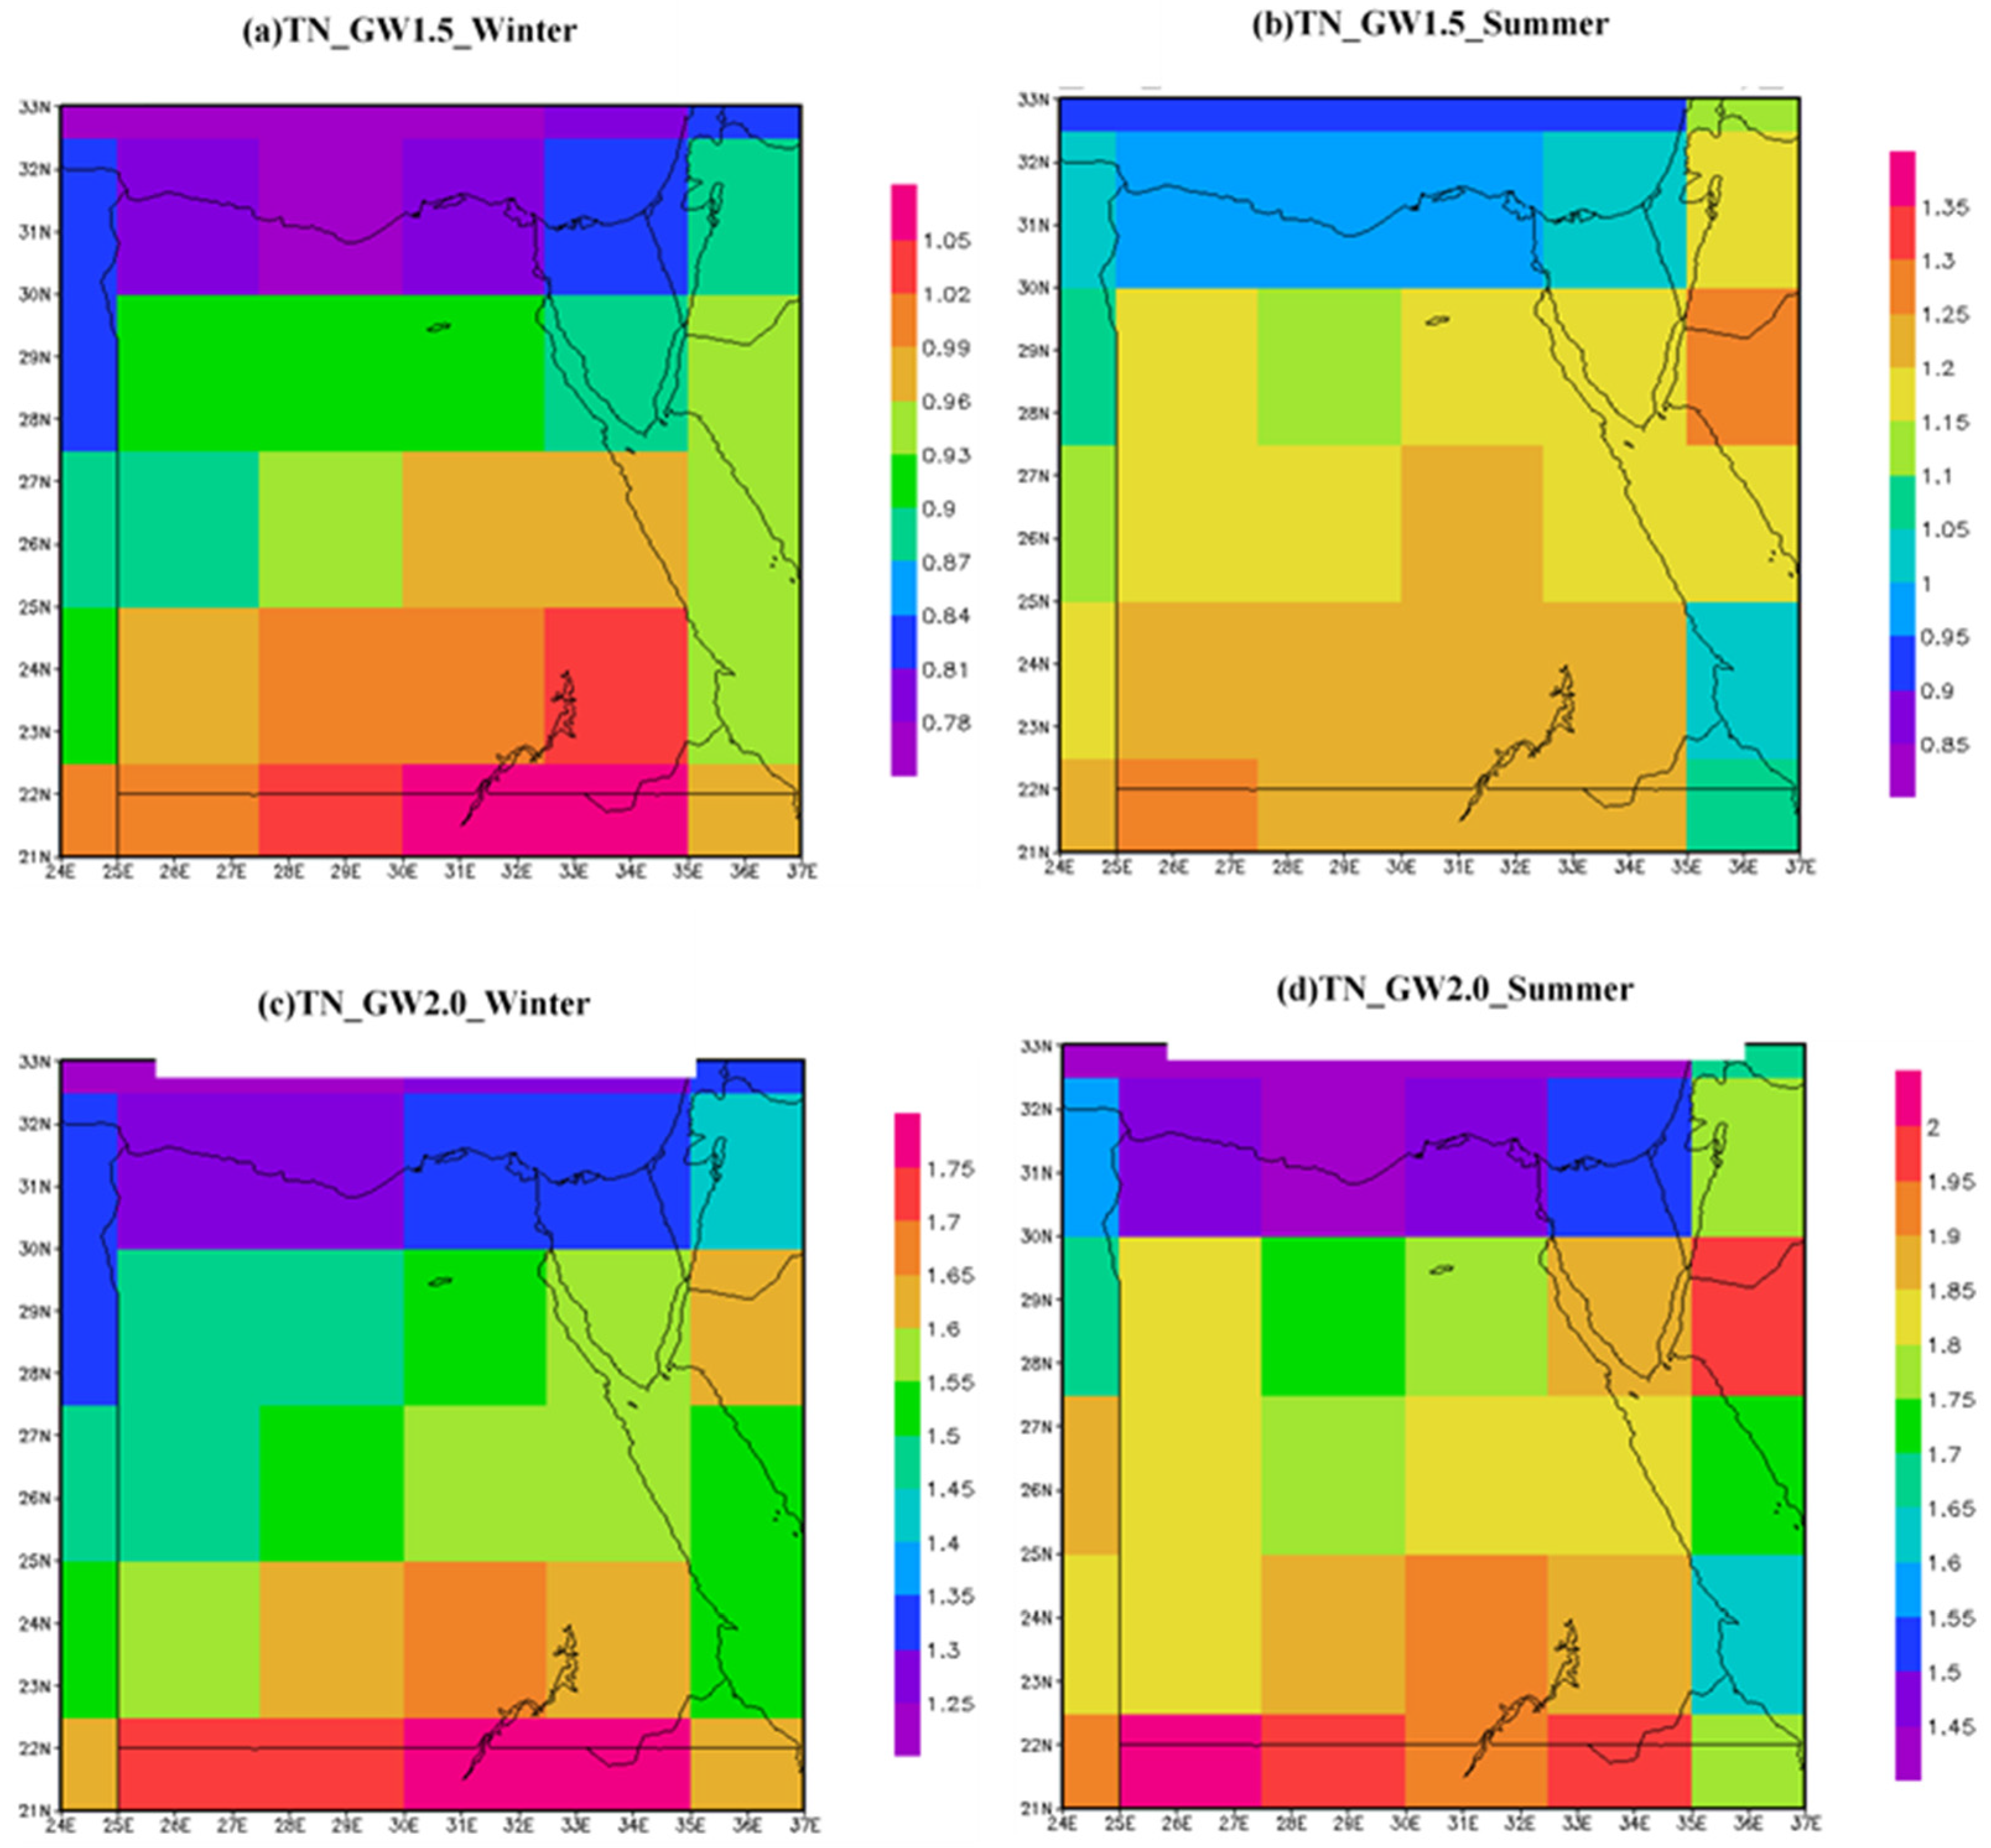
Figure 3 shows the absolute change in average seasonal maximum temperature un-der GW1.5 (2020–2039) and GW2.0 (2040–2059) from 1986–2005 baseline climate averaged over CMIP5 models. A general increase in maximum temperature for both seasons under the two warming levels. During the winter season (Figure 3a,c), the projected maximum temperature increases over Egypt are around 0.75–1.02 °C and 1.2–1.7 °C due to GW1.5 and GW2.0 respectively. For the summer season (Figure 3b,d), the change ranged between 0.8–1.35 °C and 1.4–2.0 °C corresponding to GW1.5 and GW2.0 individually. Figure 4, describes the projected seasonal minimum temperature in Egypt under GW1.5 and GW2.0. A gradual increase of minimum temperature from north to south, where the area of Upper Egypt was examined and an increase of seasonal minimum temperature up to 2 °C under GW2.0 was found, while at the Delta region to the north expected to have an increase of about 0.7–1.0 °C and 1.3–1.5 °C under GW1.5 and GW2.0, respectively.
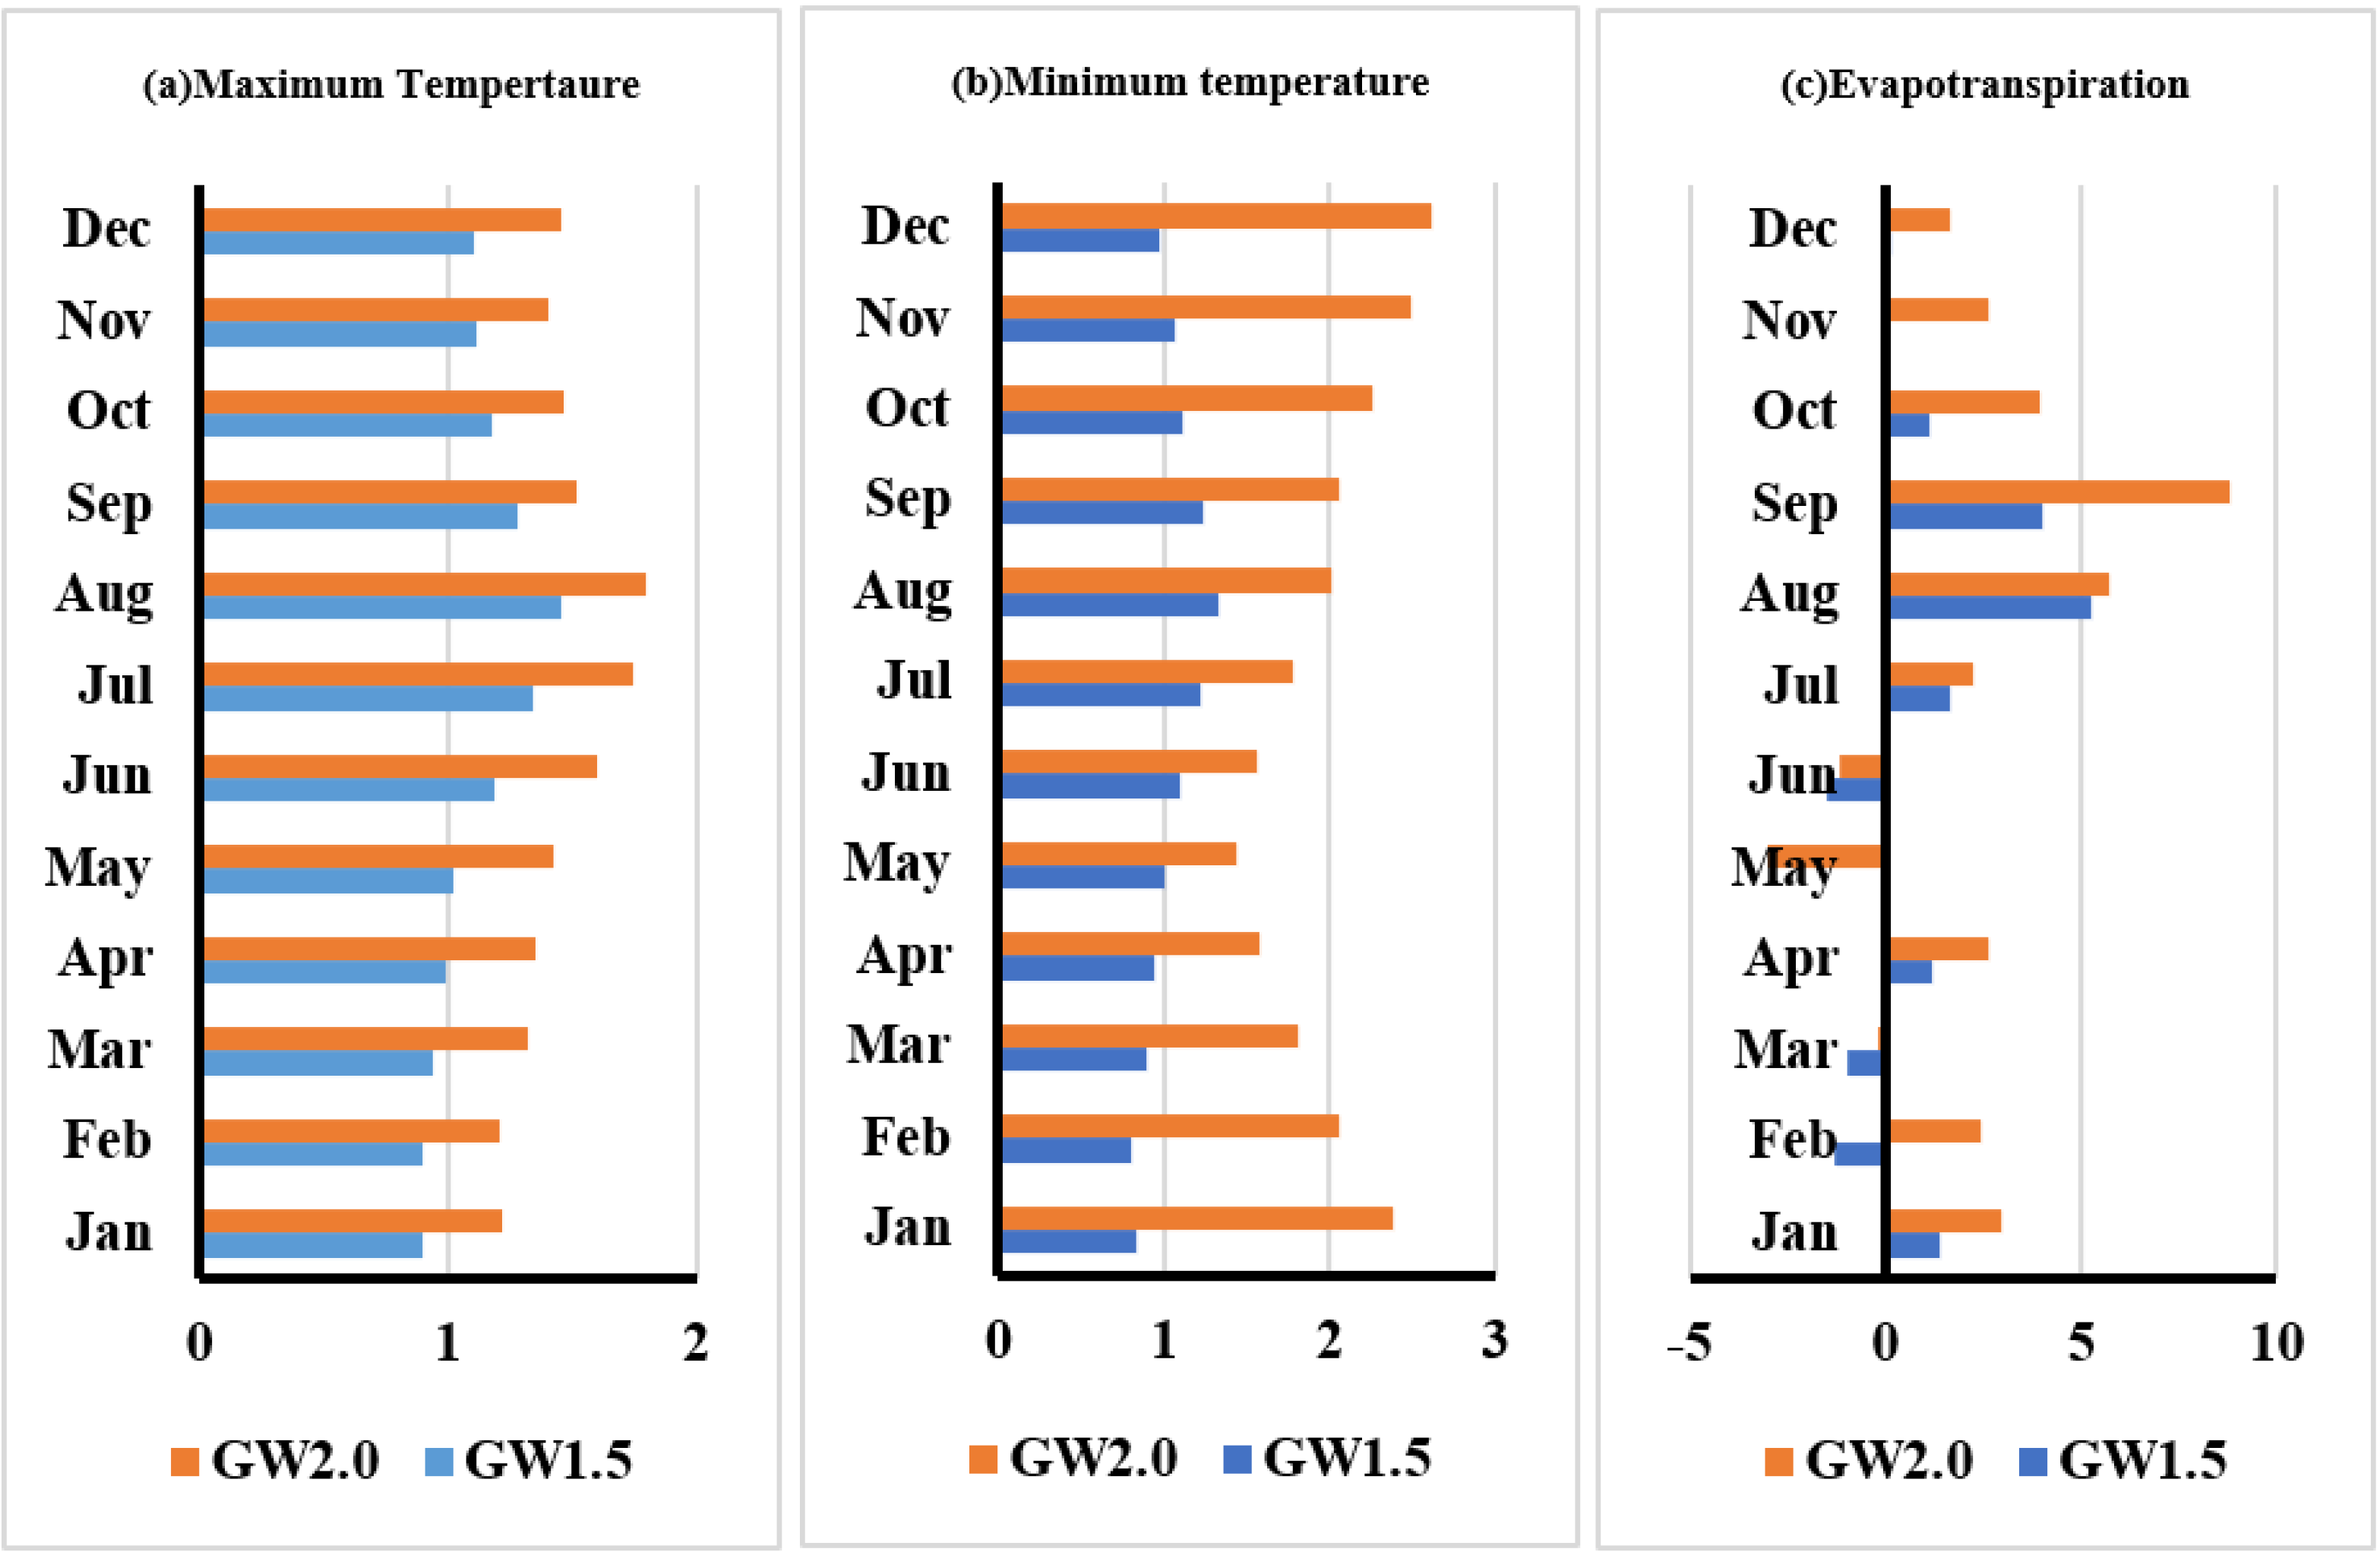
The historical and future CMIP5 dataset for minimum and maximum temperature and evapotranspiration was used to assess the area average climate change under GW1.5 and GW2.0. The historical period is 1986–2005 and the two upcoming periods of 2020–2039 and 2040–2059 as presented in Figure 5. For all warming levels, there was a systematic rise in maximum and minimum temperatures ranging from 1 °C (GW1.5 by 2039) to 2 °C (GW2.0 by 2050) (Figure 5a,b). The higher increase is reasonably detected for the second period (2040–2059) and GW2.0. For instance, the average difference between the maximum temperature and observed values during January and February was 0.9 °C (1.2 °C), whereas this difference for August was 1.46 °C (1.8 °C) under GW1.5 2039 (GW2.0 2059). In the case of GW1.5, minimum temperature and observed values during January-February was 0.8 °C, while this difference for August was only 1.3 °C. Under GW2.0, the minimum temperature difference with the referenced values during May was 1.4 °C, while this difference for December is 2.6 °C. This increased temperature will also disturb reference evapotranspiration (ET). In this study, monthly ET (Figure 5c), was expected to increase by 0.14% (1.66%) in December and up to 5.28% in August under GW1.5 and in September by 8.83% under (GW2.0). There was a drop in ET around 1.3%, 0.94%, 0.12%, 1.48%, and 0.03% in February, March, May, June, and November respectively under GW1.5 level, whereas under GW2.0, the decrease in (ET) was just in March (0.17%), May (2.97%) and June (1.17%).
3.2. Wheat Production under GW1.5 and GW2.0
The wheat crop favors a moderately cool temperature, so the growth and yield could be influenced by climate variations. Consequently, the susceptibility of wheat production in the future has become of main concern, as some zones could experience a rise in yield while other areas could experience a reduction in yield [24,25].
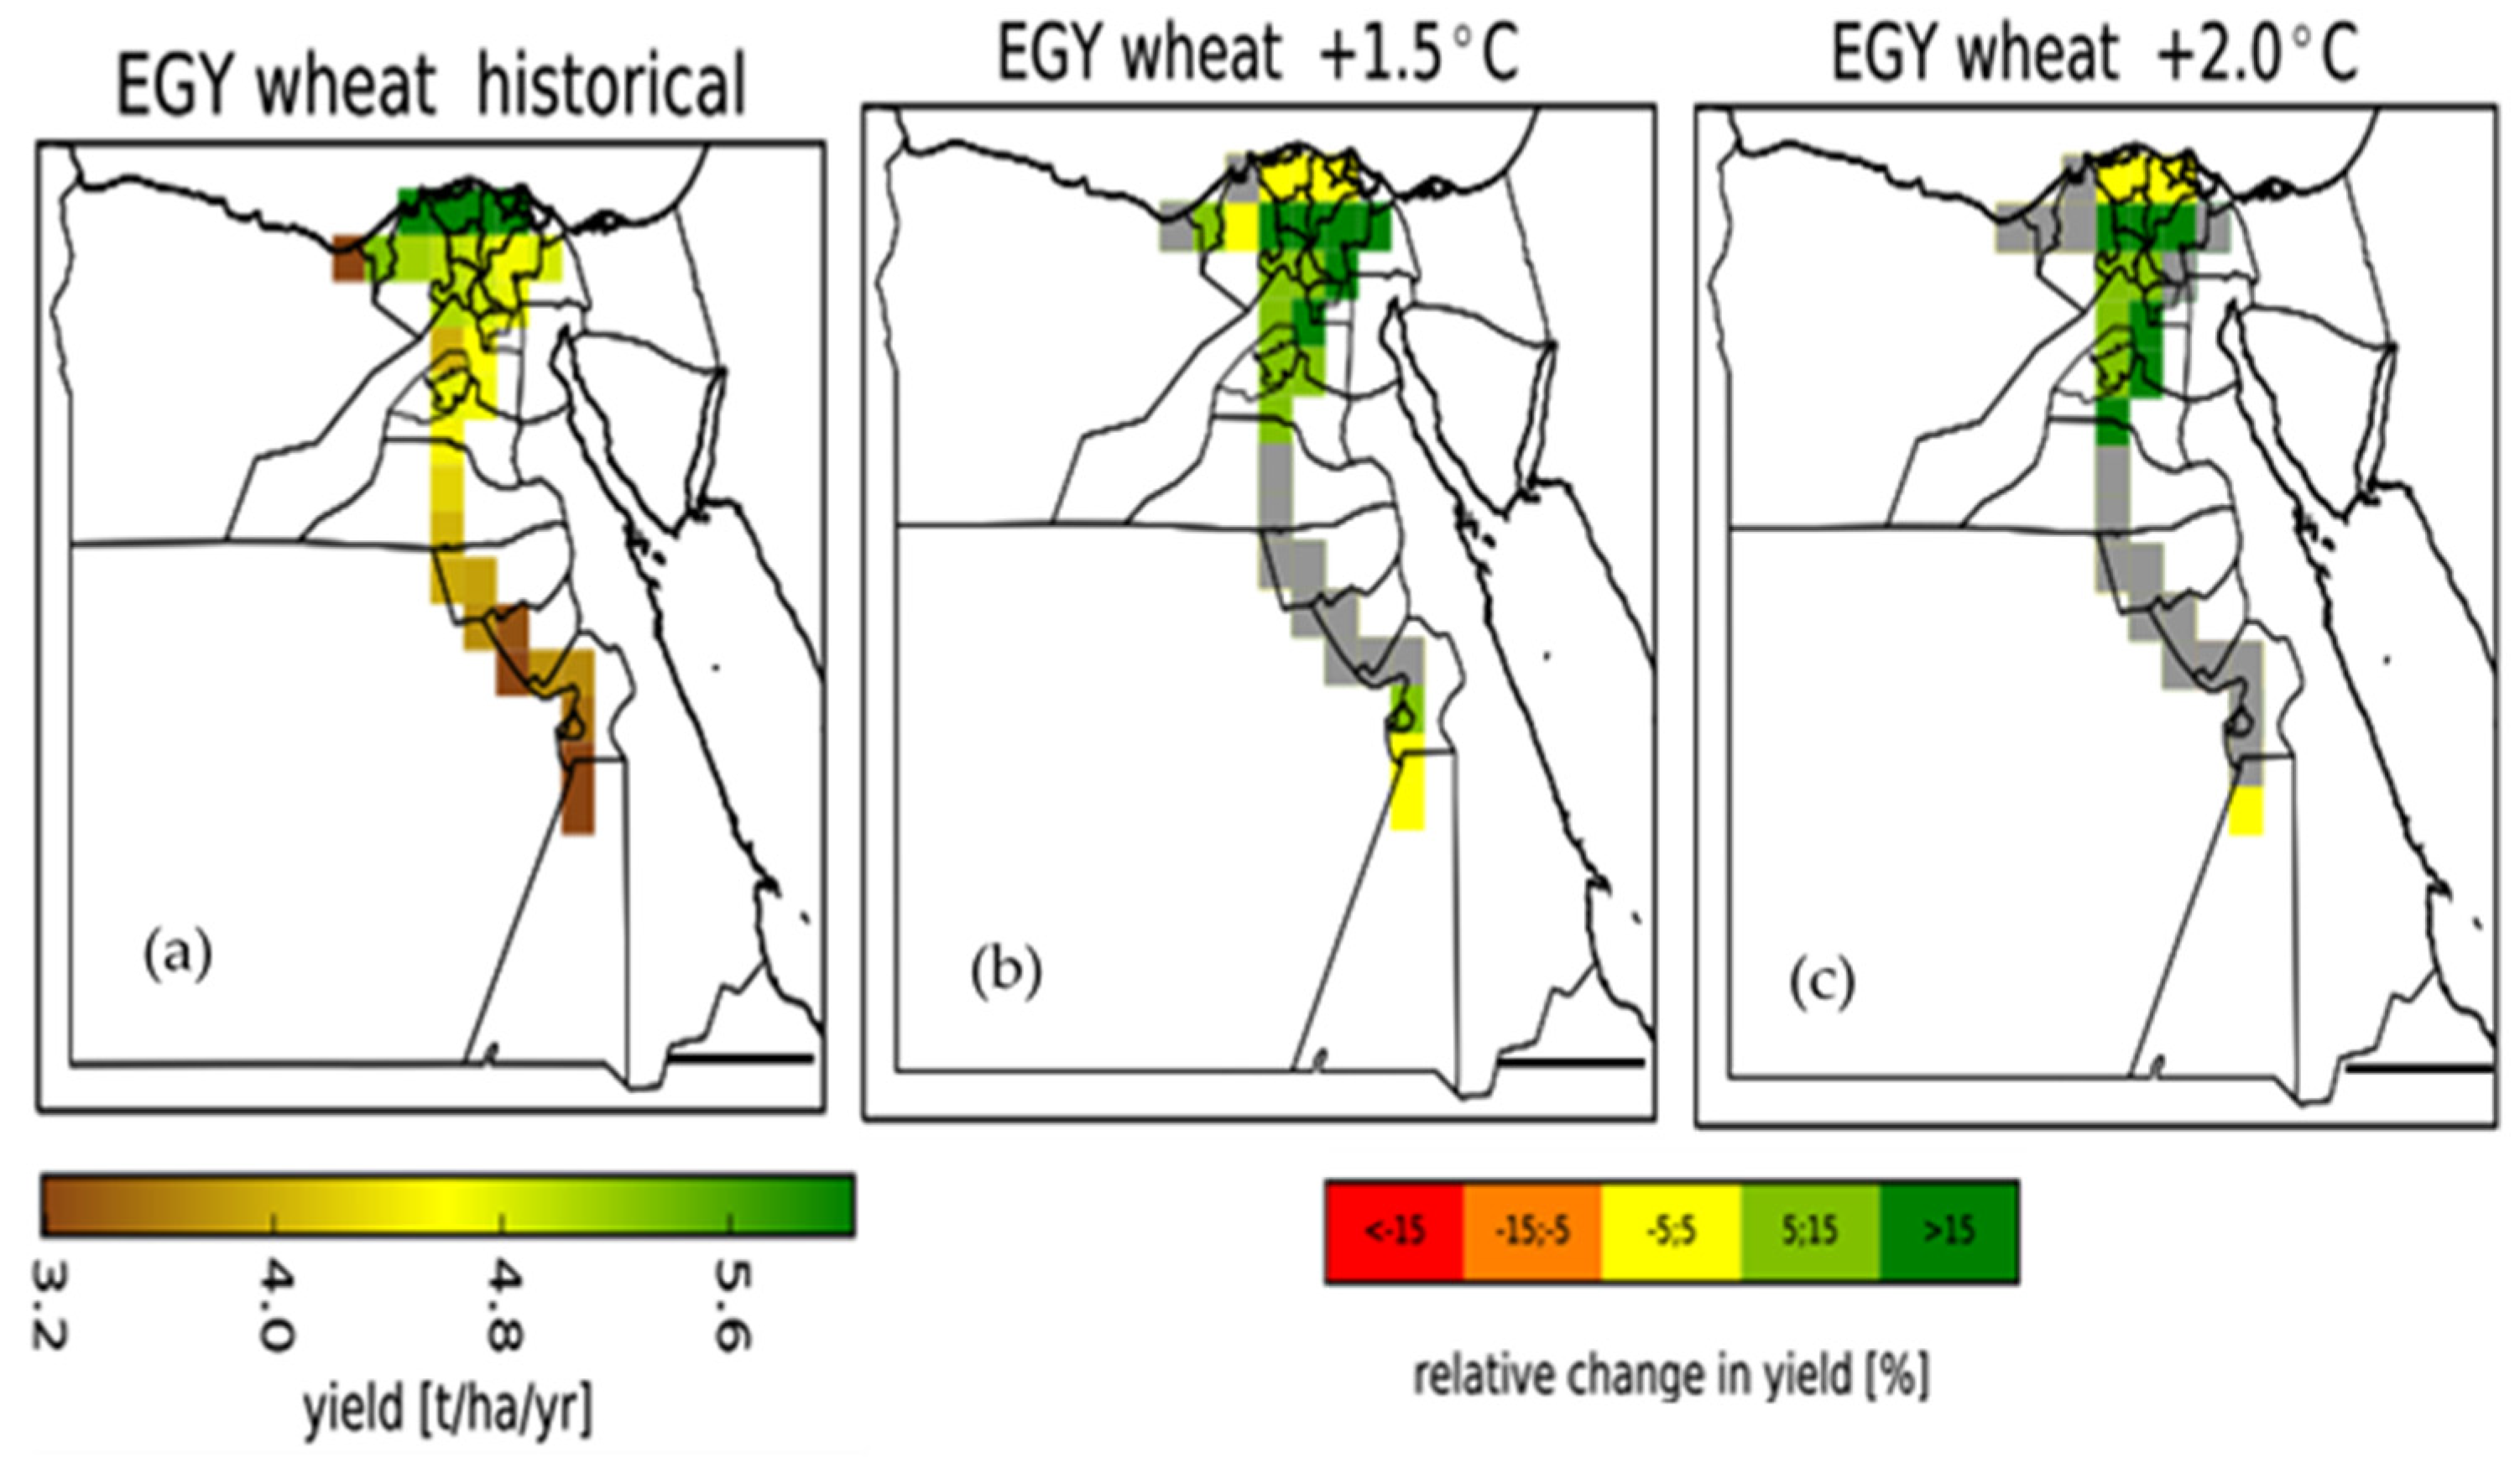
Figure 6a describes the Fast-Track ISI-MIP simulations for historical wheat yield in the average of the year 2000 and the relative change at 1.5 °C and 2.0 °C warming levels. As shown in Figure 6a, the highest wheat production was found in Lower Egypt followed by Middle and Upper Egypt [76]. The negative impacts of climate change on wheat yield inclined to increase from the northeast to the southwest of the study area.
Under GW1.5 (Figure 6b), there was an increase in relative change of wheat production (more than 15.0%) in Lower Egypt especially to the east at governorates Gharbia, Sharqia, and south of Dakahlia. There was a small reduction (−5.0 to 5.0%) in the north of the Delta region at Beheira, Kafr El-Sheikh, and Dakahlia governorates. An increase of about 5.0 to 15.0% in wheat production in Alexandria, Cairo, Monufia, Giza, Qalyubia, and Beni Suef was recorded. The wheat potential yield for the Upper Egypt zone exhibited large inter-model dissimilarities, owing to great uncertainties among different ISI-MIP projections, except at Qena and Luxor, there was an increase of about 5.0 to 15.0% and a small change of about −5.0 to 5.0%, respectively.
Under the GW2.0 level (Figure 6c), the risk of high temperature expands on many zones from north to south Egypt which has negative impacts on wheat production. There was an increase (more than 15.0%) in Gharbia, Sharqia, and south of Dakahlia also Cairo and Beni Suef. A positive change ranged between 5.0 and 15.0% in Monufia, Qalyubia, and Giza, where there was a general reduction in the rest of the cultivated areas.
Table 4 presented the change in national average year%, in the year 2000. For wheat yield, an average growth of about 5% with the range of (0–9.0%) for GW1.5 and (−3.0 to 14.0%) for GW2.0 level. The data listed in Table 4 is accessed through (http://regiocrop.climateanalytics.org/choices, accessed on 23 October 2021).
The increase of the wheat production in the Lower Egypt area, due to the fertilizer effect and high CO2 concentration that result in improvement in crop photosynthesis [77], also the temperature increases of winter and spring seasons diminish frost damage [78], which would amend the climate change impressions on wheat growth and yield.
The reduction of wheat production especially under the GW2.0 level corresponds to the increased air temperature that frequently reduced wheat growth period, and bore the rates of respiration, photosynthesis, and grain filling [79]. Extreme temperatures can significantly destruct crops’ cellular structure and hinder their capability to reproduce [80].
3.3. Maize Production under GW1.5 and GW2.0
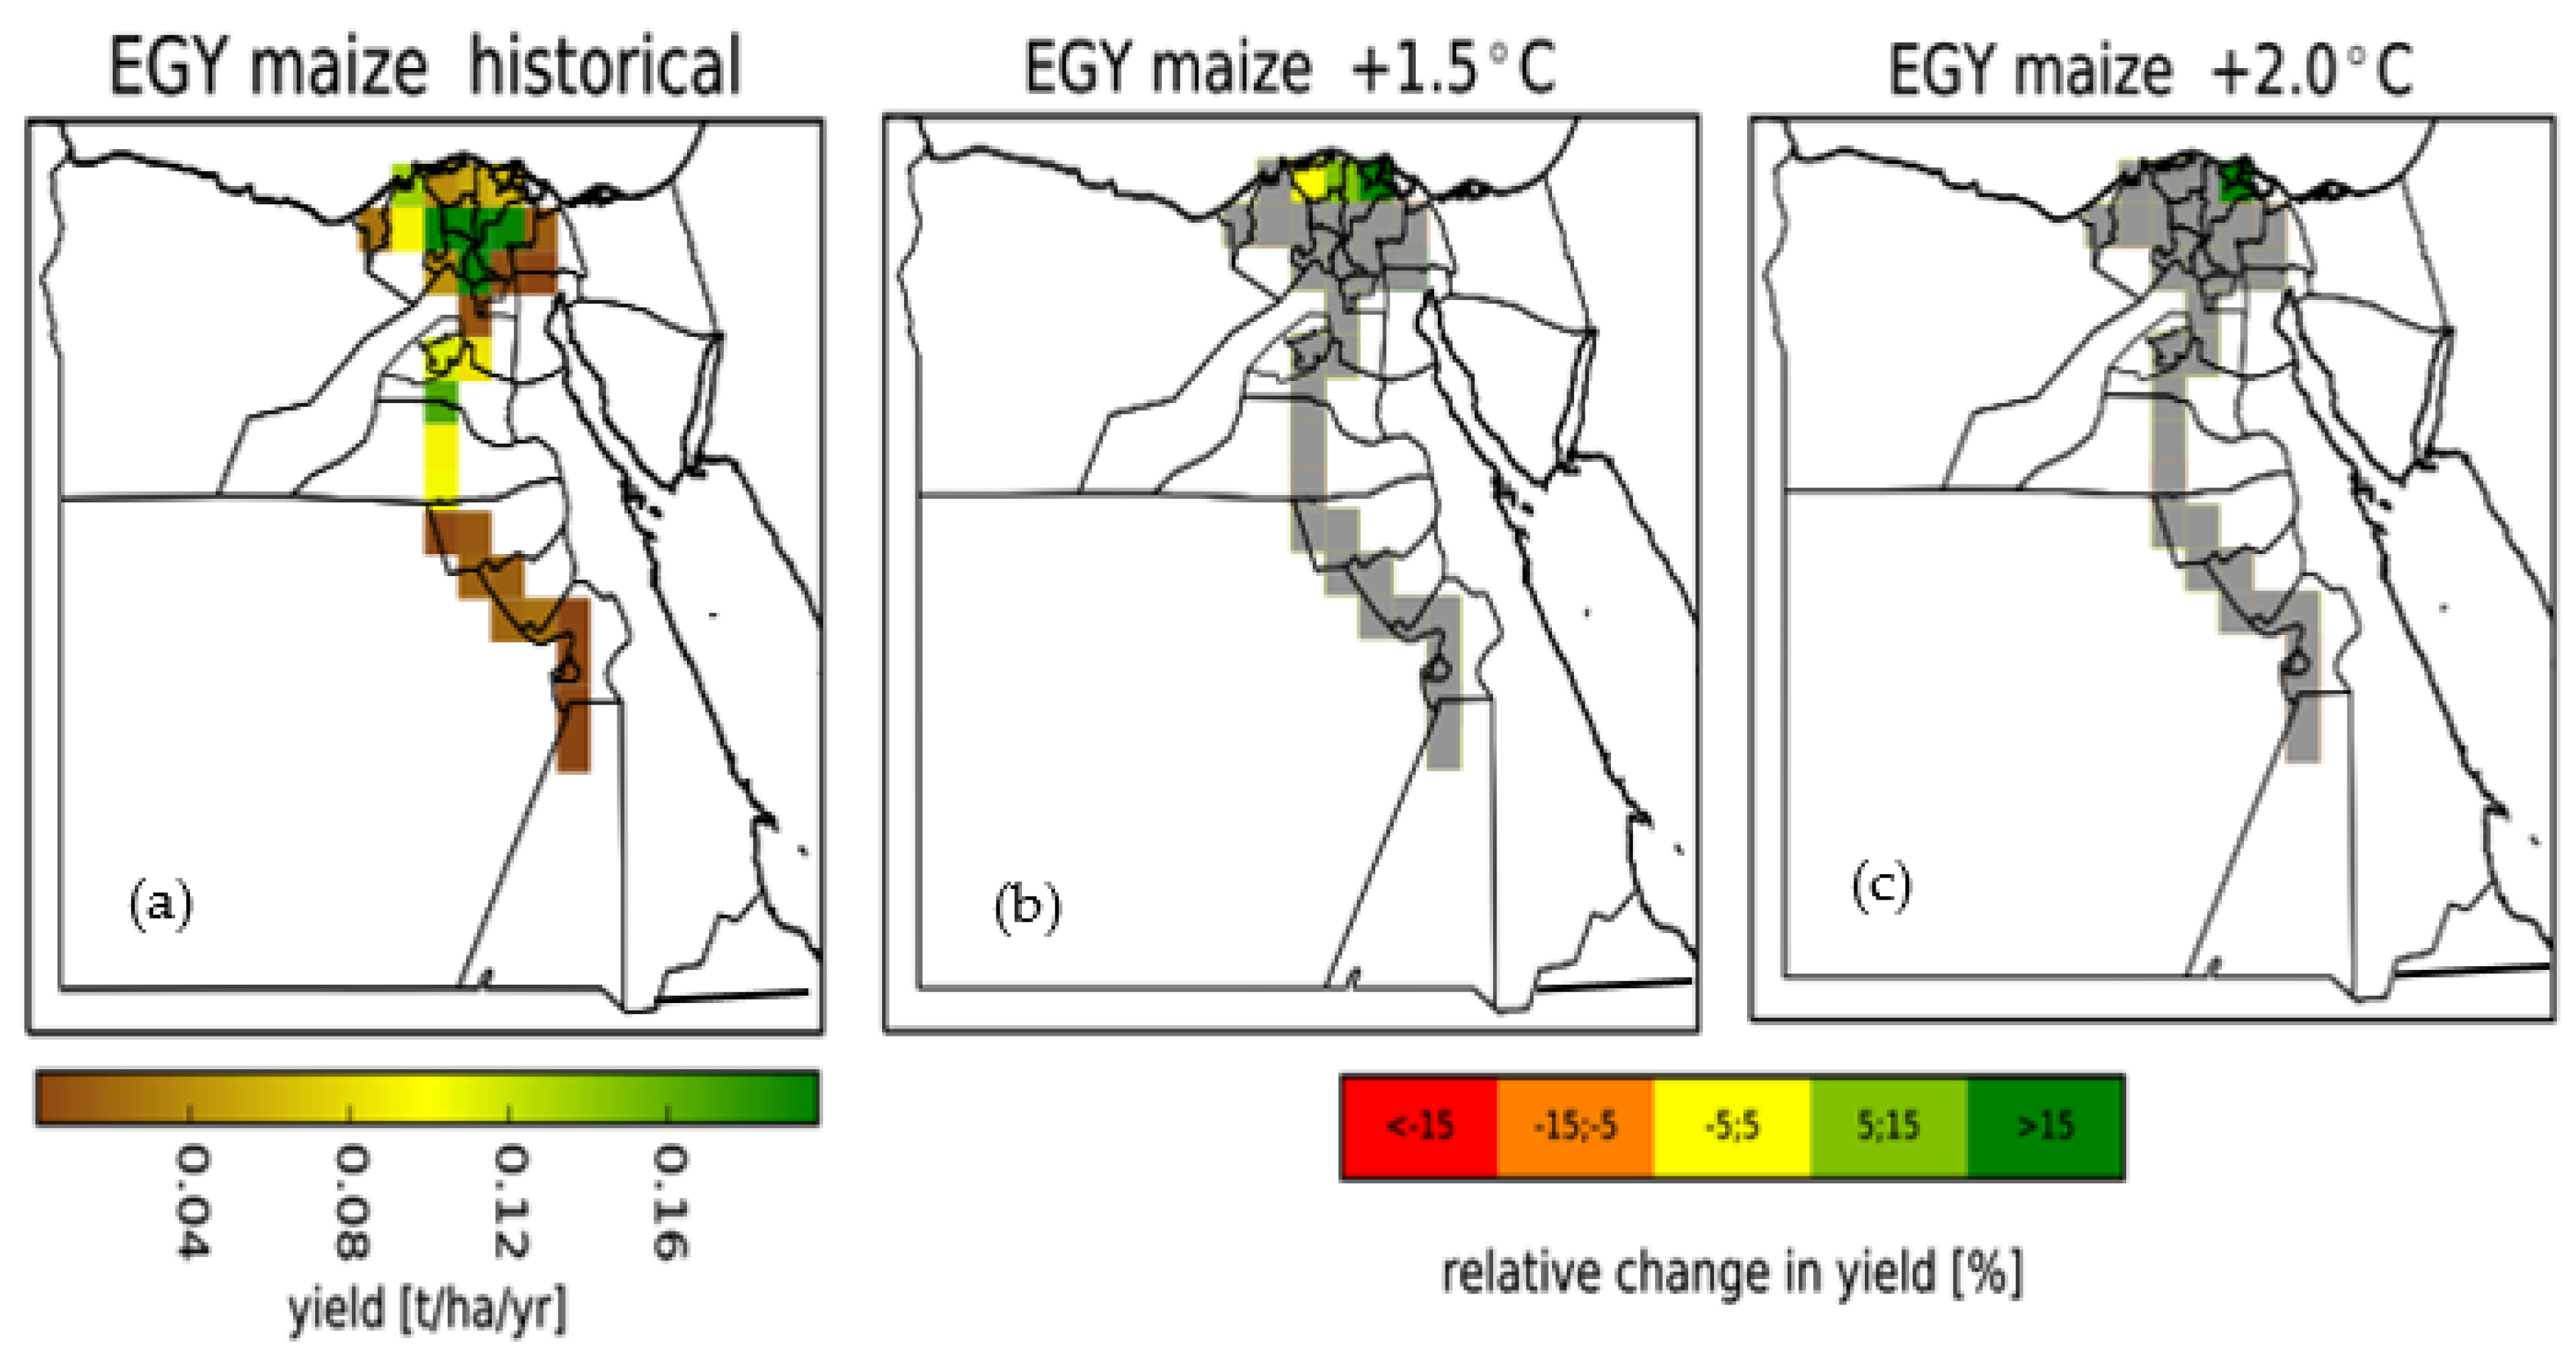
Figure 7a presented the spatial distribution of maize yield across Egypt, where the highest (lowest) percentage of maize production existed in Lower Egypt (Upper Egypt) [76]. Under GW1.5 (Figure 7b), the yield in the northeast of the Delta increased at Dakahlia and Kafr El-Sheikh governorates by (5.0 to 15.0%). Small change about (−5.0 to 5.0%) respectively due to the elevation of temperature and CO2. This increase in maize in the north-eastern Delta, mainly from the rise of minimum temperature, which beneficial to germination and seedling growth, and a higher minimum temperature in September provided more optimal conditions for grain filling and avoided the damage by early frost [81].
The change in maize yield at the national level would be −1.0% (−5.0% to 3.0%) and −4.0% (−8.0% to 2.0%) under GW1.5 and GW2.0 respectively. Similar results found in many regions globally, in the United States, by 18–33% under RCP4.5 and by 33–46% under RCP8.5 observed in southwestern Kansas [82]; in range of 19% to 37% in Alabama [83]; whereas, Central Great Plain examined a decline up to 21% [84], also in Africa, the increasing temperature and diminishing rainfall had a negative influence on maize yield production [85,86,87].
This reduction in maize yield might be due to the negative impacts of the relatively higher temperatures [84,88,89]. The rise in temperatures reduced the crop maturity period, which resulted in significant yield declines [84,85,86,87,88,89,90].
A reduced maturity period could decrease the time length of the crop to capture more solar radiation and assimilate CO2 [84,85,86,87,88,89,90,91], which then lessen the accretion of biomass and yield. Also, the high temperatures and low water availability affect photosynthesis which in turn contributed to yield reduction [84,85,86,87,88].
Furthermore, various studies displayed those high temperatures at the time of flowering could decrease pollen viability [92], cause kernel abortion [93], and decrease the number of seeds or number of kernels [93,94].
Matched with GW1.5, the maize yield drop risk in Egypt is inclined to increase under GW2.0. This outcome indicated that keeping global warming lower than 1.5 °C would be more valuable for agriculture production. The reasons for the reduction of maize yield in the future, due to the disclosure to overhead optimum temperature threshold [95], which reduce pollen feasibility [91], and might also link to the lessening of kernel set [95], which diminish the number of kernels or number of seeds [93].
4. Discussion
In addition to the substantial warming trend, increasing air temperature tends to raise evapotranspiration and contribute to drought situations [77], signifying extra severe impacts of drought risks caused by climate change with the biggest influence in Upper Egypt than the Delta and the Lower Egypt regions, results in a reduction in the yields.
Compared with the reference period (the 2000s), the average wheat yield increased under GW1.5 and GW2.0, especially in Lower Egypt, but its magnitude was lower under the GW2.0 level.
The increase in wheat yield under GW1.5 by 5.0% (0% to 9.0%) could be explained, by the warmer temperatures accompanied by greater amounts of solar radiation improving the photosynthesis process [78]. Similar results were found, in In Australia, where climate warming could benefit for the cold wheat-growing areas [96]; in Chitral district (Pakistan), an expected increase by 14% and 23% [97]; 1% in wheat yields in North Kazakhstan and Akmola districts (Kazakhstan) [98].
The reduction in wheat yield under the GW2.0 level can be linked to the rise of temperatures above the optimum threshold value. This increase led to a drop in water usage due to the intensification in evapotranspiration [99]. This percentage of reduction in wheat yield is higher in Upper Egypt, which is characterized by the warm climate than in Lower Egypt. Similar results of reduction in yield were found in the warm growing zone in Australia [96], India [100,101], and in Europe’s eastern Mediterranean coastal areas [102].
There is a general reduction of maize in Egypt under both GW1.5 and GW2.0 and, explained by the water stress which, will be more severe because the coupling of higher temperatures and radiation will rise evapotranspiration by disturbing saturated vapor pressure deficit [103].
Maize crops are exaggerated by drought, during the phase of productivity, water lack can also consequence in the inhibition of photosynthesis, hence also dropping the nutrient quantity [104]. Additionally, compact soil moisture accessibility can advance increase the probability of heat stress [105].
The increase in CO2 will encourage photosynthesis in plants such as wheat, but in yields as maize, photosynthesis gets saturated and does not improve with any further increase in CO2 concentrations [106,107].
The higher temperatures in the future would increase crop transpiration and soil evaporation [105,108] and shorten the crop growth cycle [23], which finally leads to a decline in crop production.
It was clear that the influences of temperature increase were completely different and were dependent on plant category and site. These alterations in the sensitivity of the crops to climate deviations, due to the definite temperature thresholds of each crop, can distress diurnal production and tolerance to temperature excesses [92].
5. Conclusions
This study analyzed the spatial variation and changes of wheat and maize production in Egypt under GW1.5 and GW2.0 and further discussed the causes of these changes. Compared with the reference year 2000, the average wheat yield increased under GW1.5 and GW2.0, but its magnitude was lower under GW2.0. The maize yield will decrease under both two warming levels. Additionally, the magnitude of evapotranspiration increase will be greater in GW2.0 than in GW1.5. Spatially, the distributional range of yield reduction of maize extended from Upper Egypt to the rest of the planting areas in the Delta when the temperature rose from 1.5 °C to 2.0 °C. The results show that Upper Egypt is projected to become a high-risk region for maize and wheat yield reduction in the warmer future. The urgency of adaptation measures ought to be applied herein in response to global warming. Our findings showed that warming had both positive and negative effects on wheat and maize yields. These results indicated that limiting global warming to 1.5 °C would be more beneficial for agriculture production, thus making it easier to attain the United Nations Sustainable Development Goals.
Therefore, Adaptation approaches, containing shifting sowing time, breeding new cultivars with better heat resistance, and regulating wheat planting zone [109,110,111,112] have been suggested to better deal with climate changes. Region-definite adaptation policies should be provided according to the climate and production scenarios in different sub-regions. For instance, wheat and maize production were projected to be affected more in the Upper Egypt region than the northern Lower Egypt regions. Additionally, improved farm practices, such as soil conservation and fertilizer management, form chief adaptation plans [113]. Adaptation strategies ought to improve the total farming/cropping systems, which might contain increasing crop intensities and planting various types of crops [113,114].
Author Contributions
Conceptualization, methodology, investigation, writing—original draft preparation, G.G.; Preparation, methodology, M.S. (Magdy Samak); writing—review and editing, supervision, M.S. (Mohamed Shahba). All authors have read and agreed to the published version of the manuscript.
Funding
This research received no external funding.
Data Availability Statement
These ISI-MIP predictions are worked out from the ISIMIP Fast-Track archive based on six global gridded crop models driven by five global climate models from CMIP5 were obtained throughout http://regiocrop.climateanalytics.org/choices (accessed on 23 October 2021).
Acknowledgments
We acknowledge the Inter-Sectoral Impact Model Intercomparison Project (ISIMIP, www.isimip.org, accessed on 23 October 2021), and CMIP5 institution for the availability of data, also we acknowledge the RegioCrop tool team to make their simulations for crops available through http://regiocrop.climateanalytics.org/choices, accessed on 23 October 2021.
Conflicts of Interest
The authors declare no conflict of interest.
References
- Houghton, J.T. Climate change 2001: The scientific basis. Neth. J. Geosci. 2001, 87, 197–199. [Google Scholar]
- IPCC. Contribution of Working Group I to the Fifth Assessment Report of the Intergovernmental Panel on Climate Change; Cambridge University Press: Cambridge, UK; New York, NY, USA, 2013. [Google Scholar]
- IPCC. Climate change 2014: Impacts, adaptation, and vulnerability. Part B: Regional aspects. In Contribution of Working Group II to the Fifth Assessment Report of the Intergovernmental Panel on Climate Change; Cambridge University Press: Cambridge, UK; New York, NY, USA, 2014; p. 688. [Google Scholar]
- IPCC. Global warming of 1.5 °C. In An IPCC Special Report on the Impacts of Global Warming of 1.5 °C above Pre-Industrial Levels and Related Global Greenhouse Gas Emission Pathways. In The Context of Strengthening the Global Response to the Threat of Climate Change, Sustainable Development, and Efforts to Eradicate Poverty; Masson-Delmotte, V., Zhai, P., Pörtner, H.O., Roberts, D., Skea, J., Shukla, P.R., Pirani, A., Moufouma-Okia, W., Péan, C., Pidcock, R., et al., Eds.; World Meteorological Organization: Geneva, Switzerland, 2019. [Google Scholar]
- Howden, S.M.; Soussana, J.F.; Tubiello, F.N.; Chhetri, N.; Dunlop, M.; Meinke, H. Climate change and food security special feature: Adapting agriculture to climate change. Proc. Natl. Acad. Sci. USA 2007, 104, 19691–19696. [Google Scholar] [CrossRef] [Green Version]
- Tao, F.; Yokozawa, M.; Liu, J.Y.; Zhang, Z. Climate-crop yield relationships at provincial scales in China and the impacts of recent climate trends. Clim. Res. 2008, 38, 83–94. [Google Scholar] [CrossRef]
- Fanzo, J.; Davis, C.; McLaren, R.; Choufani, J. The effect of climate change across food systems: Implications for nutrition outcomes. Glob. Food Secur. 2018, 18, 12–19. [Google Scholar] [CrossRef]
- Gay, C.; Estrada, F.; Conde, C.; Eakin, H.; Villers, L. Potential impacts of climate change on agriculture: A case of study of coffee production in Veracruz, Mexico. Clim. Chang. 2006, 79, 259–288. [Google Scholar] [CrossRef]
- Schmidhuber, J.; Tubiello, F.N. Global food security under climate change. Proc. Natl. Acad. Sci. USA 2007, 104, 19703–19708. [Google Scholar] [CrossRef] [Green Version]
- Lobell, D.B.; Schlenker, W.; Costa-Roberts, J. Climate trends and global crop production since 1980. Science 2011, 333, 616–620. [Google Scholar] [CrossRef] [Green Version]
- Trnka, M.; Rötter, R.P.; Ruiz-Ramos, M.; Kersebaum, K.C.; Olesen, J.E.; Žalud, Z.; Semenov, M.A. Adverse weather conditions for European wheat production will become more frequent with climate change. Nat. Clim. Chang. 2014, 4, 637–643. [Google Scholar] [CrossRef]
- Powell, J.P.; Reinhard, S. Measuring the effects of extreme weather events on yields. Weather Clim. Extrem. 2015, 12, 69–79. [Google Scholar] [CrossRef] [Green Version]
- Lesk, C.; Rowhani, P.; Ramankutty, N. Influence of extreme weather disasters on global crop production. Nature 2016, 529, 84–87. [Google Scholar] [CrossRef]
- Cox, P.M.; Huntingford, C.; Williamson, M.S. Emergent constraint on equilibrium climate sensitivity from global temperature variability. Nature 2018, 553, 319–322. [Google Scholar] [CrossRef]
- Rosegrant, M.W.; Zhu, T.; Msangi, S.; Sulser, T. Global scenarios for biofuels: Impacts and implications. Rev. Agric. Econ. 2008, 30, 495–505. [Google Scholar] [CrossRef]
- UNFCCC. Adoption of the Paris Agreement; UNFCCC: New York, NY, USA, 2015. [Google Scholar]
- Rogelj, J.; Den Elzen, M.; Höhne, N.; Fransen, T.; Fekete, H.; Winkler, H.; Schaeffer, R.; Sha, F.; Riahi, K.; Meinshausen, M. Paris Agreement climate proposals need a boost to keep warming well below 2 °C. Nature 2016, 534, 631–639. [Google Scholar] [CrossRef] [PubMed] [Green Version]
- Seneviratne, S.I.; Rogelj, J.; Séférian, R.; Wartenburger, R.; Allen, M.R.; Cain, M.; Millar, R.J.; Ebi, K.L.; Ellis, N.; Hoegh-Guldberg, O. The many possible climates from the Paris Agreement’s aim of 1.5 °C warming. Nature 2018, 558, 41–49. [Google Scholar] [CrossRef] [PubMed]
- FAO. World Food and Agriculture—Statistical Yearbook 2020; FAO: Rome, Italy, 2020. [Google Scholar]
- Sharma, I.; Tyagi, B.S.; Singh, G.; Venkatesh, K.; Gupta, O.P. Enhancing wheat production—A global perspective. Indian J. Agric. Sci. 2015, 85, 3–13. [Google Scholar]
- Tao, F.; Zhang, Z. Climate change, wheat productivity and water use in the North China Plain: A new super-ensemble-based probabilistic projection. Agric. For. Meteorol. 2013, 170, 146–165. [Google Scholar] [CrossRef]
- Asseng, S.; Foster, I.; Turner, N.C. The impact of temperature variability on wheat yields. Glob. Chang. Biol. 2011, 17, 997–1012. [Google Scholar] [CrossRef]
- Asseng, S.; Ewert, F.; Martre, P.; Rotter, R.P.; Lobell, D.B.; Cammarano, D.; Kimball, B.A.; Ottman, M.J.; Wall, G.W.; White, J.W.; et al. Rising temperatures reduce global wheat production. Nat. Clim. Chang. 2015, 5, 143–147. [Google Scholar] [CrossRef]
- Kristensten, K.; Schelde, K.; Olesen, J.E. Winter wheat yield response to climate variability in Denmark. J. Agric. Sci. 2011, 149, 33–47. [Google Scholar] [CrossRef]
- Olesen, J.E.; Trnka, M.; Kersebaum, K.C.; Skjelvag, A.; Seguin, B.; Peltonen-Sainio, P.; Rossi, F.; Kozyra, J.; Micale, F. Impacts and adaptation of European crop production systems to climate change. Eur. J. Agron. 2011, 34, 96–112. [Google Scholar] [CrossRef]
- Metz, H.C. Egypt: A Country Study; GPO for the Library of Congress: Washington, DC, USA, 1990; Available online: http://countrystudies.us/egypt/ (accessed on 23 October 2021).
- Aegic (2015) Global Grain Market. Series: Egypt; Australian Export Grain Innovation Center: North Ryde, Australia, 2015.
- Zohry, A.E.-H.; Ouda, S. Wheat Insufficiency and Deficit Irrigation. In Deficit Irrigation; Springer: Cham, Switzerland, 2020. [Google Scholar] [CrossRef]
- Asseng, S.; Cammarano, D.; Basso, B.; Chung, U.; Alderman, P.D.; Sonder, K.; Reynolds, M.; Lobell, D.B. Hot spots of wheat yield decline with rising temperatures. Glob. Chang. Biol. 2017, 23, 2464–2472. [Google Scholar] [CrossRef]
- Grassini, P.; Yang, H.; Rattalino Edreira, J.I.; Rizzo, G. Hindsight of 2016 Corn Yield Forecasts by the Yield Forecasting Center. CropWatch, 2017. Available online: https://cropwatch.unl.edu/2017/hindsight-review-2016-corn-yield-forecasts-yield-forecasting-center (accessed on 23 October 2021).
- Eid, H.M.; El-Marsafawy, S.M.; Ainer, N.G.; El-Mowelhi, N.M.; El-Kholi, O. Vulnerability and adaptation to climate change in wheat crop. In Proceedings of the Meteorology & Environmental Cases Conference, Cairo, Egypt, 2–6 March 1997. [Google Scholar]
- Hassanein, M.K. Climate Change Risk Management in Egypt, Food Security FAO Project UNJP/EGY022 Report Number 6.1.2.1; Springer: Berlin/Heidelberg, Germany, 2010; p. 92. [Google Scholar]
- Hassanien, M.K.; Medany, M.A. The impact of climate change on production of Maize (Zea mays L.). In Proceedings of the International Conference on “Climate Change and Their Impacts on Costal Zones and River Deltas”, Alexandria, Egypt, 23–25 April 2007. [Google Scholar]
- IPCC. The Third Assessment Report (TAR): Climate Change 2001. The Scientific Basis; Cambridge University Press: Cambridge, UK; New York, NY, USA, 2001. [Google Scholar]
- Morsy, M. Use of Regional Climate and Crop Simulation Models to Predict Wheat and Maize Productivity and Their Adaptation under Climate Change. Ph.D. Thesis, Faculty of Science Al-Azhar University, Cairo, Egypt, 2015. [Google Scholar]
- Rötter, R.P.; Hoffmann, M.P.; Koch, M.; Müller, C. Progress in modelling agricultural impacts of and adaptations to climate change. Curr. Opin. Plant Biol. 2018, 45, 255–261. [Google Scholar] [CrossRef] [PubMed]
- Rosenzweig, C.; Elliott, J.; Deryng, D.; Ruane, A.C.; Müller, C.; Arneth, A.; Boote, K.J.; Folberth, C.; Glotter, M.; Khabarov, N.; et al. Assessing agricultural risks of climate change in the 21st century in a global gridded crop model intercomparison. Proc. Natl. Acad. Sci. USA 2014, 111, 3268–3273. [Google Scholar] [CrossRef] [PubMed] [Green Version]
- Qian, B.; Zhang, X.; Smith, W.; Grant, B.; Jing, Q.; Cannon, A.J.; Neilsen, D.; McConkey, B.; Li, G.; Bonsal, B.; et al. Climate change impacts on Canadian yields of spring wheat, canola and maize for global warming levels of 1.5 °C, 2.0 °C, 2.5 °C and 3.0 °C. Environ. Res. Lett. 2019, 14, 074005. [Google Scholar] [CrossRef]
- Warszawski, L.; Frieler, K.; Huber, V.; Piontek, F.; Serdeczny, O.; Schewe, J. The inter-sectoral impact model intercomparison project (ISI–MIP): Project framework. Proc. Natl. Acad. Sci. USA 2014, 111, 3228–3232. [Google Scholar] [CrossRef] [PubMed] [Green Version]
- Müller, C.; Elliott, J.; Kelly, D.; Arneth, A.; Balkovic, J.; Ciais, P.; Deryng, D.; Folberth, C.; Hoek, S.; Izaurralde, R.C.; et al. The Global Gridded Crop Model Intercomparison phase 1 simulation dataset. Sci. Data 2019, 6, 1–22. [Google Scholar] [CrossRef]
- Omran, E.S.E. Land and groundwater assessment for agricultural development in the Sinai Peninsula, Egypt. In The Handbook of Environmental Chemistry; Negm, A.M., Ed.; Springer: Berlin/Heidelberg, Germany, 2017. [Google Scholar] [CrossRef]
- Mougou, R.; Abou-Hadid, A.; Iglesias, A.; Medany, M.; Nafti, A.; Chetali, R.; Mansour, M.; Eid, H. Adapting Dryland and Irrigated Cereal Farming to Climate Change in Tunisia and Egypt. In Climate Change and Adaptation; Leary, N., Adejuwon, J., Barros, V., Burton, I., Kulkarni, J., Lasco, R., Eds.; Climate Change and Adaptation; Earthscan: London, UK, 2008. [Google Scholar]
- Attaher, S.M.; Medany, M.A.; El-Gindy, A. Feasibility of some adaptation measures of on-farm irrigation in Egypt under water scarcity conditions. Options Mediterr. 2010, 95, 307–312. [Google Scholar]
- El-Tantawi, A.M.; Anming, B.; Liu, Y.; Gamal, G. An assessment of rainfall variability in northern Egypt. Arab. J. Geosci. 2021, 14, 1203. [Google Scholar] [CrossRef]
- El-Tantawi, A.M.; Bao, A.; Liu, Y.; Gamal, G. Assessment of Meteorological Drought in North-Western Egypt using Rainfall Deciles, Standardized Precipitation Index and Reconnaissance Drought Index. Disaster Adv. 2021, 14, 1–14. Available online: https://scholar.cu.edu.eg/sites/default/files/atia/files/assessment_of_meteorological_drought_in_north-western_egypt.pdf (accessed on 23 October 2021).
- Gamal, G. Future analysis of extreme temperature indices for sinai peninsula-egypt. Imp. J. Interdiscip. Res. 2017, 3, 1960–1966. [Google Scholar]
- Gamal, G. Historical and future extreme temperature indices of Greater Cairo region, Egypt. Bull. Soc. Géogr. d’Egypte 2019, 92, 40–52. [Google Scholar] [CrossRef]
- Ouda, S.; Zohry, A. Cropping pattern to face water scarcity. In Cropping Pattern to Overcome Abiotic Stresses: Water, Salinity and Climate; Springer: Berlin/Heidelberg, Germany, 2018; ISBN 978-3-319-69879-3. [Google Scholar]
- Rosenzweig, C.; Jones, J.W.; Hatfield, J.L.; Ruane, A.C.; Boote, K.J.; Thorburn, P.; Antle, J.M.; Nelson, G.C.; Porter, C.; Janssen, S.; et al. The agricultural model intercomparison and improvement project (AgMIP): Protocols and pilot studies. Agric. For. Meteorol. 2013, 170, 166–182. [Google Scholar] [CrossRef] [Green Version]
- Goderniaux, P.; Brouyere, S.; Blenkinsop, S.; Burton, A.; Fowler, H.J.; Orban, P.; Dassargues, A. Modeling climate change impacts on groundwater resources using transient stochastic climatic scenarios. Water Resour. Res. 2011, 47, W12516. [Google Scholar] [CrossRef] [Green Version]
- Melillo, J.M.; Borchers, J.; Chaney, J. Vegetation/ecosystem modeling and analysis project: Comparing biogeography and geochemistry models in a continental-scale study of terrestrial ecosystem responses to climate change and CO2 doubling. Glob. Biogeochem. Cycles 1995, 9, 407–437. [Google Scholar]
- Cramer, W.; Bondeau, A.; Woodward, F.I.; Prentice, I.C.; Betts, R.A.; Brovkin, V.; Cox, P.M.; Fisher, V.; Foley, J.A.; Friend, A.D.; et al. Global response of terrestrial ecosystem structure andfunction to CO2 and climate change: Resultsfrom six dynamic global vegetation models. Glob. Chang. Biol. 2001, 7, 357–373. [Google Scholar] [CrossRef] [Green Version]
- Caminade, C.; Kovats, S.; Rocklov, J.; Tompkins, A.M.; Morse, A.P.; Colon-Gonzalez, F.J.; Stenlund, H.; Martens, P.; Lloyd, S.J. Impact of climate change on global malaria distribution. Proc. Natl. Acad. Sci. USA 2014, 111, 3286–3291. [Google Scholar] [CrossRef] [Green Version]
- Tebaldi, C.; Strauss, B.H.; Zervas, C.E. Modelling sea level rise impacts on storm surges along US coasts Environ. Res. Lett. 2012, 7, 014032. [Google Scholar] [CrossRef]
- Nicholls, R.J.; Hanson, S.E.; Lowe, J.A.; Warrick, R.A.; Lu, X.; Long, A.J. Sea-level scenarios for evaluating coastal impacts. Rev. Clim. Chang. 2014, 5, 129–150. [Google Scholar] [CrossRef]
- Taylor, K.E.; Stouffer, R.J.; Meehl, G.A. An overview of CMIP5 and the experiment design. Bull. Am. Meteorol. Soc. 2012, 93, 485–498. [Google Scholar] [CrossRef] [Green Version]
- Weedon, G.P.; Gomes, S.; Viterbo, P.; Shuttleworth, W.J.; Blyth, E.; Österle, H.; Adam, J.C.; Bellouin, N.; Boucher, O.; Best, M. Creation of the WATCH forcing data and its use to assess global and regional reference crop evaporation over land during the twentieth century. J. Hydrometeorol. 2011, 12, 823–848. [Google Scholar] [CrossRef] [Green Version]
- Sacks, W.J.; Deryng, D.; Foley, J.A.; Ramankutty, N. Crop planting dates: An analysis of global patterns. Glob. Ecol. Biogeogr. 2010, 19, 607–620. [Google Scholar] [CrossRef]
- Williams, J.R. The EPIC Model. In Computer Models of Watershed Hydrology; Singh, V.P., Ed.; Water Resources Publications: Highlands Ranch, CO, USA, 1995; pp. 7–42. [Google Scholar]
- Liu, J.G.; Williams, J.R.; Zehnder, A.J.B.; Yang, H. GEPIC—Modelling wheat yield and crop water productivity with high resolution on a global scale. Agric. Syst. 2007, 94, 478–493. [Google Scholar] [CrossRef]
- Elliott, J.; Kelly, D.; Chryssanthacopoulos, J.; Glotter, M.; Jhunjhnuwala, K.; Best, N.; Wilde, M.; Foster, I. The parallel system for integrating impact models and sectors (pSIMS). Environ. Model. Softw. 2014, 62, 509–516. [Google Scholar] [CrossRef] [Green Version]
- Deryng, D.; Conway, D.; Ramankutty, N.; Price, J.; Warren, R. Global crop yield response to extreme heat stress under multiple climate change futures. Environ. Res. Lett. 2014, 9, 034011. [Google Scholar] [CrossRef] [Green Version]
- Waha, K.; van Bussel, L.G.J.; Müller, C.; Bondeau, A. Climate driven simulation of global crop sowing dates. Glob. Ecol. Biogeogr. 2012, 21, 247–259. [Google Scholar] [CrossRef]
- Bondeau, A.; Smith, P.C.; Zaehle, S.; Schaphoff, S.; Lucht, W.; Cramer, W.; Gerten, D.; Lotze-Campen, H.; Müller, C.; Reichstein, M.; et al. Modelling the role of agriculture for the 20th century global terrestrial carbon balance. Glob. Chang. Biol. 2007, 13, 679–706. [Google Scholar] [CrossRef]
- Fader, M.; Rost, S.; Müller, C.; Bondeau, A.; Gerten, D. Virtual water content of temperate cereals and maize: Present and potential future patterns. J. Hydrol. 2010, 384, 218–231. [Google Scholar] [CrossRef]
- Lindeskog, M.; Arneth, A.; Bondeau, A.; Waha, K.; Seaquist, J.; Olin, S.; Smith, B. Implications of accounting for land use in simulations of ecosystem carbon cycling in Africa. Earth Syst. Dyn. 2013, 4, 385–407. [Google Scholar] [CrossRef] [Green Version]
- Dunne, J.P.; John, J.G.; Adcroft, A.J.; Griffies, S.M.; Hallberg, R.W.; Shevliakova, E.; Stouffer, R.J.; Cooke, W.; Dunne, K.A.; Harrison, M.J.; et al. GFDL’s ESM2 Global Coupled Climate–Carbon Earth System Models, Part I: Physical Formulation and Baseline Simulation Characteristics. J. Clim. 2012, 25, 6646–6665. [Google Scholar] [CrossRef] [Green Version]
- Dunne, J.P.; John, J.G.; Shevliakova, E.; Stouffer, R.J.; Krasting, J.P.; Malyshev, S.L.; Milly, P.C.; Sentman, L.T.; Adcroft, A.J.; Cooke, W.; et al. GFDL’s ESM2 Global Coupled Climate–Carbon Earth System Models—Part II: Carbon System Formulation and Baseline Simulation Characteristics. J. Clim. 2013, 26, 2247–2267. [Google Scholar] [CrossRef] [Green Version]
- Jones, C.D.; Hughes, J.K.; Bellouin, N.; Hardiman, S.C.; Jones, G.S.; Knight, J.; Liddicoat, S.; O’Connor, F.M.; Andres, R.J.; Bell, C.; et al. The HadGEM2-ES implementation of CMIP5 centennial simulations. Geosci. Model. Dev. 2011, 4, 543–570. [Google Scholar] [CrossRef] [Green Version]
- Mignot, J.; Bony, S. Presentation and analysis of the IPSL and CNRM climate models used in CMIP5. Clim. Dyn. 2013, 40, 2089. [Google Scholar] [CrossRef] [Green Version]
- Watanabe, S.; Hajima, T.; Sudo, K.; Nagashima, T.; Takemura, T.; Okajima, H.; Nozawa, T.; Kawase, H.; Abe, M.; Yokohata, T.; et al. MIROC-ESM 2010: Model description and basic results of CMIP5-20c3m experiments. Geosci. Model. Dev. 2011, 4, 845–872. [Google Scholar] [CrossRef] [Green Version]
- Bentsen, M.; Bethke, I.; Debernard, J.B.; Iversen, T.; Kirkevåg, A.; Seland, Ø.; Drange, H.; Roelandt, C.; Seierstad, I.A.; Hoose, C.; et al. The Norwegian Earth System Model, NorESM1-M—Part 1: Description and basic evaluation of the physical climate. Geosci. Model. Dev. 2013, 6, 687–720. [Google Scholar] [CrossRef] [Green Version]
- Iversen, T.; Bentsen, M.; Bethke, I.; Debernard, J.B.; Kirkevåg, A.; Seland, Ø.; Drange, H.; Kristjansson, J.E.; Medhaug, I.; Sand, M.; et al. The Norwegian Earth System Model, NorESM1-M—Part 2: Climate response and scenario projections. Geosci. Model. Dev. 2013, 6, 389–415. [Google Scholar] [CrossRef] [Green Version]
- Liu, Y.; Zhang, J.; Qin, Y. How global warming alter future maize yield and water use efficiency in China. Technol. Forecast. Soc. Chang. 2020, 160, 120229. [Google Scholar] [CrossRef]
- Wang, B.; Liu, D.L.; O’Leary, G.J.; Asseng, S.; Macadam, I.; Lines-Kelly, R.; Yang, X.; Clark, A.; Crean, J.; Sides, T.; et al. Australian wheat production expected to decrease by the late 21st century. Glob. Chang. Biol. 2017, 24, 2403–2415. [Google Scholar] [CrossRef] [PubMed]
- Ouda, S.; Zohry, A.A. Crops intensification to reduce wheat gap in Egypt. In Future of Food Gaps in Egypt: Obstacles and Opportunities; Springer: Berlin/Heidelberg, Germany, 2017; ISBN 978-3-319-46942-3. [Google Scholar]
- Zhang, T.; Huang, Y. Impacts of climate change and inter-annual variability on cereal crops in China from 1980 to 2008. J. Sci. Food Agric. 2012, 92, 1643–1652. [Google Scholar] [CrossRef]
- Stanhill, G.; Cohen, S. Global dimming: A review of the evidence for a widespread and significant reduction in global radiation with discussion of its probable causes and possible agricultural consequences. Agric. For. Meteorol. 2001, 107, 255–278. [Google Scholar] [CrossRef]
- Bai, H.; Tao, F.; Xiao, D.; Liu, F.; Zhang, H. Attribution of yield change for rice-wheat rotation system in China to climate change, cultivars and agronomic management in the past three decades. Clim. Chang. 2016, 135, 539–553. [Google Scholar] [CrossRef]
- Lobell, D.B.; Gourdji, S.M. The influence of climate change on global crop productivity. Plant. Physiol. 2012, 160, 1686–1697. [Google Scholar] [CrossRef] [Green Version]
- Liu, Z.; Yang, X.; Hubbard, K.G.; Lin, X. Maize potential yields and yield gaps in the changing climate of northeast China. Glob. Chang. Biol. 2012, 18, 3441–3454. [Google Scholar] [CrossRef]
- Araya, A.; Kisekka, I.; Lin, X.; Prasad, P.V.; Gowda, P.H.; Rice, C.; Andales, A. Evaluating the impact of future climate change on irrigated maize production in Kansas. Clim. Risk Manag. 2017, 17, 139–154. [Google Scholar] [CrossRef]
- Welikhe, P.; Essamuah-Quansah, J.; Boote, K.; Asseng, S.; El Afandi, G.; Fall, S.; Mortley, D.; Ankumah, R. Impact of climate change on maize yields in Alabama. Prof. Agric. Work. J. 2016, 4, 12. [Google Scholar]
- Islama, A.; Ahuja, R.L.; Garciab, L.A.; Ma, L.; Saseendran, A.S.; Trout, T.J. Modeling the impacts of climate change on irrigated maize production in the Central Great Plains. Agric. Water Manag. 2012, 110, 94–108. [Google Scholar] [CrossRef]
- Makadho, J.M. Potential effects of climate change on corn production in Zimbabwe. Clim. Res. 1996, 6, 147–151. [Google Scholar] [CrossRef] [Green Version]
- Abraha, M.G.; Savage, M.J. Potential impacts of climate change on the grain yield of maize for the midlands of KwaZulu-Natal, South Africa. Agric. Ecosyst. Environ. 2006, 115, 150–160. [Google Scholar] [CrossRef]
- Shi, W.; Tao, F. Vulnerability of African maize yield to climate change and variability during 1961–2010. Food Secur. 2014, 6, 471–481. [Google Scholar] [CrossRef]
- Olesen, J.E.; Bindi, M. Consequences of climate change for European agricultural productivity, land use and policy. Eur. J. Agron. 2002, 16, 239–262. [Google Scholar] [CrossRef]
- Ruane, A.C.; Cecil, L.D.; Horton, R.M.; Gordón, R.; McCollum, R.; Brown, D.; Killough, B.; Goldberg, R.; Greeley, A.P.; Rosenzweig, C. Climate change impact uncertainties for maize in Panama: Farm information, climate projections, and yield sensitivities. Agric. For. Meteorol. 2013, 170, 132–145. [Google Scholar] [CrossRef]
- Araya, A.; Hoogenboom, G.; Luedeling, E.; Hadgu, K.H.; Kisekka, I.; Lucieta, G.M. Assessment of maize growth and yield using crop models under present and future climate in southwestern Ethiopia. Agric. For. Meteorol. 2015, 214–215, 252–265. [Google Scholar] [CrossRef]
- Bassu, S.; Brisson, N.; Durand, J.L.; Boote, K.; Lizaso, J.; Jones, J.W.; Rosenzweig, C.; Ruane, A.C.; Adam, M.; Baron, C.; et al. How do various maize crop models vary in their responses to climate change factors? Glob. Chang. Biol. 2014, 20, 2301–2320. [Google Scholar] [CrossRef]
- Porter, J.R.; Semenov, M.A. Crop responses to climatic variation. Philos. Trans. R. Soc. B Biol. Sci. 2005, 360, 2021–2035. [Google Scholar] [CrossRef]
- Edreira, J.R.; Carpici, E.B.; Sammarro, D.; Otegui, M.E. Heat stress effects around flowering on kernel set of temperate and tropical maize hybrids. Field Crops Res. 2011, 123, 62–73. [Google Scholar] [CrossRef]
- Wheeler, T.R.; Craufurd, P.Q.; Ellis, R.H.; Porter, J.R.; Vara Prasad, P. Temperature variability and the yield of annual crops. Agric. Ecosyst. Environ. 2000, 82, 159–167. [Google Scholar] [CrossRef]
- Rezaei, E.E.; Webber, H.; Gaiser, T.; Naab, J.; Ewert, F. Heat stress in cereals: Mechanisms and modelling. Eur. J. Agron. 2015, 64, 98–113. [Google Scholar] [CrossRef]
- Wang, Z.; Shi, P.; Zhang, Z.; Meng, Y.; Luan, Y.; Wang, J. Separating out the influence of climatic trend, fluctuations, and extreme events on crop yield: A case study in Hunan Province, China. Clim. Dyn. 2018, 51, 4469–4487. [Google Scholar] [CrossRef]
- Hussain, S.S.; Mudasser, M. Prospects for wheat production under changing climate in mountain areas of Pakistan—An econometric analysis. Agric. Syst. 2007, 94, 494–501. [Google Scholar] [CrossRef]
- Schierhorn, F.; Hofmann, M.; Adrian, I.; Bobojonov, I.; Müller, D. Spatially varying impacts of climate change on wheat and barley yields in Kazakhstan. J. Arid Environ. 2020, 178, 104164. [Google Scholar] [CrossRef]
- Schleser, G.H. Investigations of the δ13C pattern in leaves of Fagus sylvatica L. J. Exp. Bot. 1990, 41, 565–572. [Google Scholar] [CrossRef]
- Kumar, S.N.; Aggarwal, P.K.; Rani, D.S.; Saxena, R.; Chauhan, N.; Jain, S. Vulnerability of wheat production to climate change in India. Clim. Res. 2014, 59, 173–187. [Google Scholar] [CrossRef]
- Lobell, D.B.; Sibley, A.; Ortiz-Monasterio, J.I. Extreme heat effects on wheat senescence in India. Nat. Clim. Chang. 2012, 2, 186–189. [Google Scholar] [CrossRef]
- Constantinidou, K.; Hadjinicolaou, P.; Zittis, G.; Lelieveld, J. Effects of climate change on the yield of winter wheat in the eastern Mediterranean and Middle East. Clim. Res. 2016, 69, 129–141. [Google Scholar] [CrossRef] [Green Version]
- Shaw, R.H. Secondary wind speed maxima inside plant canopies. J. Appl. Meteorol. Climatol. 1977, 16, 514–521. [Google Scholar] [CrossRef] [Green Version]
- Barnabás, B.; Jäger, K.; Fehér, A. The effect of drought and heat stress on reproductive processes in cereals. Plant Cell Environ. 2008, 31, 11–38. [Google Scholar] [CrossRef] [PubMed]
- Lobell, D.B.; Hammer, G.L.; McLean, G.; Messina, C.; Roberts, M.J.; Schlenker, W. The critical role of extreme heat for maize production in the United States. Nat. Clim. Chang. 2013, 3, 497–501. [Google Scholar] [CrossRef]
- Hussain, M.Z.; VanLoocke, A.; Siebers, M.H.; Ruiz-Vera, U.M.; Cody Markelz, R.J.; Leakey, A.D.; Ort, D.R.; Bernacchi, C.J. Future carbon dioxide concentration decreases canopy evapotranspiration and soil water depletion by field-grown maize. Glob. Chang. Biol. 2013, 19, 1572–1584. [Google Scholar] [CrossRef] [PubMed]
- Leakey, A.D.; Ainsworth, E.A.; Bernacchi, C.J.; Rogers, A.; Long, S.P.; Ort, D.R. Elevated CO2 effects on plant carbon, nitrogen, and water relations: Six important lessons from FACE. J. Exp. Bot. 2009, 60, 2859–2876. [Google Scholar] [CrossRef] [PubMed]
- Mueller, B.; Seneviratne, S.I. Hot days induced by precipitation deficits at the global scale. Proc. Natl. Acad. Sci. USA 2012, 109, 12398–12403. [Google Scholar] [CrossRef] [Green Version]
- Challinor, A.J.; Wheeler, T.R.; Craufur, P.Q.; Ferroa, C.A.T.; Stephensonc, D.B. Adaptation of crops to climate change through genotypic responses to mean and extreme temperatures. Agric. Ecosyst. Environ. 2007, 119, 190–204. [Google Scholar] [CrossRef] [Green Version]
- Gouache, D.; Le Bris, X.; Bogard, M.; Deudon, O.; Page, C.; Gate, P. Evaluating agronomic adaptation options to increasing heat stress under climate change during wheat grain filling in France. Eur. J. Agron. 2012, 39, 62–70. [Google Scholar] [CrossRef]
- Jingsong, S.; Guangsheng, Z.; Xinghua, S. Climatic suitability of the distribution of the winter wheat cultivation zone in China. Eur. J. Agron. 2012, 43, 77–86. [Google Scholar] [CrossRef]
- Tao, F.; Zhang, S.; Zhang, Z. Spatiotemporal changes of wheat phenology in China under the effects of temperature, day length and cultivar thermal characteristics. Eur. J. Agron. 2012, 43, 201–212. [Google Scholar] [CrossRef]
- IPCC. Climate Change 2001: Third Assessment Report of the Intergovernmental Panel on Climate Change; Cambridge University Press: Cambridge, CA, USA, 2001. [Google Scholar]
- Sinha, S.K.; Rai, M.; Singh, G.B. Decline in Productivity in Punjab and Haryana: A Myth or Reality? Indian Council of Agricultural Research (ICAR) Publication: New Delhi, India, 1998; p. 89. [Google Scholar]
Figure 1.
Egypt location map.

Figure 2.
The seasonal mean temperature for the period (1986–2005), (a) winter (Nov-Apr) maximum temperature (TX), (b) summer TX (May-Oct), (c) winter minimum temperature (TN), and (d) summer TN.
Figure 2.
The seasonal mean temperature for the period (1986–2005), (a) winter (Nov-Apr) maximum temperature (TX), (b) summer TX (May-Oct), (c) winter minimum temperature (TN), and (d) summer TN.

Figure 3.
The seasonal absolute difference of maximum temperature for, (a) winter (TX) for GW1.5, (b) summer TX at GW1.5, (c) winter (TX) at GW2.0, and (d) summer TX at GW2.0.
Figure 3.
The seasonal absolute difference of maximum temperature for, (a) winter (TX) for GW1.5, (b) summer TX at GW1.5, (c) winter (TX) at GW2.0, and (d) summer TX at GW2.0.

Figure 4.
The seasonal absolute difference of minimum temperature for, (a) winter (TN) for GW1.5, (b) summer TN at GW1.5, (c) winter (TN) at GW2.0, and (d) summer TN at GW2.0.
Figure 4.
The seasonal absolute difference of minimum temperature for, (a) winter (TN) for GW1.5, (b) summer TN at GW1.5, (c) winter (TN) at GW2.0, and (d) summer TN at GW2.0.

Figure 5.
The monthly deviations of the climate variables under current GW1.5 and GW2.0 situations.

Figure 6.
The historical wheat yield in the 2000s and the future ISI-MIP relative change under GW1.5 and GW2.0 levels, (a): EGY wheat historical; (b) EGY wheat +1.5 °C; (c): EGY wheat +2.0 °C. The grey grid cells where the models do not agree in the sign of change under each warming level, and this belongs to the uncertainty.

Figure 7.
The historical maize yield in the 2000s and the future ISI-MIP relative change under GW1.5 and GW2.0 levels, (a): EGY maize historical; (b) EGY maize +1.5 °C; (c): EGY maize +2.0 °C. The grey grid cells where the models do not agree in the sign of change under each warming level, and this belongs to the uncertainty.

Table 4.
The change in national yield of wheat and maize under 1.5 °C and 2.0 °C levels of temperature change.
Table 4.
The change in national yield of wheat and maize under 1.5 °C and 2.0 °C levels of temperature change.
| Crop | Change in National Average Yield (%) | |
|---|---|---|
| +1.5 °C | +2 °C | |
| Wheat | 5 [0 to 9] | 5 [−3 to 14] |
| Maize | −1 [−5 to 3] | −4 [−8 to 2] |
Publisher’s Note: MDPI stays neutral with regard to jurisdictional claims in published maps and institutional affiliations. |
© 2021 by the authors. Licensee MDPI, Basel, Switzerland. This article is an open access article distributed under the terms and conditions of the Creative Commons Attribution (CC BY) license (https://creativecommons.org/licenses/by/4.0/).
Share and Cite
MDPI and ACS Style
Gamal, G.; Samak, M.; Shahba, M. The Possible Impacts of Different Global Warming Levels on Major Crops in Egypt. Atmosphere 2021, 12, 1589. https://0-doi-org.brum.beds.ac.uk/10.3390/atmos12121589
AMA Style
Gamal G, Samak M, Shahba M. The Possible Impacts of Different Global Warming Levels on Major Crops in Egypt. Atmosphere. 2021; 12(12):1589. https://0-doi-org.brum.beds.ac.uk/10.3390/atmos12121589
Chicago/Turabian StyleGamal, Gamil, Magdy Samak, and Mohamed Shahba. 2021. "The Possible Impacts of Different Global Warming Levels on Major Crops in Egypt" Atmosphere 12, no. 12: 1589. https://0-doi-org.brum.beds.ac.uk/10.3390/atmos12121589
Note that from the first issue of 2016, this journal uses article numbers instead of page numbers. See further details here.