
Exposure to PM4 in Homes with Tobacco Smoke in and around Katowice, Poland


1
Department of Air Protection, Silesian University of Technology, 44-100 Gliwice, Poland
2
Institute of Physics, University of Silesia, 41-500 Chorzów, Poland
3
Department of Biology and Environment Protection, University of Silesia, 40-032 Katowice, Poland
*
Author to whom correspondence should be addressed.
Atmosphere 2021, 12(12), 1590; https://0-doi-org.brum.beds.ac.uk/10.3390/atmos12121590
Submission received: 14 October 2021
/
Revised: 25 November 2021
/
Accepted: 25 November 2021
/
Published: 29 November 2021
(This article belongs to the Special Issue Environmental and Energy Assessment of Buildings and Systems)
Abstract
:The results of a PM4 (airborne particles with an aerodynamic diameter less than 4 µm) study in Katowice and in the surrounding area in homes with and without environmental tobacco smoke (ETS) are presented. It was found that the average concentration of PM4 inside the homes with ETS was between 126 µg m−3 (in Jaworzno) and 208 µg m−3 (in Katowice)—significantly higher than in the homes without smokers (55–65 µg m−3). The mean of the indoor to outdoor ratios (I/O) for PM4 varied greatly, ranging from 0.6 in the apartments without smokers in Katowice to 5.2 in the homes with smokers in Jaworzno. The highly polluted by ETS indoor air causes children aged 14–15 living in these homes to inhale from 2.5 to 6.6 mg of PM4 more per day than their peers living in non-ETS homes. X-ray photoelectron spectroscopy (XPS) was used to determine the surface chemical composition of the studied indoor airborne particles. Carbon, including elemental carbon, and oxygen-containing species dominated the particulate surface, with traces of Si, N, S, Na, Al, Zn, and K present. The surface layer of PM4 from the homes with ETS contains significantly more carbon and less oxygen than the airborne particles collected in the homes without smokers, which can be explained by the high emission of carbon during tobacco smoking.
1. Introduction
Because people spend most of their time indoors, the exposure to pollutants present in indoor air is a very important problem of public health. Among various kinds of air pollutants, especially interesting seem to be aerosols. One reason is certainly the fact that the process of the migration of airborne particles from the outdoor environment to the indoor environment is more difficult compared to the migration of gaseous molecules.
Although a number of studies report that indoor and outdoor particulate levels are approximately equal in buildings without a significant indoor source [1,2,3], almost all investigations into indoor–outdoor ratios for aerosol particles report that indoor particulate levels are on average lower than outdoor levels. The influence of outdoor particulate matter (PM) on the level of concentration in the indoor environment is characterized by the I/O ratio (concentration of PM indoors/concentration of PM outdoors). Generally, the I/O ratio for various modes of PM are reported from 0.1 to 3.4 (if some emission sources are present indoors). For the fine particles having an aerodynamic diameter less than 2.5 µm (PM2.5), I/O ratios in different cities were in the range from 0.8 to 2.4 [4].
In estimating exposure to airborne particles indoors, understanding the role of various sources is important, mainly because of the different contribution of each source but also because those different sources produce particles with different physical and chemical characteristics [3]. Anthropogenic sources may originate either outdoors or indoors, with the main indoor sources being tobacco smoke, fossil fuel heating systems, and cooking. Airborne particles can enter a building with ambient air through a number of routes, including open windows and doors, air conditioning systems (HVAC), and adventitious leaks. One of the most important emission sources of air pollution indoors is still tobacco smoking (see, for example: [5,6,7]). It should be noted that although the global prevalence of daily smoking has decreased [8], the absolute number of smokers has increased to almost 1 billion people in 2012 [9]. About 6 trillion cigarettes were smoked worldwide in 2016 [10].
Tobacco smoke consists of solid particles and gases. More than 7000 different chemicals have been identified in tobacco smoke. The number of these chemicals that are known to cause cancer in animals, humans, or both are reported to be about 70. The solid particles make up about 10 percent of tobacco smoke and include “tar” and nicotine. The gases or vapors make up about 90 percent of tobacco smoke. The major gas present is carbon monoxide. Others include formaldehyde, acrolein, ammonia, nitrogen oxides, pyridine, hydrogen cyanide, vinyl chloride, N-nitrosodimethylamine, and acrylonitrile. Of these, formaldehyde, N- nitrosodimethylamine, and vinyl chloride are suspected or known carcinogens in humans. Acrylonitrile has been shown to cause cancer in animals [11]. Therefore, the level of airborne particles indoors strongly depends on the emission sources in both outdoor and indoor environments, as well as on the characteristics of the migration of particles from ambient air into the buildings. Therefore, local studies of the exposure to indoor aerosols are needed. In addition, these studies should be repeated from time to time as results can change quickly. It should be remembered that the air quality in the world, including Poland, is very dynamic. For example, significant political and economic transformations in Poland during the last 30 years have changed the anthropogenic sources of pollution. The reduction in the emission of air pollutants from metallurgical, chemical, and other industries have taken place, especially in Upper Silesia, located in middle southern Poland. This region belongs to the most industrialized and polluted region in Europe [12,13]. In Upper Silesia, the degradation of the environment related to hard coal excavation and the production of coal derivatives started in the early 19th century. The problem of environmental pollution in this area was recognized as serious already in the late 1950s, but this did not stop further environmental degradation. The greatest intensity of this process, including the greatest air pollution, took place in the 1960s and 1970s.
Although these traditional industrial as well as municipal sources are still very important there, the air pollution is also related to the rapid development of vehicular traffic. Traffic has been recognized now as a significant source of fine/respirable particles because mainly fine and ultrafine particles are emitted by compression-ignition (diesel) engines, although other sources of airborne particles, including vehicle wear and street surface erosion, as well as the resuspension of dust from the road surface generated by the movement of vehicles, can be also important. The influence of traffic on the characteristics of aerosol particles in Upper Silesia during the first and second decade of the twenty-first century have been intensively studied [14,15,16], and it is interesting that despite the rapid increase in emissions from traffic, in Upper Silesia, we are observing, per saldo, a clear, although still insufficient, reduction in air pollutant emissions. This creates a number of new and interesting facts. First, this should result in an improvement in the health status of the inhabitants of this region. Such a hypothesis is supported by the analysis made by Kobza et al. [17]. However, it can be expected that the air quality in the indoor environment in Upper Silesia has not been significantly improved yet. Although the role of outdoor air has been reduced, mainly because of the reduction of PM concentration in atmospheric air but also because of the decreasing penetration rate from outdoors into indoors due to the installation of new, very tight windows in almost all buildings in Poland in the last 20 years, the emission rates of various indoor sources seems to be still unchanged. This applies in particular to the emission of dust particles from smoking. For this reason, it seems very important to assess the total exposure of the inhabitants of Upper Silesia to respirable airborne particles in the late twenty-first century. Such information may be useful not only for the purposes of current health prevention but also may be used in the future to analyze the historical exposure of the population living under rapidly changing environmental conditions.
Unfortunately, the so-called ordinary observations indicate that smoking is still very popular in Poland, including, which is particularly worrying, among young people under the age of 30. These conclusions are confirmed in recent epidemiological studies [18]. The only “novelty” is the appearance of “electronic” cigarettes (e-cigarettes), which does not change the fact that even non-smoking residents of homes where at least one of the household members regularly smoke cigarettes are exposed to environmental tobacco smoke (ETS) [19].
For this reason, the assessment of human exposure to the ETS in Poland seems to be still very important, the more so that some studies indicate an unfavorable different aspect of synergy of simultaneous exposure to coronavirus (COVID-19) and tobacco smoke [19,20,21,22].
The main aim of this study was to describe the influence of environmental tobacco smoke (ETS) on the characteristics of respirable indoor aerosol in the apartments on Katowice, the capital town of Upper Silesia, Poland, and in the single-family houses in this region where approximately one pack of cigarettes is smoked per day. The houses for the research were selected on the basis of a previously conducted survey in which the respondents answered whether they smoke cigarettes and how many cigarettes they smoke per day.
The second purpose was to estimate a daily dose of airborne particles inhaled by children (teenagers) in their homes.
The chemical characterization of the surface of these indoor aerosol particles was an additional purpose of this work. Although the toxicity and carcinogenicity of airborne particles is still only partially understood, it should be noted that the chemical composition of the surface of particles is crucial in determining health effects because the surface is directly accessible to biological fluids after inhalation.
Fine particles (PM2.5), i.e., particles with an aerodynamic diameter of up to 2.5 µm, are considered particularly dangerous because they can reach very deep areas of the human respiratory tract (secondary bronchi, terminal bronchi and alveoli). However, particles embedded in the trachea and primary bronchi, i.e., particles with a diameter of 3 to 4 µm can also cause serious adverse health effects, especially if the inhaled dose of these particles is very high [23]. Therefore, we decided to analyze the exposure to PM4 of the inhabitants of the houses studied. To our knowledge, this is the first study in Poland to investigate PM4 levels in homes with tobacco smoke.
2. Materials and Methods
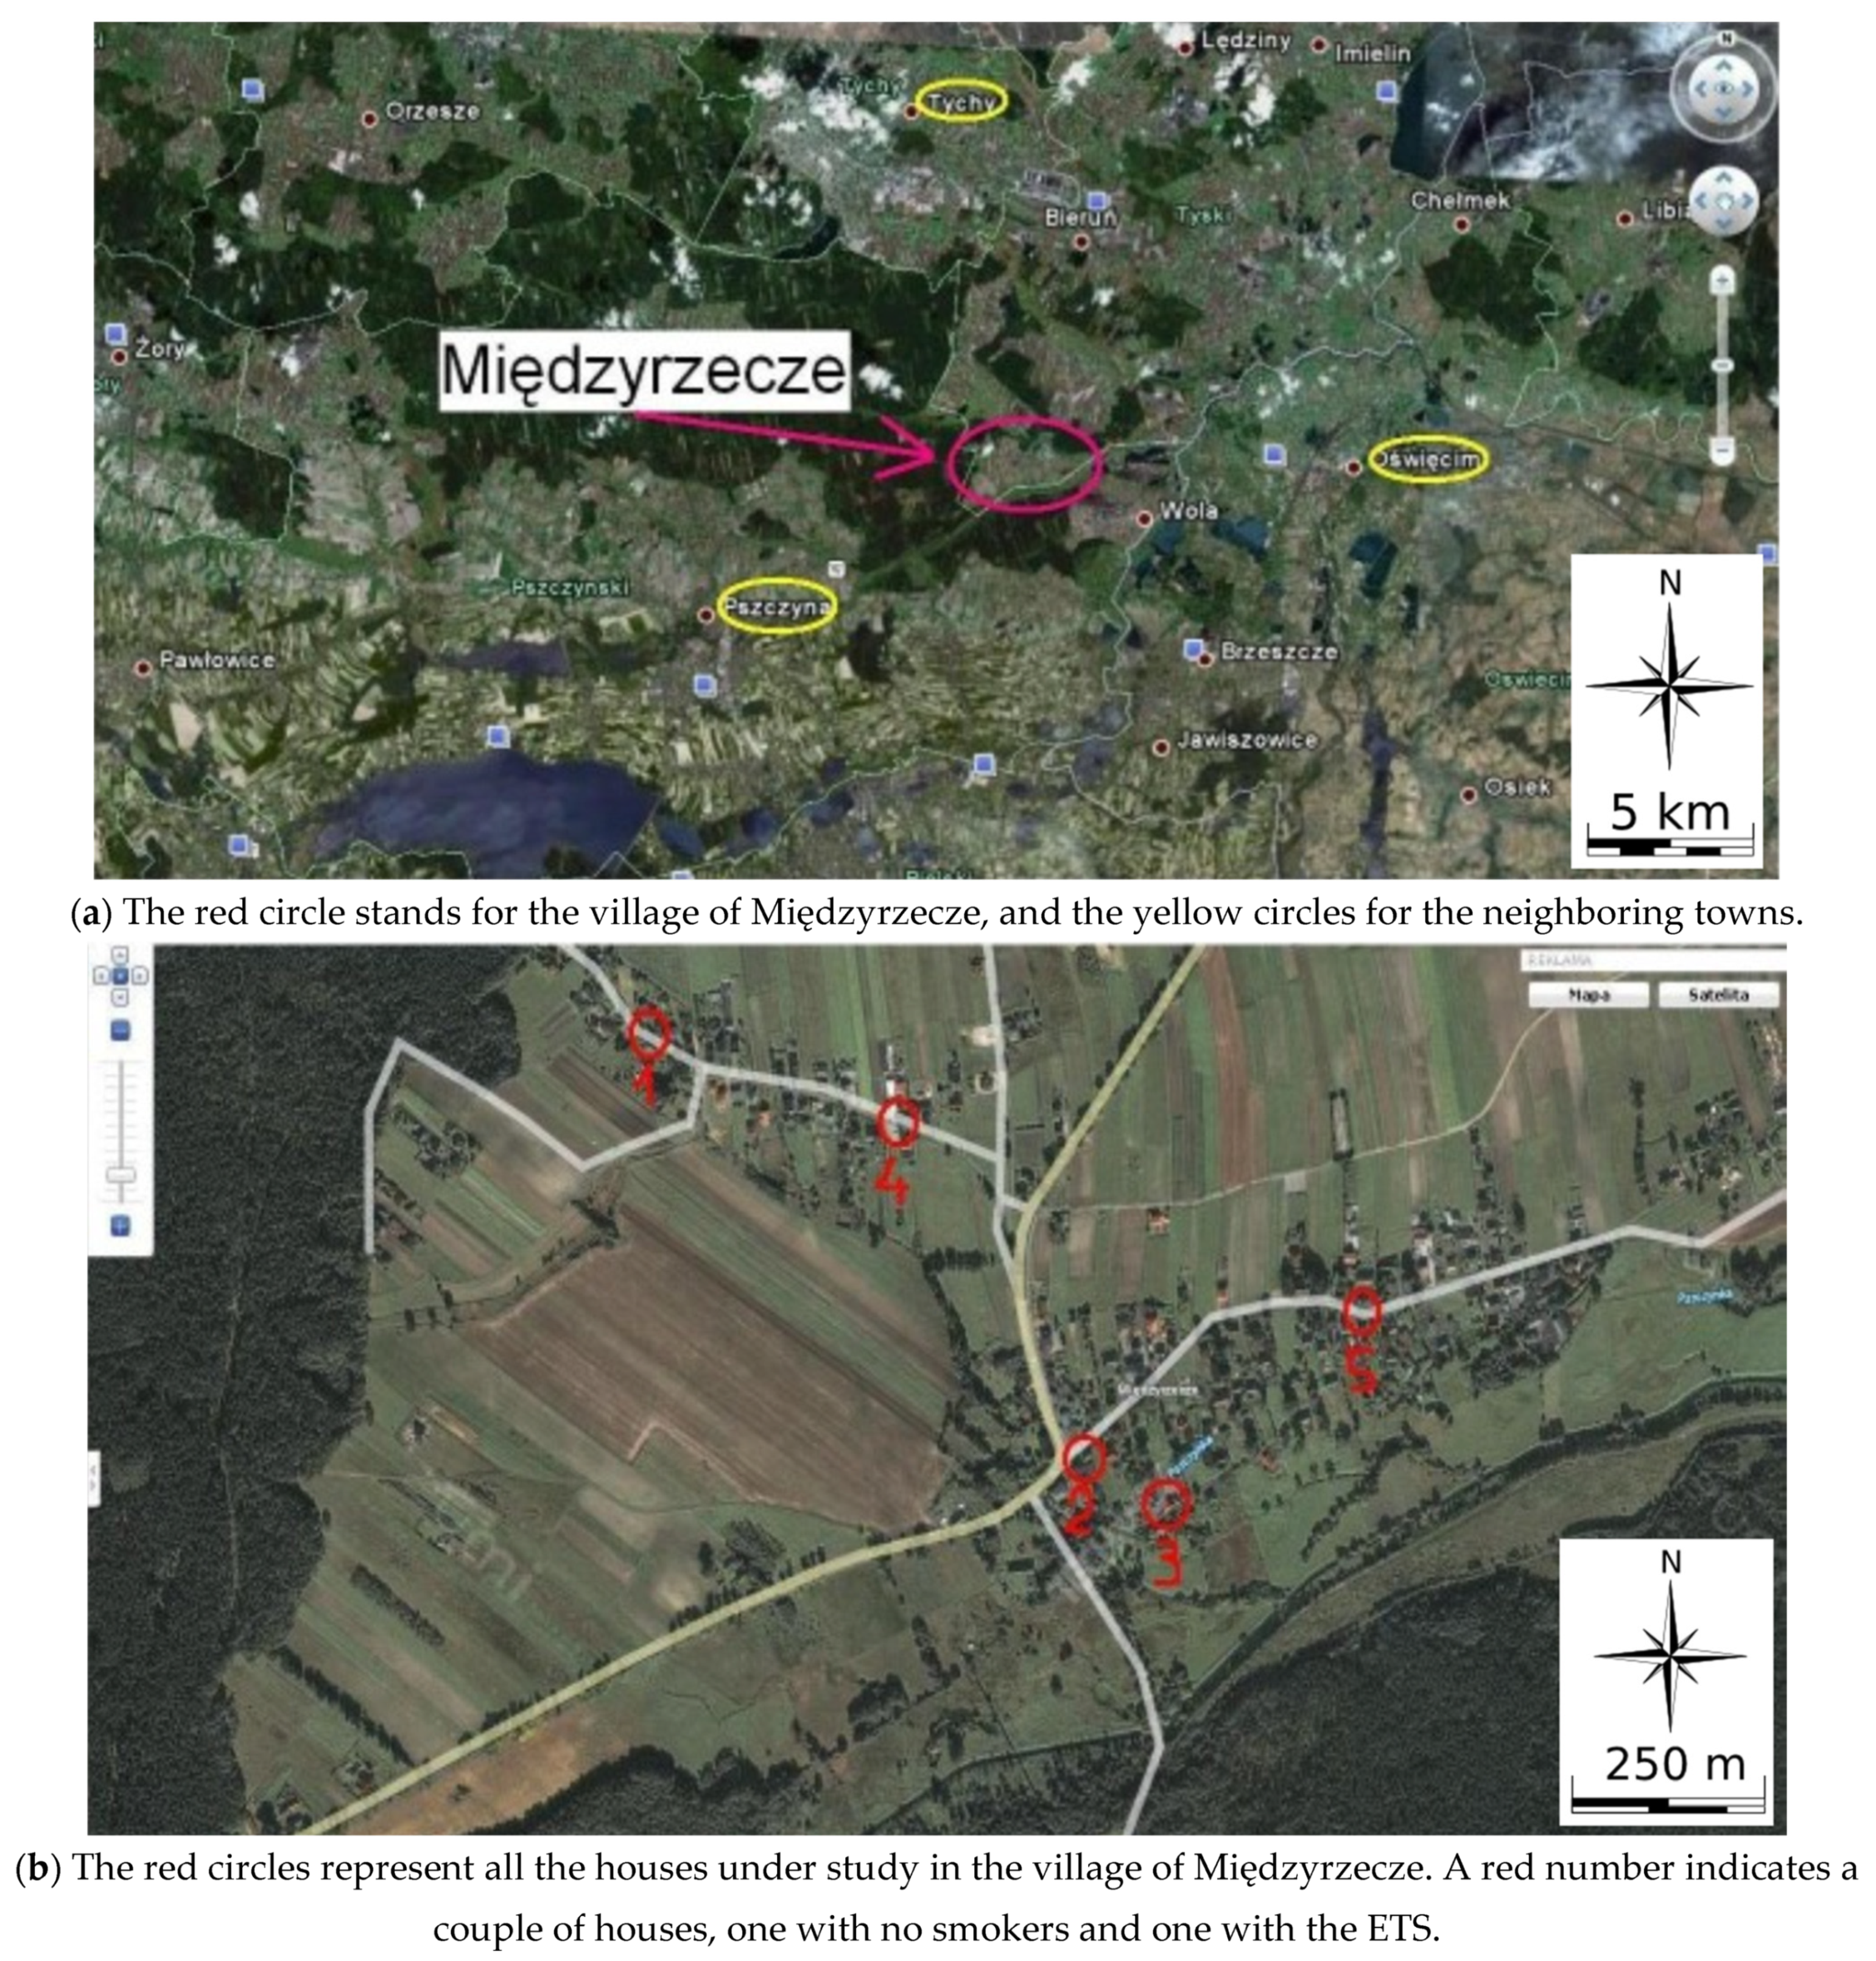
Measurements were carried out before the coronavirus COVID-19 pandemic and before the related lockdown in autumn season (at the turn of October and November) in the apartment buildings in Katowice, in the Dąbrówka Mała district, as well as in the small single-family houses near Katowice in the town Jaworzno as well as in the very small town/village Międzyrzecze. It should be noted that the research on aerosols inside small single-family buildings presented in this study was carried out for the first time in Poland.
The houses in Katowice and Jaworzno where the measurements were carried out were located close to each other. Buildings in Zarzecze were dispersed over a larger area, which is illustrated in Figure 1.
In Katowice, the flats/apartments under study were located on floors from the first to the fifth floor. All studies involved sampling of respirable airborne particles PM4 from homes where smokers live and from reference homes (no smokers), as well as from outdoor air outside these homes. The samplers were located in the central points of those rooms where the residents spent most of their time, at a height of 70 to 180 cm above the floor. Measurements on the outside were made on the balcony. The sampling frequency was several times a month, while the sampling time was 16 h. All measurements were carried out in two stages, 8 h each, over two days (the division of sampling into two stages was determined by the need to recharge the batteries in the aspirators, as their operation lasts about 9 h). The samplers were launched in both apartments or houses (smoking and non-smoking) and outside at the same time.
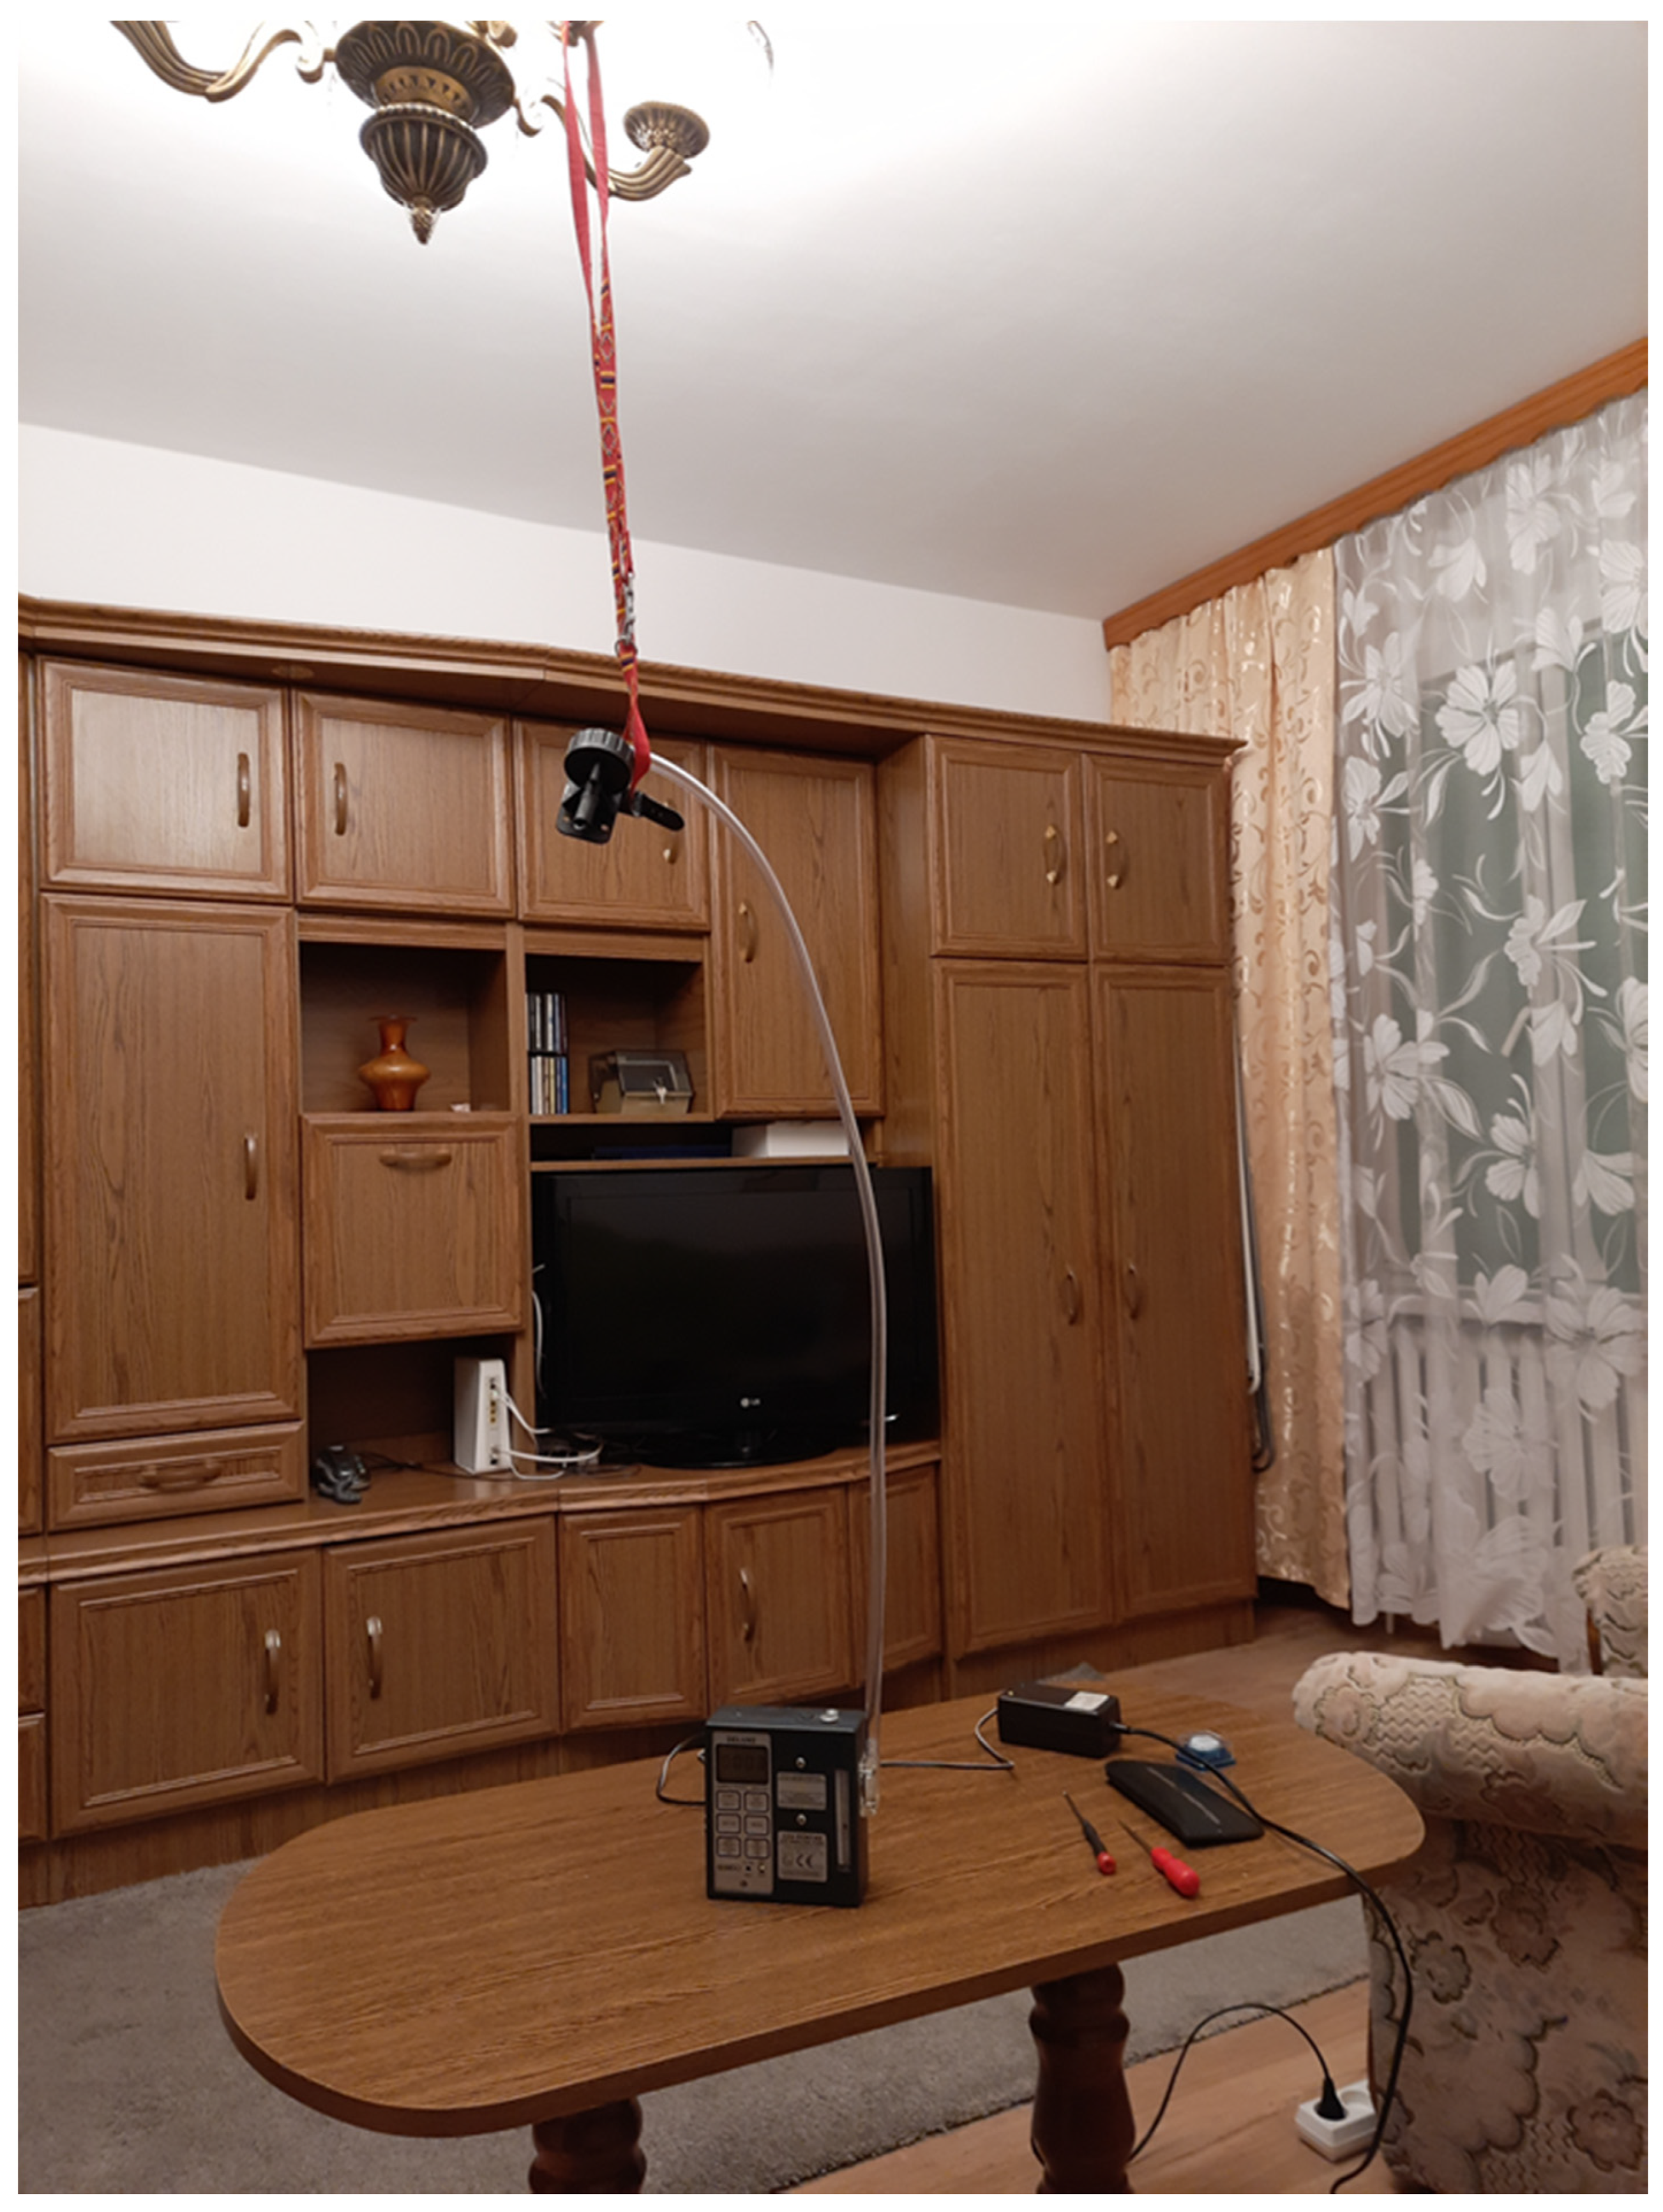
Airborne particles were collected using SKC samplers (USA) with cyclones with a cut-off diameter of 4.0 µm (see Figure 2). The flowrate was 2.2 × 10⁻³ m−3 (2.2 L/min) being constant during the sampling, which guaranteed that sampled airborne particles had aerodynamic diameters less than 4 µm. The PM4 particles were deposited on Whatman’s 25 mm round filters, made of 100% high-quality silicon glass. In addition, some Teflon filters were used.
During the studies, the air temperature outdoors was between 5 and 15 °C. There was a slight wind blowing up to 2 ms−1. From time to time, there was light rainfall.
Concentration of PM4 in Jaworzno and Międzyrzecze was studied in 5 pairs of houses. In each pair, 1 of the houses was a home with a tobacco smoker (smoking 1 pack of cigarettes per day), and the other building was chosen without a smoker. Overall, in any home with smokers, one resident smoked about 20 cigarettes a day (10 to 15 in some cases). In 25% of these homes, two smokers smoked a pack of cigarettes a day. In all selected single-family houses, there were no sources of air pollution other than tobacco smoking and stoves. All homes, including flats, may also occasionally have re-emissions of settled dust generated by the movement of residents. Moreover, the buildings of each pair were relatively close to each other (20–70 m). Samplers were located inside and outside of every two houses. The total sampling time for every filter was 16 h (2 × 8 h).
In order to estimate the daily dose of respirable particles inhaled by children/adolescents in the studied rooms, it was necessary to determine the daily stay in these buildings. For this purpose, an extensive survey was carried out among the inhabitants of Piekary Śląskie, a small town near Katowice (funds were obtained for research in this city). In the special activity diaries, each of the respondents wrote down subsequent activities that they performed at specific times in a given microenvironment. The study included residents of Piekary Śląskie in various age groups, working in different professions, employed in different cities, as well as learners and retirees.
A total of 118 respondents took part in the study, including:
- (a)
- 25 working women aged 20 to 40;
- (b)
- 14 working women aged 40 to 60;
- (c)
- 16 working men aged 20 to 40;
- (d)
- 13 working men aged 40 to 60;
- (e)
- 14 students (women and men);
- (f)
- 31 junior high school students (including 14 boys and 17 girls);
- (g)
- 5 pensioners (women and men).
All respondents were informed how to properly fill in the activity diaries, as well as the purpose of the research. In order for the research to be reflected in a typical time schedule, these people were asked to fill in their diaries on a regular working day, excluding Saturdays and Sundays. Any doubts that the respondents had were explained when returning the diaries. After calculating the questionnaires, the percentage of days spent in specific micro-environments by individual people was calculated, and then it was checked whether the total time was balanced and equal to 24 h.
During the research, 126 activity diaries were distributed, 118 of which were taken into account in further calculations, because the remaining 8 were filled in incorrectly. When calculating the percentage of time spent in individual microenvironments, the subjects were divided into individual groups in which the calculations were made. Only a small part of the research was used in this work, the rest of which will be published in a separate article.
To determine the chemical composition of a particle surface, the X-ray photoelectron spectroscopy (XPS) was used. The XPS spectra of aerosol samples were obtained with monochromatized Al K radiation using a PHI 5700y660 Photoelectron Spectrometer (Physical Electronics, Chanhassen, MN, USA). Surface analysis by XPS is accomplished by irradiating a sample with monoenergetic soft X-rays and analyzing the energy of the detected electrons. The photons have limited penetrating power in a solid in the order of 0.01 micrometers. They interact with atoms in the surface region, causing electrons to be emitted by the photoelectric effect [24].
The emitted electrons have kinetic energies given by:
where:
hv—is the energy of the photon;
BE—is the binding energy of the atomic orbit from which the electron originates;
fs—is the spectrometer work function.
A hemispherical mirror analyzer determined the energy of the electrons with a resolution of approximately 0.3 eV.
During the X-ray analysis, a voltage of 15 kV was applied. X-ray emissions from a surface area of 800 × 2000 mm were measured. Each analysis session took approximately 5 h. All measurements were performed under UHV (ultra-high vacuum) conditions, 10−10 Torr. Calibration for the spectra was made using the carbon C1s peak (284.6 eV). Each peak of the recorded spectrum is characteristic of a certain electron energy level of a certain element. The electron binding energies are characteristic for each element.
3. Results and Discussion
The mean concentration of PM4 for 26 different homes are shown in Table 1, Table 2 and Table 3, along with the mean ratios of the indoor to outdoor particles concentrations (I/O ratios).
It can be seen that for PM4 exposure in the homes with smokers, there was an almost two times difference between the lowest average concentration (126 µg m−3 in Jaworzno) and the highest (208 µg m−3 in Katowice). The corresponding PM4 concentrations in homes without ETS varied slightly less. The outdoor concentrations ranged from 38 µg m−3 in Jaworzno to 80 µg m−3 in Katowice.
The mean I/O ratios for PM4 varied greatly, ranging from 0.6 in the apartments without smokers in Katowice to 5.2 in the homes with smokers in Jaworzno.
It is interesting to compare these data with the levels of airborne particles in homes without and with ETS obtained two decades ago. Pastuszka [25] found that in the beginning of the twenty-first century in Upper Silesia, the concentration of PM in these two groups of homes (apartments) were as follows:
- 1.
- Homes without ETS:Concentration of PM5—71 µg m−3 (n = 58; standard dev. = 41 µg m−3);Concentration of PM2.5—56 µg m−3 (n = 47; standard dev. = 39 µg m−3).
- 2.
- Homes with ETS:Concentration of PM5—161 µg m−3 (n = 29; standard dev. = 108 µg m−3);Concentration of PM2.5—128 µg m−3 (n = 22; standard dev. = 95 µg m−3).
By comparing these levels, and in particular the PM5 level, with the PM4 concentration values obtained in this study, we can conclude that respirable dust levels in homes without smoking have significantly decreased over the past two decades. However, in homes with smokers, the situation is still very bad and needs radical improvement.
It should be noted that a more general term than “indoor environment” is “microenvironment”. Specific microenvironments are distinguished in the exposure model including residence, other indoors, outdoors, and in vehicle. It can be assumed that within a microenvironment, the pollutants are homogeneously distributed and microenvironmental concentration C(x,y,z,t) is calculated using a linear regression equation [26] based on the outdoor/indoor infiltration factor αj (dimensionless) and additional contribution of indoor pollution sources expressed as ẞj (µg m−3):
C(x,y,z,t)indoor = ẞj + αj · C(x,y,z,t)ambient
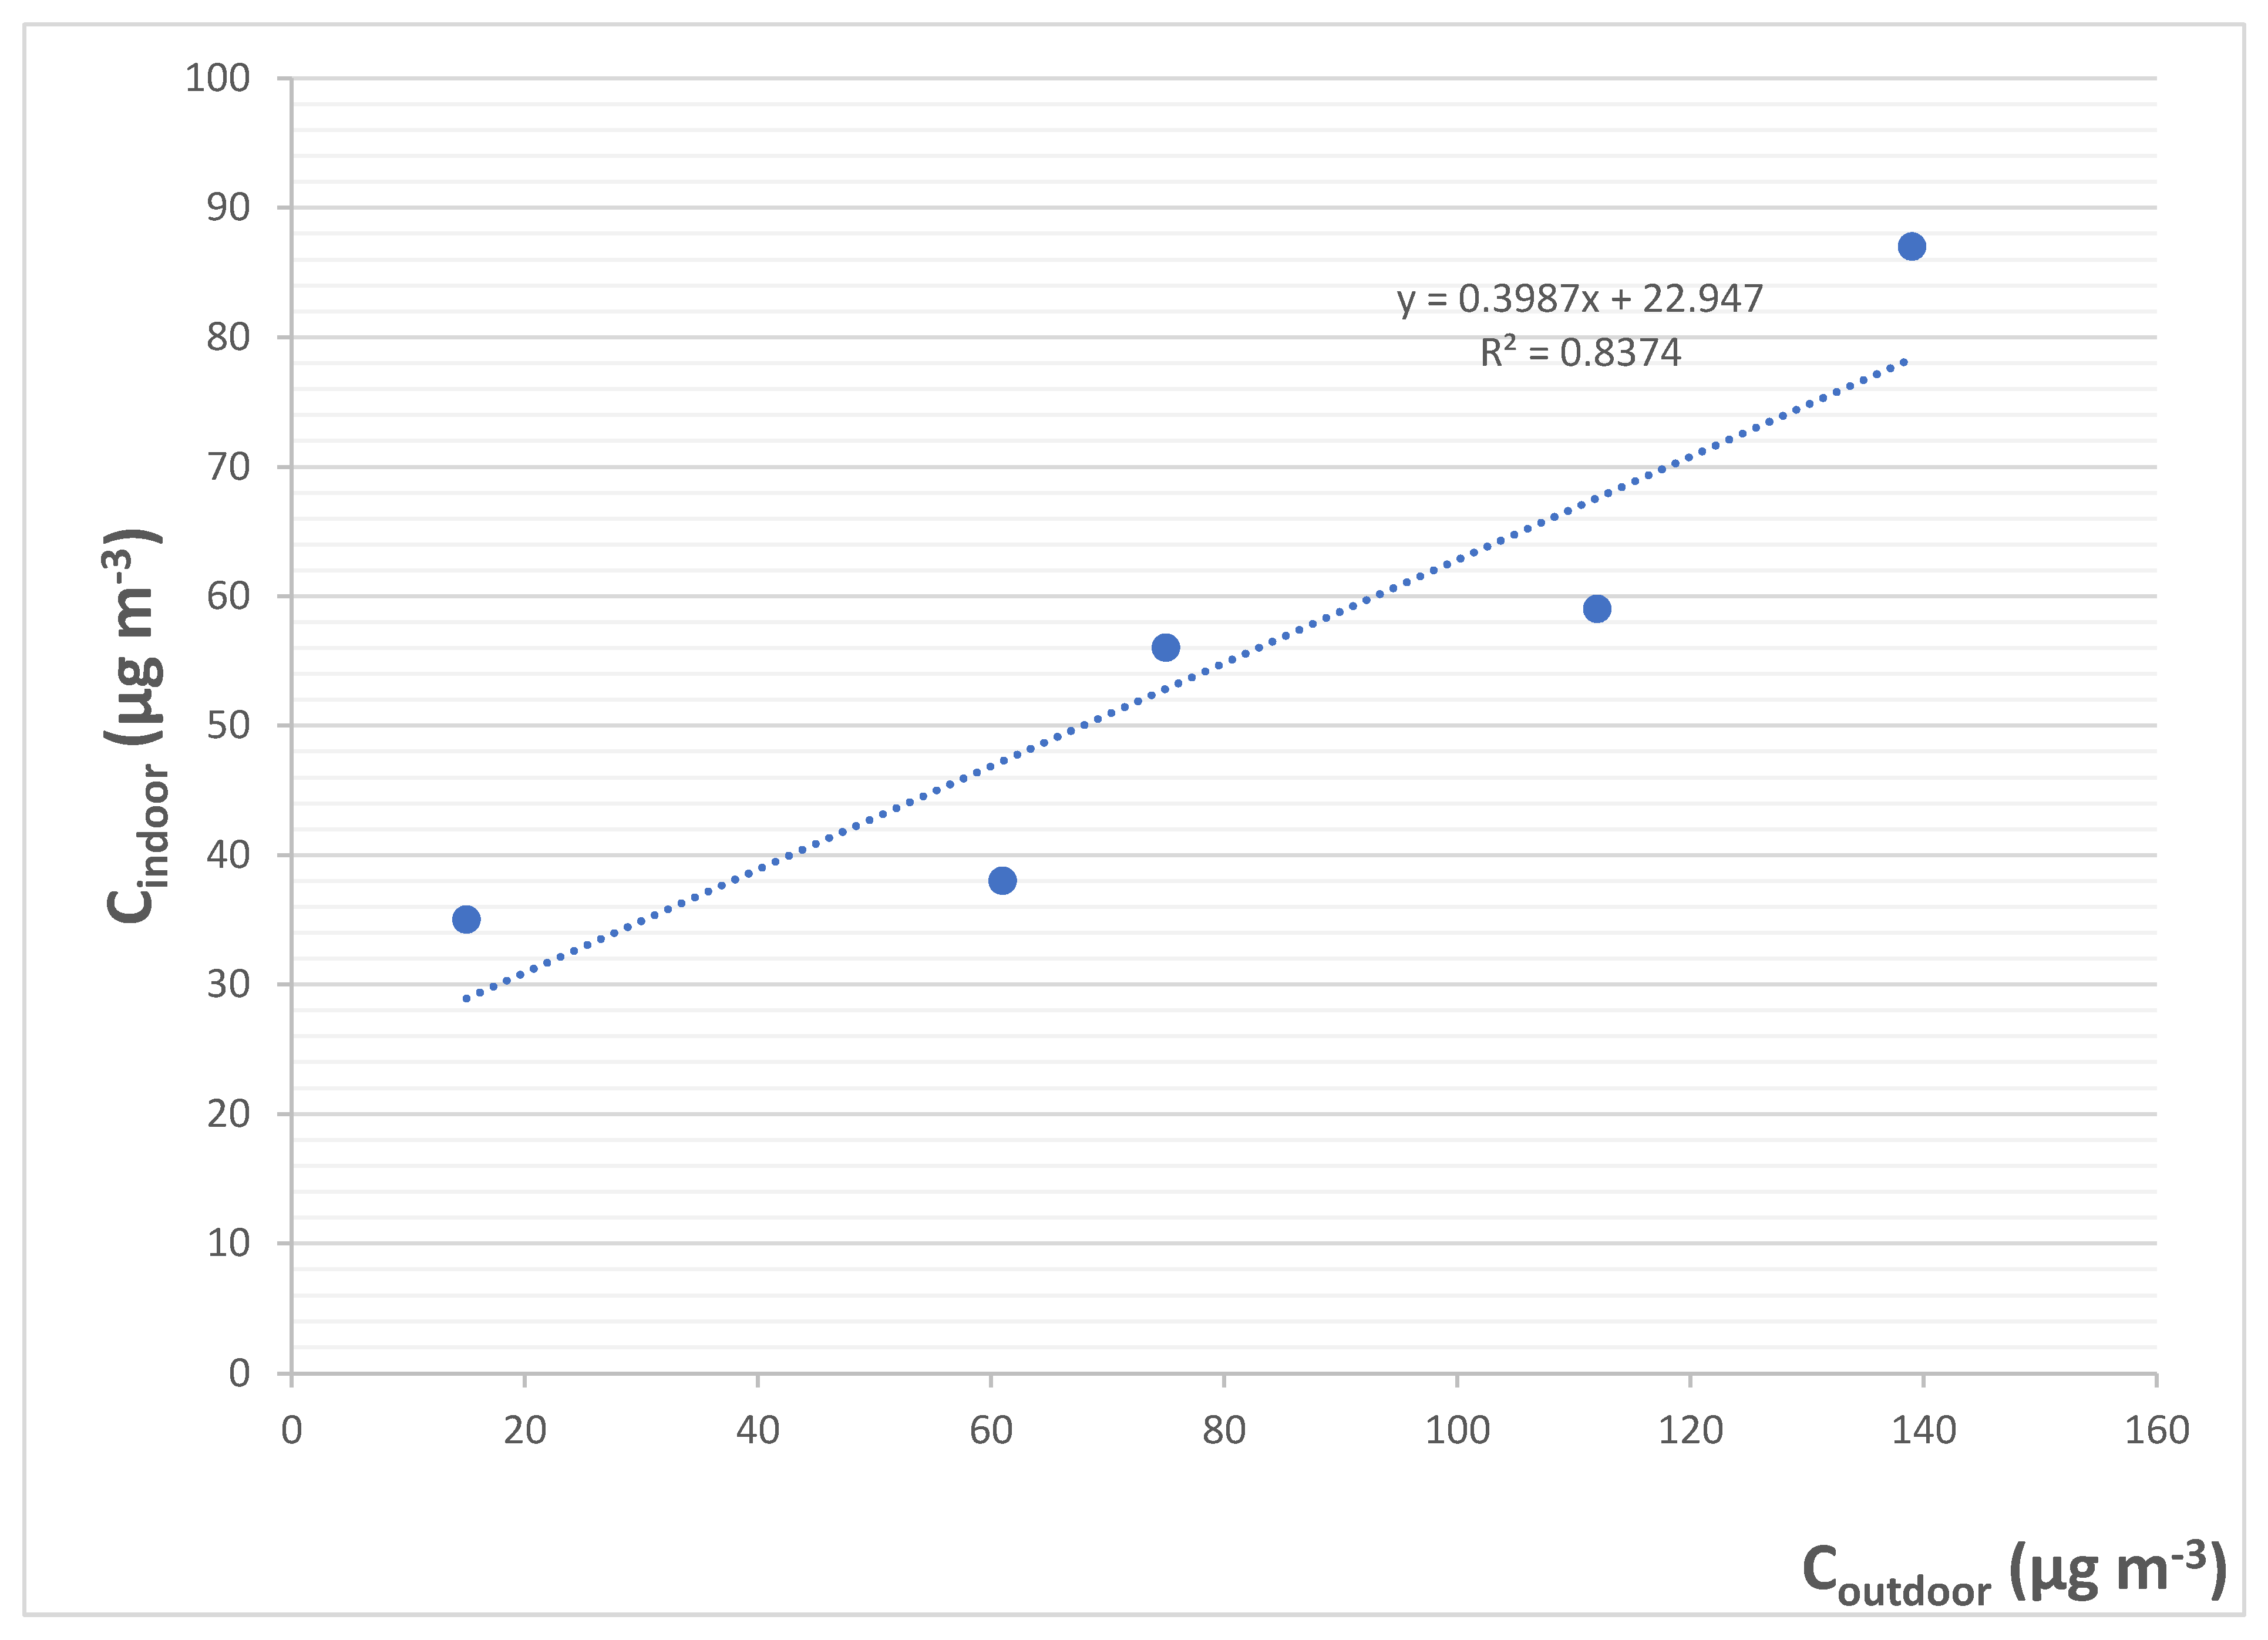
Hoek et al. [27] found that for a residence, ẞ = 5.75 µg m−3 (with standard deviation = 3.91 µg m−3) and α = 0.41 (with standard deviation = 0.06). They obtained this result for PM2.5.
Figure 3 shows such relationship between the concentration of PM4 outdoors and indoors obtained in Katowice for the flats (apartments) without smokers. It can be seen that the coefficient α is almost the same (0.40) indicating that the infiltration intensity is very similar in various towns. The factor describing the indoor pollution sources in Katowice is higher; ẞ = 23 µg m−3, however, it should be noted that this relation was obtained for PM4 (not for PM2.5). Anyway, it can be concluded that the contribution of indoor emission sources in Polish homes to the total concentration indoors is elevated comparing to other European homes. It is confirmed by the analysis of I/O ratio in the single-family houses without ETS (see Table 2 and Table 3). It can be seen that the I/O ratio was higher than one, even in non-ETS single-family houses (see Table 2 and Table 3). We have not investigated the cause of this result, but it is likely that particle emission from small coal stoves, still very common in this type of house, and partly a re-emission of settled dust from the floor, was responsible for this result. For example, from the measurement made in the flat in the old building in Bytom (near Katowice) with the individual coal stove, it was obtained the concentration of PM5 (airborne particles with aerodynamic diameter less or equal to 5 µm) 115 and 73 µg m−3 indoors and outdoors, respectively [25], which means that the I/O ratio was 1.6.
This situation is rapidly changing when tobacco smoke is emitted. Although we carried out a huge number of studies on the relationships between the concentration of airborne particles (TSP, PM10, PM5, PM4, PM2.5) outdoors and indoors, we could find no correlation between the levels in these two environments. What we obtained was only the indoor/outdoor ratio (I/O) higher than 1, which agrees well with all data published over the world. Table 1 shows such data obtained in the apartments/dwellings in Katowice.
Trying to precisely predict the adverse health effect of the specific air pollutant inhaled by the exposed people, it should be clearly stated that the factor responsible for the kind of the effect and its intensity is not the concentration (C) but dose (D) being, as a rule, the mass or amount of absorbed pollutant. Although the idea of the importance of the dose has been formulated unusually slowly [28], it is well known that the received dose (D) of air pollutants depends on the concentration (Ck) of the pollutant in the air in the microenvironment (k), time of exposure to this pollutant in the k-microenvironment (tk), and on the inhalation rate, or generally, the contact rate w. Hence, the dose can be calculated using the simple equation:
The value of tk for the studied population can be estimated using the data presented in Table 4, Table 5 and Table 6.
It is worth noting that the time spent at home by the so-called general population, which is around 52% (see Table 4), has slightly decreased in the last two decades. For example, Pastuszka obtained in the 1996 study that staying at home constituted 60% of the total daily budget of the time of the inhabitants of Upper Silesia [25].
It appears useful to calculate the inhaled dose of airborne respirable particles for a future in-depth analysis of the adverse health effects of inhaling aerosol indoors. We can calculate the total inhalation dose (TID) or the body inhalation dose (BID), i.e., dose of PM4 depending on the weight of the exposed children in the homes. These factors can be defined using Equation (3) as follows:
where:
TID—(Total Inhaled Dose) the total dose of respirable airborne particles (PM4) inhaled during the exposure in homes, µg;
BID—(Body Inhaled Dose) the ratio of the dose of PM4 inhaled during exposure in homes to the body weight of the exposed person, µg kg−1;
w—inhalation rate coefficient, characteristic for selected activity levels, m3 h−1;
t—time of exposure in home, h;
BW—mean body weight, kg.
According to the USEPA analysis [29], for teenagers aged 11–15 years, we selected the w value for the averaged intensity state as 2.9 m3 h−1.
The estimated mean body weight (BW) of children living in the tested homes was between 54 and 62 kg, hence, we assumed the dose calculation of BWav = 58 kg. The result of these calculations is presented in Table 7. These data show the following:
- –
- In buildings without ETS, children aged 14–15 absorb about 2.2–2.7 mg of PM4 every day.
- –
- Children living in homes with smokers absorb from 2.5 to 6.5 mg of PM4 more per day than their peers living in non-ETS homes.
- –
- The BID indicator ranges from about 40 µg kg−1 in buildings without an ETS to over 150 µg kg−1 in buildings with an ETS.
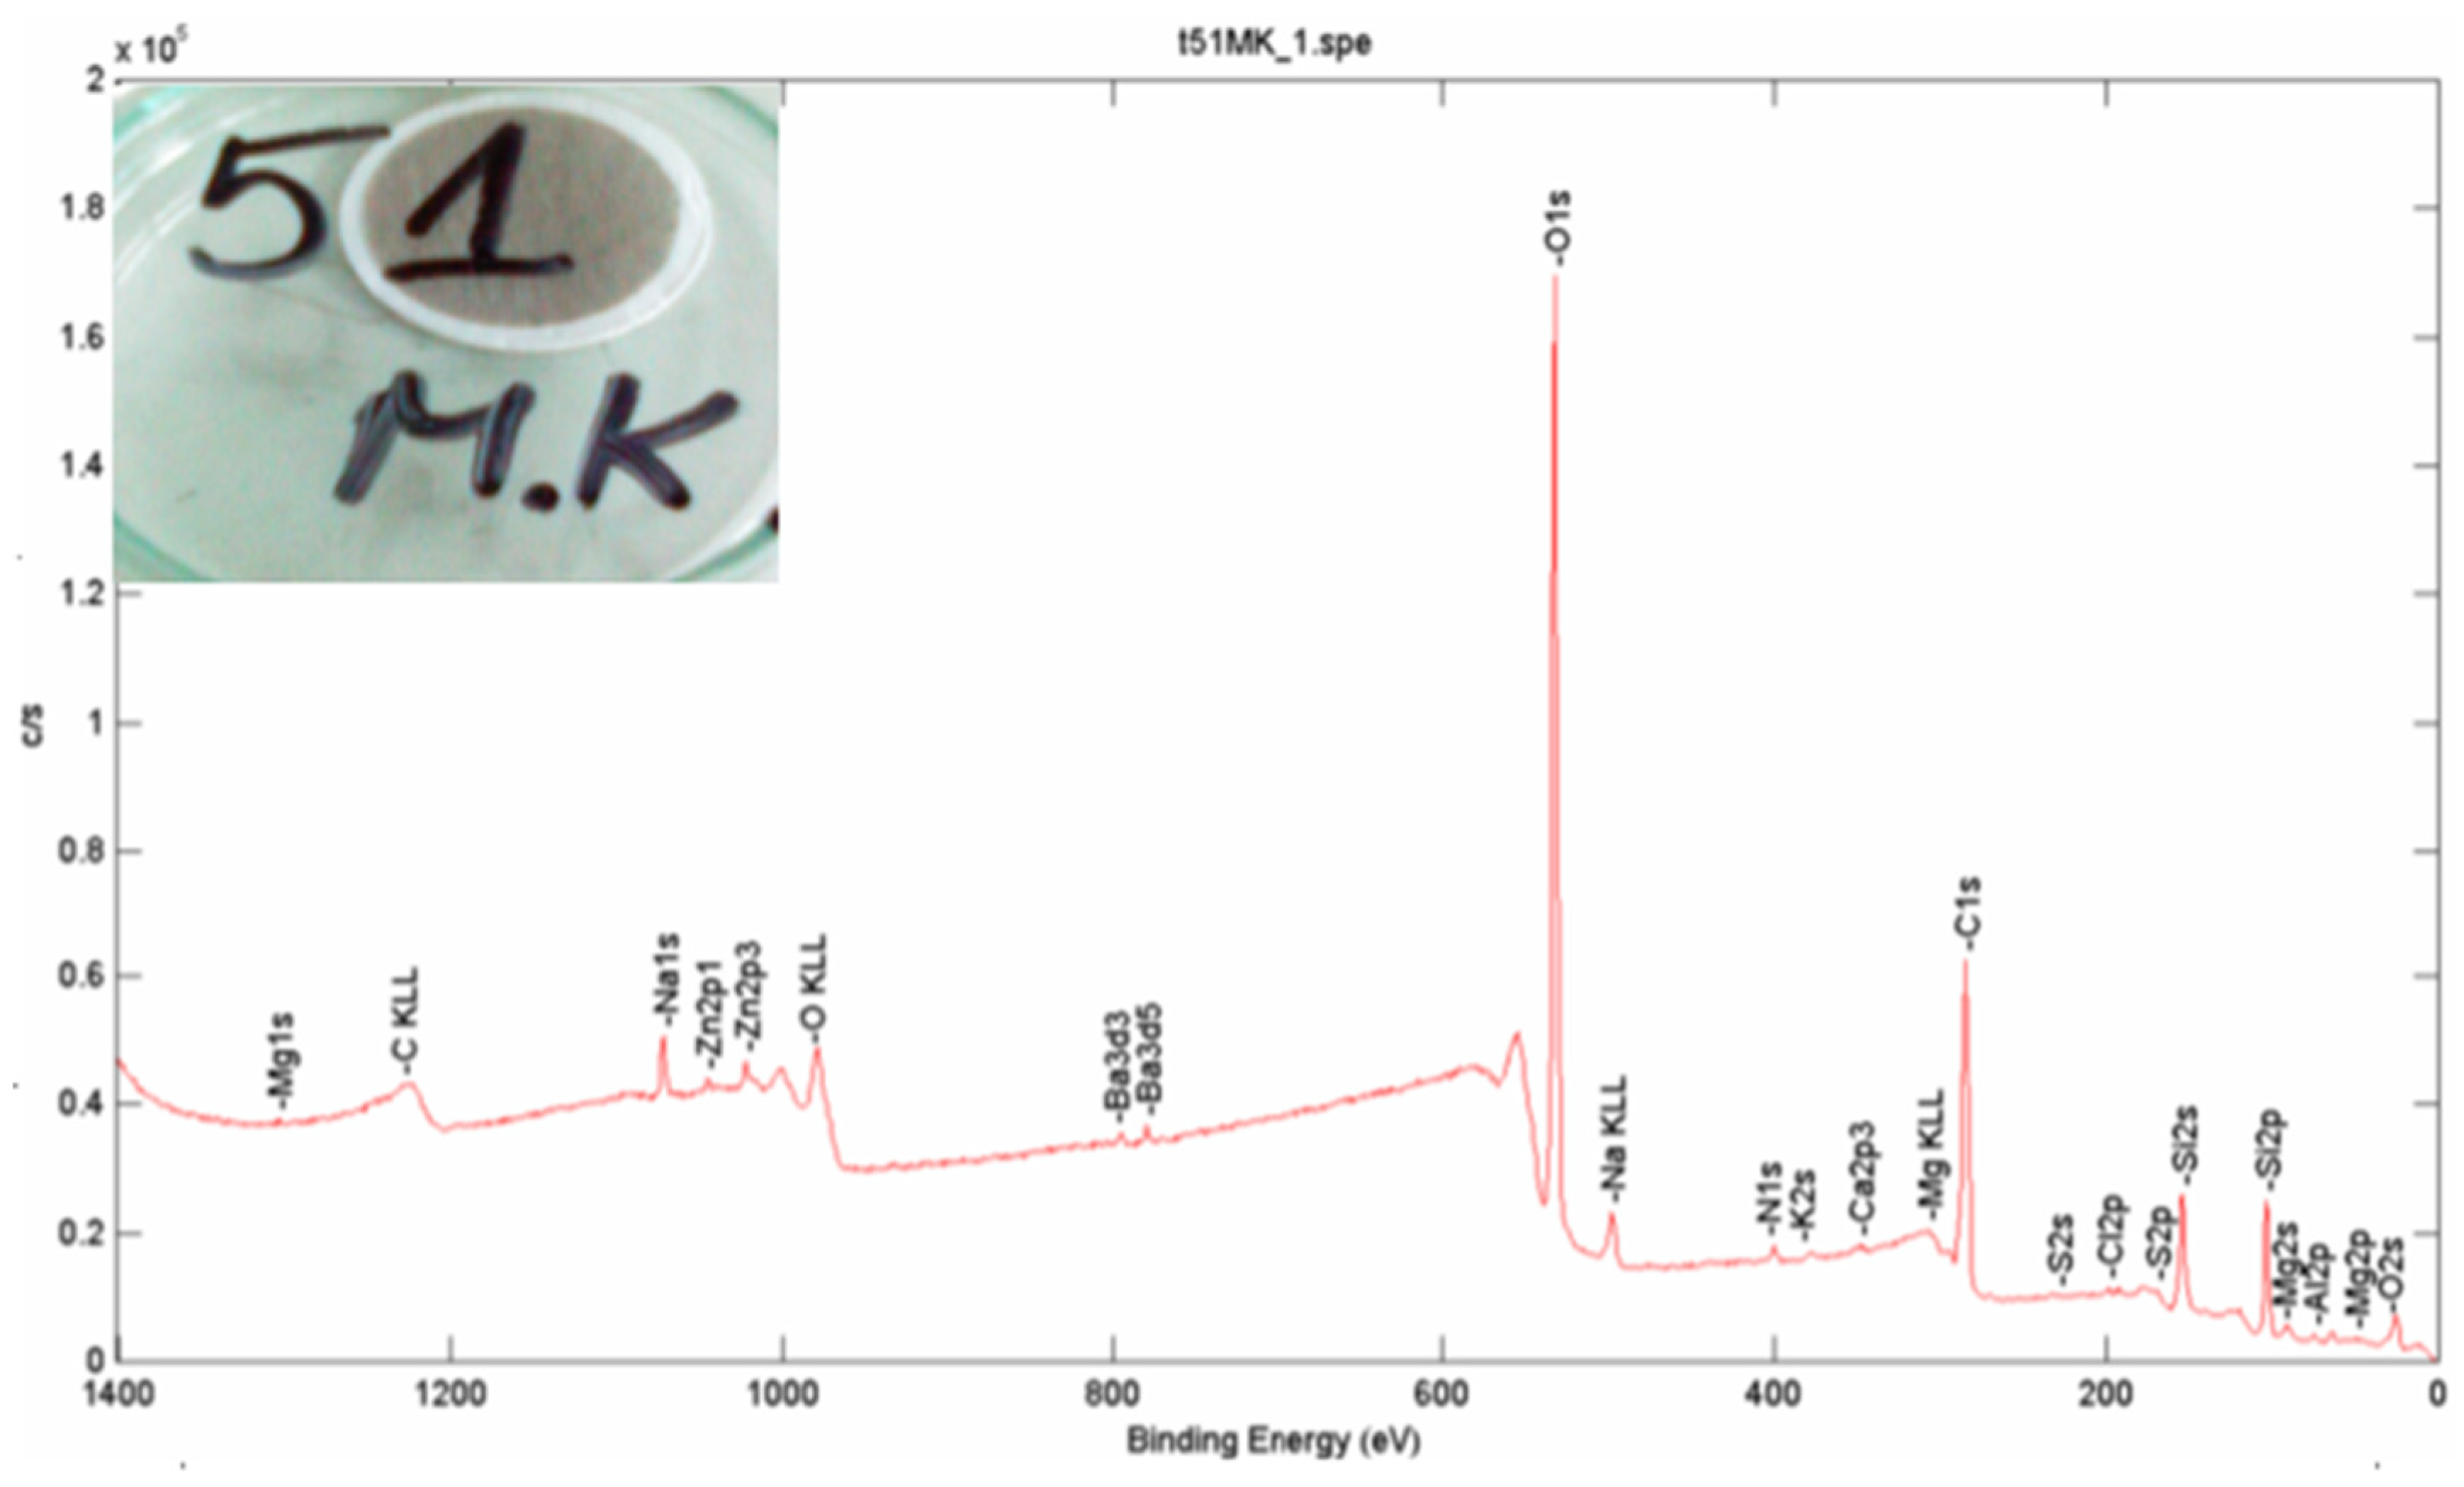
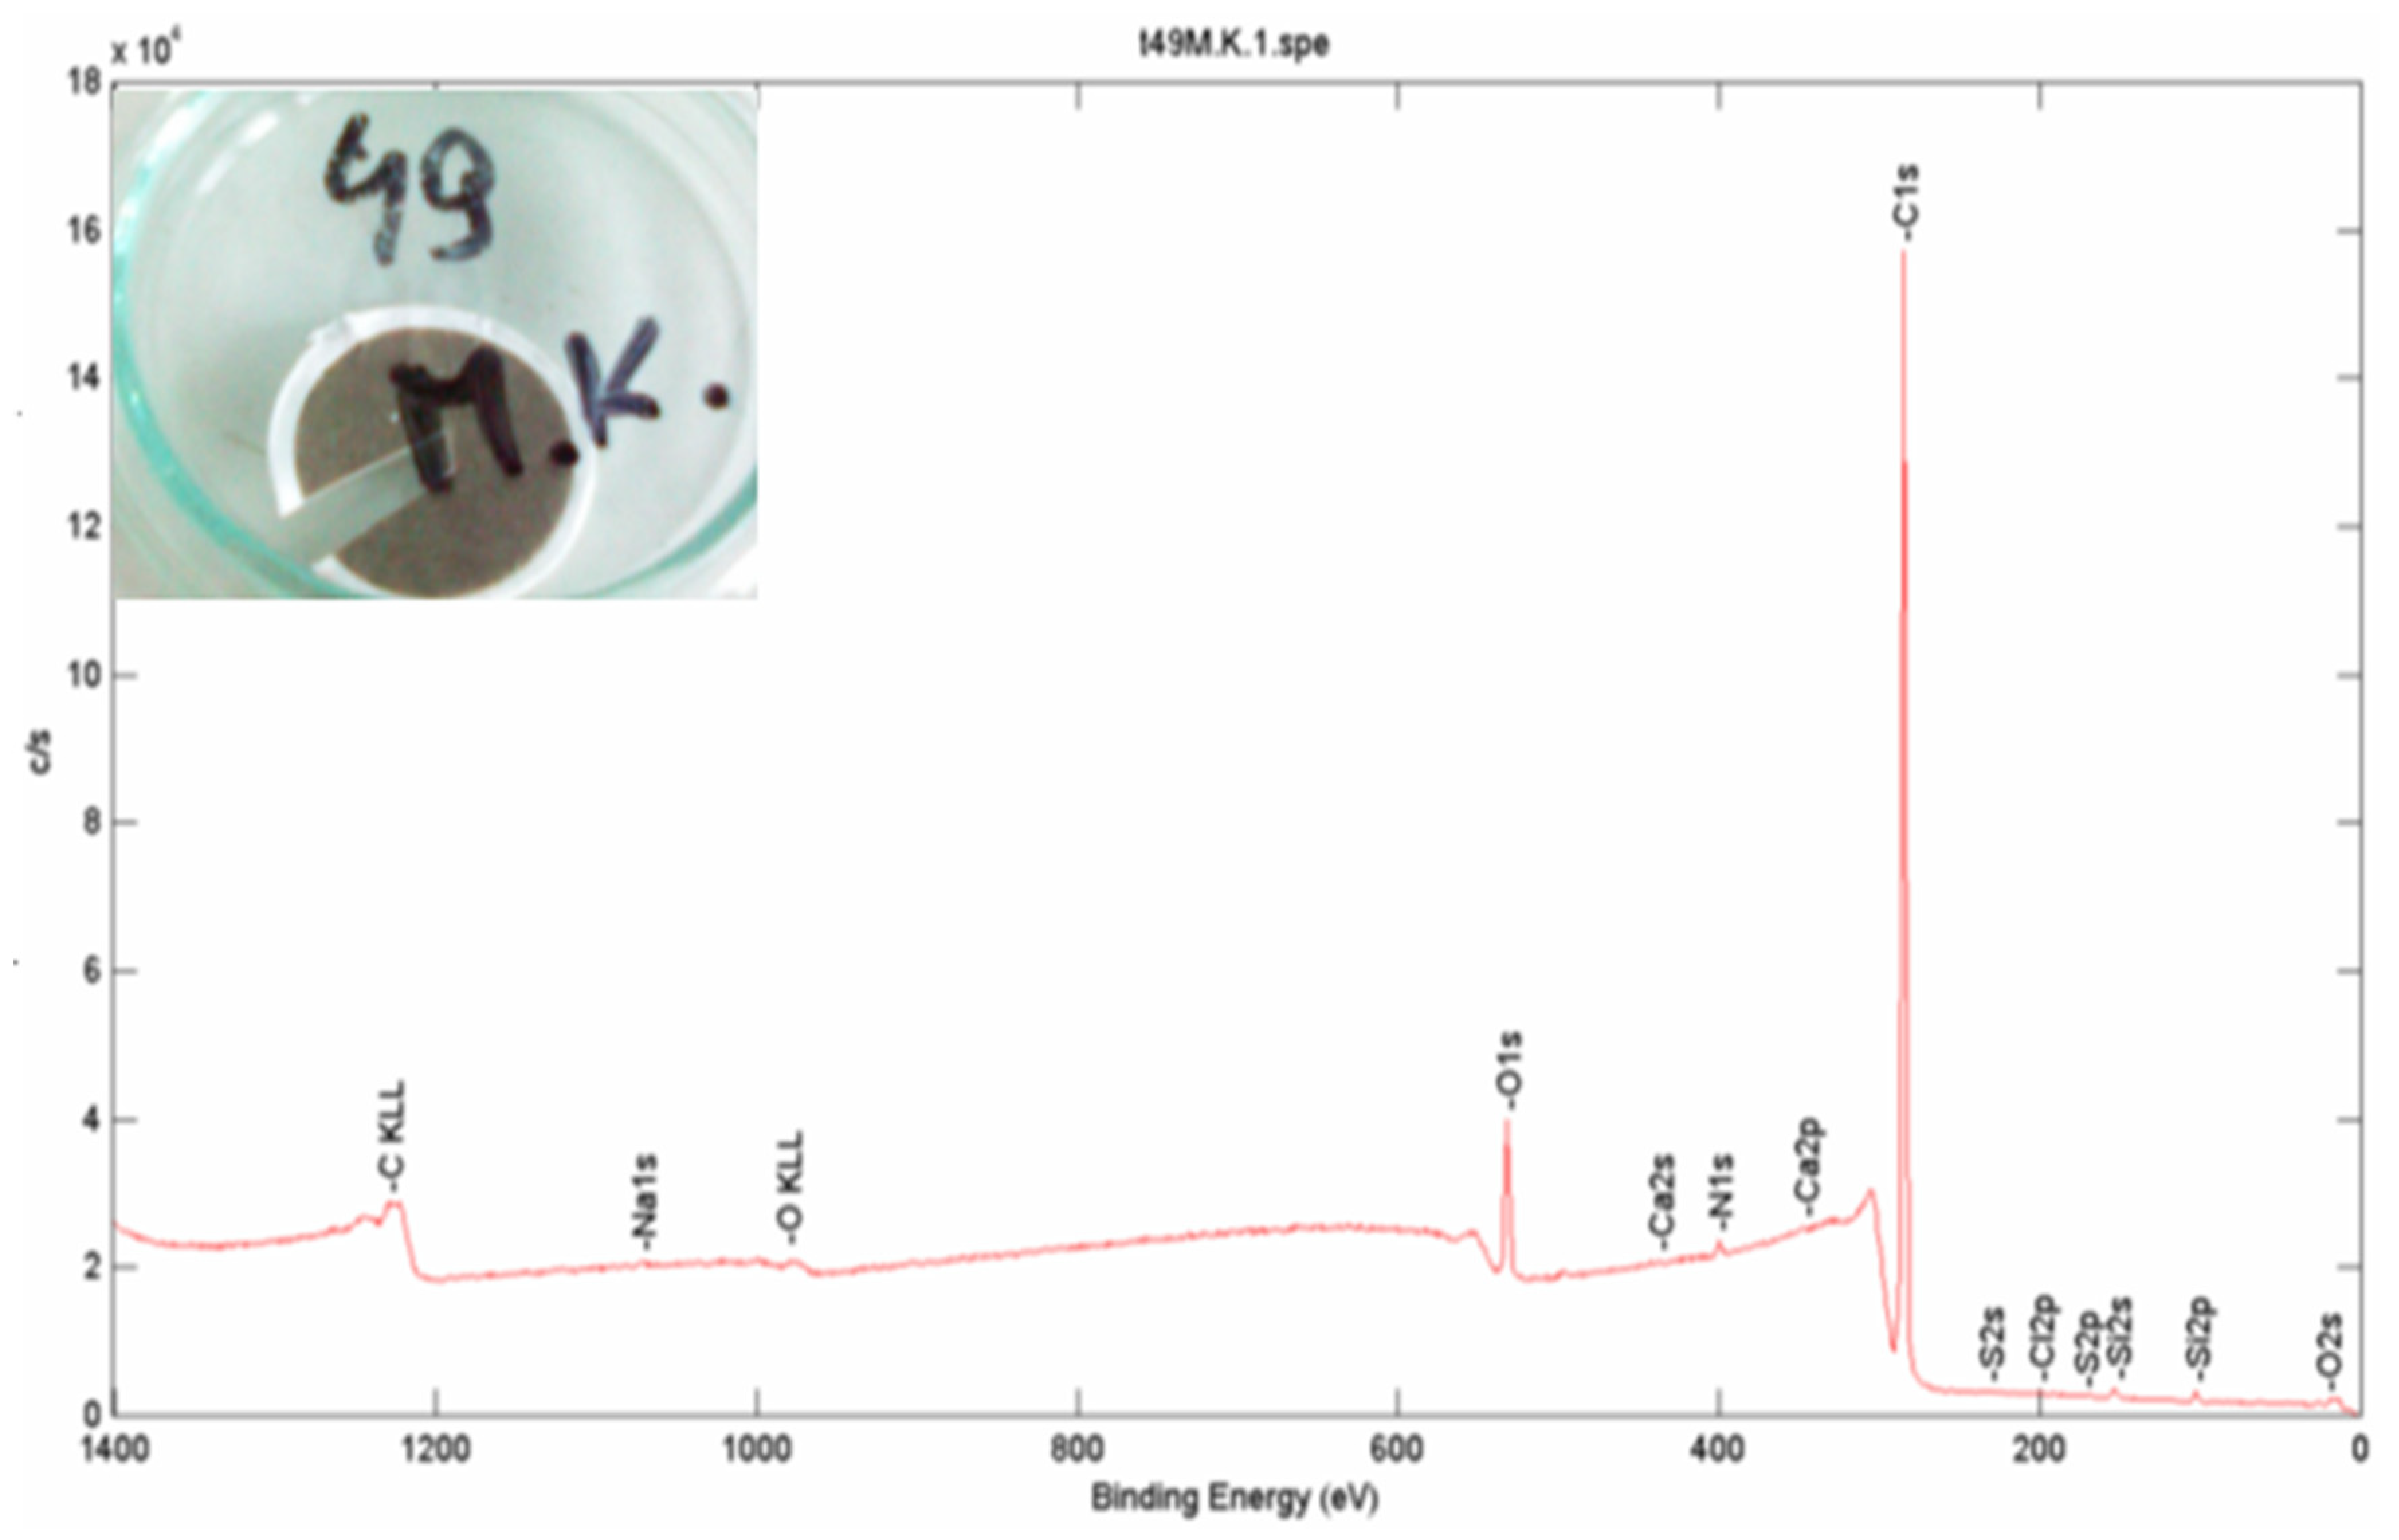
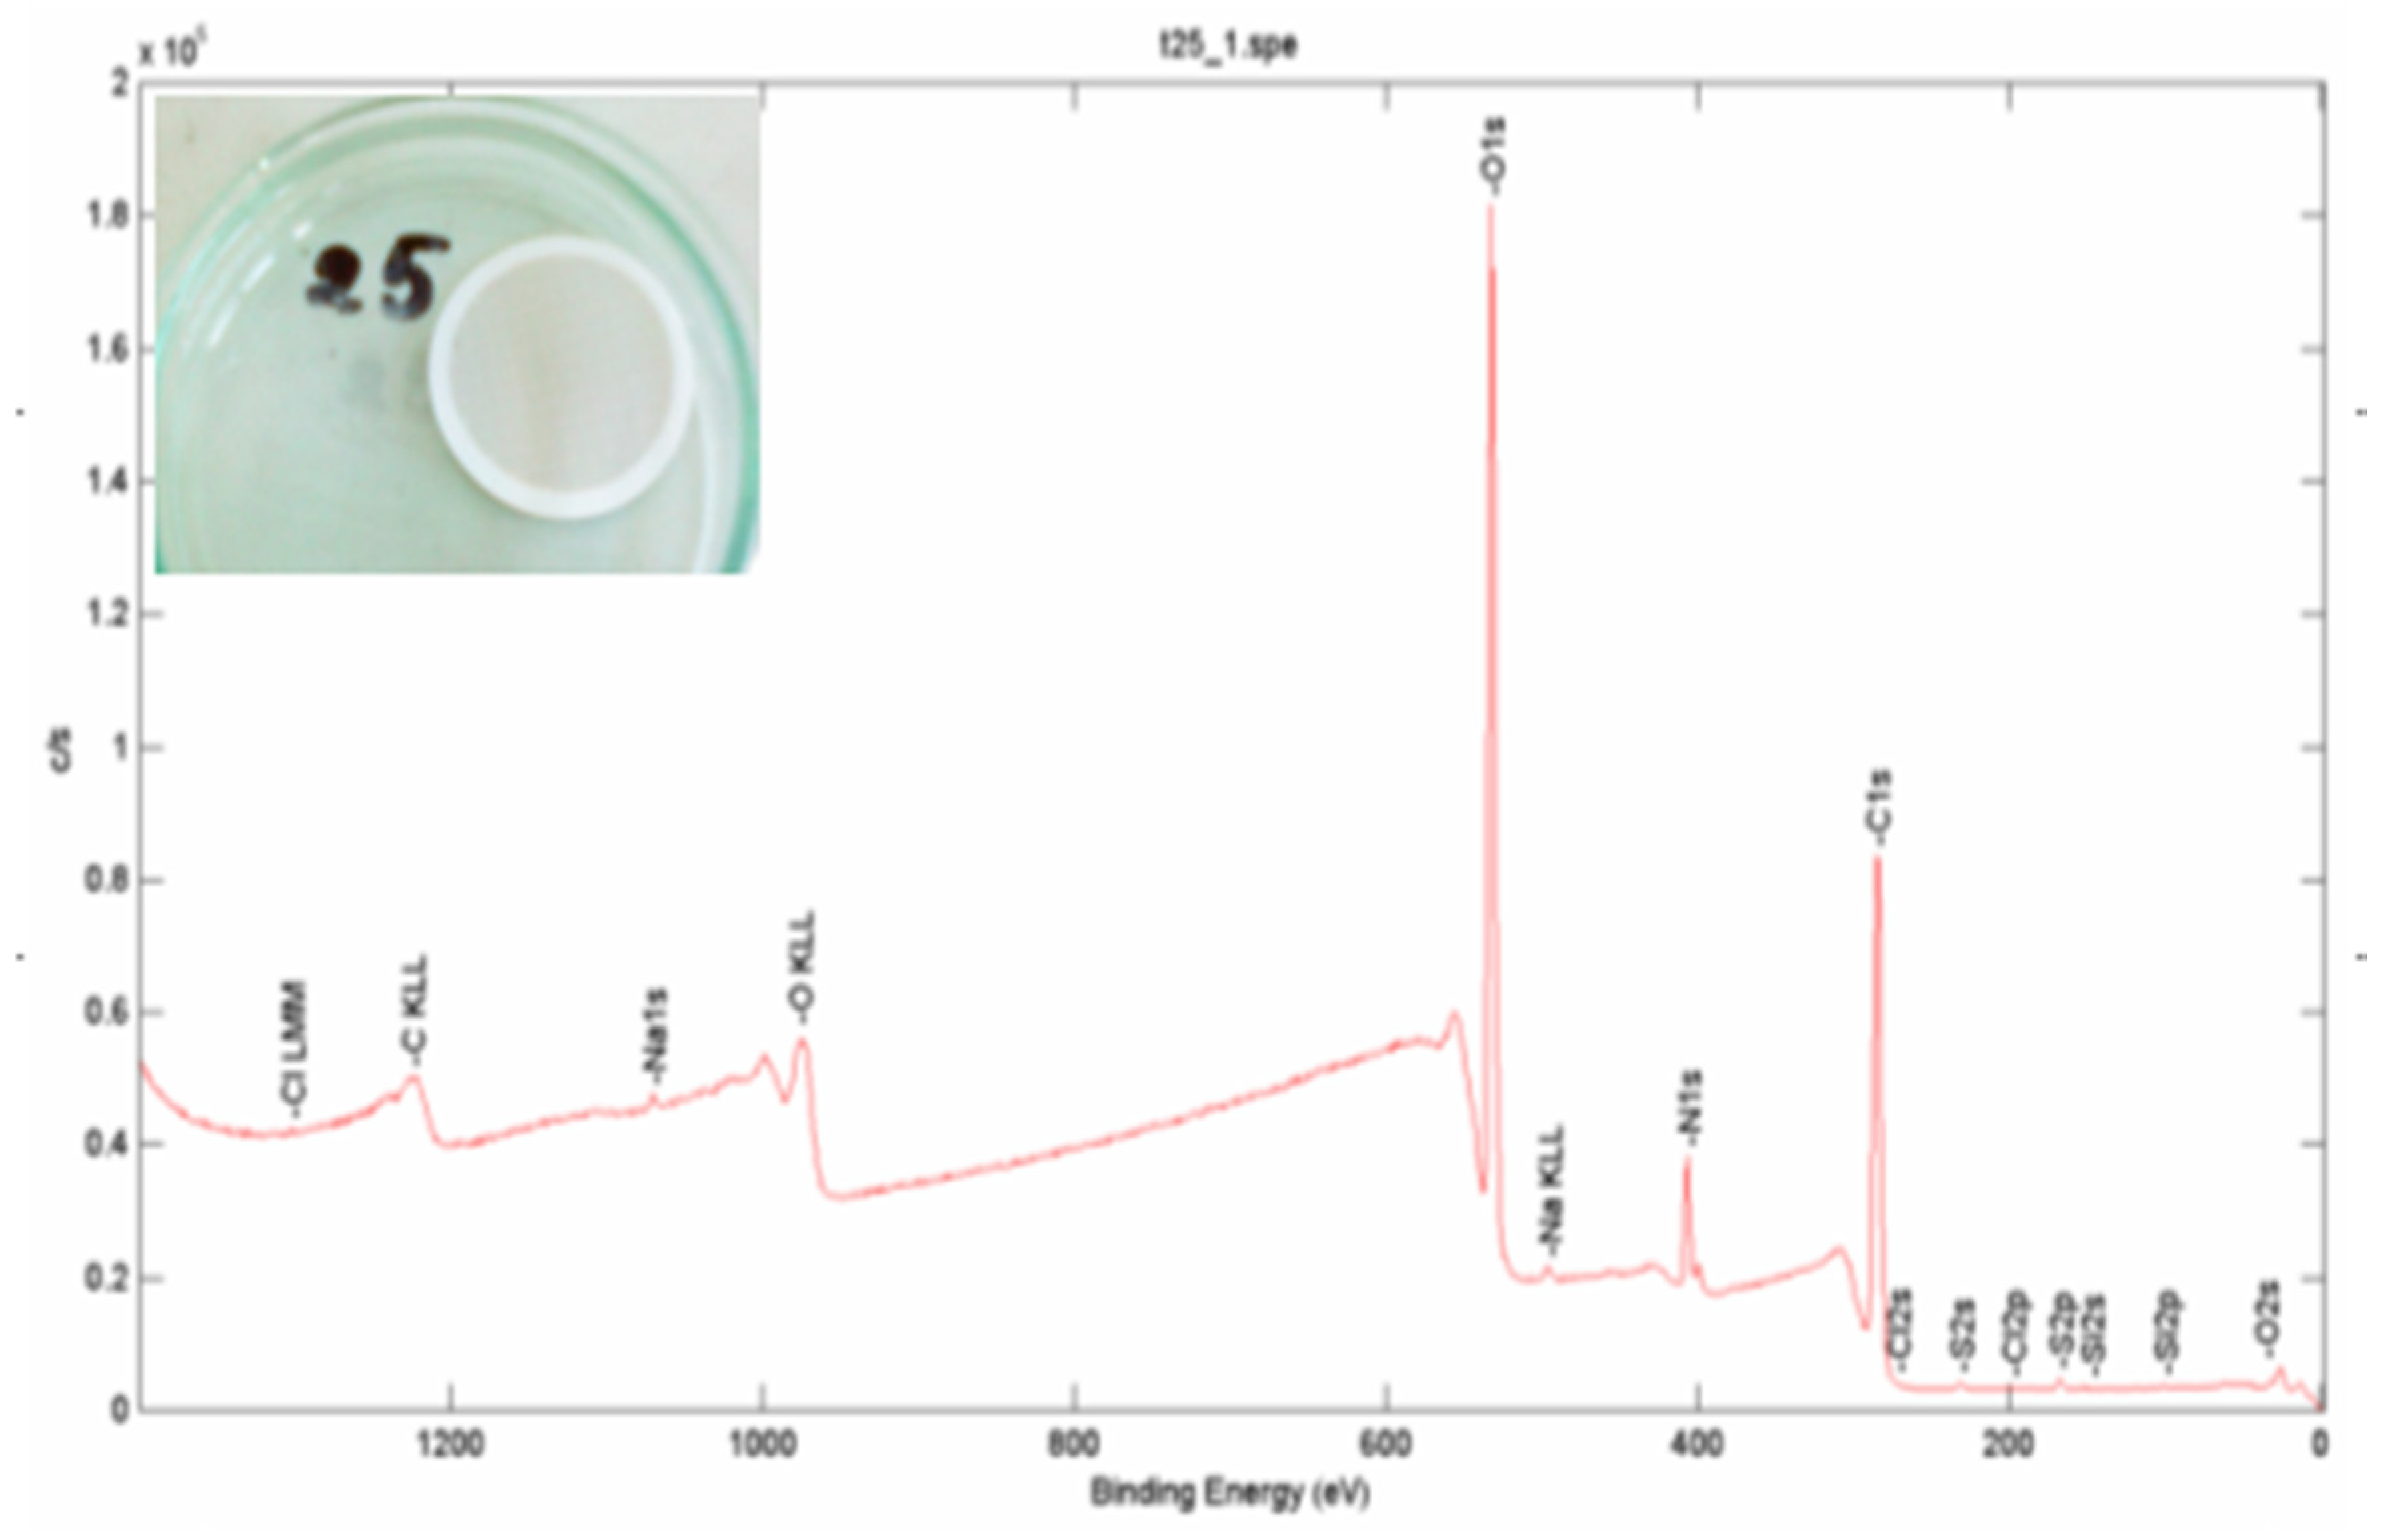
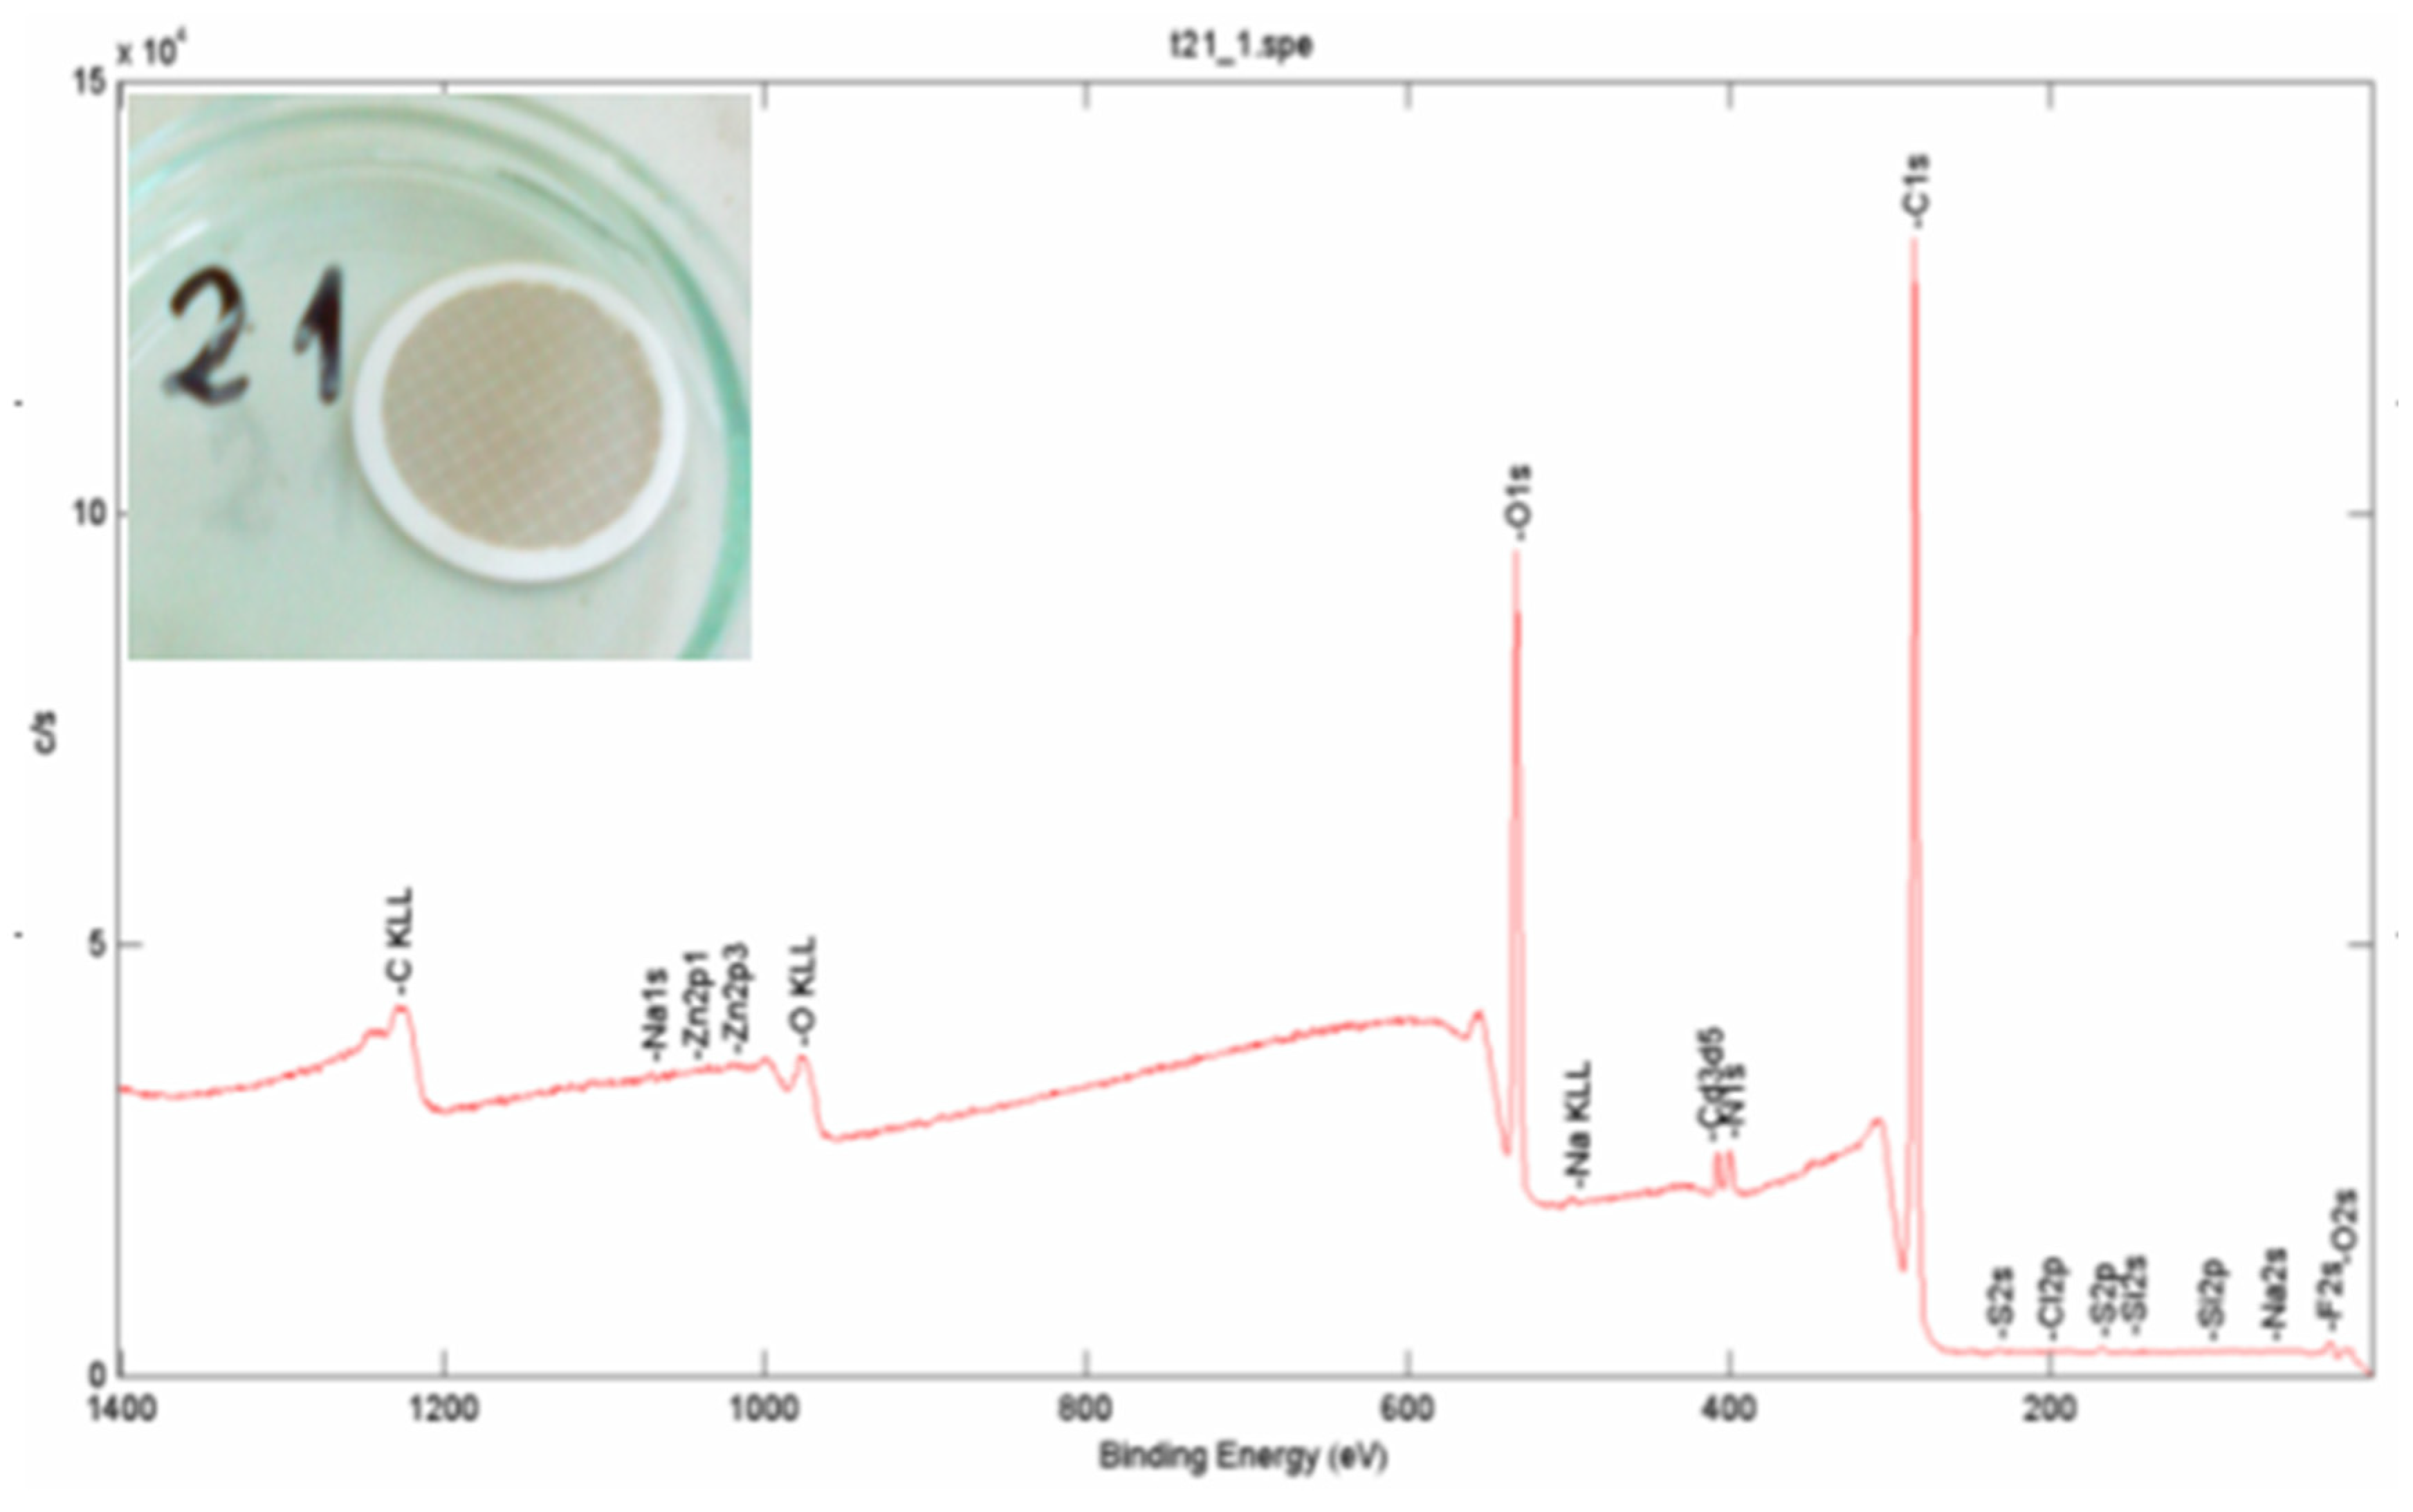
Examples of the XPS spectra for the studied indoor aerosol (PM4) are shown in Figure 4, Figure 5, Figure 6 and Figure 7. Before the detailed analysis of these data, it should be noted that XPS yields information on the particle surface rather than the average composition of the whole particles. An important limitation is also the loss of volatile species under UHV conditions, partially organic species from soot [30]. As shown in these figures, the spectra indicate strong peaks of carbon and oxygen, which generally is a typical picture for urban aerosol [31,32,33]. It can be seen that the surface layer of PM4 from the homes with ETS contains significantly more carbon and less oxygen than the airborne particles collected in the homes without smokers, which can be explained by the high emission of carbon during tobacco smoking. The analysis of the all XPS spectra confirmed that carbon and oxygen clearly dominated on the surface of the tested aerosol particles, with carbon being the largest single surface component. Its value ranged from 44 to 48% of the atomic mass of PM4 in non-ETS homes and increased to 74–79% in homes with smokers.
Although we can state that the carbon- and oxygen-containing species dominated on the surface of the tested particles, trace elements were also present there: Si, N, S, Na, Al, Zn, Cl, and K. Probably, the source of these elements is the surrounding environment as well as tobacco contaminated with plant protection products used in crops.
It should be noted that although carbon is non-toxic, its presence on the surface of airborne particles, especially of elemental carbon, attracts various toxic and carcinogenic gases present in the polluted air, which then deposit on the surface of the dust particles. This phenomenon can quickly make these particles dangerous to human health.
Our study indicates that the advanced monitoring of people exposed to tobacco smoke should be continued. However, in future studies of exposure, it would be important to utilize markers for PM, such as nicotelline, as well as gas-phase markers such as nicotine. Both phases contain numerous toxic substances, and of particular concern in the particle phase are the highly carcinogenic, tobacco-specific nitrosamines [34].
4. Conclusions
To our knowledge, this is the first study in Poland that has investigated the level of PM4 in the indoor air polluted by environmental tobacco smoke (ETS).
It was found that the infiltration intensity of airborne particles from outdoors into indoors in the studied homes was very similar to the results obtained in different European countries. However, the contribution of indoor emission sources (excluding tobacco smoking) in Polish homes to the total concentration of respirable particles indoors was elevated compared to other European homes.
The average concentration of PM4 inside the homes with ETS was between 126 µg m−3 (in Jaworzno) and 208 µg m−3 (in Katowice)—significantly higher than in the homes without smokers (55–65 µg m−3). The mean I/O ratios for PM4 varied greatly, ranging from 0.6 in the apartments without smokers in Katowice to 5.2 in the homes with smokers in Jaworzno.
The indoor air highly polluted by ETS causes children aged 14–15 living in these homes to inhale from 2.5 to 6.5 mg of PM4 more per day than their peers living in non-ETS homes.
The surface layer of PM4 from the homes with ETS contains significantly more carbon and less oxygen than the airborne particles collected in the homes without smokers, which can be explained by the high emission of carbon during tobacco smoking. It should be noted that carbon present on the surface of airborne particles can attract various toxic and carcinogenic gases present in the polluted air and make these particles more dangerous for human health.
5. Recommendation
In the course of our research, we found that in Poland, the exposure of non-smokers, especially children and teenagers to tobacco smoke in their homes, is still very serious and does not seem to be improving any time soon. To change this, it would be necessary to conduct a broad and multi-faceted campaign to make parents aware of the problem of the ETS. Our observations show that although awareness of the risk of smoking in Polish families is currently quite high (but smokers are consciously ready to take the risk), the importance of ETS is often underestimated.
Author Contributions
J.S.P. prepared the plan of the study, performed some experiments, and calculated the inhaled dose of PM4, as well as prepared the draft and final manuscript. E.T. and J.P.-P. carried out the XPS laboratory analysis of the selected samples of PM4. All authors have read and agreed to the published version of the manuscript.
Funding
This research received no external funding.
Institutional Review Board Statement
Not applicable.
Informed Consent Statement
Not applicable.
Data Availability Statement
Not applicable.
Acknowledgments
This work was partially supported by the Faculty of Power and Environmental Engineering, Silesian University of Technology (statutory research). The authors are very grateful to MS students Maja Klockowska and Jan Maroszek for help with the sampling and determination of the concentration of PM4 in the studied homes and Edyta Stępień for her testing the daily time budget of the general population of Piekary Śląskie.
Conflicts of Interest
The authors declare no conflict of interest.
References
- Benson, F.B.; Henderson, J.J.; Caldwell, D.E. Indoor-Outdoor Air Pollution Relationships: A Literature Review; U.S. Environmental Protection Agency: Washington, DC, USA, 1972. [Google Scholar]
- Li, C.S. Relationships of indoor/outdoor inhalable and respirable particles in domestic environments. Sci. Total Environ. 1994, 151, 205–211. [Google Scholar] [CrossRef]
- Shilton, V. Airborne particulate matter: Indoor outdoor relationship and personal exposure. Aerosol Soc. Newsl. 2000, 37, 6–8. [Google Scholar]
- Chen, C.; Zhao, B. Review of relationship between indoor and outdoor particles: I/O ratio, infiltration factor and penetration factor. Atmos. Environ. 2011, 45, 275–288. [Google Scholar] [CrossRef]
- Braun, M.; Koger, F.; Klingelhöfer, D.; Müller, R.; Groneberg, D.A. Particulate matter emission of four different cigarette types of one popular brand: Influence of tobacco strength and additives. Int. J. Environ. Res. Public Health 2019, 16, 263. [Google Scholar] [CrossRef] [Green Version]
- Ni, Y.; Shi, G.; Qu, J. Indoor PM2.5, tobacco smoking and chronic lung diseases: A narrative review. Environ. Res. 2020, 181, 108910. [Google Scholar] [CrossRef]
- Obore, N.; Kawuki, J.; Guan, J.; Papabathini, S.S.; Wang, L. Association between indoor air pollution, tobacco smoke and tuberculosis: An updated systematic review and meta-analysis. Public Health 2020, 187, 24–35. [Google Scholar] [CrossRef]
- Ng, M.; Freeman, M.K.; Fleming, T.D.; Robinson, M.; Dwyer-Lindgren, L.; Thomson, B.; Wollum, A.; Sanman, E.; Wulf, S.; Lopez, A.D.; et al. Smoking prevalence and cigarette consumption in 187 countries, 1980–2012. JAMA 2014, 311, 183. [Google Scholar] [CrossRef] [PubMed] [Green Version]
- Beaglehole, R.; Bonita, R.; Yach, D.; Mackay, J.; Reddy, K.S. A tobacco-free world: A call to action to phase out the sale of tobacco products by 2040. Lancet 2015, 385, 1011–1018. [Google Scholar] [CrossRef]
- World-Lung-Foundation. The Tobacco Atlas: Consumption. 2015. Available online: https://tobaccoatlas.org/topic/consumption/ (accessed on 30 September 2018).
- Canadian Centre for Occupational Health and Safety. Report. 2021. Available online: https://www.ccohs.ca/oshanswers/psychosocial/ets_health.html (accessed on 5 October 2021).
- Regional Report for 2020; Annual Air Quality Assessment in the Silesian Region/Voivodeship; Regionalny Wydział Monitoringu Środowiska w Katowicach: Katowice, Poland, 2021; Available online: https://www.archiwum.cieszyn.pl/mczk/attachments/article/87/WCZK%202021.04.15.pdf (accessed on 24 November 2021). (In Polish)
- Forecasts of air pollution in the Silesian Voivodeship, Katowice, Poland. 2021. Available online: http://powietrze.gios.gov.pl/pjp/airPollution?woj=slaskie (accessed on 5 October 2021).
- Rogula-Kozłowska, W.; Pastuszka, J.S.; Talik, E. Influence of vehicular traffic on concentration and particle surface composition of PM10 and PM2.5 in Zabrze, Poland. Pol. J. Environ. Stud. 2008, 17, 539–548. [Google Scholar]
- Pastuszka, J.S.; Rogula-Kozlowska, W.; Zajusz-Zubek, E. Characterization of PM10 and PM2.5 and associated heavy metals at the crossroads and urban background site in Zabrze, Upper Silesia, Poland, during the smog episodes. Environ. Monit. Asses. 2010, 168, 613–627. [Google Scholar] [CrossRef] [PubMed]
- Kozielska, B.; Rogula-Kozłowska, W.; Pastuszka, J.S. Traffic emission effects on ambient air pollution by PM2.5-related PAH in Upper Silesia, Poland. Int. J. Environ. Pollut. 2013, 53, 245–264. [Google Scholar] [CrossRef]
- Kobza, J.; Pastuszka, J.S.; Gulis, G. Consideration on the health risk reduction related to attainment of the new particulate matter standards in Poland: A top-down policy risk assessment approach. Int. J. Occup. Med. Environ. Health 2016, 29, 1–14. [Google Scholar] [CrossRef] [PubMed]
- Chudzik, R.; Rybojad, P.; Jarosz-Chudzik, K.; Sawicki, M.; Rybojad, B.; Panasiuk, L. Air pollution: How many cigarettes does each Pole smoke every year and how does it influence health, with special respect to lung cancer? Agric. Environ. Med. 2019, 26, 566–571. [Google Scholar] [CrossRef] [PubMed]
- Sussman, R.A.; Golberstein, E.; Polosa, R. Aerial transmission of the SARS-CoV-2 virus through environmental e-cigarette aerosols: Implication for public health. Int. J. Environ. Public Health 2021, 18, 1437. [Google Scholar] [CrossRef]
- Grundy, E.J.; Suddek, T.; Filippidis, F.T.; Majeed, A.; Coronini-Cronberg, S. Smoking, SARS-CoV-2 and COVID-19: A review of reviews considering implications for public health policy and practice. Tob. Induc. Dis. 2020, 18, 58. [Google Scholar] [CrossRef]
- Osinibi, M.; Gupta, A.; Harman, K.; Bossley, C.J. Passive tobacco smoke in children and young people during the COVID-19 pandemic. Lancet Resp. Med. 2021, 9, 693–694. [Google Scholar] [CrossRef]
- Schiliro, M.; Voge, E.R.; Paolini, L.; Pabelick, C.M. Cigarette smoke exposure, pediatric lung disease, and COVID-19. Front. Physiol. 2021, 12, 652198. [Google Scholar] [CrossRef]
- Adar, S.A.; Filigrana, P.A.; Clements, N.; Peel, J.L. Ambient coarse particulate matter and human health: A systematic review and meta-analysis. Curr. Environ Health Rep. 2014, 1, 258–274. [Google Scholar] [CrossRef] [Green Version]
- Moulder, J.E.; Stickle, W.F.; Sobol, P.E.; Bomben, K.D. Handbook of X-Ray Photoelectron Spectroscopy; Physical Electronics, Inc.: Chanhassen, MN, USA, 1995. [Google Scholar]
- Pastuszka, J.S. Exposure of the General Population Living in the Upper Silesia Industrial Zone to the Particulate, Fibrous, and Biological (Bacteria and Fungi) Aerosols; Monograph No. 40; Wrocław University of Technology: Wrocław, Poland, 2021. (In Polish) [Google Scholar]
- Dias, D.; Tchepel, O. Modeling of human exposure to air pollution in the urban environment: A GPS-based approached. Environ. Sci. Pollut. Res. 2014, 21, 3558–3571. [Google Scholar] [CrossRef] [PubMed]
- Hoek, G.; Beelen, R.; de Hoogh, K.; Vienneau, D.; Gulliver, J.; Fischer, P.; Briggs, D. A review of land-use regression models to assess spatial variation of outdoor air pollution. Atmos. Environ. 2008, 42, 7561–7578. [Google Scholar] [CrossRef]
- Pastuszka, J.S. Dose-effect and dose-risk relationships as the tools for the quantitative description of the adverse health effects of inhaled pollutants: Chances and limitation. In Synergic Influence of Gaseous, Particulate, and Biological Pollutants on Human Health; Pastuszka, J.S., Ed.; CRC Press, Taylor & Francis Group: Boca Raton, FL, USA, 2016; pp. 226–243. [Google Scholar]
- U.S. EPA. Exposure Factors Handbook, 2011 ed.; U.S. Environmental Protection Agency: Washington, DC, USA, 2011; Volume EPA/600/R, EPA/600/R-090/052F. Available online: https://cfpub.epa.gov/ncea/risk/recordisplay.cfm?deid=236252 (accessed on 24 November 2021).
- Hutton, B.M.; Williams, D.E. Assessment of X-ray photoelectron spectroscopy for analysis of particle pollutants in urban air. Analyst 2000, 125, 1703–1706. [Google Scholar] [CrossRef]
- Wawros, A.; Talik, E.; Pastuszka, J.S. Investigations of aerosols from Swietochlowice, Pszczyna and Kielce by XPS method. J. Alloys Compd. 2001, 328, 171–174. [Google Scholar] [CrossRef]
- Wawroś, A.; Talik, E.; Pastuszka, J.S. Investigation of winter atmospheric aerosol particles in downtown Katowice using XPS and SEM. Microsc. Microanal. 2003, 9, 349–358. [Google Scholar] [CrossRef] [PubMed]
- Pastuszka, J.S.; Wawroś, A.; Talik, E.; Paw, U.K.T. Optical and chemical characteristics of the atmospheric aerosol in four towns in southern Poland. Sci. Total Environ. 2003, 309, 237–251. [Google Scholar] [CrossRef]
- Aquilina, N.J.; Havel, C.M.; Cheung, P.; Harrison, R.M.; Ho, K.-F.; Benowitz, N.L.; Jacob, P., III. Ubiquitous atmospheric contamination by tobacco smoke: Nicotine and a new marker for tobacco smoke-derived particulate matter, nicotelline. Environ. Int. 2021, 150, 106417. [Google Scholar] [CrossRef] [PubMed]
Figure 1.
Location of Międzyrzecze (a) and the studied houses (b). Sources: Google.

Figure 2.
Photo of the SKC sampler with a head equipped with a cyclone with a cut-off diameter of 4 µm while measuring the concentration of airborne particles in one of the reference apartments in Katowice (no smokers).
Figure 2.
Photo of the SKC sampler with a head equipped with a cyclone with a cut-off diameter of 4 µm while measuring the concentration of airborne particles in one of the reference apartments in Katowice (no smokers).

Figure 3.
Relationships between the concentration of PM4 outdoors and indoors in the apartments without ETS in Katowice.
Figure 3.
Relationships between the concentration of PM4 outdoors and indoors in the apartments without ETS in Katowice.

Figure 4.
Example of the XPS spectrum in the energy range 0–1400 eV for the PM4 in the apartment without smokers in Katowice.
Figure 4.
Example of the XPS spectrum in the energy range 0–1400 eV for the PM4 in the apartment without smokers in Katowice.

Figure 5.
Example of the XPS spectrum in the energy range 0–1400 eV for the PM4 in the apartment with ETS in Katowice.
Figure 5.
Example of the XPS spectrum in the energy range 0–1400 eV for the PM4 in the apartment with ETS in Katowice.

Figure 6.
Example of the XPS spectrum in the energy range 0–1400 eV for the PM4 in the house without smokers in Jaworzno.
Figure 6.
Example of the XPS spectrum in the energy range 0–1400 eV for the PM4 in the house without smokers in Jaworzno.

Figure 7.
Example of the XPS spectrum in the energy range 0–1400 eV for the PM4 in the house with ETS in Jaworzno.
Figure 7.
Example of the XPS spectrum in the energy range 0–1400 eV for the PM4 in the house with ETS in Jaworzno.


Table 1.
Concentration of PM4 indoors and outdoors for the apartments without and with smoking residents in Katowice.
Table 1.
Concentration of PM4 indoors and outdoors for the apartments without and with smoking residents in Katowice.
| Sampling Site | Concentration, µg m−3 | I/O | |||
|---|---|---|---|---|---|
| Mean (SD) * | Max | Min | |||
| Apartments without smokers (5) | Indoor | 55 (21) | 87 | 35 | 0.6 |
| Outdoor | 80 (48) | 139 | 15 | ||
| Apartments with smokers (5) | Indoor | 208 (127) | 413 | 92 | 2.8 |
| Outdoor | 74 (80) | 50 | 98 | ||
* SD—Standard deviation.
Table 2.
Concentration of PM4 indoors and outdoors for the single-family houses without and with smoking residents in Jaworzno.
Table 2.
Concentration of PM4 indoors and outdoors for the single-family houses without and with smoking residents in Jaworzno.
| Sampling Site | Concentration, µg m−3 | I/O | |||
|---|---|---|---|---|---|
| Mean (SD) * | Max | Min | |||
| Houses without smokers (3) | Indoor | 65 (24) | 95 | 35 | 1.8 |
| Outdoor | 38 (13) | 51 | 20 | ||
| Houses with smokers (3) | Indoor | 126 (40) | 173 | 76 | 5.2 |
| Outdoor | 48 (24) | 66 | 14 | ||
* SD—Standard deviation.
Table 3.
Concentration of PM4 indoors and outdoors for the single-family houses without and with smoking residents in Międzyrzecze.
Table 3.
Concentration of PM4 indoors and outdoors for the single-family houses without and with smoking residents in Międzyrzecze.
| Sampling Site | Concentration, µg m−3 | I/O | |||
|---|---|---|---|---|---|
| Mean (SD) * | Max | Min | |||
| Houses without smokers (5) | Indoor | 65 (23) | 99 | 39 | 1.4 |
| Outdoor | 50 (14) | 66 | 32 | ||
| Houses with smokers (5) | Indoor | 161 (51) | 221 | 83 | 2.7 |
| Outdoor | 66 (23) | 110 | 45 | ||
* SD—Standard deviation.
Table 4.
Summary of the daily time budget (time distribution) for the entire study population (n = 118 people).
Table 4.
Summary of the daily time budget (time distribution) for the entire study population (n = 118 people).
| Statistical Value | Time Spent in the Microenvironment, % | ||||
|---|---|---|---|---|---|
| Home | Work/School | Other Environment | Transport Vehicles | Outdoor | |
| Arithmetic Mean | 51.66 | 31.37 | 1.31 | 5.48 | 10.2 |
| Min. Value | 22.9 | 0.0 | 0.0 | 0.0 | 0.0 |
| Max. Value | 79.3 | 62.5 | 16.6 | 25.0 | 31.2 |
| Standard Dev. | 1.94 | 2.7 | 2.16 | 1.59 | 1.42 |
Table 5.
Daily time budget of boys aged 14–15.
| Statistical Value | Time Spent in the Microenvironment, % | ||||
|---|---|---|---|---|---|
| Home | Work/School | Other Environment | Transport Vehicles | Outdoor | |
| Arithmetic Mean | 58.31 | 29.04 | 2.82 | 1.64 | 8.18 |
| Min. Value | 50.0 | 25.0 | 0.0 | 0.0 | 2.1 |
| Max. Value | 68.7 | 39.6 | 10.4 | 12.5 | 16.6 |
| Standard Dev. | 6.00 | 3.52 | 4.36 | 3.29 | 4.99 |
Table 6.
Daily time budget of girls aged 14–15.
| Statistical Value | Time Spent in the Microenvironment, % | ||||
|---|---|---|---|---|---|
| Home | Work/School | Other Environment | Transport Vehicles | Outdoor | |
| Arithmetic Mean | 61.28 | 26.58 | 2.09 | 1.11 | 8.95 |
| Min. Value | 45.8 | 25.0 | 4.2 | 2.1 | 4.2 |
| Max. Value | 68.7 | 31.2 | 8.3 | 8.3 | 29.2 |
| Standard Dev. | 6.70 | 2.80 | 3.13 | 2.34 | 6.73 |
Table 7.
The home dose of exposure to PM4 in the studied population of adolescents aged 14–15 years.
Table 7.
The home dose of exposure to PM4 in the studied population of adolescents aged 14–15 years.
| Homes | Inhalation Dose of PM4 | |||
|---|---|---|---|---|
| Boys | Girls | |||
| TID, mg | BID, µg kg−1 | TID, mg | BID, µg kg−1 | |
| Katowice. Apartments without ETS | 2.23 | 38.4 | 2.34 | 40.3 |
| Katowice. Apartments with ETS | 8.44 | 145.5 | 8.87 | 152.9 |
| Jaworzno. Houses without ETS | 2.64 | 45.5 | 2.77 | 47.8 |
| Jaworzno. Houses with ETS | 5.12 | 88.3 | 5.37 | 92.3 |
| Międzyrzecze. Houses without ETS | 2.64 | 45.5 | 2.77 | 47.8 |
| Międzyrzecze. Houses with ETS | 6.54 | 112.8 | 6.86 | 118.3 |
Publisher’s Note: MDPI stays neutral with regard to jurisdictional claims in published maps and institutional affiliations. |
© 2021 by the authors. Licensee MDPI, Basel, Switzerland. This article is an open access article distributed under the terms and conditions of the Creative Commons Attribution (CC BY) license (https://creativecommons.org/licenses/by/4.0/).
Share and Cite
MDPI and ACS Style
Pastuszka, J.S.; Talik, E.; Płoszaj-Pyrek, J. Exposure to PM4 in Homes with Tobacco Smoke in and around Katowice, Poland. Atmosphere 2021, 12, 1590. https://0-doi-org.brum.beds.ac.uk/10.3390/atmos12121590
AMA Style
Pastuszka JS, Talik E, Płoszaj-Pyrek J. Exposure to PM4 in Homes with Tobacco Smoke in and around Katowice, Poland. Atmosphere. 2021; 12(12):1590. https://0-doi-org.brum.beds.ac.uk/10.3390/atmos12121590
Chicago/Turabian StylePastuszka, Józef S., Ewa Talik, and Justyna Płoszaj-Pyrek. 2021. "Exposure to PM4 in Homes with Tobacco Smoke in and around Katowice, Poland" Atmosphere 12, no. 12: 1590. https://0-doi-org.brum.beds.ac.uk/10.3390/atmos12121590
Note that from the first issue of 2016, this journal uses article numbers instead of page numbers. See further details here.