
Impacts of Climate and Environmental Change on Bean Cultivation in China

1
School of Economics and Management, Wuhan University, Wuhan 430072, China
2
The School of Economics, Shanghai University of Finance and Economics, Shanghai 200433, China
*
Author to whom correspondence should be addressed.
Atmosphere 2021, 12(12), 1591; https://0-doi-org.brum.beds.ac.uk/10.3390/atmos12121591
Submission received: 14 October 2021
/
Revised: 25 November 2021
/
Accepted: 26 November 2021
/
Published: 29 November 2021
(This article belongs to the Special Issue Advanced Climate Simulation and Observation)
Abstract
:The impact of human-caused environmental pollution and global climate change on the economy and society can no longer be underestimated. Agriculture is the most directly and vulnerably affected sector by climate change. This study used beans, the food crop with the largest supply and demand gap in China, as the research object and established a panel spatial error model consisting of multiple indicators of four factors: climate environment, economic market, human planting behavior and technical development level of 25 provinces in China from 2005 to 2019 to explore the impact of climate environmental changes on the yields of beans. The study shows that: (1) The increase in precipitation has a significant positive effect on bean yields; however, the increase in temperature year by year has a significant negative effect on bean yields; (2) carbon emissions do not directly affect bean production at present but may have an indirect impact on bean production; (3) artificial irrigation and fertilization behavior on bean production has basically reached saturation, making it difficult to continue to increase bean yields and (4) the development of technology and human activity is a mixed blessing, and the consequent inhibiting effects on bean production are currently unable to offset their promoting effects. Thus, when it comes to bean cultivation, China should focus mainly on the overall impact of environmental changes on its production, rather than technical enhancements such as irrigation and fertilization.
1. Introduction
In recent decades, the global climate has undergone significant changes due to natural environmental changes and human activities, and this change is mainly characterized by global warming. The main reason for the warming is the emission of greenhouse gases such as carbon dioxide caused by human activities [1]. Climate change research intends to assess the effects of climate change on ecosystems, economies and societies by predicting possible future changes of climate [2]. The influence of climate change on human beings is comprehensive, multi-level and multi-scale. Agriculture is the sector most directly affected by and vulnerable to climate change. It is also the sector on which human society depends for the output of basic means of living, and the sustainable development of agriculture is directly related to the survival and development of human society [3,4]. As grain is a crucial agricultural product, grain security, grain varieties and grain production have always been the top priority of the global economy. With the advancement of agricultural technologies and the improvement of life quality, the yields of crops and productivity have been boosted over time. At the same time, climate warming, precipitation instability, extreme weather and disasters have brought negative impacts on food production [5]. Studies have shown that the determinants of crop production are climatic (e.g., rainfall, high temperatures) and weather extremes (e.g., floods, droughts and storms) [6]. Changes in rainfall patterns and increased temperature could have a marked impact on food production [7]. According to IPCC (2012), crop production is sensitive to climate change associated with temperature increases, changes in rainfall patterns and extreme weather events. In addition to the changes of climate and temperature, carbon dioxide also affects the food production, and it has a higher impact on C3 species (including wheat, rice and bean) than C4 species (including maize and sorghum) [8]. Food production in countries around the world is currently under serious threat from climate change, which leads to challenges to sustainable development as well [9]. Climate change is also an important challenge for food production and security in China. In the context of global warming, changes in temperature and precipitation patterns could lead to a 20–36% decline in maize, wheat, and rice yields in China over the next 20–80 years [10]. China’s grain production with the background of climate change has the following three main problems: Firstly, grain production becomes more volatile; secondly, the structure and layout of food production may change, and crop cultivation systems need to change accordingly and thirdly, climate change will substantially increase the cost of grain production [11].
China is a global grain-producing country. For example, in 2020, the total grain production in China reached 669 million tons, an increase of 0.85% year-on-year, accounting for about 24% of the world’s grain production, and the grain supply was more than adequate. However, the production of bean products accounted for only 3.42%, or about 22.87 million tons. In contrast to the reality of limited bean supply, China is a major consumer of beans in the world, and bean consumption is rising annually, with bean consumption demand exceeding 120 million tons in 2018 and 2019, implying a huge domestic bean supply and demand gap in China and high dependence of the bean industry on imports [12,13]. Therefore, this study turned the research perspective to the Chinese bean industry, which is severely limited in self-sufficiency, and investigated the impact of climate change on bean production so as to provide some practical suggestions for the bean industry in China regarding future changes in the structure, layout of food production and the long-term development.
The impact of climate change on agricultural production is an interdisciplinary subject between climatology, agronomy and economics, and different methods and emphases have been adopted by different disciplines in the study of this subject. In existing studies, the impact of agronomic climate change on agricultural production has been mainly used in the crop growth simulation model (CGSM), which examines the changes in crop growth, development and yield due to changes in climatic factors by dynamically simulating crop growth and development processes and their relationships with climatic factors, soil properties and management techniques and provides a quantitative tool for predicting early warning and assessing the effects of crop productivity under different conditions [14,15,16]. The agronomic approach focuses on the process of crop growth and development cycles without considering economic factors, while the economic approach focuses more on the economic value dimension. The representative studies in economics have measured agricultural production by constructing land value indicators and with the help of crop yields, progress in controlling technology and economic factors using a large quantity of statistical data and relevant econometric models to examine the causal relationship between climate factors and agricultural production [17,18]. A review of representative literature reveals that the current research trend gradually shifts to examine specific crop yields, and the empirical method of causality shifts from traditional cross-sectional regression to panel spatial econometric empirical analysis [19,20,21]. Spatial measurement is a common econometric method. When spatial correlations and spatial differences exist among individual research objects, spatial measurement can be used to consider the variability under multiple influencing factors in different spaces at the same time, removing these differential influences and focusing on the main influencing factors of the research object. In the present studies on the relationship between grain production and climate in China, most of the research objects are cereal grains such as wheat and rice, and the influencing factors are covered comprehensively with various analysis methods; however, the research on beans is relatively insufficient and covered with fewer dimensions of influencing factors. This study used bean productivity as the research object and analyzed the influence of four influencing factors on bean production: climate environment, economic market, human planting behavior and technology development level. The spatial error model was selected in this study for empirical analysis, which focuses on climatic environmental factors as the variables of interest, while economic market, human planting behavior and technology development level are the variables that need to be controlled. Moreover, the inter-regional factors such as geographic rationality and policy institutional differences should be excluded.
2. Materials and Methods
2.1. Variable Selection
In this study, the unit area yield of bean crops was selected as the explanatory variable, and the four factors affecting the unit area yield of bean crops were climate environment, economic market, human cultivation behavior and technology development level. Economic market factors mainly include economic factors such as market price and cost of food. Human cultivation behavior refers to the human intervention in food crops, including both fertilization and irrigation. The level of technological development refers to the level of technology in growing food, which is reflected in the paper using the degree of modernization of the cultivation area. Therefore, the specific indicators including the explanatory variables and the four aspects of explanatory variables selected in this study are shown in Table 1 below.
2.2. Modeling
In this study, a panel spatial error model was constructed to analyze the effect of climatic environmental changes on the yield per unit area of beans. The model was constructed as shown below [22].
(1) In the equation, and denote province and year, respectively; denotes grain yield; , an indicator of regional heat resources, denotes effective cumulative temperature, the sum of effective temperature of crops during the reproductive period, reflecting the heat demand of biological growth and development; denotes total annual precipitation of each province and denotes other climate variables, including the degree of disaster, carbon emission, SO2 emission in exhaust gas and total wastewater discharge. Considering that coal is the main source of carbon emissions, coal usage was chosen to represent carbon emissions, while the degree of disaster was calculated by dividing the number of disasters by the total sown area in each province. represents economic market factors, expressed as the benefit–cost ratio of grain cultivation. Due to the interplay between economic market factors and bean yields, there is a significant endogeneity problem between the two variables. A one-period lagged price variable was used in this study as a proxy for current period prices. The rationale for this treatment is that climatic conditions and market factors in the previous year have a strong influence on farmers’ decisions to plant in the following year, which in turn changes farmers’ expectations of the returns and costs of planting in the current year, but there is no direct link between climatic conditions and economic factors in the previous year and crop yields in the current year (i.e., the residuals of the model). Thus, the price index of agricultural production with a lag of one period can be considered as the expected return to planting in the current period, while the price index of agricultural production materials in the current period represents the cost of planting faced in the current period, and the ratio of these two price indices, i.e., expected return/cost of planting, characterizes economic market factors, with higher ratios indicating greater returns to planting [23]. characterizes human behavioral interventions, including fertilizer use per unit area and effective irrigated area. The ratio of effective irrigated area is calculated by dividing the effective irrigated area by the total sown area [24]. The factor characterizes technology development, i.e., the level of modernization of the growing area, as reflected by rural electricity consumption, and the time fixed effect captures factors that do not change with the area, such as policy regimes.
In addition, other influences not captured by the independent variables in Equation (1) were all included in the residual term (), including regional farming systems, regional soil environments, and regional cropping habits that are both highly correlated with local climate and affect bean yields and therefore also affect the consistency of the estimation results. To compensate for potential omitted variable bias, this study allows for spatial correlation between samples and uses residuals from neighboring provinces () to explain province-specific residuals () to capture all omitted variables with regional characteristics. The basic idea behind the ability of the spatial error models to correct for omitted variable bias is that anything that cannot be captured by the independent variables in the regression model will enter the model residual term (); however, once the unobservable omitted variables share common spatial regional characteristics (i.e., regional characteristics common to a particular province and adjacent provinces, such as regional farming systems, regional natural hazards, regional varieties and soil types), using the residuals as an additional independent variable to explain crop yields () in a given province from adjacent provinces can reflect all common regional characteristics as shown in Equation (2). In Equation (2), is the spatial weighting matrix that specifies the range of spatially correlated influences. The spatial adjacency matrix was used in this study to reflect the spatial correlation of the samples, with a priori assumption that there are spatially correlated influences between neighboring sample provinces but no spatial correlation between non-adjacent sample provinces. The spatial adjacency matrix is a square matrix whose elements take the values (0, 1). It takes the value 1 if the sample county domains are adjacent and 0 if they are not. The spatial adjacency matrix was chosen as the baseline case in this study for three reasons: first, to be consistent with the existing literature [17,22]; second, because existing studies [17,25] confirm that while the choice of different spatial weighting matrices affects the magnitude of the spatially relevant degree, indicator does not significantly change the coefficient estimates of the climate variables of interest to the empirical analysis model. Furthermore, in the panel data case, it is often assumed that the extent and magnitude of spatially correlated impacts (i.e., spatial weighting matrices ) do not change over time [26]. The degree of spatial correlation between neighboring sample provinces is reflected by the estimated coefficients. Equations (1) and (2) form the panel spatial error model in this study, after stripping out the spatial correlation, where is the true residual term of the empirical analysis model.
Thus, the economic significance of the climate factor coefficients (, , ) in this paper is the marginal impact per unit (, , ) change in climate factors on crop yields, with all else remaining the same(, , and ).
2.3. Data Sources and Processing
The sample data used in this study contained the following four aspects: planting data, basic climate data, environmental data and socioeconomic data. The time interval was 2005–2019, and the research sample area was initially selected from 31 provinces in China. Among them, considering the special geographical environment of Hainan Province and Tibet Autonomous Region, their low bean yield and missing data, these regions were excluded. At the same time, the four municipalities directly under the central government of Beijing, Tianjin, Shanghai and Chongqing have less arable land compared with other provinces and have a higher level of modernization, which makes them unsuitable for the cultivation of beans and other agricultural products and not representative for the analysis of factors influencing bean yields in this study, so they were also excluded. The specific sources of data for the four areas are as follows.
Planting data: Among the 25 provinces, planting data were selected to include bean planting area, yield per unit area, effective irrigated area and fertilizer use per unit area for each province. The data were obtained from the Yearbook of the National Bureau of Statistics of China and the CSMAR database, respectively, and all 375 complete sample data were collected.
Basic climate data: The basic climate data were obtained from 820 meteorological observation sites across the country, and the meteorological data of daily values from 25 urban meteorological stations with the highest bean production in each province were selected as the representative of the basic climate data in the province. The growing temperature of bean crops is above 10 °C, so the average daily temperature greater than 10 °C in each station in each year was accumulated in this study as the annual effective cumulative temperature value in the province, which reflects the influence of temperature in bean cultivation. Precipitation data for each province were obtained from the China National Meteorological Science Data Sharing Service Platform—China Terrestrial Climate Information Daily Value Dataset v3.0. These data were complete and free of defects.
Environmental data: Environmental data mainly include total carbon emissions, total SO2 emissions in exhaust gas, total wastewater emissions and severity of disaster, where severity of disaster is expressed as the number of disasters per year in the province divided by the area of bean cultivation. The data on total carbon emissions and the number of disasters were obtained from the yearbook of the National Bureau of Statistics of China, in which there were 25 missing values for the indicator of total carbon emissions; the data on total SO2 emissions in exhaust gas and total wastewater emissions were obtained from the statistical database of the China Economic Network, in which there were 25 missing values for total wastewater emissions, and the missing values above were supplemented by the interpolation method.
Socioeconomic data: The socioeconomic data include the benefit–cost ratio of food and rural electricity consumption; the benefit–cost ratio is calculated by dividing the relative price index of agricultural production in the previous period by the relative price index of agricultural production materials in the current period. The data on the relative price index of agricultural production and the relative price index of agricultural production materials were obtained from the CSMAR database, and the data were complete and free of missing values; the data on rural electricity consumption were obtained from the CSMAR database, and the data had 25 missing values, which were completed by interpolation.
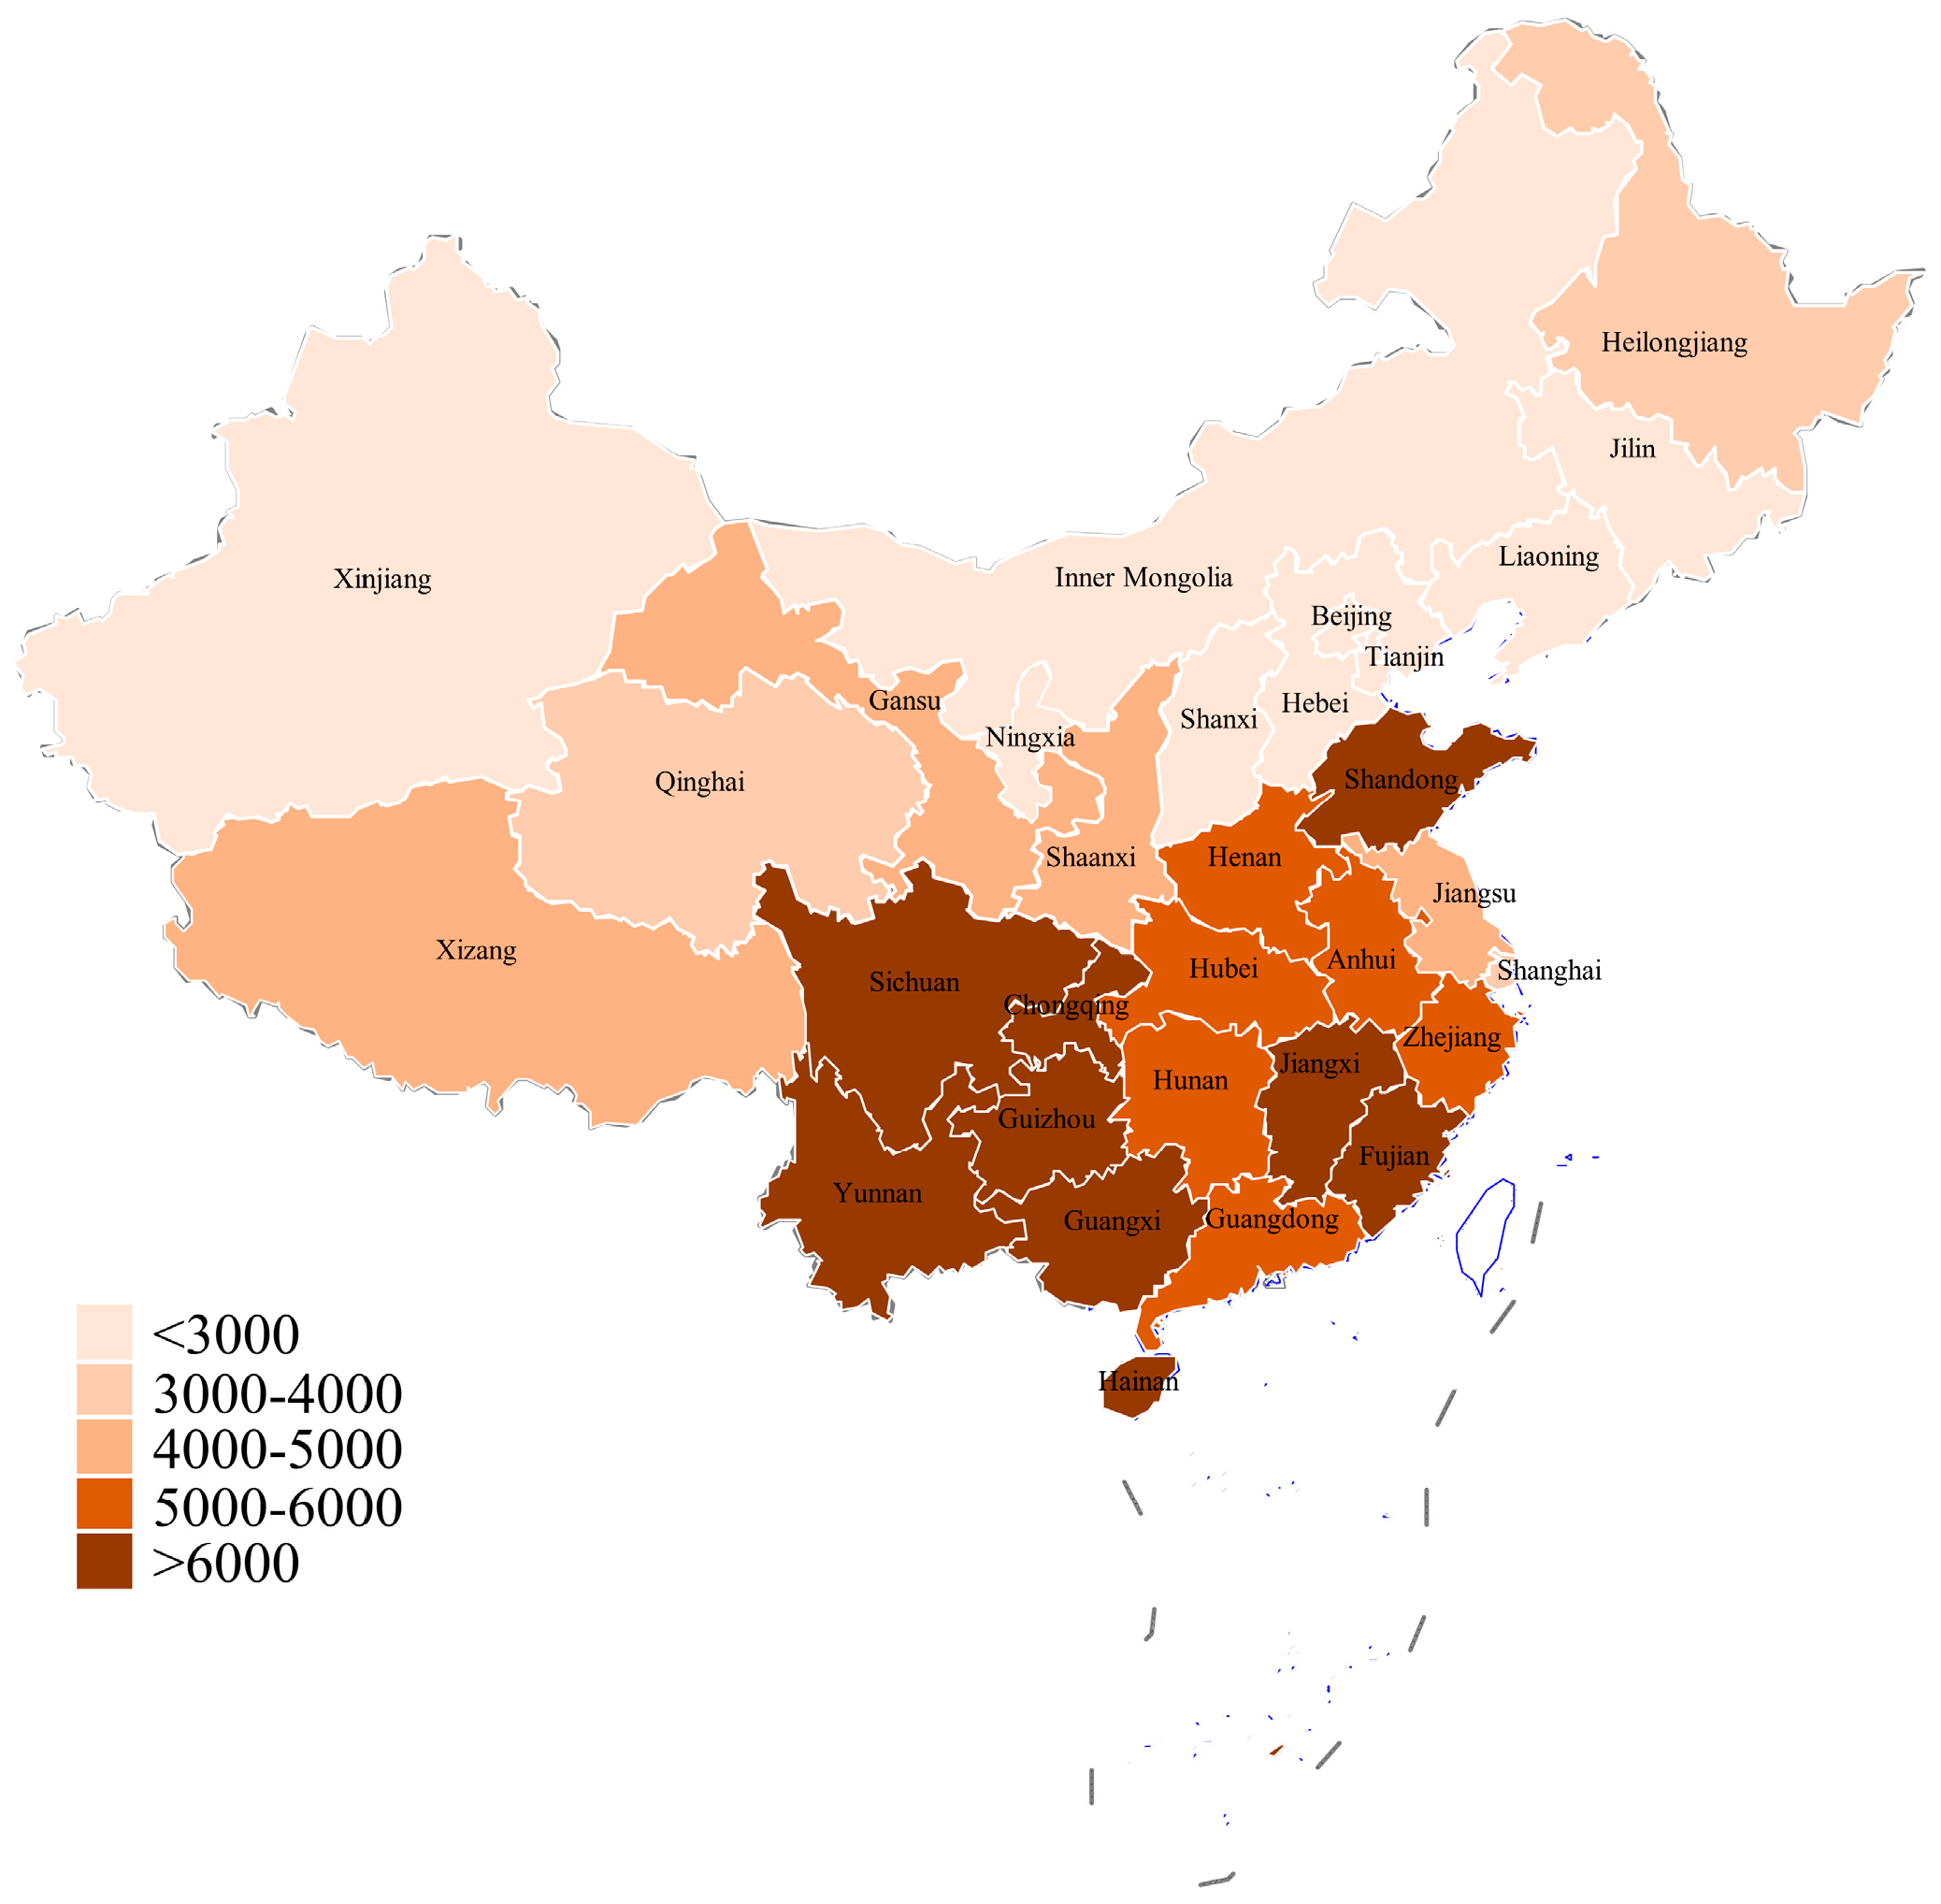
Numerous studies have shown that precipitation has an important influence on the production of crops. The national precipitation is plotted for the years 2005–2009, 2010–2014 and 2015–2019 as shown in Figure 1, Figure 2 and Figure 3, respectively. The major growing provinces of beans in China are in Xinjiang Uyghur Autonomous Region, Fujian Province, Shandong Province and Guangdong Province, and as can be seen from the figure, the distribution of precipitation in these provinces varies widely, indicating that beans are not very sensitive to precipitation. The result is not quite consistent with the conclusion that the yields of many cereal crops are more sensitive to changing patterns of precipitation.
For the 11 independent variables selected in this study, the same descriptive statistics are shown in Table 2 for each of the 5-year periods 2005–2009, 2010–2014 and 2015–2019.
As can be seen in Table 2, the average bean yields in China increased steadily; there was also a gradual increase in temperature levels and average precipitation across the country. The level of disasters decreased year by year, although this was not because the number of disasters became less frequent. In contrast, the frequency of disasters increased gradually, but the area of bean cultivation in China decreased year by year, and the area of efficient, bean-adapted arable land also decreased year by year. Emissions of SO2 from exhaust gases decreased significantly from 2015 to 2019. As a positive effect of policy interventions, the control of emissions from wastewater increased year by year. There is a more pronounced downward trend in the benefit–cost ratio of food, which implies that the willingness of Chinese farmers to grow on their own may have declined to some extent, and the use of fertilizer per unit area remains largely stable or even slightly declines as an indication of this phenomenon. Rural electricity consumption, on the other hand, has shown a very significant upward trend, indicating that the modernization and scientific and technological development of China’s rural areas over the past 15 years have had a remarkable effect.
3. Model Results and Conclusions
3.1. Testing for Spatial Effects
Moran’s index and Geary’s c coefficient, which measure the existence of spatial autocorrelation between global areas, and the spatial adjacency matrix (W) was used as the baseline matrix reflecting the spatial correlation of the sample, which is defined in the same way as in Section 2.2. If both Moran’s index and Geary’s c coefficient values are significant, this indicates that there is correlation between bean unit yield samples. The positive or negative sign of the coefficient reflects the corresponding spatial correlation between samples. Table 3 shows the results of the test for spatial correlation for this indicator of bean yields for the sample studied in this work.
The results of the above tests indicate that there is a significant positive spatial correlation effect between the bean unit yield samples. The traditional panel model is inadequate to deal with the spatial correlation problem since its estimation results are not only biased but could greatly overestimate the significance level of the variables. The bias essentially stems from the omission of spatial factors, and therefore, a spatial econometric model was used in this study for the empirical analysis.
3.2. Model Selection and Robustness Tests
The stability test is a necessary step before using the model for panel data. It is necessary to ensure that each variable is a stable series and that a cointegration between the variables can be modeled. The test revealed that bean yields were not stable, so they were logarithmically processed. The results of the stability test of the processed bean yields with the rest of the variables are shown in Table 4.
In this study, the Levin–Lin–Chu test, Hadri (2000) panel unit root test and Im–Pesaran–Shin test were selected for the above 11 variables. In the test results of these three coefficients, more than two coefficients needed to be significant to consider the variable as a stable series. The results in Table 4 show that the panel data of the above variables are all stable series.
Section 3.1 validates the findings of this study using a spatial econometric model from the perspective of a single variable, grain yields. The LM test, on the other hand, tests whether a spatial regression method or the OLS regression method should be used for ordinary panel data from the perspective of the panel data containing all variables. The LM test can test whether there are spatial error effects and spatial lag effects in the overall panel data. Table 5 shows the results of LM test for the overall model. The three test coefficients of spatial error effect are significant, indicating that the panel data has spatial error effect, while the robust Lagrange multiplier in spatial lag effect is not significant, so it is not fully confirmed that the panel data has a spatial lag effect.
The test provides strong support for the choice of the spatial error model, while for panel data, whether to use the fixed effect or random effect model depends on the Hausman test. Table 6 shows the results of the Hausman test.
The original hypothesis of the Hausman test is that there is a random effect in these panel data. As can be seen from Table 6, the p-value is 0.0008, so the original hypothesis can be rejected at the 95% confidence level. That is, the panel data do not have a random effect but a fixed effect, and the fixed effect model should be selected. The four tests in Table 3, Table 4, Table 5 and Table 6 provide support for model Equations (1) and (2) outlined in Section 2.2 of this paper.
3.3. Model Results
According to the settings of panel spatial error model (1) and (2), the goodness of fit of the three models of time fixed effect, individual fixed effect and double fixed effect was 0.27, 0.06 and 0.03, respectively, so the time fixed effect model was chosen to examine the effects of the four types of factors on bean yields in China, and the regression results are shown in Table 7.
Table 7 reflects the following findings. The overall R squared is 0.2793, which indicates that the overall fit of the model is good. The within R squared is 0.0094, which shows that the within fit of the model is poor. The between R squared is 0.5439, indicating that the between fit of the model is good.
(1) Biologically, similar to cereals such as wheat and rice [27], there is an “inverted U-shaped” relationship between temperature and precipitation and unit yield of beans, i.e., the effect of temperature and precipitation on bean production is a non-linear relationship that increases first and then decreases. The model results showed that the current effective cumulative temperature had a negative effect on bean yields (Coef. = −0.0002578, p < 0.01), i.e., for every 1 °C increase in effective cumulative temperature, bean yields decreased by 0.02578%. The result not only implies that the effect of extreme weather on bean yields is significant, with either lower or higher cumulative temperatures causing a reduction in bean yields, but also, combined with the descriptive statistics in Table 2, we can conclude that the warming phenomenon occurring in China significantly and negatively affects bean production. In the long run, elevated temperatures can adversely affect crop production [28,29], and the results of this paper suggest that the relationship between legumes and temperature factors is consistent with this conclusion. There is also a positive relationship between precipitation and bean yields (Coef. = 0.0.0015519, p < 0.01), i.e., grain yields increase with increasing rainfall, with each 100 mm increase in precipitation increasing bean yields by 4.895%. In countries such as China, where agriculture is more dependent on rainfall, climate change is more significant for crop production, and changes in rainfall may adversely affect crop production [30]. There is a negative relationship between rice production and precipitation in China, which is contrary to the findings of the relationship between legumes and precipitation studied in this research. The current precipitation situation in China remains in an interval of positive effects on bean production and growth.
(2) Among the climatic variables in the environment category, there are significant relationships between SO2 emissions from exhaust gases (Coef. = 0.0015519, p < 0.05), wastewater emissions (Coef. = 7.67 × 10⁻⁷, p < 0.05) and severity of damage (Coef. = −0.68233, p < 0.01) and bean yields. Among them, the effect of SO2 emissions from waste gas on bean yields is the largest, with an increase of 0.155194% in bean yields for every 10,000 tons of SO2 emissions from waste gas. The effect of wastewater emissions on bean yields is the smallest and almost negligible, with an increase of 0.0000766% in bean yields for every 10,000 tons of increase in wastewater emissions. The results show that there is a positive relationship between SO2 emissions from exhaust gas and wastewater emissions and bean yields, which is different from the hypothesis.
With the rapid development of China’s economy, the domestic energy situation is becoming increasingly scarce, and the demand for natural gas as a clean gas fuel and an important chemical raw material is increasing. Therefore, some domestic scholars have studied the short-term and long-term effects of SO2 emissions from waste gas on the environment, soil and crops. Some studies have shown that although SO2 is higher than the requirements of the Limits of Concentration of Air Pollutants for the Protection of Crops, it does not cause acute harm to wheat, rice, beans, corn or rapeseed in the predicted impact area, let alone to their long-term growth [31]; some studies have also shown that high sulfur gas field SO2 emissions from high sulfur gas fields can significantly reduce the thousand-grain-weight of rice seeds, thereby affecting rice yield and reducing rice quality [32]. There are no studies that support a positive effect of SO2 emissions on bean yield, which is contrary to the results of the study, probably due to the inaccurate location of the selected emissions data collection, which does not fully reflect the effect on bean cultivation, and the fact that emissions are related to human activities and industrial production, which may have omitted variables and endogeneity problems. Similarly, the same problem exists in the relationship between wastewater emissions and bean yields. It has been suggested that each percentage point increase in CO2 emissions decreases cereal production by 0.29%, showing a negative correlation [30,33,34,35], and it has also been suggested that there is no significant relationship between CO2 emissions and cereal production [36]. The effect of bean yields and CO2 emissions studied in this work is similar to the findings of Sossou et al., who studied cereal yields, where the effect of carbon emissions (Coef. = −0.00009, p > 0.05) on bean yields was not significant. The reason may be that on the one hand, the increase in carbon emissions brings negative climate effects such as extreme weather and global warming, which have a negative effect on the growth of beans, and on the other hand, CO2 is a condition for photosynthesis in beans, which has a positive effect on their growth, and the two effects are currently in a state of offset; carbon emissions have not yet had a significant effect on bean yields. There is a negative relationship between the degree of damage and bean yields. In bean growing areas, each increase in the degree of damage per hectare reduces bean yields by 68.233%, indicating that the degree of damage is the most serious factor affecting bean yields per unit area. This is in agreement with Chijioke et al. who concluded that extreme climatic events such as floods and droughts significantly affect crop yields [37], suggesting that beans as a crop are also sensitive to the degree of damage.
(3) The benefit–cost ratio of grain does not have an effect on bean yields (Coef. = 0.227392, p > 0.05), and farmers’ expected returns and costs of growing beans are not significantly related to bean yields.
(4) Among the human behavioral intervention factors, there is a positive relationship between effective irrigated area ratio (Coef. = 1.030, p < 0.001) and bean yields, i.e., an increase in effective irrigation ratio boosted grain yields, whereas the effect of fertilizer being used per unit area (Coef. = 0.0002584, p > 0.005) on grain yield is insignificant. This may be due to the good soil environment of the farmland, where fertilizer self-supply and micro-ecological cycles are at a better level and the farmers’ fertilizer application for bean tillage is at a more desirable level, which has a weaker effect on bean growth.
(5) There is a negative relationship between rural electricity consumption (Coef. = −0.0001, p < 0.05), a proxy for the technology level factor, and bean yields, with an increase in rural electricity consumption of 100 million kWh reducing bean yields by 0.01%. An increase in electricity consumption in turn reduces bean yields. The development of modern technology has effectively improved agricultural cultivation techniques, which will increase the production capacity of beans to a certain extent, but from another perspective, the modernization of the countryside means an increase in human activities, overexploitation of the ecological environment and a reduction in the area of high-quality arable land, all of which have a negative impact on the production capacity per unit area of beans, and the conclusion shows that the negative impact under this factor is slightly greater than the positive effects.
4. Discussion
A large number of observations and research results show that climate change has different impacts on crop growth and development, cropping systems and yield quality, with both advantages and disadvantages, but the negative impacts outweigh positive ones. The relationship between climate change and grain production in China is complex. From an ecosystem perspective, not only are there two major agroecosystems, the southern paddy field and the northern dryland, which play an important role in crop growth, but grain production is also affected differently by climate change due to the vast geographical area, the diversity of crops, the many varieties, the differences in cultivation practices, cropping systems and production structures [38]. In this study, based on panel data of 25 Chinese provinces from 2005 to 2019, we analyzed the effects of the above factors on the unit yield of beans in China in four dimensions: climatic environment, economic market, human cultivation behavior and technological development level, where the focus is on the climatic environment factor and other factors are considered as control variables in the model.
The results of this study show that in recent years, all aspects of bean production in China have been characterized by progressive changes in the context of climate change. During 1979–2002, climate warming was more favorable for bean growth in China, especially in the northeast, where warmer temperatures could extend the growing period of the crop and reduce the impact of frost damage on beans [39]. However, the results of this study of 2005–2019 show that as global warming intensifies and the growing season accumulation temperature exceeds the inflection point optimum accumulation level, the increase in temperature begins to show a suppressive effect on bean yields, which is different from the relationship between temperature change and bean yields in 1979–2002. In addition, carbon emissions increase each year. Kumar, P. et al. indicated a positive relationship between carbon emissions and cereal production [40]; Pickson, R. B et al. stated that CO2 emissions have a significant negative impact on cereal production in the long run [30] and show a unidirectional causality and Ahsan F et al. had the same conclusion as Pickson, R. B et al. on the relationship between cereal production and CO2 emissions, but their study showed a bidirectional causal relationship between CO2 emissions and cereal production [35]. These findings are not the same as the relationship between bean yields and CO2 emissions in this paper, but this does not mean that it has no effect on the growth of bean crops in China. Excessive carbon emissions are an important cause of large changes and significant fluctuations in climate, and the most direct result is the increase in the number of disasters each year, which has a significant effect on the reduction in bean yields. It can be seen that the increasing temperature will cause changes in the spatial and temporal distribution of light, temperature, water and other climatic resources in the main grain-producing regions of China, which will lead to changes in soil organic matter, soil microorganisms and soil fertility and intensify the outbreak of agricultural pests and meteorological disasters in local areas.
At the same time, climate change will also lead to changes in the physiological and ecological characteristics of grain crop varieties by changing environmental factors, thus affecting the grain yield, cropping system, production method and structure in China. Climate change also leads to changes in the physiological and ecological characteristics of food crop varieties through changes in environmental factors, thus having far-reaching effects on China’s grain production, cropping systems, production methods, structural layout and variety quality. In addition, the high level of rural modernization has started to have a slight negative impact on the growing environment of beans, which is also a conclusion that deserves our attention. The growing industry is one of the most sensitive areas to climate change, which has caused changes in crop fertility, farming systems, etc., and increased frequency and intensity of disasters, posing risks to and increasing pressure on global food production systems and food security. Ensuring sustainable agricultural development and food security is one of the important objectives of addressing climate change.
In international studies, many other countries have studied the relationship between local bean production and climate, for example, Wurr, D. et al. conducted a detailed analysis of French bean production in relation to CO2 emissions and temperature variation. They concluded that temperature has a large positive effect on French bean production, while CO2 has a negative or even no significant effect on French bean growth [41]. The current studies on bean crop yield in China are insufficient, and the factors involved are not comprehensive. The panel spatial error model used in this study explains the impact of current climatic and environmental factors on the yield per unit area of beans in China in four aspects, and the conclusions of the paper provide a reference for Chinese bean cultivation in response to climate change, while showing a positive correlation between CO2 and SO2 emissions, wastewater emissions and bean yield and the negative correlation between technological level development and bean yield. The two findings, which are different from cereal yields, are worthy of our attention and consideration. However, the limitations of the index still hindered the study somewhat. When considering the impact of air pollution and water environment pollution on bean production, SO2 emissions from exhaust gas and total wastewater discharge essentially reflect the emission behavior of human life, which can only reflect the actual situation of air pollution and water pollution to a certain extent, while the distinction between planting and non-planting areas in these two indicators appears difficult to achieve, which is due to the low selectivity of statistical indicators for planting areas. Therefore, only the overall indicator can be chosen to replace the indicator for planted areas. The errors introduced by this indicator choice may lead to problems such as lower overall model fit superiority and insignificant estimated coefficients. In later studies, other alternative variables or instrumental variables that are highly accurate and can be collected to respond to pollutant concentrations in air and water pollution need to be considered.
Author Contributions
S.L. conducted the analysis of conditions, numerical simulation, data interpretation and drafted the manuscript; S.Y. initiated the study; Z.S. coordinated the data collection; L.Z. contributes to checking and translating; Y.L. contributed to checking and proofreading. All authors have read and agreed to the published version of the manuscript.
Funding
This research received no external funding.
Institutional Review Board Statement
Not applicable.
Informed Consent Statement
Not applicable.
Data Availability Statement
The data used in the study comes from the National Bureau of Statistics of China, China’s National Meteorological Science Data Sharing Service Platform-China Surface Climate Data Daily Value Dataset V3.0, and the China Economic Information Network database, above data can be accessed online. The CSMAR database can be accessed only after subscription.
Acknowledgments
The authors would like to thank the editor and anonymous reviewers for their valuable comments and suggestions to this paper.
Conflicts of Interest
The authors declare no conflict of interest.
References
- Lovejoy, E.T.; Hannah, L. Climate Change and Biodiversity; Yale University Press: New Heaven, CT, USA; London, UK; Sheridan Books: Ann Arbor, MI, USA, 2005. [Google Scholar]
- Li, X.; Qin, D.; Li, J. National Assessment Report on Climate Change; Science Press: Beijing, China, 2007. [Google Scholar]
- Aryal, J.P.; Sapkota, T.B.; Khurana, R.; Khatri-Chhetri, A.; Rahut, D.B.; Jat, M.L. Climate change and agriculture in South Asia: Adaptation options in smallholder production systems. Env. Dev. Sustain. 2019, 22, 5045–5075. [Google Scholar] [CrossRef] [Green Version]
- Banerjee, C.; Adenaeuer, L. Up, up and away! The economics of vertical farming. J. Agric. Stud. 2014, 2, 40. [Google Scholar] [CrossRef]
- Ali, T.; Huang, J.; Wang, J.; Xie, W. Global footprints of water and land resources through China’s food trade. Glob. Food Secur. 2017, 12, 139–145. [Google Scholar] [CrossRef]
- Adams, R.M.; Hurd, B.H.; Lenhart, S.; Leary, N. Effects of global climate change on agriculture: An interpretative review. Clim. Res. 1998, 11, 19–30. [Google Scholar] [CrossRef] [Green Version]
- Zhao, C.; Liu, B.; Piao, S.; Wang, X.; Lobell, D.B.; Huang, Y.; Asseng, S. Temperature increase reduces global yields of major crops in four independent estimates. Proc. Natl. Acad. Sci. USA 2017, 114, 9326–9331. [Google Scholar] [CrossRef] [PubMed] [Green Version]
- Shankar, S. Impacts of Climate Change on Agriculture and Food Security. In Biotechnology for Sustainable Agriculture: Emerging Approaches and Strategies; Lakahan, R., Mondal, S., Eds.; Elsevier: Amsterdam, The Netherlands, 2017. [Google Scholar]
- Howden, S.M.; Soussana, J.-F.; Tubiello, F.N.; Chhetri, N.; Dunlop, M.; Meinke, H. Adapting agriculture to climate change. Proc. Natl. Acad. Sci. Sci. USA 2007, 104, 19691–19696. [Google Scholar] [CrossRef] [Green Version]
- Xiong, W.; Lin, E.; Ju, H.; Xu, Y. Climate change and critical thresholds in China’s food security. Clim. Chang. 2007, 81, 205–221. [Google Scholar] [CrossRef]
- Zhou, W. Impact of Climate Change on Grain Production in China and Coping Strategies; Nanjing Agricultural University: Nanjing, China, 2012. [Google Scholar]
- Jiang, M. Research on Bean Improvement, Production and Utilization in China in the Twentieth Century; Nanjing Agricultural University: Nanjing, China, 2006. [Google Scholar]
- Meng, L. Review of domestic and international bean markets in 2011 and outlook for 2012. Agric. Outlook 2011, 11, 10–13. [Google Scholar]
- Lin, E. Simulation of the Impact of Global Climate Change on Chinese Agriculture; China Agricultural Science and Technology Press: Beijing, China, 1997. [Google Scholar]
- Cline, W. Global Warming and Agriculture: Impact Estimates by Country; Peterson Institute: Washington, DC, USA, 2007. [Google Scholar]
- Pan, G.-X.; Gao, M.; Hu, G.-H.; Wei, Q.-P.; Yang, X.-G.; Zhang, W.-Z.; Zhou, G.-S.; Zou, J.-W. Impacts of Climate Change on Agricultural Production in China. J. Agric. Environ. Sci. 2011, 30, 1698–1706. [Google Scholar]
- Schlenker, W.; Hanemann, W.; Fisher, A. The Impact of Global Warming on US Agriculture: An Econometric Analysis of Optimal Growing Conditions. Rev. Econ. Stat. 2006, 88, 113–125. [Google Scholar] [CrossRef]
- Lobell, D.; Bänziger, M.; Magorokosho, C.; Vivek, B. Nonlinear Heat Effects on African Maize as Evidenced by Historical Yield Trials. Nat. Clim. Chang. 2011, 1, 42–45. [Google Scholar] [CrossRef]
- Sarker, M.A.R.; Alam, K.; Gow, J. Assessing the effects of climate change on rice yields: An econometric investigation using Bangladeshi panel data. Econ. Anal. Policy 2014, 10, 405–416. [Google Scholar] [CrossRef]
- Loum, A.; Fogarassy, C. The effects of climate change on cereals yield of production and food security in Gambia. Appl. Stud. Agribus. Commer. 2015, 9, 83–92. [Google Scholar] [CrossRef]
- Susanto, J.; Zheng, X.; Liu, Y.; Wang, C. The impacts of climate variables and climate-related extreme events on island country’s tourism: Evidence from Indonesia. J. Clean. Prod. 2020, 276, 124204. [Google Scholar] [CrossRef]
- Schlenker, W.; Roberts, M. Nonlinear Temperature Effects Indicate Severe Damages to US Crop Yields under Climate Change. Proc. Natl. Acad. Sci. USA 2009, 106, 15594–15598. [Google Scholar] [CrossRef] [Green Version]
- Welch, J.; Vincent, J.; Auffhammer, M.; Moya, P.; Dobermann, A.; Dawe, D. Rice Yields in Tropical/subtropical Asia Exhibit Large but Opposing Sensitivities to Minimum and Maximum Temperatures. Proc. Natl. Acad. Sci.USA 2010, 107, 14562–14567. [Google Scholar] [CrossRef] [Green Version]
- Deschênes, O.; Greenstone, M. The Economic Impacts of Climate Change: Evidence from Agricultural Output and Random Fluctuations in Weather. Am. Econ. Rev. 2007, 97, 354–385. [Google Scholar] [CrossRef] [Green Version]
- Chen, S.; Chen, X.; Xu, J. Impacts of Climate Change on Agriculture: Evidence from China. J. Environ. Econ. Manag. 2016, 76, 105–124. [Google Scholar] [CrossRef]
- Elhorst, J. Spatial Panel Data Models. In Spatial Econometrics; Elhorst, J., Ed.; Springer: Berlin/Heidelberg, Germany, 2014. [Google Scholar]
- Chen, S.; Xu, J.; Zhang, H. Impact of climate change on grain production in China—An empirical analysis based on county-level panel data. China Rural. Econ. 2016, 5, 2–15. [Google Scholar]
- Peiris, D.R.; Crawford, J.W.; Grashoff, C.; Jefferies, R.A.; Porter, J.R.; Marshall, B. A simulation study of crop growth and development under climate change. Agric. Meteorol. 1996, 79, 271–287. [Google Scholar] [CrossRef]
- Joshi, N.P.; Maharjan, K.L.; Piya, L. Effect of Climate Variables on Yield of Major Food Crops in Nepal-A Time-Series Analysis; MPRA Paper No. 35379; Springer: Tokyo, Japan, 2013. [Google Scholar]
- Pickson, R.B.; He, G.; Ntiamoah, E.B.; Li, C. Cereal production in the presence of climate change in China. Environ. Sci. Pollut. Res. 2020, 27, 45802–45813. [Google Scholar] [CrossRef]
- Liu, Z. Prediction Study on the Impact of SO2 Emissions from a Large Natural Gas Purification Plant on Regional Crops; Southwest Jiaotong University: Chengdu, China, 2012. [Google Scholar]
- Yang, G.; Zhong, G.; Wu, J. Deng Shihuai. Effects of SO2 emissions from high sulfur gas fields on rice growth and yield. Chin. J. Ecol. Agric. 2010, 18, 827–830. [Google Scholar] [CrossRef]
- Janjua, P.Z.; Samad, G.; Khan, N. Climate change and wheat production in Pakistan: An autoregressive distributed lag approach. NJAS Wagening J. Life Sci. 2014, 68, 13–19. [Google Scholar] [CrossRef] [Green Version]
- Casemir, B.H.; Diaw, A. Analysis of climate change effect on agricultural production in Benin. Asian J. Agric. Ext. Econ. Soc. 2018, 24, 1–12. [Google Scholar]
- Ahsan, F.; Chandio, A.A.; Fang, W. Climate change impacts on cereal crops production in Pakistan. Int. J. Clim. Chang. Strateg. Manag. 2020, 12, 257–269. [Google Scholar] [CrossRef]
- Sossou, S.; Igue, C.B.; Diallo, M. Impact of climate change on cereal yield and production in the Sahel: Case of Burkina Faso. Asian J. Agric. Ext. Econ. Soc. 2019, 37, 1–11. [Google Scholar] [CrossRef] [Green Version]
- Chijioke, O.B.; Haile, M.; Waschkeit, C. Implications of climate change on crop yield and food accessibility in sub-saharan Africa. In Interdisciplinary Term Paper; Center for Development Research, University of Bonn: Bonn, Germany, 2011; Available online: http://www.zef.de/fileadmin/downloads/forum/docprog/Termpapers/2011_1_Oyiga__Haile_Waschkeit.pdf (accessed on 13 September 2013).
- Qin, Z.; Tang, H.; Li, W. Frontiers of research on the impact of climate change on food production systems in China. China Agric. Resour. Zoning 2015, 36, 1–8. [Google Scholar]
- Tao, F.; Yokozawa, M.; Liu, J.; Zhang, Z. Climate-crop yield relationships at provincial scales in China and the impacts of recent climate trends. Clim. Res. 2008, 38, 83–94. [Google Scholar] [CrossRef]
- Kumar, P.; Sahu, N.C.; Kumar, S.; Ansari, M.A. Impact of climate change on cereal production: Evidence from lower-middle-income countries. Environ. Sci. Pollut. Res. 2021, 28, 51597–51611. [Google Scholar] [CrossRef] [PubMed]
- Wurr, D.; Edmondson, R.; Fellows, J. Climate change: A response surface study of the effects of CO2 and temperature on the growth of French beans. J. Agric. Sci. 2000, 135, 379–387. [Google Scholar] [CrossRef] [Green Version]
Figure 1.
Distribution of precipitation in China, 2005–2009 (unit: millimeter, aggregated data from 2005 to 2009).
Figure 1.
Distribution of precipitation in China, 2005–2009 (unit: millimeter, aggregated data from 2005 to 2009).

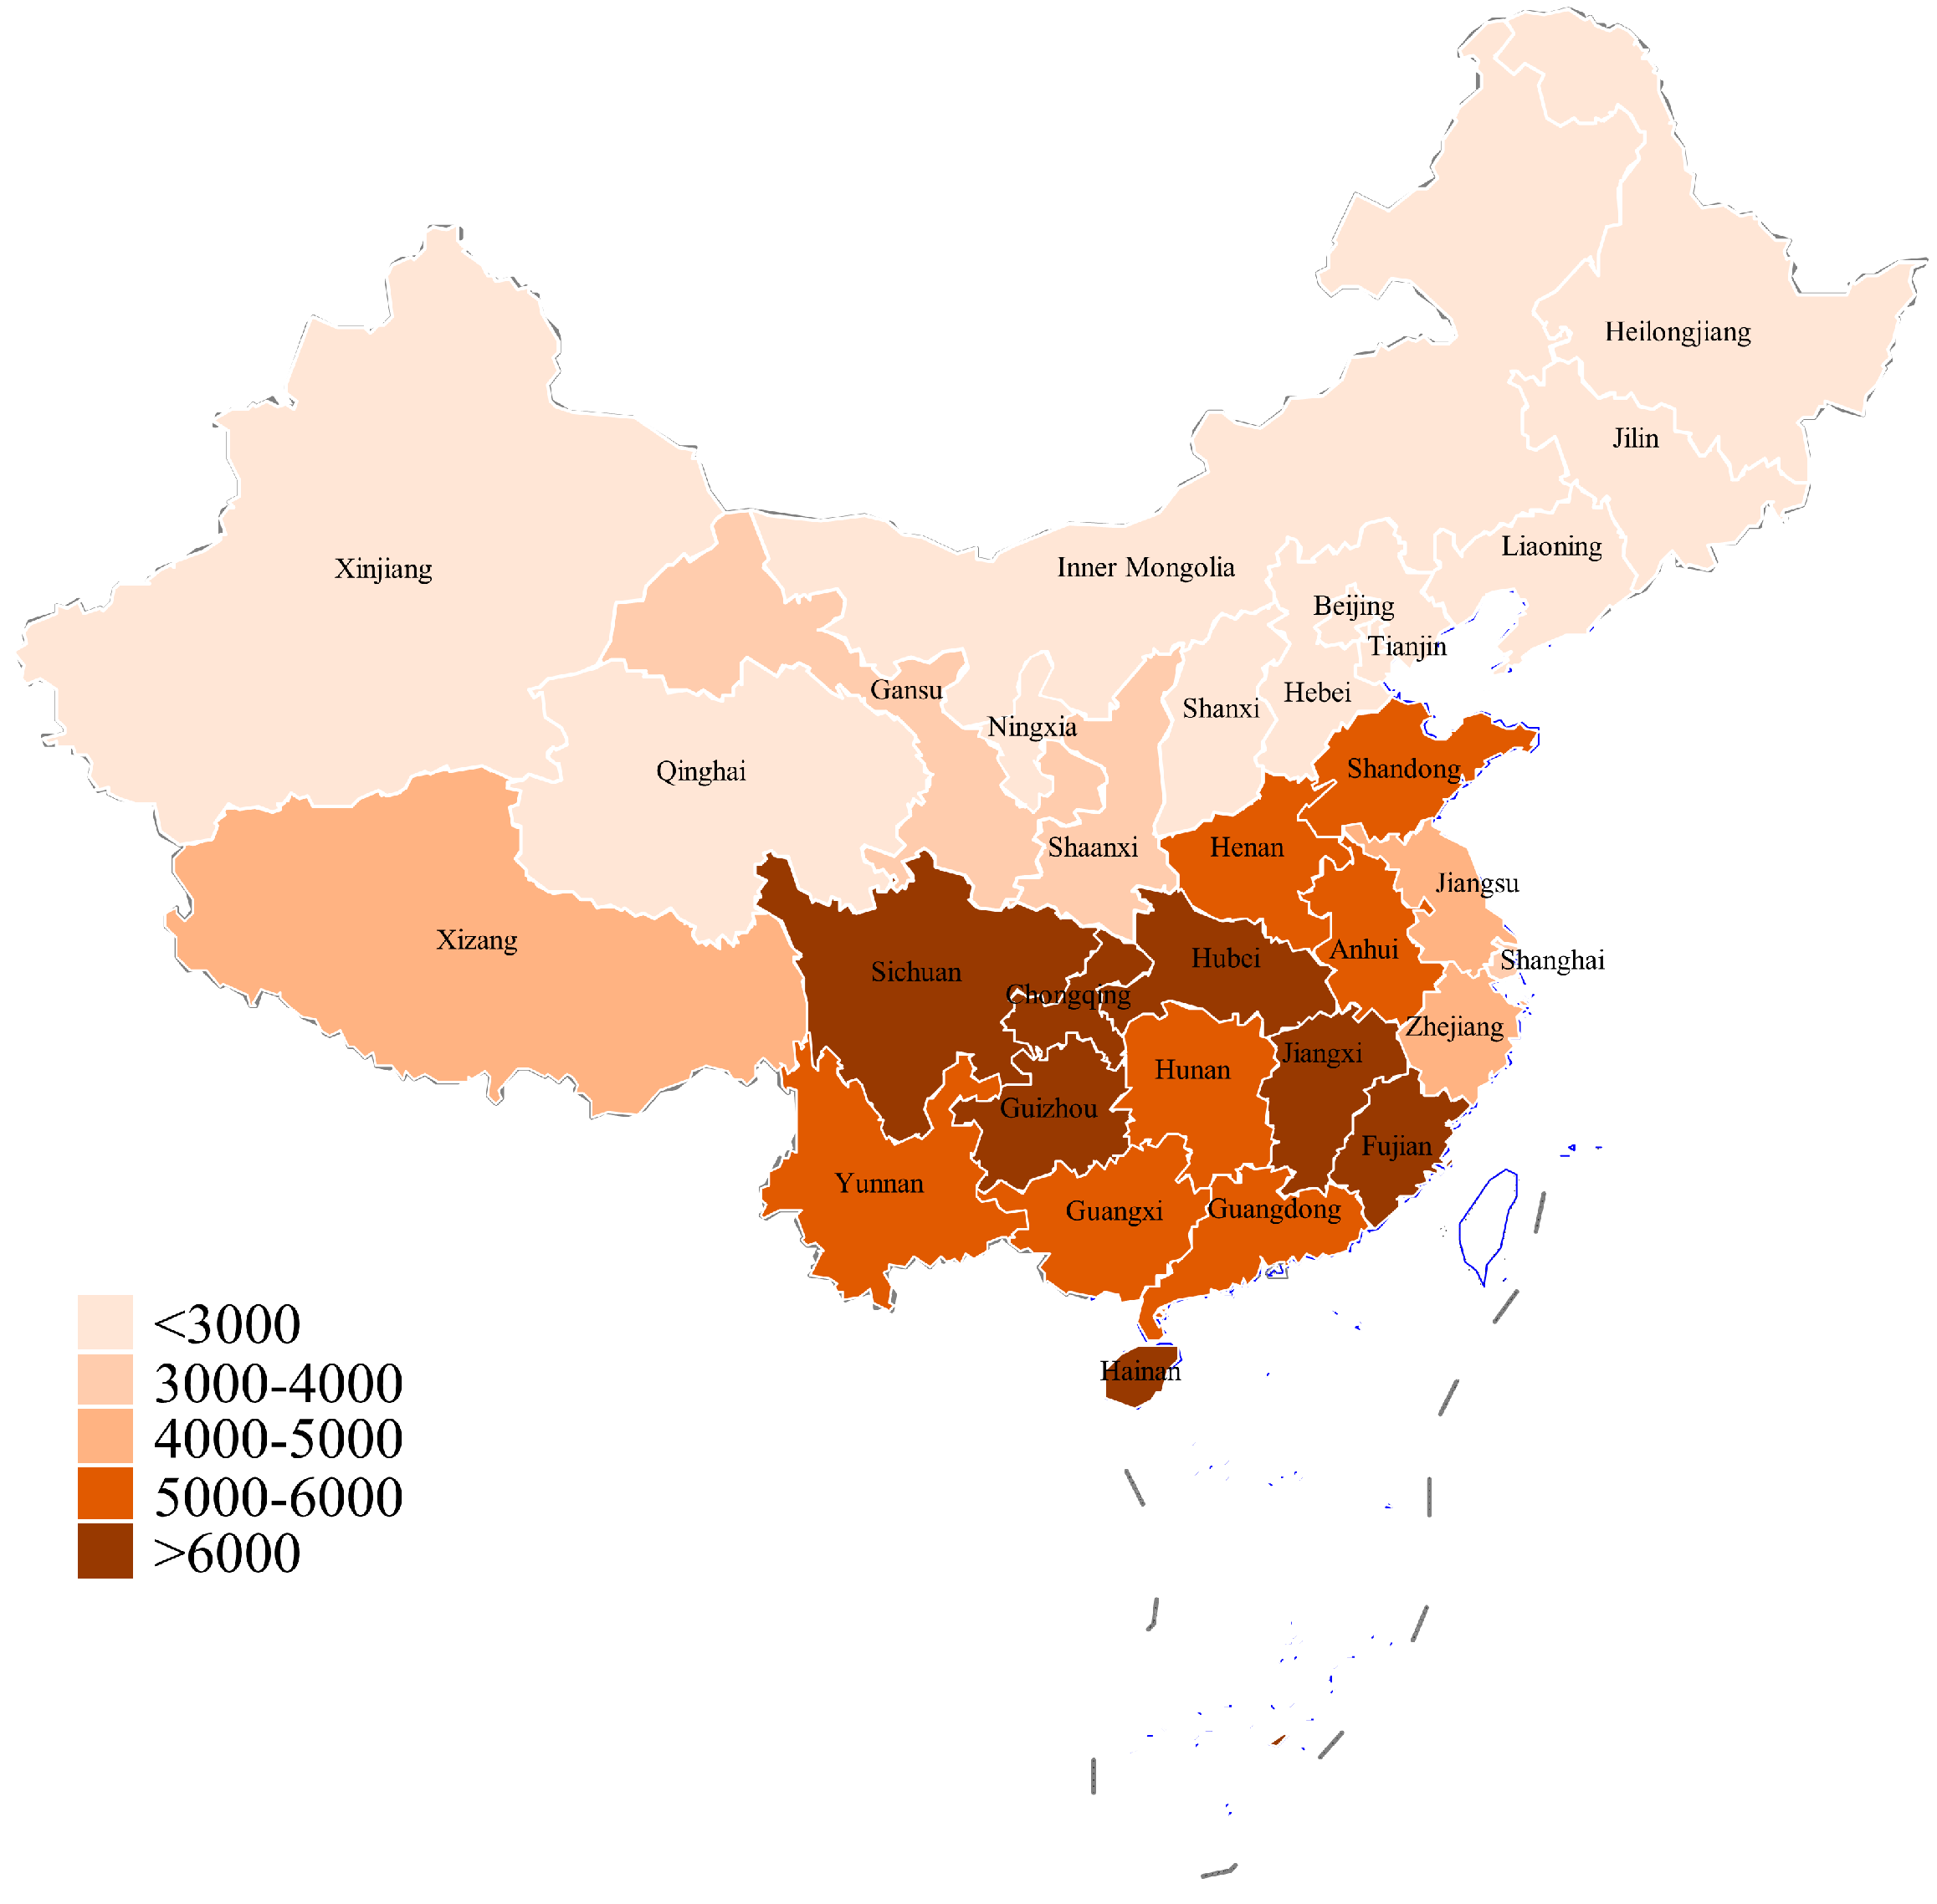
Figure 2.
Precipitation distribution in China, 2010–2014 (unit: millimeter, aggregated data from 2010 to 2014).
Figure 2.
Precipitation distribution in China, 2010–2014 (unit: millimeter, aggregated data from 2010 to 2014).

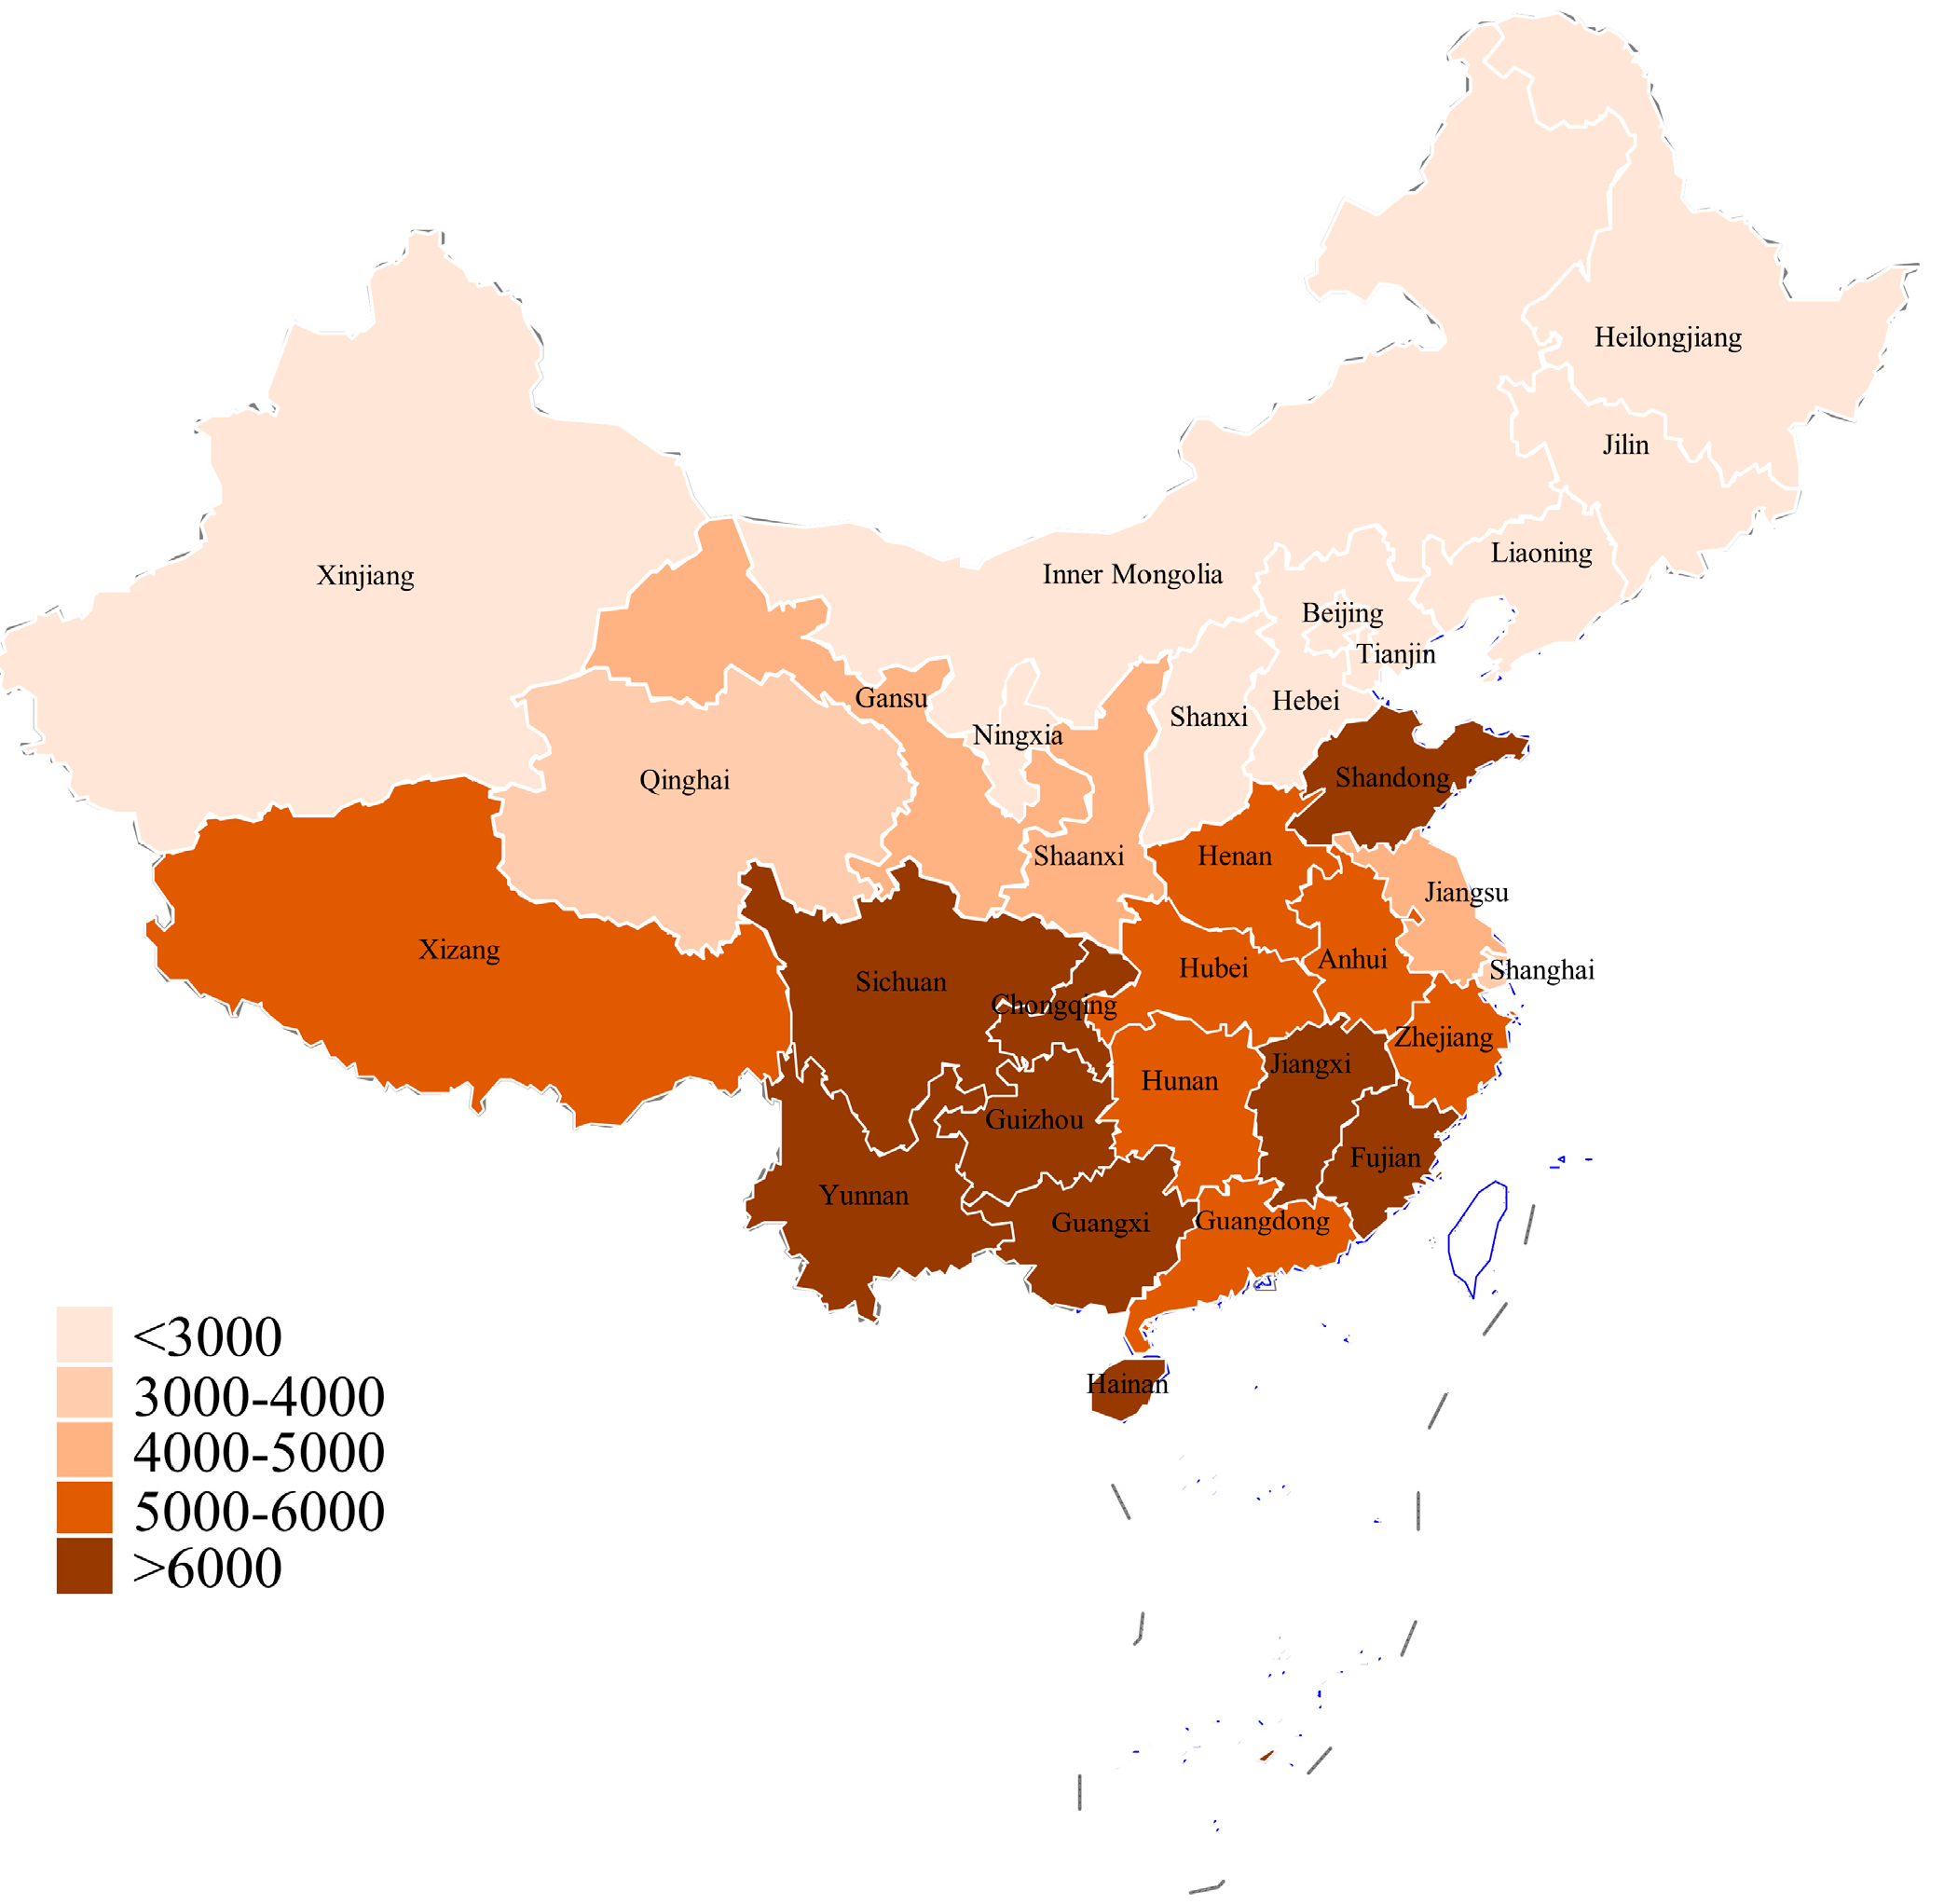
Figure 3.
Precipitation distribution in China, 2015–2019 (unit: millimeter, aggregated data from 2015 to 2019).
Figure 3.
Precipitation distribution in China, 2015–2019 (unit: millimeter, aggregated data from 2015 to 2019).


Table 1.
Table for selection of variable indicators.
| Explained and Explanatory Variables | Name of Indicator |
|---|---|
| Production of beans | Bean yields (per unit) |
| Climatic environment | Effective cumulative temperature |
| Precipitation (meteorology) | |
| Extent of disaster | |
| Carbon Emissions | |
| Sulfur dioxide emissions from exhaust gases | |
| Total wastewater discharge | |
| Economic market | Food benefit–cost ratio |
| Human cultivation behavior | Fertilizer use per unit area |
| Effective irrigated area ratio | |
| Level of technological development | Rural electricity consumption |
Table 2.
Descriptive statistics of the sample.
| Variable Name | Variable Identification | Unit | 2005–2009 | 2010–2014 | 2015–2019 | |||
|---|---|---|---|---|---|---|---|---|
| Average Value | Standard Deviation | Average Value | Standard Deviation | Average Value | Standard Deviation | |||
| Bean Yields | Yield | kg/ha | 1877.857 | 565.6416 | 1921.798 | 566.7584 | 2024.988 | 581.6842 |
| Effective Cumulative Temperature | EAT | degrees centigrade | 2566.77 | 972.2334 | 2525.814 | 948.9907 | 2598.245 | 969.6687 |
| Precipitation (Meteorology) | PRE | mm | 894.4729 | 416.7491 | 933.9605 | 436.7277 | 990.1309 | 478.927 |
| Extent of Disaster | DISASTER | times/ha | 0.3049891 | 0.156439 | 0.2023446 | 0.1127987 | 0.1386728 | 0.1045211 |
| Carbon Footprint | COAL | million tons | 256.1646 | 166.7895 | 396.4381 | 262.6799 | 446.6218 | 330.7543 |
| Sulfur Dioxide Emissions from Exhaust Gases | SO2 | million tons | 90.30312 | 44.34946 | 79.5552 | 37.38318 | 33.45112 | 26.404 |
| Total Wastewater Discharge | WASTE | million tons | 198,086.6 | 153076.4 | 245,094.4 | 183,915.9 | 265,363.5 | 203,324 |
| Food Benefit–cost Ratio | RATIO | 1.0303 | 0.0919729 | 1.024677 | 0.0604204 | 0.9843792 | 0.0406275 | |
| Fertilizer Use Per Unit Area | FER | kg/ha | 326.8883 | 108.8031 | 366.5041 | 126.2272 | 360.5308 | 134.1082 |
| Effective Irrigated Area Ratio | IRRI | 0.3855871 | 0.1445012 | 0.4070513 | 0.1502828 | 0.423296 | 0.1480573 | |
| Rural Electricity Consumption | POWER | billion kWh | 201.9817 | 286.5458 | 282.9348 | 402.312 | 323.7136 | 450.8923 |
Table 3.
Results of spatial autocorrelation test.
| Test Coefficient | Bean Yields |
|---|---|
| Moran‘s I | 0.201 ** |
| Geary’s c | 0.733 ** |
** denotes 5% level of significance.
Table 4.
Table of results of stability tests.
| Inspection Method | Test Results | |
|---|---|---|
| Ln(Yield) | LLC | −9.013 *** |
| HARDI | 15.238 *** | |
| IPS | −1.781 * | |
| EAT | LLC | −11.331 *** |
| HARDI | 7.187 *** | |
| IPS | −2.304 *** | |
| PRE | LLC | −12.314 *** |
| HARDI | 1.216 | |
| IPS | −2.236 *** | |
| DISASTER | LLC | −14.212 *** |
| HARDI | 12.848 | |
| IPS | −2.550 *** | |
| COAL | LLC | −4.327 ** |
| HARDI | 37.559 *** | |
| IPS | −1.175 | |
| SO2 | LLC | −3.725 |
| HARDI | 33.522 *** | |
| IPS | −0.717 | |
| WASTE | LLC | −5.141 * |
| HARDI | 34.790 *** | |
| IPS | −0.988 | |
| RATIO | LLC | −19.627 *** |
| HARDI | −1.484 | |
| IPS | −3.602 *** | |
| FER | LLC | −8.599 *** |
| HARDI | 27.550 *** | |
| IPS | −1.588 | |
| IRRI | LLC | −12.055 *** |
| HARDI | 28.060 *** | |
| IPS | −2.329 *** | |
| POWER | LLC | −7.422 *** |
| HARDI | 37.509 *** | |
| IPS | −1.374 |
*** denotes 1% level of significance. ** denotes 5% level of significance. * denotes 10% level of significance.
Table 5.
LM test results.
| Spatial Error | |
|---|---|
| Moran’s I | 15.347 *** |
| Lagrange multiplier | 204.345 *** |
| Robust Lagrange multiplier | 13.433 *** |
*** denotes 1% level of significance.
Table 6.
Hausman test results.
| Coef. | Std. Err. | p-Value | |
|---|---|---|---|
| _Cons | 7.200671 *** | 0.2130221 | 0.000 |
| EAT | 0.000091 * | 0.0000525 | 0.083 |
| PRE | 0.0000683 | 0.0000633 | 0.280 |
| DISASTER | −0.1533701 ** | 0.0771955 | 0.047 |
| COAL | 2.58929 *** | 0.7248598 | 0.000 |
| SO2 | −0.4844776 | 3.493605 | 0.890 |
| WASTE | −0.0051428 ** | 0.0022797 | 0.024 |
| RATIO | −0.1334411 | 0.1251934 | 0.286 |
| FER | −0.0001154 | 0.0002452 | 0.638 |
| IRRI | 0.6176916 *** | 0.2025145 | 0.002 |
| POWER | 0.0000286 | 0.0001004 | 0.775 |
*** denotes 1% level of significance. ** denotes 5% level of significance. * denotes 10% level of significance. H0: Difference in coefficients not systematic chi2(11) = 31.74 Prob > = chi2 = 0.0008.
Table 7.
Regression results of panel spatial error model.
| Coef. | Std. Err. | p-Value | |
|---|---|---|---|
| EAT | −0.0002578 *** | 0.0000468 | 0.000 |
| PRE | 0.0004895 *** | 0.0000757 | 0.000 |
| DISASTER | −0.6823345 *** | 0.1305011 | 0.000 |
| COAL | −0.00009 | 0.000079 | 0.254 |
| SO2 | 0.0015519 *** | 0.0006016 | 0.010 |
| WASTE | 7.67 × 10⁻⁷ *** | 2.38 × 10⁻⁷ | 0.001 |
| RATIO | 0.227392 | 0.3739179 | 0.543 |
| FER | 0.0002584 | 0.0001873 | 0.168 |
| IRRI | 1.03056 *** | 0.128758 | 0.000 |
| POWER | −0.000172 ** | 0.0000844 | 0.041 |
| within | between | overall | |
| R-sq | 0.0094 | 0.5439 | 0.2793 |
*** denotes 1% level of significance. ** denotes 5% level of significance.
Publisher’s Note: MDPI stays neutral with regard to jurisdictional claims in published maps and institutional affiliations. |
© 2021 by the authors. Licensee MDPI, Basel, Switzerland. This article is an open access article distributed under the terms and conditions of the Creative Commons Attribution (CC BY) license (https://creativecommons.org/licenses/by/4.0/).
Share and Cite
MDPI and ACS Style
Li, S.; You, S.; Song, Z.; Zhang, L.; Liu, Y. Impacts of Climate and Environmental Change on Bean Cultivation in China. Atmosphere 2021, 12, 1591. https://0-doi-org.brum.beds.ac.uk/10.3390/atmos12121591
AMA Style
Li S, You S, Song Z, Zhang L, Liu Y. Impacts of Climate and Environmental Change on Bean Cultivation in China. Atmosphere. 2021; 12(12):1591. https://0-doi-org.brum.beds.ac.uk/10.3390/atmos12121591
Chicago/Turabian StyleLi, Sidan, Shibing You, Ze Song, Li Zhang, and Yixuan Liu. 2021. "Impacts of Climate and Environmental Change on Bean Cultivation in China" Atmosphere 12, no. 12: 1591. https://0-doi-org.brum.beds.ac.uk/10.3390/atmos12121591
Note that from the first issue of 2016, this journal uses article numbers instead of page numbers. See further details here.