Article

Seasonal and Spatial Variation of Volatile Organic Compounds in Ambient Air of Almaty City, Kazakhstan

Center of Physical-Chemical Methods of Research and Analysis, Al-Farabi Kazakh National University, Almaty 050040, Kazakhstan
*
Author to whom correspondence should be addressed.
Submission received: 3 November 2021 / Revised: 26 November 2021 / Accepted: 27 November 2021 / Published: 29 November 2021
(This article belongs to the Special Issue VOC Sensing and Measurements)

Abstract

:
Air pollution is one of the primary sources of risk to human health in the world. In this study, seasonal and spatial variations of multiple volatile organic compounds (VOCs) were measured at six sampling sites in Almaty, Kazakhstan. The seasonal and spatial variations of 19 VOCs were evaluated in 2020, including the periods before and after COVID-19 lockdown. The concentrations of 9 out of 19 VOCs had been changed significantly (p < 0.01) during 2020. The maximum concentrations of total VOCs (TVOCs) were observed on 15, 17, and 19 January and ranged from 233 to 420 µg m−3. The spatial distribution of TVOCs concentrations in the air during sampling seasons correlated with the elevation and increased from southern to northern part of Almaty, where Combined Heat and Power Plants are located. The sources of air pollution by VOCs were studied by correlations analysis and BTEX ratios. The ranges of toluene to benzene ratio and benzene, toluene, and ethylbenzene demonstrated two primary sources of BTEX in 2020: traffic emissions and biomass/biofuel/coal burning. Most of m-, p-xylenes to ethylbenzene ratios in this study were lower than 3 in all sampling periods, evidencing the presence of aged air masses at studied sampling sites from remote sources.

1. Introduction

Air pollution leads to a disturbance of the ecosystem and substantial economic and social damages. In 2020, Kazakhstan was ranked as the 32nd most polluted country in the world, with an annual average PM2.5 concentration of 21.9 µg m−3 [1]. Exceeding concentrations of PM2.5 caused about 8134 premature deaths of adults annually in 2015–2017 in 21 cities of Kazakhstan [2].
Almaty, the former capital and the largest (2 million people) [3] city of Kazakhstan, is located in the center of the Eurasian continental area at the foot of the Trans-Ili Alatau Mountains, with a continental climate covering 700 km2. The urban part of Almaty is situated from 600 (in the north) to 1400 m (in the south) above sea level, while the elevation of the mountainous areas reaches up to 4000 m. The geographical location of the city and air movements from the mountains can cause temperature inversion, which may affect the pollution dispersion. Electricity and heat in Almaty are provided by three Combined Heat and Power Plants (CHP-1, CHP-2, CHP-3). The CHP-2 and CHP-3 are located within and 3 km away from the city, respectively. The CHP-1 uses natural gas as a fuel, while CHP-2 and CHP-3 burn approximately 3.7 million tons of low-grade coal with a high ash content (~40%) annually [4]. Advanced emissions-control technologies (desulphurization, denitrification) are not used at coal power plants, and the removal of pollutants is not reported. The number of registered passenger cars of Almaty is about 467 thousand, with additional vehicles from suburban areas of the city [5].
Almaty is one of the most polluted cities in Kazakhstan with unacceptable carcinogenic risk, high acute and chronic effects, and a high hazard index for the respiratory system’s chronic exposure [6]. It was observed that outdoor workers in Almaty are at high risk of respiratory diseases in the cold season [7].
The number of studies based on the assessment of air quality in Almaty is very limited. The majority of existing studies use data of inorganic air pollutants from information bulletin published by the National Hydrometeorological Service of Kazakhstan “Kazhydromet”, which is the only legally responsible organization in Kazakhstan continuously monitoring the air pollution. Currently, the monitoring program of “Kazhydromet” determines only two volatile organic compounds (VOCs), formaldehyde and phenol.
VOCs, a diverse group with a biogenic (BVOCs) and anthropogenic origin, include hazardous to health air pollutants [8] and contribute to the formation of ozone [9,10], the main component of photochemical smog [11]. Ozone air pollution negatively affects agriculture [12] and causes respiratory and cardiovascular mortality [13]. Although most BVOCs are not hazardous, they should be controlled with anthropogenic VOCs and NOx [14]. Exposure to individual VOCs can lead to the possible development of respiratory diseases such as asthma [15], chronic obstructive pulmonary disease [16], etc. A group of VOCs known as BTEX (benzene, toluene, ethylbenzene, and xylenes) deserves special emphasis [17] due to high toxicity and well-known carcinogenicity (benzene—Group 1 by IARC) [18].
Previous studies were aimed at the effect of inorganic air pollutants on human health [2,6,7], evaluation of air pollution data and environmental situation [19], spatiotemporal variations and contributing factors of inorganic air pollutants [20], characteristics [21], and traffic component of air pollution in Almaty [22], quantification of VOCs, including BTEX in Almaty under the application of developed simple and cost-effective methods [23,24], and accessing of air quality during COVID-19 lockdown [25].
Data on the VOCs concentrations are not available for all cities in Kazakhstan, except Almaty, where only several short-term studies were carried out [22,23,24,25,26]. Based on partial order methodology [26], environmental pollution studies ranked Almaty the 8th most polluted city by BTEX in 20 major cities worldwide. According to the previous study [23], average concentrations of BTEX in ambient air of Almaty on 31 March–4 April 2015 were 53, 57, 11, and 14 µg m−3, respectively. The maximum benzene concentration was 237 µg m−3, comparable with highly polluted cities, such as New Delhi, Cairo, and Rome [23]. On 30 March–4 April 2019, the mean concentrations of benzene homologues, alkanes, polycyclic aromatic compounds, and chlorinated VOCs were in the range of 0.1–81, 5–123, 1.3–2.6, and 0.1–53 µg m−3, respectively [24].
Air pollution in Almaty has a complex nature [25]. It may be caused by various factors, including the geographical location of the city, meteorological conditions, several manufacturing enterprises, a vast number of vehicles, and coal combustion at power plants. The appropriate identification of the sources of emissions in Almaty remains a challenge due to the lack of capacity, outdated methodologies, scarcity of data, and nontransparent energy statistics. In addition, previous short-term studies are insufficient for a detailed description of VOCs concentrations and their sources in the air of Almaty. The assessment of spatial and seasonal variations of VOCs and their possible sources are needed for developing effective measures for air quality improvement by reducing harmful emissions.
Therefore, the goals of this study were to evaluate (1) seasonal variation of VOCs in the air in 2020, (2) spatial distribution of total VOCs (TVOCs) by season, and (3) to identify the emission sources of BTEX.

2. Materials and Methods

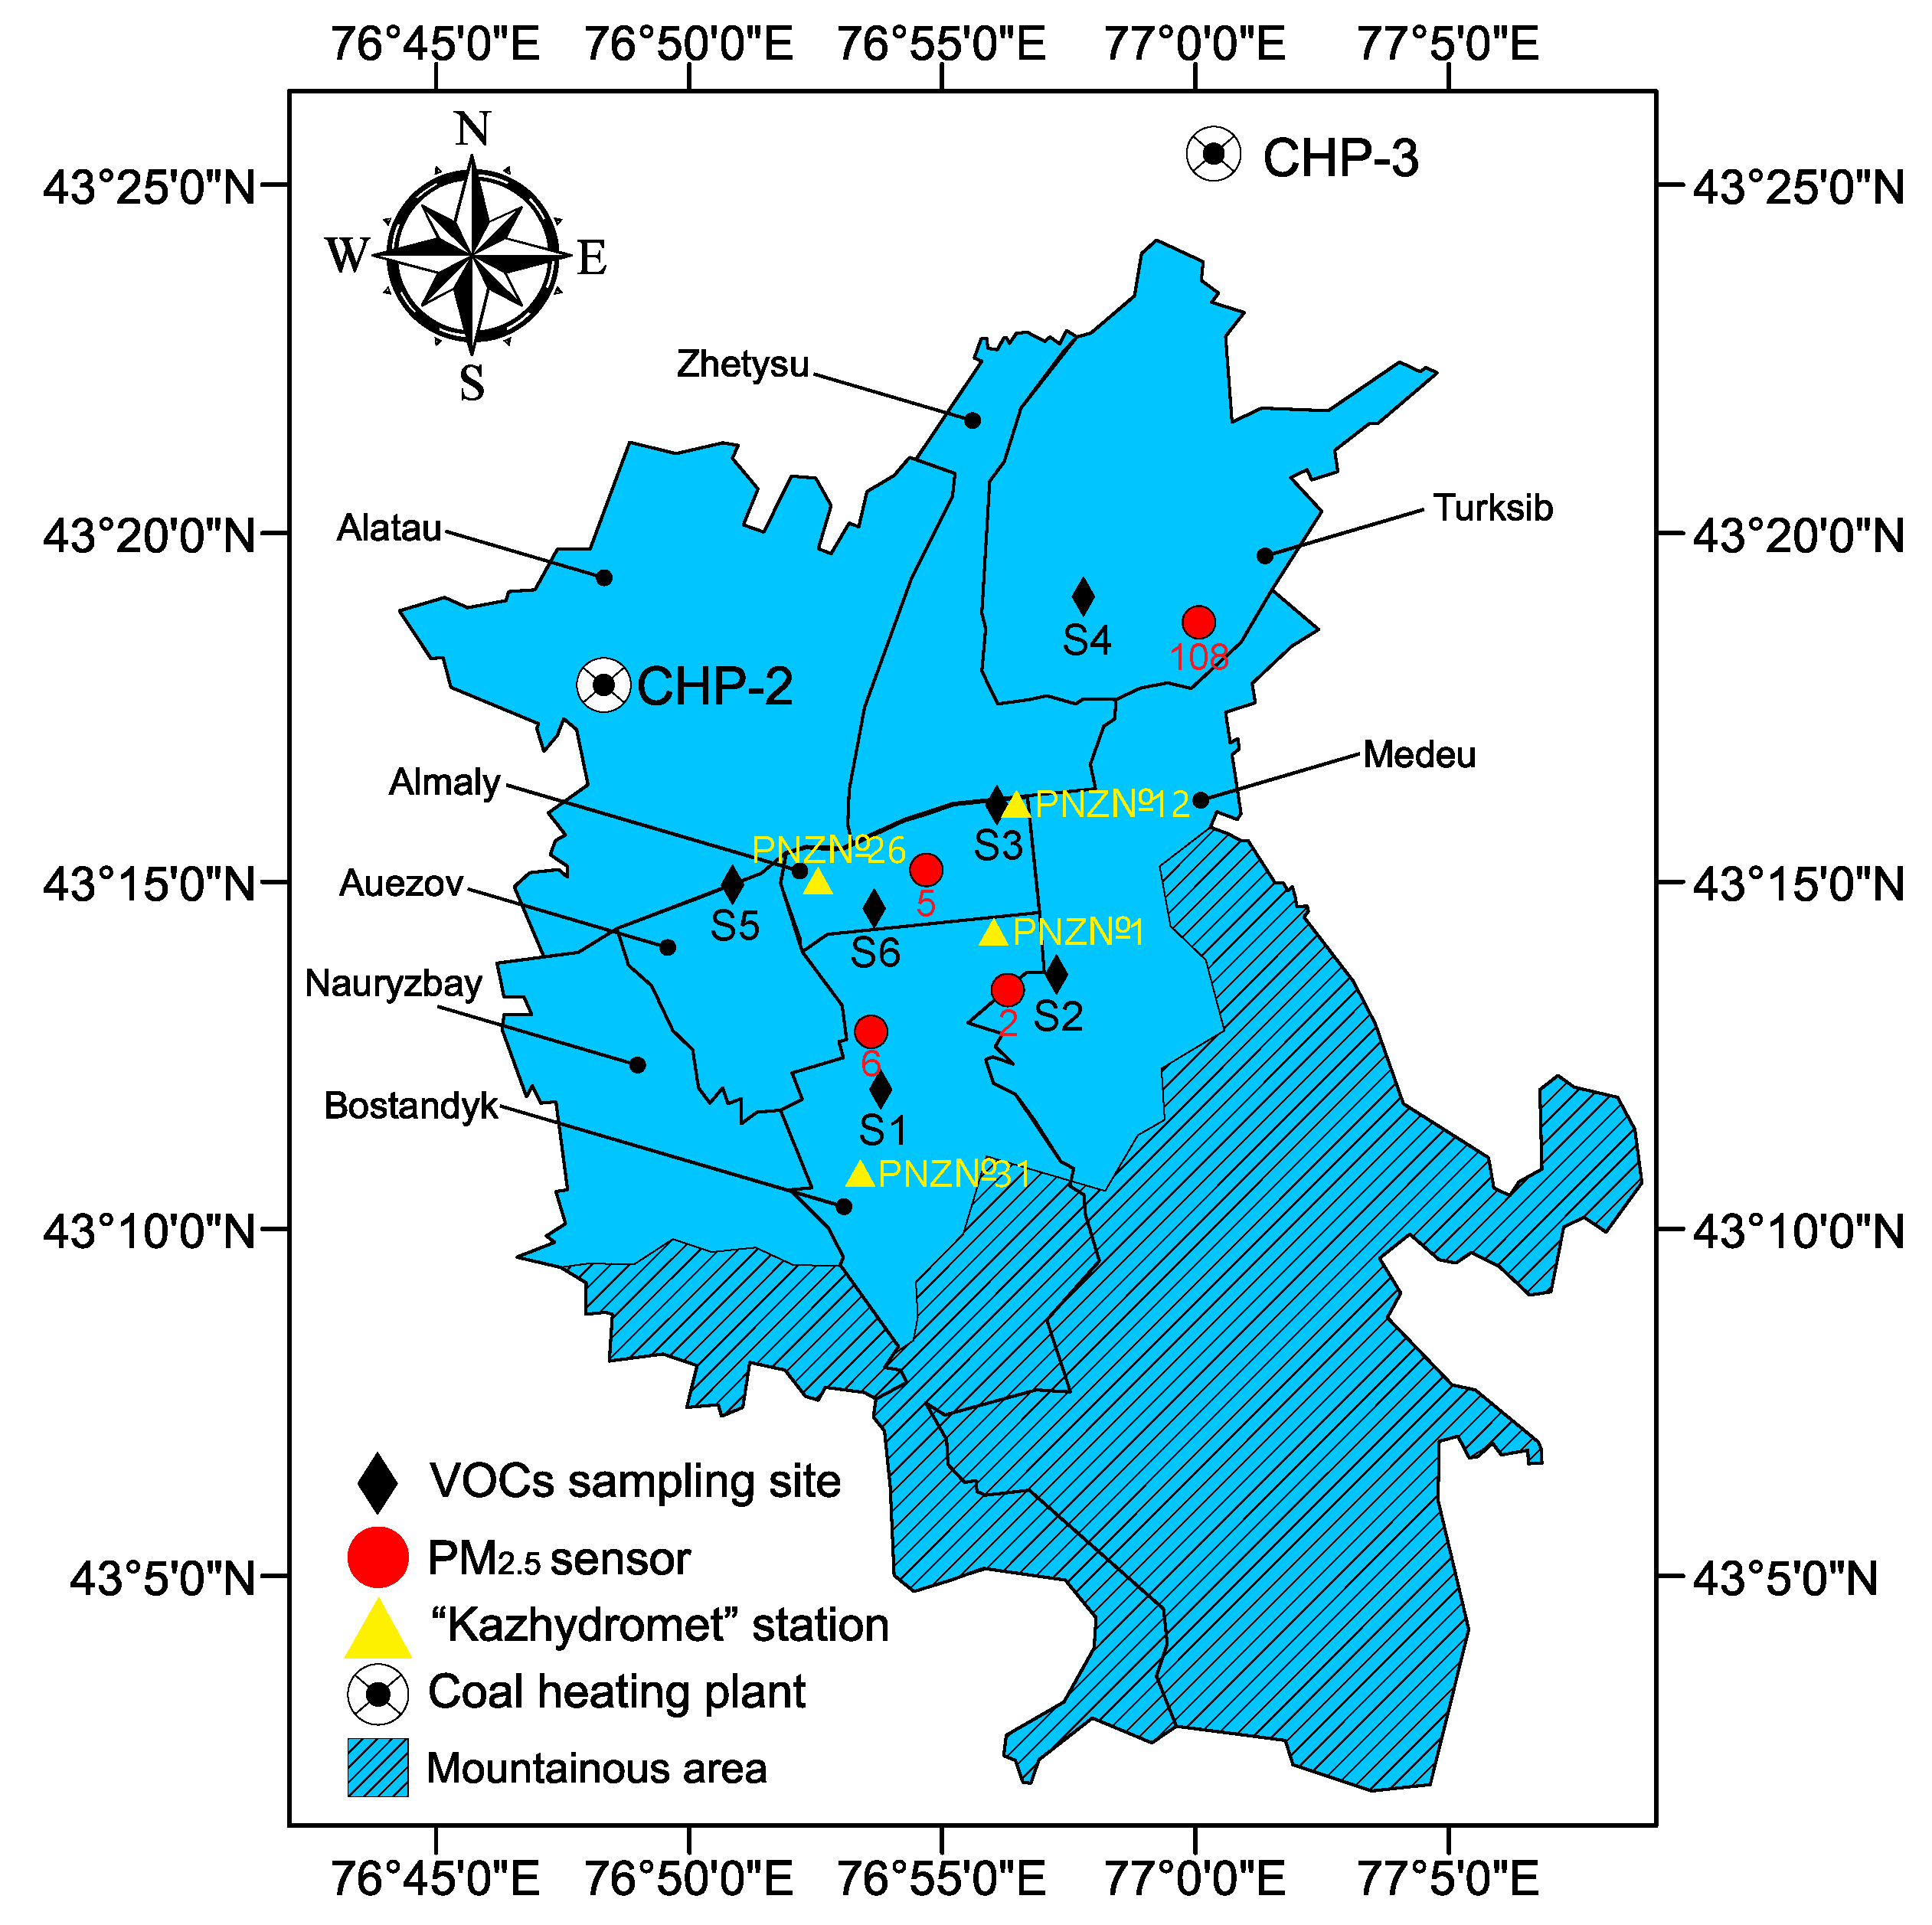
2.1. Description of Sampling Sites

Air sampling of VOCs was conducted at six sites S1–S6 (Table 1). Each sampling site was more than 15 m away from the road. VOCs sampling locations were selected to represent five districts (Almaly, Auezov, Bostandyk, Medeu, and Turksib) of Almaty (Figure 1).
Average temperatures in sampling periods in winter, spring, summer, and autumn in Almaty in 2020 were −5.7, 15.8, 24.3, and 9.3 ℃, respectively. The heating season in Almaty lasted from 15 October 2019 to 21 April 2020 and resumed on 28 September 2020.
Concentrations of NO2, SO2, and CO were obtained from The National Air Quality Monitoring Network (NAQMN) operated by the National Hydrometeorological Service of Kazakhstan “Kazhydromet” and were used for correlation analysis. Air is analyzed using OP-824TTs and OP-280 aspirators, K-100 gas analyzer, and AFA-VP-20-1 filters (JSC OPTEK, Saint Petersburg, Russia). Data are published each month and year by “Kazhydromet” in the information bulletins [27].
The data of PM2.5 were obtained from the public network “Airkaz” [28], which uses PM2.5 sensors (The Plantower Pms5003, Beijing, China) for air quality monitoring based on PM2.5 concentrations. Four stations (Figure 1, Table S1 in Supplementary Materials) of the network, close to VOCs sampling sites, were selected for this study. Due to technical problems of sensors, 23.3% of the data on PM2.5 concentrations were omitted.
Spatial distribution of total VOCs (TVOCs) across Almaty in different sampling periods in 2020 were obtained using Geographic Information System software—ArcGIS (ArcMap 10.8.1) and cokriging Geostatistical Analyst tool. A simple cokriging method with normal score transformation and exponential model of semivariogram was used to build the map for the primary dataset. As a secondary dataset, the digital elevation model (DEM) of Almaty was used. The DEM was obtained from United States Geological Survey and Shuttle Radar Topography Mission data.

2.2. Sampling and Analysis of VOCs

The list of VOCs is provided in Table 3. Air samples were collected at the height of 1.5 m above the ground. Samples were collected at 9 A.M. and 9 P.M. on 15, 17, and 19 January (winter); 3, 5, and 7 April (spring: heating period); 28, 30 April, and 3 May (spring: non-heating period); 22, 24, and 26 July (summer); 21, 23, and 25 October (autumn) (Table 2). The obtained data do not represent the whole season due to limited sampling days.
Air sampling and analysis were carried out by the methods described by Baimatova et al. [23] and Ibragimova et al. [24]. Air samples were collected in triplicates into 20 mL crimp-top vials (Zhejiang Aijiren Technology Inc., Quzhou, Zhejiang, China). Solid-phase microextraction of VOCs from 20 mL vials was conducted using exposed 65 µm Divinylbenzene/Polydimethylsiloxane (DVB/PDMS) (Supelco, Bellefonte, PA, USA) at 22 °C (room temperature) for 10 min followed by analysis on 7890A/5975C Triple-Axis Detector diffusion pump-based gas chromatography with mass-spectrometric detection (GC-MS, Agilent, Wilmington, DE, USA). A detailed description of the parameters of GC-MS analysis is provided in [24]. Calibration curves (R2 = 0.97–0.99) were obtained before each sampling day. The concentrations units (µg m−3) of VOCs were not adjusted to temperature and pressure changes between sampling sites and analysis, contributing uncertainties to concentration measurement. Thirty-six samples were taken on each sampling day; the total number of the analyzed samples was 540 (180 measurements in triplicates).

2.3. Data Collection and Pre-Processing

Meteorological parameters (temperature, wind speed, pressure, and air humidity) were taken from [29] (Table S2 in Supplementary Materials).
Descriptive statistics of the VOC concentrations during study periods are presented in Table 3. Data of VOCs concentrations lower than LODs (23.8% from the total number of measurements) and outliers (4.9% of the total number of samples) were omitted.
The mean concentrations of benzene, toluene, methylene chloride, and n-heptane in all sampling days and sampling sites ranged from 23 to 64 µg m−3. The maximum benzene concentration exceeded Kazakhstan 24-h limit (100 µg m−3 [30]) by 3.4 times during the sampling period. The Kazakhstan benzene limit is 2.5 and 25.6 times higher than those in Belarus (40 µg m−3) and Israel (3.9 µg m−3), respectively [31]. While the mean concentrations of ethylbenzene, m-, p-xylenes, o-xylene, 1,2,4-trimethylbenzene, phenol, benzaldehyde, 3-picoline, naphthalene, 1,3,5-trimethylbenzene, and n-decane were 1.2–8.5 µg m−3 and for propylbenzene, and fluorene—0.53–0.96 µg m−3.
The data of PM2.5 and inorganic pollutants with concentrations lower than LODs (6.2% of the measurements) were omitted. The mean concentrations of NO2, PM2.5, SO2, and CO during the studied period were 81, 44, 8.4, and 1.2 µg m−3, respectively (Table 4). Maximum concentrations of NO2 (436 µg m−3) and PM2.5 (260 µg m−3) exceeded WHO limits by 17 times (Table 4).

3. Results and Discussion

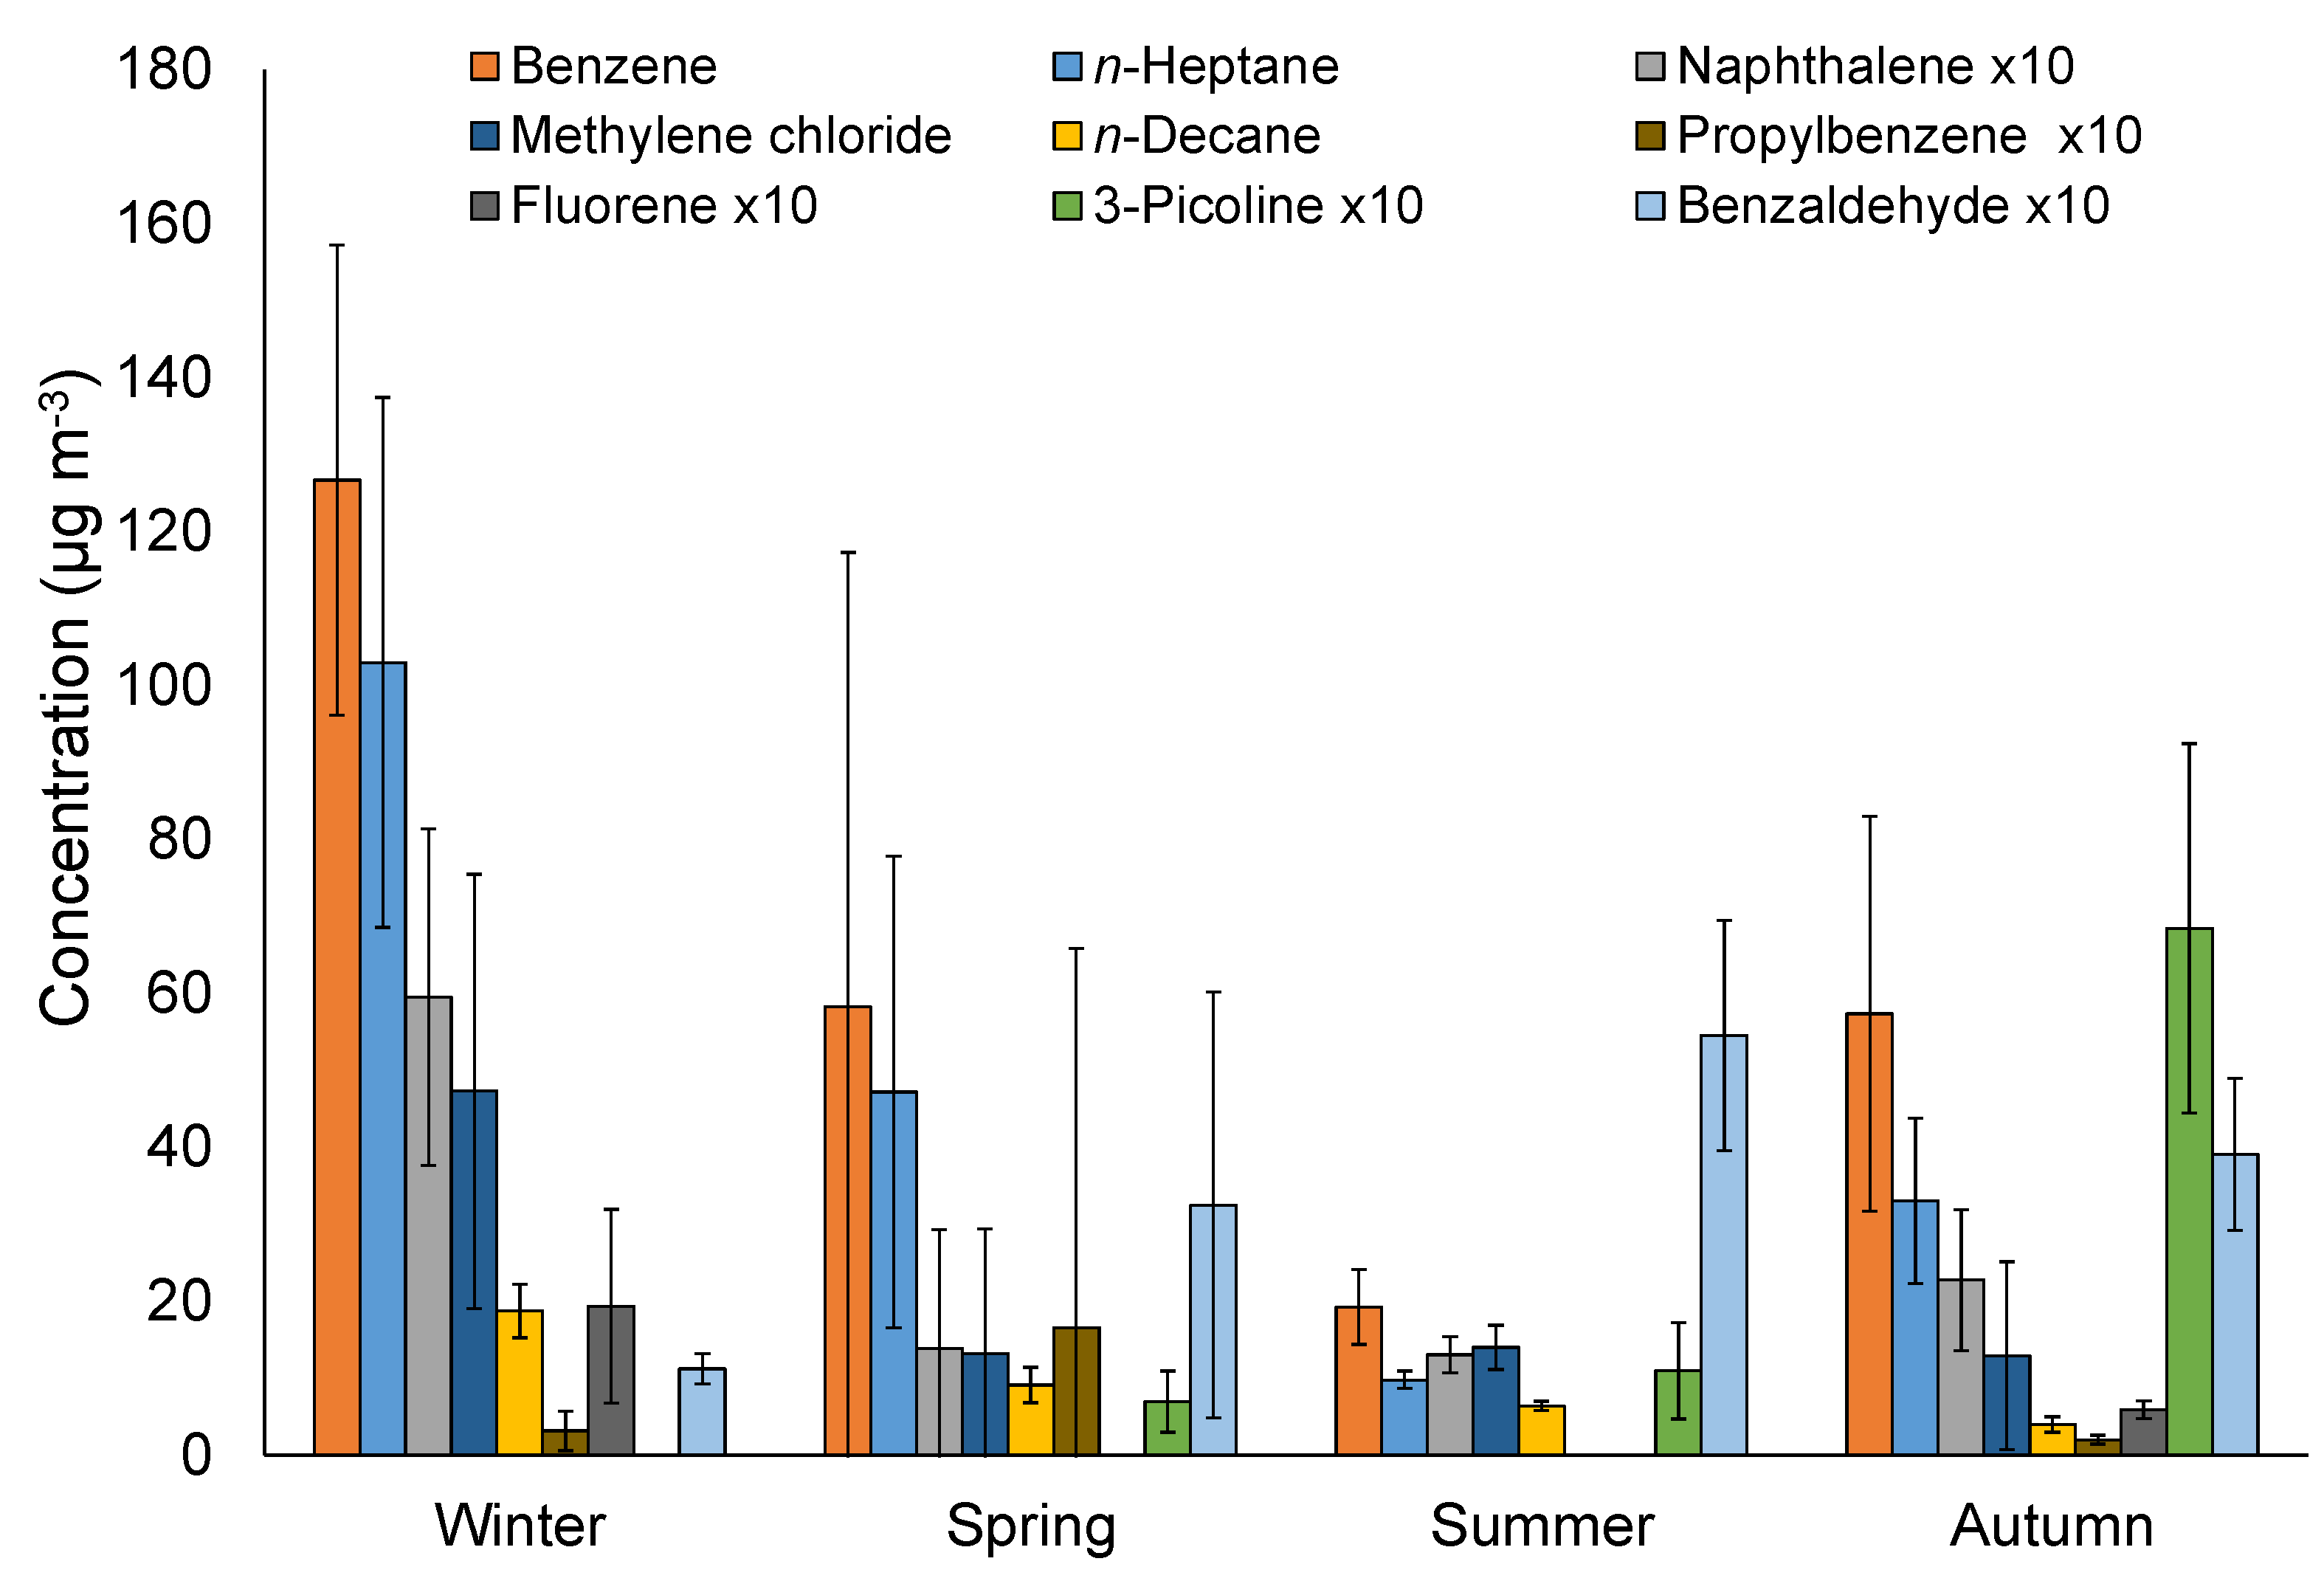
3.1. Average Seasonal Variations of VOCs

Significant seasonal variations (one-way ANOVA, Tukey test, p < 0.01) were observed for 9 out of 19 VOCs (Figure 2). However, those 9 VOCs (benzene, propylbenzene, benzaldehyde, 3-picoline, naphthalene, fluorene, methylene chloride, n-decane, and n-heptane) resulted in a non-significant or low correlation with humidity and precipitation (Table S3 in Supplementary Materials). The pollutants correlated negatively with temperature and positively with pressure except for benzaldehyde, which exhibited a reverse trend. The increasing benzaldehyde level by 5 times in sampling days in summer compared to winter can be caused by higher photochemical activity in that season, leading to secondary carbonyl compounds. Similar seasonal variations were obtained by Liu et al. [32], who proposed that the primary source of benzaldehyde is vehicle emissions.
The concentrations of n-heptane, naphthalene, and benzene decreased gradually by 78–90% from winter to summer sampling days and then increased by 2–3 times in sampling days in autumn (Figure 2). Fluorene concentrations were detected in winter and autumn sampling periods, while in spring and summer, concentrations were below LODs. Moreover, in the winter sampling periods, the maximum concentrations of n-decane (19 µg m−3) and methylene chloride (47 µg m−3) were observed.
The high levels of the above-mentioned VOCs in sampling periods in winter can be attributed to meteorological conditions of Almaty and specific geographic location [20]. During winter sampling, the mean temperature and pressure were −5.7 °C and 775 mm Hg, while during sampling in spring, summer, and autumn, it varied from 9.3 to 24.3 °C and from 762 to 768 mm Hg. The highest average wind speed was observed during the sampling period in summer (1.5 m s−1); in other seasons’ sampling periods, average wind speed ranged from 0.2 to 0.3 m s−1. Liang et al. [33] proposed that high TVOCs concentrations in the heating season (winter) can be attributed to the decreasing VOCs photodegradation. In addition, high concentrations of VOCs in winter may be associated with poorer dispersion conditions caused by high pressure [34], low planetary boundary layer heights, or the presence of low-level inversion layers.
The seasonal variations of toluene, 1,2-dichloroethane, ethylbenzene, m-, p-, o-xylenes, propylbenzene, chlorobenzene, 1,3,5-trimethylbenzene, 1,2,4-trimethylbenzene, and phenol were insignificant and varied from 0.070 to 61 µg m−3 (Figure S1 in Supplementary Materials).
The mean spring sampling period concentrations of VOCs were calculated as mean concentrations of sampling days in heating (3, 5, 7 April) and non-heating (28, 30 April, and 3 May) periods. Above-mentioned periods were chosen for sampling in spring for evaluation effect of the heating season, which ended a week before sampling on 28 April. Moreover, the sampling period in 3–7 April coincided with the COVID-19 lockdown in Kazakhstan (19 March–13 April) with the absence of traffic activity [35]. Kerimray et al. [25] assessed the effect of the lockdown restrictions on benzene, toluene, ethylbenzene, and o-xylene emissions by comparing their concentrations in April 2020 with the same period in the previous years from 2015 to 2019. Authors proposed that an increase of benzene and toluene concentrations by 2–3 times in 2020 indicated the non-traffic sources and can be related to no-precipitation conditions during sampling. In addition, the COVID-19 lockdown period can be associated with higher coal combustion by private houses and bathhouses (saunas) [25].
The significant reduction of n-heptane, methylene chloride, benzene, n-decane, toluene, 1,2-dichloroethane, and naphthalene by 27–90% (t-test, p < 0.05) was observed in the heating period compared to the non-heating period in spring (Figure 3).
Temperatures (14.0 vs. 17.6 °C) and pressure (763 vs. 760 mm Hg) were comparable in both spring sampling periods. Therefore, such reduction may indicate that coal combustion during the heating season primarily affected the emissions of the above-mentioned VOCs. The obtained results of benzene and toluene emissions are in agreement with Kerimray et al. [25].
A significant increase by 2–5-fold of ethylbenzene and benzaldehyde concentrations was observed from the heating period to the non-heating period in spring, which can be explained by a substantial reduction of traffic in the heating period due to the lockdown and resuming traffic in the non-heating period [35]. A similar effect of traffic-free conditions was observed by Kerimray et al. [25], when concentrations of ethylbenzene and o-xylene decreased by 4 and 2.7 times in April 2020 (lockdown) compared to the same period in 2015–2019. The variations of mean concentrations of the rest of the analytes were insignificant and varied from 0.36 to 3.1 µg m−3 (Figure 3).

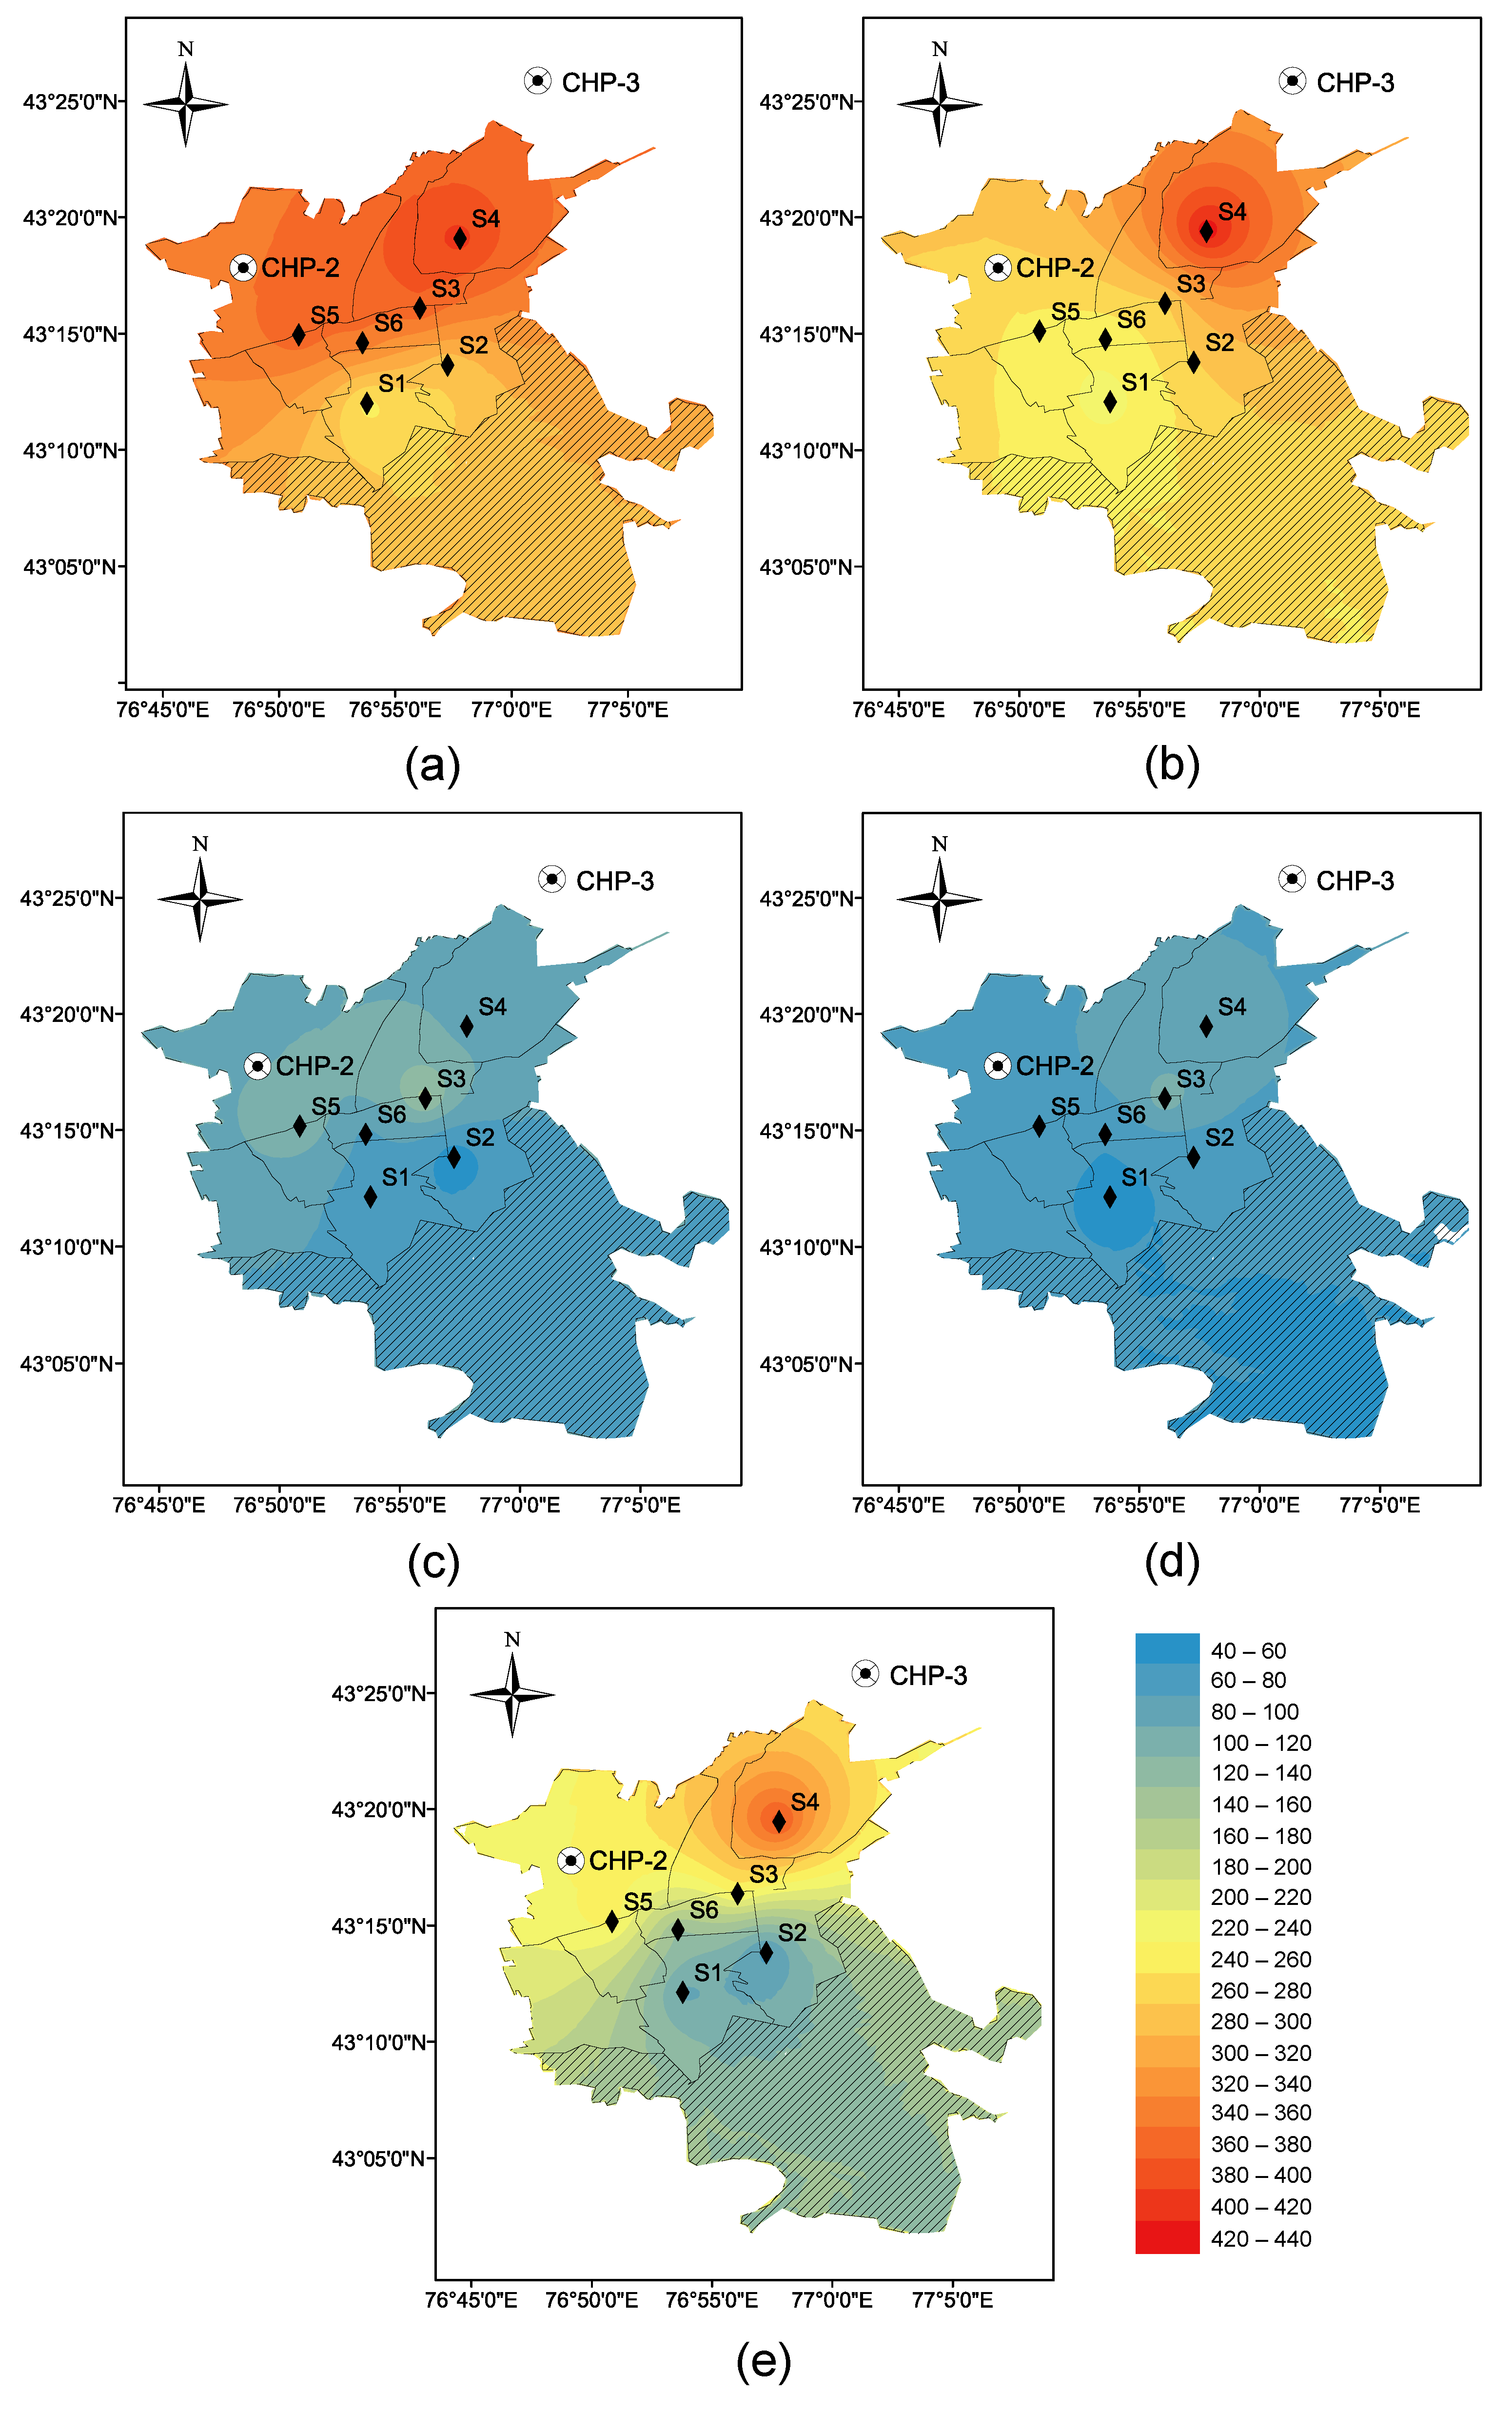
3.2. Spatial Differences of VOCs

The total VOCs concentrations (the sum of the mean concentrations of individual VOCs during the sampling period) varied across sampling sites during all seasons in 2020. The total VOCs variations were from 233 to 420, from 231 to 437, from 48 to 151, from 46 to 133, and from 72 to 393 µg m−3 in sampling days in January, April, April–May, July, and October, respectively. TVOCs concentrations decreased on 28, 30 April, and 3 May by an average of 74 and 67% compared to 15, 17, 19 January and 3, 5, 7 April, respectively.
The spatial distribution of TVOCs (Figure 4) varied from the south to the north. All sampling seasons had a similar spatial profile, with lower TVOCs concentrations in the south and higher in the north of Almaty, where CHPs are located. 15, 17, 19 January and 21, 23, 25 October were characterized by a strong negative correlation between TVOCs level and elevation of sampling sites with r = −1.0 and r = −0.89, while a moderate negative correlation was observed in sampling days in April, April–May, and July (Figure S2 in Supplementary Materials). These correlations indicate the possible effect of heating season on TVOCs spatial distribution due to increased coal consumption [4] at low ambient temperature.
For the studied periods, the most polluted sampling site in Almaty was site S4 (Papanin str.–Suyunbay ave.). The sampling site S4 is at 12 km from CHP-3 and 14 km from CHP-2 and the lowest elevation above the sea level (700 m) (Table 1). There are a number of private houses close to S4 sampling sites that use solid fuel for heating (coal) and avenues with heavy traffic, which could contribute to air pollution around the S4 sampling site. The lower TVOCs concentrations were obtained in sampling sites S1 and S2 during all sampling periods. These sampling sites are located at a higher level (978 and 944 m) close to mountains and far from CHP-3 (22–26 km) and CHP-2 (13–15 km).

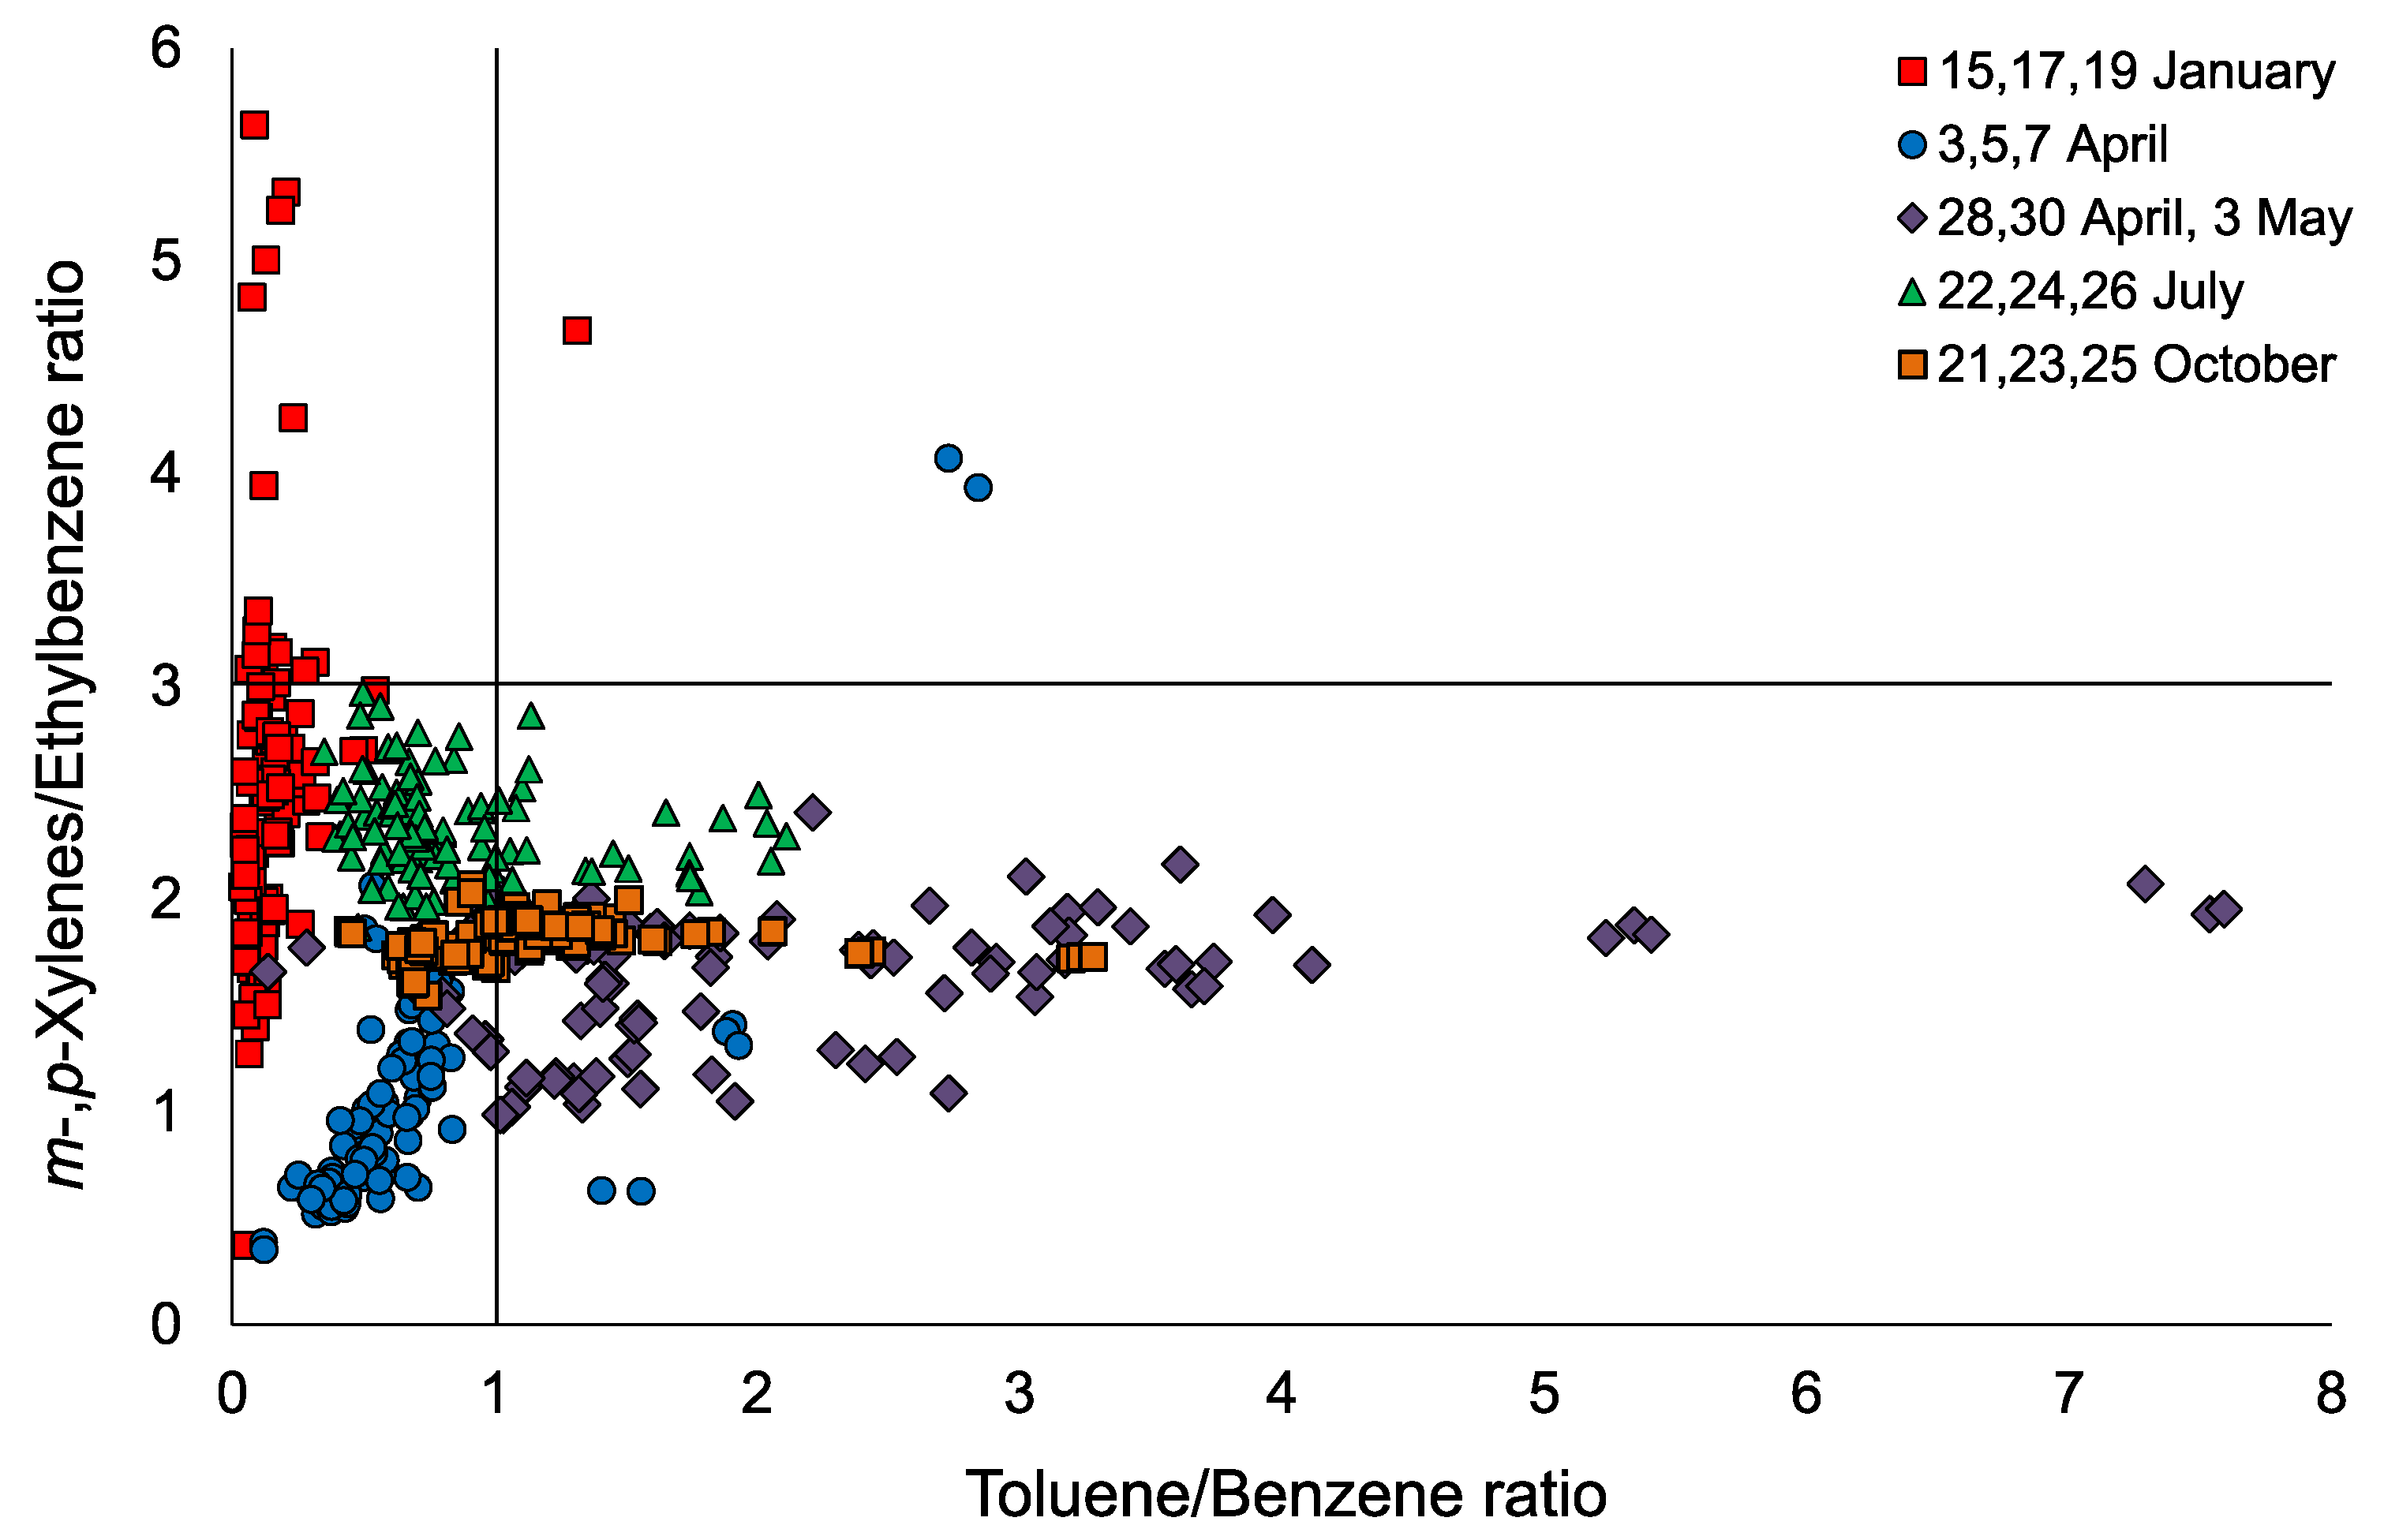
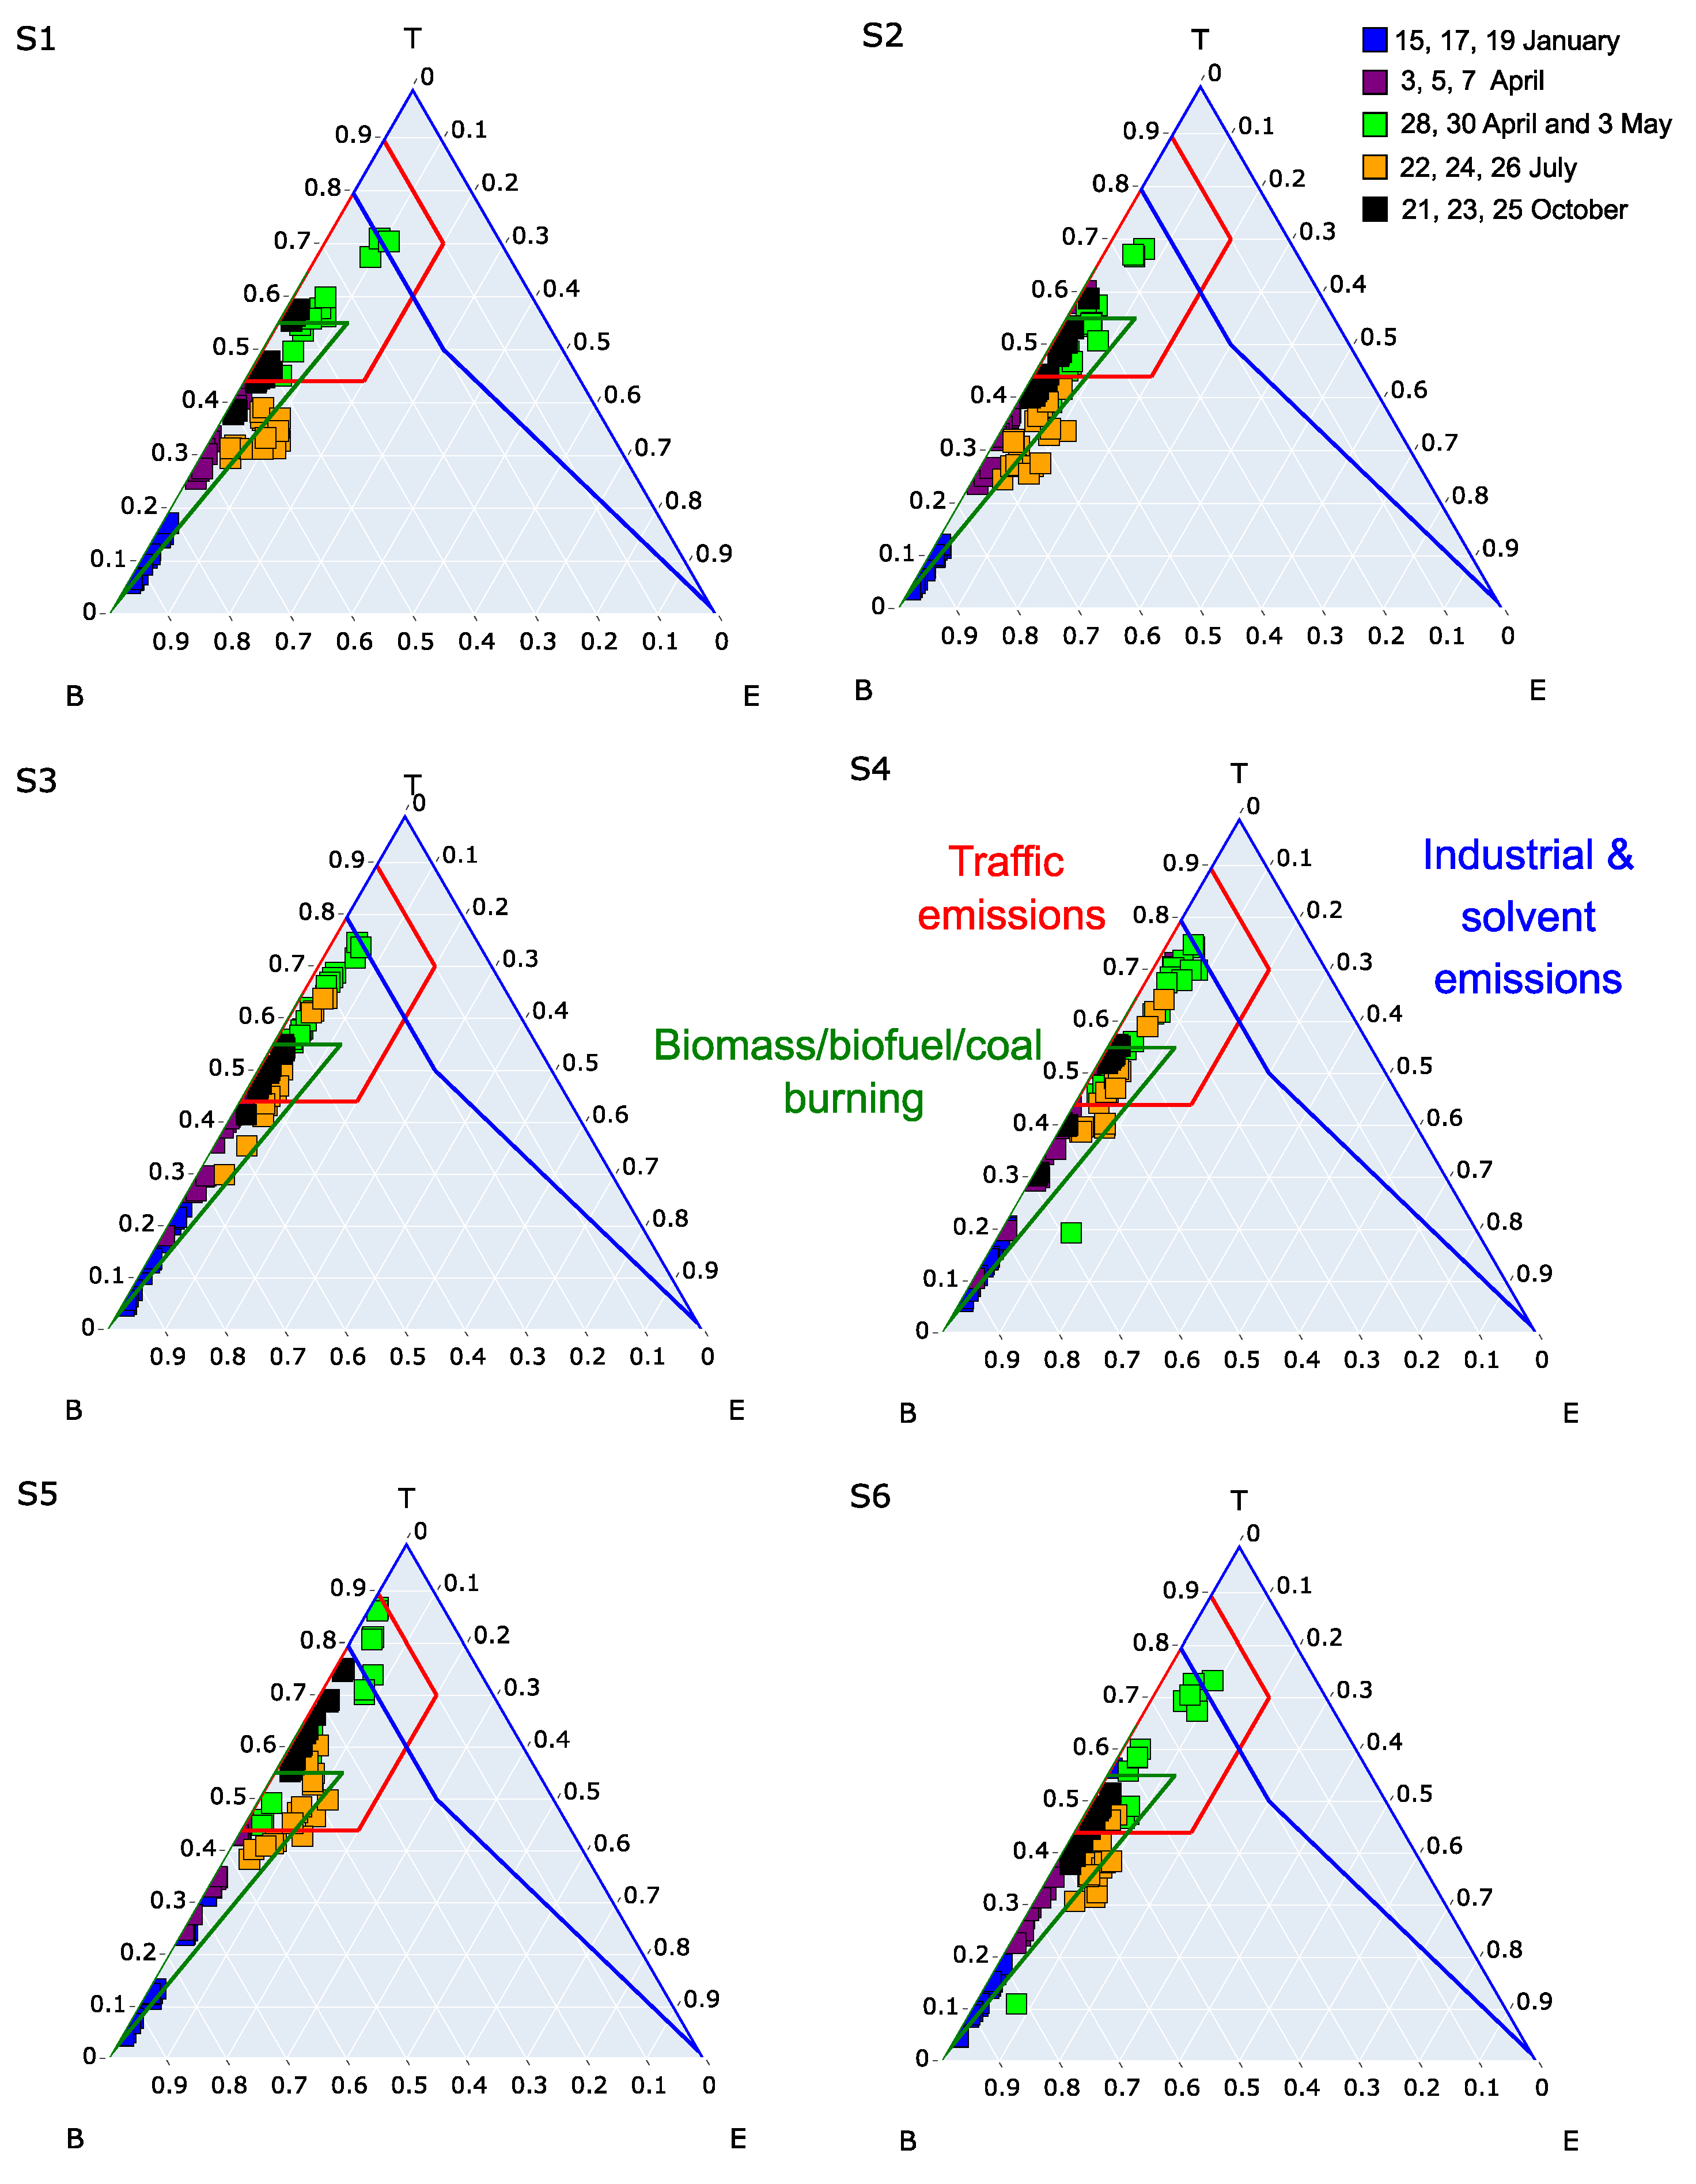
3.3. BTEX Source Apportionment

Several studies have reported that the ratio of toluene to benzene (T/B) can be used to find pollutants sources [36,37]. The T/B ratio can be applied to determine the emission sources of BTEX in ambient air. T/B < 1 indicates the non-traffic-related sources (biomass/biofuel/coal burning), while T/B > 1 shows the dominant contribution of traffic-related sources (vehicle emissions) [38]. Figure 5 shows that sources of air pollution in Almaty have a complex nature. During the sampling in January, April, and July, the prevailing sources of BTEX were the combustion of biomass/biofuel/coal. While, in May and October sampling days, BTEX mainly originated from vehicle emissions. In the July sampling period, the lower contribution of vehicle-related sources can be explained by partial lockdown measures (5 July–16 August) due to the second wave of COVID-19 in Kazakhstan [35]. However, CHPs had been operating for a whole year in Almaty what can explain the contribution of coal-burning sources to air pollution.
The m-, p-xylenes to ethylbenzene (X/E) ratio indicates the photochemical age of pollution. m- and p-Xylenes are more reactive than ethylbenzene and quickly react with •OH radicals [39]. The X/E ratio higher than 3 indicates the fresh and local emissions, while the ratio lower than 3 shows aged air masses and consequently emissions from remote sources [40]. The majority of X/E ratios were lower than 3 in all sampling periods, assuming the presence of aged air masses from remote sources (Figure 5). Several X/E ratios (6% of total) were higher or close to 3, which indicate the local, fresh emissions, and a mixture of aged air masses (Figure 5). The strong correlation of ethylbenzene, m-, p-xylenes, and o-xylene (r ≥ 0.9, p ≤ 0.01) suggests the constant and familiar sources of these VOCs (Table S3 in Supplementary Materials). Based on these results, it can be concluded that the contribution of the remote sources is dominant in Almaty at all sites and periods.
The benzene, toluene, and ethylbenzene (B:T:E) ratio is applied to evaluate aromatic sources in ambient air [36,40,41]. Biomass/biofuel/coal burning is characterized by the mean relative proportions of B:T:E—0.69:0.27:0.04, traffic emissions—0.31:0.59:0.10, industrial emissions—0.06:0.59:0.35 [36]. B:T:E ratio of each air sample was calculated and plotted in ternary diagrams to understand the emissions sources better. The obtained B:T:E ratio showed that in Almaty, there were two main sources of BTEX during the studied period: traffic emissions and biomass/biofuel/coal burning (Figure 6). For all sampling sites, biomass/biofuel/coal burning was a prevalent source of VOCs on 15, 17, 19 January, with an average B:T:E ratio of 0.87:0.12:0.01. During the heating season, the use of coal increases by more than two times [4], which leads to a dramatic increase in SO2 emissions from CHP-2 [42] and PM2.5 concentrations [4]. The moderate correlation of benzene with concentrations of a coal combustion marker SO2 [43] and PM2.5 (r ≥ 0.5, p ≤ 0.01) can also indicate that the burning of solid fuel is one of the primary sources of pollution during the heating season in Almaty (Table S3 in Supplementary Materials). Similar findings were obtained in the Dushanzi district, Northwest China [44], and in a rural area of North China [38,45], where coal combustion was the main source of VOCs emissions during cold seasons.
On 3, 5, 7 April, sampling was carried out during the first COVID-19 lockdown (19 March–13 April) under non-traffic conditions, and the B:T:E ratio was 0.61:0.39:0 indicating the coal combustion as the main source of BTEX.
On 28, 30 April, 3 May, and 21, 23, 25 October, B:T:E ratios were 0.32:0.64:0.04 and 0.48:0.50:0.02, respectively, which indicated the traffic and non-traffic-related BTEX sources. In July sampling days, three out of six sampling sites (S1, S2, and S6) depicted the distribution of B:T:E ratios in the coal combustion area. While, the distribution of B:T:E ratios of the rest of the sampling sites (S3, S4, S5) was in both (traffic and coal combustion) areas. The B:T:E ratios at sampling sites S3, S4, and S5 differed from S1, S2, S6 due to their closest location to the main roads.
The correlation analysis of VOCs concentrations and BTEX source apportionment in Almaty showed the complex nature of air pollution and variation of the primary source depending on the season and sampling site.

4. Conclusions

Assessment of the air pollution in Almaty, Kazakhstan, in 2020 was conducted by measurements of VOCs concentrations using the previously developed method. The seasonal variations for 9 out of 19 VOCs were significant, with maximum concentration in sampling days in winter. The high concentrations of VOCs in the winter sampling period can be related to the higher emissions from coal combustion, meteorological parameters, and the geographic location of Almaty. In addition, in winter, the low planetary boundary layer heights and low-level inversion layers can affect VOCs dispersion. Insignificant seasonal variations of the rest of the analytes may indicate that their sources have a constant contribution to air pollution during all sampling periods.
Comparison of the two sampling periods (3, 5, 7 April and 28, 30 April, 3 May) in spring were used for evaluating the effect of the heating season and COVID-19 lockdown restrictions in Almaty on VOCs emissions. The obtained results and analysis of typical ratios of BTEX demonstrate that the primary sources in Almaty are associated with the burning of biomass/biofuel/coal and vehicle emissions with the dominant effect of solid fuel combustion in heating seasons. Additionally, the observed X/E ratios (lower than 3) indicate that sampling sites in Almaty are affected mainly by aged air masses from remote sources. It was found that the spatial distribution of the TVOCs concentrations depends on the sampling site’s elevation and distance from CHPs. The spatial difference of TVOCs has a similar trend in all sampling periods, with the most polluted site in the north part of the city.
The limitation of this study is that the obtained results represent only short sampling periods and boundary layer height as well as temperature inversions were not investigated due to data gaps. However, it is the first attempt to study VOCs’ seasonal and spatial air pollution in Almaty, one of the most polluted cities in Kazakhstan. The obtained data could serve as a basis for action plans for improving the air quality based on air monitoring data and could be an impulse for further comprehensive investigations. Moreover, observed complex air pollution in Almaty, Kazakhstan, requires further detailed source-apportionment studies of the VOCs and their diurnal, temporal, and seasonal variations.
In Kazakhstan, identifying air pollution’s emission sources and health effects remains a challenge due to lack of capacity, outdated methodologies, scarcity of data, and nontransparent energy statistics. Continuous and reliable monitoring of air quality is crucial to track the progress of implemented activities. The limited data on the concentrations of pollutants and the absence of adequate data analysis inhibit the appropriate assessment of risks and the development of effective programs to reduce air pollution. Therefore, a comprehensive air analysis is required in the cities of Kazakhstan using modern research methods and modeling tools.
We also suggest considering the approaches for reducing, eliminating, or preventing air pollution, such as less toxic fossil fuel use. The quality of low-grade coal with a high ash content, which householders and CHPs utilize for electricity and heating production, should be improved, or changed to alternative fuel types (natural gas). Advanced emission-control technologies should be applied at CHPs. Control of transportation exhaust gases should include emission control on vehicles, use of cleaner fuels along with the development of public transport network. Strict standards for transport, industrial, and power plants emissions, development of an emission control strategy, and plan incorporating the control measures are urgently needed.
This study could raise awareness among the decision-makers, the academic community, and the local population regarding the severity of the problem by providing evidence of air quality measured using advanced techniques and methods.

Supplementary Materials

The following are available online at https://0-www-mdpi-com.brum.beds.ac.uk/article/10.3390/atmos12121592/s1, Table S1: Coordinates of Kazhydromet and PM2.5 sampling sites, Table S2: Air sampling periods and meteorological parameters, Table S3: Pearson correlation between the concentration of pollutants and meteorological parameters, Figure S1: Seasonal variations of the mean VOCs concentrations (mean of the sampling days in each season ± SD), Figure S2: TVOCs concentrations and sampling sites’ (S1–S6) elevations above the sea level during sampling periods.

Author Contributions

Conceptualization, O.P.I., A.O. and N.B.; methodology, B.B. and A.Z.; formal analysis, investigation, O.P.I., A.O., B.B. and A.Z.; writing—original draft preparation, O.P.I., A.O., B.B. and A.Z.; writing—review and editing, O.P.I., A.O. and N.B.; visualization, O.P.I. and A.O.; supervision, project administration, and funding acquisition, N.B. All authors contributed to shaping the content of the paper during the revisions. All authors have read and agreed to the published version of the manuscript.

Funding

This research was funded by the Science Committee of the Ministry of Education and Science of the Republic of Kazakhstan (Grant No. AP09058606), the “AirVision.kz” non-profit Public Fund and Tustykbayeva Aisulu.

Institutional Review Board Statement

Not applicable.

Informed Consent Statement

Not applicable.

Data Availability Statement

VOCs measurements in the air are available by request from the corresponding author. The “Kazhydromet” stations data is available online at the website www.ecodata.kz (accessed on 1 November 2021) or mobile app “AirKZ”. PM2.5 data is available online at website www.airkaz.org (accessed on 1 November 2021). Weather and other meteorological data can be obtained from www.rp5.kz (accessed on 1 November 2021) archives.

Acknowledgments

The authors would like to thank Al-Farabi Kazakh National University for the Ph.D. scholarship of Olga P. Ibragimova and Bauyrzhan Bukenov.

Conflicts of Interest

The authors declare no conflict of interest.

References

  1. IQAir World’s Most Polluted Countries 2020 (PM2.5). Available online: https://www.iqair.com/world-most-polluted-countries (accessed on 1 November 2021).
  2. Kerimray, A.; Assanov, D.; Kenessov, B.; Karaca, F. Trends and health impacts of major urban air pollutants in Kazakhstan. J. Air Waste Manag. Assoc. 2020, 70, 1148–1164. [Google Scholar] [CrossRef] [PubMed]
  3. Agency for Strategic Planning and Reforms of the Republic of Kazakhstan Bureau of National Statistics Dynamic Tables of Demographic Statistics. Available online: https://stat.gov.kz/official/industry/61/statistic/8 (accessed on 1 November 2021).
  4. Assanov, D.; Zapasnyi, V.; Kerimray, A. Air Quality and Industrial Emissions in the Cities of Kazakhstan. Atmosphere 2021, 12, 314. [Google Scholar] [CrossRef]
  5. Agency for Strategic Planning and Reforms of the Republic of Kazakhstan Bureau of National Statistics Main Indicators of Statistics of Transport. Available online: https://stat.gov.kz/official/industry/18/statistic/7 (accessed on 1 November 2021).
  6. Kenessary, D.; Kenessary, A.; Adilgireiuly, Z.; Akzholova, N.; Erzhanova, A.; Dosmukhametov, A.; Syzdykov, D.; Masoud, A.-R.; Saliev, T. Air Pollution in Kazakhstan and Its Health Risk Assessment. Ann. Glob. Heal. 2019, 85, 1–9. [Google Scholar] [CrossRef] [Green Version]
  7. Vinnikov, D.; Tulekov, Z.; Raushanova, A. Occupational exposure to particulate matter from air pollution in the outdoor workplaces in Almaty during the cold season. PLoS ONE 2020, 15, e0227447. [Google Scholar] [CrossRef]
  8. Shuai, J.; Kim, S.; Ryu, H.; Park, J.; Lee, C.K.; Kim, G.-B.; Ultra, V.U.; Yang, W. Health risk assessment of volatile organic compounds exposure near Daegu dyeing industrial complex in South Korea. BMC Public Health 2018, 18, 528. [Google Scholar] [CrossRef] [Green Version]
  9. Juráň, S.; Grace, J.; Urban, O. Temporal Changes in Ozone Concentrations and Their Impact on Vegetation. Atmosphere 2021, 12, 82. [Google Scholar] [CrossRef]
  10. Calfapietra, C.; Fares, S.; Manes, F.; Morani, A.; Sgrigna, G.; Loreto, F. Role of Biogenic Volatile Organic Compounds (BVOC) emitted by urban trees on ozone concentration in cities: A review. Environ. Pollut. 2013, 183, 71–80. [Google Scholar] [CrossRef]
  11. Brusseau, M.L.; Matthias, A.D.; Comrie, A.C.; Musil, S.A. Atmospheric Pollution. In Environmental and Pollution Science; Elsevier: Amsterdam, The Netherlands, 2019; pp. 293–309. [Google Scholar]
  12. Zhang, T.; Yue, X.; Unger, N.; Feng, Z.; Zheng, B.; Li, T.; Lei, Y.; Zhou, H.; Dong, X.; Liu, Y.; et al. Modeling the joint impacts of ozone and aerosols on crop yields in China: An air pollution policy scenario analysis. Atmos. Environ. 2021, 247, 118216. [Google Scholar] [CrossRef]
  13. Sahu, S.K.; Liu, S.; Liu, S.; Ding, D.; Xing, J. Ozone pollution in China: Background and transboundary contributions to ozone concentration & related health effects across the country. Sci. Total Environ. 2021, 761, 144131. [Google Scholar] [CrossRef] [PubMed]
  14. Li, A.; Zhou, Q.; Xu, Q. Prospects for ozone pollution control in China: An epidemiological perspective. Environ. Pollut. 2021, 285, 117670. [Google Scholar] [CrossRef] [PubMed]
  15. Paterson, C.A.; Sharpe, R.A.; Taylor, T.; Morrissey, K. Indoor PM2.5, VOCs and asthma outcomes: A systematic review in adults and their home environments. Environ. Res. 2021, 202, 111631. [Google Scholar] [CrossRef] [PubMed]
  16. Alford, K.L.; Kumar, N. Pulmonary Health Effects of Indoor Volatile Organic Compounds—A Meta-Analysis. Int. J. Environ. Res. Public Health 2021, 18, 1578. [Google Scholar] [CrossRef]
  17. Bolden, A.L.; Kwiatkowski, C.F.; Colborn, T. New Look at BTEX: Are Ambient Levels a Problem? Environ. Sci. Technol. 2015, 49, 5261–5276. [Google Scholar] [CrossRef]
  18. World Health Organization. IARC Monographs on the Evaluation of Carcinogenic Risks to Humans—Benzene; International Agency for Research on Cancer: Lyon, France, 2018; ISBN 978-92-832-0187-8. [Google Scholar]
  19. Russell, A.; Ghalaieny, M.; Gazdiyeva, B.; Zhumabayeva, S.; Kurmanbayeva, A.; Akhmetov, K.K.; Mukanov, Y.; McCann, M.; Ali, M.; Tucker, A.; et al. A Spatial Survey of Environmental Indicators for Kazakhstan: An Examination of Current Conditions and Future Needs. Int. J. Environ. Res. 2018, 12, 735–748. [Google Scholar] [CrossRef] [Green Version]
  20. Kerimray, A.; Azbanbayev, E.; Kenessov, B.; Plotitsyn, P.; Alimbayeva, D.; Karaca, F. Spatiotemporal Variations and Contributing Factors of Air Pollutants in Almaty, Kazakhstan. Aerosol Air Qual. Res. 2020, 20, 1340–1352. [Google Scholar] [CrossRef] [Green Version]
  21. Aiman, N.; Gulnaz, S.; Alena, M. The characteristics of pollution in the big industrial cities of Kazakhstan by the example of Almaty. J. Environ. Health Sci. Eng. 2018, 16, 81–88. [Google Scholar] [CrossRef] [PubMed]
  22. Carlsen, L.; Kenessov, B.N.; Baimatova, N.K.; Kenessova, O.A. Assessment of the Air Quality of Almaty. Focussing on the Traffic Component. Int. J. Biol. Chem. 2013, 1, 49–69. [Google Scholar]
  23. Baimatova, N.; Kenessov, B.; Koziel, J.A.; Carlsen, L.; Bektassov, M.; Demyanenko, O.P. Simple and accurate quantification of BTEX in ambient air by SPME and GC–MS. Talanta 2016, 154, 46–52. [Google Scholar] [CrossRef] [PubMed] [Green Version]
  24. Ibragimova, O.P.; Baimatova, N.; Kenessov, B. Low-Cost Quantitation of Multiple Volatile Organic Compounds in Air Using Solid-Phase Microextraction. Separations 2019, 6, 51. [Google Scholar] [CrossRef] [Green Version]
  25. Kerimray, A.; Baimatova, N.; Ibragimova, O.P.; Bukenov, B.; Kenessov, B.; Plotitsyn, P.; Karaca, F. Assessing air quality changes in large cities during COVID-19 lockdowns: The impacts of traffic-free urban conditions in Almaty, Kazakhstan. Sci. Total Environ. 2020, 730, 139179. [Google Scholar] [CrossRef]
  26. Carlsen, L.; Bruggemann, R.; Kenessov, B. Use of partial order in environmental pollution studies demonstrated by urban BTEX air pollution in 20 major cities worldwide. Sci. Total Environ. 2018, 610–611, 234–243. [Google Scholar] [CrossRef]
  27. Kazhydromet.kz Monthly Newsletter on the State of the Environment. Available online: https://www.kazhydromet.kz/ (accessed on 3 November 2021).
  28. Airkaz.org Air Pollution Map. Available online: https://www.airkaz.org/almaty.php (accessed on 3 November 2021).
  29. Reliable Prognosis-5 Weather for 243 Countries. Available online: http://rp5.am/Weather_in_the_world (accessed on 1 November 2021).
  30. Adilet.zan.kz Hygienic Standards for Atmospheric Air in Urban and Rural Settlements. Available online: https://adilet.zan.kz/rus/docs/V1500011036 (accessed on 3 November 2021).
  31. Sekar, A.; Varghese, G.K.; Ravi Varma, M.K. Analysis of benzene air quality standards, monitoring methods and concentrations in indoor and outdoor environment. Heliyon 2019, 5, e02918. [Google Scholar] [CrossRef] [Green Version]
  32. Liu, W.; Zhang, J.; Kwon, J.; Weisel, C.; Turpin, B.; Zhang, L.; Korn, L.; Morandi, M.; Stock, T.; Colome, S. Concentrations and source characteristics of airborne carbonyl compounds measured outside urban residences. J. Air Waste Manag. Assoc. 2006, 56, 1196–1204. [Google Scholar] [CrossRef] [Green Version]
  33. Liang, Y.; Liu, X.; Wu, F.; Guo, Y.; Fan, X.; Xiao, H. The year-round variations of VOC mixing ratios and their sources in Kuytun City (northwestern China), near oilfields. Atmos. Pollut. Res. 2020, 11, 1513–1523. [Google Scholar] [CrossRef]
  34. Lyu, X.P.; Chen, N.; Guo, H.; Zhang, W.H.; Wang, N.; Wang, Y.; Liu, M. Ambient volatile organic compounds and their effect on ozone production in Wuhan, central China. Sci. Total Environ. 2016, 541, 200–209. [Google Scholar] [CrossRef]
  35. Zakon.kz Which Cities of Kazakhstan Are in Quarantine and What Is the Regime in Them? Available online: https://online.zakon.kz/Document/?doc_id=34591808 (accessed on 1 November 2021).
  36. Zhang, Z.; Zhang, Y.; Wang, X.; Lü, S.; Huang, Z.; Huang, X.; Yang, W.; Wang, Y.; Zhang, Q. Spatiotemporal patterns and source implications of aromatic hydrocarbons at six rural sites across china’s developed coastal regions. J. Geophys. Res. 2016, 121, 6669–6687. [Google Scholar] [CrossRef]
  37. Wu, Y.; Hu, J.; Wang, H.; Li, H.; Zhang, H.; Chai, F.; Wang, S. The characteristics of ambient non-methane hydrocarbons (NMHCs) in Lanzhou, China. Atmosphere 2019, 10, 745. [Google Scholar] [CrossRef] [Green Version]
  38. Liu, K.; Zhang, C.; Cheng, Y.; Liu, C.; Zhang, H.; Zhang, G.; Sun, X.; Mu, Y. Serious BTEX pollution in rural area of the North China Plain during winter season. J. Environ. Sci. 2015, 30, 186–190. [Google Scholar] [CrossRef] [PubMed]
  39. Xiong, Y.; Bari, M.A.; Xing, Z.; Du, K. Ambient volatile organic compounds (VOCs) in two coastal cities in western Canada: Spatiotemporal variation, source apportionment, and health risk assessment. Sci. Total Environ. 2020, 706. [Google Scholar] [CrossRef]
  40. Huang, Y.S.; Hsieh, C.C. VOC characteristics and sources at nine photochemical assessment monitoring stations in western Taiwan. Atmos. Environ. 2020, 240, 117741. [Google Scholar] [CrossRef]
  41. Ding, Y.; Lu, J.; Liu, Z.; Li, W.; Chen, J. Volatile organic compounds in Shihezi, China, during the heating season: Pollution characteristics, source apportionment, and health risk assessment. Environ. Sci. Pollut. Res. 2020, 27, 16439–16450. [Google Scholar] [CrossRef] [PubMed]
  42. Ecoexpert LLP. Report on Monitoring of Environmental Quality Targets of Almaty 2020; Ecoexpert LLP: Almaty, Kazakhstan, 2020. [Google Scholar]
  43. Zhao, B.; Wang, P.; Ma, J.Z.; Zhu, S.; Pozzer, A.; Li, W. A high-resolution emission inventory of primary pollutants for the Huabei region, China. Atmos. Chem. Phys. 2012, 12, 481–501. [Google Scholar] [CrossRef] [Green Version]
  44. Zhang, X.; Ding, X.; Wang, X.; Talifu, D.; Wang, G.; Zhang, Y.; Abulizi, A. Volatile organic compounds in a petrochemical region in arid of NW China: Chemical reactivity and source apportionment. Atmosphere 2019, 10, 641. [Google Scholar] [CrossRef] [Green Version]
  45. Zhang, F.; Shang, X.; Chen, H.; Xie, G.; Fu, Y.; Wu, D.; Sun, W.; Liu, P.; Zhang, C.; Mu, Y.; et al. Significant impact of coal combustion on VOCs emissions in winter in a North China rural site. Sci. Total Environ. 2020, 720. [Google Scholar] [CrossRef]
Figure 1. Map showing the location of the sampling sites in Almaty, Kazakhstan.
Atmosphere 12 01592 g001
Figure 2. Seasonal concentrations (mean of the sampling days in each season ± SD) of the VOCs.
Atmosphere 12 01592 g002
Figure 3. Variations of the VOCs concentrations (mean of the three sampling days ± SD) in spring sampling periods during heating and non-heating season.
Atmosphere 12 01592 g003
Figure 4. Spatial distribution of total VOCs concentrations during sampling periods in 15, 17, 19 January (a), 3, 5, 7 April (b), 28, 30 April, 3 May (c), 22, 24, 26 July (d), and 21, 23, 25 October (e).
Atmosphere 12 01592 g004
Figure 5. The ratios of BTEX at different sampling periods.
Atmosphere 12 01592 g005
Figure 6. Benzene:Toluene:Ethylbenzene ratios in Almaty.
Atmosphere 12 01592 g006
Table 1. VOCs sampling sites.
CodeCrossroadCoordinatesElevation (m)Distance to CHP-2Distance to CHP-3Objects Close to Sampling Sites
S1Radostovets str.–
al-Farabi ave.
43°12.007′ N 76°53.774′ E9781326Residential area with high buildings, Mega Center Alma-Ata mall, Kazakh-Russian Gymnasium No 38, Almaty Management University
S2Mendikulov str.–
al-Farabi ave.
43°13.654′ N 76°57.252′ E9441522Residential and office areas with high buildings, Al-Farabi highway
S3Nauryzbay Batyr str.– Raiymbek ave.43°16.099′ N 76°56.062′ E7641118Residential and office area with low buildings, Atrium mall, parking, Kazakh Academy of Labor and Social Relations, Kazakh-Russian Medical University, crossroad with high traffic load
S4Papanin str.–
Suyunbay ave.
43°19.095′ N 76°57.781′ E7001412Private low buildings, household warehouse, small parking, Suyunbay avenue
S5Raiymbek ave.–Akhrimenko str.43°14.950′ N
76° 50.844′ E
770623Private low buildings, crossroad with high traffic load, bakery plant
S6Shevchenko str.–
Gagarin ave.
43°14.612′ N 76°53.586′ E803922Mahatma Gandhi Park, office, and residential areas with middle-rise buildings
Table 2. Description of VOCs sampling periods.
Sampling PeriodSampling SeasonDescription of SamplingThe Average Value of the Meteorological Parameter
T, °CHumidity,
%
Wind
Speed, m/s
Precipitation, mmPressure,
mm Hg
15, 17, and 19 JanuaryWinterPeak of the heating
season
−5.778.30.30774.7
3, 5, and 7 AprilSpring: heating periodTwo weeks before the end of the heating season,
lockdown
14.056.50.30.2763.4
28, 30 April, and 3 MaySpring: non-heating periodOne week after the end of the heating season,
post-lockdown
17.668.80.31.8759.9
22, 24, and 26 JulySummerNon-heating season,
lockdown
24.350.31.50.4755.7
21, 23, and 25 OctoberAutumnThree weeks after the start of the heating season9.356.50.20.7768.2
Table 3. Descriptive statistics of the VOC concentrations during the study period.
NoAnalytesN *Concentration, µg m−3
MeanSDMinimumMaximum
1Benzene17964672.3341
2Toluene18039431.4223
3Ethylbenzene1801.81.40.139.5
4m-Xylene1773.83.90.241
5p-Xylene
6o-Xylene1802.72.50.1520
71,2,4-Trimethylbenzene1802.33.30.1236
81,3,5-Trimethylbenzene1771.21.50.1013
9Propylbenzene1170.532.50.1027
10Phenol1803.13.90.1931
11Chlorobenzene1560.210.680.0408.2
12Benzaldehyde1803.42.70.1113
133-Picoline1312.53.70.1023
14Naphthalene1802.53.30.3926
15Fluorene1010.961.390.1411
161,2-Dichloroethane844.04.81.742
17Methylene chloride13723290.66168
18n-Decane1428.55.71.528
19n-Heptane9964488.7235
* Note: N—number of measurements.
Table 4. Descriptive statistics of the concentrations of NO2, SO2, CO, and PM2.5.
AnalyteN *Concentration, µg m−3
MeanSDMinimumMaximumWHO
(24-h Limit)
NO28181680.1043625
PM2.59244492.0026015
SO2678.48.50.103640
CO, mg m−3691.21.20.065.0-
* Note: N—number of measurements.
Publisher’s Note: MDPI stays neutral with regard to jurisdictional claims in published maps and institutional affiliations.

