1. Introduction
Efficient monitoring of air quality in urban areas implies integrated monitoring, proper infrastructure, and forecasting tools to evaluate population exposure and support local authorities in adapting appropriate plans to reduce air pollution levels, particularly particulate pollution [
1]. During rainy days, air pollutants are washed away from the surrounding air, thus increasing the quality of the air (wet deposition) [
2]. Humans have been collecting water for use since ancient times. Both wastewater and rainwater must be managed in such a way that it does not pose a risk to human health and does not endanger the comfort of the population. This is ensured by the conventional sewerage methods, which, however, require considerable technical and financial efforts (execution and maintenance of the sewerage system, retention basins for rainwater, facilities for rainwater discharge, and treatment plants). Due to the considerable increase in impermeable surfaces in cities and villages, the sewerage of rainwater is limited by the transport capacity of sewerage networks [
3]. The efficiency of treatment of existing systems is limited, and, in the case of heavy rains, negative impacts on the environment might occur: the aquatic ecosystem is frequently affected, extensive rains can cause floods, and rapid runoff of rainfall has negative effects on water recovery capacity of groundwater resources [
4]. Furthermore, heavy metals can be ingested by drinking contaminated water. Nonpoint sources of heavy metals from stormwater runoff within urban areas contribute to this contamination, and acidic rain breaks down contaminated soils, consequently releasing the substances from these soils into streams, lakes, rivers, and groundwater [
5].
Particulate matter (PM), especially the high concentration of fine particles (i.e., PM
2.5, which is PM up to 2.5 µm (micro-meters in diameter)), is a problem in urban areas worldwide [
6]. The prolonged exposure in a PM-laden environment has been leading to significant adverse health effects [
7]. There is no sure evidence to date to establish a safe level of exposure to humans [
8]. For this reason, the improvement in monitoring programs, as well as the initiation of new experimental approaches for a better estimation of exposure, must be a priority in air quality planning from local to macro-regional scales [
9].
PM monitoring is a very complex task having many unknowns, mainly due to the multitude of sources from which they directly originate and the physicochemical changes that occur in the atmosphere, which results in the formation of secondary particles [
10]. Both chemical and physical compositions of particulate matter depend on various factors, such as location, time of the year, and weather conditions. Major components of PM include sulfate, nitrate, ammonium and hydrogen ions, trace elements (including toxic and transition metals), organic material, elemental carbon, and crustal components [
11]. PM can also consist of at least 160 organic compounds and 20 metals (i.e., Ag, As, Ba, Be, Dc, Ce, Cr, Co, Cu, Fe, Mn, Nd, Ni, Pb, Sb, Se, Sr, Ti, V, and Zn). Significant variations between polluted industry zones and background sites for each heavy metal concentration have been reported in the PM speciation [
12,
13].
The abundance of chemical species in PM has a seasonal dependency based on their volatility and the influence of photochemical production of secondary species [
14]. In [
15], coarse and fine particles were compared based on composition, common emission sources, life span, and travel distances reported in the literature. It was noticed that PM
2.5 contains more hazardous chemical species, such as Polycyclic Aromatic Hydrocarbons (PAHs) and heavy metals, which have carcinogenic, mutagenic, and/or teratogenic effects [
16]. Various health effects of PM
2.5, ranging from more minor to very serious, are associated with its specific chemical and physical components. Most studies did not find a direct link between individual chemical species and health effects, suggesting that a combination of chemical as well as physical properties of aerosols, i.e., mass, particle number, and surface area, are contributing to adverse health effects [
17]. While heavy metals have an influence on chronic disease development in correlation with exposure time and bioaccumulation, mainly in adults, PAHs have a direct toxic effect [
18]. The US EPA and the EU have identified a list of 16 priority PAHs for monitoring [
13], from which Benzo(a)Pyrene (BaP) is in the first carcinogenic group. The complexity of PM chemical speciation reinforces the relevance of rigorous PM monitoring and associated micro-pollutants for reliable air quality management [
19].
Atmospheric deposition (resulting from precipitation events) together with dry deposition of atmospheric particles have been found to be relevant nonpoint sources of nutrients [
20] and heavy metals to surface waters either from direct deposition on surface water or from stormwater runoff [
21].
Atmospheric precipitation shows increased variability in time, related to atmospheric factors that facilitate the appearance of clouds and lead to the growth of elements in the clouds [
22]. These include all the products of condensation and crystallization of water vapors in the atmosphere, also called hydrometeors, which usually fall from the clouds and reach the Earth’s surface in liquid form, solid, or in both forms at the same time.
In this context, the aim of the study was to assess the rainwater properties using samples collected from 31 rainfall events in three sites located in the urban areas of Targoviste city, which still has several metallurgical plants. The samples were tested for pH, conductivity, dissolved nitrate nitrogen, and dissolved ammonia nitrogen. In this paper, the heavy metals content of the rainwater collected from the rainfall events occurring in October and November, which were months that recorded elevated concentrations of airborne PM2.5 (potential pollution episodes), is analyzed and discussed. Backward trajectories were computed to understand the potential sources of pollution. The rationale of the study envisages establishing several pinpoints in developing proper plans for protection, and enhancement of water quality, sediments, and living resources for surrounding surface waters and also for air quality management in the area.
2. Materials and Methods
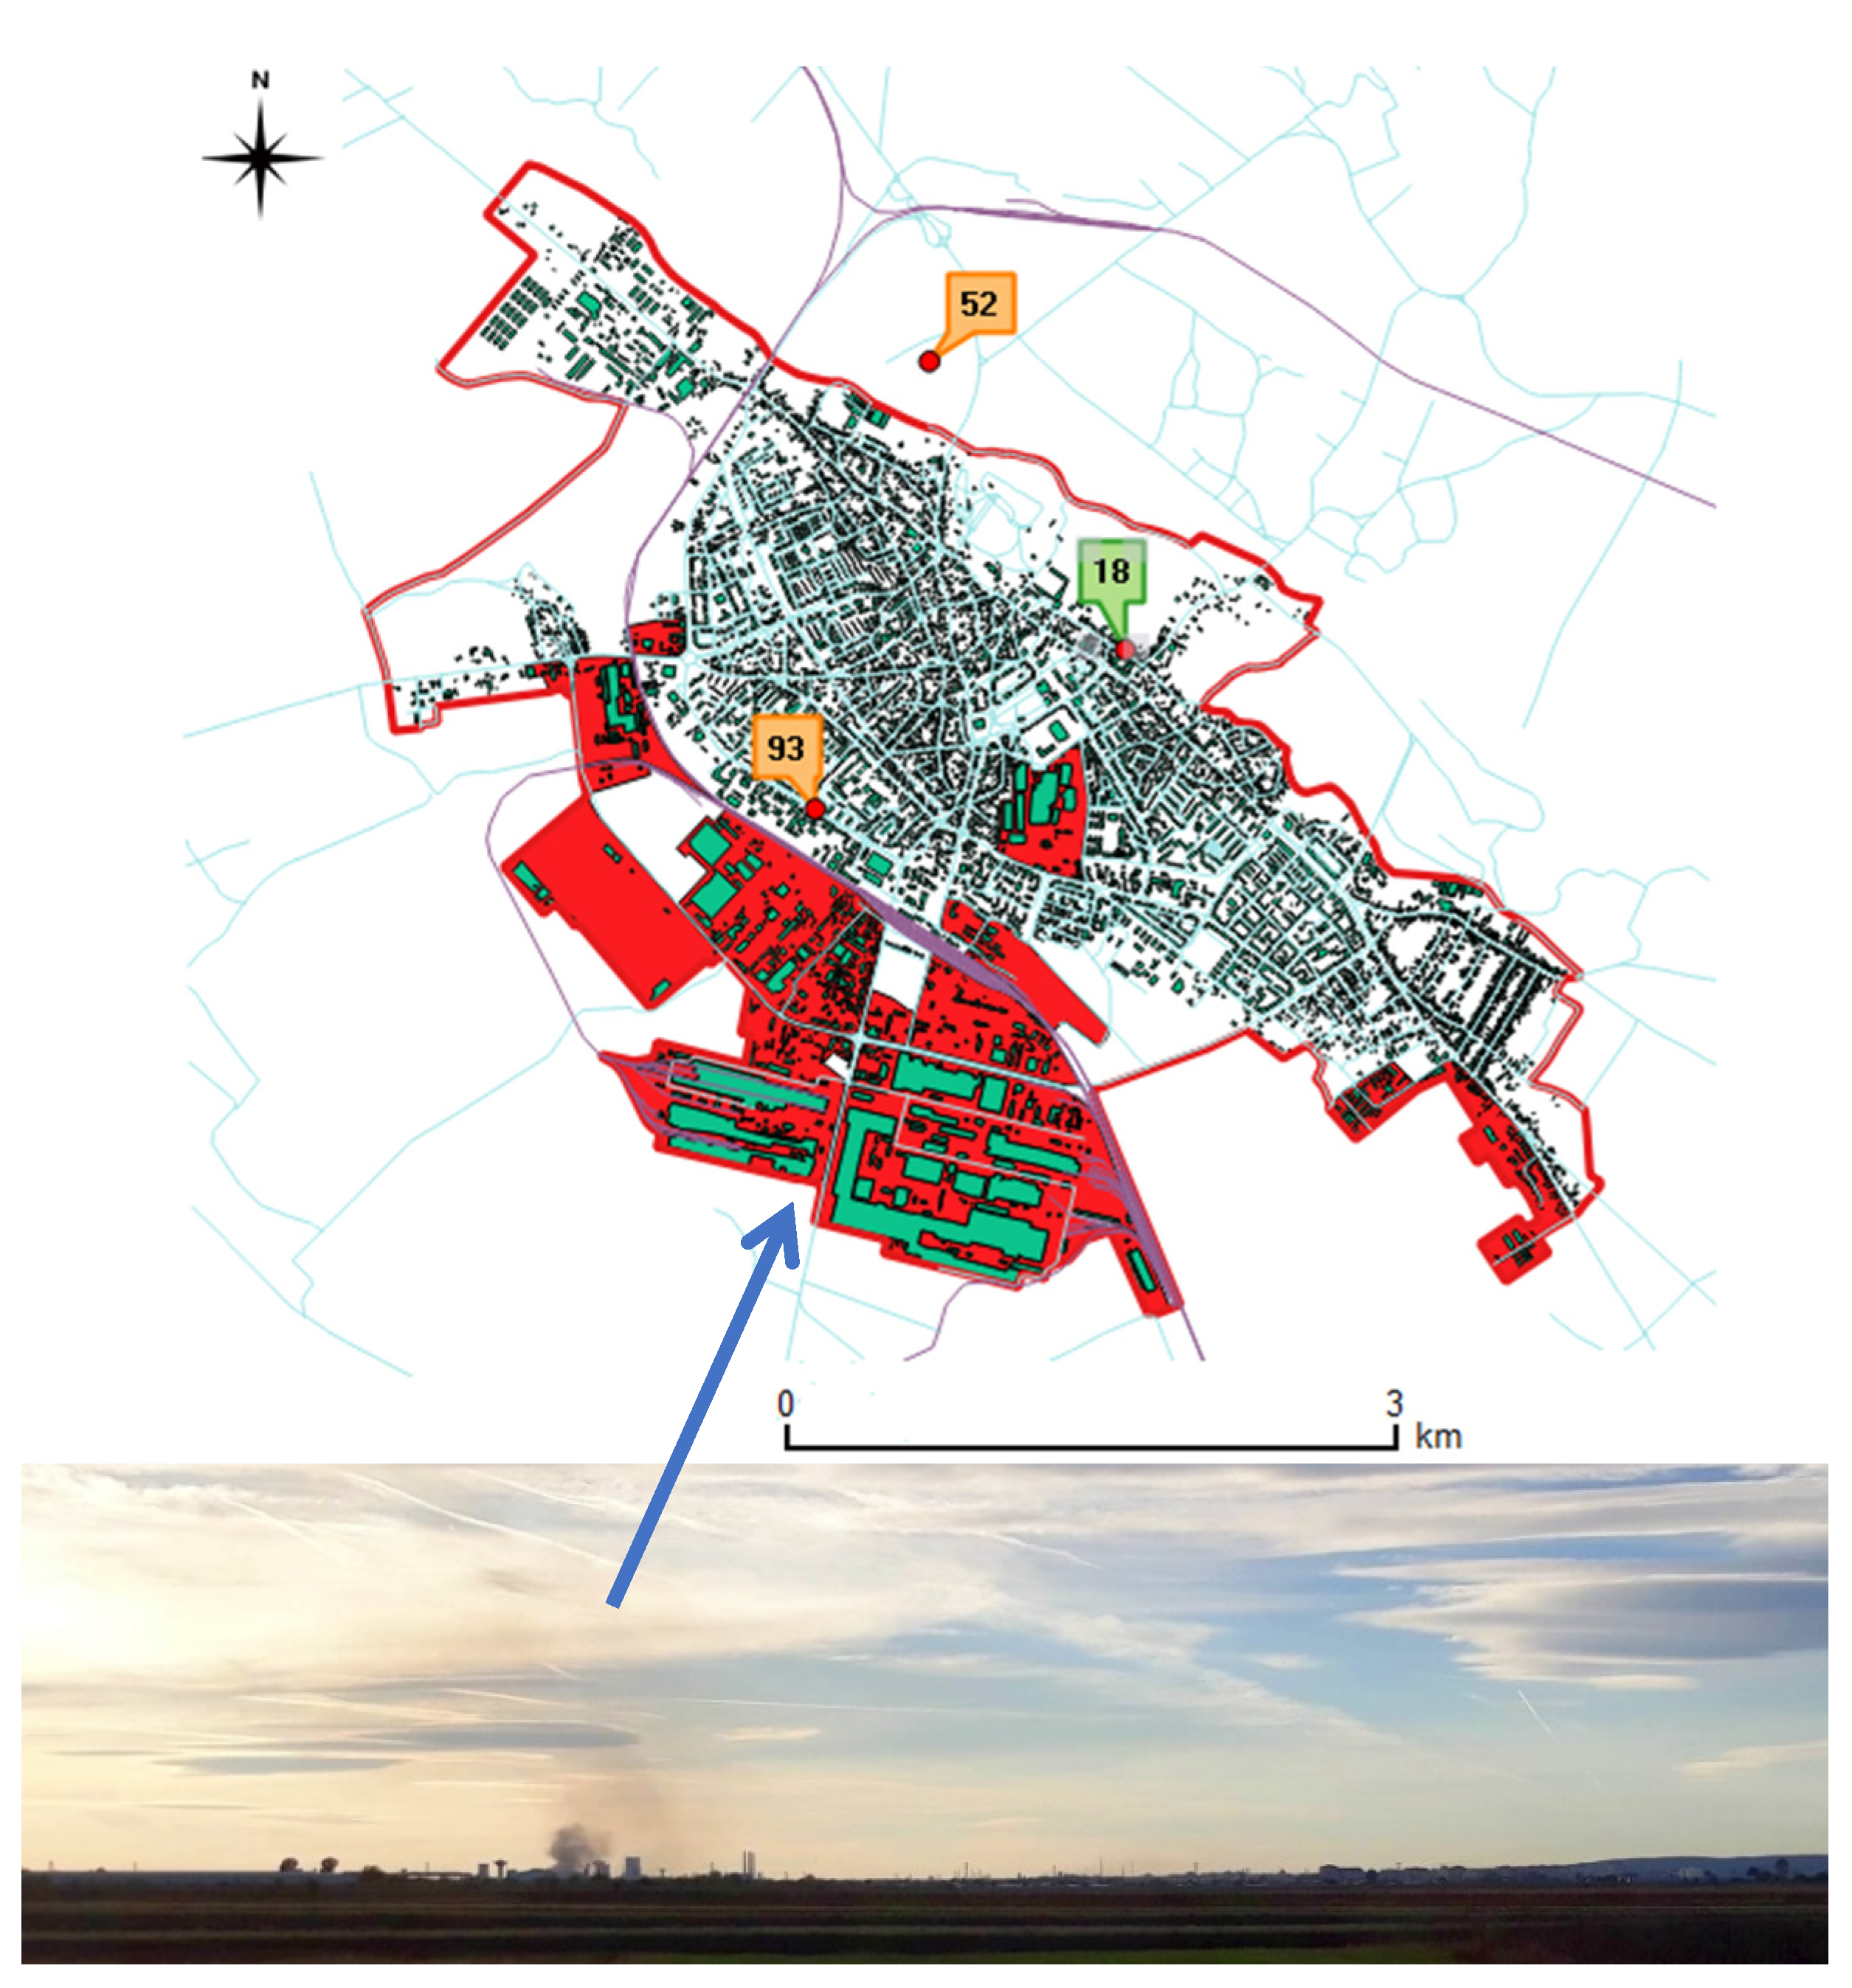
Targoviste is a Romanian city (44°56′ N, 25°26′ E, altitude 280 m) having around 74,000 residents. The city has a specialty steel plant and several metalworking facilities which are located in the south (
Figure 1). Due to economic constraints, production has diminished significantly, leading to lower emissions compared to the previous decade. However, pollution episodes with increased emissions have occurred in October and November 2019, the precipitation event-mean concentrations (EMC) being analyzed in detail in this work.
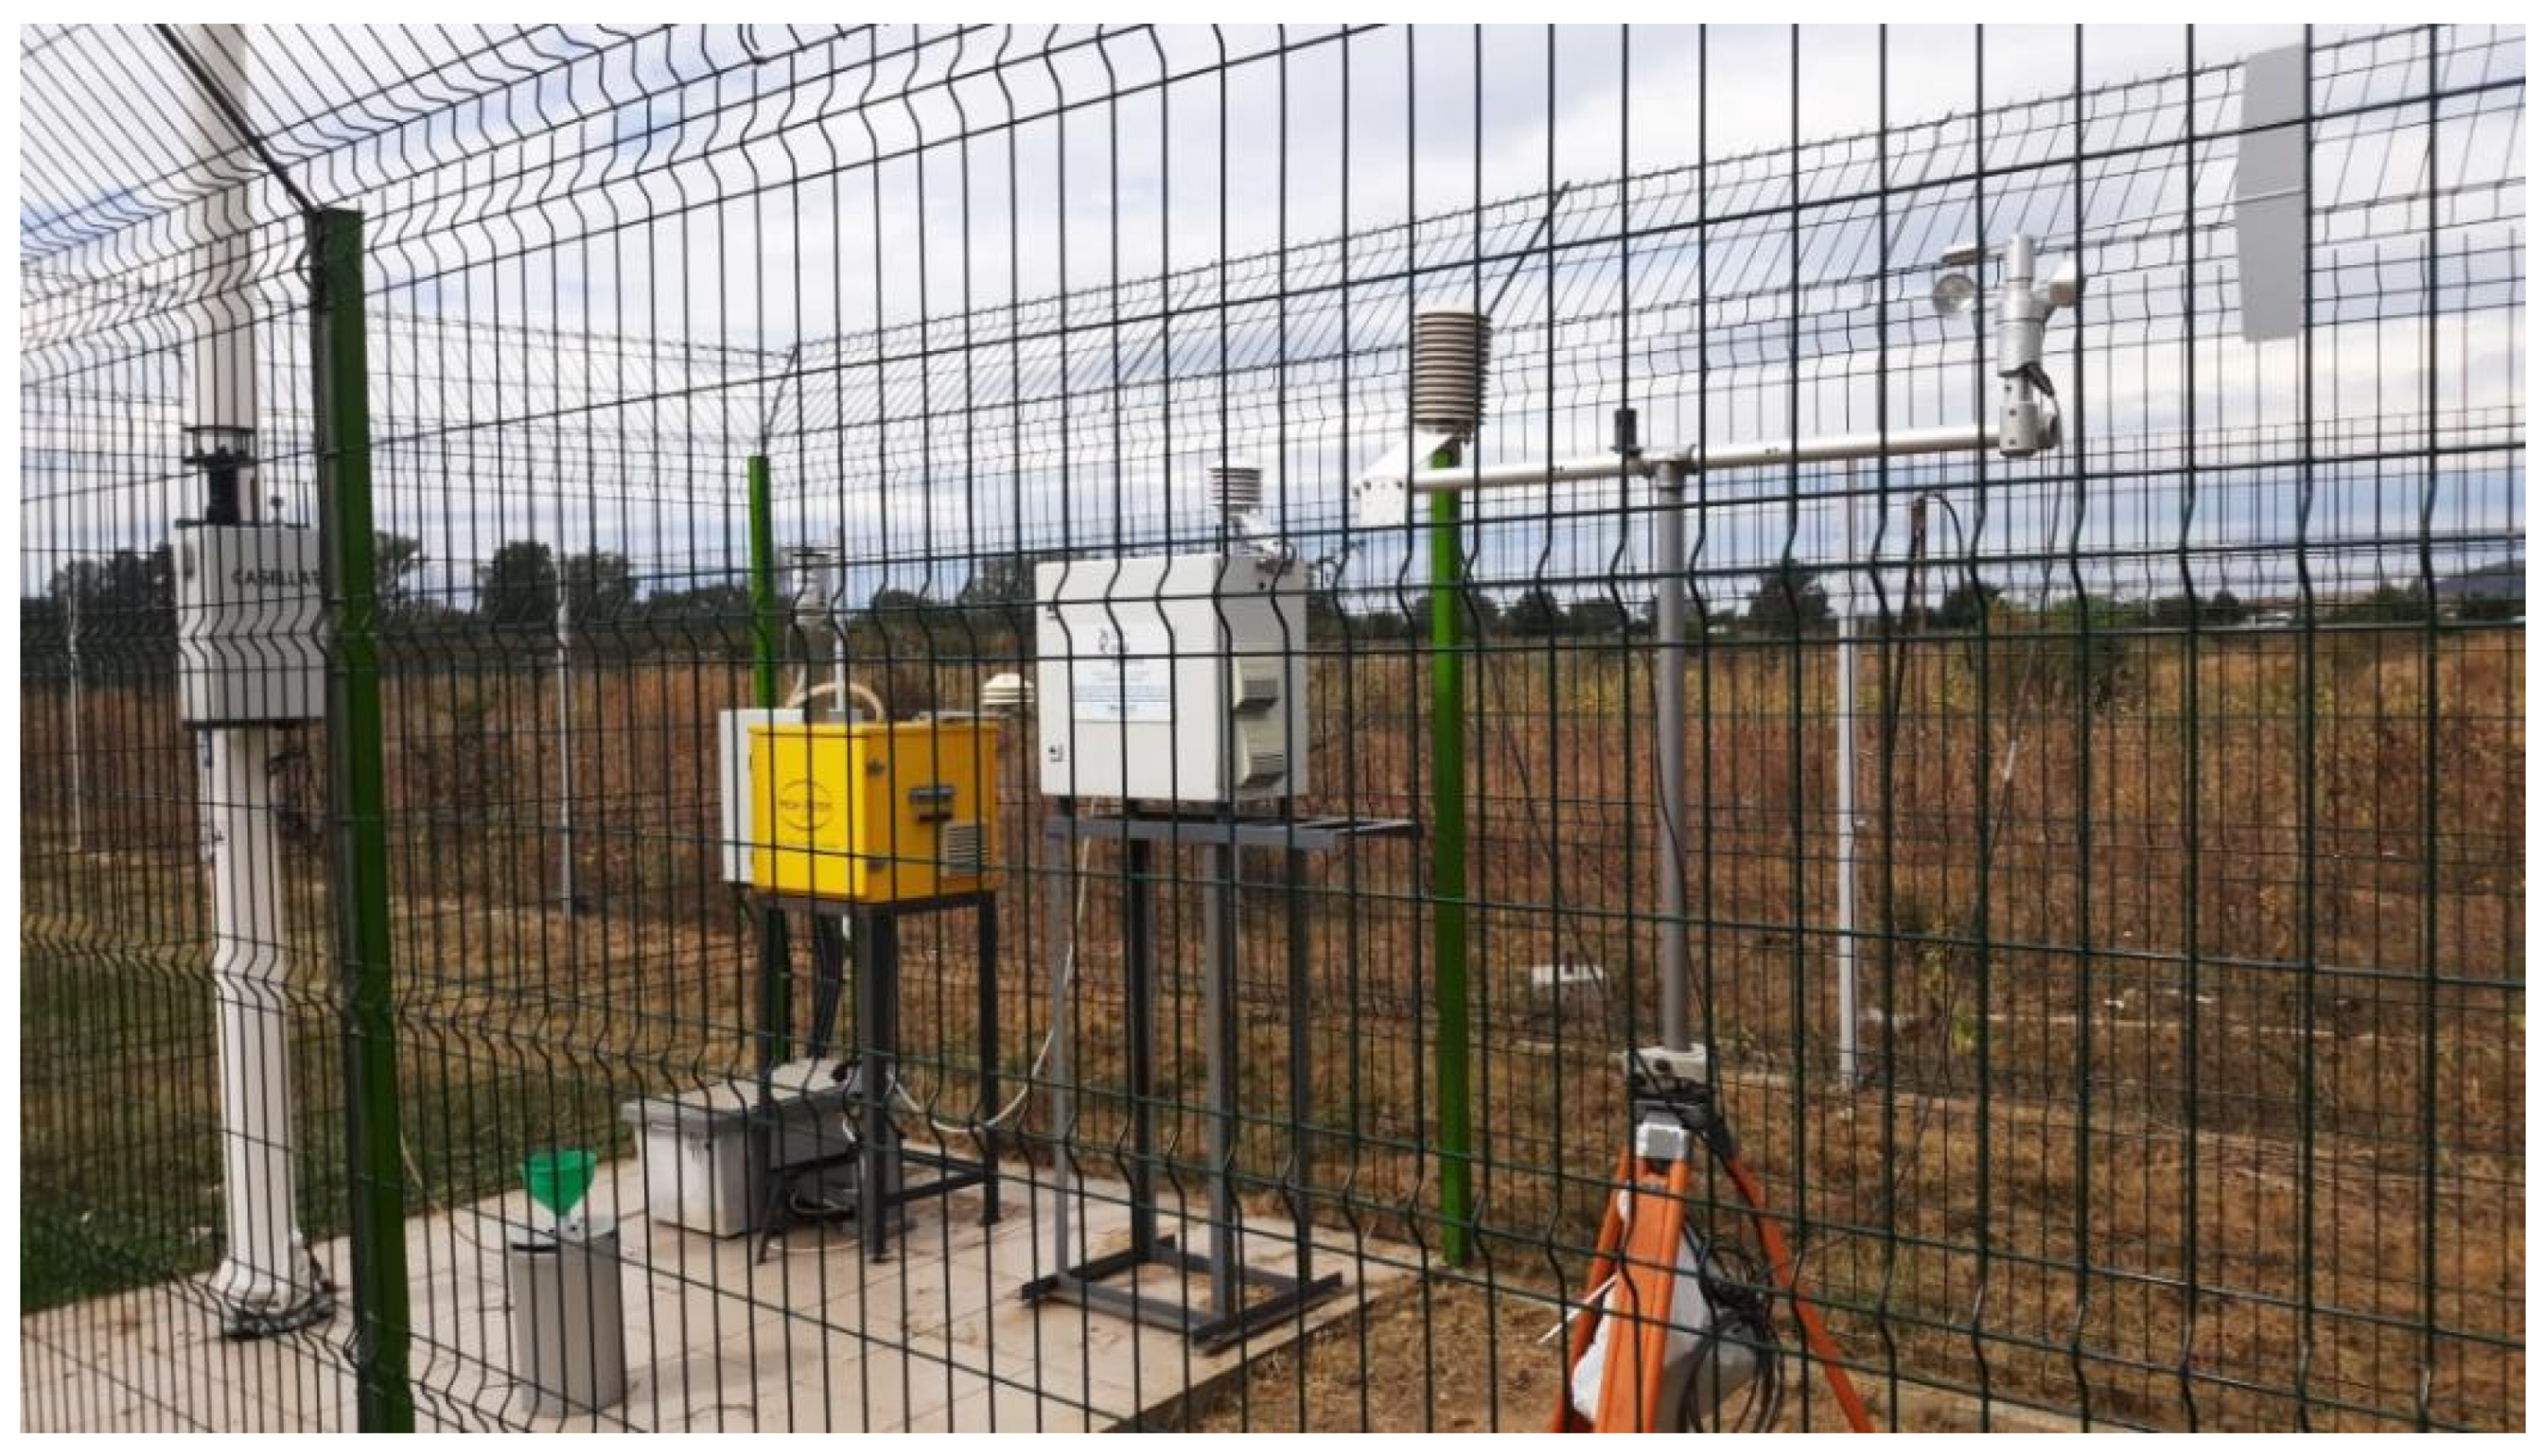
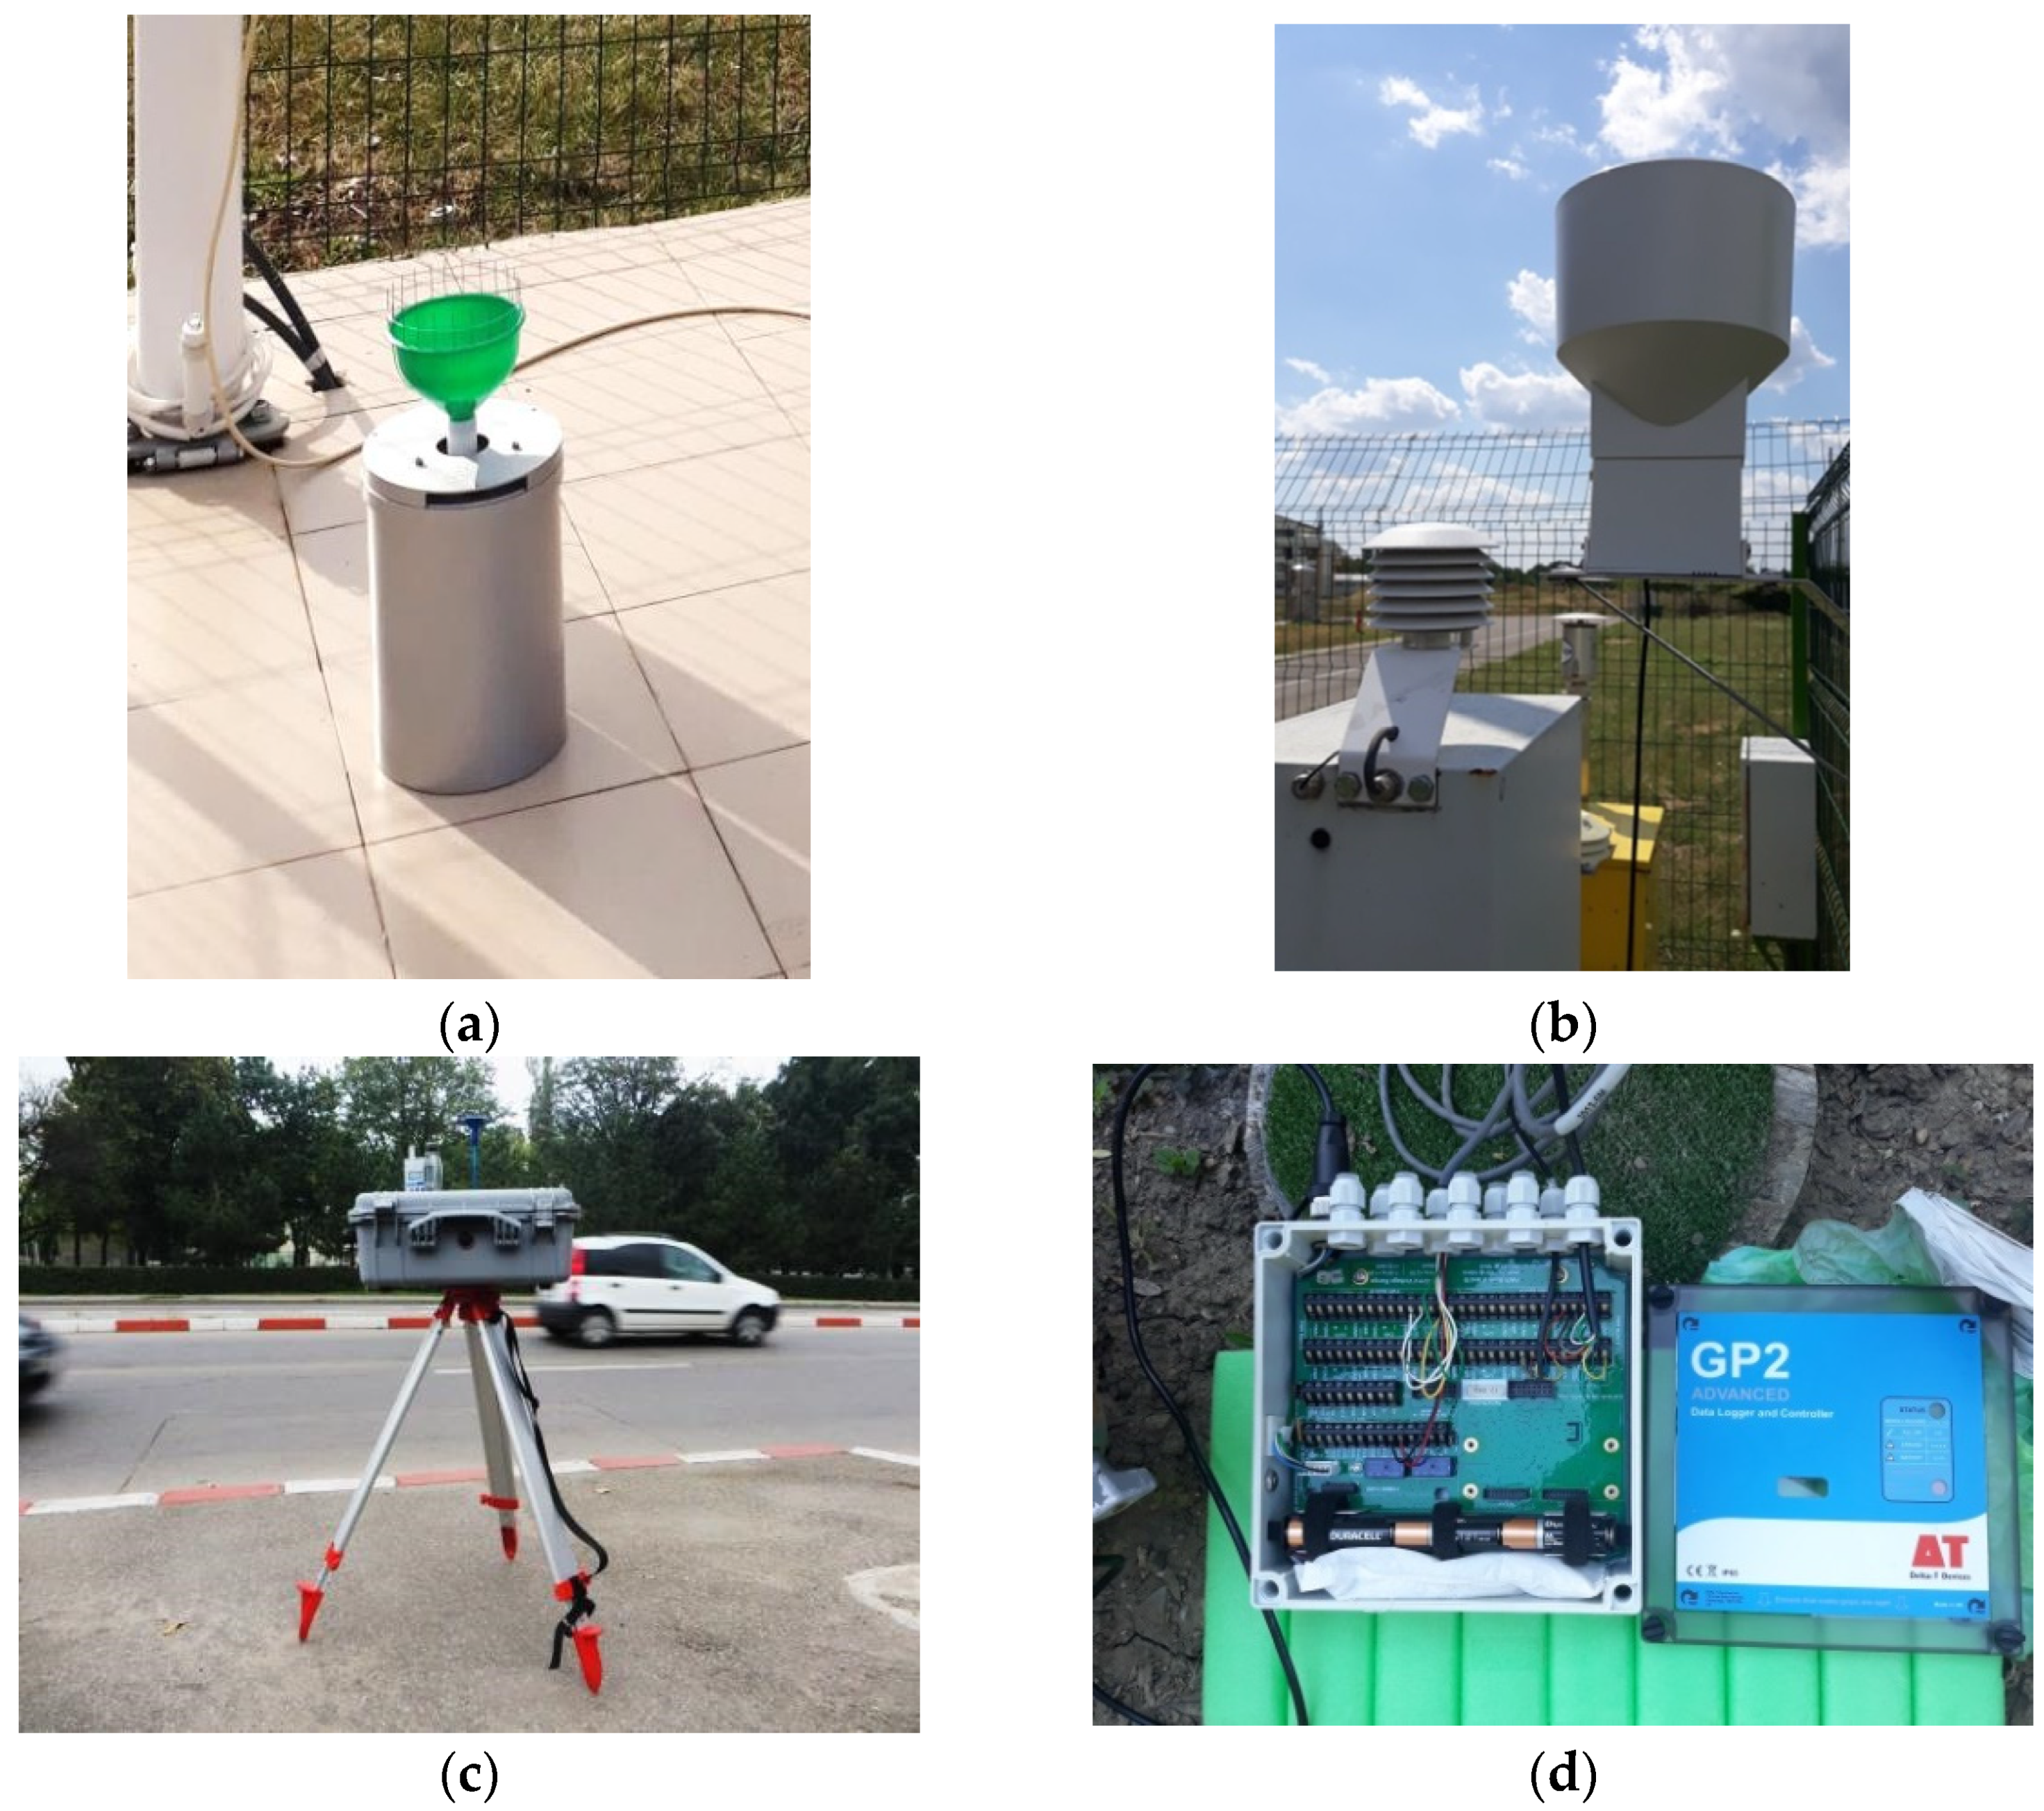
The sampling of rainwater was performed between 1 April and 31 November 2019, using PALMEX RS1 B rain samplers. RS1 B is specially designed to store collected water from rainfall for long periods without evaporation or other losses. This is a feature that allows a better assessment of the rainwater composition (
www.palmex.hr) (accessed on 25 November 2021). The samplers have a 3-L plastic bottle in which water enters from a funnel and an intake tube. The collector bottle is unscrewed and changed from below. Water collected in rain samplers from 3 locations was transferred in high-density polyethylene bottles. pH was assessed using a Thermo Scientific Eutech pH 150 and conductivity with an Oakton CON 6+. Nitrates and ammonium content was measured using a Hach Lange DR 2800 portable spectrophotometer (
https://www.hach.com/asset-get.download.jsa%3Fid%3D7639982436) (accessed on 25 November 2021).
For the elemental analysis, all water samples were filtered (pore size 0.45 μm, cellulose nitrate filters) and acidified using suprapure HNO3 65% (Merck, Kenilworth, NJ, USA), 1 mL of acid for every 100 mL of sample and then stored at 4 °C until analysis. Elements were analyzed by quadrupole inductively coupled plasma with mass spectrometry (ICP-MS, Perkin-Elmer ELAN DRC-e, Waltham, WA, USA) single collector with axial field technology for trace elements, rare earth elements, and isotopic analyses. Standard solutions were prepared by diluting a 10 μg/mL multielement solution (Multielement ICP Calibration Standard 3, matrix 5% HNO3, Perkin Elmer Pure Plus).
To assess particle-bound heavy metals, the airborne particles were collected on 47-mm quartz fiberglass filters (QM-A Whatman, Maidstone, Kent, UK) using the SELECT-ONE gravimetric sampler with a flow rate of 16.67 L min
–1 during the October and November months. Blank filters were weighed on a Kern analytical microbalance and were labeled prior to use. The analysis for determining the content of metals was following the procedures described in [
24] using graphite furnace atomic absorption spectrometry (GFAAS) on Analytik Jena ZEEnit 700 P spectrometer. The NIST SRM 1648a, Urban Particulate Matter, was used as a certified reference to check and validate the analytical results.
In Romania, the annual variation of precipitation falls within the continental regime of latitudes with a temperate climate, with a maximum value in summer (in June) and a minimum in winter (in February). The transition seasons (Spring and Autumn) receive relatively the same amount of precipitation.
Observations on atmospheric precipitation events were made visually (type, duration, and intensity) and instrumentally using Delta-T Devices RG2 rain gauges (
https://delta-t.co.uk/wp-content/uploads/2016/10/RG2-Raingauge-Sensor-UM.pdf) (accessed on 25 November 2021) connected to GP-1 or GP-2 data loggers, measuring and continuously recording the amount of water falling during precipitation (
Figure A2b,d). Rainfall less than 1.5 mm was not taken into account for analytical convenience.
The NOOA HYSPLIT trajectory-based geographic model (
https://www.ready.noaa.gov/HYSPLIT_traj.php) (accessed on 25 November 2021) was applied to explain the meteorology variations using long-range transport of the pollutants in and around Romania toward the monitoring location during high PM episodes.
The backward trajectory model used vertical velocity to provide frequency trajectories of emissions transport from the originating source regions of air pollution (1° grid resolution). The trajectory frequency 0 type was computed by multiplying the number of trajectories passing through each grid square with 100 and dividing the results by the number of trajectories (trajectory starting interval of 6 h). The Global Data Assimilation System (GDAS1) Archive (1° global) was selected for meteorology (
https://www.ready.noaa.gov/gdas1.php, accessed on 26 November 2021).
The values of the tested parameters from the collected water samples (n = 93) were considered as EMCs. The Wilcoxon rank-sum test [
20] was performed to determine if EMCs significantly differed between samples collected at the three monitoring sites. Since the tests did not show significant differences, the EMCs from all three sites were combined into one time series for further analysis (n = 31). Summary statistics (mean, associated confidence intervals, geometric mean, median, minimum, maximum, standard deviation, coefficient of variation, C.V. (%), skewness, and kurtosis) were calculated for each time series comprising the 31 rainfall events occurring from 1 April to 31 November 2019. A correlation matrix was explored to find the significant associations between the tested variables. Factor analysis (FA) was applied to the particle-bound heavy metals dataset using principal component analysis (PCA) based on Varimax with Kaiser normalization. All the tests were performed using SPSS software (SPSS Inc., Chicago, IL, USA, 2011).
3. Results
The rainwater characteristics in the former metallurgical city, Targoviste, were estimated based on pH, conductivity, nitrates and ammonia, and heavy metals content.
3.1. pH and Conductivity of Rainwater
pH is a parameter of water quality having an influence on other water parameters, and its measurement is one of the most frequently tested in water chemistry.
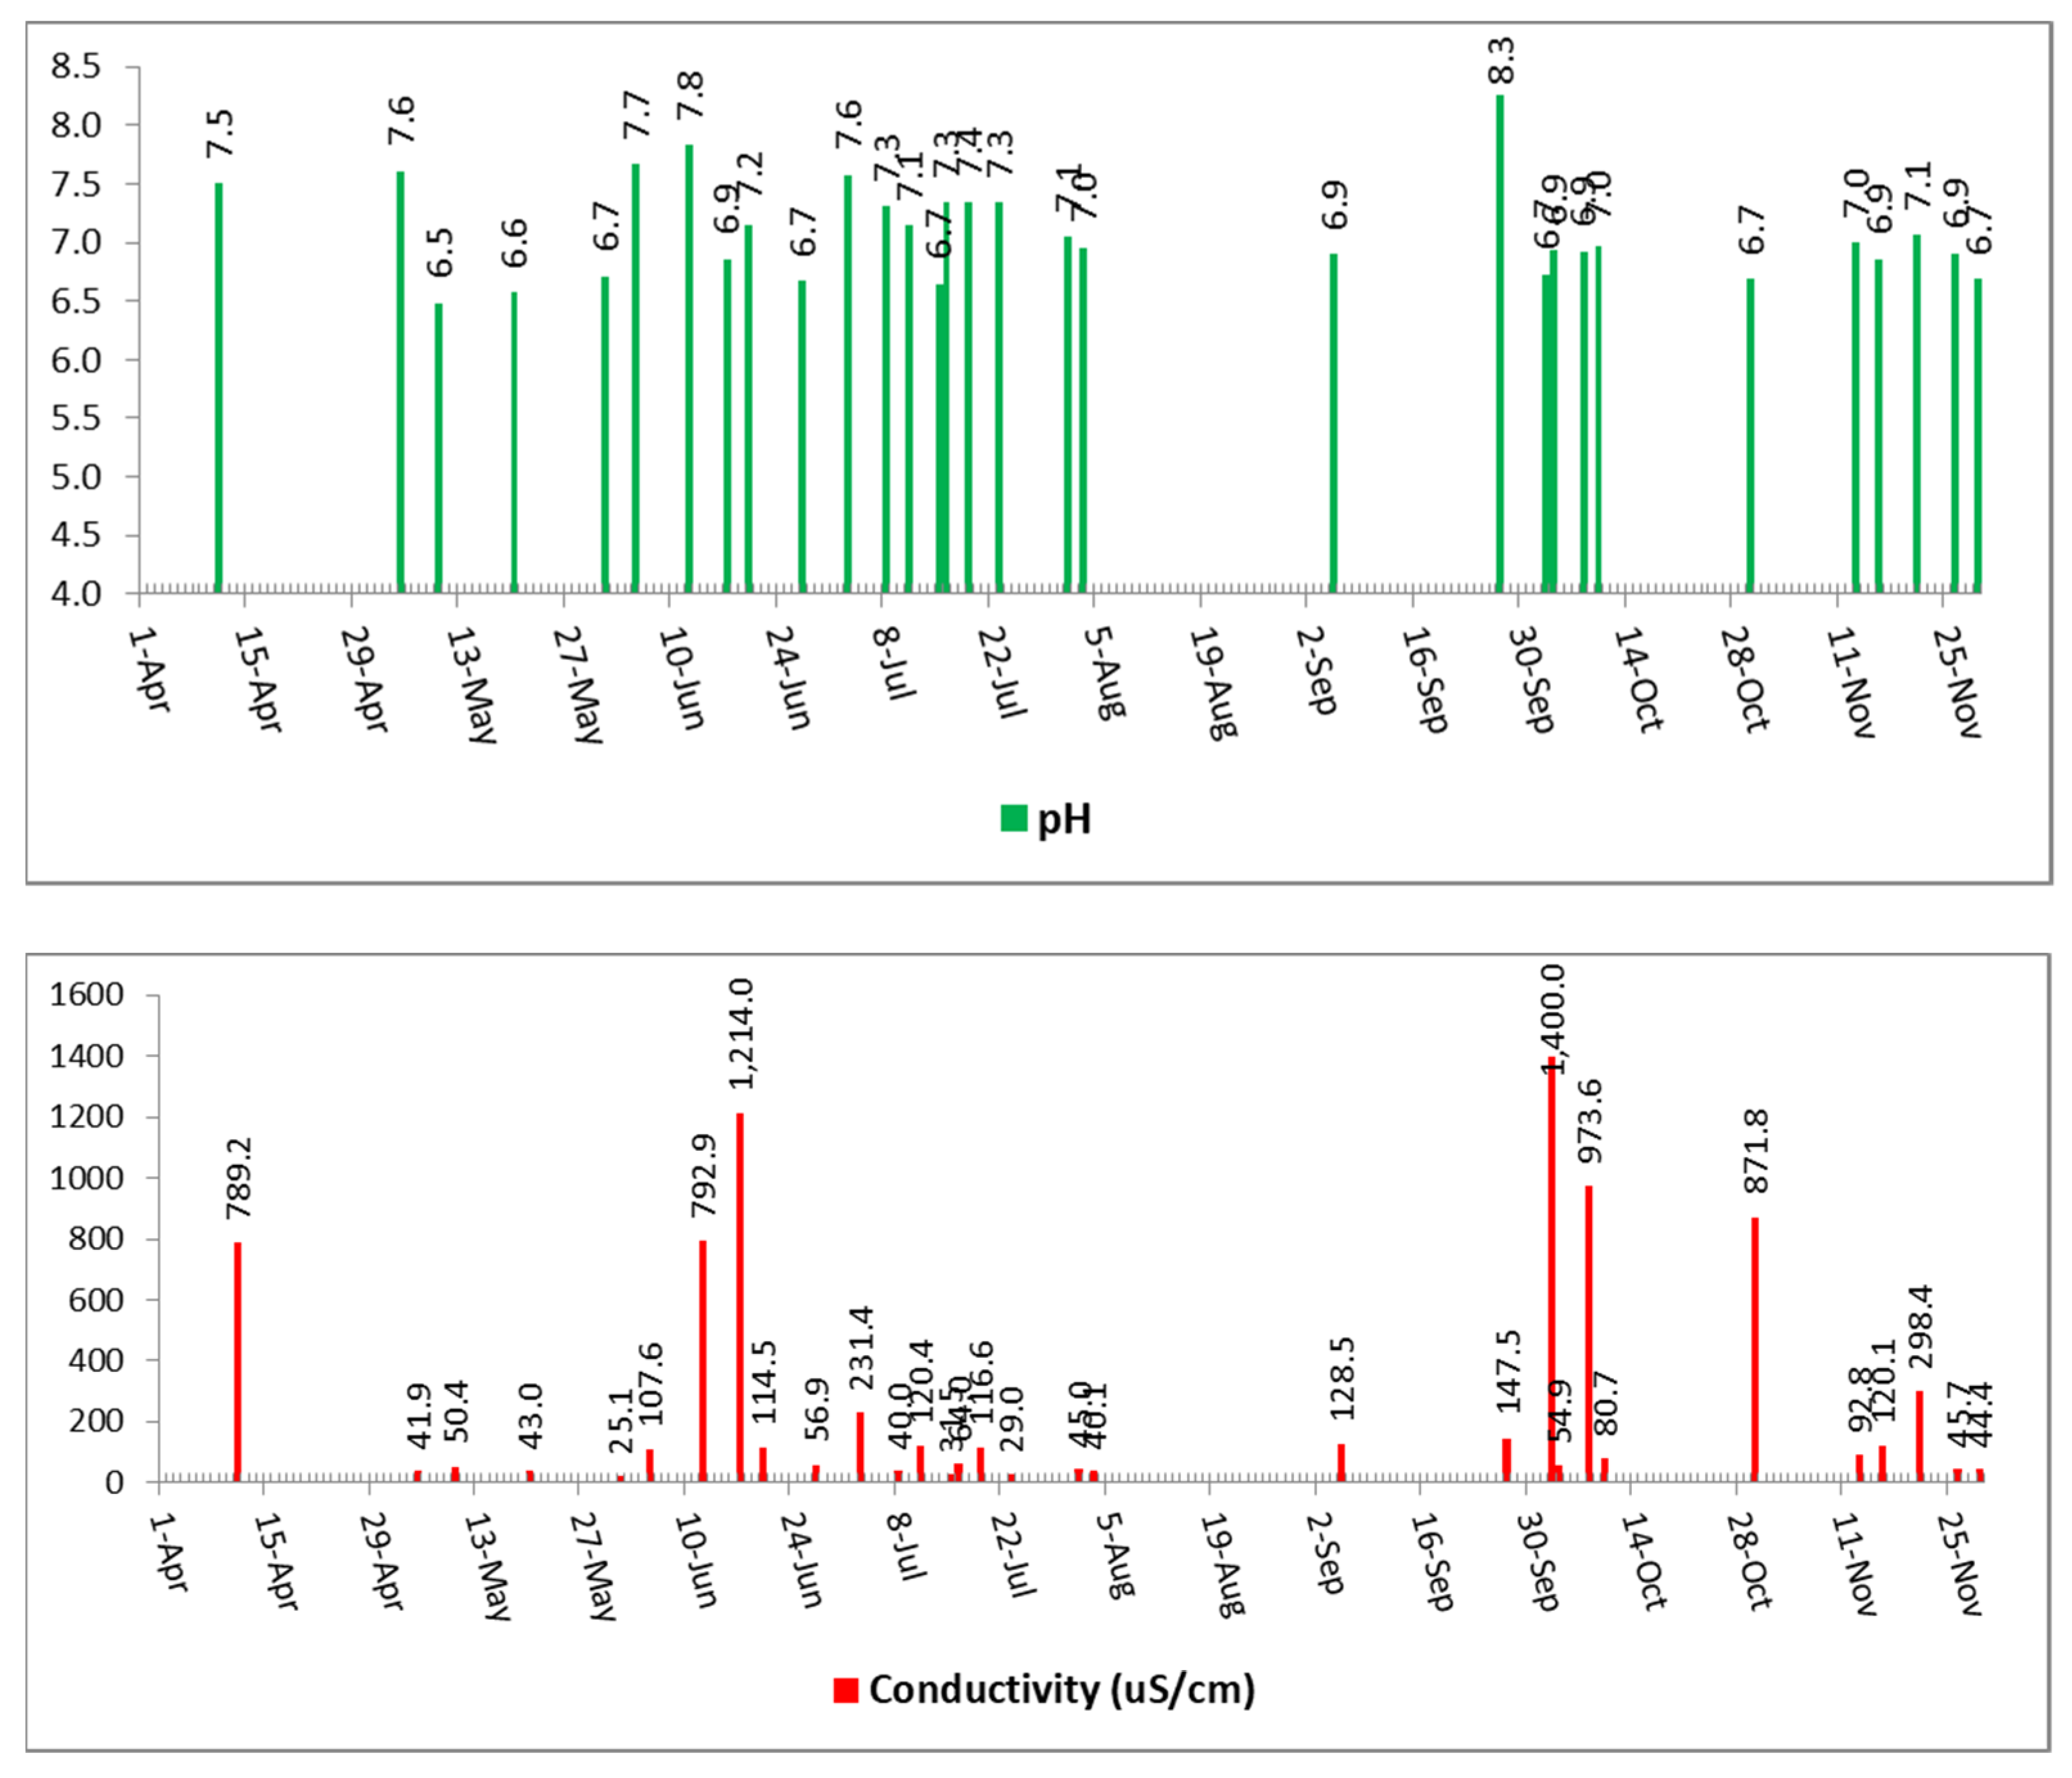
Figure 2 shows the pH values for each rainfall event observed between April and November 2019. The average for the entire period was 7.09 [95% C.I. 6.94–7.24] with a minimum of 6.5 and a maximum of 8.3. The C.V. was 5.78%, being the smallest of the tested variables.
Conductivity ranged between 25.1 and 1400 µS/cm showing the highest variability (146.34%). Only six rainfall events from 31 exceeded a conductivity of 750 µS/cm, most of the values being less than 130 µS/cm. The median of the period was 92.76 µS/cm, while the average of the aggregated time series from the average of the values recorded in each of the three monitoring points was 264.89 µS/cm [95% C.I. 122.68–407.10]
pH did not present any associations with the other tested variables, while conductivity was strongly correlated with dissolved nitrates (Pearson r = 0.96; p = 0.0001) and ammonia (Pearson r = 0.95; p = 0.0001).
3.2. Nitrates and Ammonia in Rainwater
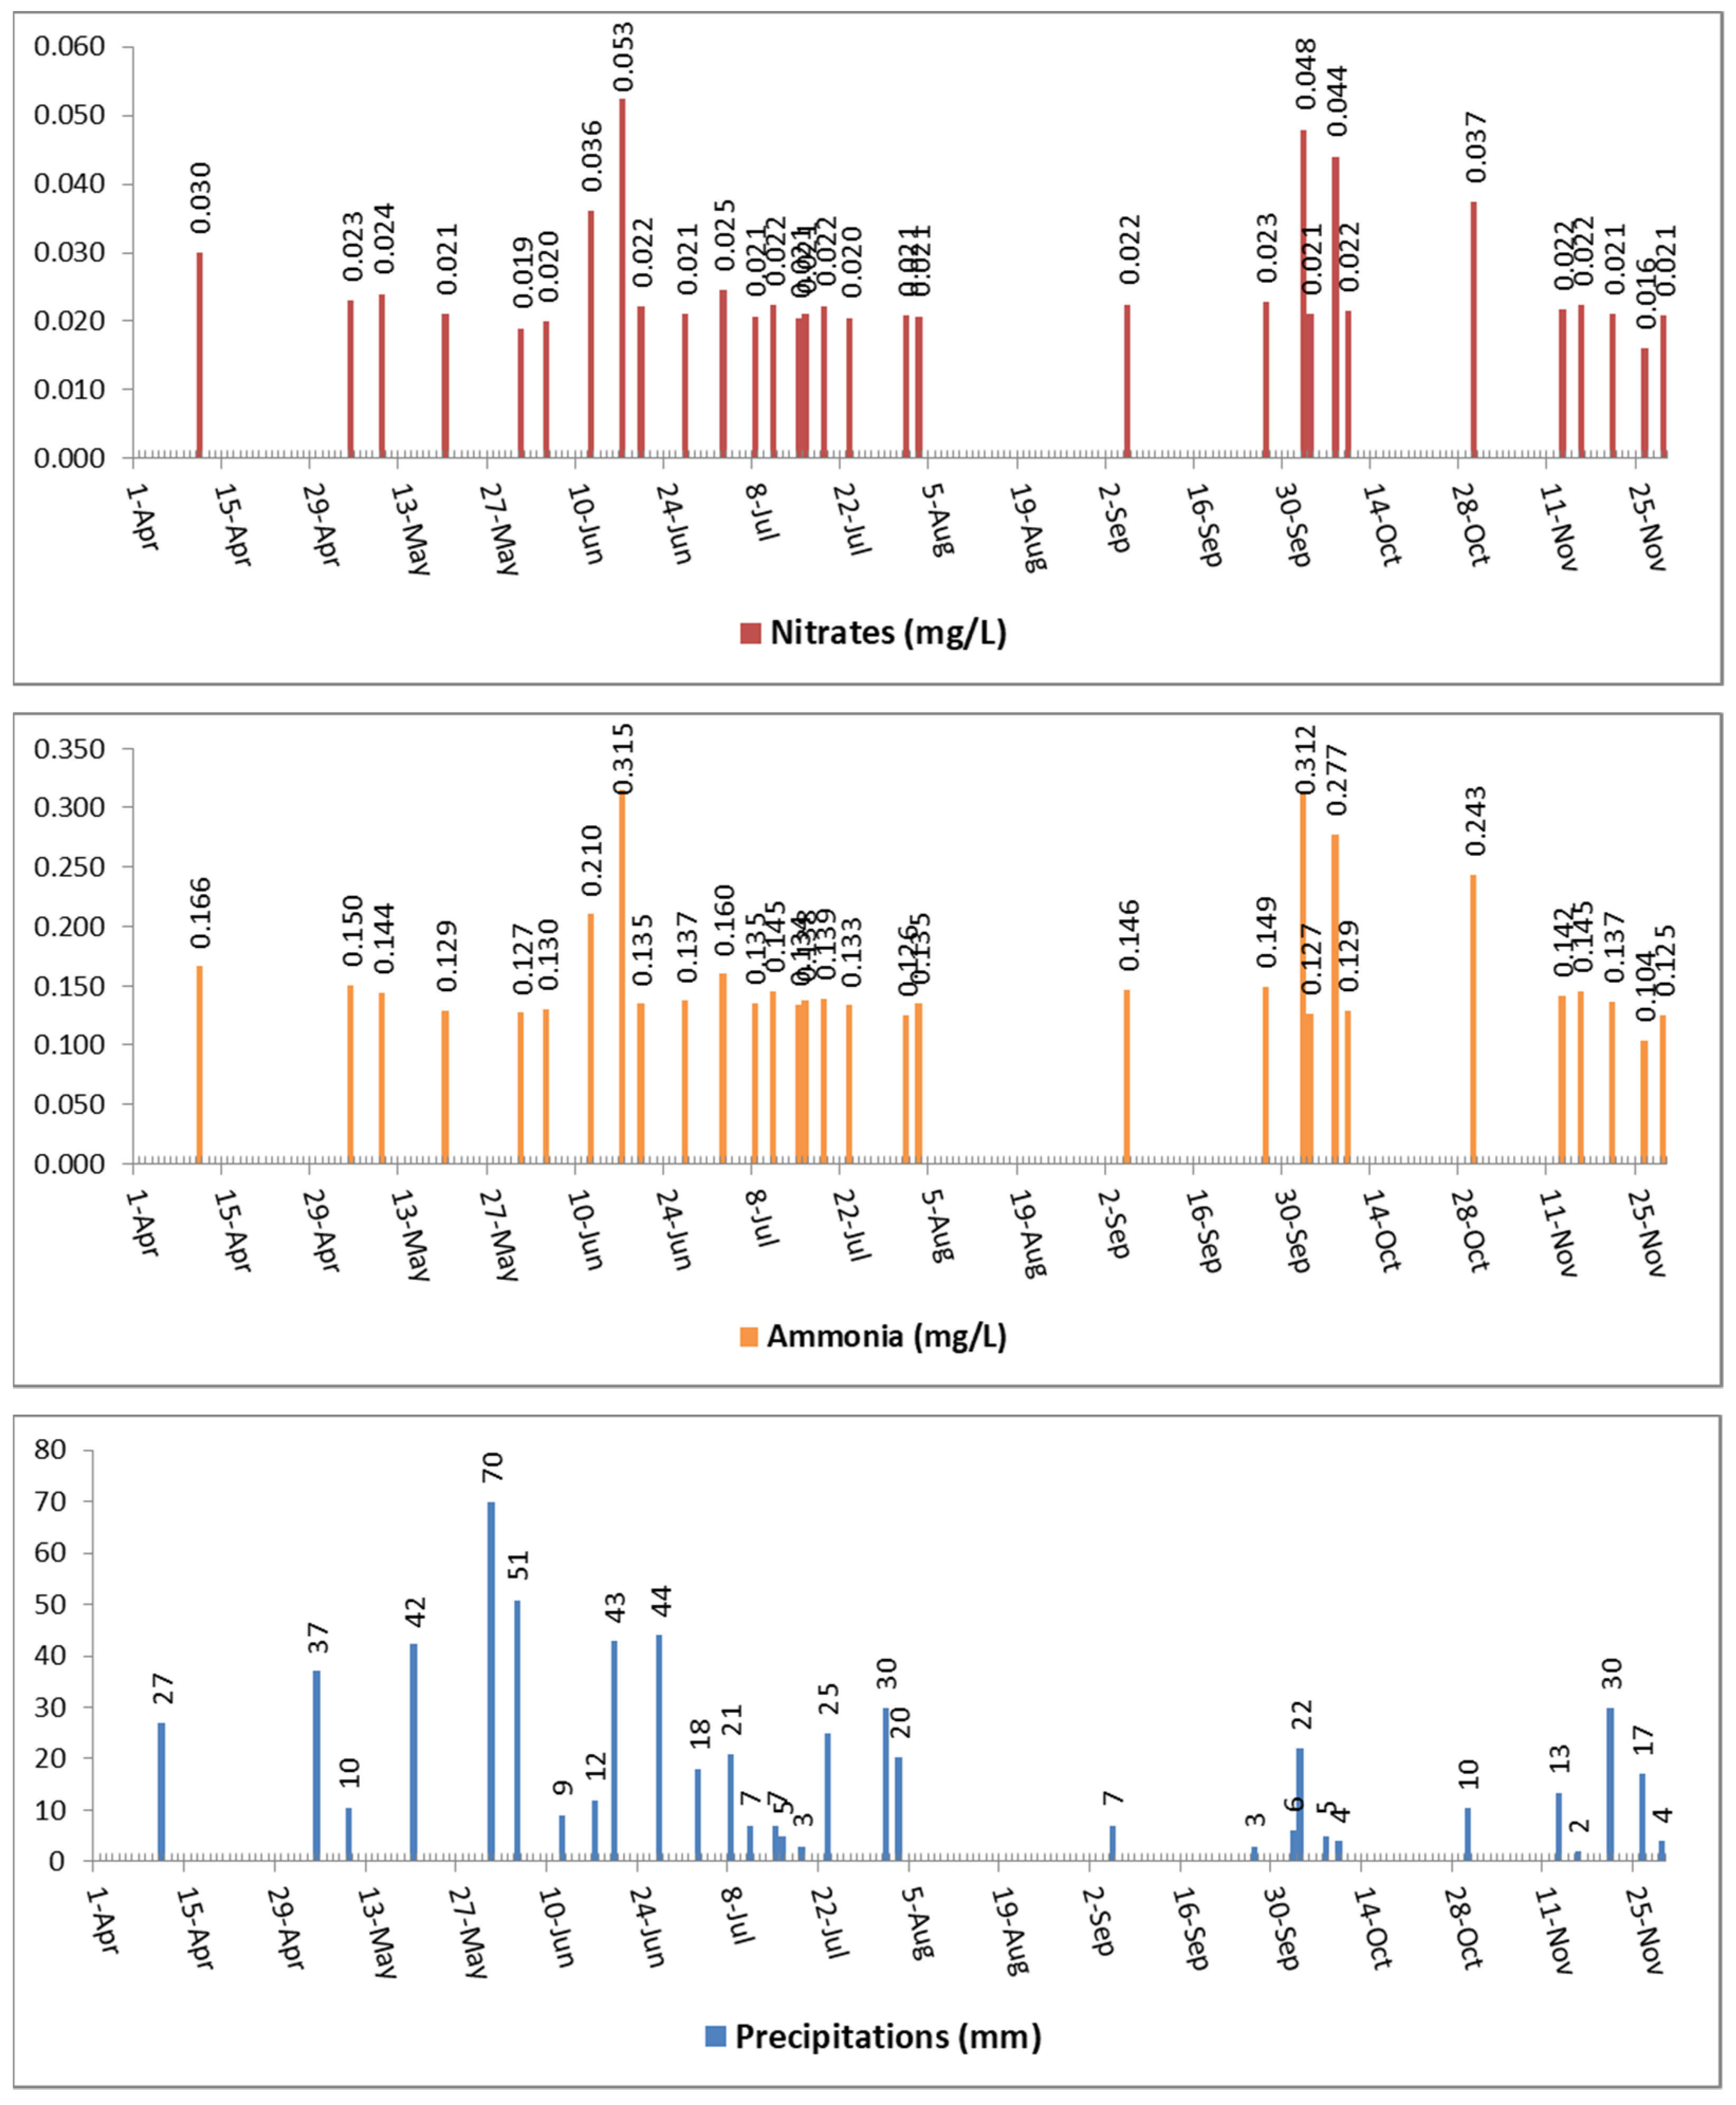
Figure 3 shows the time series of nitrates, ammonia, and quantity of precipitation events for each rainfall event during the monitoring period selected for analysis in this work.
Dissolved nitrates reached an average of 0.03 mg L−1 [95% C.I. 0.02–0.03] with a 35.06% coefficient of variation. The lowest value was 0.016 mg L−1 in November, while the maximum was 0.053 mg L−1 in the middle of June. Only three rainfall events reached values higher than 0.04 mg L−1 during the monitoring period.
Ammonia showed a similar trend as dissolved nitrates, with a C.V. = 33.98%, an average of 0.16 mg L−1 [95% C.I. 0.14–0.18]. The ammonia time series ranged between 0.10 and 0.32 mg L−1.
A strong positive correlation was noticed between dissolved nitrates and dissolved ammonia (Pearson r = 0.99; p = 0.0001).
Regarding the quantity of precipitation events recorded for each event, the average of the period was 19.54 mm [95% C.I. 13.32–25.75], with a C.V. = 86.69% (min. = 2.00 mm; max. = 70.00 mm). The distribution was concentrated in the May to July period, with lower quantities in September and November.
Table 1 summarizes the results presented graphically for the monitored period.
3.3. Wet Deposition of Nitrates and Ammonia
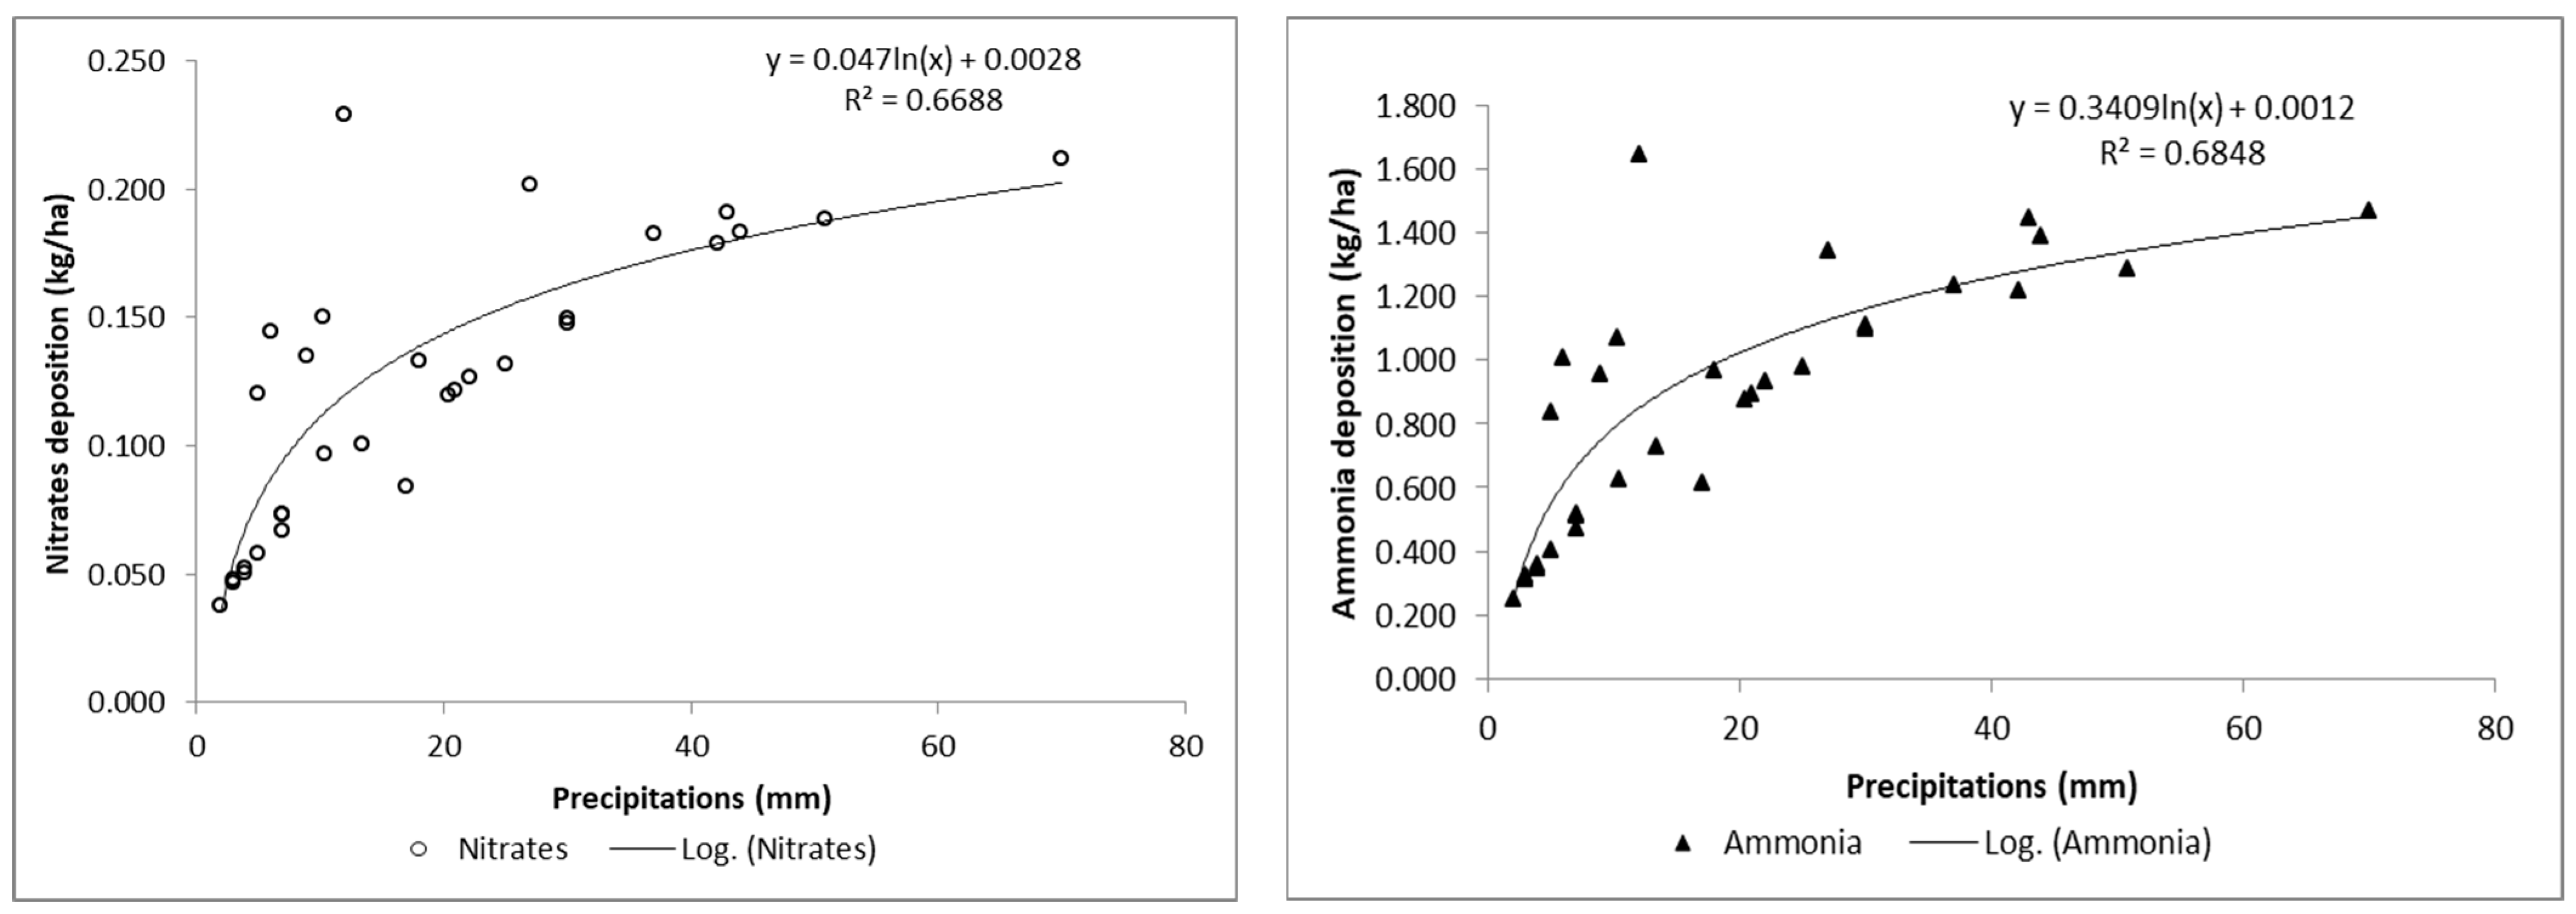
The wet deposition was estimated using Equation (A1)—
Appendix A, both for nitrate nitrogen and ammonia nitrogen for all 31 rainfall events following the procedures presented in [
20].
Figure 4 illustrates the nitrogen deposition estimated per hectare based on the least-square regression. The monthly nitrogen depositions obtained by summing daily deposition estimated by regression were 0.2 kg ha
−1 in April, 0.5 in May, 0.8 in June, 0.6 in July, 0.1 in August, 0.1 in September, 0.4 in October and, 0.3 in November, respectively, with a total of 3 kg ha
−1 for the period.
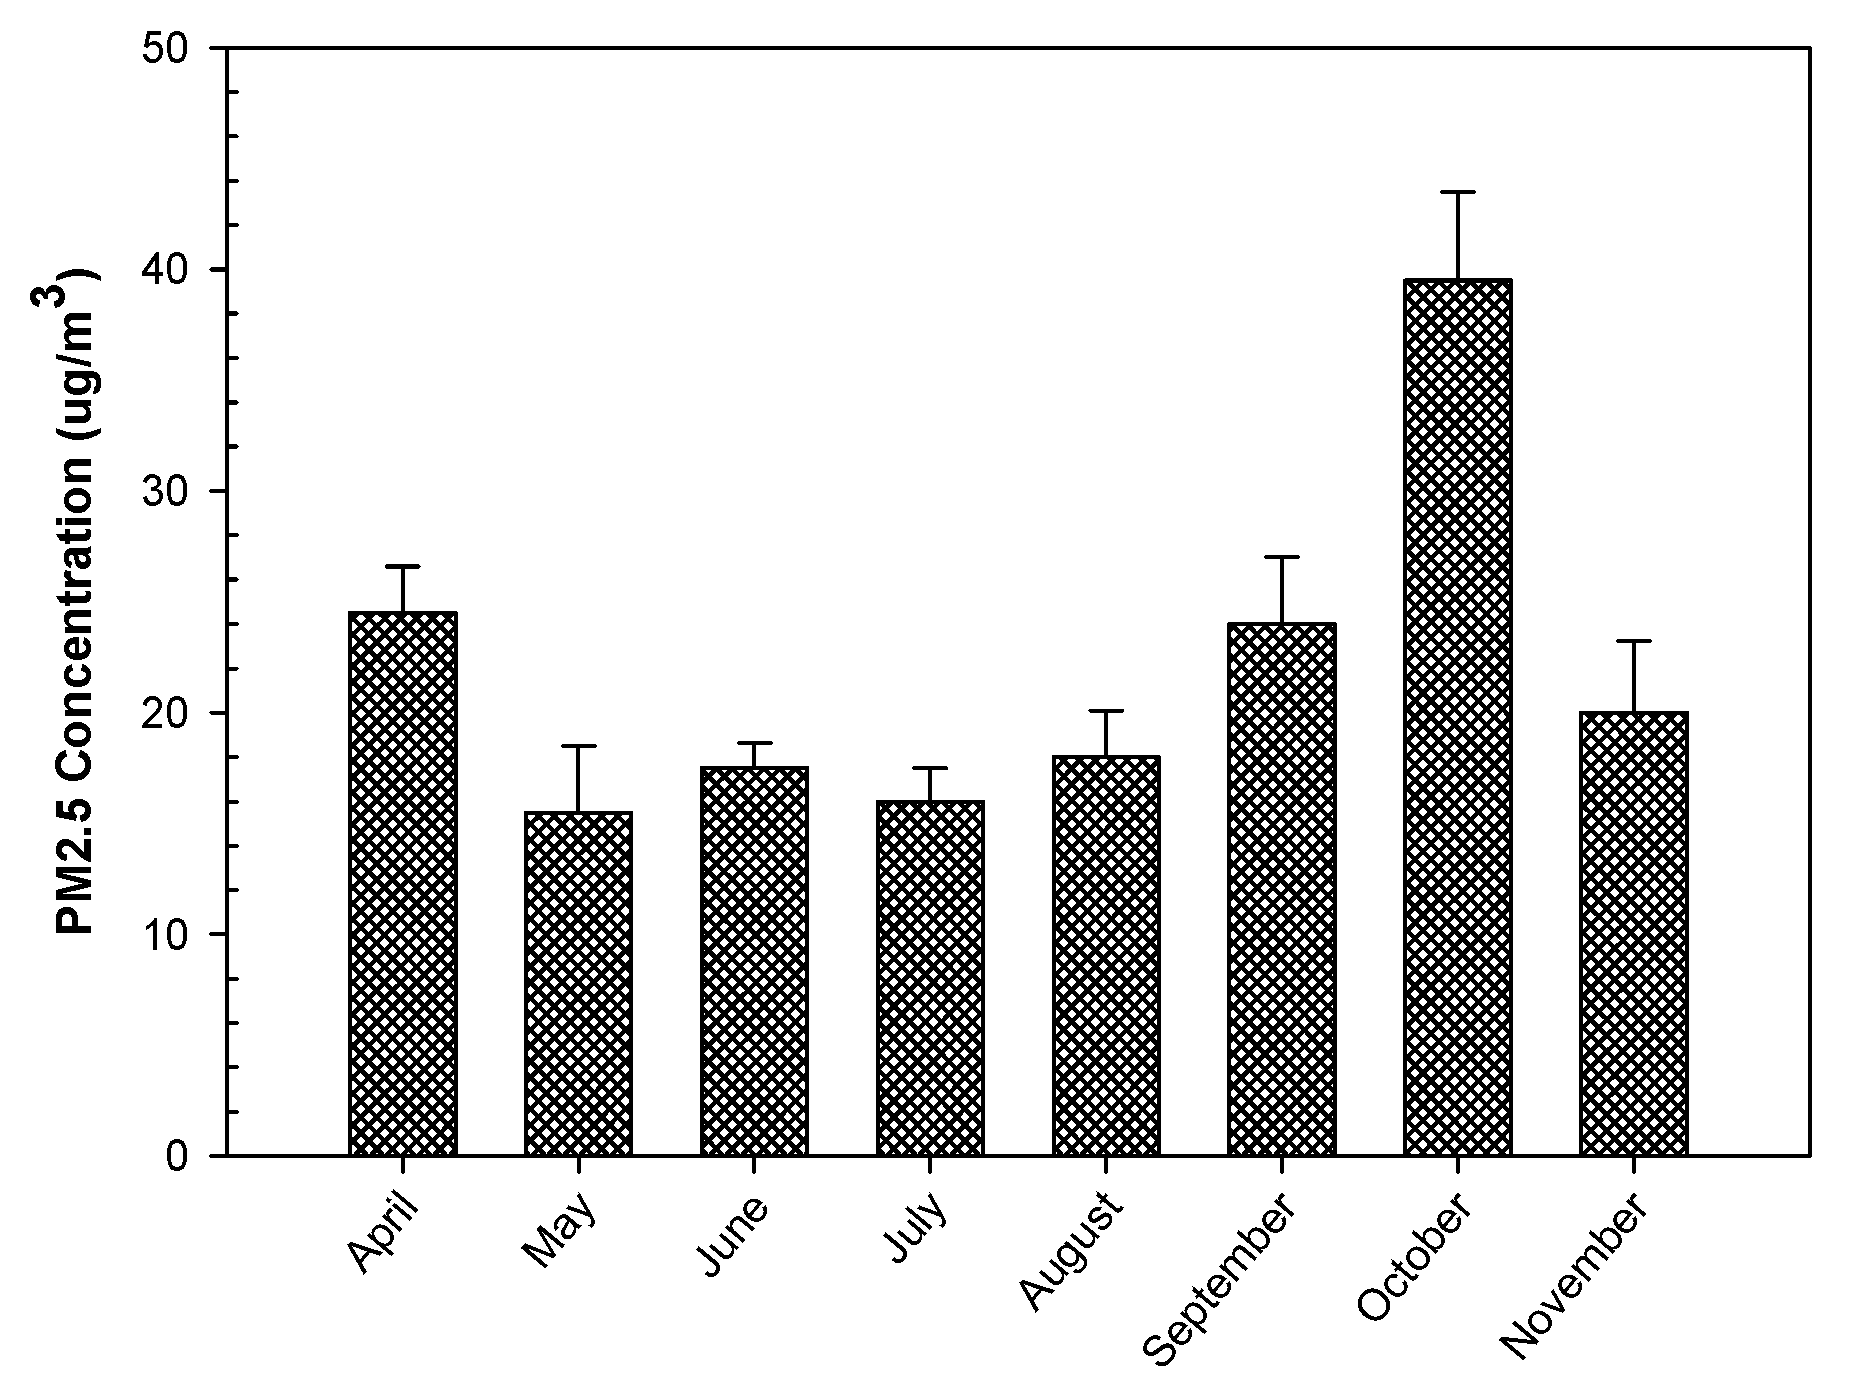
3.4. Particulate Matter
The results regarding the fine fraction (PM
2.5) are presented in
Figure 5, showing the monthly averages of concentrations calculated before a rainfall event. The average for the monitored period (April–November) was 21.9 µg m
−3 (± 2.8 between the three monitoring points). The maximum value was recorded in October (39.5 ± 4.2 µg m
−3) and the minimum in May (15.5 ± 2.4 µg m
−3) and June (16 ± 1.8 µg m
−3). October was a month with few precipitation events, while the number and quantities of precipitation events were high both in May and June 2019.
A negative correlation was noticed between the monthly precipitation events and the PM2.5 concentrations (Pearson r = −0.57; p < 0.05), suggesting that the rainfall regime (monthly and seasonal amounts, indicating the distribution of precipitation over different periods of the year) has an important influence on the particulate pollution depending on the general circulation of the atmosphere and local geographical factors.
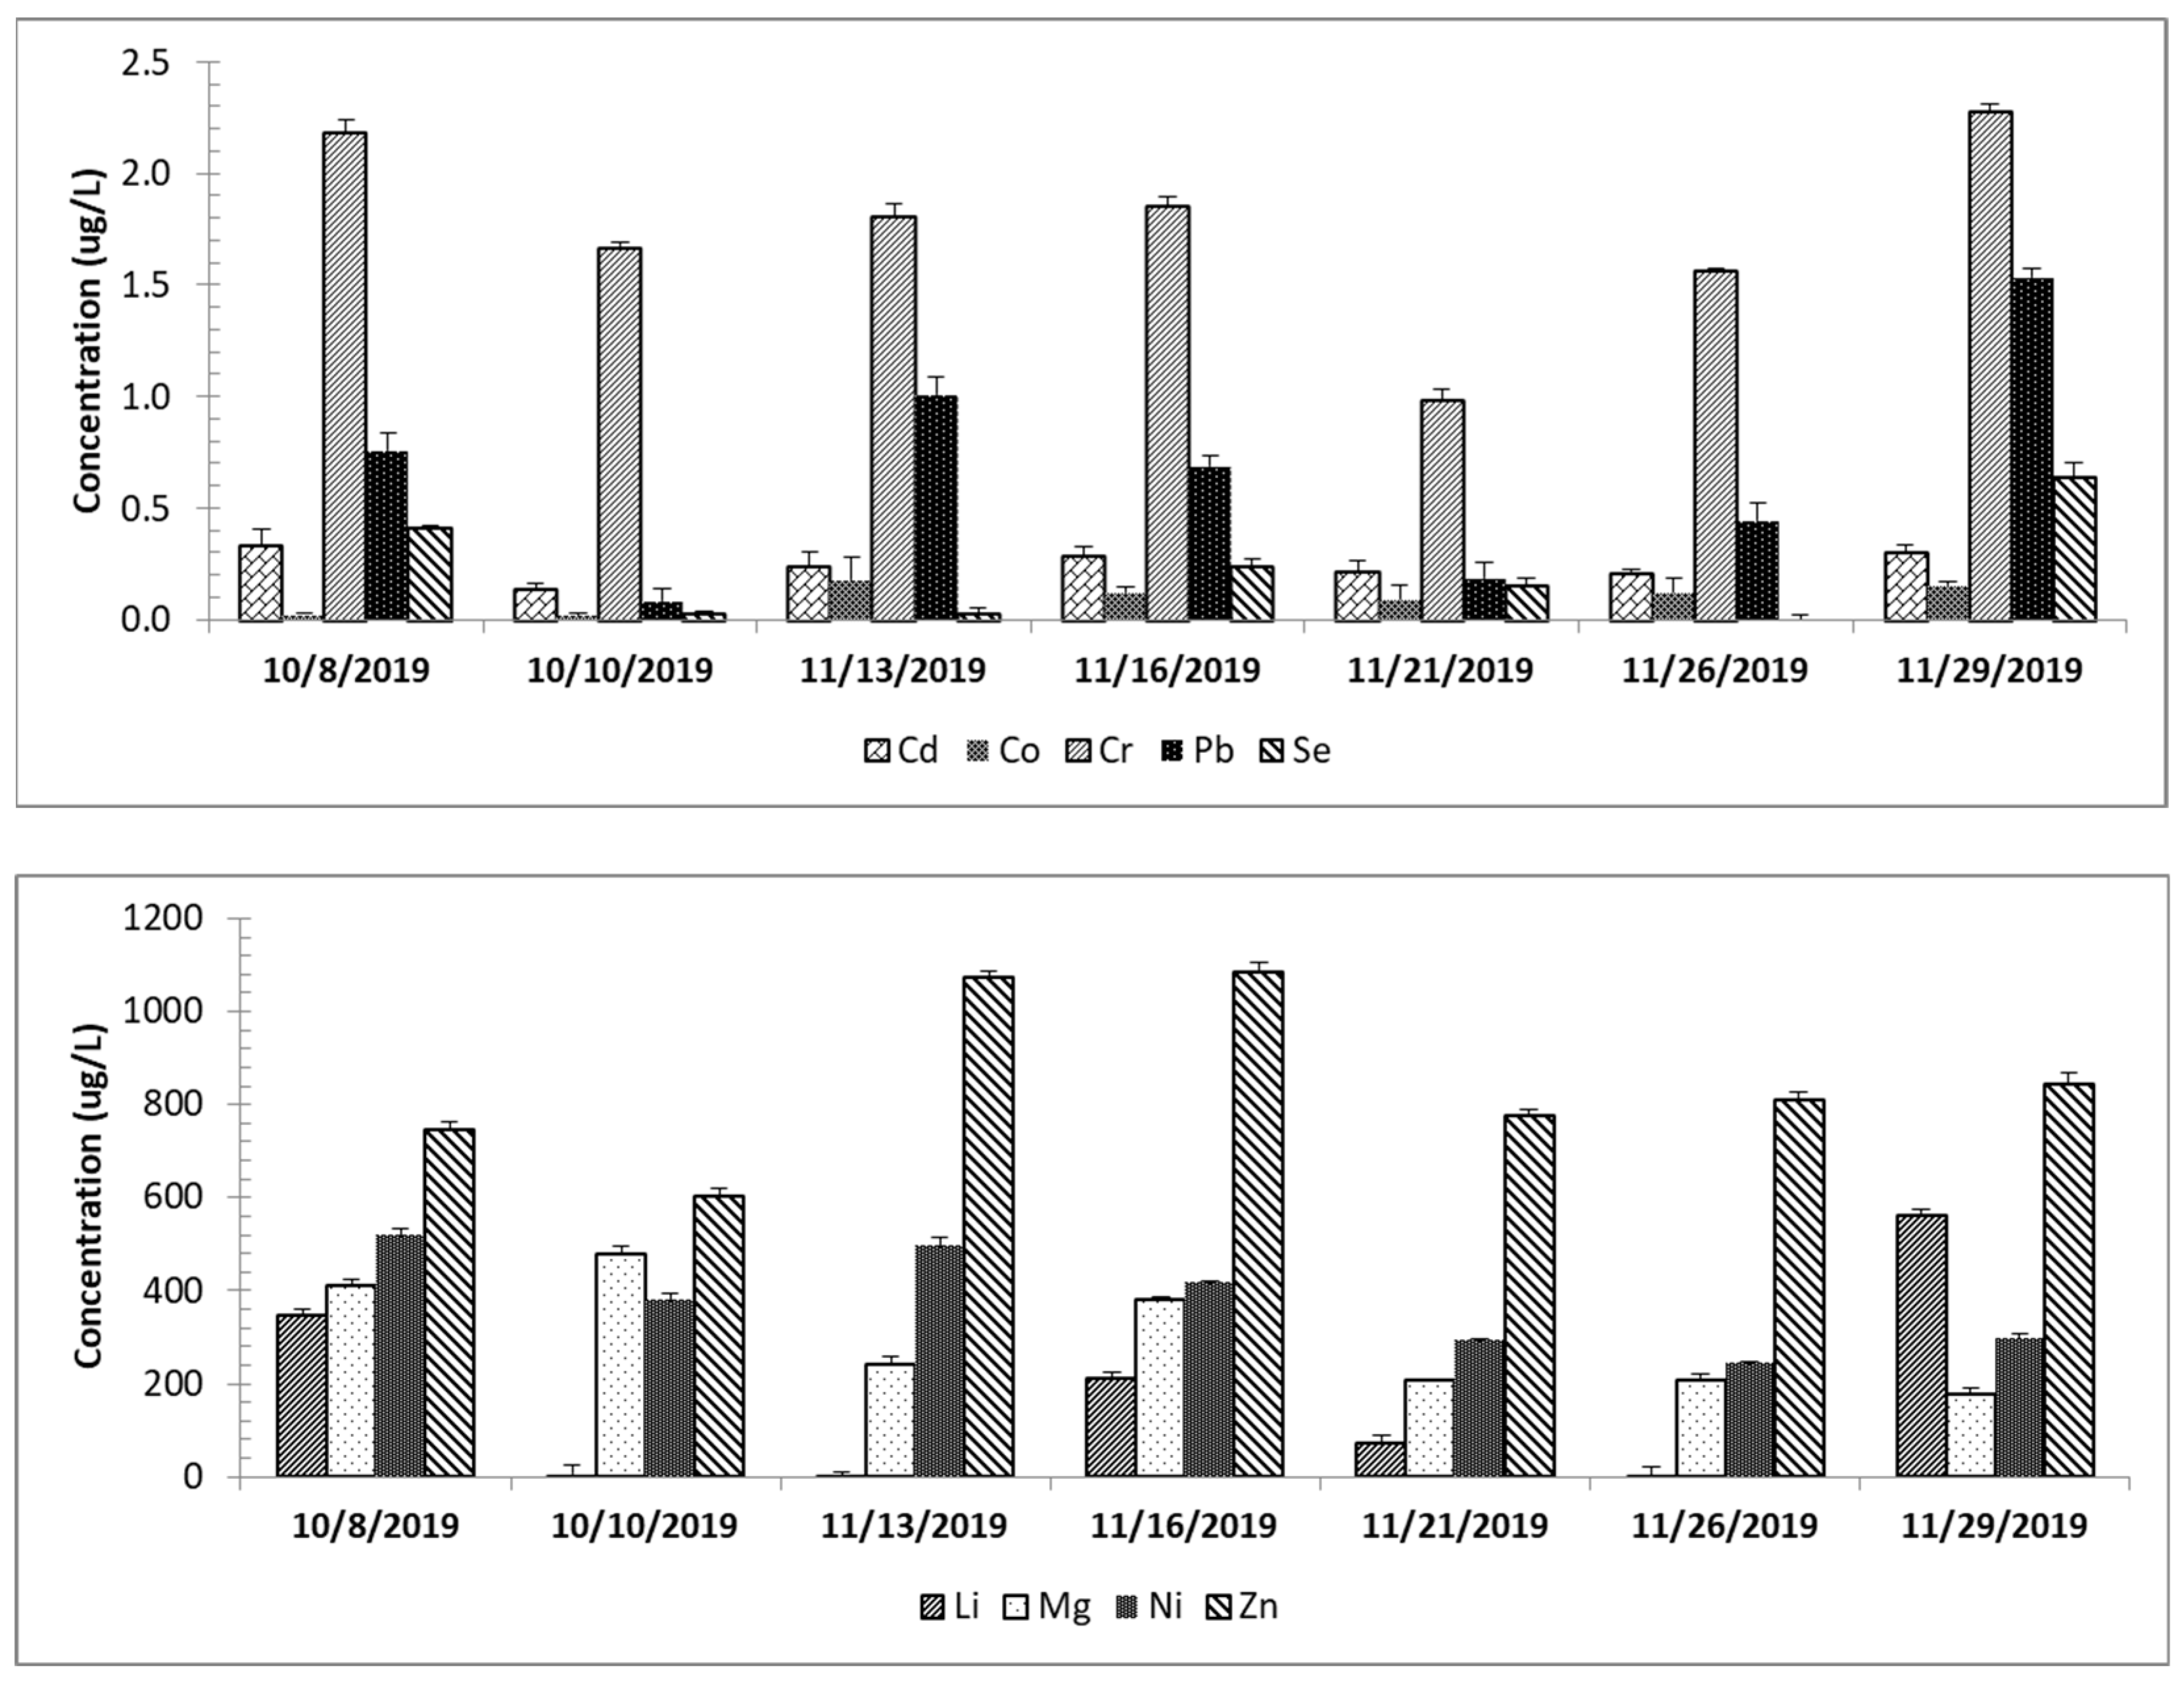
3.5. Heavy Metals in Rainwater and Surrounding Airborne PM
The elemental analysis provided a screening of the rainwater composition for the October and November events.
Table 2 shows the overall results in µg L
−1. Al, Be, and Bi were below the detection limit of the analytical instrument.
As, which is a metalloid, had an average of 0.52 µg L−1 (C.V. = 75.8%). Ca was found in elevated amounts reaching an average of 5480.89 µg L−1 (C.V. = 21.8%), being the most constant element within the rainfall events. Regarding the heavy metals, the concentrations were 0.25 (Cd) − C.V. = 26.5%, 0.10 (Co) − C.V. = 58.1%, 1.77 (Cr) − C.V. = 24.3%, 377.37 (Ni) − C.V. = 27.9%, 0.67 (Pb) − C.V. = 74.3%, and 846.56 (Zn) − C.V. = 20.6%. Other elements that are used in the manufacturing of special steel by adding them to iron were found in the rainwater collected in autumn: Mn-10.51 µg L−1 (C.V. = 74.3%), Cu-3.1 µg L−1 (C.V. = 69.6%), and V-0.96 µg L−1 (C.V. = 98.1%). Se (0.21 µg L−1) and Sr (9.12 µg L−1) were also detected in water, the latter one exceeding the 4 mg/L for strontium levels in drinking water recommended by US EPA.
P was found with an average concentration of the seven consisting events reaching 4.33 µg L−1 (C.V. = 84.11%). Mg (299.38 µg L−1) and Li (171. 83 µg L−1) showed relatively high concentrations compared to the other elements.
Figure 6 presents the variability of selected elements, including the heavy metals between rainfall events and between the three monitoring points. From the results of the heavy metals content of PM, we selected for presentation only the metals with potentially high impact on health, i.e., Cr, Cd, Ni, Pb, and V, which are also related to the metallurgical emissions resulting from the production of special steels.
The average concentrations of the period corresponding to the rainfall events occurring between October and November 2019 were Cr (0.07 ng m
−n), Cd (0.01 ng m
−n), Ni (0.6 ng m
−n), Pb (1.03 ng m
−n), and V (1.01 ng m
−n),
Table 3. The highest variability was recorded for V (113.9%) and the lowest for Ni (32.1). Lead showed an increased variability as well (88.5%).
Table 4 presents the correlation between the rainwater content of heavy metals and the concentrations determined in PM, and the volume of precipitation for the rainfall events. Overall, Ni, Pb, and V had significantly strong correlations (
p < 0.01) between the concentrations from rainwater and PM. Cr showed a lower significance (
p < 0.05), respectively. Negative associations were found between precipitation and heavy metals both from rainwater and PM, but only a few showed statistical significance. However, this could explain the “washing” effect of the rain on the heavy metals from PM
2.5. Factor analysis provided the factor loadings in the rotated matrix, explaining the variability in the dataset consisting of rainwater and airborne PM-heavy metals and precipitation (
Table A1). The rotated matrix showed that Cd, Pb, and V both in rainwater and PM formed the first factor (PC1), Cr from rainwater and PM, and precipitation formed the second factor (PC2), and Ni from rainwater and PM formed the third one (PC3).
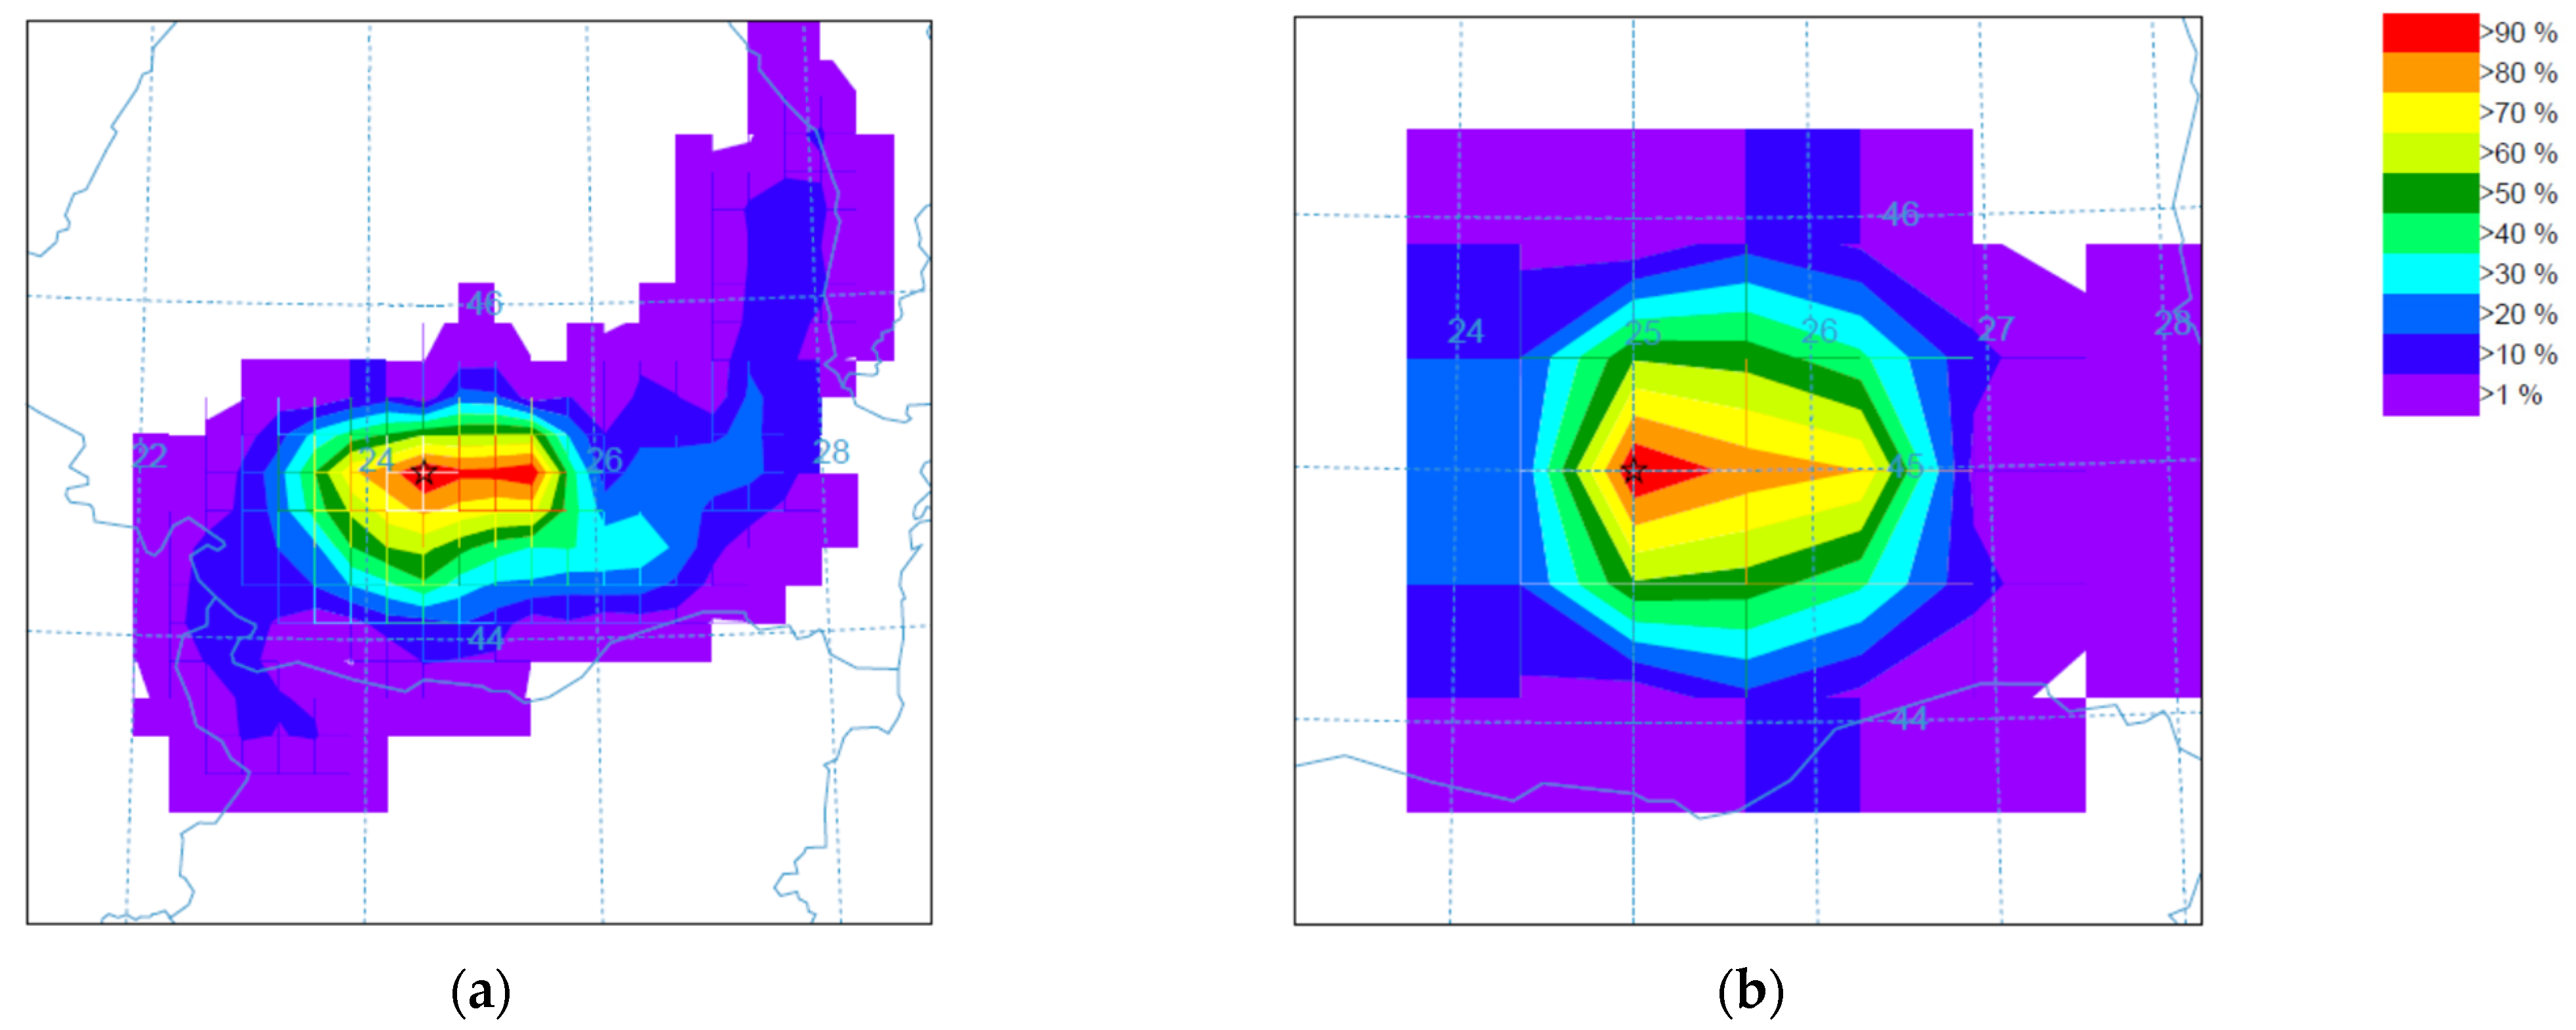
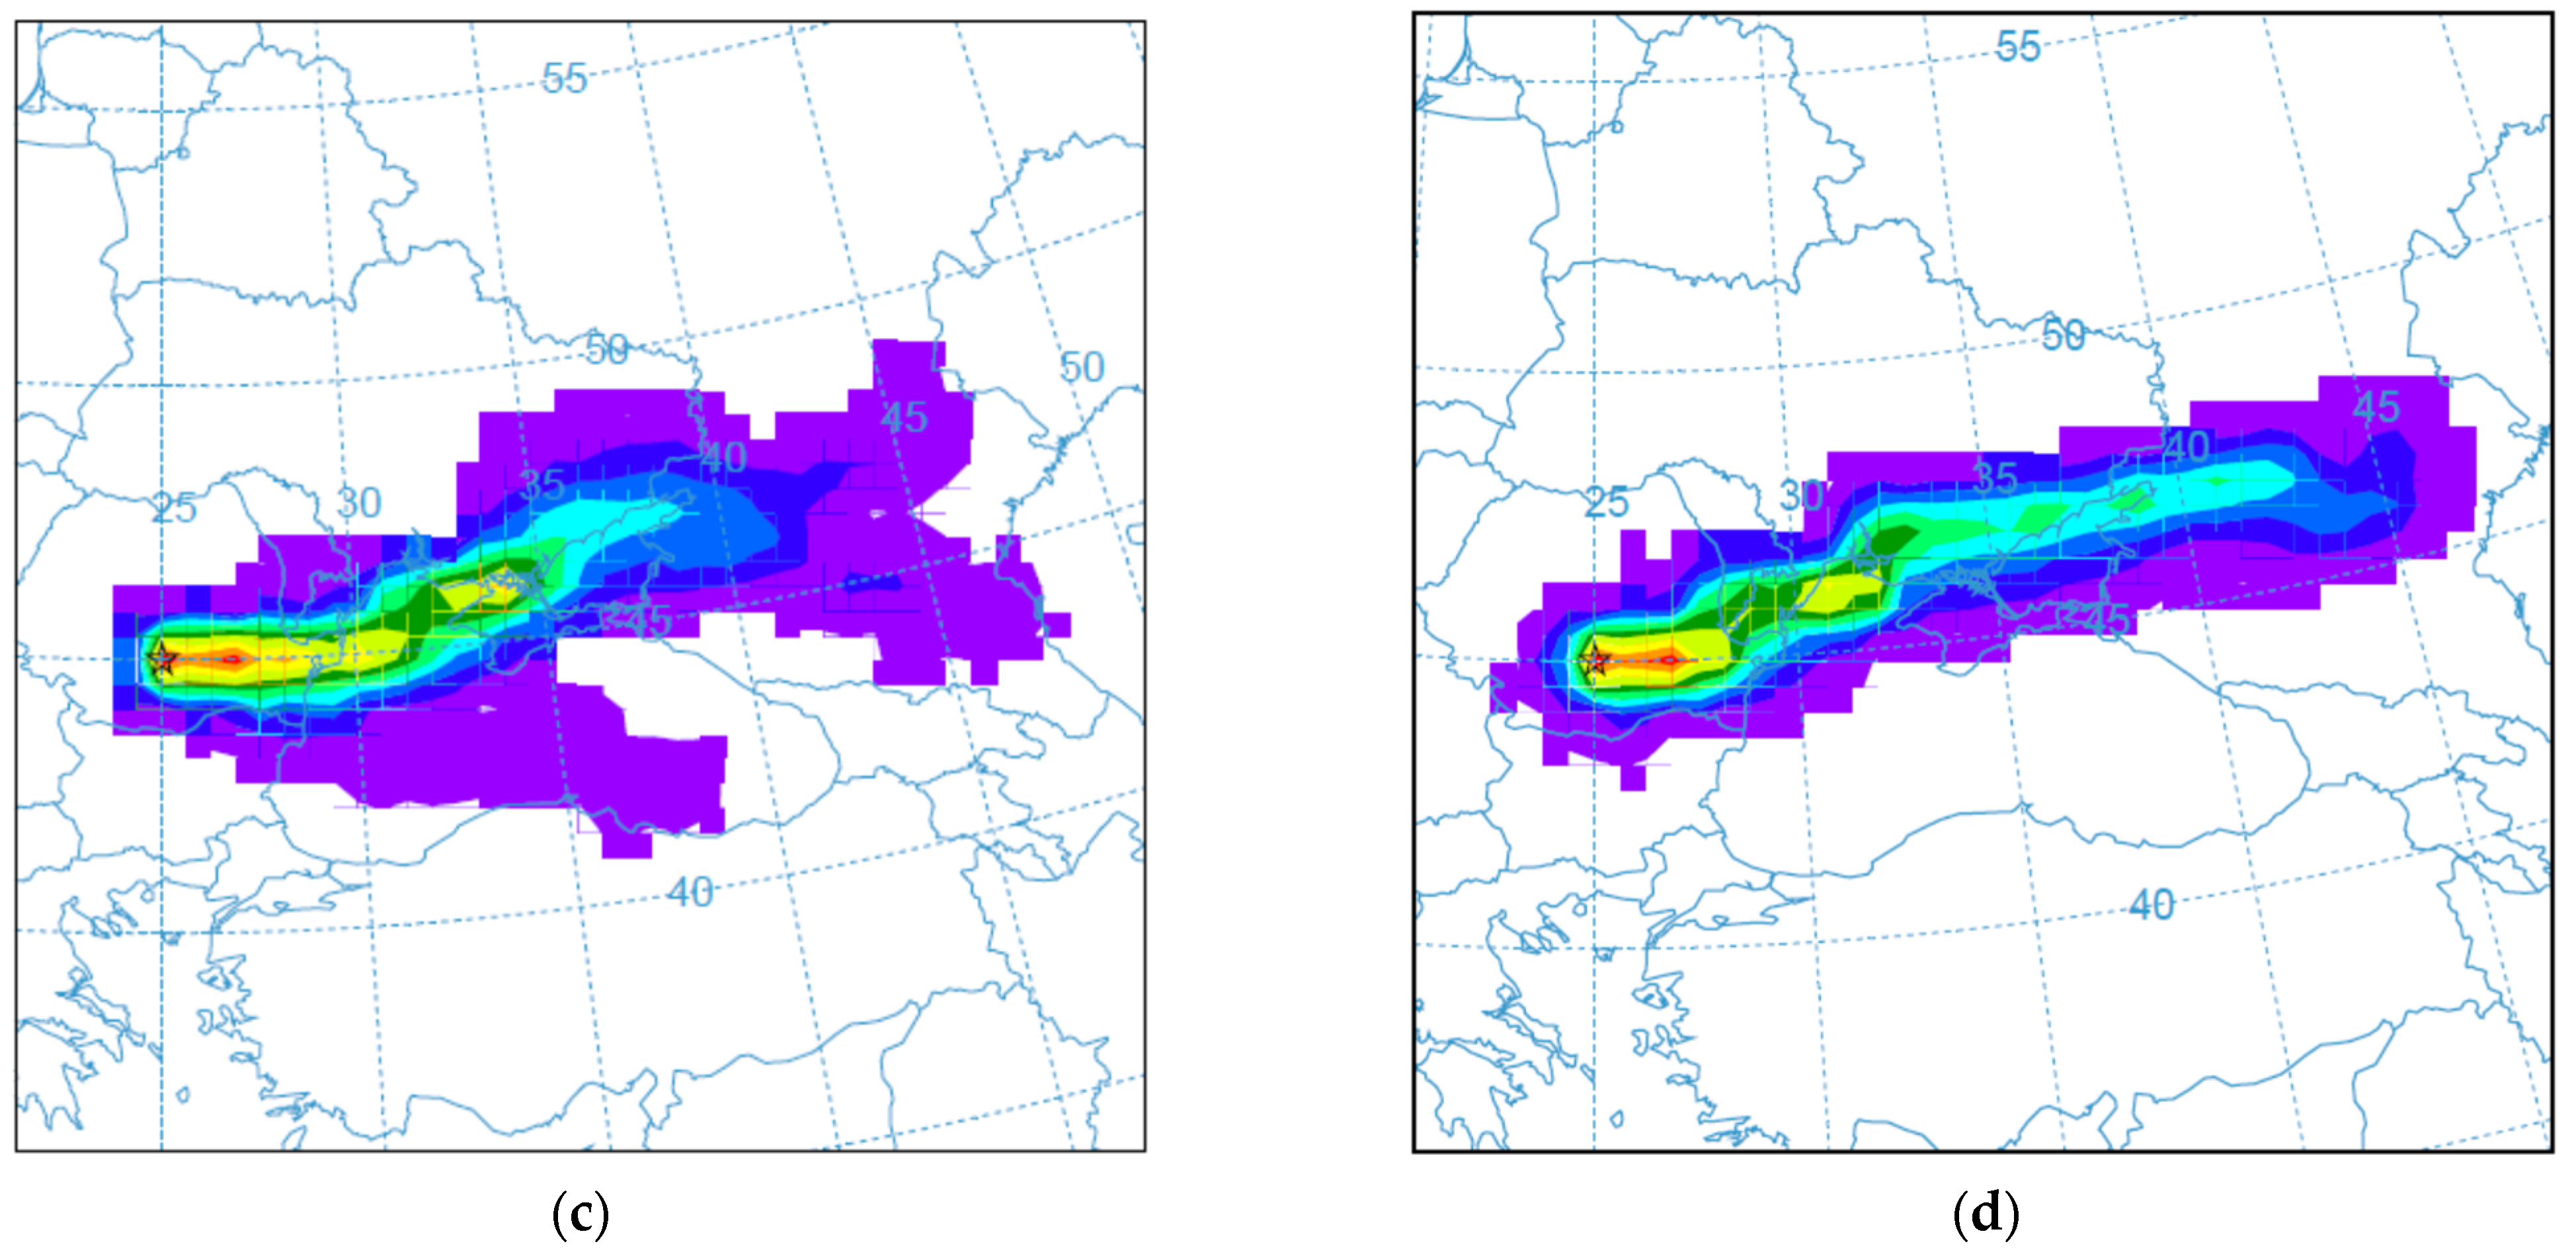
Figure 7 provides the link between meteorology and the influence of local emissions during the four periods associated with the rainfall events occurring between October and November 2019. All the trajectories had either local stability or eastern directions. The bands associated with percentages higher than 70% were located mostly around the monitored city and surrounding areas.
4. Discussion
Anthropogenic activities may result in an excess of nitrogen in rainwater, which can modify the balance in some fragile ecosystems [
25]. Consequently, the monitoring of rainwater for nutrients and other elements is important, especially inside or near industrialized cities, in correlation with air quality surveillance. The results obtained during the screening period showed a relative constancy regarding the concentration of dissolved nitrates and ammonia in the analyzed rainwater collected from the rainfall events. Compared to [
20] that reported nitrogen concentration and deposition in the South Texas Coastal Bend Area, the concentrations of dissolved nitrates and dissolved ammonia showed similar values in some cases, and the reported averages were higher for nitrates (0.15 mg L
−1) and almost equal for ammonia (0.19 mg L
−1). The predominant pH was more acidic compared to Targoviste city conditions. The higher concentrations of nitrates can be related to the specific coastal weather conditions with more active air circulation. In Israel [
26], almost 60 years ago, rainwater contained between 4 and 22 mg L
−1 ammonia with no correlation with other climatic factors. The main sources were considered the release from the soil due to biological activity during the decomposition of organic matter and losses from the soil fertilization. Regarding nitrates, the study reported fewer variable concentrations (0.042 ± 0.012 e.p.m.). It was estimated that the mean annual deposition of ammonia is 40 g ha
−1 for each millimeter of precipitation. The estimations from the current study suggest a lower value of approximately 5 g ha
−1 mm
−1. In [
20], the monthly rainfall nitrogen deposition was significantly variable, ranging from 0 to 0.72 pounds per acre (~0.8 kg ha
−1), with greater deposition according to the greater amount of precipitation. The potential sources of nitrogen in the rainwater collected in Targoviste can be from burning fossil fuels and the soils (both biological processes and fertilization especially since the city is located in a piedmont plain with intensive agriculture). Furthermore, vehicle emissions, and burning coal and natural gas are considered major sources of nitrate, being a constituent of PM [
27]. Particulate nitrate concentrations resulting from NO
x emissions are higher in cooler weather. Some possible indirect processes involving sulfate and nitrate in PM may affect health-related endpoints, including interactions with certain metal species and a linkage with the production of secondary organic matter [
28].
PM
2.5 in Targoviste city during the monitoring period showed increased concentrations in October, April, and September 2019, with little difference between the three monitoring points. The same trend in PM dynamics was provided by the air quality station from the national monitoring network located in the south of the city by measuring PM
10 (79 μg m
−3 in October, 49 in April, and 48 μg m
−3 in September) [
29]. Previous studies in the area showed that the PM
2.5 multiannual average of measured concentrations ranged between 4.6 and 22.5 μg m
−3, and the maximum concentrations ranged between 13.1 and 102 μg m
−3, depending on the sampling point and pollution episode [
24]. The average PM
2.5 concentration for the monitored period (April–November 2019) was 21.9 µg m
−3 considering only the days before a rainfall event. After the rain, the PM concentrations dropped out considerably (see
Supplementary Materials for an example of the daily time series of various PM fractions monitored by Casella Guardian 2 after a rainfall event).
Several metals were found in PM, i.e., Fe (3.1–5.8 ng m
−3), Pb (0.8–2.8 ng m
−3), Ni (0.5–1.16 ng m
−3), Cd (0.01–0.25 ng m
−3), and Cr (0.01–0.09 ng m
−3), which may be considered the “signature” of the industrial metallurgical operations in the area [
24]. In this study, the content of heavy metals in PM was determined before each rainfall event using a single disk, and consequently, the results may be considered indicative. Pb ranged from 0.11 to 2.09 ng m
−3, while the concentrations of other harmful metals were Ni (0.32–0.89 ng m
−3), Cd (0.011–0.025 ng m
−3), and Cr (0.03–0.1 ng m
−3). The presence of V in PM was new compared to the previous reports, as it was found in all the samples with concentrations ranging from 0.02 to 3.01 ng m
−3.
In 2019, the local EPA determined Pb (19 ng m
−3), Cd (0.51 ng m
−3), Ni (0.89 ng m
−3), and As (0.67 ng m
−3) in PM
10 fraction [
29]. It can be noticed that the presence of heavy metals is almost similar despite the difference in tested PM fractions. Their levels seemed to maintain throughout the years in Targoviste city.
During the monitoring period, the collected rainwater contained several elements, including various heavy metals, metalloids, Ca, and P. Antecedent dry period and rainfall characteristics are factors that influence the characteristics of wet and dry deposition of solids and heavy metals. In [
21], Zn was correlated with traffic volume, whereas Pb, Cd, Ni, and Cu were correlated with traffic congestion. It was suggested that reducing traffic congestion will be more effective than reducing traffic volume for improving air quality considering Pb, Cd, Ni, and Cu. Zn was found to have the highest atmospheric deposition rate compared to other heavy metals. In the current study, more metals were found in the rainwater, most of them being used in the manufacture of special steel. High variability of the concentrations of elements was observed from one rainfall event to another in October and November.
Regarding the P concentrations in rainwater, in [
30], it ranged from 0.05 to 4.5 μmol L
−1. In the current study, P had an average of 4.33 µg L
−1. Anthropogenic emissions are sources of soluble P, and a significant part of these emissions could originate from incinerators and/or biomass burning, which is a common practice in the villages that surround Targoviste city.
In Beijing, sulfur was the primary inorganic element detected in PM, and the average EMC of twelve rainfall events was 8.92 mg L
−1. The EMC of ammonia-N, nitrate-N, and phosphorus after significant PM2.5 pollution was 11.57 mg L
−1, 1.72 mg L
−1, and 0.019 mg L
−1, respectively [
31]. In the same study, the largest heavy metal load of 3.11 mg m
−2 was attributed to Zn, but other harmful heavy metals were determined in high concentrations as well. Wind directions have a complex effect, with higher PM concentrations at low and high wind than moderate winds. Furthermore, the PM
2.5/PM
10 ratio was found to be proportional to the mean relative humidity [
32].
The correlation matrix showed several significant associations between the harmful heavy metal concentrations from rainwater and PM, i.e., Cr, Ni, Pb, and V. Cd concentration from the rainwater did not reach the statistical significance with the one in PM but was correlated with V from rainwater and PM. It was noticed that negative correlations were present between rainfall and heavy metals, but only Cr from rainwater and Cd from PM associations showed statistical significance. Corroborated with the rotated component matrix from FA analysis, one possibility could be that Cd, Pb, and V originated mostly from local industrial emissions, including a pigment factory. Cr and Ni concentrations could also result from the contribution from sources located in the eastern direction, as shown by the backward trajectory model [
33]. On this trajectory, there are other major industrial cities, such as Ploiesti (petroleum processing and chemical industries) [
1] and Galati (big metallurgical facilities). Regional transport can significantly affect the concentrations of air pollutants, particularly ozone. The wind effect was demonstrated to be largely associated with regional transport [
34].
The study had some limitations related to the relatively short period of monitoring, which cannot substantiate the seasonal pattern and the multiannual variability of rainwater characteristics. Source apportionment was not performed for deriving information about the contribution of pollution sources and the amount they contribute to ambient air pollution levels in the area and the pollutant load in rainwater.
Future work will address these limitations and will involve dispersion modeling from multiple sources together with a better assessment of the dry and wet deposition [
35,
36].


 ,
, 


