Article

Multi-Criteria Performance Evaluation of Gridded Precipitation and Temperature Products in Data-Sparse Regions

by
Ibrahim Mohammed Lawal
1,2,*,
Douglas Bertram
1,
Christopher John White
1,
Ahmad Hussaini Jagaba
2,3,
Ibrahim Hassan
2 and
Abdulrahman Shuaibu
1,4
1
Department of Civil and Environmental Engineering, University of Strathclyde, Glasgow G1 1XJ, UK
2
Department of Civil Engineering, Abubakar Tafawa Balewa University, Bauchi 740272, Nigeria
3
Department of Civil and Environmental Engineering, Universiti Teknologi PETRONAS, Bandar, Seri Iskandar 32610, Malaysia
4
Department of Water Resources and Environmental Engineering, Ahmadu Bello University, Zaria 810107, Nigeria
*
Author to whom correspondence should be addressed.
Submission received: 14 October 2021 / Revised: 24 November 2021 / Accepted: 25 November 2021 / Published: 29 November 2021
(This article belongs to the Section Climatology)

Abstract

:
Inadequate climate data stations often make hydrological modelling a rather challenging task in data-sparse regions. Gridded climate data can be used as an alternative; however, their accuracy in replicating the climatology of the region of interest with low levels of uncertainty is important to water resource planning. This study utilised several performance metrics and multi-criteria decision making to assess the performance of the widely used gridded precipitation and temperature data against quality-controlled observed station records in the Lake Chad basin. The study’s findings reveal that the products differ in their quality across the selected performance metrics, although they are especially promising with regards to temperature. However, there are some inherent weaknesses in replicating the observed station data. Princeton University Global Meteorological Forcing precipitation showed the worst performance, with Kling–Gupta efficiency of 0.13–0.50, a mean modified index of agreement of 0.68, and a similarity coefficient SU = 0.365, relative to other products with satisfactory performance across all stations. There were varying degrees of mismatch in unidirectional precipitation and temperature trends, although they were satisfactory in replicating the hydro-climatic information with a low level of uncertainty. Assessment based on multi-criteria decision making revealed that the Climate Research Unit, Global Precipitation Climatology Centre, and Climate Prediction Centre precipitation data and the Climate Research Unit and Princeton University Global Meteorological Forcing temperature data exhibit better performance in terms of similarity, and are recommended for application in hydrological impact studies—especially in the quantification of projected climate hazards and vulnerabilities for better water policy decision making in the Lake Chad basin.

1. Introduction

Accurate climate data are critical to the success of modelling processes in order to reduce uncertainty and achieve better prediction in hydrological impact studies. Unfortunately, reliable and long-term observed meteorological datasets are sparse and unavailable in some regions—especially sub-Saharan Africa and the Mediterranean—making hydrological studies a challenging task [1,2].
Alternatively, high-resolution gridded data have been developed to address these shortcomings; however, an understanding of their limitations in terms of observational uncertainties and reliability is important in order to address the twin issues of choice of dataset and suitability to represent basin features.
Some climate data products are more appropriate than others in their applications for climate change impact studies across different regions; therefore, careful and adequate assessment of their strengths and limitations is required in order to provide guidance for future climate and hydrological studies—especially in data-sparse basins. An accurate hydro-climatic impact study requires climate data at high temporal and spatial resolutions. The most accurate measurement devices are rain gauges, and although these are often situated on land and in populated areas for ease of measurement [3], there are a limited number of ground-based rain gauge stations in most parts of the world for effective and efficient hydro-climatic studies with reduced uncertainty in spatial climate prediction. However, weather station records are typically site-specific, while most hydrological studies in environmental sciences research require aerial observations of climate data in order to achieve accurate modelling processes with minimal uncertainty in impact studies [4].
Climate data have been seen to be an important component of hydrologic cycle analysis over time and space. The knowledge and understanding of their spatiotemporal dynamics are essential, and provide useful information for their practical applications in the field of agriculture, aquaculture, water resource and river basin management, and hazard and flood disaster warnings and management [5,6].
Climate and hydrological studies require complete and reliable rainfall and temperature records at good spatial and temporal resolutions [7]. Unfortunately, climate records from various databases contain gaps or missing data points due to systematic errors, which are prevalent in the Mediterranean and sub-Saharan African countries, making hydrological studies difficult [7,8,9]. Several gridded climate data developed by various modelling centres are used as alternatives, owing to their reliability, and are generated from the observed climate station data after quality control, with enhanced reliability analysis and long-term temporal and spatial coverage [10].
In a hydro-climatic studies, the choice of gridded data for the process of bias correction of general circulation models in data-sparse regions indicates an essential procedure for climate change impact assessment studies [11]. However, the choice of reference dataset that is available in either station data, or gridded products derived from observations [12,13], reanalysis data [14,15,16], or remote sensing data [17,18], is critical in the overall uncertainty associated with projected climate change impact studies.
These datasets form the primary input in hydrological modelling studies and climate change impact studies for the accurate assessment of hydrological variables such as streamflow, runoff, soil moisture, evapotranspiration, etc., in order to manage hydropower operations, irrigation scheduling, and early warning systems for landslides and changes in future water availability for climate change and basin hydrological cycle assessment [19].
A study conducted in Africa showed varying degrees of spatial mismatch between observed weather stations and reanalysis data [20]. The techniques and efforts in the analysis vary based on temporal coverage, climate variables involved, and the region of interest [21]. However, gridded and reanalysis data are being updated due to advances in the understanding of climate science over time, and detailed evaluation of their performance at the catchment scale in Africa is rarely found in literature, although this may be attributed to limited availability of reliable long-term climate records, expertise, and ease of access to data [22,23].
Studies have shown that high-resolution gridded data have been developed to provide valuable information on disaster management, initialisation and validation of numerical models, and resolving the diurnal global cycle of precipitation [24,25]. There are many gridded data products available at different timescales (hourly, daily, and monthly) with a finer resolution of 0.5° × 0.5°, which can provide insight that relates (but is not limited) to a model forecast of hydrological cycles, climate change trend analysis, climate downscaling, etc. [13,26,27,28,29,30,31,32,33,34].
The downside in the use of gridded and reanalysis climate data lies in the fact that gridded climate data are a combination of observed station data and quality-controlled statistical interpolation that could result in the attenuation of local climate signals, while reanalysis data are model-based forecasts that require parameterisation of the model, good assimilation technique, and high-quality observation [21,35,36].
Gridded climate products are known to differ in their source, spatial and temporal resolutions, domain size (global coverage), and available timescales, and also exhibit different error bands due to interpolation procedures and considerable differences in general climatology, which are well known and acknowledged [12,37,38,39]. The choice and selection of reference datasets at the catchment scale should be based on observational uncertainty and purpose via critical analysis of the gridded data products. The development and application of gridded climate data is growing rapidly, especially due to the advances in knowledge of their spatiotemporal resolution, latency, and reliability. However, the uncertainty associated with their application across local and regional catchments is still a cause for concern, and has led to some studies related to the ability of the gridded data to replicate or mimic reliable but sparse ground-based data across the globe [40,41,42,43,44,45,46,47].
Furthermore, the performance of the gridded data is predicated on using individual or combined statistical metrics to replicate some particular characteristics of the observed data, and often exhibits contradictory results, making the decision making difficult [6,48,49]. It has been posited that some gridded data have proven to be appropriate compared to others in specific applications and in certain regions around the world [50], and a single statistical metric cannot justify the performance or suitability of a particular gridded dataset. Therefore, it is important to use various metrics to obtain an ideal solution, based on optimal performance across all metrics, especially in data-sparse regions—for prediction efficiency [49,51].
The objective of this study was to employ multi-criteria decision making to assess the performance of five widely used and recently updated gridded precipitation datasets and four temperature datasets in replicating the total and average monthly precipitation and temperature of available gauge-based records in the Lake Chad hydrological basin. This study was necessary to provide guidance on the choice of reference dataset(s) to be adopted for future research in the basin, depending on performance and purpose in hydro-climatic studies, in order to reduce uncertainty in predictions as well as computational time and resource costs.
Furthermore, the choice of the gridded dataset(s) in previous climate studies found in the literature on the Lake Chad basin, for example [52,53,54,55], has been based on their popularity and usage in other basins, without a proper justification of their suitability compared to other available products for improving the reliability of predictions and reducing model biases to provide an accurate representation of basin-scale hydrological features. Additionally, some of the products are only available in monthly time steps, which may not be suitable for downscaling of GCMs with daily time steps as input requirements in some hydrological models and climate change impact studies.
This study employs entropy-based symmetric uncertainty (SU) [56]—a machine learning approach that has been found to be an efficient tool for the assessment of agreement in data that measure the shapes and patterns of data sequences via the concept of mutual information theory, by comparing the similarity between two long time-series climate datasets, and has found its application in various fields [10,57]. The benefit of this method is that it does not depend on the data distribution, unlike the statistical metrics used in other studies [32,40,
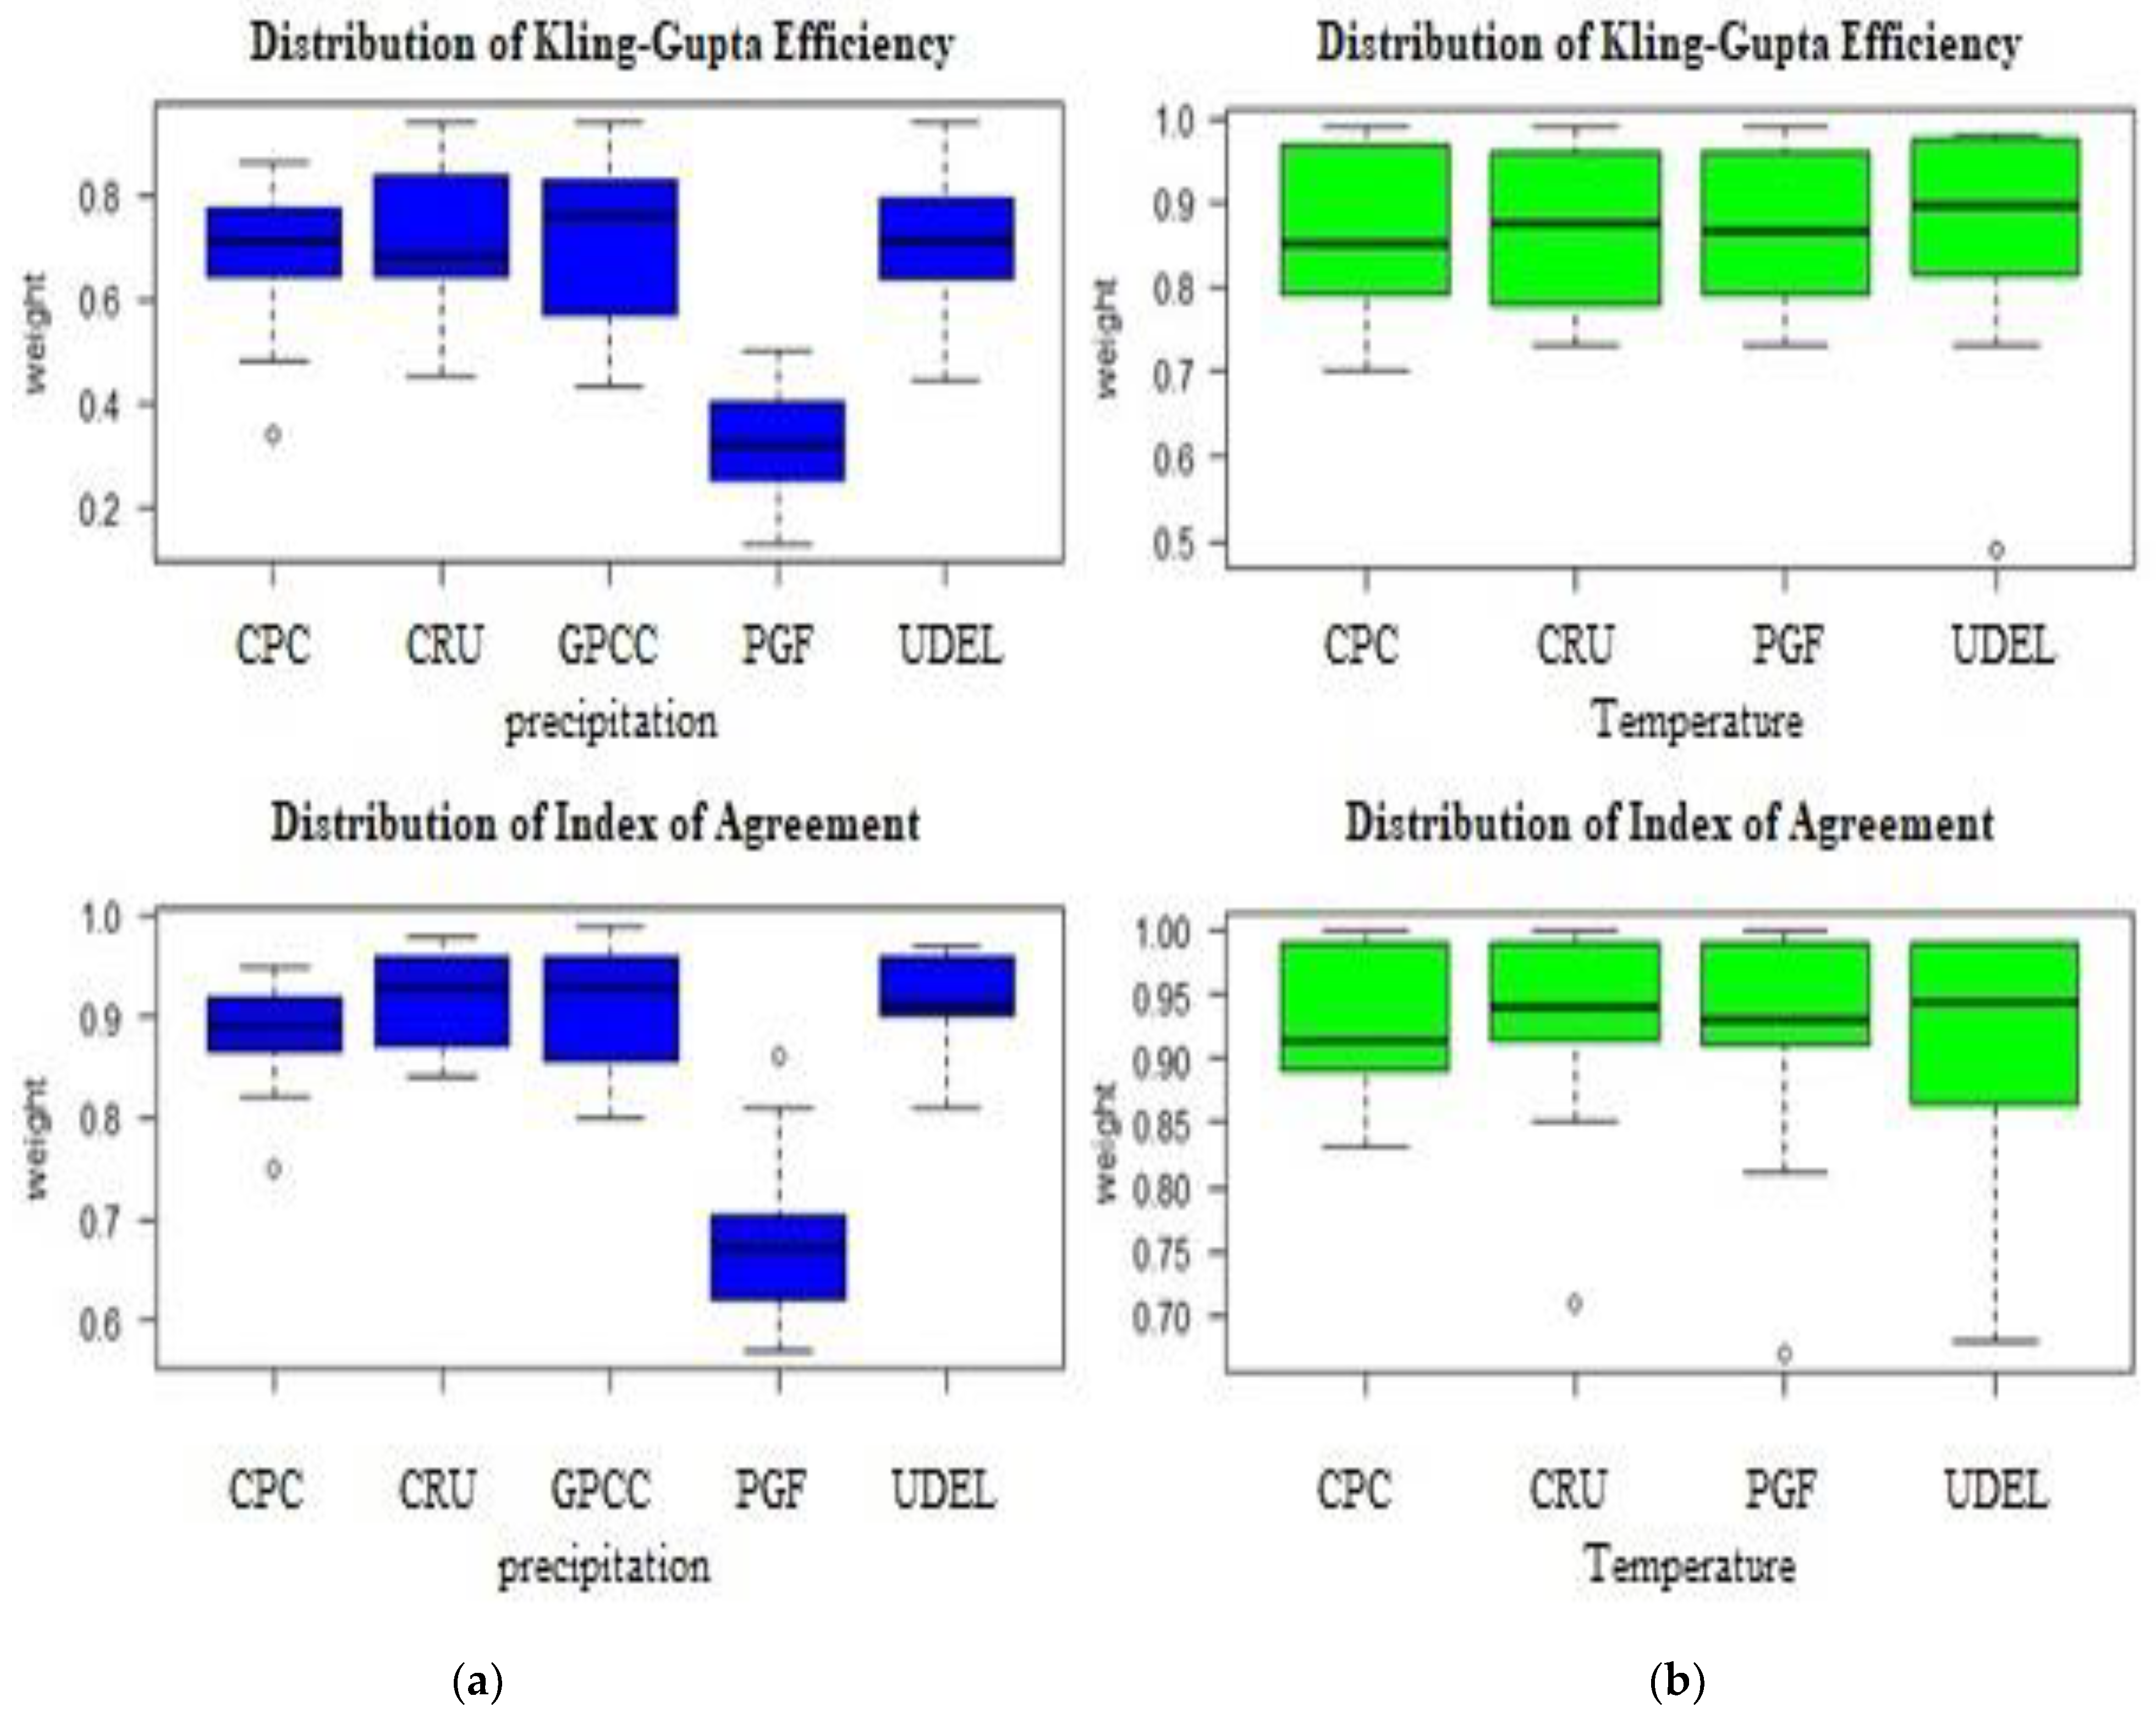
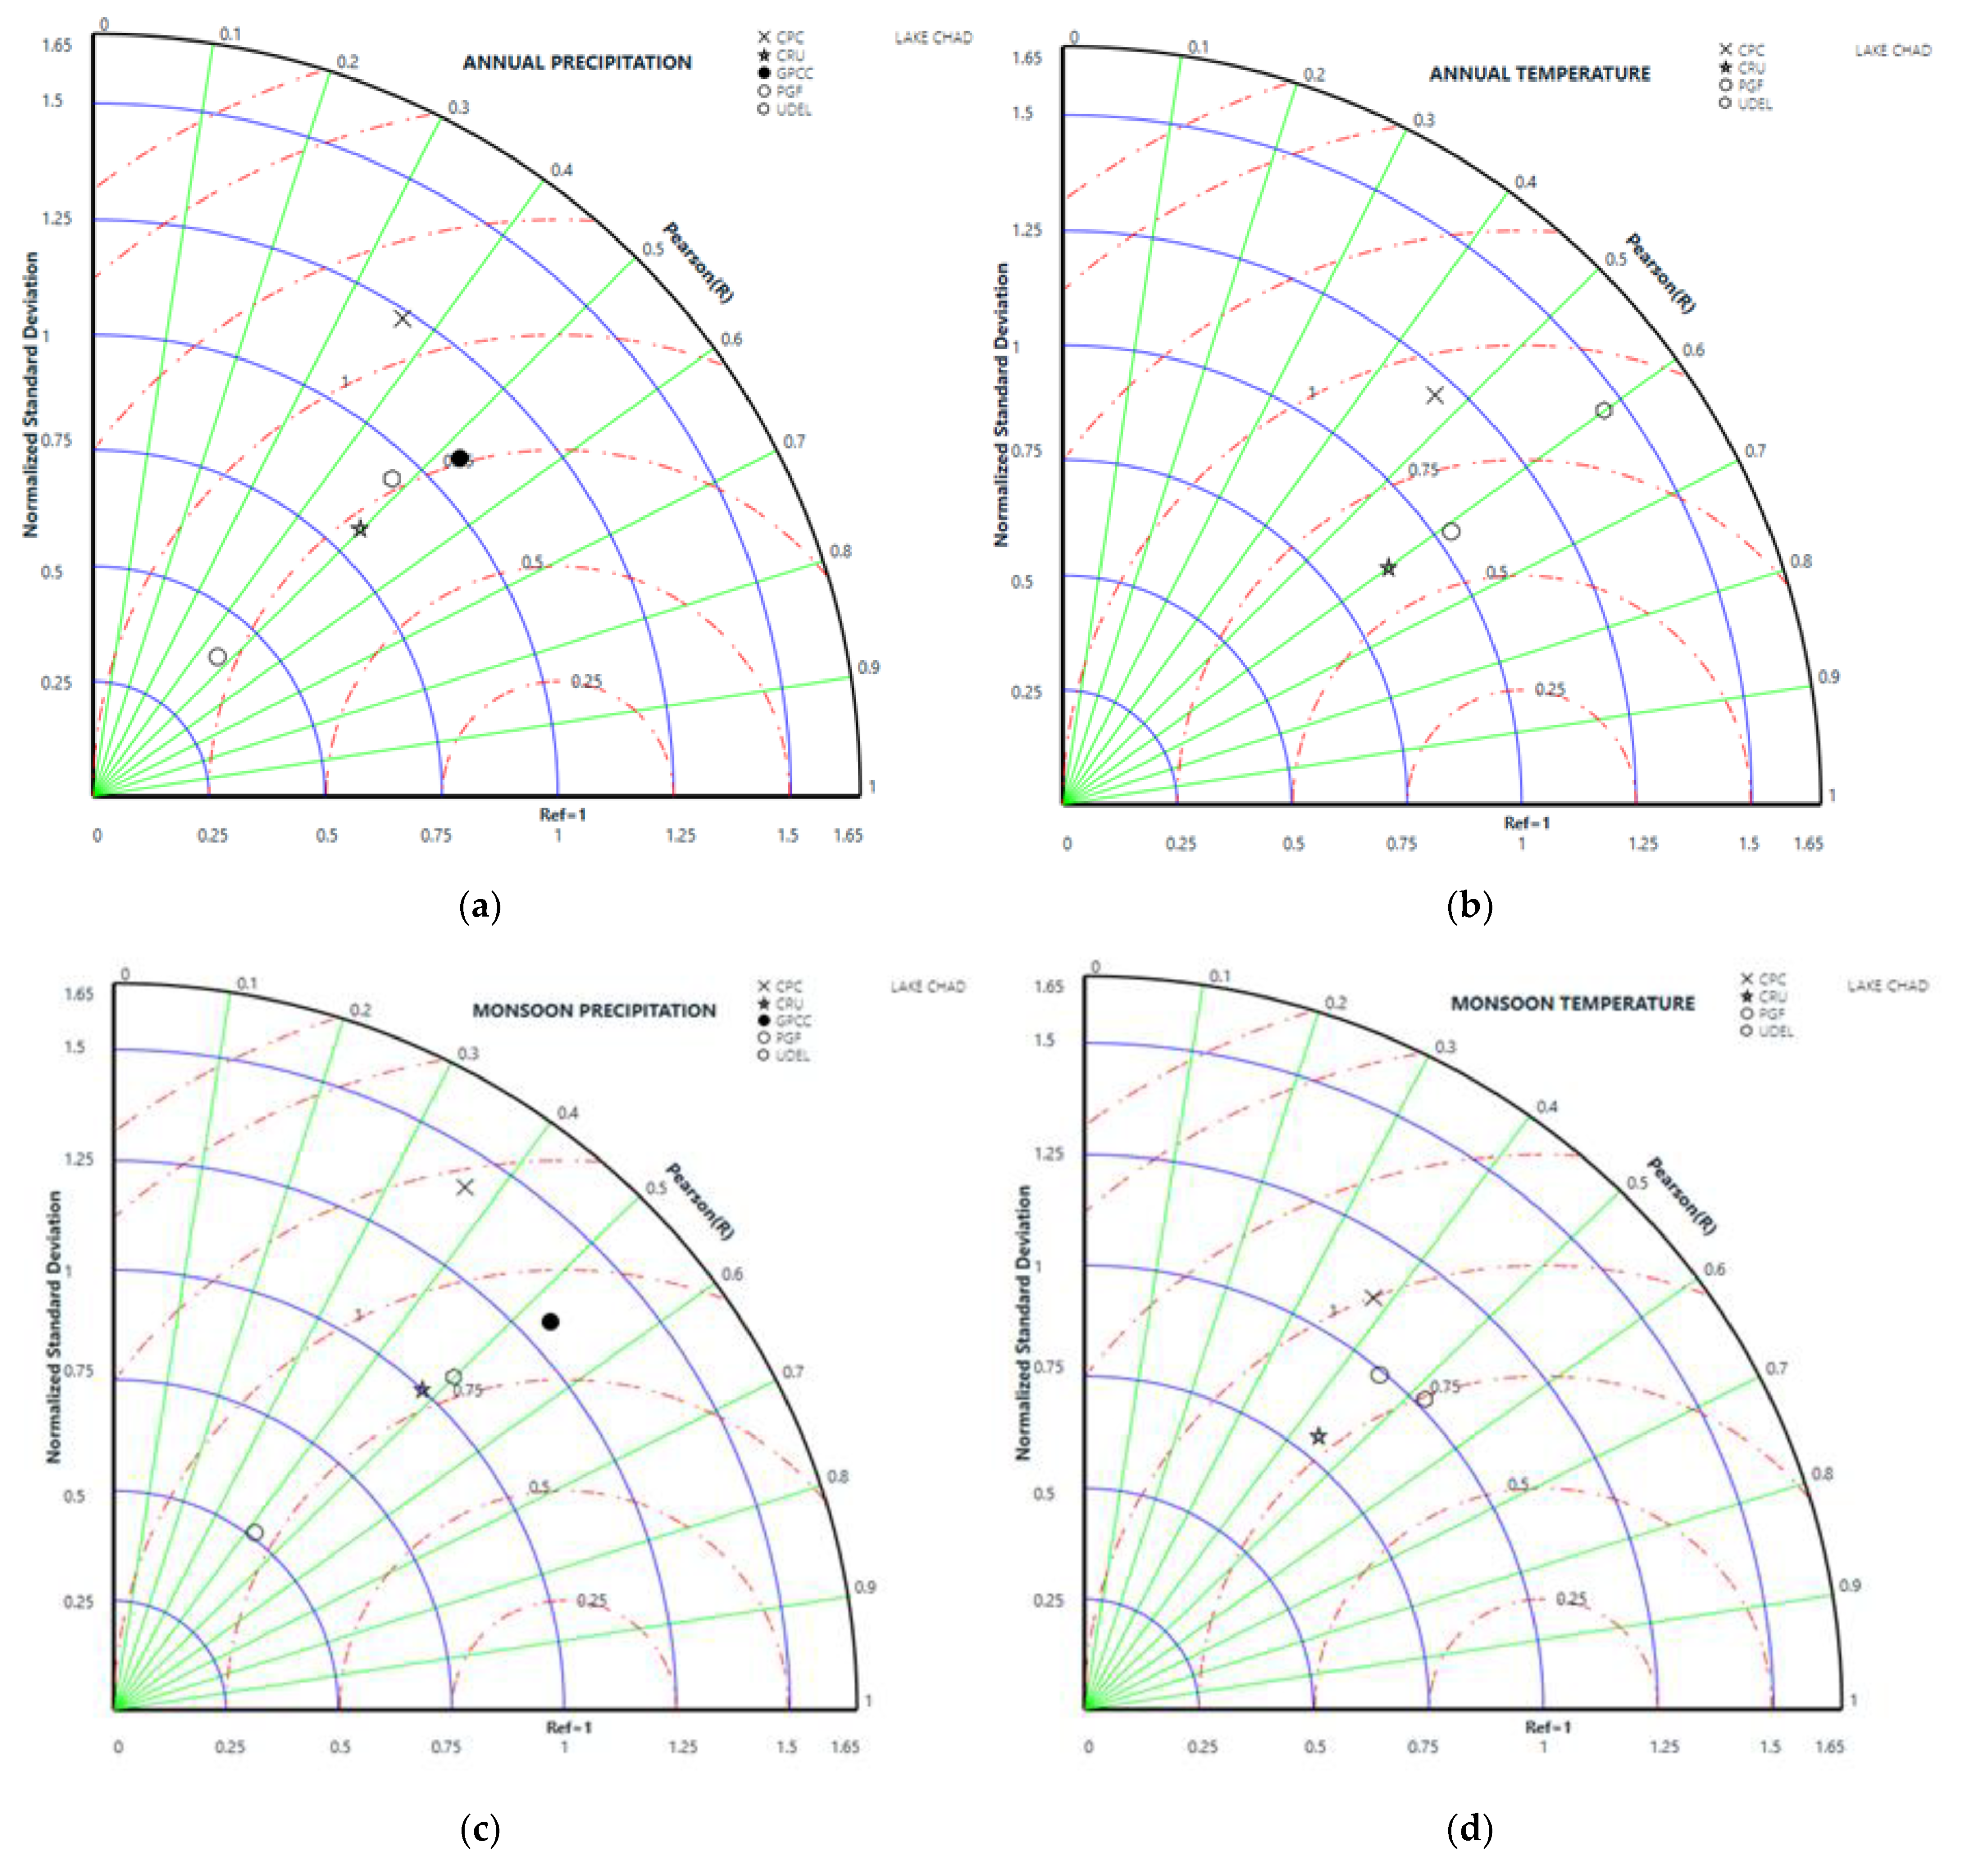
57]. Four statistical metrics were used in this study—namely, Taylor diagrams, modified index of agreement (md), Kling–Gupta efficiency (KGE), and normalised root-mean-square error (NRMSE)—and then finally trend analysis of the precipitation and temperature data at the annual and seasonal scales of the gridded and observed station records was compared for mean variability and temporal homogeneity across the basin.

2. Study Area and Data

2.1. Study Area

The Lake Chad basin is one of the largest endorheic basins in the world, and occupies an estimated area of ~2,500,000 km2—approximately 8% of Africa [58,59]. The basin cuts across the entirety or part of Algeria, Cameroon, the Central African Republic, Chad, Libya, Niger, Nigeria, and Sudan in Central Africa. The basin is geographically located at latitudes of 5.2°–25.3° N and longitudes of 6.9°–24.5° E, right at the transition zone of the Sahara region and the tropics of the Sudano-Sahelian region of West Africa [60], (Figure 1).
The basin is characterised by a vast and shallow freshwater lake located at its centre, with inflows from Chari and Logone rivers (~90–95%) into the southern pool, the Yobe and Komadugu rivers (~2.5–5%) in the western region, which enters the lake through the northern pool [61,62,63], and other minor rivers such as the Gubio, Ngadda, Yedseram, and El Beid, which supplied only ~1–2% inflow to the lake through the southwestern part of the basin between 1961 and 2013 [64]. The basin serves as the main source of fresh water that supports livelihoods across pastoral land, agricultural land, and fish farming [65], with irrigation agriculture as the major user of the resource that supports a majority (~60%) of the population [66].
The basin is divided into several climatic zones, namely, the Saharan zone located in the north of the basin; the Sahelo-Saharan zone located in the central part of the basin, which covers the north of Diffa, Niger, and Lake Chad; the Sudano-Sahelian zone, which covers N’Djamena in the Chad Republic and the northern part of Cameroon and Nigeria; and the Sudano-Guinean zone located in the south, which covers the south of Chad and the Central African Republic, with annual precipitation of < 100 mm, 100–400 mm, 400–600 mm, and 600–1500 mm, respectively. The average annual temperature in the basin ranges from 35–40 °C in the northern part of the basin to as low as 26.5 °C in the southern part [52], characterised by hot and dry, wet and dry, and cool weather during March–June, June–October, and November–February, respectively [67].
The basin is located in a region that is characterised as having little relief, no surface outlets, and a spatial extent that is quite sensitive to climatic variability; the elevation of the basin ranges from −330 m to 3446 m (Figure 1). However, according to [68,69], the basin is a relatively flat area with an average slope of <1.3%, except for some local hills, plateaus, and mountains in the southern and northern parts of the basin.

2.2. Observational Data and Sources

The observed climate data used in this study were acquired from a number of sources; for example, 12 average monthly observed temperature datasets were obtained from the Global Historical Climatology Network’s monthly temperature dataset, version 4 (Table 1) (http://www.ncdc.noaa.gov/ghcnm/v4.php, accessed on 2 March 2020 [68], while 11 total monthly observed precipitation datasets were obtained from the Lake Chad Basin Commission, and can be found as supplementary datasets online in [52]. We also used 2 station records from the Nigerian Meteorological Agency (NIMET) and the NOAA Global Historical Climatology Network Daily (GHCN-D) version 3.23 http://www.ncdc.noaa.gov/pub/data/ghcn/daily, accessed on 2 March 2020 (Table 2).
The observed station data considered in this study were carefully selected based on the condition of having fewer missing records and an acceptable temporal span for hydro-climatic analysis in order to achieve effective and reliable predictions. The observed missing climate data records were filled using the multivariate imputation by chained equations (MICE) package, due to its ability to impute continuous two-level data and maintain consistency between imputations while employing passive imputation [70].
The data were checked for 100% completeness after imputation and assessed for comparison using a double-mass curve approach for subjective evaluation of heterogeneity in the datasets [71], and finally subjected to absolute homogeneity tests—namely, the standard normal homogeneity test (SNHT), Pettitt test, and Von Neumann ratio test [72,73].
The double-mass curve showed an almost straight line at all stations without breakpoints (Figure 2a,b), and absolute homogeneity test results were all less than the critical values. The null hypothesis of all of the station data—that the climate data were homogenous at a 95% level of confidence—cannot be rejected; therefore, the quality-controlled data for precipitation and temperature are suitable for performance evaluation of the gridded climate data.

2.3. Gridded Data and Sources

This study analysed five gridded precipitation and four temperature datasets, from the University of East Anglia, Climate Research Unit CRU TS V4.04, German Weather Service, Global Precipitation Climatology Centre (GPCC) v.2018 (precipitation only), US Climate Prediction Centre (CPC), Princeton University Global Meteorological Forcing (PGF) v.2, and University of Delaware (UDEL) V5.01. Table 3 summarises the climatic variables, temporal and spatial resolution, temporal span, and sources of the gridded data.
The gridded datasets were developed from different modelling centres using different interpolation techniques; for example, CPC gridded data were developed via optimal interpolation of station- or gauge-based records of GTS [25]; CRU data were developed via angular distance weighting of monthly observed station data from the World Meteorological Organization, National Oceanic and Atmospheric Administration (NOAA) database, and climate records from national meteorological agencies across the globe [75]; the PGF dataset was developed based on findings from NCEP–NCAR reanalysis and other global data via bilinear interpolation from their native gridded scale [76]; GPCC datasets were developed by the combination of monthly gauged and quality-controlled records from 7000 stations around the world, along with GTS synoptic weather reports, and interpolated to regular grids using an ordinary point Kriging method [13], while UDEL precipitation and temperature data were interpolated using shepherd algorithms for grid-based data from various sources—such as GHCN2, NCAR, GHCN-D, GHCN-monthly version 3, and records from national meteorological agencies [77,78].

3. Research Methodology

The performance of the gauge-based gridded precipitation and temperature data was evaluated by multiple approaches—including machine learning, filter-based symmetric uncertainty, statistical metrics (modified index of agreement, Kling–Gupta efficiency, normalised root-mean-square error, and Taylor diagrams), and time-series analysis of trends exhibited at annual and seasonal timescales—to assess the gridded data in terms of their reliability in mimicking the observed data across all of the stations in the study area for the period 1979–2012. The gridded datasets were sourced from the websites of the providers, as shown in Table 3, extracted using the raster and ncdf4 R packages, and interpolated to the observed data station resolution using the inverse distance weighting method. The detailed methodology of the study is outlined below.

3.1. Symmetric Uncertainty

Symmetric uncertainty is an entropy-based machine learning algorithm (filter method) used in assessing the pairwise agreement between long time-series data. This method utilises information entropy via the concept of mutual information (MI), which measures the commonality between two variables. For example, if p ( x ) and p ( y ) are considered probability density functions of the observed variable ( x ) and the gridded variable ( y ) , and p ( x , y ) represents the mutual probability distribution functions of x   and y , then mutual information can be evaluated as follows:
M I ( x , y ) = p ( x , y )   log p ( x , y ) p ( x ) · p ( y )
The mutual information shown in Equation (1) can also be evaluated as the difference between the mutual entropy of two time-series variables, and in this case, taking the observed data as H ( x ) , the gridded data as H ( y ) , and the mutual entropy of the observed and gridded data time series as H ( y , x ) , MI can be written as:
M I ( x , y ) = H ( y ) H ( x , y )
Thus, H ( y ) and H ( y , x ) indicate the amount of uncertainty inherent in the gridded data, and join the gridded and observed probability density functions of the precipitation and temperature time series data. The two independent variables in Equation (2) can be expressed as:
H ( x , y ) = i = 1 n p ( x , y ) log p ( x , y ) p ( x ) × p ( y )
H ( y ) = p ( y ) log ( p ( y ) ) d x
The entropy estimated in Equation (3) implies the extent of mutual information between the gridded and observed precipitation/temperature data. The mutual information tends to be zero in the absence of common information, and has a value of unity when the model data series can depict the complete information associated with the observed data series. However, biases are inherent when using time series with larger values if there are less similar values between the two variables [79]; this drawback can be addressed through the concept of SU, by dividing the value of mutual information gain and the sum of the entropies of y and x , as shown in Equation (5):
S U ( x , y ) = 2 × M I ( x , y ) H ( x ) + H ( y )
The value of symmetric uncertainty ranges from 0 to 1, where 0 indicates poor similarity and 1 indicates high similarity between the gridded and observed precipitation/temperature time-series data [80]. This study utilised the FSelector package in R software [81] to assess the similarity between the monthly gridded and observed precipitation/temperature data (Table 4). Figure 3 shows the distribution of gridded precipitation and temperature data of all available stations within the study area.

3.2. Statistical Metrics

In this study, four statistical metrics were used to evaluate the ability of the selected monthly gridded precipitation and temperature datasets to replicate the observed station time series. Further details of the metrics are outlined below.

3.2.1. Kling–Gupta Efficiency

This is a metric that highlights three components—namely, correlation, bias, and ratio of variances between gridded and observed time series data—as proposed in [82]; the value of KGE varies between 0 and 1, which indicate no agreement and perfect agreement between the gridded ( x g) and observed ( x obs) data, respectively. The coefficient can be computed as given in Equation (6):
K G E = 1 ( γ 1 ) 2 + ( 1 μ g μ o b s ) 2 + ( σ g / μ g σ o b s / μ o b s ) 2

3.2.2. Modified Index of Agreement

This is a statistical metric that evaluates the standardised measure of the degree of model prediction error. This metric was modified from its original form proposed in [83], which has shown to be less sensitive to extreme values; it has a value that varies between 0 and 1, indicating no agreement and perfect agreement between the gridded ( x g) and observed ( x obs) data, respectively. The coefficient can be computed as given in Equation (7):
m d = 1 i = 1 n ( x o b s , i x g , i ) i i = 1 n ( x g , i x o b s + x o b s , i x o b s ) i

3.2.3. Normalised Root-Mean-Square Error

This is a statistical metric that facilitates and summarises the magnitude of errors between model ( x g) and observed ( x obs) data with different scales, and is defined by the ratio of root-mean-square error and the standard deviation of the data. This metric is considered to be a great measure of precision, and the predictive ability of the model is considered to be accurate with values closer to zero [84,85]. The value of NRMSE can be computed by the following equation:
N R M S E = [ 1 n i = 1 n ( x g , i x o b s , i ) 2 ] 1 / 2 1 n i = 1 n x g , i

3.2.4. Taylor Diagrams

These are a graphical representation that summarise proximity or similarity between modelled and observed long time-series data. The similarity is quantified based on their correlation, centred root-mean-square difference, and the amplitude of variations (standard deviations). These models are quite useful in gauging the relative performance of models compared to the observed data [86,87].

3.2.5. Trend Analysis

In this study, trend analysis was carried out using the nonparametric Mann–Kendall or modified Mann–Kendall tests [88,89], where significant autocorrelation was observed in the time-series data, trend-free pre-whitening was applied to correct the anomaly [90], and Sen’s slope estimator was used to calculate the statistically significantly increasing or decreasing trends and the magnitude of the trends. The Mann–Kendall statistics are given as:
S = k = 1 n 1 j = k + 1 n sgn ( x j x k )
where x j and x k are sequential data values for n time series. The sgn of the series is defined as:
sgn ( x j x k ) = { 1   i f   x j > x k 0   i f   x j = x k 1   i f   x j < x k
The mean E(S), variance V(S), and the Z statistics can be computed as:
E ( S ) = 0
V ( S ) = 1 18 { n ( n 1 ) ( 2 n + 5 ) i = 1 p t i ( t i 1 ) ( 2 t i + 5 ) }
Z = { S 1 V ( S )   f o r   S > 0 0 f o r   S = 0 S + 1 V ( S )   f o r   S < 0    
In the equation above, p represents the number of tied groups in the series, and each of the tied groups is indicated by t i . All positive and negative values of the Z statistics represent statistically increasing and decreasing trends in the time-series data.
The magnitude of the detected trends in the time-series data was computed by the nonparametric Sen’s slope estimator, because this method is robust against outliers in time-series analysis, as given below:
S S = m e d i a n [ x j x i j i ] f o r   a l l   i < j  
where x i represents the value of the data at time step i , and x j for timestep j .

4. Results

4.1. Assessment of Gridded Data Using Symmetric Uncertainty

The performance of the gridded monthly total precipitation and average temperature data for the period 1979–2012 was individually assessed at each station location after being downloaded at the station resolutions. The SU score obtained at the Zinder stations located at latitude 13.8° N, longitude 8.9° E is given in Table 4. The results from the table show that CRU and PGF were found to have the highest estimated similarity scores of precipitation and temperature across the station. However, there were inconsistencies in the performance of the gridded data at different stations in replicating the observed data. The CRU, GPCC, and PGF datasets showed a better performance at 53.3%, 33.3%, and 13.3%, respectively, while CRU, PGF, and UDEL also showed a better performance, at 41.7%, 33.3, and 25.0% of the precipitation and temperature stations in the study area, respectively.
The observed precipitation stations located in the Sudano-Guinean zone of the basin—for example, Bossangoa, Samry-I, Sategui, Tsanaga, Doha, and Moundou (SU ≥ 0.478)—were shown to have a better similarity coefficient compared to stations located in the Sahelo-Saharan zone, e.g., Nguigni, Zinder (SU ≤ 0.395), etc. However, the temperature stations located in the Saharan and Sahelo-Saharan zones (i.e., Bilma, Maina-Sorda, Nguigni, and Zinder) performed better in simulating the observed temperature (SU ≥ 0.692), while the worst performance in the study area was in the Sudano-Guinean zone (SU ≤ 0.483). The consistency in the precipitation data in the Sudano-Guinean zone may be attributed to the more numerous and accurate station records in the southern zone of the basin, as well as the reduction and abandonment of ground-based gauged data and errors in taking records resulting in systematic errors in the northern part of the basin, due to migration, political instability, etc.
The mean SU of the gridded precipitation across the stations in the basin for the CPC, CRU, GPCC, PGF, and UDEL datasets was 0.448, 0.504, 0.512, 0.472, and 0.480, respectively, while the SU of the gridded temperature for the CPC, CRU, PGF, and UDEL datasets was 0.482, 0.532, 0.523, and 0.519, respectively. These results show that there is a slight variation in performance across the gridded datasets assessed in this study. Figure 3 shows the distribution of the similarity coefficients of the datasets across the stations considered.

4.2. Statistical Metric Efficiency

The results of the statistical metrics of the gridded precipitation and temperature data considered in this study for the period 1979–2012 show that there is a good agreement between the gridded precipitation datasets and the observed data across the stations within the basin, with the mean KGE and md coefficient in the range of ~0.7 and above (Table 5) for the CRU, GPCC, CPC, and UDEL datasets, but not for the PGF data, which performed the worst across the stations, with a mean KGE and md coefficient of 0.33 and 0.68, respectively. The results of NRMSE were consistent with all of the gridded datasets, but had a higher value for the PGF data, with a mean value 1.07. However, the results for the temperature datasets showed a better performance or mean similarity coefficient of all of the gridded data products, with values generally above 0.85 for both KGE and md (Table 6), along with almost similar NRMSE across the stations in the study area.
The results from Table 5 and Table 6 reveal that the CPC, CRU, GPCC, and UDEL gridded precipitation datasets show better performance, by approximately 20%, 20%, 26.7%, and 40%, respectively, in terms of KGE, and 13.3%, 40%, 46.7%, and 46.7%, respectively, in terms of md, in all of the stations. The temperature data showed a better similarity with the observed station data, with CPC, CRU, PGF, and UDEL recording a better performance by 33.3%, 50%, 25%, and 50%, respectively, in terms of KGE, and 33.3%, 75%, 41.7%, and 50%, respectively, in terms of md. The metrics used in this study are presented using boxplots in Figure 4, revealing a consistent variation in their ability to replicate the observed precipitation and temperature data—except for the PGF gridded precipitation data, which may pose a large uncertainty in the prediction of climate variables. This may be due in part to the interpolation technique, source, and quality of the observed data used in its development, covering the entire Lake Chad basin.
The similarity or agreement between the gridded precipitation/temperature datasets and the observed data for the period 1979–2012 at annual, pre-monsoon, and monsoon timescales was evaluated using Taylor diagrams (Figure 5). The results indicate that the polar plots lie in the first quadrant, revealing that all correlation values are positive. The results also reveal a notable variability in normalised standard deviation in the gridded precipitation products in the three timescales. The GPCC and CPC datasets recorded the best performance, with a Pearson’s correlation coefficient greater than 0.5, while PGF had the worst performance due to wider variability and a lower Pearson’s correlation coefficient across the annual and seasonal timescales. However, PGF data showed a better performance in the temperature datasets, with normalised standard deviation (variability) ~1.0 in the annual and monsoon season timescales, as well as a better correlation with the observed data. Although the gridded temperature datasets in general exhibited better performance with low observational uncertainty in replicating the observed data at the annual timescale relatively well compared to the monsoon and pre-monsoon seasons, the differences in their performance were apparent; however, a seemingly similar root-mean-square difference was observed in the precipitation datasets at all timescales.

4.3. Trend Analysis of Gridded Data

The trends of precipitation and temperature were evaluated at the annual and monsoon season timescales for the gridded datasets and observed station records for the period 1979–2012. For the sake of clarity, the performance of the datasets was assessed based on statistically increasing trends, decreasing trends, or no trends—arising due to limited station records—to ease the complexity of analysis. The Z-statistic values (Table 7, Table 8, Table 9 and Table 10) showed the unidirectional trends of precipitation and temperature at the annual and monsoon season timescales, respectively. The results revealed that 20% and 26.7% of the observed station data showed a statistically decreasing trend of precipitation at the annual and monsoon season timescales, respectively, while 8.3% and 33.3% of the observed station data showed a statistically decreasing trend of temperature at the annual and monsoon season timescales, respectively. The stations where the analysis recorded a declining precipitation trend—for example, Maiduguri, Nguigni, and Bongor—were situated in the semi-arid and Sudano zones. Declining temperature trends were observed at Sahr, Moundou, N’Djamena, and Zinder in the Sudano-Sahelian and Guinean zones, while other stations indicated statistically increasing unidirectional trends in the study area, consistent with the findings of [91,92,93]. However, the results revealed a variable degree of mismatch between the gridded and observed station records across the basin; for example, the CPC, CRU, GPCC, PGF, and UDEL data showed 66.67%, 73.33%, 60.0%, 66.67% and 73.33% agreement in unidirectional trends at the annual timescale, and 73.33%, 73.33%, 46.67%, 66.67%, and 66.67% agreement in unidirectional trends in the monsoon season, respectively, against the observed data. The evaluated trends indicated that the CRU and CPC datasets have the ability to replicate the observed station records with a higher degree of agreement compared to other datasets. The temperature datasets showed a higher degree of agreement in unidirectional trends against the station records, with fairly similar results—for example, CRU, PGF and UDEL showed a better performance at the annual (91.67%) and monsoon (66.67%) season timescales. However, the CRU gridded datasets showed strong increasing trends, and a possible tendency to overestimate the temperature of the basin. Therefore, the choice of the dataset adopted for hydro-climatic studies is critical for accurate assessment in order to reduce uncertainty in the prediction of hydrological variables in modelling studies and achieve good policy planning in water resource management.
The results of Sen’s slope estimator for the trend analysis of the annual and monsoon season timescales at a 95% level of confidence revealed that there were mismatches or difficulties with the gridded precipitation and temperature datasets in reproducing a similar magnitude of trends relative to the station records (Figure 6, Figure 7, Figure 8 and Figure 9). For example, the gridded datasets overestimated or underestimated the annual and monsoon season precipitation and temperature in most of the stations. However, the mismatch has been acknowledged as one of the sources of uncertainty in modelling processes—although, in this assessment, the median magnitude of the precipitation trends for CPC (1.200) and GPCC (1.000), and of the temperature trends for CRU (0.0185) and CPC/UDEL (0.0075), proved to be better than that of other datasets relative to the observed station data at the annual and monsoon season timescales across the basin.

5. Discussion

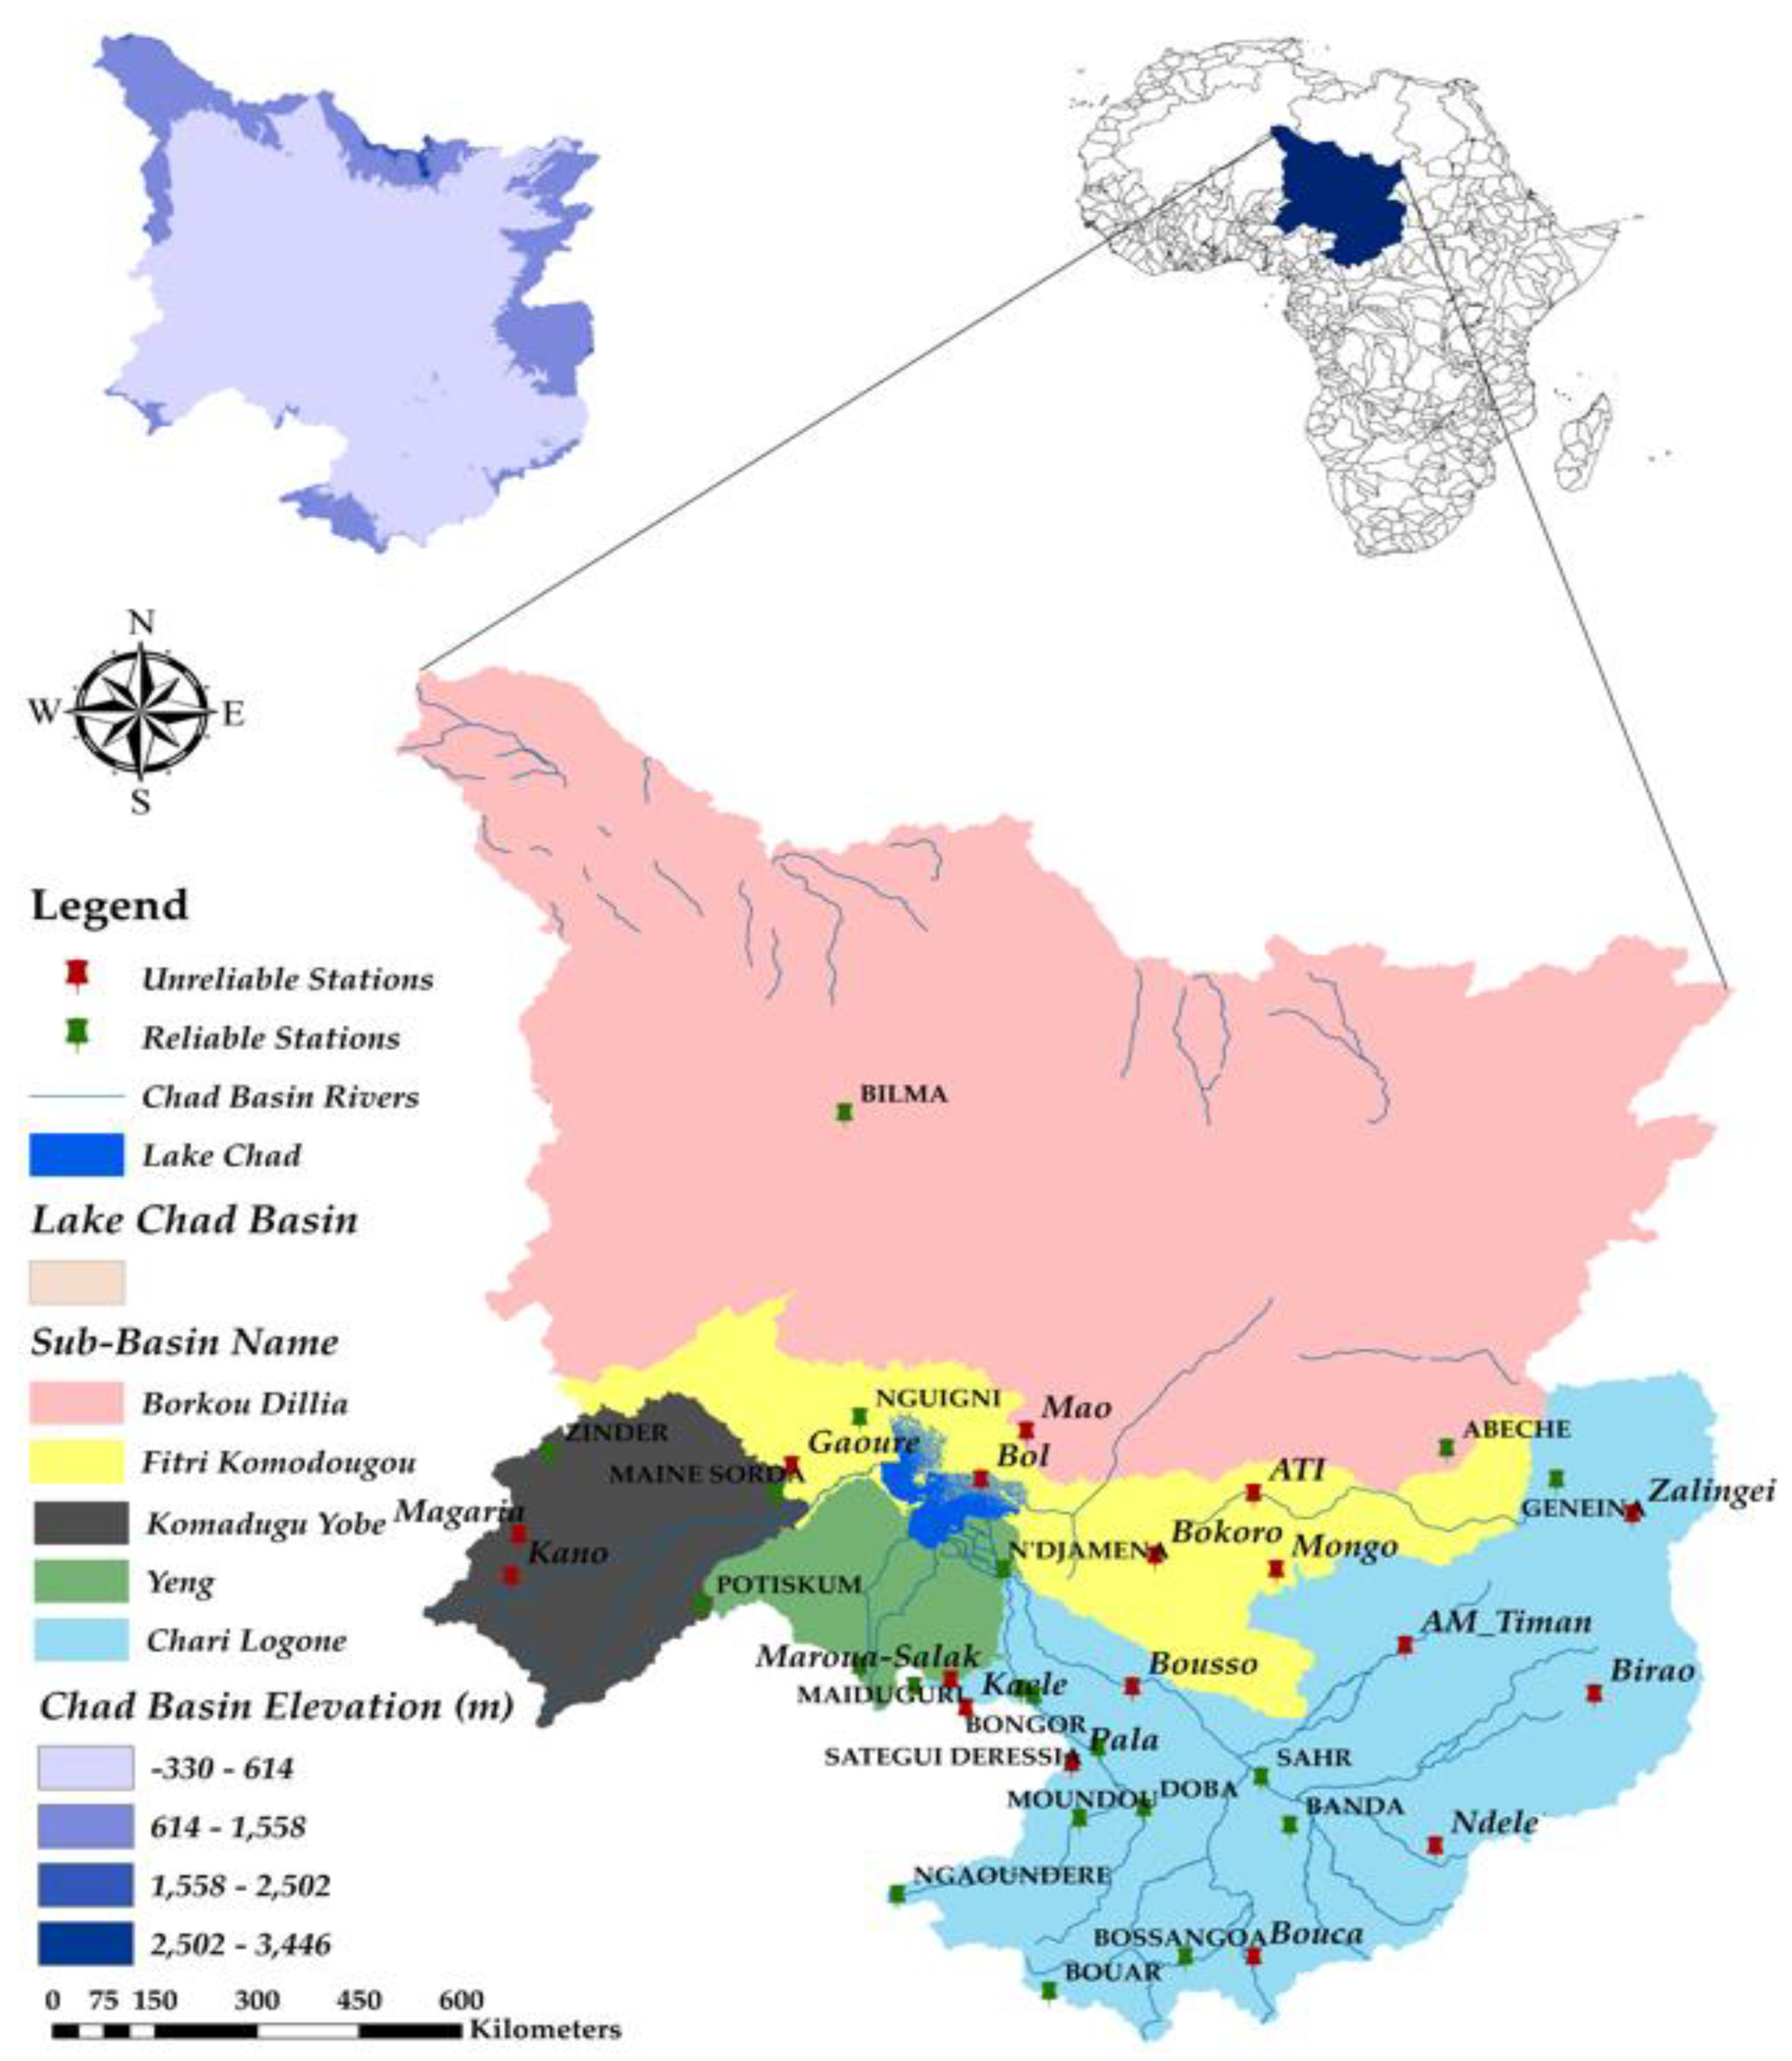
The performance of widely used, updated, and recently available high-resolution gridded precipitation and temperature datasets was assessed over the 15 available, quality-controlled, and reliable observed precipitation datasets and 12 temperature station records across the Lake Chad basin. The study’s temporal span was set to be 1979–2012 for consistency across all of the datasets, and met the requirements for a hydrological impact study. The study adopted a 0.5° resolution dataset, and finally extracted and interpolated the gridded dataset to station resolution using the inverse distance weighting method for consistency, making it adequate for regional studies.
In summary, the evaluated gridded climate datasets have proven to differ in their performance across the selected metrics, although the performance exhibited across all of the gridded climate datasets was promising—especially with regards to temperature, because climate models simulate temperature variables better than precipitation variables, as acknowledged in [94] However, these notable differences observed in the performance of the gridded datasets may be misleading in the selection or choice of a dataset based on evaluation using a single metric. Therefore, a good gridded dataset should have the ability to accurately replicate the climate patterns and amplitude of spatial and temporal variability across different performance metrics, which is critical for thorough and accurate hydro-climatic applications. This, however, has been acknowledged by [38], who stated that a single performance metric cannot adequately be relied upon for the selection of gridded datasets for global application. The merit of this methodology is predicated on the fact that the combination of multiple metrics for selection may reduce the chance of underperforming models exhibiting better performance for the wrong reasons [1].
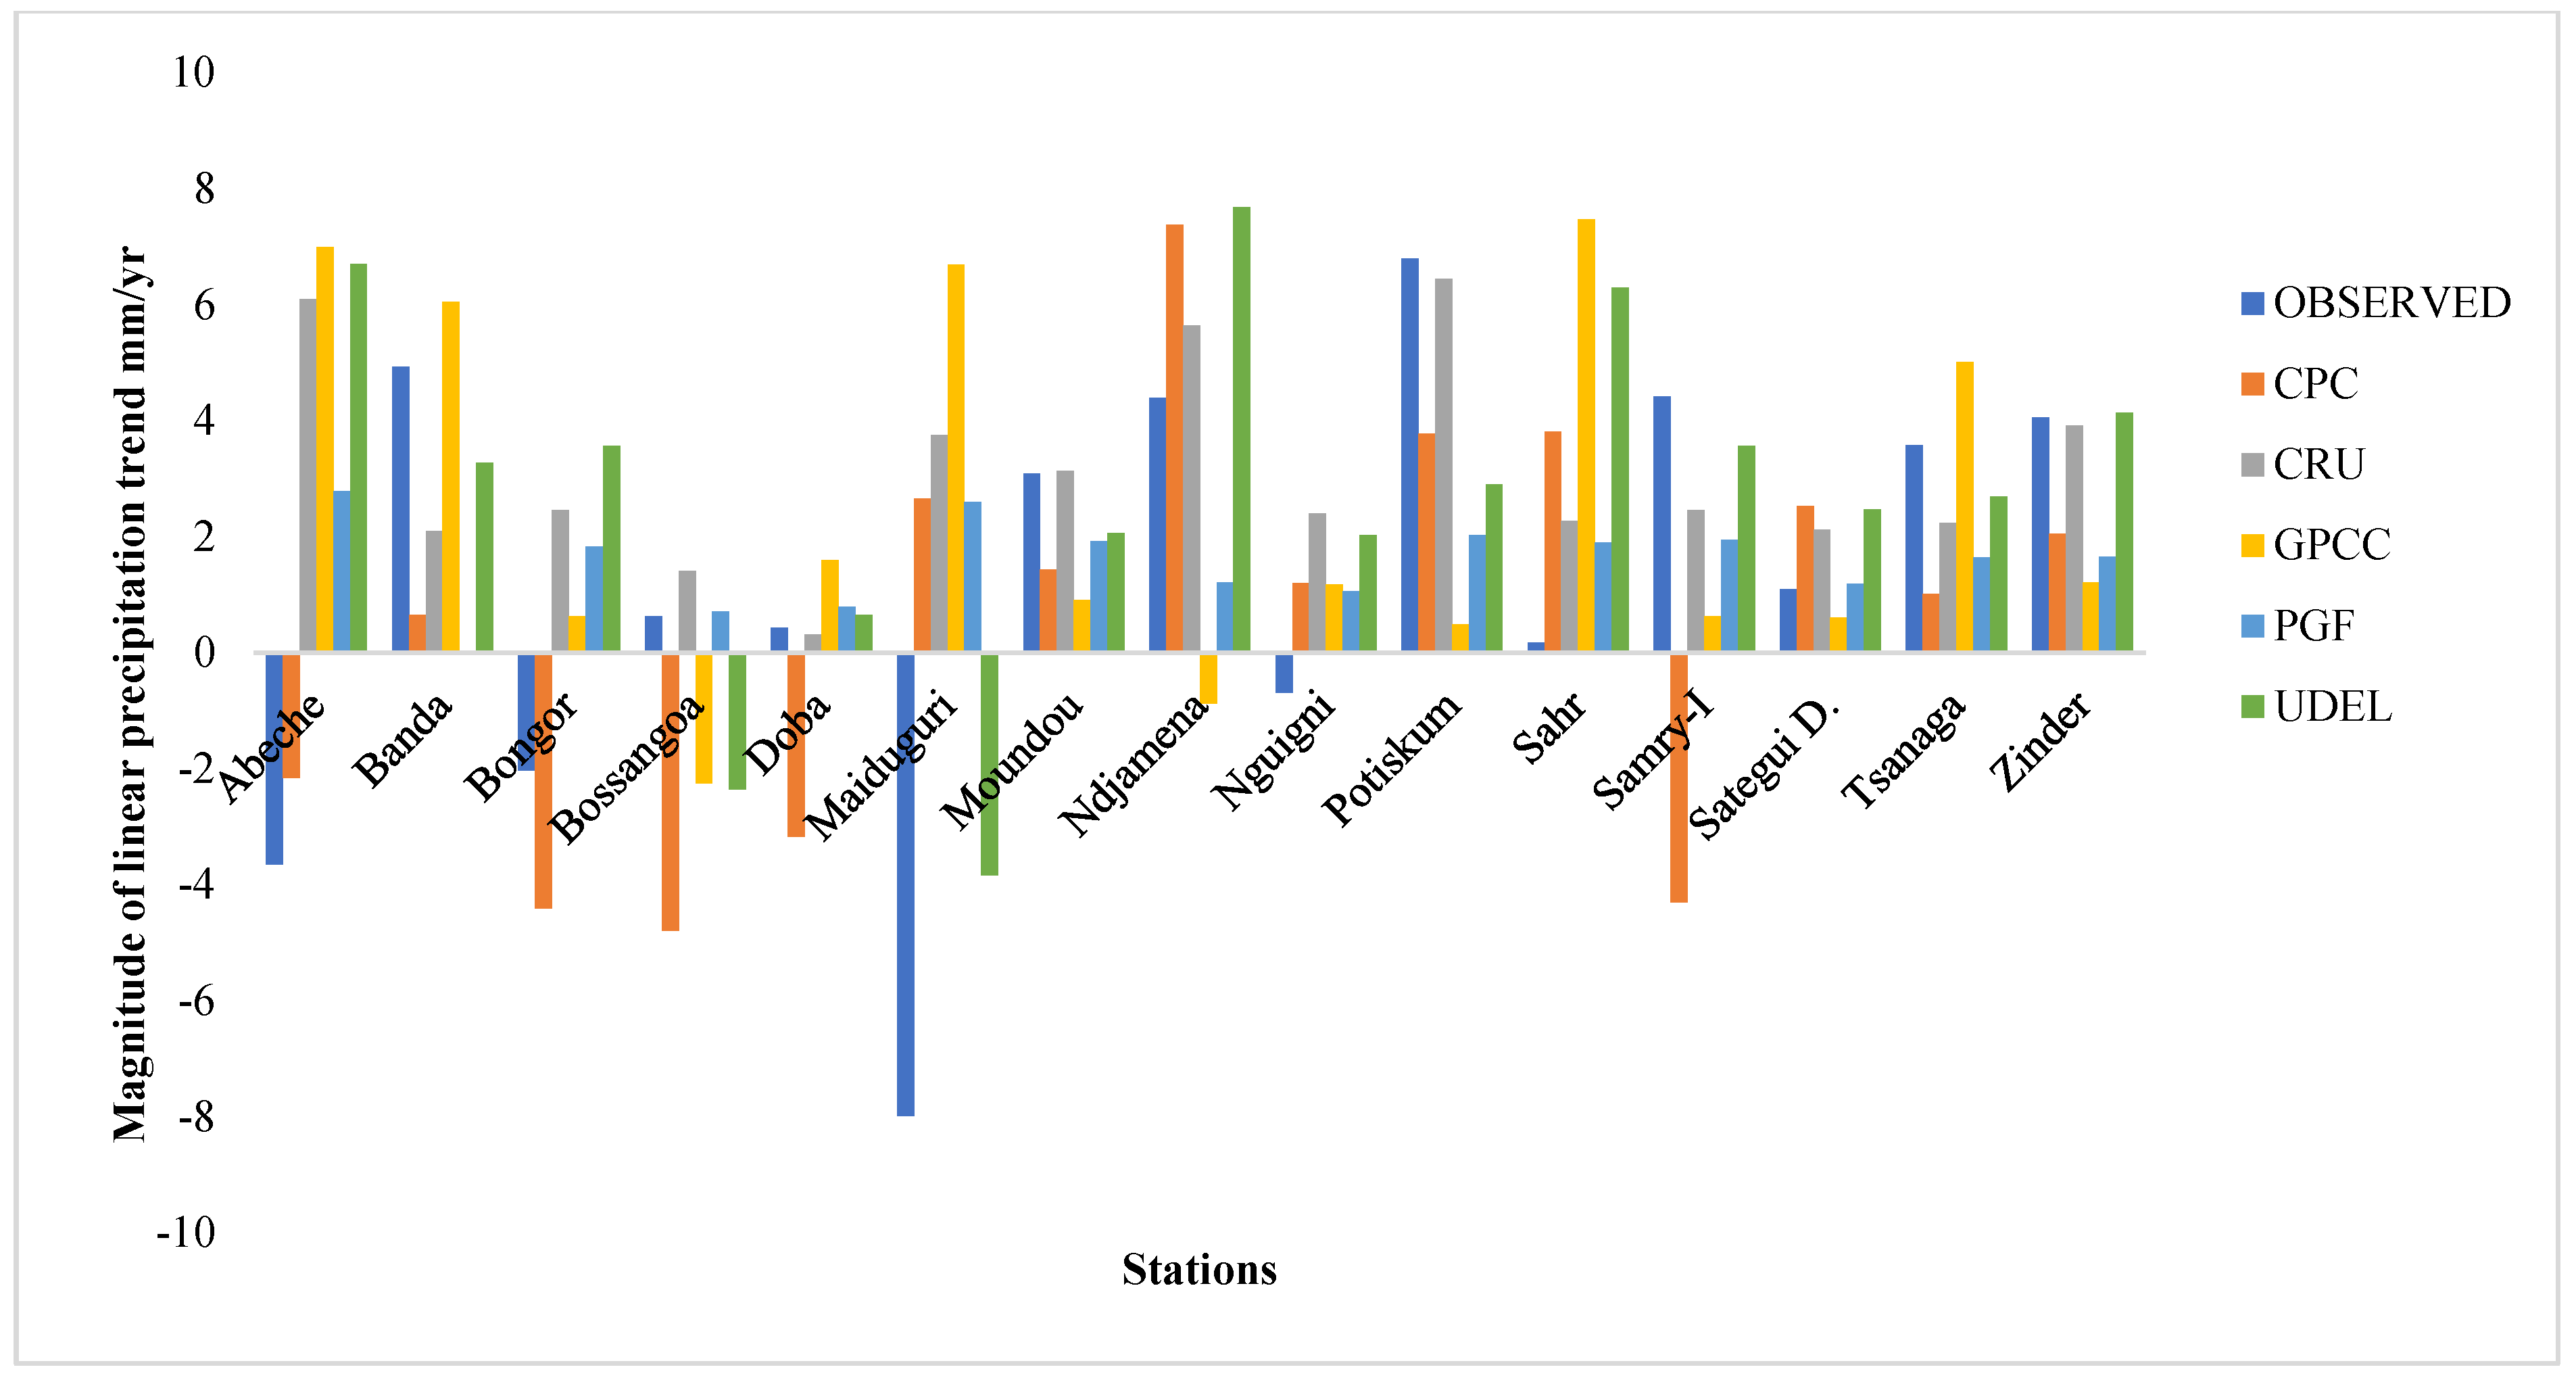
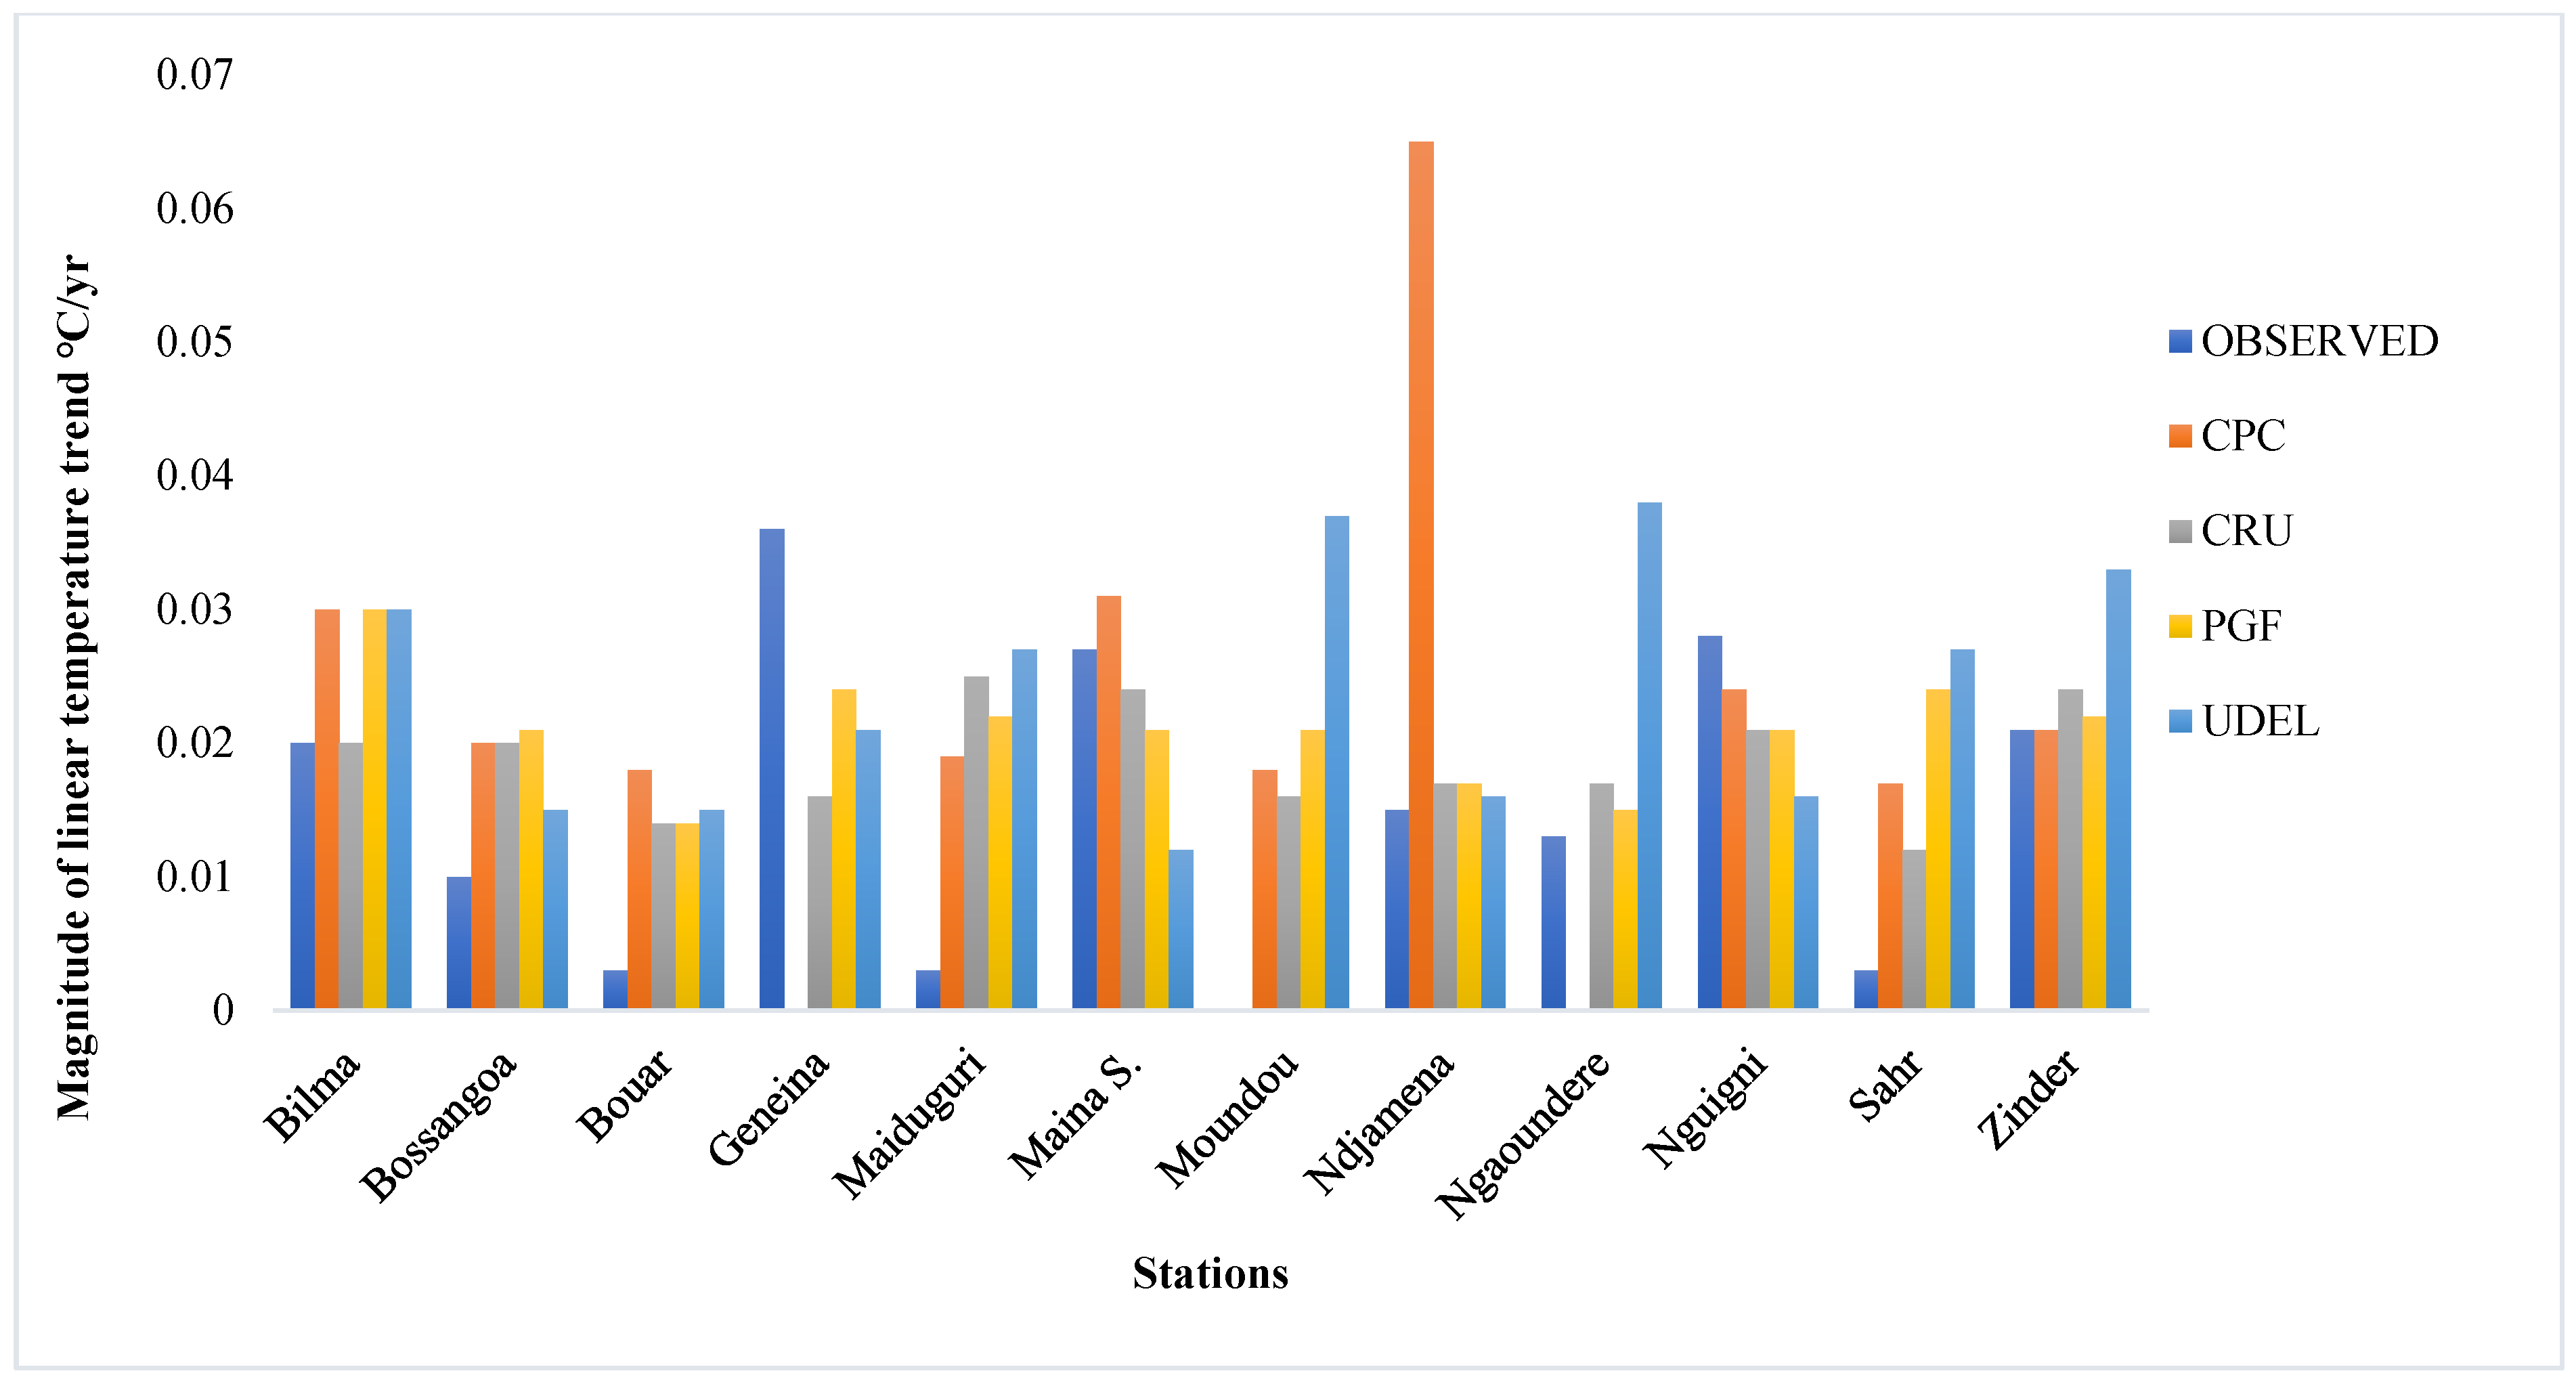
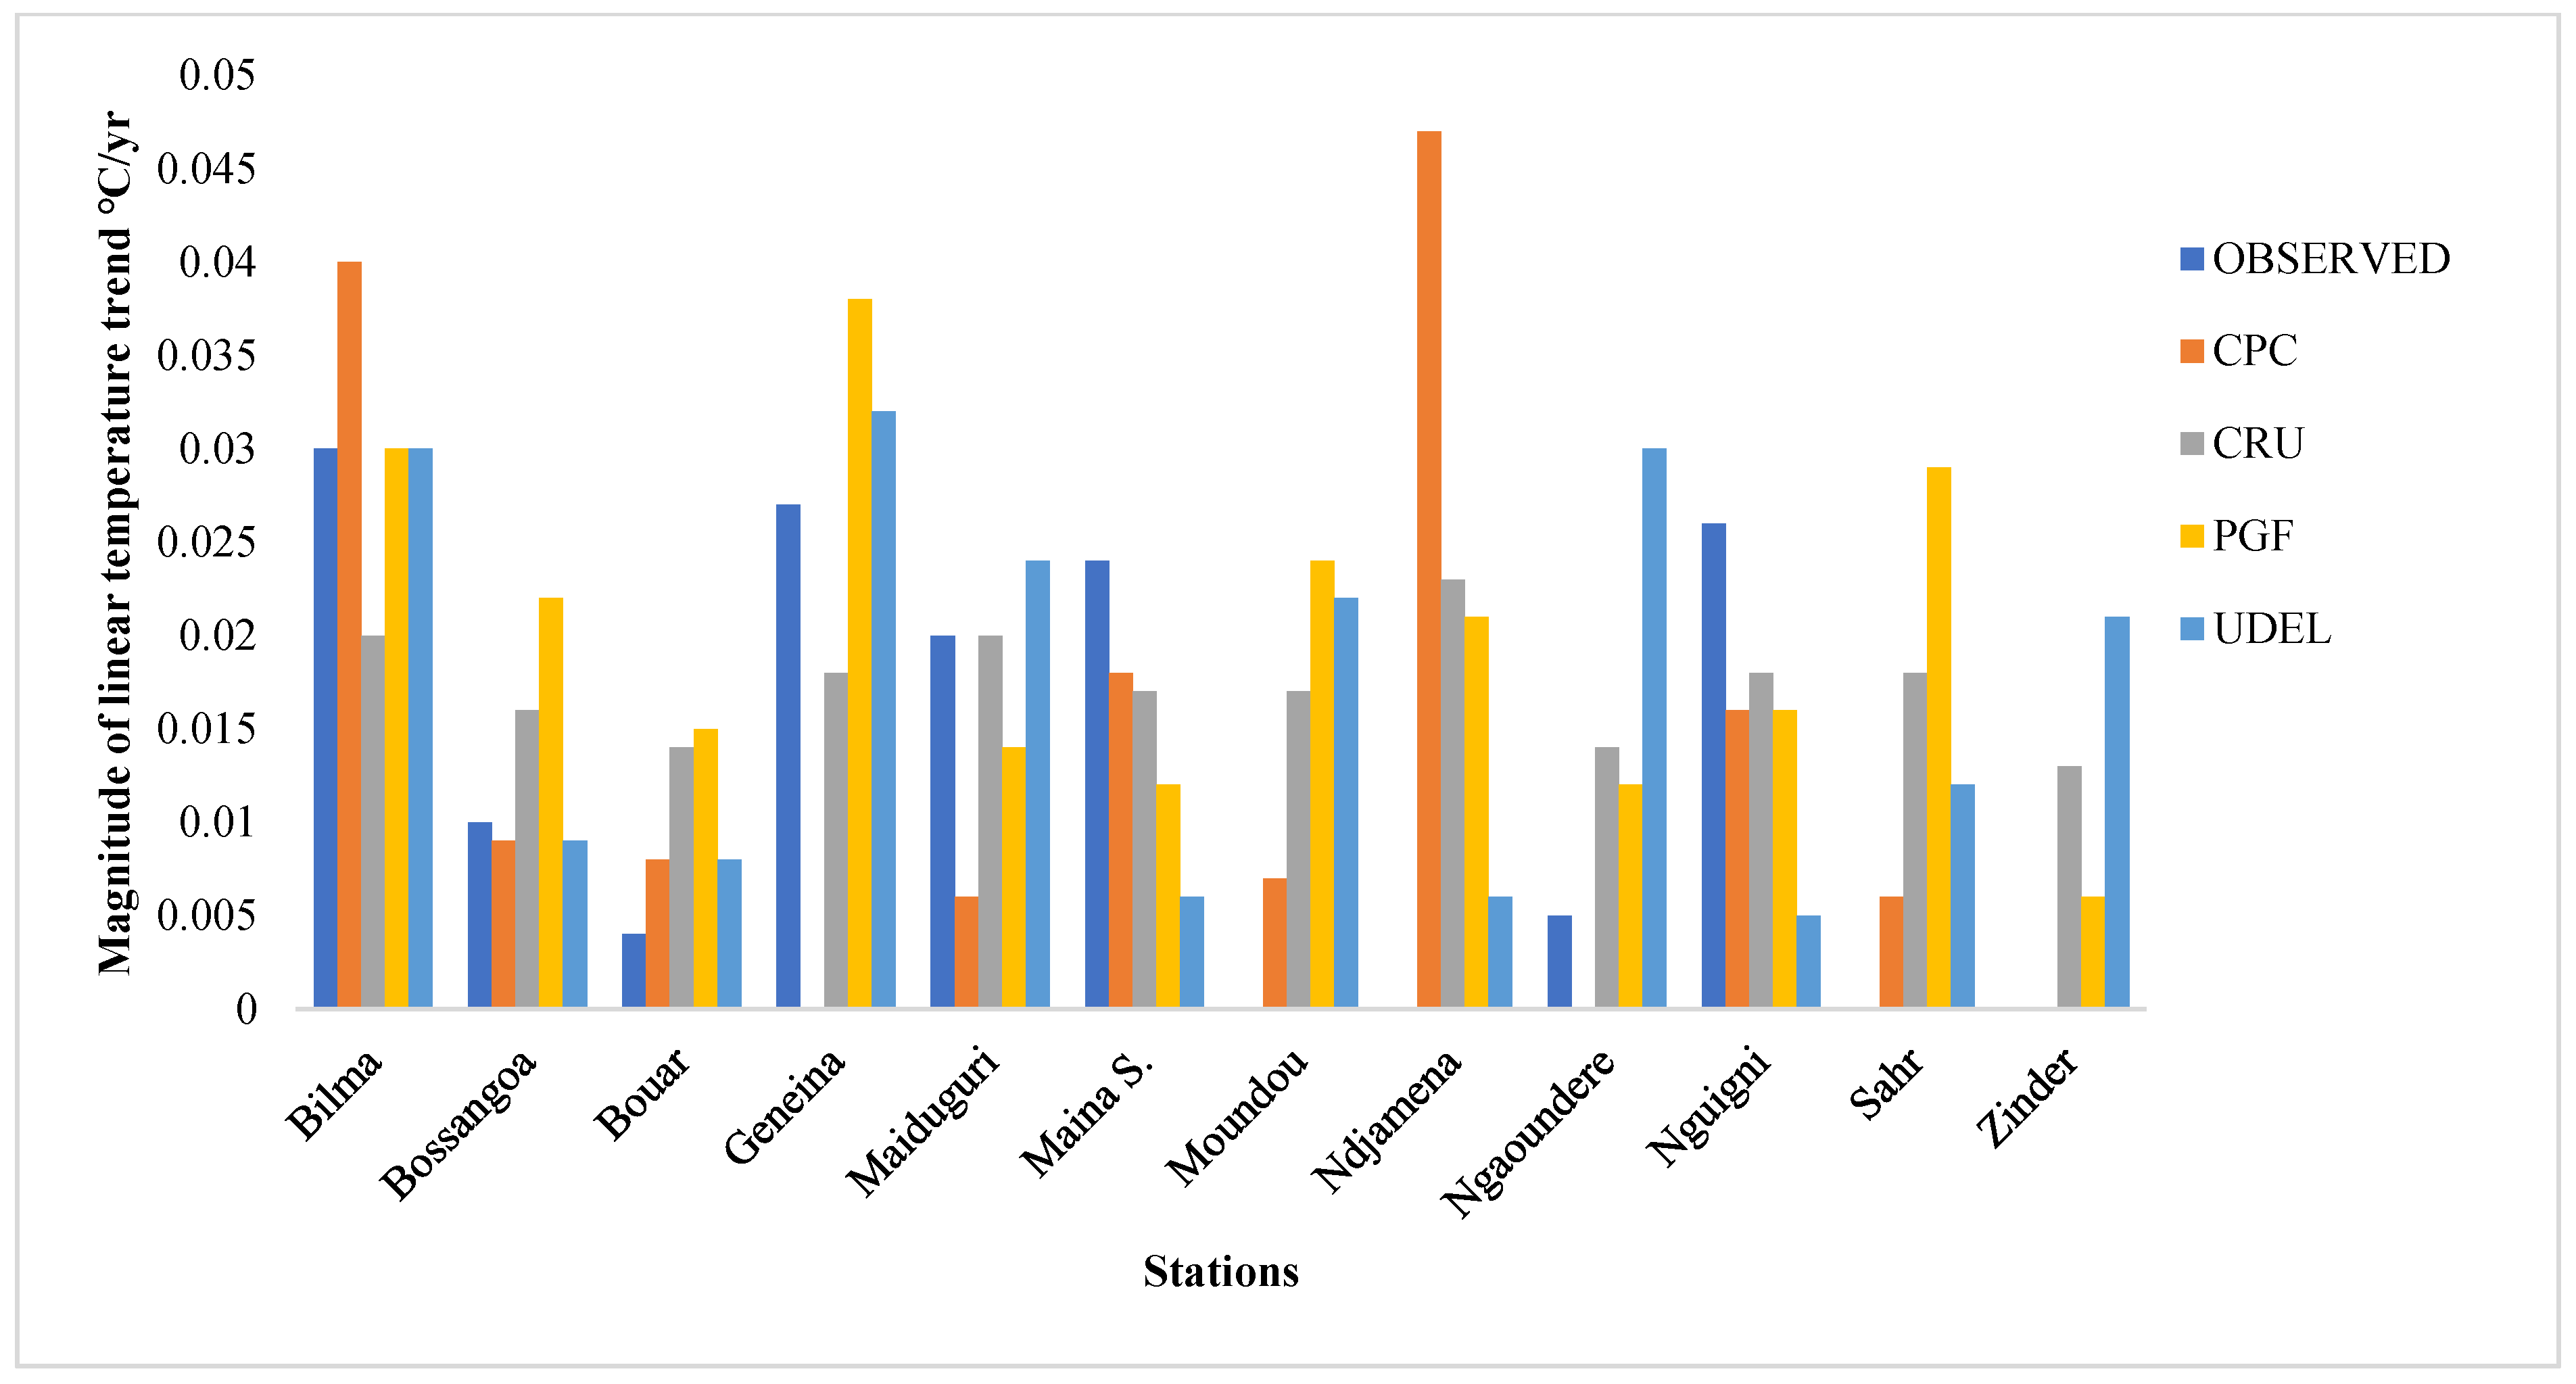
The gridded dataset exhibited some inherent weaknesses across the performance metrics, especially in simulating the trends and magnitude of precipitation and temperature across the annual and monsoon season timescales; for example, the CRU data was shown to have a better performance in replicating the observed station data relative to the other datasets, but overestimated the temperature trends across the annual and monsoon season timescales. However, the performance across the metrics considered in this study Table 11, revealed that the CRU data perform better in 5 out of 6 (83.3%) performance metrics considered for both precipitation and temperature, while CPC and GPCC have a relatively worse performance, with 3 out of 6 (50%) for precipitation, and PGF had 5 out of 6 (83%) for temperature in terms of the performance metrics. The superiority of the CRU data may be attributable to their employing a larger number of station data than other gridded datasets. However, the datasets were able to exhibit a satisfactory performance and represent the variability reasonably well, indicating that they possessed the ability to provide reliable hydro-climatic information with a lower level of uncertainty in their predictions.
The findings of this study, using multi-criteria decision making based on the assessment of the datasets by several performance metrics, revealed that the CRU, GPCC, and CPC precipitation datasets and the CRU and PGF temperature datasets showed better performance and, as such, should be recommended for application in hydro- climatic studies in the Lake Chad basin in order to enhance prediction and achieve a low level of uncertainty in terms of similarity to the observed station precipitation and temperature data, respectively. Furthermore, this was the first study to evaluate the performance and uncertainty associated with gridded precipitation and temperature datasets in the Lake Chad hydrological basin, and cannot be compared to previous studies. However, findings from other studies in regions with similar climatology have shown to be consistent with the present findings. For example, a study in the arid region of Pakistan indicated that GPCC was found to have an acceptable agreement with the observed dataset [95]. The CRU dataset was also found to have a better performance in the Niger Delta region of Nigeria [2], while GPCC, CRU, and CPC were consistent with the observed climate data in the mountainous region of South Africa [47].
Furthermore, the findings from our analysis also acknowledge the limitations associated with the development of gridded datasets and their inherent sources of uncertainty—such as spatial aggregation, the temporal period of analysis, and input uncertainty [96]—and offer ways to reduce the level of uncertainty associated with the observed station records—for example, sampling error, bias error, urbanisation effects, and rain gauge and thermometer exposure changes [97]; therefore, caution has been taken in pursuit of a reliable assessment.

6. Conclusions

This paper evaluated the performance of a long-term time series of high-resolution gridded precipitation and temperature datasets and their suitability for hydro-climatic studies in the data-scarce Lake Chad basin. The emphasis in this assessment was to employ multiple performance metrics to evaluate the ability of the selected datasets to replicate the quality-controlled observed meteorological station records available, and to provide methodological guidance based on multi-criteria decision making as to the choice of reference dataset suitable for climate and hydrological impact studies in data-scarce regions.
The results of the analysis revealed that all of the gridded precipitation datasets had the ability to replicate the observed climate record with varying levels of uncertainty—except for the PGF dataset, which exhibited unsatisfactory performance in terms of KGE, md, and NRMSE. However, all of the temperature datasets showed a strong agreement, and were consistent with the observed data. The results from the Taylor diagrams indicate a notable variability in normalised standard deviation across the annual, pre-monsoon, and monsoon season timescales, but have an acceptable Pearson’s correlation coefficient relative to the observed data records.
The trend analysis results show that the temperature datasets exhibit better ability in replicating the trends compared to precipitation datasets. Although there was a varying degree of mismatch in the magnitude of the trends across the stations, the CRU data exhibited a strong increasing temperature trend across all of the stations at the annual and monsoon season timescales, and tended to overestimate the temperature of the basin relative to the observed gauge data. However, the multi-criteria decision-making approach applied based on the performance exhibited across the metrics used in this study revealed that the CRU, GPCC, and CPC datasets are appropriate for precipitation, while the CRU and PGF datasets are appropriate for temperature, providing better replication of the basin’s climatology, with an acceptably low level of uncertainty in the prediction of climatic and hydrological variables for better policy planning and water resource management.
Furthermore, the results of this study highlight that the choice of gridded data is critical for fair representation of historical and projected future climate changes, as acknowledged in [1]. Therefore, due to differences in the temporal resolution of gridded datasets, the daily CPC precipitation and PGF temperature datasets, along with the monthly CRU precipitation/temperature datasets, are recommended for the downscaling and bias correction of global climate models in hydrological modelling processes, depending on the input data requirements of hydrological models in the Lake Chad basin, as well as on the need for improvement in the development of climate models in order to better reproduce satisfactory temporal and spatial variability in climate indices, limit uncertainties, and improve prediction accuracy in the quantification of projected climate hazards and vulnerabilities for better water policy decision making.

Author Contributions

Conceptualization, I.M.L., D.B. and A.H.J.; Data curation, I.M.L.; Formal analysis, I.M.L. and A.S.; Funding acquisition, D.B. and C.J.W.; Investigation, I.M.L., D.B., I.H. and A.S.; Methodology, I.M.L. and I.H.; Project administration, D.B. and C.J.W.; Resources, D.B., C.J.W., A.H.J. and A.S.; Software, I.M.L.; Supervision, D.B. and C.J.W.; Validation, D.B., C.J.W., A.H.J., I.H. and A.S.; Visualization, D.B., C.J.W., A.H.J., I.H. and A.S.; Writing—original draft, I.M.L.; Writing—review & editing, I.M.L., D.B., C.J.W., A.H.J., I.H. and A.S. All authors have read and agreed to the published version of the manuscript.

Funding

This research was undertaken during a PhD studentship funded by the Petroleum Technology Development Fund, Nigeria, award number [PTDF/ED/OSS/PHD/IML/1537/19], and the APC was funded by the University of Strathclyde.

Institutional Review Board Statement

Not applicable.

Informed Consent Statement

Not applicable.

Data Availability Statement

All data, materials, and codes used in this study are available upon request from the corresponding author.

Acknowledgments

This research was supported by the Petroleum Technology Development Fund (Nigeria) and the Department of Civil and Environmental Engineering, University of Strathclyde, Glasgow. The authors also wish to acknowledge Rashid Mahmood, the Lake Chad Basin Commission, the Nigerian Meteorological Agency, the NOAA and all data sources used in this study for making their resources available and free for access.

Conflicts of Interest

The authors wish to declare that there are no competing interests, and no ethical approval was required regarding the publication of this article.

References

  1. Kattsov, V.; Federation, R.; Reason, C.; Africa, S.; Uk, A.A.; Uk, T.A.; Baehr, J.; Uk, A.B.; Catto, J.; Canada, J.S.; et al. Evaluation of climate models. In Climate Change 2013 the Physical Science Basis: Working Group I Contribution to the Fifth Assessment Report of the Intergovernmental Panel on Climate Change; Cambridge University Press: Cambridge, UK, 2013; pp. 741–866. [Google Scholar] [CrossRef] [Green Version]
  2. Hassan, I.; Kalin, R.M.; White, C.J.; Aladejana, J.A. Evaluation of Daily Gridded Meteorological Datasets over the Niger Delta Region of Nigeria and Implication to Water Resources Management. Atmos. Clim. Sci. 2020, 10, 21–39. [Google Scholar] [CrossRef] [Green Version]
  3. Ouallouche, F.; Lazri, M.; Ameur, S. Improvement of rainfall estimation from MSG data using Random Forests classification and regression. Atmos. Res. 2018, 211, 62–72. [Google Scholar] [CrossRef]
  4. Berndt, C.; Haberlandt, U. Spatial interpolation of climate variables in Northern Germany—Influence of temporal resolution and network density. J. Hydrol. Reg. Stud. 2018, 15, 184–202. [Google Scholar] [CrossRef]
  5. Sehad, M.; Lazri, M.; Ameur, S. Novel SVM-based technique to improve rainfall estimation over the Mediterranean region (north of Algeria) using the multispectral MSG SEVIRI imagery. Adv. Space Res. 2017, 59, 1381–1394. [Google Scholar] [CrossRef]
  6. Beck, H.E.; Pan, M.; Roy, T.; Weedon, G.P.; Pappenberger, F.; Van Dijk, A.I.J.M.; Huffman, G.J.; Adler, R.F.; Wood, E.F. Daily evaluation of 26 precipitation datasets using Stage-IV gauge-radar data for the CONUS. Hydrol. Earth Syst. Sci. 2019, 23, 207–224. [Google Scholar] [CrossRef] [Green Version]
  7. Aieb, A.; Madani, K.; Scarpa, M.; Bonacorso, B.; Lefsih, K. A new approach for processing climate missing databases applied to daily rainfall data in Soummam watershed, Algeria. Heliyon 2019, 5, 1–27. [Google Scholar] [CrossRef] [Green Version]
  8. Gyau-Boakye, P.; Schultz, G.A. Filling gaps in runoff time series in west africa. Hydrol. Sci. J. 1994, 39, 621–636. [Google Scholar] [CrossRef]
  9. Shiru, M.S.; Shahid, S.; Shiru, S.; Chung, E.S.; Alias, N.; Ahmed, K.; Dioha, E.C.; Sa’adi, Z.; Salman, S.; Noor, M.; et al. Challenges in water resources of Lagos mega city of Nigeria in the context of climate change. J. Water Clim. Chang. 2019, 4, 1067–1083. [Google Scholar] [CrossRef]
  10. Shiru, M.S.; Shahid, S.; Chung, E.S.; Alias, N.; Scherer, L. A MCDM-based framework for selection of general circulation models and projection of spatio-temporal rainfall changes: A case study of Nigeria. Atmos. Res. 2019, 225, 1–16. [Google Scholar] [CrossRef]
  11. Gampe, D.; Schmid, J.; Ludwig, R. Impact of reference dataset selection on RCM evaluation, bias correction, and resulting climate change signals of precipitation. J. Hydrometeorol. 2019, 20, 1813–1828. [Google Scholar] [CrossRef]
  12. Isotta, F.A.; Frei, C.; Weilguni, V.; Perčec Tadić, M.; Lassègues, P.; Rudolf, B.; Pavan, V.; Cacciamani, C.; Antolini, G.; Ratto, S.M.; et al. The climate of daily precipitation in the Alps: Development and analysis of a high-resolution grid dataset from pan-Alpine rain-gauge data. Int. J. Climatol. 2014, 34, 1657–1675. [Google Scholar] [CrossRef]
  13. Schamm, K.; Ziese, M.; Becker, A.; Finger, P.; Meyer-Christoffer, A.; Schneider, U.; Schröder, M.; Stender, P. Global gridded precipitation over land: A description of the new GPCC First Guess Daily product. Earth Syst. Sci. Data 2014, 6, 49–60. [Google Scholar] [CrossRef] [Green Version]
  14. Bosilovich, M.G.; Lucchesi, R.; Suarez, M. MERRA-2: File Specification. Earth 2016, 9, 73. [Google Scholar]
  15. Landelius, T.; Dahlgren, P.; Gollvik, S.; Jansson, A.; Olsson, E. A high-resolution regional reanalysis for Europe. Part 2: 2D analysis of surface temperature, precipitation and wind. Q. J. R. Meteorol. Soc. 2016, 142, 2132–2142. [Google Scholar] [CrossRef] [Green Version]
  16. Poli, P.; Hersbach, H.; Dee, D.P.; Berrisford, P.; Simmons, A.J.; Vitart, F.; Laloyaux, P.; Tan, D.G.H.; Peubey, C.; Thépaut, J.N.; et al. ERA-20C: An atmospheric reanalysis of the twentieth century. J. Clim. 2016, 29, 4083–4097. [Google Scholar] [CrossRef]
  17. Kummerow, C.; Barnes, W.; Kozu, T.; Shiue, J.; Simpson, J. The Tropical Rainfall Measuring Mission (TRMM) sensor package. J. Atmos. Ocean. Technol. 1998, 15, 809–817. [Google Scholar] [CrossRef]
  18. Ashouri, H.; Hsu, K.L.; Sorooshian, S.; Braithwaite, D.K.; Knapp, K.R.; Cecil, L.D.; Nelson, B.R.; Prat, O.P. PERSIANN-CDR: Daily precipitation climate data record from multisatellite observations for hydrological and climate studies. Bull. Am. Meteorol. Soc. 2015, 96, 69–83. [Google Scholar] [CrossRef] [Green Version]
  19. Tapiador, F.J.; Turk, F.J.; Petersen, W.; Hou, A.Y.; García-Ortega, E.; Machado, L.A.T.; Angelis, C.F.; Salio, P.; Kidd, C.; Huffman, G.J.; et al. Global precipitation measurement: Methods, datasets and applications. Atmos. Res. 2012, 104–105, 70–97. [Google Scholar] [CrossRef]
  20. Zhang, Q.; Körnich, H.; Holmgren, K. How well do reanalyses represent the southern African precipitation? Clim. Dyn. 2013, 40, 951–962. [Google Scholar] [CrossRef]
  21. Salih, A.A.M.; Elagib, N.A.; Tjernström, M.; Zhang, Q. Characterization of the Sahelian-Sudan rainfall based on observations and regional climate models. Atmos. Res. 2018, 202, 205–218. [Google Scholar] [CrossRef]
  22. Washington, R.; Harrison, M.; Conway, D.; Black, E.; Challinor, A.; Grimes, D.; Jones, R.; Morse, A.; Kay, G.; Todd, M. African climate change: Taking the shorter route. Bull. Am. Meteorol. Soc. 2006, 87, 1355–1366. [Google Scholar] [CrossRef]
  23. Brunet, M.; Jones, P. Data rescue initiatives: Bringing historical climate data into the 21st century. Clim. Res. 2011, 47, 29–40. [Google Scholar] [CrossRef]
  24. Joyce, R.J.; Janowiak, J.E.; Arkin, P.A.; Xie, P. CMORPH: A method that produces global precipitation estimates from passive microwave and infrared data at high spatial and temporal resolution. J. Hydrometeorol. 2004, 5, 487–503. [Google Scholar] [CrossRef]
  25. Hijmans, R.J.; Cameron, S.E.; Parra, J.L.; Jones, P.G.; Jarvis, A. Very high resolution interpolated climate surfaces for global land areas. Int. J. Climatol. 2005, 25, 1965–1978. [Google Scholar] [CrossRef]
  26. Chen, M.; Xie, P.; Janowiak, J.E. Global land precipitation: A 50-yr monthly analysis based on gauge observations. J. Hydrometeorol. 2002, 3, 249–266. [Google Scholar] [CrossRef]
  27. Xie, P.; Yatagai, A.; Chen, M.; Hayasaka, T.; Fukushima, Y.; Liu, C.; Yang, S. A gauge-based analysis of daily precipitation over East Asia. J. Hydrometeorol. 2007, 8, 607–626. [Google Scholar] [CrossRef]
  28. Marengo, J.A.; Nobre, C.A.; Tomasella, J.; Oyama, M.D.; de Oliveira, G.S.; de Oliveira, R.; Camargo, H.; Alves, L.M.; Brown, I.F. The drought of Amazonia in 2005. J. Clim. 2008, 21, 495–516. [Google Scholar] [CrossRef] [Green Version]
  29. Feng, L.; Zhou, T.; Wu, B.; Li, T.; Luo, J.J. Projection of future precipitation change over China with a high-resolution global atmospheric model. Adv. Atmos. Sci. 2011, 28, 464–476. [Google Scholar] [CrossRef]
  30. Beharry, S.L.; Clarke, R.M.; Kurmarsingh, K. Precipitation trends using in-situ and gridded datasets. Theor. Appl. Climatol. 2014, 115, 599–607. [Google Scholar] [CrossRef]
  31. Shirvani, A.; Landman, W.A. Seasonal precipitation forecast skill over Iran. Int. J. Climatol. 2016, 36, 1887–1900. [Google Scholar] [CrossRef] [Green Version]
  32. Pour, S.H.; Shahid, S.; Chung, E.S.; Wang, X.J. Model output statistics downscaling using support vector machine for the projection of spatial and temporal changes in rainfall of Bangladesh. Atmos. Res. 2018, 213, 149–162. [Google Scholar] [CrossRef]
  33. Faiz, M.A.; Liu, D.; Fu, Q.; Sun, Q.; Li, M.; Baig, F.; Li, T.; Cui, S. How accurate are the performances of gridded precipitation data products over Northeast China? Atmos. Res. 2018, 211, 12–20. [Google Scholar] [CrossRef]
  34. Nashwan, M.S.; Shahid, S.; Chung, E.S. Development of high-resolution daily gridded temperature datasets for the central north region of Egypt. Sci. Data 2019, 6, 1–13. [Google Scholar] [CrossRef] [PubMed] [Green Version]
  35. Schoof, J.T.; Pryor, S.C. Evaluation of the NCEP-NCAR reanalysis in terms of synoptic-scale phenomena: A case study from the Midwestern USA. Int. J. Climatol. 2003, 23, 1725–1741. [Google Scholar] [CrossRef]
  36. Szczypta, C.; Calvet, J.C.; Albergel, C.; Balsamo, G.; Boussetta, S.; Carrer, D.; Lafont, S.; Meurey, C. Verification of the new ECMWF ERA-Interim reanalysis over France. Hydrol. Earth Syst. Sci. 2011, 15, 647–666. [Google Scholar] [CrossRef] [Green Version]
  37. Palazzi, E.; Von Hardenberg, J.; Provenzale, A. Precipitation in the hindu-kush karakoram himalaya: Observations and future scenarios. J. Geophys. Res. Atmos. 2013, 118, 85–100. [Google Scholar] [CrossRef]
  38. Gampe, D.; Ludwig, R. Evaluation of gridded precipitation data products for hydrological applications in complex topography. Hydrology 2017, 4, 53. [Google Scholar] [CrossRef] [Green Version]
  39. Henn, B.; Newman, A.J.; Livneh, B.; Daly, C.; Lundquist, J.D. An assessment of differences in gridded precipitation datasets in complex terrain. J. Hydrol. 2018, 556, 1205–1219. [Google Scholar] [CrossRef]
  40. Nashwan, M.S.; Shahid, S. Symmetrical uncertainty and random forest for the evaluation of gridded precipitation and temperature data. Atmos. Res. 2019, 230, 1–10. [Google Scholar] [CrossRef]
  41. Prein, A.F.; Gobiet, A. Impacts of uncertainties in European gridded precipitation observations on regional climate analysis. Int. J. Climatol. 2017, 37, 305–327. [Google Scholar] [CrossRef] [PubMed]
  42. Prakash, S.; Mitra, A.K.; Momin, I.M.; Rajagopal, E.N.; Basu, S.; Collins, M.; Turner, A.G.; Achuta Rao, K.; Ashok, K. Seasonal intercomparison of observational rainfall datasets over India during the southwest monsoon season. Int. J. Climatol. 2015, 35, 2326–2338. [Google Scholar] [CrossRef] [Green Version]
  43. Prakash, S.; Gairola, R.M.; Mitra, A.K. Comparison of large-scale global land precipitation from multisatellite and reanalysis products with gauge-based GPCC data sets. Theor. Appl. Climatol. 2015, 121, 303–317. [Google Scholar] [CrossRef]
  44. Eum, H.I.; Dibike, Y.; Prowse, T.; Bonsal, B. Inter-comparison of high-resolution gridded climate data sets and their implication on hydrological model simulation over the Athabasca Watershed, Canada. Hydrol. Process. 2014, 28, 4250–4271. [Google Scholar] [CrossRef]
  45. Sylla, M.B.; Giorgi, F.; Coppola, E.; Mariotti, L. Uncertainties in daily rainfall over Africa: Assessment of gridded observation products and evaluation of a regional climate model simulation. Int. J. Climatol. 2013, 33, 1805–1817. [Google Scholar] [CrossRef]
  46. Kyselý, J.; Plavcová, E. A critical remark on the applicability of E-OBS European gridded temperature data set for validating control climate simulations. J. Geophys. Res. Atmos. 2010, 115, 1–14. [Google Scholar] [CrossRef]
  47. Manatsa, D.; Chingombe, W.; Matarira, C.H. The impact of the positive Indian Ocean dipole on Zimbabwe droughts Tropical climate is understood to be dominated by. Int. J. Climatol. 2008, 2029, 2011–2029. [Google Scholar] [CrossRef]
  48. Ahmed, K.; Shahid, S.; Sachindra, D.A.; Nawaz, N.; Chung, E.S. Fidelity assessment of general circulation model simulated precipitation and temperature over Pakistan using a feature selection method. J. Hydrol. 2019, 573, 281–298. [Google Scholar] [CrossRef]
  49. Salman, S.A.; Shahid, S.; Ismail, T.; Al-Abadi, A.M.; Wang, X.; Chung, E.S. Selection of gridded precipitation data for Iraq using compromise programming. Meas. J. Int. Meas. Confed. 2019, 132, 87–98. [Google Scholar] [CrossRef]
  50. Tanarhte, M.; Hadjinicolaou, P.; Lelieveld, J. Intercomparison of temperature and precipitation data sets based on observations in the Mediterranean and the Middle East. J. Geophys. Res. Atmos. 2012, 117, 1–24. [Google Scholar] [CrossRef]
  51. Xu, H.; Xu, C.Y.; Sælthun, N.R.; Zhou, B.; Xu, Y. Evaluation of reanalysis and satellite-based precipitation datasets in driving hydrological models in a humid region of Southern China. Stoch. Environ. Res. Risk Assess. 2015, 29, 2003–2020. [Google Scholar] [CrossRef]
  52. Nkiaka, E.; Nawaz, R.; Lovett, J.C. Assessing the reliability and uncertainties of projected changes in precipitation and temperature in Coupled Model Intercomparison Project phase 5 models over the Lake Chad basin. Int. J. Climatol. 2018, 38, 5136–5152. [Google Scholar] [CrossRef]
  53. OE, A.; BL, L.; AE, L.; IS, S. Spatio-Temporal Precipitation Trend and Homogeneity Analysis in Komadugu-Yobe Basin, Lake Chad Region. J. Climatol. Weather Forecast. 2017, 5, 1–12. [Google Scholar] [CrossRef]
  54. Mahmood, R.; Jia, S. Observed and simulated hydro-climatic data for the lake Chad basin, Africa. Data Brief 2019, 25, 1–5. [Google Scholar] [CrossRef]
  55. Pattnayak, K.C.; Abdel-Lathif, A.Y.; Rathakrishnan, K.V.; Singh, M.; Dash, R.; Maharana, P. Changing Climate Over Chad: Is the Rainfall Over the Major Cities Recovering? Earth Space Sci. 2019, 6, 1149–1160. [Google Scholar] [CrossRef] [Green Version]
  56. Press, B.; William, H.; Saul, A.; William, T.; Brian, P. Numerical Recipes in Fortran 90: Volume 2 of Fortran Numerical Recipes: The Art of Parallel Scientific Computing; Cambridge University Press: Cambridge, UK, 1996; Volume 2, p. 90. [Google Scholar]
  57. Salman, S.A.; Shahid, S.; Ismail, T.; Ahmed, K.; Wang, X.J. Selection of climate models for projection of spatiotemporal changes in temperature of Iraq with uncertainties. Atmos. Res. 2018, 213, 509–522. [Google Scholar] [CrossRef]
  58. Coe, M.T.; Foley, J.A. Human and natural impacts on the water resources of the Lake Chad basin. J. Geophys. Res. Atmos. 2001, 106, 3349–3356. [Google Scholar] [CrossRef]
  59. Gao, H.; Bohn, T.J.; Podest, E.; McDonald, K.C.; Lettenmaier, D.P. On the causes of the shrinking of Lake Chad. Environ. Res. Lett. 2011, 6, 1–7. [Google Scholar] [CrossRef] [Green Version]
  60. Ndehedehe, C.E.; Awange, J.L.; Agutu, N.O.; Okwuashi, O. Changes in hydro-meteorological conditions over tropical West Africa (1980–2015) and links to global climate. Glob. Planet. Chang. 2018, 162, 321–341. [Google Scholar] [CrossRef] [Green Version]
  61. Sarch, M.T.; Birkett, C. Fishing and farming at Lake Chad: Responses to lake-level fluctuations. Geogr. J. 2000, 166, 156–172. [Google Scholar] [CrossRef]
  62. Coe, M.T.; Birkett, C.M. Calculation of river discharge and prediction of lake height from satellite radar altimetry: Example for the Lake Chad basin. Water Resour. Res. 2004, 40, 1–11. [Google Scholar] [CrossRef]
  63. Magrin, G. The disappearance of Lake Chad: History of a myth. J. Political Ecol. 2016, 23, 204–222. [Google Scholar] [CrossRef] [Green Version]
  64. Mahmood, R.; Jia, S. Assessment of hydro-climatic trends and causes of dramatically declining stream flow to Lake Chad, Africa, using a hydrological approach. Sci. Total Environ. 2019, 675, 122–140. [Google Scholar] [CrossRef] [PubMed]
  65. Buma, W.G.; Lee, S.I.; Seo, J.Y. Hydrological evaluation of Lake Chad basin using space borne and hydrological model observations. Water 2016, 8, 205. [Google Scholar] [CrossRef] [Green Version]
  66. UNEP. UNEP in 2006. Available online: https://wedocs.unep.org/bitstream/handle/20.500.11822/7476/-UNEP%202006%20Annual%20Report-2007755.pdf (accessed on 2 March 2020).
  67. Mahmood, R.; Jia, S.; Zhu, W. Analysis of climate variability, trends, and prediction in the most active parts of the Lake Chad basin, Africa. Sci. Rep. 2019, 9, 1–18. [Google Scholar] [CrossRef] [PubMed] [Green Version]
  68. Le Coz, M.; Delclaux, F.; Genthon, P.; Favreau, G. Assessment of Digital Elevation Model (DEM) aggregation methods for hydrological modeling: Lake Chad basin, Africa. Comput. Geosci. 2009, 35, 1661–1670. [Google Scholar] [CrossRef]
  69. Nkiaka, E.; Nawaz, N.R.; Lovett, J.C. Effect of single and multi-site calibration techniques on hydrological model performance, parameter estimation and predictive uncertainty: A case study in the Logone catchment, Lake Chad basin. Stoch. Environ. Res. Risk Assess. 2018, 32, 1665–1682. [Google Scholar] [CrossRef] [Green Version]
  70. van Buuren, S.; Groothuis-Oudshoorn, K. mice: Multivariate imputation by chained equations in R. J. Stat. Softw. 2011, 45, 1–67. [Google Scholar] [CrossRef] [Green Version]
  71. Kohler, M.A. Double-mass analysis for testing the consistency of records and for making adjustments. Bull. Am. Meteorol. Soc. 1949, 30, 188–189. [Google Scholar] [CrossRef]
  72. Wijngaard, J.B.; Klein Tank, A.M.G.; Können, G.P. Homogeneity of 20th century European daily temperature and precipitation series. Int. J. Climatol. 2003, 23, 679–692. [Google Scholar] [CrossRef]
  73. Yozgatligil, C.; Yazici, C. Comparison of homogeneity tests for temperature using a simulation study. Int. J. Climatol. 2016, 36, 62–81. [Google Scholar] [CrossRef]
  74. Menne, M.J.; Williams, C.N.; Gleason, B.E.; Jared Rennie, J.; Lawrimore, J.H. The Global Historical Climatology Network Monthly Temperature Dataset, Version 4. J. Clim. 2018, 31, 9835–9854. [Google Scholar] [CrossRef]
  75. New, M.; Hulme, M.; Jones, P. Representing twentieth-century space-time climate variability. Part II: Development of 1901-96 monthly grids of terrestrial surface climate. J. Clim. 2000, 13, 2217–2238. [Google Scholar] [CrossRef]
  76. Sheffield, J.; Goteti, G.; Wood, E.F. Development of a 50-year high-resolution global dataset of meteorological forcings for land surface modeling. J. Clim. 2006, 19, 3088–3111. [Google Scholar] [CrossRef] [Green Version]
  77. Lawrimore, J.H.; Menne, M.J.; Gleason, B.E.; Williams, C.N.; Wuertz, D.B.; Vose, R.S.; Rennie, J. An overview of the Global Historical Climatology Network monthly mean temperature data set, version 3. J. Geophys. Res. Atmos. 2011, 116, 1–18. [Google Scholar] [CrossRef]
  78. Menne, M.J.; Durre, I.; Vose, R.S.; Gleason, B.E.; Houston, T.G. An overview of the global historical climatology network-daily database. J. Atmos. Ocean. Technol. 2012, 29, 897–910. [Google Scholar] [CrossRef]
  79. Yu, L.; Liu, H. Feature Selection for High-Dimensional Data: A Fast Correlation-Based Filter Solution. In Proceedings of the Twentieth International Conference on Machine Learning, Washington, DC, USA, 21–24 August 2003; Volume 2, pp. 856–863. [Google Scholar]
  80. Shreem, S.S.; Abdullah, S.; Nazri, M.Z.A. Hybrid feature selection algorithm using symmetrical uncertainty and a harmony search algorithm. Int. J. Syst. Sci. 2016, 47, 1312–1329. [Google Scholar] [CrossRef]
  81. Romanski, P. Package “FSelector”. 2021. Available online: https://cran.r-project.org/web/packages/FSelector/FSelector.pdf (accessed on 2 March 2020).
  82. Gupta, H.V.; Kling, H.; Yilmaz, K.K.; Martinez, G.F. Decomposition of the mean squared error and NSE performance criteria: Implications for improving hydrological modelling. J. Hydrol. 2009, 377, 80–91. [Google Scholar] [CrossRef] [Green Version]
  83. Willmott, C.J. ON the Validation of Models. Phys. Geogr. 1981, 2, 184–194. [Google Scholar] [CrossRef]
  84. Chen, F.W.; Liu, C.W. Estimation of the spatial rainfall distribution using inverse distance weighting (IDW) in the middle of Taiwan. Paddy Water Environ. 2012, 10, 209–222. [Google Scholar] [CrossRef]
  85. Willmott, C.J. Some comments on the evaluation of model performance. Bull. Am. Meteorol. Soc. 1982, 63, 1309–1313. [Google Scholar] [CrossRef] [Green Version]
  86. Taylor, K.E. In a Single Diagram. J. Geophys. Res. 2001, 106, 7183–7192. [Google Scholar] [CrossRef]
  87. Taylor, K.E. Taylor Diagram Primer. Work. Pap. 2005, 1–4.ss. [Google Scholar]
  88. Henry B, M. Nonparametric Tests Against Trend. Econometrica 1945, 13, 245–259. [Google Scholar]
  89. Kendall, M.G. Rank Correlation Methods, 4th ed.; Griffin: London, UK, 1975. [Google Scholar]
  90. Yue, S.; Pilon, P.; Phinney, B.; Cavadias, G. The influence of autocorrelation on the ability to detect trend in hydrological series. Hydrol. Process. 2002, 16, 1807–1829. [Google Scholar] [CrossRef]
  91. Conway, D.; Pereschino, A.; Ardoin-Bardin, S.; Hamandawana, H.; Dieulin, C.; Mahé, G. Rainfall and water resources variability in sub-Saharan Africa during the twentieth century. J. Hydrometeorol. 2009, 10, 41–59. [Google Scholar] [CrossRef]
  92. Sarr, B. Present and future climate change in the semi-arid region of West Africa: A crucial input for practical adaptation in agriculture. Atmos. Sci. Lett. 2012, 13, 108–112. [Google Scholar] [CrossRef]
  93. Nkiaka, E.; Nawaz, N.R.; Lovett, J.C. Analysis of rainfall variability in the Logone catchment, Lake Chad basin. Int. J. Climatol. 2017, 37, 3553–3564. [Google Scholar] [CrossRef] [Green Version]
  94. Barron, E.J.; Moore, G. Climate Models and Their Application. In Climate Model Applications in Paleoenvironmental Analysis; SEPM (Society for Sedimentary Geology): Richmond, VA, USA, 1994; pp. 23–30. [Google Scholar]
  95. Ahmed, K.; Shahid, S.; Wang, X.; Nawaz, N.; Najeebullah, K. Evaluation of gridded precipitation datasets over arid regions of Pakistan. Water 2019, 11, 210. [Google Scholar] [CrossRef] [Green Version]
  96. Pokorny, S.; Stadnyk, T.A.; Lilhare, R.; Ali, G.; Déry, S.J.; Koenig, K. Use of ensemble-based gridded precipitation products for assessing input data uncertainty prior to hydrologic modeling. Water 2020, 12, 2751. [Google Scholar] [CrossRef]
  97. Brohan, P.; Kennedy, J.; Harris, I.; Tett, S. Uncertainty estimates in regional and global observed temperature changes: A new dataset. J. Geophys. Res 2006, 111, D12106. [Google Scholar] [CrossRef] [Green Version]
Figure 1. Map of the Lake Chad basin showing elevation, Lake Chad, climate stations, major river networks, and sub-basins.
Atmosphere 12 01597 g001
Figure 2. Double-mass curves for Lake Chad basin. (a): Cumulative annual precipitation at all stations against base station. (b): Cumulative annual temperature at all stations against base station.
Atmosphere 12 01597 g002
Figure 3. Boxplot of distribution of the similarity coefficients across the Lake Chad basin (a): variation of similarity coefficient of gridded precipitation against observed station data. (b): Variation of similarity coefficient of gridded temperature against observed station data.
Atmosphere 12 01597 g003
Figure 4. Boxplot of statistical metrics in the Lake Chad basin. (a): KGE and md of gridded precipitation against observed station data. (b): KGE and md of gridded temperature against observed station data.
Atmosphere 12 01597 g004
Figure 5. Taylor diagrams for time series data (1979–2012). (a): Annual precipitation of gridded and observed station data (b): Annual temperature of gridded against observed station data. (c): Monsoon precipitation of gridded against observed station data. (d): Monsoon temperature of gridded against observed station data. (e): Premonsoon precipitation of gridded against observed station data. (f): Premonsoon temperature of gridded against observed station data. Blue line is Normalized station deviation, Green line is Pearson correlation coefficient and Red line is Normalized root mean square error.
Atmosphere 12 01597 g005aAtmosphere 12 01597 g005b
Figure 6. Magnitude of linear trends in annual gridded and observed precipitation for the Lake Chad basin (1979–2012).
Atmosphere 12 01597 g006
Figure 7. Magnitude of linear trends in monsoon season gridded and observed precipitation for the Lake Chad basin (1979–2012).
Atmosphere 12 01597 g007
Figure 8. Magnitude of linear trends in annual gridded and observed temperature for the Lake Chad basin (1979–2012).
Atmosphere 12 01597 g008
Figure 9. Magnitude of linear trends in monsoon season gridded and observed temperature for the Lake Chad basin (1979–2012).
Atmosphere 12 01597 g009
Table 1. List of reliable observed temperature stations’ locations and temporal spans in the Lake Chad basin.
S/NoStation NameData RangeMissing Data (%)
1Bilma1950–20198.2
2Bossangoa1954–201635.0
3Bouar1951–201934.7
4Geneina1951–201911.5
5Maiduguri1910–201214.0
6Maina sorda1951–201911.5
7Moundou1951–201634.3
8N’Djamena1951–201926.3
9Ngaoundere1951–201935.2
10Nguigni1953–20195.8
11Sahr1941–201839.3
12Zinder1923–20193.5
Source: [74] http://www.ncdc.noaa.gov/ghcnm/v4.php, accessed on 2 March 2020.
Table 2. List of reliable observed precipitation stations’ locations and temporal spans in the Lake Chad basin.
S/NoStation NameData RangeMissing Data (%)
1Abeche1985–20150.0
2Banda1950–20130.0
3Bongor1950–20130.0
4Bossangoa1950–20130.0
5Doba1950–20130.0
6Maiduguri1979–20100.0
7Moundou1985–20150.0
8N’Djamena1985–20130.0
9Nguigni1968–202015.3
10Potiskum1980–20100.0
11Sahr1950–20130.0
12Samry-I1950–20130.0
13Sategui Deressia1950–20130.0
14Tsanaga1950–20130.0
15Zinder1906–202017.1
Source: ((LCBC) [54], NIMET, GHCN-D http://www.ncdc.noaa.gov/pub/data/ghcn/daily, accessed on 2 March 2020.
Table 3. Summary of gridded datasets considered in this study.
Data ProductVariable(s)Temporal ResolutionData SpanSpatial ResolutionSource
CPCP, Tmax, TminDaily1979–20200.5°Precipitation https://www.esrl.noaa.gov/psd/data/gridded/data.cpc.globalprecip.html, acessed on 5 June 2020
and temperature https://www.esrl.noaa.gov/psd/data/gridded/data.cpc.globaltemp.html, acessed on 5 June 2020
CRU TS v.4.04P, Tmax, TminMonthly1901–20160.5°https://crudata.uea.ac.uk/cru/data/hrg/cru_ts_4.04, acessed on 5 June 2020
PGF v.2P, Tmax, TminDaily1901–20120.5°http://hydrology.princeton.edu/data.pgf.php, acessed on 5 June 2020
GPCC v.2018PMonthly1901–20160.5°http://www.esrl.noaa.gov/psd/data/gridded/data.gpcc.html, acessed on 5 June 2020
UDEL V5.01P TaveMonthly1900–20170.5°https://psl.noaa.gov/data/gridded/data.UDEL_AirT_Precip.html, acessed on 5 June 2020
Table 4. Similarity score of gridded precipitation and temperature against observed datasets estimated by SU.
RankPrecipitation DatasetSUTemperature DatasetSU
1stCRU0.395PGF0.765
2ndGPCC0.387CRU0.725
3rdUDEL0.369UDEL0.722
4thCPC0.367CPC0.709
5thPGF0.365
Table 5. Summary of the performance of statistical metrics of gridded precipitation data against observed data in the Lake Chad basin.
TOTAL MONTHLY PRECIPITATION
STATIONKGEmdNRMSE
CPCCRUGPCCPGFUDELCPCCRUGPCCPGFUDELCPCCRUGPCCPGFUDEL
Abeche0.640.630.520.240.710.890.870.850.620.911.0581.2721.2371.3081.093
Banda0.840.840.800.440.870.930.960.930.730.950.6150.4550.6390.9260.508
Bongor0.710.830.780.320.810.890.950.960.670.950.7060.5270.4681.0730.505
Bossangoa0.800.940.870.380.890.940.980.970.690.970.4090.2440.31s20.8180.298
Doba0.750.770.760.310.780.940.960.960.700.960.4810.4050.3940.9110.401
Maiduguri0.700.830.850.370.440.840.930.930.660.900.9490.6680.7011.1880.888
Moundou0.860.910.940.410.940.950.960.970.710.970.5130.4430.4030.9790.392
N’Djamena0.720.660.610.270.730.900.860.860.620.900.8270.9280.911.2730.79
Nguigni0.480.450.430.130.470.820.840.820.570.811.0971.0341.0661.4211.095
Potiskum0.840.670.620.260.690.750.900.880.620.911.0450.7280.7951.2090.711
Sahr0.580.650.530.230.600.830.860.800.650.830.8260.7110.9010.9650.802
Samry-I0.740.680.780.500.720.890.950.960.810.960.9080.7060.6010.9440.617
Sategui Deressia0.700.600.640.490.510.910.900.910.860.890.7770.8930.810.7060.975
Tsanaga0.810.870.900.400.670.910.960.990.700.960.7040.5030.2931.0690.549
Zinder0.640.630.520.240.710.890.870.850.620.910.8370.8990.9181.2480.772
Mean Value0.720.730.700.330.700.890.920.910.680.920.780.690.701.070.69
Bold values indicate stations where gridded datasets have a better performance.
Table 6. Summary of the performance of statistical metrics of gridded temperature data against observed data in the Lake Chad basin.
AVERAGE MONTHLY TEMPERATURE
STATIONKGEmdNRMSE
CPCCRUPGFUDELCPCCRUPGFUDELCPCCRUPGFUDEL
Bilma0.970.970.980.980.990.990.990.990.0380.0410.0420.038
Bossangoa0.810.800.830.860.900.910.920.910.0370.0350.0330.038
Bouar0.770.730.740.850.830.710.670.890.0540.080.0910.043
Geneina0.810.820.840.930.880.930.930.970.0760.060.0570.043
Maiduguri0.770.760.750.490.920.930.920.680.0640.0590.0630.12
Maina Sorda0.970.970.960.970.990.990.990.990.0330.0260.0260.026
Moundou0.830.850.840.780.900.920.900.840.0520.0460.0540.074
N’Djamena0.920.940.940.930.960.970.960.970.0470.040.0450.042
Ngaoundere0.700.750.730.730.840.850.810.840.0520.0510.0610.053
Nguigni0.980.950.960.980.990.990.990.990.0310.0240.0250.024
Sahr0.870.900.890.860.910.950.930.920.0460.0310.0390.045
Zinder0.990.990.990.981.001.001.000.990.0190.0170.0180.022
Mean value0.870.870.870.860.930.930.920.920.0460.0430.0460.047
Bold values indicate stations where the gridded dataset has a better performance.
Table 7. Mann–Kendall Z-statistics values of linear trends in annual gridded and observed precipitation for the Lake Chad basin (1979–2012).
StationsPrecipitation Trend
OBSERVEDCPCCRUGPCCPGFUDEL
Abeche−1.60−0.852.591.962.232.43
Banda2.020.151.072.050.001.10
Bongor−0.71−1.631.170.151.421.63
Bossangoa0.33−0.820.60−0.530.44−0.53
Doba0.16−1.010.210.590.50 0.33
Maiduguri−2.190.792.252.162.45−1.90
Moundou0.690.261.210.181.010.34
N’Djamena0.672.292.02−0.291.422.54
Nguigni−0.200.712.310.922.022.31
Potiskum1.821.512.510.191.961.28
Sahr0.060.981.192.581.812.11
Samry-I1.91−1.571.160.151.631.63
Sategui D.0.740.771.100.361.411.30
Tsanaga1.130.271.391.751.691.39
Zinder1.601.072.130.652.162.16
% Agreement-66.6773.3360.0066.6773.33
Note: Highlighted bold values indicate significant trends.
Table 8. Mann–Kendall Z-statistics values of linear trends in monsoon season gridded and observed precipitation for the Lake Chad basin (1979–2012).
StationsPrecipitation Trend
OBSERVEDCPCCRUGPCCPGFUDEL
Abeche−1.24−0.380.241.682.392.07
Banda1.071.170.501.07−0.24−0.27
Bongor−0.74−0.951.51−0.091.421.50
Bossangoa0.01−0.470.53−0.920.12−0.83
Doba0.460.830.24−0.060.710.53
Maiduguri−1.991.182.382.252.94−1.80
Moundou0.381.441.32−0.141.240.34
N’Djamena0.752.461.88−0.081.512.42
Nguigni−0.470.532.160.621.962.25
Potiskum1.401.702.690.542.221.28
Sahr0.951.840.671.601.600.39
Samry-I2.11−0.951.51−0.091.431.50
Sategui D.0.361.331.900.242.160.85
Tsanaga0.980.531.711.331.901.07
Zinder1.101.392.080.622.111.96
% Agreement-73.3373.3346.6766.6766.67
Note: Highlighted bold values indicate significant trends.
Table 9. Mann–Kendall Z-statistics values of linear trends in annual gridded and observed temperature for the Lake Chad basin (1979–2012).
StationsTemperature Trend
OBSERVEDCPCCRUPGFUDEL
Bilma3.213.184.283.333.39
Bossangoa1.362.533.753.302.25
Bouar0.502.583.432.651.90
Geneina2.80−1.792.463.212.00
Maiduguri0.372.553.853.073.03
Maina S.3.353.673.613.111.60
Moundou−0.372.653.493.303.86
N’Djamena2.375.193.332.931.75
Ngaoundere1.60−0.023.643.053.83
Nguigni2.992.963.422.952.03
Sahr0.503.253.083.923.41
Zinder2.762.923.733.143.83
% Agreement-75.0091.6791.6791.67
Note: Highlighted bold values indicate significant trends.
Table 10. Mann–Kendall Z-statistics values of linear trends in monsoon season gridded and observed temperature for the Lake Chad basin (1979–2012).
StationsTemperature Trend
OBSCPCCRUPGFUDEL
Bilma2.902.772.713.282.71
Bossangoa1.461.293.333.461.45
Bouar0.791.133.312.151.11
Geneina1.41−2.621.693.381.72
Maiduguri1.590.782.571.452.21
Maina S.1.601.531.890.920.47
Moundou−1.291.072.903.042.98
N’Djamena−0.453.272.612.020.62
Ngaoundere0.50−0.822.661.983.33
Nguigni2.151.762.151.420.52
Sahr−0.820.773.253.311.66
Zinder−0.33−0.501.410.622.17
% Agreement-58.3366.6766.6766.67
Note: Highlighted bold values indicate significant trends.
Table 11. Summary of the best two (or three when the metrics have the same performance) gridded precipitation and temperature datasets across the performance metrics considered in this study.
Performance MetricPrecipitationTemperature
CPCCRUGPCCPGFUDELCPCCRUPGFUDEL
Symmetric Uncertainty-----
Kling–Gupta Efficiency----
Index of Agreement----
NRMSE----
Taylor Diagrams------
Trend Analysis----
Ability across Performance Metrics50%83.3%50%033.3%50%83.3%83.3%16.7%
Publisher’s Note: MDPI stays neutral with regard to jurisdictional claims in published maps and institutional affiliations.

