Article

Evapotranspiration Estimation Using Remote Sensing Technology Based on a SEBAL Model in the Upper Reaches of the Huaihe River Basin

1
Department of Geography and Spatial Information Techniques, Ningbo University, Ningbo 315211, China
2
Ningbo Universities Collaborative Innovation Center for Land and Marine Spatial Utilization and Governance Research, Ningbo University, Ningbo 315211, China
3
Institute of East China Sea, Ningbo University, Ningbo 315211, China
*
Author to whom correspondence should be addressed.
Submission received: 3 November 2021 / Revised: 25 November 2021 / Accepted: 27 November 2021 / Published: 30 November 2021
(This article belongs to the Special Issue The Water Cycle and Climate Change)

Abstract

:
Understanding the spatial and temporal variations of evapotranspiration (ET) is vital for water resources planning and management and drought monitoring. The development of a satellite remote sensing technique is described to provide insight into the estimation of ET at a regional scale. In this study, the Surface Energy Balance Algorithm for Land (SEBAL) was used to calculate the actual ET on a daily scale from Landsat-8 data and daily ground-based meteorological data in the upper reaches of Huaihe River on 20 November 2013, 16 April 2015 and 23 March 2018. In order to evaluate the performance of the SEBAL model, the daily SEBAL ET (ETSEBAL) was compared against the daily reference ET (ET0) from four theoretical methods: the Penman-Monteith (P-M), Irmak-Allen (I-A), the Turc, and Jensen-Haise (J-H) method, the ETMOD16 product from the MODerate Resolution Imaging Spectrometer (MOD16) and the ETVIC from Variable Infiltration Capacity Model (VIC). A linear regression equation and statistical indices were used to model performance evaluation. The results showed that the daily ETSEBAL correlated very well with the ET0, ETMOD16, and ETVIC, and bias between the ETSEBAL with them was less than 1.5%. In general, the SEBAL model could provide good estimations in daily ET over the study region. In addition, the spatial-temporal distribution of ETSEBAL was explored. The variation of ETSEBAL was significant in seasons with high values during the growth period of vegetation in March and April and low values in November. Spatially, the daily ETSEBAL values in the mountain area were much higher than those in the plain areas over the study region. The variability of ETSEBAL in this study area was positively correlated with elevation and negatively correlated with surface reflectance, which implies that elevation and surface reflectance are the important factors for predicting ET in this study area.

1. Introduction

Surface evapotranspiration (ET) as a crucial part of energy transfer, has an important impact on the growth and development of plant roots [1,2]. ET in this case becomes an important implication for drought monitoring and assessment for large areas and, particularly, irrigated agricultural areas [3]. Global warming leads to changes in the hydrological cycle, which lead to the rise in frequency of drought and floods [4]. The Huaihe River Basin (HRB) is an area affected severely by drought, and is very important crop-producing area of China. The reliable and consistent estimation of spatial and temporal distribution of ET over this region is of great importance in managing water resources for crops.
Since direct measurement of ET is time consuming, costly and difficult, traditionally, ET was estimated indirectly from climatic variables such as solar radiation, air temperature, wind speed, and relative humidity at meteorological stations [5,6]. A number of methods are available for ET estimation. The Penman-Monteith (P-M) equation [7] as reported by Allen has been widely used to estimate grass ET under different climatic conditions and also adopted as the standard method for definition and computation of ET [8]. Using the P-M equation, Djaman et al. [9] estimated the grass-reference ET in Sahelian conditions and indicated that its performance was not good when only temperature data is available. Sensitivity of P-M method in estimating ET with climatic variables for different climate regions in India was examined by Debnath [10], and results showed that the sensitivity of ET to the climate variables had considerable spatial and temporal variation. This method requires a full climate dataset that is not always available at all weather stations, especially in most of the developing countries. In recent years, the water balance method has been widely used for estimation of basin-scale ET. For example, using the water balance method, Liu et al. [11] calculated the reference annual ET for 35 global river basins to evaluate the performance of nine products in ET estimation. Xue et al. [12] estimated ET with the water balance method for the upper Yellow River and Yangtze River basins on the Tibetan Plateau. The Turc equation is another one of the simplest empirical equations used to calculate reference ET under humid conditions [13]. However, this method generally underestimates ET values at windy humid locations while overestimates ET at windless humid locations. Other methods such as the Priestley-Taylor method, Irmak-Allen method, and Jensen-Haise method (J-H) have been widely used in previous studies to estimate the ET over different regions in the world [14,15,16]. However, due to the difficulties in gathering all of the necessary climate variables, and the sparse network of point observations can present serious limitations for these methods.
In addition, ET has high spatial heterogeneity and temporal variability due to the wide spatial variability of its factors, such as precipitation, solar radiation, air temperature, hydraulic characteristics of soils, elevation, surface temperature, and vegetation types [17]. Groundwater evaporation and soil evaporation are the main sources of ET [18]. Shah et al. [19] proposed that nearly all ET was from the surface within 0.5 m. ET is the main mechanism of groundwater consumption [20], and an exponential relationship is more reasonable than a linear one [21]. ET is strongly correlated with soil moisture in areas with poor vegetation coverage [22] and is sensitive to temperature, atmospheric humidity, solar radiation and wind speed, and their seasonal variations [23]. Based on this, it is necessary to clarify the characteristics of the natural environment that affect ET, and to quantify the correlation between impact factors and ET to provide guarantees for agricultural production and food security.
Accurate information on the spatial and temporal variability of ET plays a crucial role in integrated water resources planning, development and management, especially in agriculture areas. To address the limitation of ET estimation from ground-based observations, a number of global ET products have been derived in recent years, including remote sensing-based products. An alternative approach is to estimate ET on local, regional and global-scales by combining surface parameters derived from remote sensing data with surface meteorological variables and vegetation characteristics [24]. Different remote sensing sensors on different platforms including Landsat, the Moderate Resolution Imaging Spectroradiometer, the Advanced Very High-Resolution Radiometer, the Visible Infrared Imaging Radiometer Suite, and the Advanced Spaceborne Thermal Emission and Reflection Radiometer can provide multispectral data with various temporal and spatial resolutions to estimate ET over large areas [25]. A number of models have been proposed for estimating ET by using remotely sensed data, e.g., the Surface Energy Balance Algorithm for Land Model (SEBAL) [25,26], Mapping Evapotranspiration at High Resolution with Internalized Calibration (METRIC) [27], the Simplified Surface Energy Balance Index (SSEBI) [28], the Surface Energy Balance System Model (SEBSM) [29,30], and the Surface Energy Balance Algorithm for Land-Improved (SEBALI) [31,32]. The use of remote sensing to estimate ET has been tested successfully in different climate regions of the world. For example, Wagle et al. [33] indicated that SSEBI, SEBAL and SEBS performed reasonably well for estimating daily ET over a high biomass sorghum field during the 2012 and 2013 growing seasons. Xue et al. [34] found the daily RS-based ET for crops in the Central Valley of California from METRIC, SEBS and SEBAL models were within acceptable levels of uncertainty and agreed well with surface renewal estimates. Comparing the ET derived from the remote sensing-based ET estimation models against conventional ET estimation techniques, review studies by Karimi and Bastiaanssen [35] indicated that annual and seasonal remote sensing-based ET estimates had an acceptable mean absolute percentage error ranging from 1% to 20%, with an average of 6%. SEBALI, an enhanced version of SEBAL, was used to estimate ET for different climatic regions in different countries, and results showed it can provide good ET estimations [31,32]. Multi-year remote sensing-based global actual ET datasets have been produced by combining different algorithms with recent advancements in satellite remote sensing technologies [36]. Examples of such datasets include the Moderate Resolution Imaging Spectrometer (MODIS) MOD16, and this product has been widely used in ET assessment at different scales [37,38]. Many land surface hydrological models are also used to estimate ET, i.e., the Soil and Water Assessment Tool (SWAT) and Variable Infiltration Capacity (VIC). Jiang et al. [39] demonstrated the success of using the VIC to simulate ET in the Loess Plateau.
SEBAL is a physically based ET estimation model developed by Bastiaanssen [26] that estimates ET across different ecosystems as a term of the instantaneous surface energy balance using remote sensing data and local meteorological data. Moreover, it has fewer requirements for concurrent ground-level observations [40]. In this study, the SEBAL model was applied to estimate the spatial and temporal variation of ET in the upper reaches of the Huaihe River Basin. Three Landsat-8 images were used for this purpose, as well as meteorological data. Moreover, four theoretical methods, the Penman-Monteith (P-M), Irmak-Allen (I-A), Turc, and Jensen-Haise methods (J-H) were also used to validate the results of the SEBAL model. In addition, we explored the impacts of the underlying surface and atmospheric environment on spatial distribution of ETSEBAL. The findings provide a scientific basis for rational development and utilization efficiency of water resources in the study region.

2. Materials and Methods
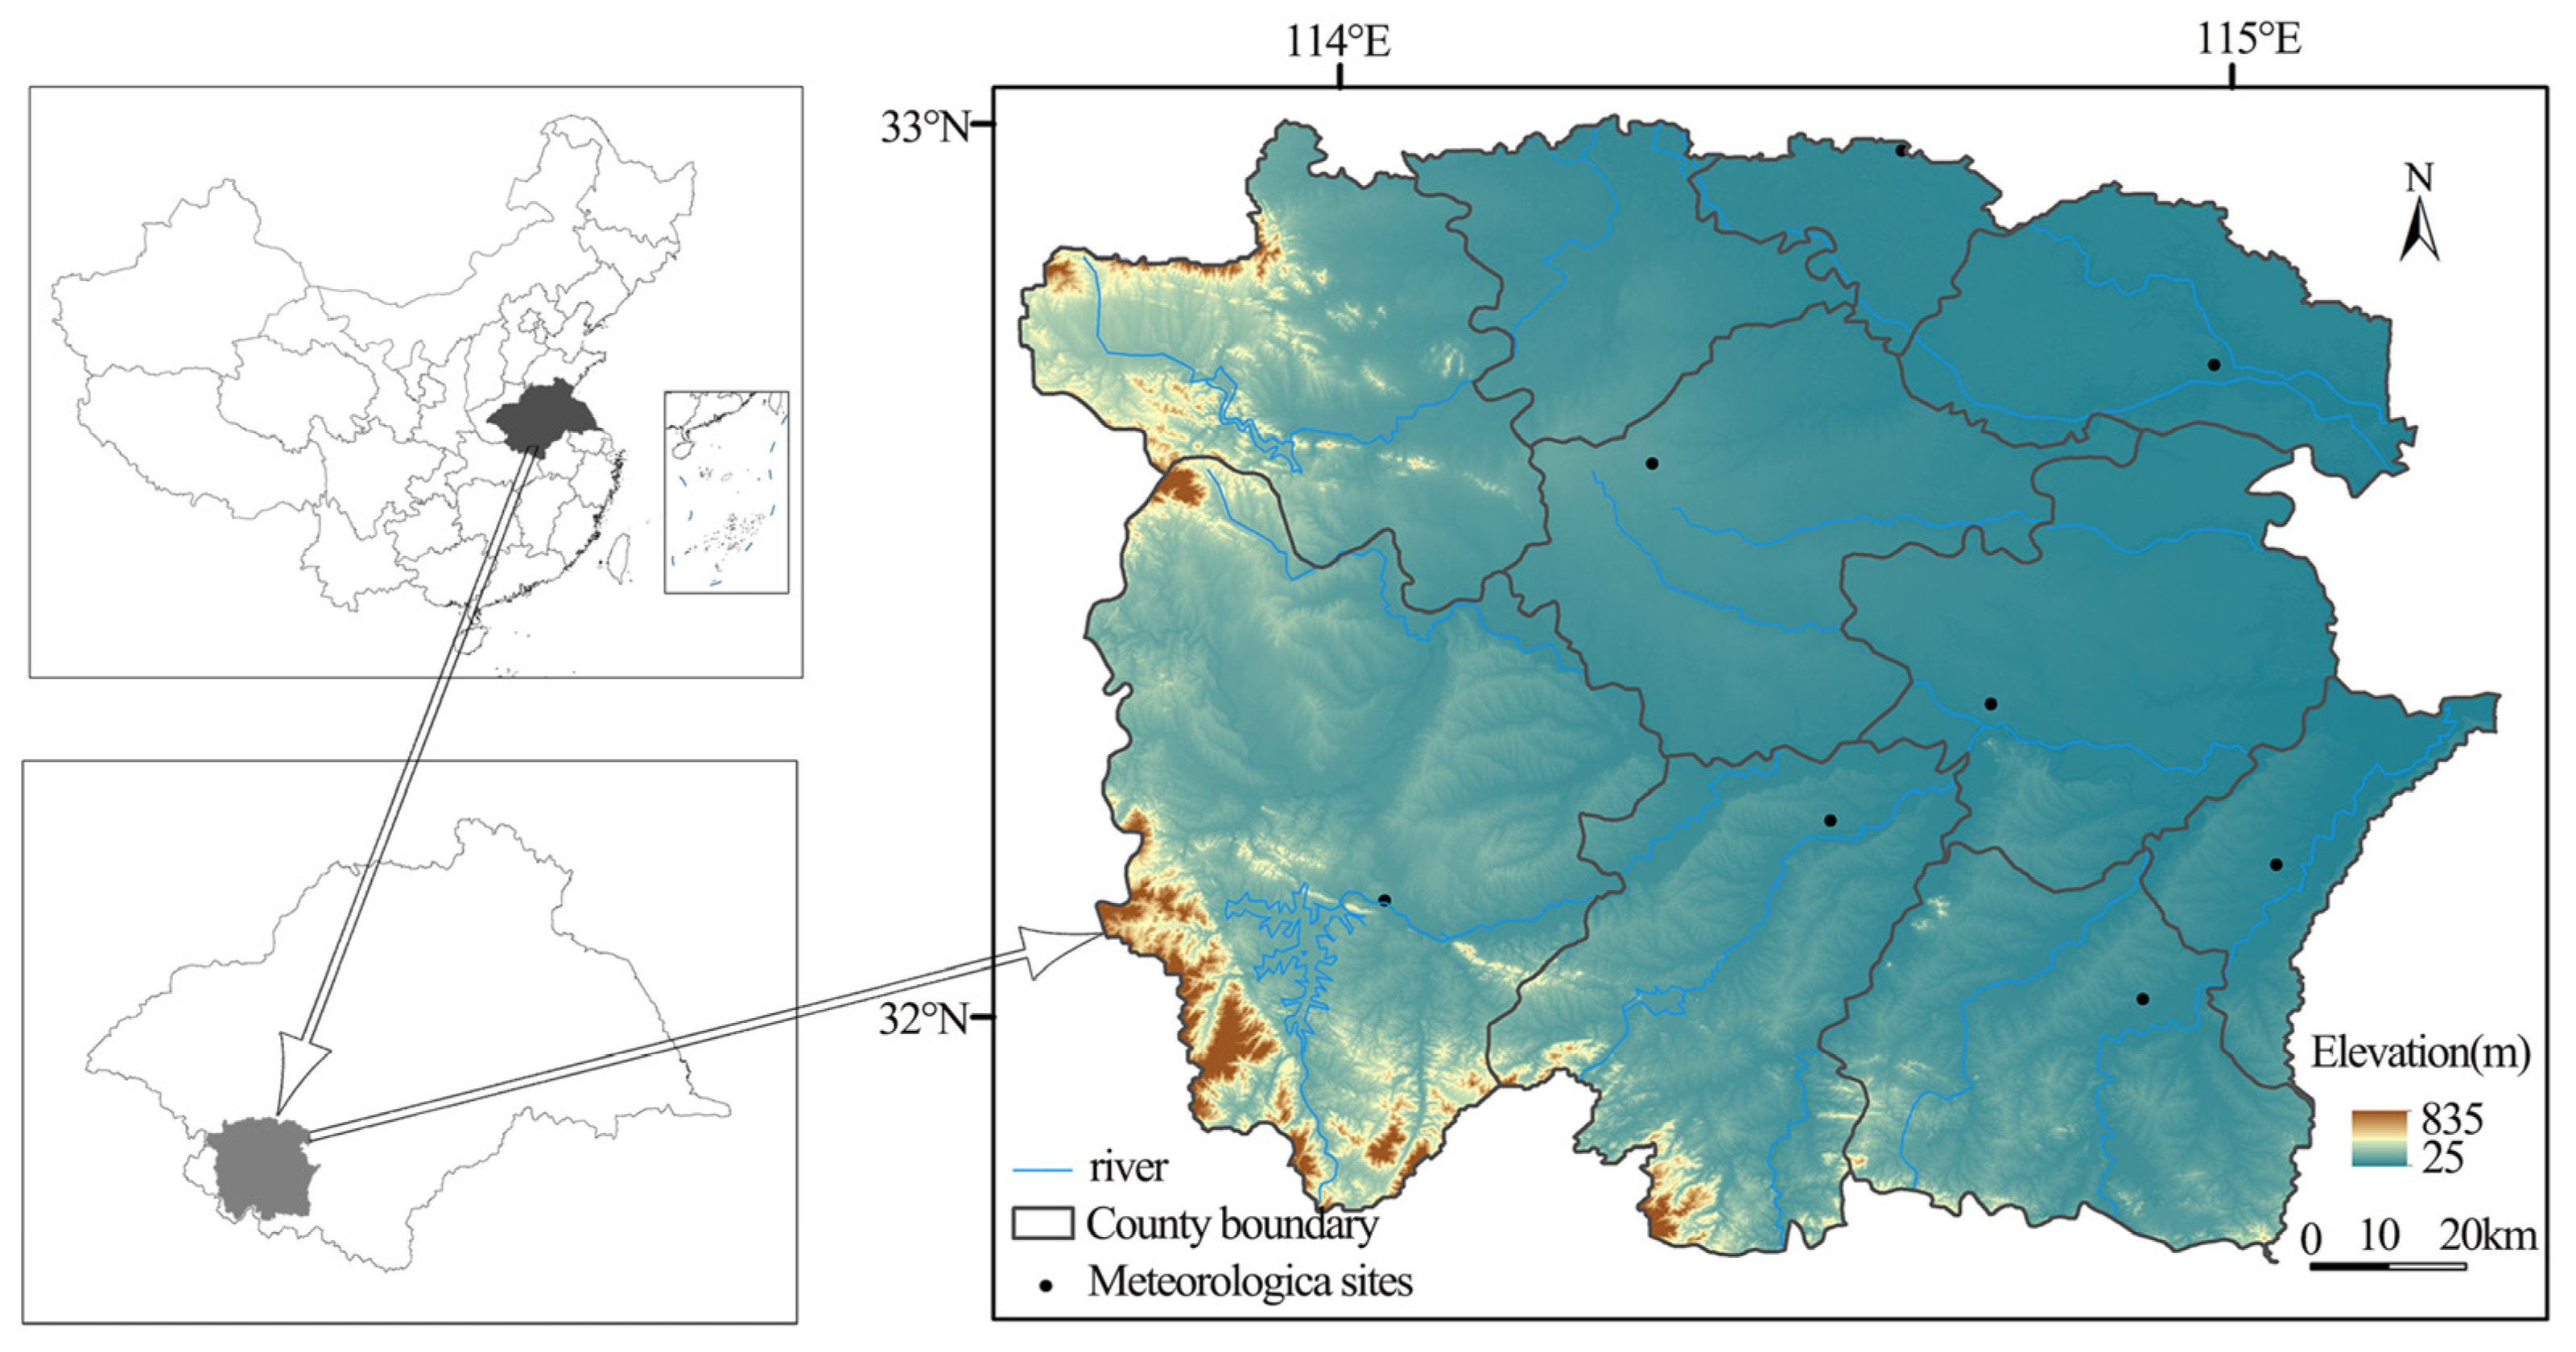
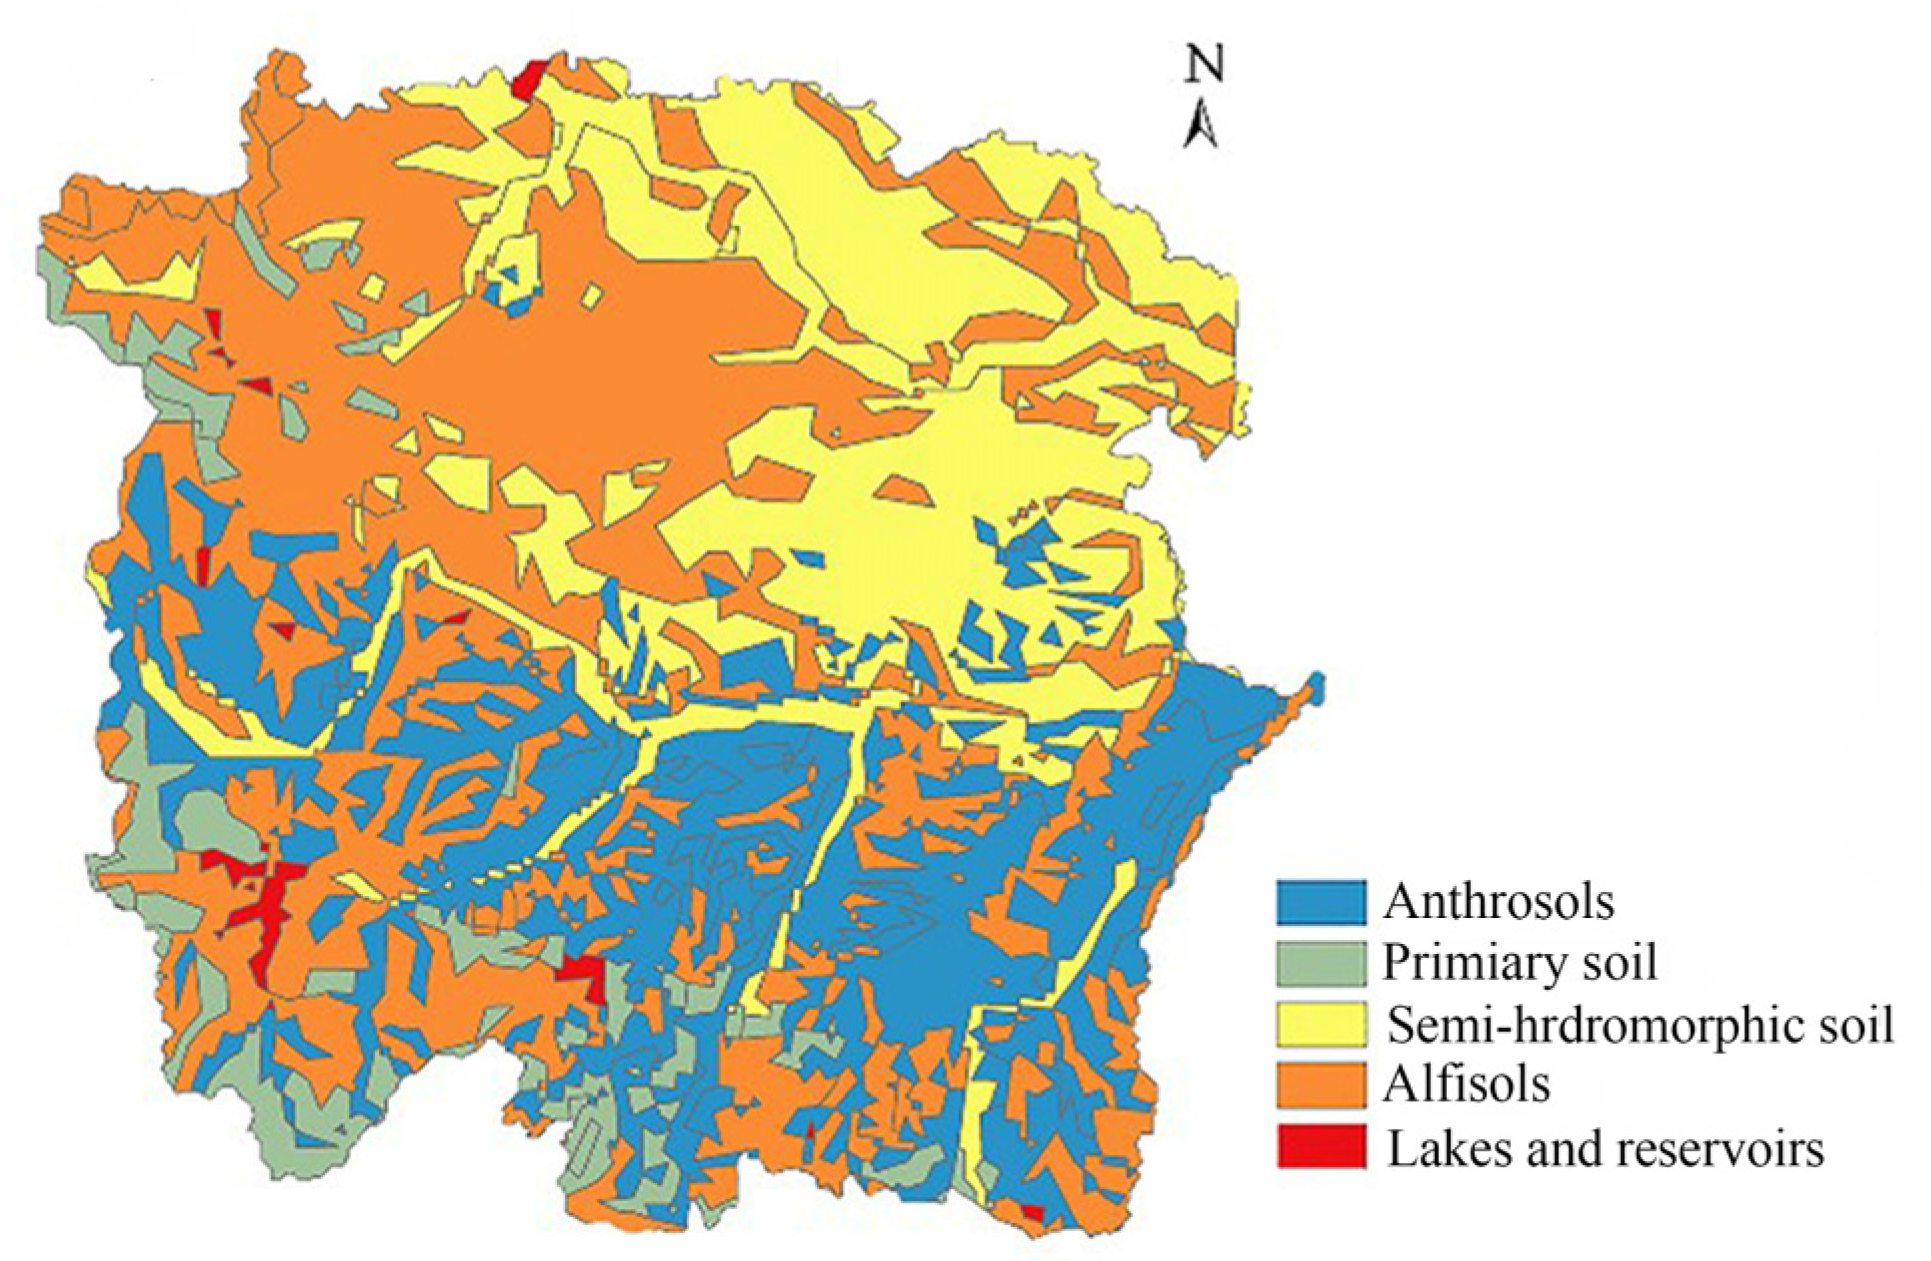
2.1. Study Area

The Huaihe River is an important geographical dividing line in China and a transition belt between southern and northern parts (Figure 1) [41]. The north region of the Huaihe River is located in a warm-temperate zone, and the south is located in a north subtropical zone [42,43], The various soil types are dominated by alfisols, anthrosols, lakes and reservoirs, with primary soil and semi-hydromorphic soil. Hydrothermal conditions play an essential role in the growth of crops, and the overall environment is suitable for the crops to grow on. The field near the Huaihe River Basin (HRB) is fertile mainly yielding wheat, maize, and potatoes, and is one of China’s grain production areas [44]. The study area in the upper reaches of the HRB is approximately 3.1 × 10⁴ km2, surrounded by numerous rivers and tortuous topography.

2.2. Data Source

Data were derived from the National Meteorological Science Data Center (http://data.cma.cn/data/cdcdetail/dataCode/A.0012.0001.html, accessed on 1 July 2020), including daily temperature, precipitation, and wind speed. Geographic data including DEM, and soil types were extracted from the Geospatial Data Cloud Platform of the Chinese Academy of Sciences (http://www.gscloud.cn, accessed on 5 March 2020) and the Food and Agriculture Organization of the United Nations, FAO (http://www.fao.org/home/zh/, accessed on 29 June 2020). Landsat-8 satellite remote sensing data (Table 1) were downloaded from the Geospatial Data Cloud (http://www.gscloud.cn, accessed on 30 June 2020) for operation of SEBAL. The results of the atmospheric scattering correction were tested before the calculation. Two remote sensing images were mosaiced together to generate the final image for the study area and the percentage of cloud cover area for each remote sensing image on a given day was calculated (Table 1).
A remote-sensing ET product from the MODerate Resolution Imaging Spectrometer (MOD16) downloaded from Google Earth Engine (https://developers.google.com/earth-engine/datasets/catalog/MODIS_006_MOD16, accessed on 19 November 2021) was also used in this study. MOD16 is a global terrestrial ET from earth land surface that represents all evaporation from the soil and wet surfaces, as well as the transpiration from vegetation. The MOD16 ET (ETMOD16) datasets were estimated using Mu et al. [37] with an improved ET algorithm over the previous Mu et al. [45] paper. The algorithm used for the ETMOD16 is based on the Penman-Monteith(P-M) equation [46,47]. ET simulated from Variable Infiltration Capacity (ETVIC) for eight stations used in this study was calculated by Luo, and the details of the calculation of the ETVIC can be found in Luo’s thesis [48].

2.3. Method

2.3.1. Calculation and Calibration of Each Component in the SEBAL Model

Using a Surface Energy Balance Algorithm for Land (SEBAL) algorithm to estimate the ET has obtained high accuracy in many case studies, and is currently the most reasonable and accurate method of estimating surface ET [49,50]. Zwart et al. [51] proposed SEBAL based on an equation of surface energy balance as follows:
Rn = H + G + λET
where H is sensible heat flux, λ is the coefficient of latent heat in water vaporization, Rn is the net radiation, G means the soil heat flux, and λET is the latent heat flux. Remote sensing data obtained were recorded instantaneously, so the time format of ET is instantaneous. Daily ET in 24 h was calculated by the equation (F = RnG) because the ratio of ET was constant.

Parameter Adjustment of Surface Net Radiation (Rn)

Equations for surface net radiation are as follows:
R n = ( 1 a ) R s + R L R L ( 1 e ) R L
R s = G S C × c o s ( θ ) × t s w d r 2  
R L = ε a σ T a 4  
R L = e s T s 4  
ε a = 1.08 ( l n τ s w ) 0.265
T a = 16.0110 + 0.9261 T a i r  
where α is the surface reflectance, R s  is the downward solar radiation, R L  is the downward long-wave radiation, R L  is the upward long-wave radiation, G S C  is the solar constant (1367 W/m2), ε is land surface emissivity (W/m2), s is the value of Stefan-Boltzmann constant which is approximately 5.67 × 10⁻⁸ W/m2/K4, and T a  is the temperature (K) of kinetics on the object surface. In the equation, the effect of elevation on temperature should be considered in the process of retrieving the surface temperature. The temperature declines 0.6 °C for each 100 m rise in elevation, with the relation T S = T S 1 0.6 DEM. The weight coefficient ( C λ ) of bands was used to calculate surface reflectance (Table 2).

Parameter Adjustment of Soil Heat Flux (G)

While calculating the soil heat flux to simulate the water and heat fluxes, NDVI was used to analyse the bands and extract the basin in study area.
G = T s 273.15 a [ 0.0032 × a c 11 + 0.0062 × ( a c 11 ) 2 ] × ( 1 0.978 N D V I 4 ) × R n
where c 11 is the effect of satellite crossing time on soil heat flux. If the satellite passes overhead at 12:00, the value of c 11 should be 0.9. The values of c 11 are 1.0 and 1.1 respectively when the satellite crossing time is in the range of 12:00–14:00 and 14:00–16:00.

Sensible Heat Flux

Sensible heat flux is derived by:
H = r a i r × C p a i r × ( T z 1 - T z 2 ) r a h
where rair is air density (k/m3), Cpair is the specific heat of air (1004 J/kg/K), T Z 1 is the temperature at height Z1 (when Z1 = 0.01 m, it is equivalent to the roughness of bare land), T Z 2 is the temperature at Z2 height (when Z2 = 2 m, this is the reference level of meteorological data) and rah is the aerodynamic resistances. (s/m).

Calculation of Daily Evapotranspiration (ET24)

Instantaneous evapotranspiration (ETinst) and latent heat flux (λET) in study region were calculated by Equations (1)–(9).
λ E T = R n H G
E T inst = R n H G λ  
E T 24 = 86400 × Λ inst ( R n 24 - G 24 ) λ  
where R n 24 is the net radiation in 24 h, G 24 is total soil heat flux in one day, λ is the latent heat in water vaporization, and Λ inst is the ratio of evapotranspiration.

2.3.2. Calculation Method for Reference Evapotranspiration ET

FAO-56 Penman-Monteith Method

The FAO-56 Penman-Monteith approach (P-M) is recommended as the standard method for correctly predicting reference evapotranspiration (ET0) [8], and is expressed in Equation (13) below:
E T 0 = K c 0.408 Δ ( R n G )   ϒ 900 T + 273 u 2 ( e s e a ) Δ + ϒ ( 1 + 0.34 u 2 )
where K c represents the value for the crop coefficient, e s is the saturation vapor pressure (kPa), e a is the actual vapor pressure (kPa), Δ is the slope vapor pressure curve, γ is the psychrometric constant (kPa/°C), and u 2 is the wind speed at 2 m height.

Irmak-Allen Method

The Irmak-Allen approach (I-A) was deduced by the data from humid district in Eastern America.
ET0 = K (1 + 0.591Rn + 0.047T)
where R n is the net solar radiation, T is the mean temperature (°C), and the empirical constant of K is 0.489 [52]. The adjusting for the value of K depends on the situation, and was adjusted to 0.2589 in October.

Turc Method

The Turc formula for daily ET calculation is given by Equation (15):
E T 0 = K [ 23.88 × ( 0.25 + 0.5 n N ) R a + 50 ] × T ( T × 15 )
where n is the actual duration (h) of sunshine in a day, N is the astronomic possible sunshine duration (h), T is the mean daily air temperature (°C), the empirical constant of K is 0.013 [53]. The adjusting for the value of K depends on the different months (Table 3).

Jensen-Haise Method

The Jensen-Haise model (J-H) is used in computing ET0 by sampling and observing the soil, which is based on the Equation (16):
E T 0 = K ( 0.0225 T 0.075 ) × 0.408 × ( 0.25 + 0.5 n N ) R a
All the variables in the Jensen-Haise method are the same as in the Turc method. The empirical constant of K is 0.87 [54]. The adjusting for the value of K depends on the different months (Table 4).
Considering the effect of climate in different months, the empirical constant of K in I-A method, Turc method and J-H method used the approach by Qin et al. [55] to build an equation of daily linear regression. The positive multiples of K had to be found to adjust values of K in equations by each month.

2.3.3. Partial Correlation Analysis

A partial correlation coefficient is usually used to quantify the strength and linear direction of the relationship between two variables when conditioning on one or several other variables known as control variables of covariates [56]. A univariate analysis was most likely not appropriate as the variables could be strongly linked to each other [57]. Therefore, a partial correlation analysis was used in this study to investigate the correlation between ETSEBAL and one of the four environment variables after removing the effects of the other three variables.
In this study, ENVI (The Environment for Visualizing Images, EVIS, USA), MATLAB (Matrix & Laboratory, MathWorks, Natick, MA, USA), ArcGIS (ESRI, West Redlands, CA, USA), and SPSS (Statistical Product and Service Solutions, IBM, Palo Alto, San Francisco, CA, USA) software were used. MATLAB was used to construct SEBAL. ArcGIS software and ENVI software were used to process remote senses data. MATLAB and the SPSS software were used for numerical calculation and analysis.

3. Results

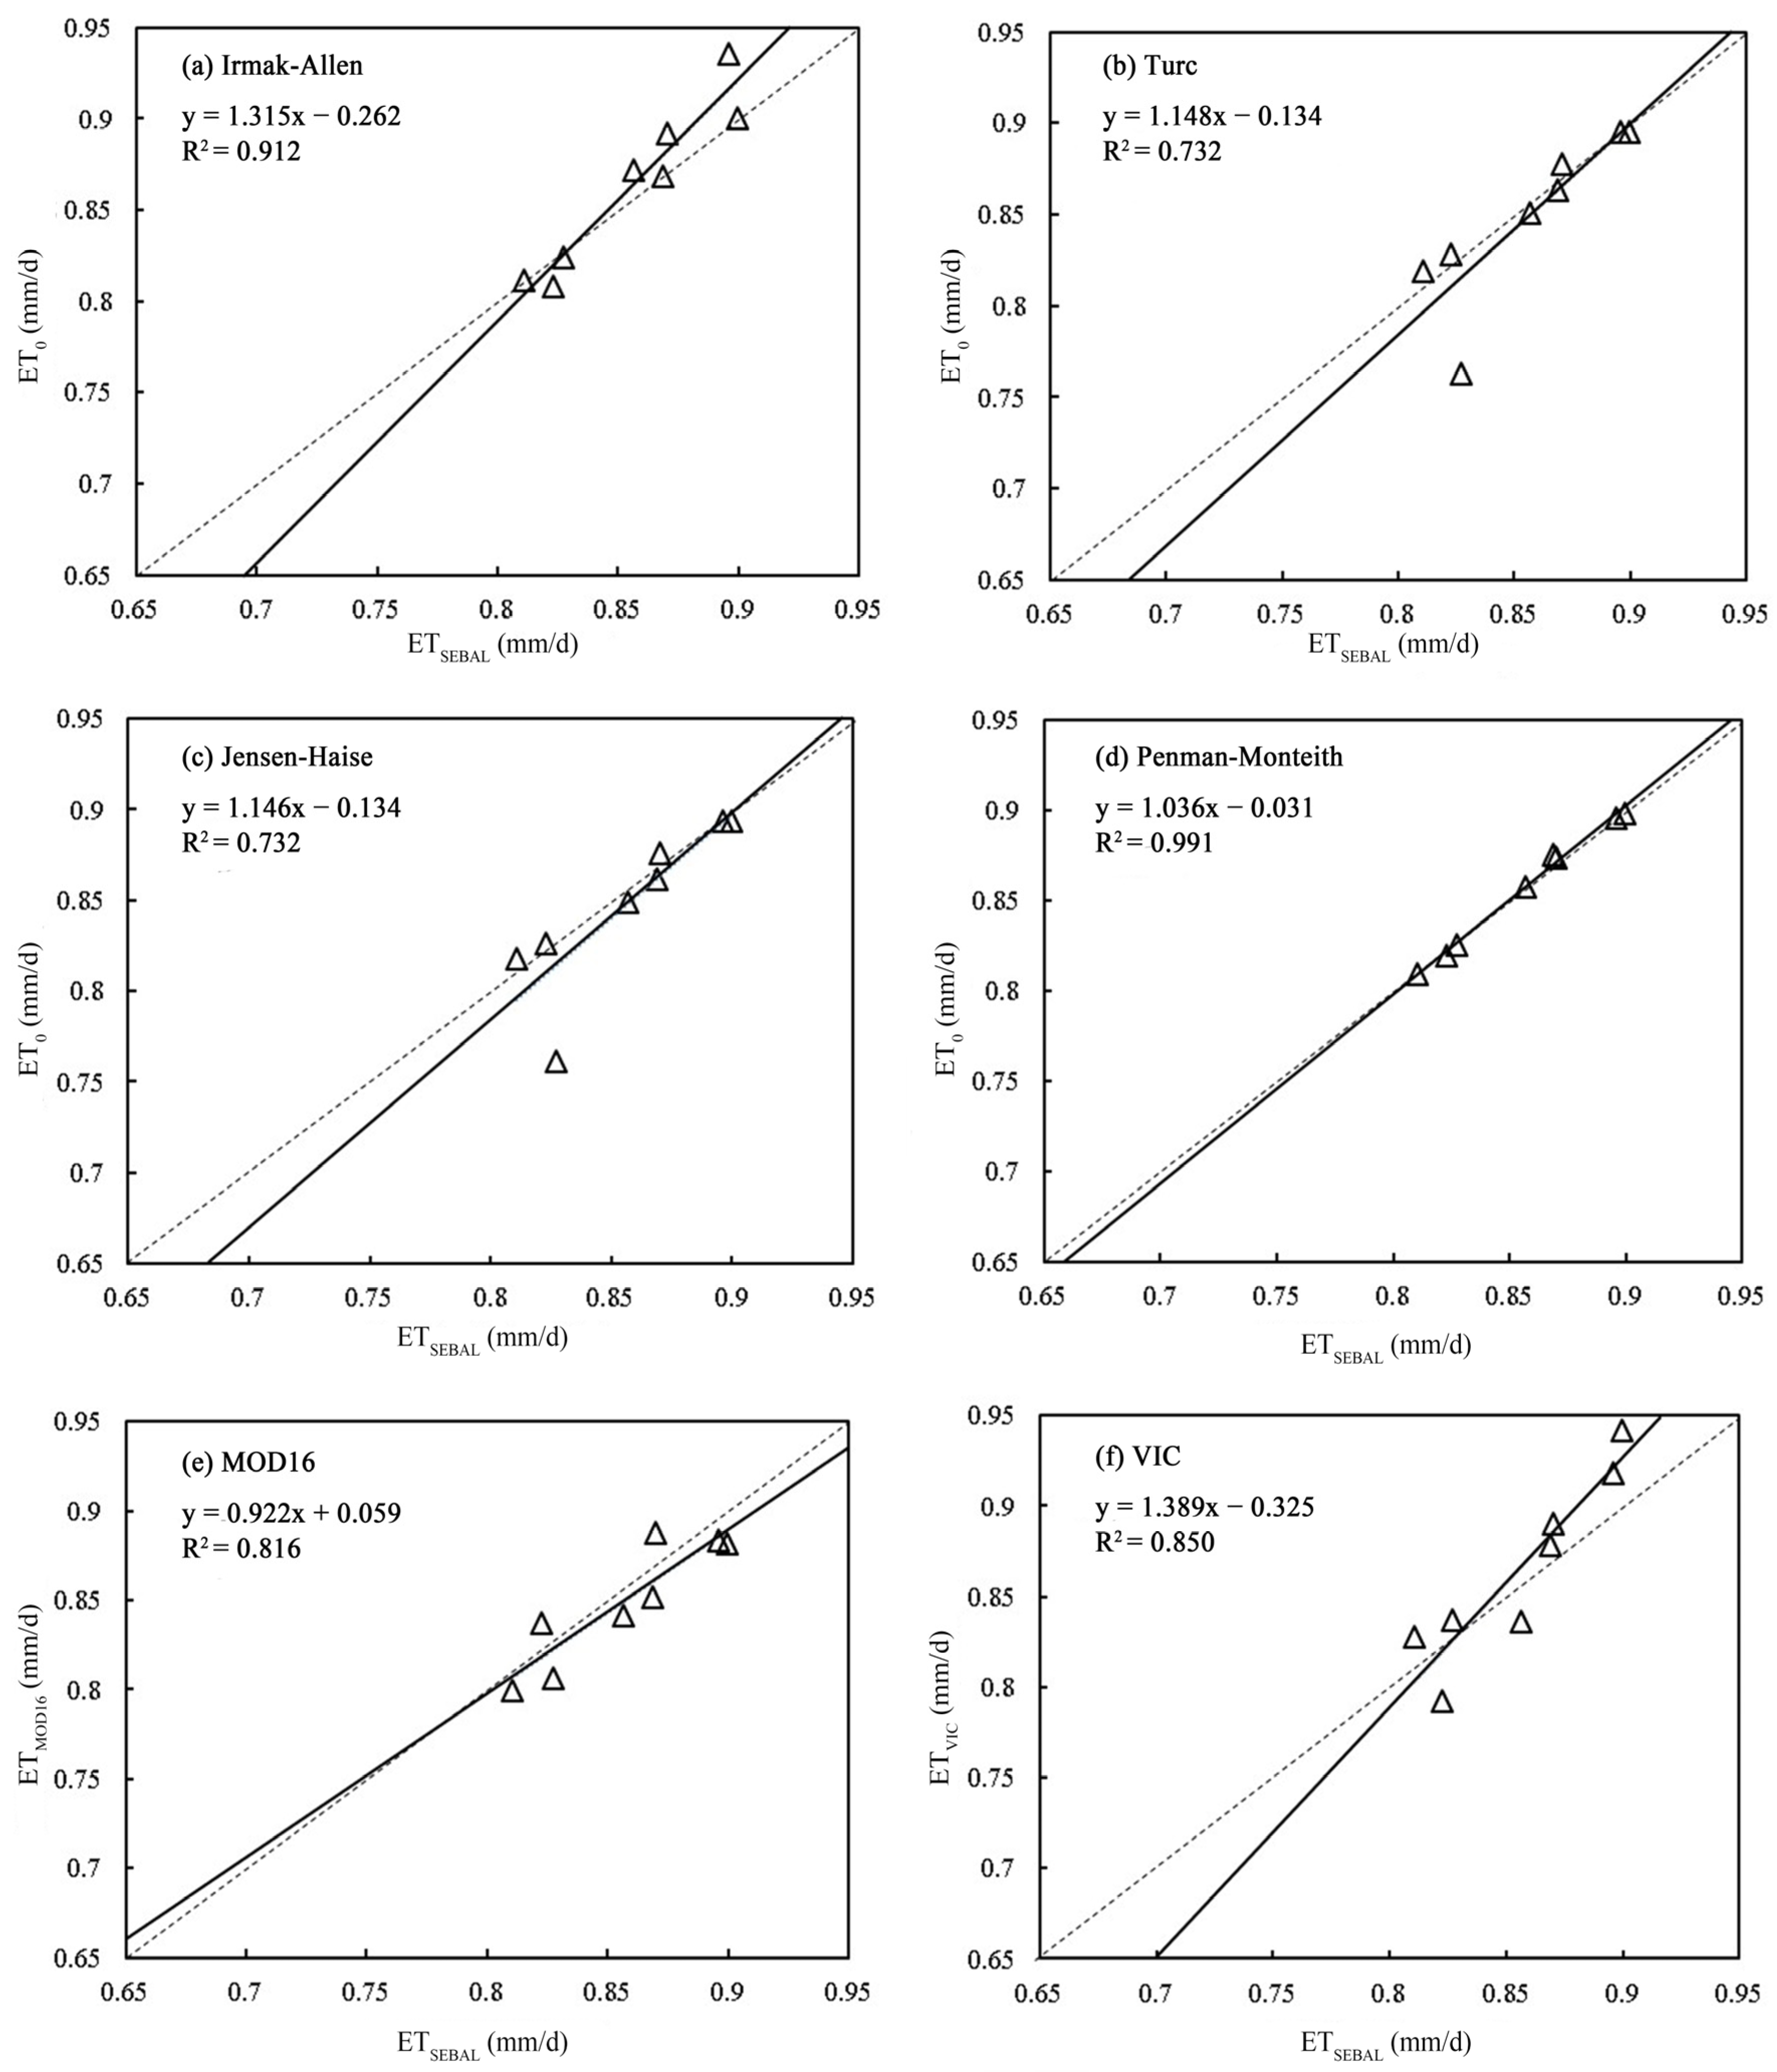
3.1. Comparative Analysis of Evapotranspiration Estimation

Daily evapotranspiration values obtained using the SEBAL model (ETSEBAL), VIC model (ETVIC), four theoretical (P-M, I-A, Turc, and J-H) methods (ET0) and remote sensing ET (ETMOD16) for eight stations on 20 November 2013 (mm/d) over the study region are shown in Table 5, and comparisons for ETSEBAL are made with ET0, ETVIC and ETMOD16 (Table 6). The correlations among ET0, ETVIC and ETMOD16 against the SEBAL model estimates were analyzed using the linear regression equation (Figure 2), where the x axis represents daily ETSEBAL estimated by the SEBAL model the y axis represents the daily ET0, ETVIC and ETMOD16. The coefficient of determination (R2) has been widely used to evaluate the goodness of fit of evapotranspiration equations [5]. Intercepts (b) and slopes (a) for the least squared regression analysis were calculated and reported. Moreover, in order to obtain a quantitative evaluation, additional statistical measures, mean bias error (MBE) and root mean square error (RMSE), between ETSEBAL and each four ET0, ETVIC and ETMOD16 values, were calculated (Table 6). MBE describes the bias and the RMSE expresses the average difference. MBE and RMSE values are preferably close to 0.
As demonstrated in Figure 2 and Table 6, the daily ETSEBAL from the SEBAL model correlated very well with ET0, ETVIC and ETMOD16. According to the regression equation, there were high determination correlation values (R2) of 0.991 and 0.912 between daily ETSEBAL and ET0 computed from P-M and I-A methods, respectively, while the R2 value between ETSEBAL and ET0 computed from Turc and J-H methods was relatively lower at about 0.732. The R2 between ETSEBAL and ETVIC (ETMOD16) was 0.816 (0.850), and well correlated as can be seen by slopes close to 1 with low value of intercepts. The slopes (intercepts) were 1.315 (−0.262), 1.418 (−0.134), 1.146 (−0.134) and 1.036 (−0.031) for I-A, Turc, J-H and P-M methods, respectively. The slopes (intercepts) were 0.922 (0.059) and 1.389 (−0.325) for ETMOD16 and ETVIC, respectively. In addition, MBE and RMSE were close to 0. The error in daily ET estimation by SEBAL was less than 1.5% compared to the four theoretical methods. In general, we can see the SEBAL model provided good estimations in the daily evapotranspiration over the study region.

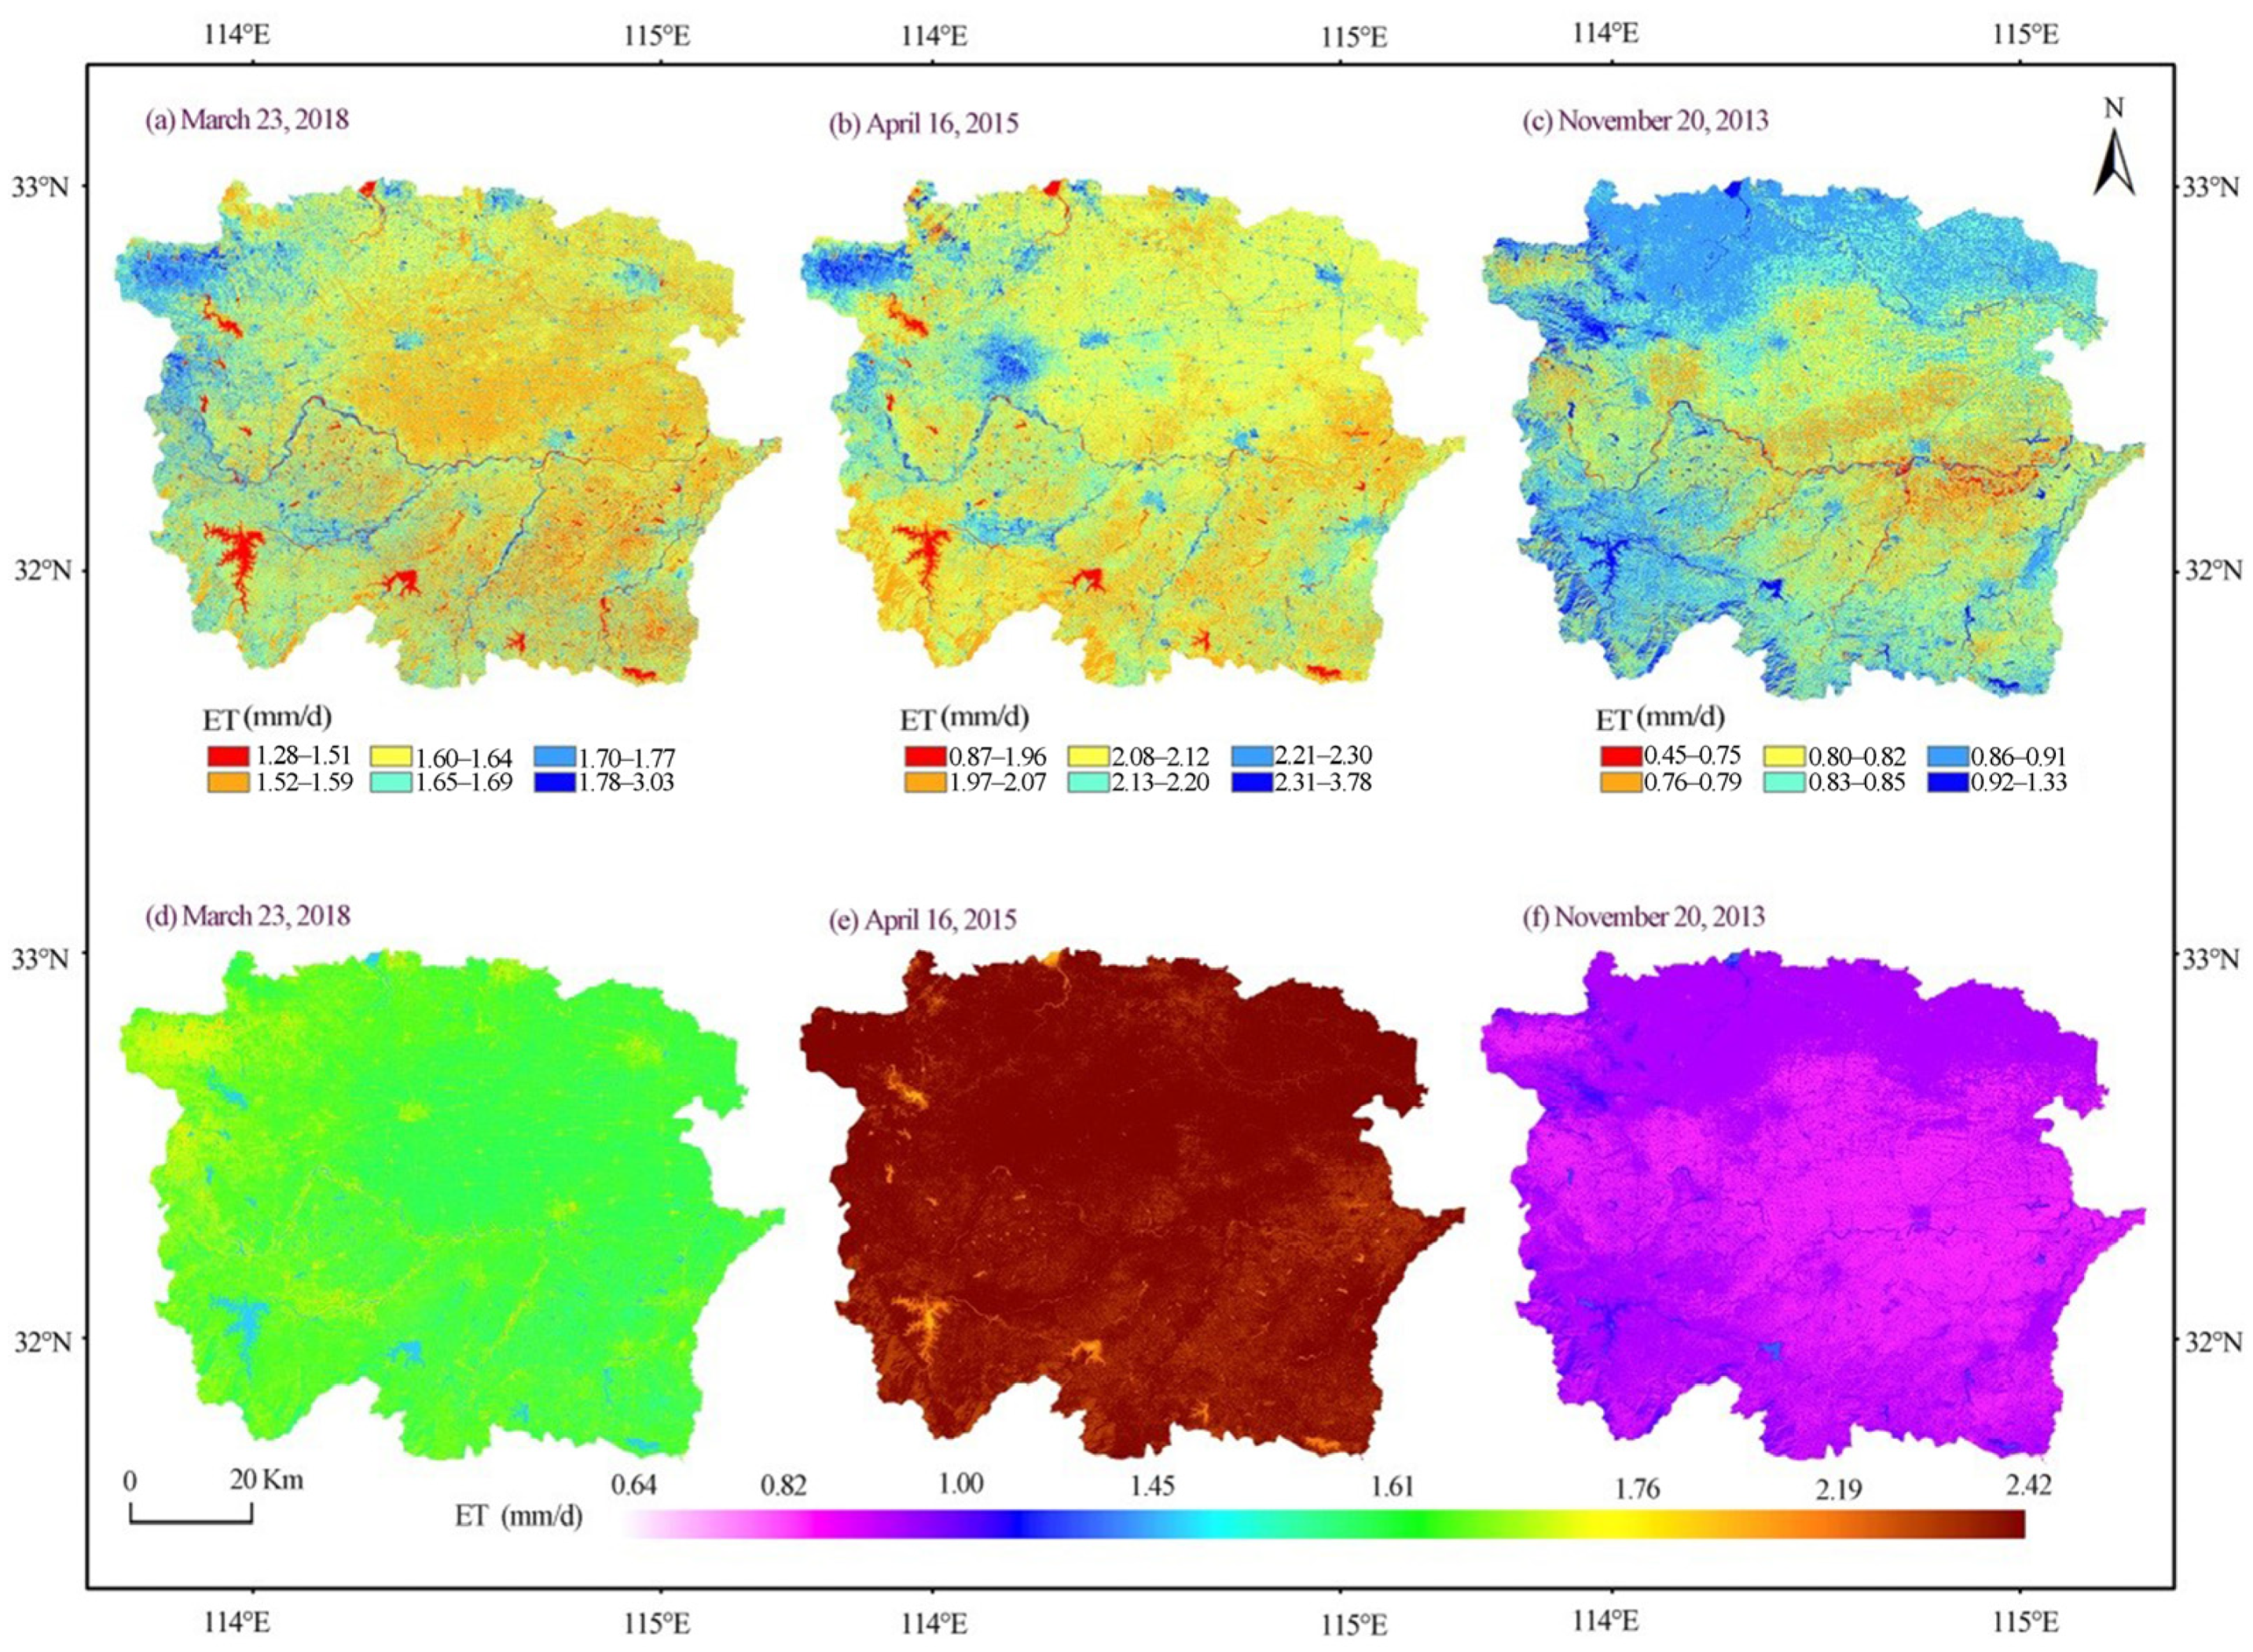
3.2. Spatio-Temporal Distribution of Daily Surface Evapotranspiration

Understanding the spatial and temporal variations of evapotranspiration is critical for regional hydrology, agricultural water requirements, irrigation planning and water resources management over the study region [58]; thus, the spatio-temporal distribution of ETSEBAL in the study area was analyzed (Figure 3). It can be seen that the values of ETSEBAL over the study region had distinctive seasonal variations. The values of ETSEBAL for the study region were less in winter and higher in spring. The ETSEBAL for the entire region on average was less in November, at 0.84 mm/d, with a spatial range of 0.45 to 1.33 mm/d (Figure 3c,f), higher in March at 1.62 mm/d with a range of 1.28 to 3.03mm/d (Figure 3a,d), and very higher in April at 2.11 mm/d with a range of 0.87 to 3.78 mm/d (Figure 3c,f). The ETSEBAL was great during the growth period of the vegetation. The increase in temperature from November to April may make a contribution to the increase in evapotranspiration from winter (November) to spring (March, April). In terms of spatial patterns, the highest ETSEBAL values were located in the far western and southwestern mountain area, whereas the ETSEBAL values in middle and north of the study region, which are mostly composed of plains, were relatively low. Evapotranspiration exhibited large spatial variability at global and regional scales [59,60,61], which was affected by multiple factors such as underlying surfaces and the atmospheric environment [62,63]. The possible influencing factors on the observed characteristics of ETSEBAL over study region are examined in the Section 3.3.

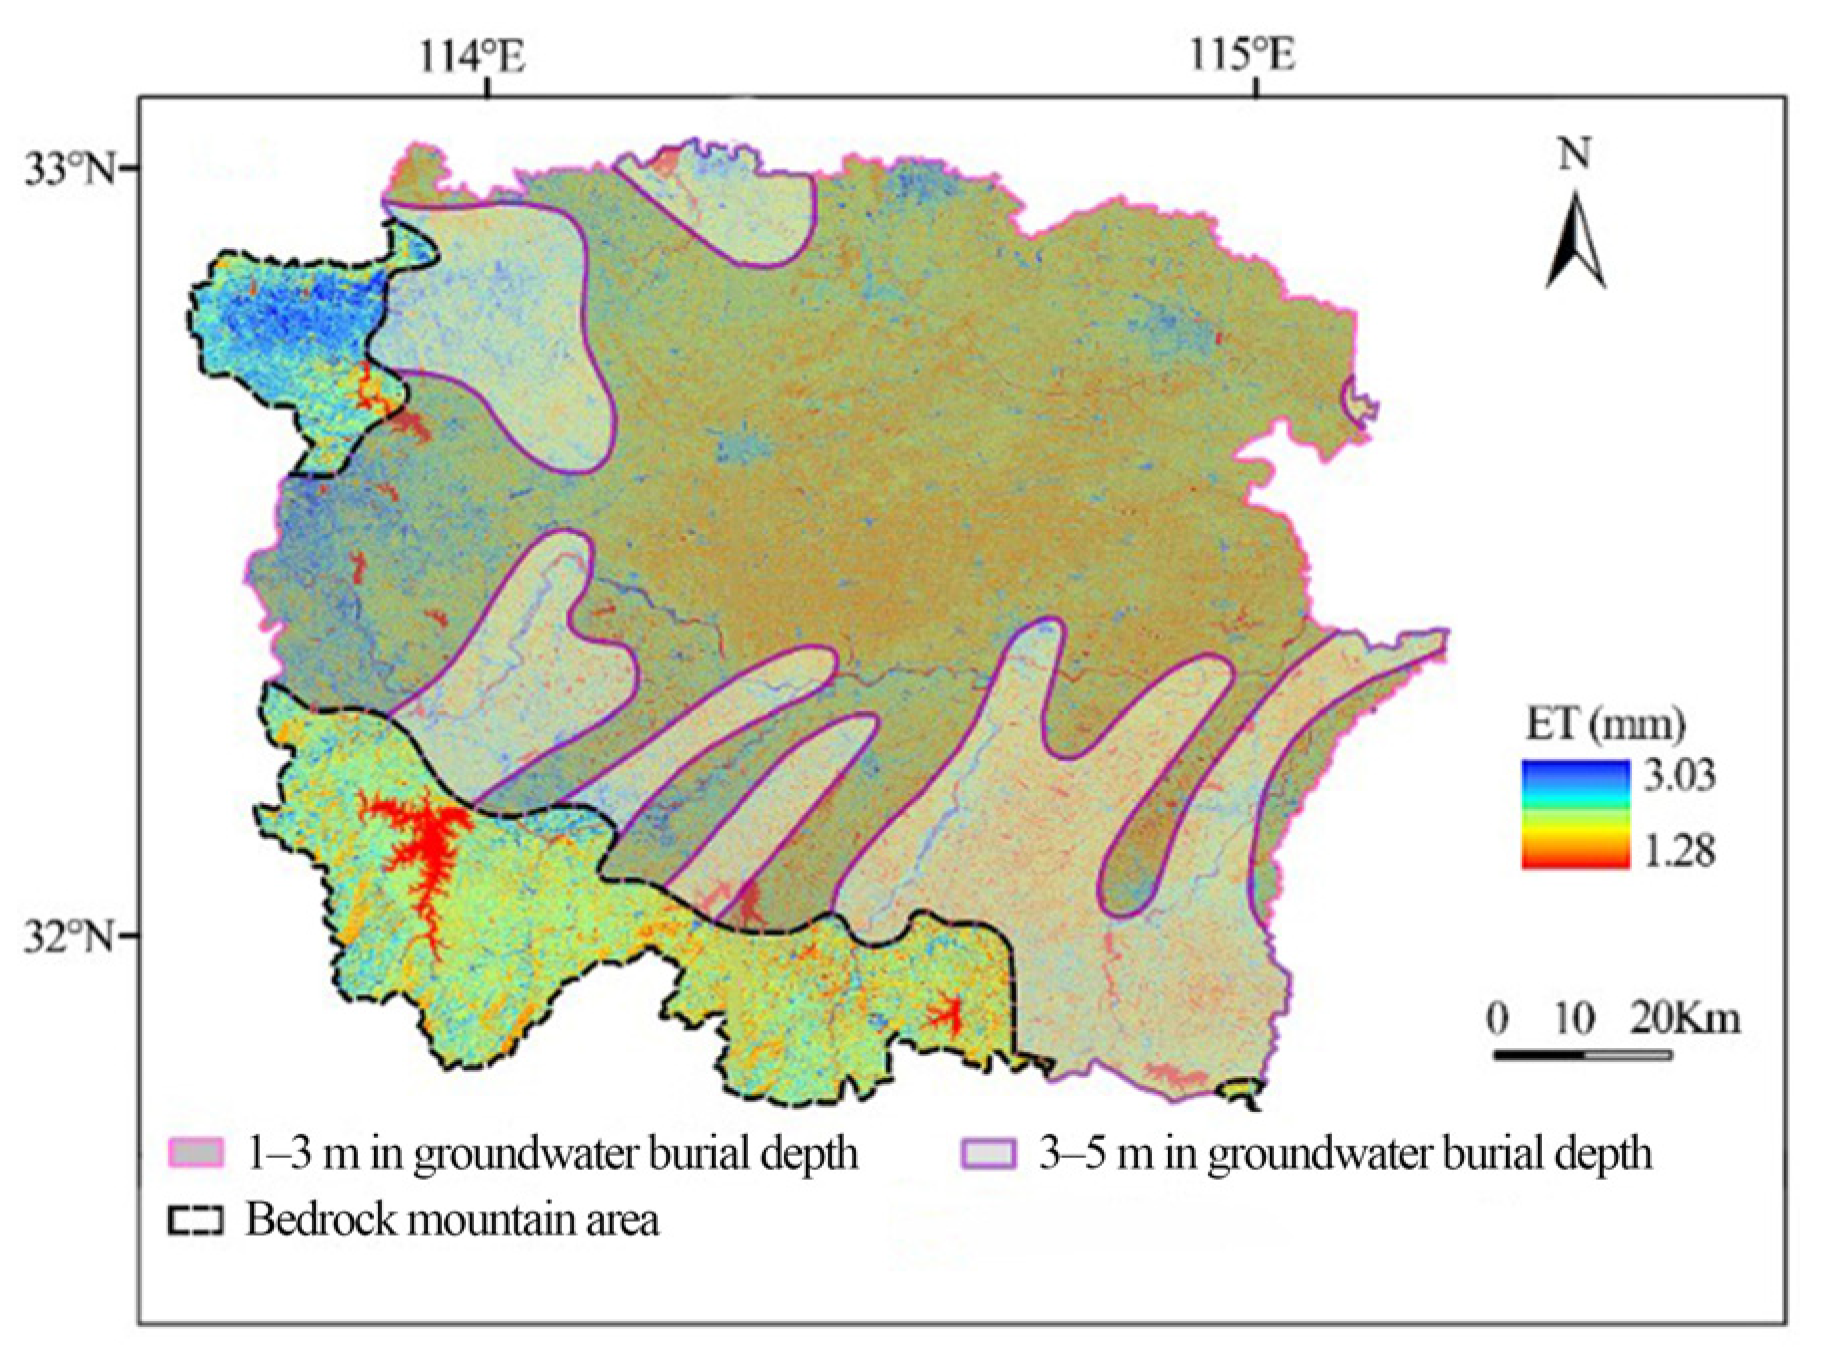
3.3. Influencing Factors of Evapotranspiration

To identify the possible factors that influence daily ETSEBAL over the study region, especially in spatial heterogeneity, a superposition analysis was performed based on ET data on March 23, 2018, and raster data of groundwater depths, soil types, elevation, surface temperature, extra-atmospheric reflectance and surface reflectance. The spatial distribution of the ETSEBAL and the groundwater depths is shown in Figure 4. Results show that ETSEBAL was less for the shallowest groundwater depth at 1–3 m, high for the groundwater depth at 3–5 m and higher for the bedrock mountain area. Previous studies had different results in this regard. For example, Huo et al. [19] revealed that evaporation decreased as the water table fell by performing a lysimeter experiment incorporating a 1-year-long bromide tracer test, until it was down to the extinction depth of groundwater. Luo and Sophocleous [64] found that ET decreased with increasing depth to the water table through the HYDRUS-1D model in arid and semi-arid regions. In addition, Liu et al. [65] indicated that groundwater depth from 4 to 12 m had little effect on total evaporation in a subtropical scrub forest. Studies have shown that ET was also affected by meteorological factors and underlying surface factors [59,60,61]. The observed characteristics of the ETSEBAL maybe correlated with some of these influencing factors rather than groundwater depth in the study region.
Soil properties directly affect ET through changes in sensible heat flux and soil heat flux [49,50]. The spatial distribution of soil types is shown in Figure 5. Five types of soils, including alfisols, semi-hydromorphic soil, anthrosols, primitive and lakes and reservoirs, are recognized in study area. The most common soil types over this region are alfisols, semi-hydromorphic soil and anthrosols, which occupy approximately 42%, 25% and 26% of the study region, respectively. Only 6% and 1% of the study area is occupied by primary soil and lakes and reservoirs (Figure 5 and Table 7). The statistical characteristics of ETSEBAL values are shown in Table 7, and the results reveal that there was no significant difference among these soil types. The mean and median of ETSEBAL value of lakes and reservoirs was 1.459 mm/d and 1.395 mm/d, respectively. The mean (median) of ETSEBAL value was 1.618 mm/d (1.622 mm/d) for alfisols, 1.614 mm/d (1.623 mm/d) for anthrosols and 1.610 mm/d (1.619 mm/d) for semi-hydromorphic soil. The alfisols and semi-hydromorphic soil is mainly concentrated in northwest and northeast of the study region, respectively and anthrosols gathers in the middle of the study region. The mean and median of ETSEBAL value was 1.624 mm/d and 1.626 mm/d for primary soil, which is mostly located at the far western and southwestern mountain area. In general, ETSEBAL value was less for lakes and reservoirs, high for alfisols, anthrosols and semi-hydromorphic soil and higher for primary soil.
The relationships between daily ETSEBAL and environment variables, including elevation, surface temperature, extra-atmospheric reflectance and surface reflectance, were also investigated. Partial correlation analysis was used to quantify the correlation between ETSEBAL with one of the environment variables, e.g., elevation, when controlling the other three variables (e.g., surface temperature, extra-atmospheric reflectance and surface reflectance), and the results are shown in Table 8. The partial correlation analysis revealed that elevation, surface temperature, extra-atmospheric reflectance were positively correlated with ETSEBAL, which is consistent with the results of previous research [65,66], while surface reflectance was negatively correlated with ETSEBAL. However, the positive and negative correlations were not statistically significant. The partial correlation between ETSEBAL with elevation was about 0.248, showing that the trend of increasing ETSEBAL with increasing altitude was moderate. There was a slight increase in ETSEBAL with increasing surface temperature and extra-atmospheric reflectance, with a partial correlation of about 0.041 and 0.117, respectively, whereas partial correlation coefficient between surface reflectance and ETSEBAL was −0.534, meaning that an increase in surface reflectance led to a large decrease in ETSEBAL. In general, we can see that the daily ETSEBAL over study region was positively correlated with elevation and negatively correlated with surface reflectance.

4. Discussion

In this study, the SEBAL model was applied to estimate the characteristics of ET in the upper reaches of the Huaihe River Basin, which is in a subtropical zone. Some previous studies have also estimated the ET in a subtropical climate area. For example, Rahimikhoob [67] used artificial neural networks to estimate crop evapotranspiration in Iran and found that the neural network provided quite good agreement with the ET obtained using the Penman–Monteith method, with an R2 of 0.95 and a RMSE of 0.41 mm/d. Xu and Singh [68] evaluated the performance of three complementary relationship evapotranspiration models on ET estimations in different climatic regions by a water balance approach and found that they were all closely correlated with the water balance calculations with high R2 values (0.85 in all cases) in the Baixi catchment in Eastern China. Different equations or models were used to estimate ET, and different reference ETs are chosen as standards for comparison and calibration in the current studies [69], so it is hard to compare the accuracy of ET estimations in our study to other studies directly, but the accuracy of the SEBAL in ET estimation in this study was considered satisfactory with R2 > 0.73 and small errors. A number of studies have evaluated the performance of the SEBAL model in estimating the ET under different climate conditions, and results indicate that SEBAL models have shown reasonable accuracy for predicting ET in different parts of the world. For example, Cheng et al. [70] used flux tower observational data to assess the performance of the SEBAL ET and found SEBAL underestimated ET in China, with an MBE of −0.15 mm/d.
The SEBAL model was also used to estimate crop evapotranspiration in a maize field in Italy and it was found that the ET map from SEBAL largely agreed with the measured yield map, with relative errors of 0.3% among the irrigation management zones and of 1% for the whole field [71]. Teixeira et al. [72] used field measurements to assess the performance of the SEBAL model for estimating ET in the semi-arid region of a river basin in Brazil, and results showed that the relation between the SEBAL and field measurements of daily ET presented a R2 of 0.91 and a RMSE of 0.38 mm/d. The SEBAL model ET were compared with the Bowen ratio energy balance system-measured fluxes in south-central Nebraska climatic conditions, and results showed that SEBAL can be a viable tool for generating evapotranspiration maps [73]. In general, the SEBAL model can provide a good estimation of ET.
However, a bias of SEBAL in ET estimation also exits. This may be due to the following reasons. One drawback of SEBAL is that it relies on the presence of extreme instantaneous surface temperature, which requires subjective specifications of representative hot (dry) and cold (wet) pixels in the imagery [40,74]. The selection of hot and cold pixels can have a significant impact on SEBAL ET estimation. Second, it always predicts accurate ET over flat surfaces, while biases and errors are relatively high when it is applied over mountainous areas [69]. Thus, according to the digital elevation model and the lapse rate, adjustments need to be made to surface temperature. Third, instead of the actual evaporative fraction, the daily integrated ET from the SEBAL model was converted from the instantaneous evaporative fraction at the moment of satellite overpass, and the underlying assumption is that the evaporative fraction tends to be constant during the entire day. Fourth, SEBAL is usually used to estimate the ET for the cloud-free days across different ecosystems. Liu et al. [74] indicated that even a thin layer of cloud can considerably decrease thermal band readings and cause large errors in calculation of sensible heat fluxes. Future work is required to overcome the above-mentioned issues to improve the performance of SEBAL mode in ET estimation.
The spatial heterogeneity of ET is considered to be the result of the effects of soil heat flux, net radiation and sensible heat flux in response to the changing underlying surface, climate, and atmospheric environment [59,60,61]. Obviously, the factors affecting ET are different in different climate regions. Shi et al. [75] pointed out that in arid and semi-arid regions, surface temperature, soil moisture content, and thickness of dry sand layers, are considered to affect ET by constructing isothermal and non-isothermal models. The value of ET in a delta with vigorous vegetation is strongly influenced by groundwater. Due to changes in the depth of groundwater, vegetation changes the absorption capacity of roots through the migration of water in the aeration zone [76]. In China, previous studies have shown that a decrease of wind speed in western and northern China is the main reason for the change in ET, the decrease of sunshine duration in subtropical and tropical areas in southern China is the dominant main factor affecting the decrease of annual potential evapotranspiration, and the increase of maximum temperature in cold and temperate regions in northern China is the key factor driving the variation of potential evapotranspiration [77].Based on the regional characteristics of the study region, the underlying surface environment, including elevation, groundwater and soil types, as well as the atmospheric environment, we conducted factor analysis of ET spatial heterogeneity. However, it was still difficult to identify the contribution of single factors to evapotranspiration change. Distinguishing dominating features that affect ET variation in a region with complex terrain and land use types is a critical step.

5. Conclusions

According to the Landsat-8 data and daily meteorological data from eight stations, the SEBAL model was employed to estimate the daily ETSEBAL in the upper reaches of the HRB. The daily ET estimated from the SEBAL model (ETSEBAL) was compared against the daily reference ET0 from four (P-M, I-A, Turc, and J-H) methods, ETVIC and ETMOD16. Linear regression and statistical indices of quantitative approaches were used to evaluate the performance of the SEBAL model in ET estimation, and results show that the SEBAL model can provide good estimations in daily evapotranspiration over the study area. The SEBAL model is an important tool for spatial and temporal ET estimation on a regional scale, which is deemed critical for water resources planning and management.
Considering time scale, ETSEBAL was relatively high during the growth period of the vegetation in March and April, while the ETSEBAL in November was quite low. On the spatial scale, the daily ETSEBAL values in the far western and southwestern mountain area were much higher than those in the plains areas located in the middle and north of study area.
The influence of factors on ETSEBAL was also explored. The ETSEBAL value was relatively high for primary soil located in the mountain area. The daily ETSEBAL over the study area was positively correlated with elevation and negatively correlated with surface reflectance, implying that the variability of ETSEBAL in this study area was affected by elevation and surface reflectance. To make the finding of this study more practical to water resources management, quantitative assessment of the influence of different factors on ET should be studied in the future.

Author Contributions

Conceptualization, Y.W.; methodology, K.Z.; software, K.Z.; validation, L.T., K.Z. and Q.Z.; formal analysis, L.T; investigation, Q.Z.; resources, L.T.; data curation, K.Z.; writing—original draft preparation, L.T; writing—review and editing, Y.W. and L.T.; visualization, L.T. and Q.Z.; supervision, Y.W.; project administration, Y.W.; funding acquisition, Y.W. All authors have read and agreed to the published version of the manuscript.

Funding

This research was funded by the National Natural Science Foundation of China (No. 41871024, No. 42001014 and No. 42001025), Humanity and Social Science Youth Foundation of Ministry of Education of China (No. 20YJCZH180), Zhejiang Public Welfare Technology Research (No. LGF21D010003), the Basic Science and Technology Project of Ningbo (No. 202002N3200), Ningbo Fan-3315 Plan, and Leading and Top Tal9ent Training Project of Ningbo.

Data Availability Statement

Data supporting reported results can be found at the National Meteorological Science Data Center (http://data.cma.cn/data/cdcdetail/dataCode/A.0012.0001.html, accessed on 1 July 2020) and Geospatial Data Cloud (http://www.gscloud.cn, accessed on 30 June 2020).

Acknowledgments

The authors thank their cooperative teacher, Chao, G., for invaluable contributions during the process of writing. Constructive comments from anonymous reviewers are greatly appreciated.

Conflicts of Interest

The authors declare that they have no known competing financial interests or personal relationships that could influence the work reported in this paper.

References

  1. Gao, C.; Liu, Q.; Su, B.; Zhai, J.; Hu, C. Study on applicability evaluation of hydrological models with different scales and data bases: A case study of Huaihe River Basin. J. Nat. Resour. 2013, 28, 1765–1777. [Google Scholar]
  2. Wang, K.; Dickinson, R.E. A review of global terrestrial evapotranspiration: Observation, modeling, climatology, and climatic variability. Rev. Geophys. 2012, 50, 1–54. [Google Scholar] [CrossRef]
  3. Zhao, R.; Wang, H.; Chen, J.; Fu, G.; Zhan, C.; Yang, H. Quantitative analysis of nonlinear climate change impact on drought based on the standardized precipitation and evapotranspiration index. Ecol. Indic. 2020, 121, 107107. [Google Scholar] [CrossRef]
  4. Huang, S.; Chang, J.; Huang, Q.; Chen, Y. Spatio-temporal changes and frequency analysis of drought in the Wei River Basin, China. Water Resour. Manag. 2014, 28, 3095–3110. [Google Scholar] [CrossRef]
  5. Efthimiou, N.; Alexandris, S.; Karavitis, C.; Mamassis, N. Comparative analysis of reference evapotranspiration estimation between various methods and the FAO56 Penman-Monteith procedure. Eur. Water 2013, 42, 19–34. [Google Scholar]
  6. Karimi, P.; Bongani, B.; Blatchford, M.; de Fraiture, C. Global satellite-based ET products for the local level irrigation management: An application of irrigation performance assessment in the Sugarbelt of Swaziland. Remote Sens. 2019, 11, 705. [Google Scholar] [CrossRef] [Green Version]
  7. Penman, H.L. Vegetation and Hydrology. Technical Communication NO. 53, Commonwealth Bureau of Soils, Harpenden; Common-wealth Agricultural Bureaux: Farnham Royal, UK, 1963. [Google Scholar]
  8. Allen, R.G.; Pereira, L.S.; Raes, D.; Smith, M. Crop Evapotranspiration Guidelines for Computing Crop Water Requirements. Irrigation. Drainage; Paper. No. 56; FAO: Rome, Italy, 1998. [Google Scholar]
  9. Djaman, K.; Irmak, S.; Kabenge, I.; Futakuchi, K. Evaluation of FAO-56 penman-monteith model with limited data and the valiantzas models for estimating grass-reference evapotranspiration in Sahelian conditions. J. Irrig. Drain. Eng. 2016, 142, 04016044. [Google Scholar] [CrossRef]
  10. Debnath, S.; Adamala, S.; Raghuwanshi, N.S. Sensitivity analysis of FAO-56 Penman-Monteith method for different agro-ecological regions of India. Environ. Process. 2015, 2, 689–704. [Google Scholar] [CrossRef]
  11. Liu, W.; Wang, L.; Zhou, J.; Li, Y.; Sun, F.; Fu, G.; Li, X.; Sang, Y.F. A worldwide evaluation of basin-scale evapotranspiration estimates against the water balance method. J. Hydrol. 2016, 538, 82–95. [Google Scholar] [CrossRef] [Green Version]
  12. Xue, B.L.; Wang, L.; Li, X.; Yang, K.; Chen, D.; Sun, L. Evaluation of evapotranspiration estimates for two river basins on the Tibetan Plateau by a water balance method. J. Hydrol. 2013, 492, 290–297. [Google Scholar] [CrossRef]
  13. Trajkovic, S.; Kolakovic, S. Wind-adjusted Turc equation for estimating reference evapotranspiration at humid European locations. Hydrol. Res. 2009, 40, 45–52. [Google Scholar] [CrossRef]
  14. Gao, X.; Peng, S.; Xu, J.; Yang, S.; Wang, W. Proper methods and its calibration for estimating reference evapotranspiration using limited climatic data in Southwestern China. Arch. Agron. Soil Sci. 2015, 61, 415–426. [Google Scholar] [CrossRef]
  15. Wang, K.; Li, Z.; Cribb, M. Estimation of evaporative fraction from a combination of day and night land surface temperatures and NDVI: A new method to determine the Priestley–Taylor parameter. Remote Sens. Environ. 2006, 102, 293–305. [Google Scholar] [CrossRef]
  16. Shirmohammadi, A.Z.; Saberali, S.F. Evaluating of eight evapotranspiration estimation methods in arid regions of Iran. Agric. Water Manag. 2020, 239, 106243. [Google Scholar] [CrossRef]
  17. Abrishamkar, M.; Ahmadi, A. Evapotranspiration Estimation Using Remote Sensing Technology Based on SEBAL Algorithm. Iran. J. Sci. Technol. 2016, 41, 65–76. [Google Scholar] [CrossRef]
  18. Sanderson, J.S.; Cooper, D.J. Ground water discharge by evapotranspiration in wet-lands of an arid intermountain basin. J. Hydrol. 2008, 351, 344–359. [Google Scholar] [CrossRef]
  19. Huo, S.Y.; Jin, M.G.; Liang, X.; Li, X.; Hao, H.B. Estimating impacts of water-table depth on groundwater evaporation and recharge using lysimeter measurement data and bromide tracer. Hydrogeol. J. 2020, 28, 955–971. [Google Scholar] [CrossRef]
  20. Cheng, D.H.; Li, Y.; Chen, X.; Wang, W.K.; Hou, G.C.; Wang, C.L. Estimation of groundwater evapotranspiration using diurnal water table fluctuations in the Mu Us Desert, northern China. J. Hydrol. 2013, 490, 106–113. [Google Scholar] [CrossRef]
  21. Nyambayo, V.P.; Potts, D.M. Numerical simulation of evapotranspiration using a root water uptake model. Comput. Geotech. 2010, 37, 175–186. [Google Scholar] [CrossRef]
  22. Bing, L.F.; Su, H.B.; Shao, Q.Q.; Liu, J.Y. Changing characteristic of land surface evapotranspiration and soil moisture in china during the past 30 years. Geo. Spat. Inf. Sci. 2012, 14, 1–13. [Google Scholar] [CrossRef]
  23. Kul, K.; Izaya, N.; Jeppe, K.; George, V. Dry season evapotranspiration dynamics over human-impacted land-scapes in the Southern Amazon using the Landsat-based METRIC model. Remote Sens. 2017, 9, 706. [Google Scholar]
  24. Li, Z.L.; Tang, R.; Wan, Z.; Bi, Y.; Zhou, C.; Tang, B.; Yan, G.; Zhang, X. A review of current methodologies for regional evapotranspiration estimation from remotely sensed data. Sensors 2009, 9, 3801–3853. [Google Scholar] [CrossRef] [Green Version]
  25. Senkondo, W.; Munishi, S.E.; Tumbo, M.; Nobert, J.; Lyon, S.W. Comparing remotely-sensed surface energy balance evapotranspiration estimates in heterogeneous and data-limited regions: A case study of Tanzania’s Kilombero Valley. Remote Sens. 2019, 11, 1289. [Google Scholar] [CrossRef] [Green Version]
  26. Bastiaanssen, W.G.M.; Menenti, M.; Feddes, R.A.; Holtslag, A.A.M. A remote sensing surface energy balance algorithm for land (SEBAL). 1. Formulation. J. Hydrol. 1998, 212–213, 198–212. [Google Scholar] [CrossRef]
  27. Allen, R.G.; Tasumi, M.; Trezza, R. Satellite-based energy balance for mapping evapotranspiration with internalized calibration (METRIC)—Model. J. Irrig. Drain. Eng. 2007, 133, 380–394. [Google Scholar] [CrossRef]
  28. Singh, R.K.; Senay, G.B.; Velpuri, N.M.; Bohms, S.; Scott, R.L.; Verdin, J.P. Actual evapotranspiration (water use) assessment of the Colorado River Basin at the Landsat resolution using the operational simplified surface energy balance model. Remote Sens. 2014, 6, 233–256. [Google Scholar] [CrossRef] [Green Version]
  29. Su, Z. The Surface Energy Balance System (SEBS) for estimation of turbulent heat fluxes. Hydrol. Earth Syst. Sci. 2002, 6, 85–99. [Google Scholar] [CrossRef]
  30. Sun, H.; Yang, Y.; Wu, R.; Gui, D.; Xue, J.; Liu, Y.; Yan, D. Improving estimation of cropland evapotranspiration by the Bayesian model averaging method with surface energy balance models. Atmosphere 2019, 10, 188. [Google Scholar] [CrossRef] [Green Version]
  31. Allam, M.; Mhawej, M.; Meng, Q.Y.; Faour, G.; Fadel, A.; Hu, X.L. Monthly 10-m evapo-transpiration rates retrieved by SEBALI with Sentinel-2 and MODIS LST data. Agric. Water Manag. 2021, 243, 106432. [Google Scholar] [CrossRef]
  32. Mhawej, M.; Nasrallah, A.; Abunnasr YFadel, A.; Faour, G. Better irrigation management using the satellite-based adjusted single crop coefficient (aKc) for over sixty crop types in California, USA. Agric. Water Manag. 2021, 256, 207059. [Google Scholar] [CrossRef]
  33. Wagle, P.; Bhattarai, N.; Gowda, P.H.; Kakani, V.G. Performance of five surface energy balance models for estimating daily evapotranspiration in high biomass sorghum. ISPRS J. Photogramm. Remote Sens. 2017, 128, 192–203. [Google Scholar] [CrossRef] [Green Version]
  34. Xue, J.; Bali, K.M.; Light, S.; Hessels, T.; Kisekka, I. Evaluation of remote sensing-based evapotranspiration models against surface renewal in almonds, tomatoes and maize. Agric. Water Manag. 2020, 238, 106228. [Google Scholar] [CrossRef]
  35. Karimi, P.; Bastiaanssen, W.G.M. Spatial evapotranspiration, rainfall and land use data in water accounting—Part 1: Review of the accuracy of the remote sensing data. Hydrol. Earth Syst. Sci. 2015, 19, 507–532. [Google Scholar] [CrossRef] [Green Version]
  36. Muhammad, S.K.; Umar, W.L.; Jongjin, B.; Minha, C. Stand-alone uncertainty characterization of GLEAM, GLDAS and MOD16 evapotranspiration products using an extended triple collocation approach. Agric. For. Meteorol. 2018, 252, 256–268. [Google Scholar]
  37. Mu, Q.; Zhao, M.; Running, S.W. Improvements to a MODIS global terrestrial evapotranspiration algorithm. Remote Sens. Environ. 2011, 115, 1781–1800. [Google Scholar] [CrossRef]
  38. Jiang, Y.Y.; Wang, W.; Zhou, Z.H. Evaluation of MODIS MOD16 Evapotranspiration Product in Chinese River Basins. Nat. Resour. J. 2017, 32, 517–528. [Google Scholar]
  39. Jiang, F.X.; Xie, X.H.; Liang, S.L.; Wang, Y.B.; Zhu, B.W.; Zhang, X.T.; Chen, Y.C. Loess Plateau evapotranspiration intensified by land surface radiative forcing associated with ecological restoration. Agric. For. Meteorol. 2021, 331, 208669. [Google Scholar] [CrossRef]
  40. Jassas, H.; Kanoua, W.; Merkel, B. Actual evapotranspiration in the Al-Khazir Gomal Basin (Northern Iraq) using the surface energy balance algorithm for land (SEBAL) and water balance. Geosciences 2015, 5, 141–159. [Google Scholar] [CrossRef] [Green Version]
  41. Gao, C.; Ruan, T. Impact of climate change and human activities on Runoff in the middle and upper reaches of the Huaihe River Basin. J. Geog. Sci. 2018, 28, 79–92. [Google Scholar] [CrossRef] [Green Version]
  42. Gao, C.; Zhang, Z.; Liu, Q.; Ruan, T. An optimal grid method for vulnerability assessment index of disaster bearing body: A case study of rainstorm and flood disaster in the main stream of Huaihe River. J. Nat. Disasters 2018, 27, 119–129. [Google Scholar]
  43. Gao, C.; Chen, C.; He, Y.; Ruan, T.; Luo, G.; Sun, Y. Response of Agricultural Drought to Meteorological Drought: A Case Study of the Winter Wheat above the Bengbu Sluice in the Huaihe River Basin, China. Water 2020, 12, 2805. [Google Scholar] [CrossRef]
  44. Gao, C.; Li, X.; Sun, Y.; Zhou, T.; Luo, G.; Chen, C. Water requirement of summer maize at different growth stages and the spatiotemporal characteristics of agricultural drought in the Huaihe River Basin, China. Theor. Appl. Climatol. 2019, 136, 1289–1302. [Google Scholar] [CrossRef]
  45. Mu, Q.; Heinsch, F.A.; Zhao, M.; Running, S.W. Development of a global evapotranspiration algorithm based on MODIS and global meteorology data. Remote Sens. Environ. 2007, 111, 519–536. [Google Scholar] [CrossRef]
  46. Allen, R. Penman-Monteith Equation. Encycl. Soils. Environ. 2005, 3, 180–188. [Google Scholar]
  47. Alexandridis, T.K.; Andrianopoulos, A.; Galanis GKalopesa, E.; Dimitrakos, A.; Katsogiannos, F.; Zalidis, G. An Integrated Approach to Promote Precision Farming as a Measure Toward Reduced-Input Agriculture in Northern Greece Using a Spatial Decision Support System. Compre. Geo. Inform. Syst. 2018, 315–352. [Google Scholar] [CrossRef]
  48. Luo, G. Research of Water Deficit and Driving Mechanism in Key Growth Stages of Winter Wheat—A Case Study in the Upper Reaches of Huaihe River Basin; Ningbo University: Ningbo, China, 2020. [Google Scholar]
  49. Zhang, Z.; Li, X.; Liu, L.; Wang, Y.; Li, Y. Influence of mulched drip irrigation on landscape scale evapotranspiration from farmland in an arid area. Agric. Water Manag. 2020, 230, 105953. [Google Scholar] [CrossRef]
  50. Dos Santos, C.A.C.; Mariano, D.A.; das Chagas, A.; do Nascimento, F.; da CDantas, F.R.; de Oliveira, G.; Silva, M.T.; da Silva, L.L.; da Silva, B.B.; Bezerra, B.G.; et al. Spatio-temporal patterns of energy exchange and evapotranspiration during an intense drought for drylands in Brazil. Int. J. Appl. Earth Obs. Geoinf. 2020, 85, 101982. [Google Scholar] [CrossRef]
  51. Zwart, S.J.; Bastiaanssen, W.G.M. SEBAL for detecting spatial variation of water productivity and scope for improvement in eight 65 irrigated wheat systems. Agric. Water Manag. 2007, 89, 287–296. [Google Scholar] [CrossRef]
  52. Irmak, S.; Irmak, A.; Allen, R.G.; Jones, J.W. Solar and net radiationased equations to estimate reference evapotranspiration in humid climates. J. Irrig. Drain. Eng. ASCE 2003, 129, 336–347. [Google Scholar] [CrossRef]
  53. Turc, L. Estimation of irrigation water requirements, potential evapotranspiration: A simple climatic formula evolved up to date. Adv. Agron. 1961, 12, 13–49. [Google Scholar]
  54. Jensen, M.E.; Haise, H.R. Estimating evapotranspiration from solar radiation. J. Irrig. Drain. Div. 1963, 89, 15–41. [Google Scholar] [CrossRef]
  55. Qin, M.; Hao, L.; Shi, T.; Sun, L.; Sun, G. Comparison and improvement of five reference crop evapotranspiration estimation methods in Qinhuai River Basin. China Agrometeorol. 2016, 37, 390–399. [Google Scholar]
  56. Baba, K.; Shibata, R.; Sibuya, M. Partial correlation and conditional correlation as measures of conditional independence. Aust. N. Z. J. Stat. 2004, 46, 657–664. [Google Scholar] [CrossRef]
  57. Gao, G.; Chen, D.; Ren GYChen, Y.; Liao, Y.M. Spatial and temporal variations and controlling factors of potential evapotranspiration in China: 1956–2000. J. Geogr. Sci. 2006, 16, 3–12. [Google Scholar] [CrossRef]
  58. Tabari, H.; Aeini, A.; Talaee, P.H.; Some’e, B.S. Spatial distribution and temporal variation of reference evapotranspiration in arid and semi-arid regions of Iran. Hydrol. Process. 2012, 26, 500–512. [Google Scholar] [CrossRef]
  59. Maayar, M.M.; Chen, J.M. Spatial scaling of evapotranspiration as affected by heterogeneities in vegetation, topography, and soil texture. Remotes Sens. Environ. 2006, 102, 33–51. [Google Scholar] [CrossRef]
  60. Joiner, J.; Yoshida, Y.; Anderson, M.; Holmes, T.; Hain, C.; Reichle, R.; Koster, R.; Middleton, E.; Zeng, F.W. Global relationships among traditional reflectance vegetation indices (NDVI and NDII), evapotranspiration (ET), and soil moisture variability on weekly timescales. Remotes Sens. Environ. 2018, 219, 339–352. [Google Scholar] [CrossRef] [Green Version]
  61. Lehmann, P.; Merlin, O.; Gentine, P.; Or, D. Soil texture effects on surface resistance to bare-soil evaporation. Geophys. Res. Lett. 2018, 45, 10398–10405. [Google Scholar] [CrossRef]
  62. Su, T.; Feng, G.L. Spatial-temporal variation characteristics of global evaporation revealed by eight reanalyses. Sci. China Earth Sci. 2015, 58, 255–269. [Google Scholar] [CrossRef]
  63. Howell, T.A.; Evett, S.R.; Tolk, J.A.; Copeland, K.S.; Marek, T.H. Evapotranspiration, water productivity and crop coefficients for irrigated sunflower in the U.S. southern high plains. Agric. Water Manag. 2015, 162, 33–46. [Google Scholar] [CrossRef]
  64. Luo, Y.; Sophocleous, M. Seasonal groundwater contribution to crop-water use assessed with lysimeter observations and model simulations. J. Hydrol. 2010, 389, 325–335. [Google Scholar] [CrossRef]
  65. Liu, Y.J.; Chen, J.; Pan, T. Analysis of Changes in Reference Evapotranspiration, Pan Evaporation, and Actual Evapotranspiration and Their Influencing Factors in the North China Plain During 1998–2005. Earth Space Sci. 2019, 6, 1366–1377. [Google Scholar] [CrossRef] [Green Version]
  66. Xu, Y.; Xu, Y.P.; Wang, Y.F.; Wu, L.; Li, G.; Song, S. Spatial and temporal trends of reference crop evapotranspiration and its influential variables in Yangtze River Delta, eastern China. Theor. Appl. Climatol. 2017, 130, 945–958. [Google Scholar] [CrossRef]
  67. Rahimikhoob, A. Estimation of evapotranspiration based on only air temperature data using artificial neural networks for a subtropical climate in Iran. Theor. Appl. Climatol. 2010, 101, 83–91. [Google Scholar] [CrossRef]
  68. Xu, C.Y.; Singh, V.P. Evaluation of three complementary relationship evapotranspiration models by water balance approach to estimate actual regional evapotranspiration in different climatic regions. J. Hydrol. 2005, 308, 105–121. [Google Scholar] [CrossRef]
  69. Zhong, Y.; Zhong, M.; Mao, Y.; Ji, B. Evaluation of Evapotranspiration for Exorheic Catchments of China during the GRACE Era: From a Water Balance Perspective. Remote Sens. 2020, 12, 511. [Google Scholar] [CrossRef] [Green Version]
  70. Cheng, M.; Jiao, X.; Li, B.; Yu, X.; Shao, M.; Jin, X. Long time series of daily evapotranspiration in China based on the SEBAL model and multisource images and validation. Earth Syst. Sci. 2021, 13, 3995–4017. [Google Scholar] [CrossRef]
  71. Gobbo, S.; Lo Presti, S.; Martello, M.; Panunzi, L.; Berti, A.; Morari, F. Inter-grating SEBAL with in-field crop water status measurement for precision irrigation applications-A case study. Remote Sens. 2019, 11, 2069. [Google Scholar] [CrossRef] [Green Version]
  72. Teixeira, A.D.C.; Bastiaanssen, W.G.; Ahmad, M.; Bos, M.G. Reviewing SEBAL input parameters for assessing evapotranspiration and water productivity for the Low-Middle São Francisco River basin, Brazil: Part B: Application to the regional scale. Agric. For. Meteorol. 2009, 149, 462–476. [Google Scholar] [CrossRef] [Green Version]
  73. Singh, R.K.; Irmak, A.; Irmak, S.; Martin, D.L. Application of SEBAL model for mapping evapotranspiration and estimating surface energy fluxes in south-central Nebraska. J. Irrig. Drain. Eng. 2008, 134, 273–285. [Google Scholar] [CrossRef]
  74. Liu, C. Spatial and temporal change in the potential evapotranspiration sensitivity to meteorological factors in China (1960–2007). J. Geog. Sci. 2012, 22, 3–14. [Google Scholar] [CrossRef]
  75. Shi, T.T.; Guan, D.X.; Wu, J.B.; Wang, A.Z.; An, C.J.J.; Han, S.J. Comparison of methods for estimating evapotranspiration rate of dry forest canopy: Eddy covariance, Bowen ratio energy balance, and Penman-Monteith equation. J. Geophys. Res. 2008, 113, D19116. [Google Scholar] [CrossRef]
  76. Gao, X.L.; Peng, S.Z.; Wang, W.G.; Xu, J.Z.; Yang, S.L. Spatial and temporal distribution characteristics of reference evapotranspiration trends in Karst area: A case study in Guizhou Province, China. Meteorol. Atmos. Phys. 2016, 128, 677–688. [Google Scholar] [CrossRef]
  77. Ying, Y.H.; Wang, S.D.; Chen, G.; Dai, E. Attribution analyses of potential evapotranspiration change in China since the 1960s. Theor. Appl. Climatol. 2010, 101, 19–28. [Google Scholar]
Figure 1. Study area location and elevation and meteorological stations.
Atmosphere 12 01599 g001
Figure 2. Comparison of daily evapotranspiration from the SEBAL model (ETSEBAL) on 20 November 2013, versus reference evapotranspiration (ET0) obtained from Imark-Allen (a), Turc (b), Jensen-Haise (c), Penman-Monteith (d), ETMOD16 (e), and ETVIC (f). The solid line is the least-squares regression line, and the dashed line is the x = y line.
Atmosphere 12 01599 g002
Figure 3. Distribution of daily ETSEBAL over the study region in March 2018 (a,d), April 2015 (b,e) and November 2013 (c,f).
Atmosphere 12 01599 g003
Figure 4. Distribution of daily ETSEBAL and underwater at different depths over the study region in March 2018.
Atmosphere 12 01599 g004
Figure 5. Spatial distribution of different soil types in the study region.
Atmosphere 12 01599 g005
Table 1. Data information of Landsat-8.
DateOrdinal NumbersOrbit NumberLine NumberCloud Cover (%)
20 November 2013324d123372.23
123380.13
16 April 2015106d123373.14
123381.31
23 March 201883d123371.14
123380.54
Table 2. Weight coefficients of Landsat 8 bands.
Band123457
Weight coefficient0.29340.27360.23260.15510.03250.0119
Table 3. Adjustment table of evapotranspiration in different months calculated by Turc method.
MonthJanuaryMarchAprilNovember
K0.25890.02070.00250.0017
Table 4. Adjustment table of evapotranspiration in different months calculated by the Jensen-Haise method.
MonthJanuaryMarchAprilOctoberNovember
K0.8301.9871.7091.1870.837
Table 5. Daily evapotranspiration values from the SEBAL model, VIC model, four theoretical methods and remote sensing ET for eight stations on 20 November 2013 (mm/d).
IDStationSEBALI-ATurcJ-HP-MMOD16VIC
57292Pingyu0.89600.93580.89550.89390.89540.86310.9185
57293Xincai0.89950.90030.89540.89380.89780.80161.0917
57295Zhengyang0.82720.82420.76260.76120.82510.97650.8173
57296Xi xian0.85650.87210.85050.84900.85730.82170.8625
57297Xinyang0.86870.86820.86330.86180.87540.74150.8705
57298Luoshan0.82280.80770.82790.82640.81890.75680.7625
57299Guangshan0.87020.89220.87750.87590.87380.69750.8753
58207Huangchuan0.81060.81130.81930.81790.80940.71250.8274
Table 6. Summary statistics of daily ETSEBAL estimated from the SEBAL model against ET0, ETMOD16, ETVIC.
The Calculation Methods or Source of ETR2RMSE (mm/d)MBE
(mm/d)
Slope
(a)
Intercept
(b)
I-A0.9120.0178−0.00751.315−0.262
Turc0.7320.02350.00741.418−0.134
J-H0.7320.02390.00891.146−0.134
P-M0.9910.0032−0.00021.036−0.031
MOD160.8160.1085−0.08180.9220.0689
VIC0.8500.07210.00131.3896−0.3247
Table 7. Area proportion, mean ETSEBAL, and median ETSEBAL of soil types in the study region.
Area Proportion, Mean ET, and Median ETAlfisolsAnthrosolsLakes and ReservoirsPrimary SoilSemi-Hydromorphic Soil
Area proportion (%)42251626
Mean ETSEBAL(mm/d)1.6181.6141.4591.6241.610
Median ETSEBAL(mm/d)1.6221.6231.3951.6261.619
Table 8. Partial correlation coefficient between ETSEBAL and elevation, surface temperature, extra-atmospheric reflectance, surface reflectance in the study region.
Influencing FactorsCoefficientp-Value
Elevation0.248>0.05
Surface temperature0.041>0.05
Extra-atmospheric reflectance0.117>0.05
Surface reflectance−0.534>0.05
Publisher’s Note: MDPI stays neutral with regard to jurisdictional claims in published maps and institutional affiliations.

