Article

Trends in the Diurnal Temperature Range over the Southern Slope of Central Himalaya: Retrospective and Prospective Evaluation

1
International Center for Climate and Environment Sciences, Institute of Atmospheric Physics, Chinese Academy of Sciences, Beijing 100029, China
2
University of Chinese Academy of Sciences, Beijing 100049, China
3
Central Department of Hydrology and Meteorology, Tribhuvan University, Kathmandu 44613, Nepal
4
Texas A&M AgriLife Research, Texas A&M University, El Paso, TX 79927, USA
5
Forests, Wildlife and Environment Department, Government of Gilgit Baltistan, Pakistan
6
College of Water Resources and Architectural Engineering, Shihezi University, Shihezi 832000, China
7
Kathmandu Center for Research and Education, Chinese Academy of Sciences-Tribhuvan University, Kathmandu 44613, Nepal
*
Author to whom correspondence should be addressed.
Submission received: 14 November 2021 / Revised: 8 December 2021 / Accepted: 10 December 2021 / Published: 15 December 2021

Abstract

:
The Diurnal Temperature Range (DTR) profoundly affects human health, agriculture, eco-system, and socioeconomic systems. In this study, we analyzed past and future changes in DTR using gridded Climate Research Unit (CRU) datasets for the years 1950–2020 and an ensemble means of thirteen bias-corrected Coupled Model Intercomparison Project Phase 6 (CMIP6) models under different Shared Socioeconomic Pathways (SSP1-2.6, SSP2-4.5, and SSP5-8.5) scenarios for the rest of the 21st century over the southern slope of Central Himalaya, Nepal. Furthermore, the potential drivers (precipitation and cloud cover) of seasonal and annual DTR were studied using correlation analysis. This study found that the DTR trends generally declined; the highest decrease was observed in the pre-monsoon and winter at a rate of 0.09 °C/decade (p ≤ 0.01). As expected, DTR demonstrated a significant negative correlation with cloudiness and precipitation in all four seasons. Further, the decreased DTR was weakly related to the Sea Surface Temperature variation (SST) in the tropical Pacific and Indian Oceans. We found that the projected DTR changes in the future varied from a marginal increase under the SSP1-2.6 (only pre-monsoon) scenario to continued significant decreases under SSP2-4.5 and SSP5-8.5. Insights based on retrospective and prospective evaluation help to understand the long-term evolution of diurnal temperature variations.

1. Introduction

The surface air temperature is an essential climatic variable mediating the diversity of biological, physical, and chemical processes guaranteeing the sustainability of life on earth [1,2]. Due to ongoing climate change, the global land surface temperature increased by 0.99 °C from 1850–1900 to 2001–2020; recent decades have been successively warmer than previous decades [3]. The observed variation in the mean temperature (Tmean) trend corresponds to either the maximum temperature (Tmax) or the minimum temperature (Tmin) trend; otherwise, it is relative to both temperature trends. The complicated climate variation cannot be analyzed with mean annual temperature alone; therefore, the Diurnal Temperature Range (DTR), which measures the difference between the Tmax and Tmin, becomes an essential indicator of recent climate change [4,5]. The land-surface DTR featured a significantly decreasing trend, at a rate of −0.036 °C/decade between 1901 and 2014 [6]. Further, apparent changes in DTR are much smaller than reported changes in average temperatures, and therefore it is virtually certain that maximum and minimum temperatures have increased since the 1950s [7,8]. It is a fact that rising temperatures, especially night-time temperatures, significantly impact human health by amplifying thermal stress and increasing heat-related mortality [9]. Moreover, the decreasing trend of the DTR was associated with an increase in mortality across India [10]. It also has a significant impact on the growth and development of crops such as maize, wheat, and rice [11,12].
On the regional scale, Asia is experiencing a widespread decrease in DTR [6]; moreover, the Hindu-Kush Himalayan region experienced a faster decrease in DTR, at a rate of −0.108 °C/decade, from 1960 to 2015 [13]. Similarly, annual and seasonal Tmax and Tmin increased between 1961 and 2010 across India; however, no trend was observed for annual and summer DTR, whereas a decreasing DTR trend was observed for winter and post-monsoon [14]. By contrast, an increase in the monsoon DTR was observed during 1961–2008 across Bangladesh [15]. Similarly, in northern Pakistan, the annual and seasonal DTR displayed an increasing trend from 1986 to 2018, with a significant increase (0.32 °C/decade) in the winter season [16]. Thus, it is evident from previous studies that the DTR change features regional and seasonal characteristics in South Asian countries. However, to our knowledge, studies concerning DTR changes have not paid considerable attention to Nepal, in the Himalayan region.
Nepal, bounded between the central Himalayan mountains and the Indo-Gangetic plain, features an exclusive top climatic setting with two distinct weather systems, south Indian monsoon, and westerly currents, ensuring precipitation along the east–west gradient during the summer and winter, respectively [17,18,19]. In tandem with the predominant warming in the Himalayan region, Nepal has experienced warming in general, with maximum temperatures (0.04 °C/year) increasing faster than minimum temperatures (0.02 °C/year) between 1986 and 2015 [20]. The temperature rise has consequently exacerbated glacier retreats, glacial lake outbursts of floods (GLOFs), droughts, and food insecurity, among other effects, in Nepal [21,22,23,24,25]. Significantly, enhanced warming trends associated with extreme changes in climatic variables, further intensifying weather extremes, have been projected [26]. For instance, heat waves have been increasing in the monsoon season over the southern part of the country in recent years; the situation in Surkhet and Pokhara is worrying [27].
Several studies also observed the increased Tmin, Tmax, and Tmean over Nepal [26,28,29]. Furthermore, the seasonal and annual Tmax displayed a negative trend in the lower elevation, and a higher positive Tmin trend was observed in the mountainous regions of the country [28]; thus, national-scale DTR asymmetry over Nepal is worth examining. The Tmax warming during the non-monsoonal season over mountain regions is due to reduced cloud cover, whereas cooling in the lowland is due to dense fog cover in winter [29]. In addition, cloud cover, precipitation, sunshine duration, soil moisture, atmospheric aerosols, greenhouse gases, urban growth, and land use may significantly impact DTR changes [30,31,32]. In the context of variable DTR trends influenced by many environmental variables, this study intends to reveal the DTR trend and the underlying factors (cloud cover and precipitation) responsible for the DTR change across Nepal. Further, Indo-Pacific Sea Surface Temperature (SST) anomalies play a significant role in the variability of the temperature extremes [33,34]; therefore, we try to relate the DTR change of Nepal with the El Nino Southern Oscillation (ENSO) and Indian Ocean Dipole Mode Index (DMI).
Moreover, anthropogenic factors, such as greenhouse gases and aerosols, also play an essential role in DTR variations [35]. In the 21st century, aerosols are predicted to decline sharply, whereas greenhouse gases are projected to rise, changing the temperature and leading to extreme weather conditions [36]. Different phases of the Coupled Model Intercomparison Project (CMIP) models have been developed to understand future climatic changes arising from natural, unforced variability or in response to changes in radiative forcing in a multi-model context. For instance, 20 different Coupled Model InterComparison Project phase 5 (CMIP5) models have been used to project DTR globally, revealing a reduction in the globally averaged DTR in most of these models [37]. Further, a decreasing DTR trend is observed in CMIP phase 6 (CMIP6) models; however, CMIP6 models can simulate DTR better than CMIP5 [38]. Furthermore, CMIP6 models can unfold future climatic conditions due to improved emissions scenarios, land use scenarios, and computational advances [39,40]. Moreover, the better-simulating capacity of CMIP6 for temperatures over the South Asian region was already verified by [41]. However, none of these studies has estimated the future DTR trends using CMIP6 models; therefore, this study aims to analyze the projected (2021–2100) annual and seasonal DTR changes using 13 bias-corrected CMIP6 models over Nepal.
Overall, this study attempts to answer three research questions: (a) how did annual and seasonal DTR trends vary over the last 71 years (1950–2020)? (b) What are the possible factors responsible for the annual and seasonal DTR change? And (c) how will climate models project future DTR trends (2021–2100) over Nepal?

2. Materials and Methods
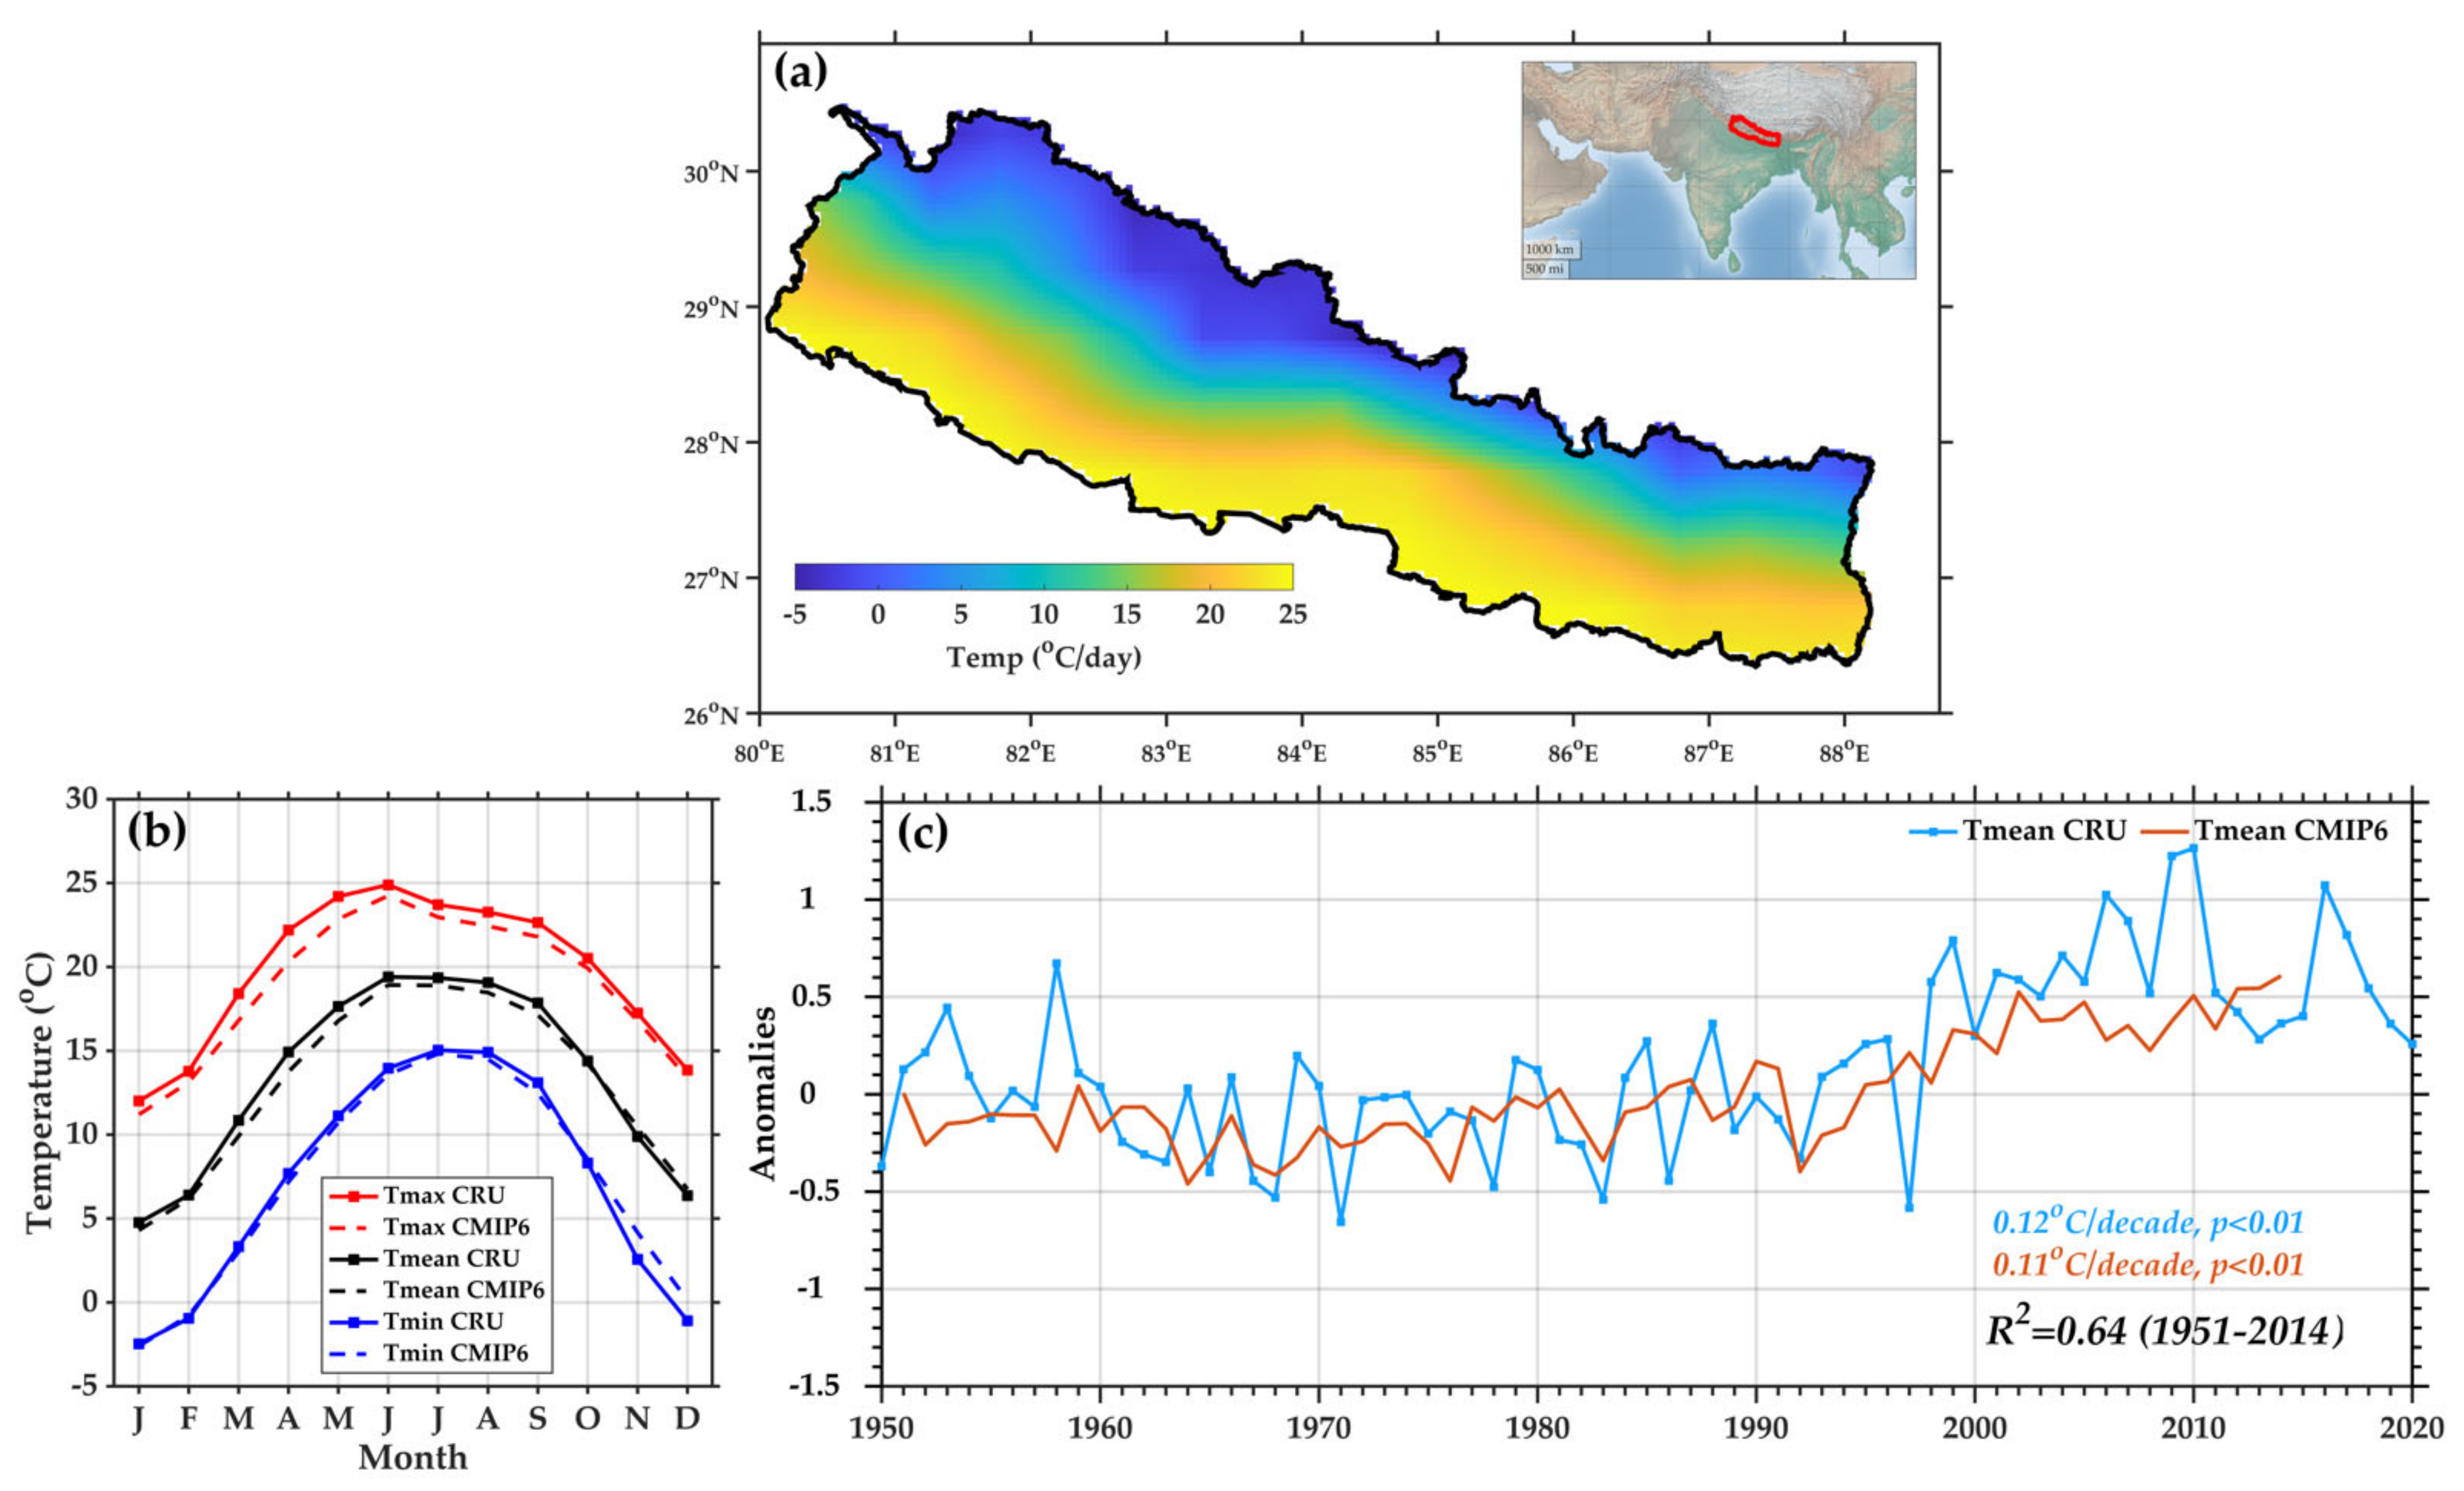
2.1. Study Area

Nepal (26°22′ to 30°27′ N 80°04′ to 88°12′ E), a south Asian country located between China and India, is a geographically diverse country (Figure 1a). The altitude varies from below 100 m to over 8000 m above sea level within a short latitudinal distance. It extends from ~885 km east to west and 130 km to 260 km from north to south, covering 147,516 km2. The country’s climate varies from subtropical to alpine [42]. The seasons in Nepal are categorized as pre-monsoon (March–May), monsoon (June–August), post-monsoon (September–November), and winter (December–February) [43]. Pre-monsoon is hot and dry, with prevailing westerly windy weather and generally localized precipitation. Monsoon is characterized by humid, southeasterly winds blowing from the Bay of Bengal and by widespread precipitation [42,44]. During the post-monsoon season, rainfall is significantly reduced, with November usually the driest month [45,46,47]. Winter (December–February) is generally dry, and some rains occur due to westerly disturbances, primarily in the western highlands [17].

2.2. Gridded Data

Daily gridded measurements of precipitation, Tmin, Tmax, Tmean, and cloud cover data over Nepal from the Climate Research Unit CRU TS v.4.05 (released on 17 March 2021) were used in this study [48]. CRU gridded datasets are derived by the interpolation of monthly climate anomalies from extensive weather station observations around the globe and provide climatological data at a 0.5° resolution over all land domains except for Antarctica. These datasets are updated regularly from several sources, i.e., CLIMAT messages exchanged internationally between World Meteorological Organization (WMO) countries, obtained as quality-controlled files via the UK Met Office; Monthly Climatic Data for the World (MCDW) summaries, obtained from the US National Oceanographic and Atmospheric Administration (NOAA), via its National Climate Data Centre (NCDC); and updates on the minimum and maximum temperatures for Australia, obtained from the Bureau of Meteorology (BoM). In addition, ad hoc collections of stations are incorporated (after quality control checks, including location, correspondence to existing holdings, and outlier checking). The CRU dataset is spatially and temporally complete over land, but where station data are unavailable or very limited, the interpolated gridded values are relaxed towards the mean for the baseline period 1961–1990 [48,49]. This is the case for DTR before 1950 in Nepal. Thus, we used CRU data only from 1950 to 2020 for the current study. More details on the datasets can be found in [48] and at https://crudata.uea.ac.uk/cru/data/hrg/ (accessed on 1 September 2021).

2.3. Climatic Indices

This study used the monthly Indo-Pacific climatic indices of NINO3.4 and DMI between 1950 and 2020 developed by the National Centers for Environmental Information (NOAA). We used the NINO3.4 and DMI from the preceding winter and autumn, as they appeared to be stronger. These datasets are freely available on the NOAA’s Physical Sciences Laboratory: https://psl.noaa.gov/gcos_wgsp/Timeseries/ (accessed on 1 September 2021).

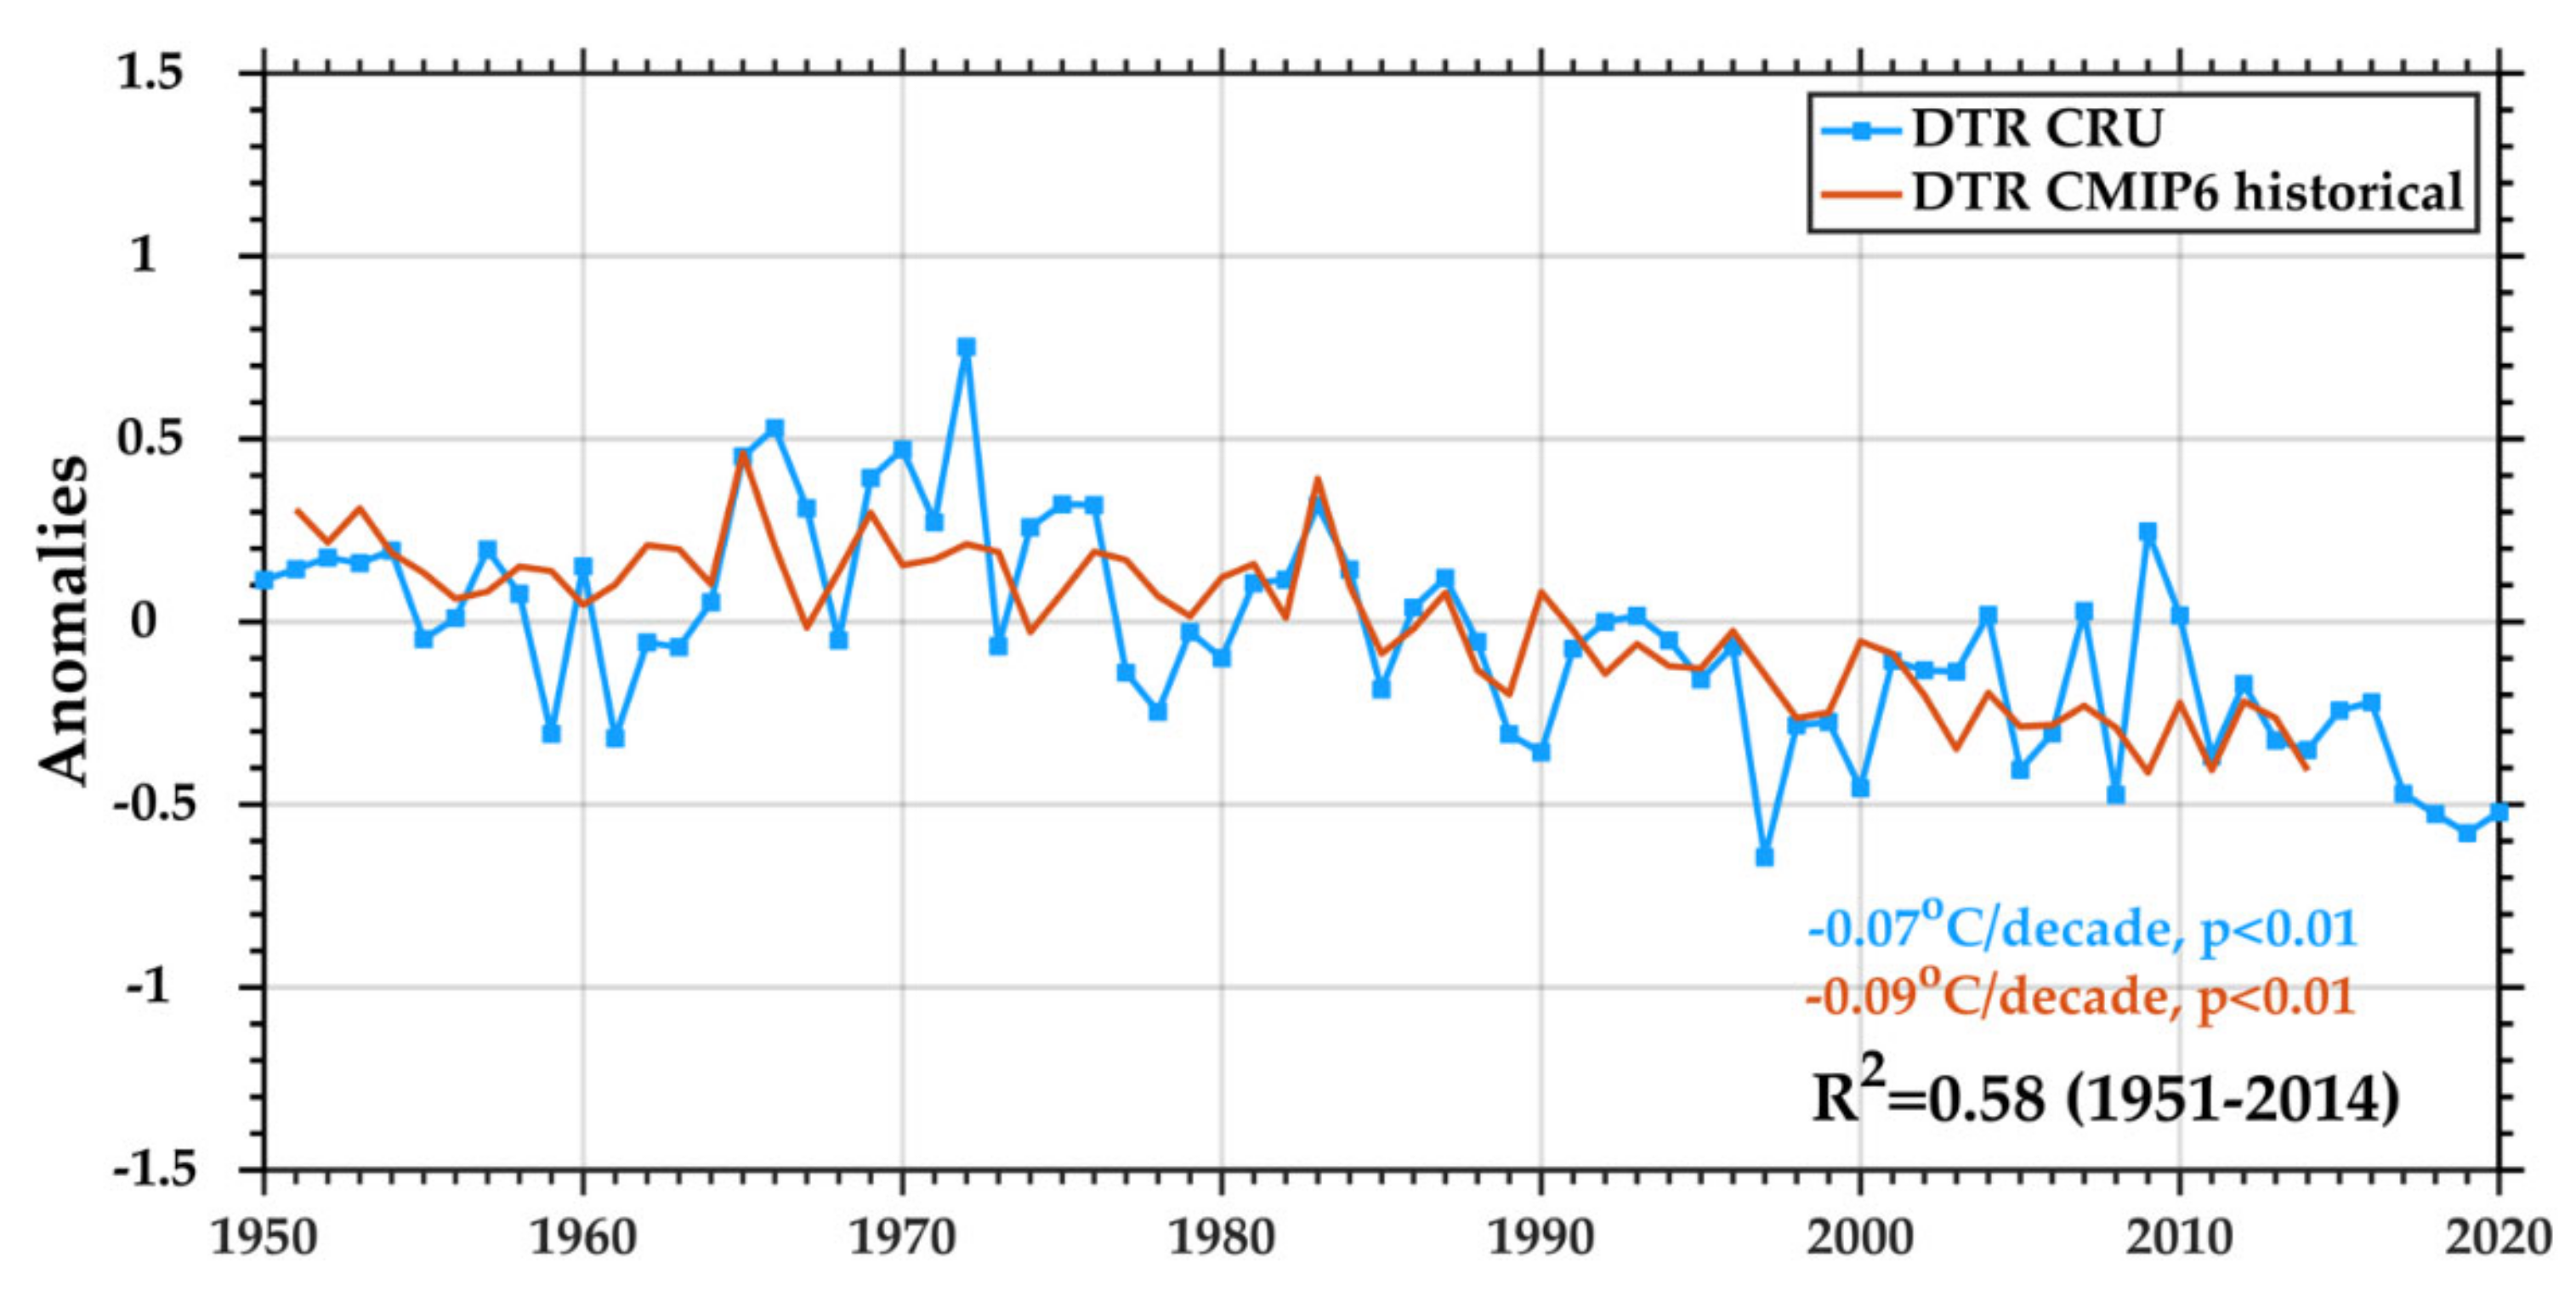
2.4. Model Simulations

We used 13 bias-corrected CMIP6 models (ACCESS-CM2, ACCESS-ESM1-5, BCC-CSM2-MR, CanESM5, EC-Earth3, EC-Earth3-Veg, INM-CM4-8, INM-CM5-INM-CM5-0, MPI-ESM1-2-HR, MPI-ESM1-2-LR, MRI-ESM2-0, NorESM2-LM, NorESM2-MM) for Nepal, with a 0.25° × 0.25° spatial resolution. These are the bias-corrected models developed for the South Asian countries by Mishra, Bhatia, and Tiwari [39]. Indian Meteorological Department (IMD) gridded datasets were used for the Indian region, and data generated by Sheffield, et al. [50] outside India were used for bias correction. Projections for the future are available under four Shared Socioeconomic Pathways (SSPs) (i.e., SSP1-2.6, SSP2-4.5, SSP3-7.0, and SSP5-8.5) scenarios for South Asia (India, Pakistan, Bangladesh, Sri Lanka, Bhutan, and Nepal). For the current study, 13 bias-corrected model ensembles of Tmax and Tmin data from CMIP6 historical (1951–2014) and projected (2021–2100) under three scenarios, i.e., SSP1-2.6, SSP2-4.5, and SSP5-8.5, representing the low, intermediate, and high greenhouse gas emissions, respectively [51], were downloaded from https://zenodo.org/record/3873998#.YKOjiqgzY2w (accessed on 1 February 2021). More details on the CMIP6 bias correction procedures can be accessed from https://arxiv.org/abs/2006.12976 (accessed on 1 February 2021).
The spatial distribution of the mean monthly temperatures over Nepal between 1950 and 2020 is presented in Figure 1a. Temperature variation over the country is directly associated with altitude, local winds, and season [29,52,53]. The Tmean varies considerably from south to north; the maximum (minimum) temperature is observed in the flat southern strip (high mountains or the Himalayas in the north) (Figure 1a). The seasonal cycle of the CRU and CMIP6 historical for temperatures across Nepal is presented in Figure 1b. CMIP6 slightly underestimated the monthly variation of the CRU temperature; however, both CRU and CMIP6 historical mean annual temperature anomalies displayed very similar magnitudes (~0.12 °C/decade, p < 0.01) of increasing trends during 1951–2014, indicating that CMIP6 can represent the temperature variation and trend over Nepal (Figure 1c).

2.5. Methodology

Daily DTR data were obtained by subtracting the daily minimum temperature from the daily maximum temperature. Further, the monthly, seasonal, and annual DTR were calculated by averaging daily DTR for each month. For this purpose, the daily DTR was averaged for each month; subsequently, the average DTR for each month was arranged according to season (pre-monsoon, monsoon, post-monsoon, and winter). For the historical (1951–2014) and projected (2021–2100) CMIP6 datasets, 13 bias-corrected models were averaged to generate the Tmax and Tmin daily time series. These CMIP6 data were also validated across Nepal using CRU datasets (Figure 1b,c). Next, spatially averaged annual and seasonal mean DTRs were obtained through a yearly and seasonal average of daily DTR. Next, the temporal averages were conducted for annual and seasonal (pre-monsoon, monsoon, post-monsoon, and winter) analysis to obtain the DTR time series for Nepal.
The Mann–Kendall (MK) statistical test [54,55] was used to assess the monotonic upward or downward trend of the climatic variables for seasonal and annual timescales. The test was proposed by Mann [54], further studied by Kendall [55], and approved by Hirsch and Slack [56]. The MK statistical test compares the relative magnitudes of sample data rather than the values themselves and uses them to identify the monotonic trends present in time series data. It tests either to reject the null hypothesis (Ho) or to accept the alternative hypothesis (Ha). The Ho of the test is that there is no trend in the data, and the Ha represents a monotonic increasing or decreasing trend [54]. Further, the test statistic (S) is computed using Equations (1) and (2), and the variance is calculated using Equation (3). Many studies have used the MK test to detect a trend [4,5,57,58,59].
S = i = 1 n 1 j = i + 1 n s g n x j x i
sgn x j x i = 1           i f   x j x i > 0 0         i f   x j x i = 0 1     i f   x j x i < 0
where xi and xj are the values of sequence i, j; n is the number of observations for a particular climate data. If n is higher than 8, statistic S approximates to normal distribution. The mean of S is 0, and the variance of S can be acquired as follows:
    V a r S = n n 1   2 n + 5 18
Next, the test statistic Z is generated using Equation (4).
Z = S 1 V a r S ,       i f   S > 0 0 ,                       i f   S = 0 S + 1 V a r S ,         i f   S < 0
Positive and negative Z values in Equation (4) indicate increasing and decreasing trends, respectively. For a two-tailed test, the null hypothesis (Ho) is rejected at a given significance level α for an absolute value of |Z| ≥ Z1 − α/2. In this study, the α is taken at p < 0.1 (90%), p < 0.05 (95%), and p < 0.01 (99%). Furthermore, the magnitude of a time series trend was estimated by Sen’s non-parametric estimator (Equation (4)); the trend is calculated by Equation (5); where β is Sen’s slope [60], x denotes the climatic variable, and I and j are indices. The values β > 0 and β < 0 indicate upward and downward trends in a time series, respectively.
β = M e d i a n x i x j i j   f o r   j < i
Additionally, a Pearson correlation coefficient (R2; Equation (6)) was performed using the spatially averaged time series of cloud cover, precipitation, and sea surface temperature for their possible effects on or association with DTR.
R2= √(Cov(x,y)/σx σy)
where R2 = Pearson correlation coefficient and Cov(x,y) represents the covariance of the climatic variables x and y. The values σx and σy denote the standard deviation of x and y, respectively.

3. Results and Discussion

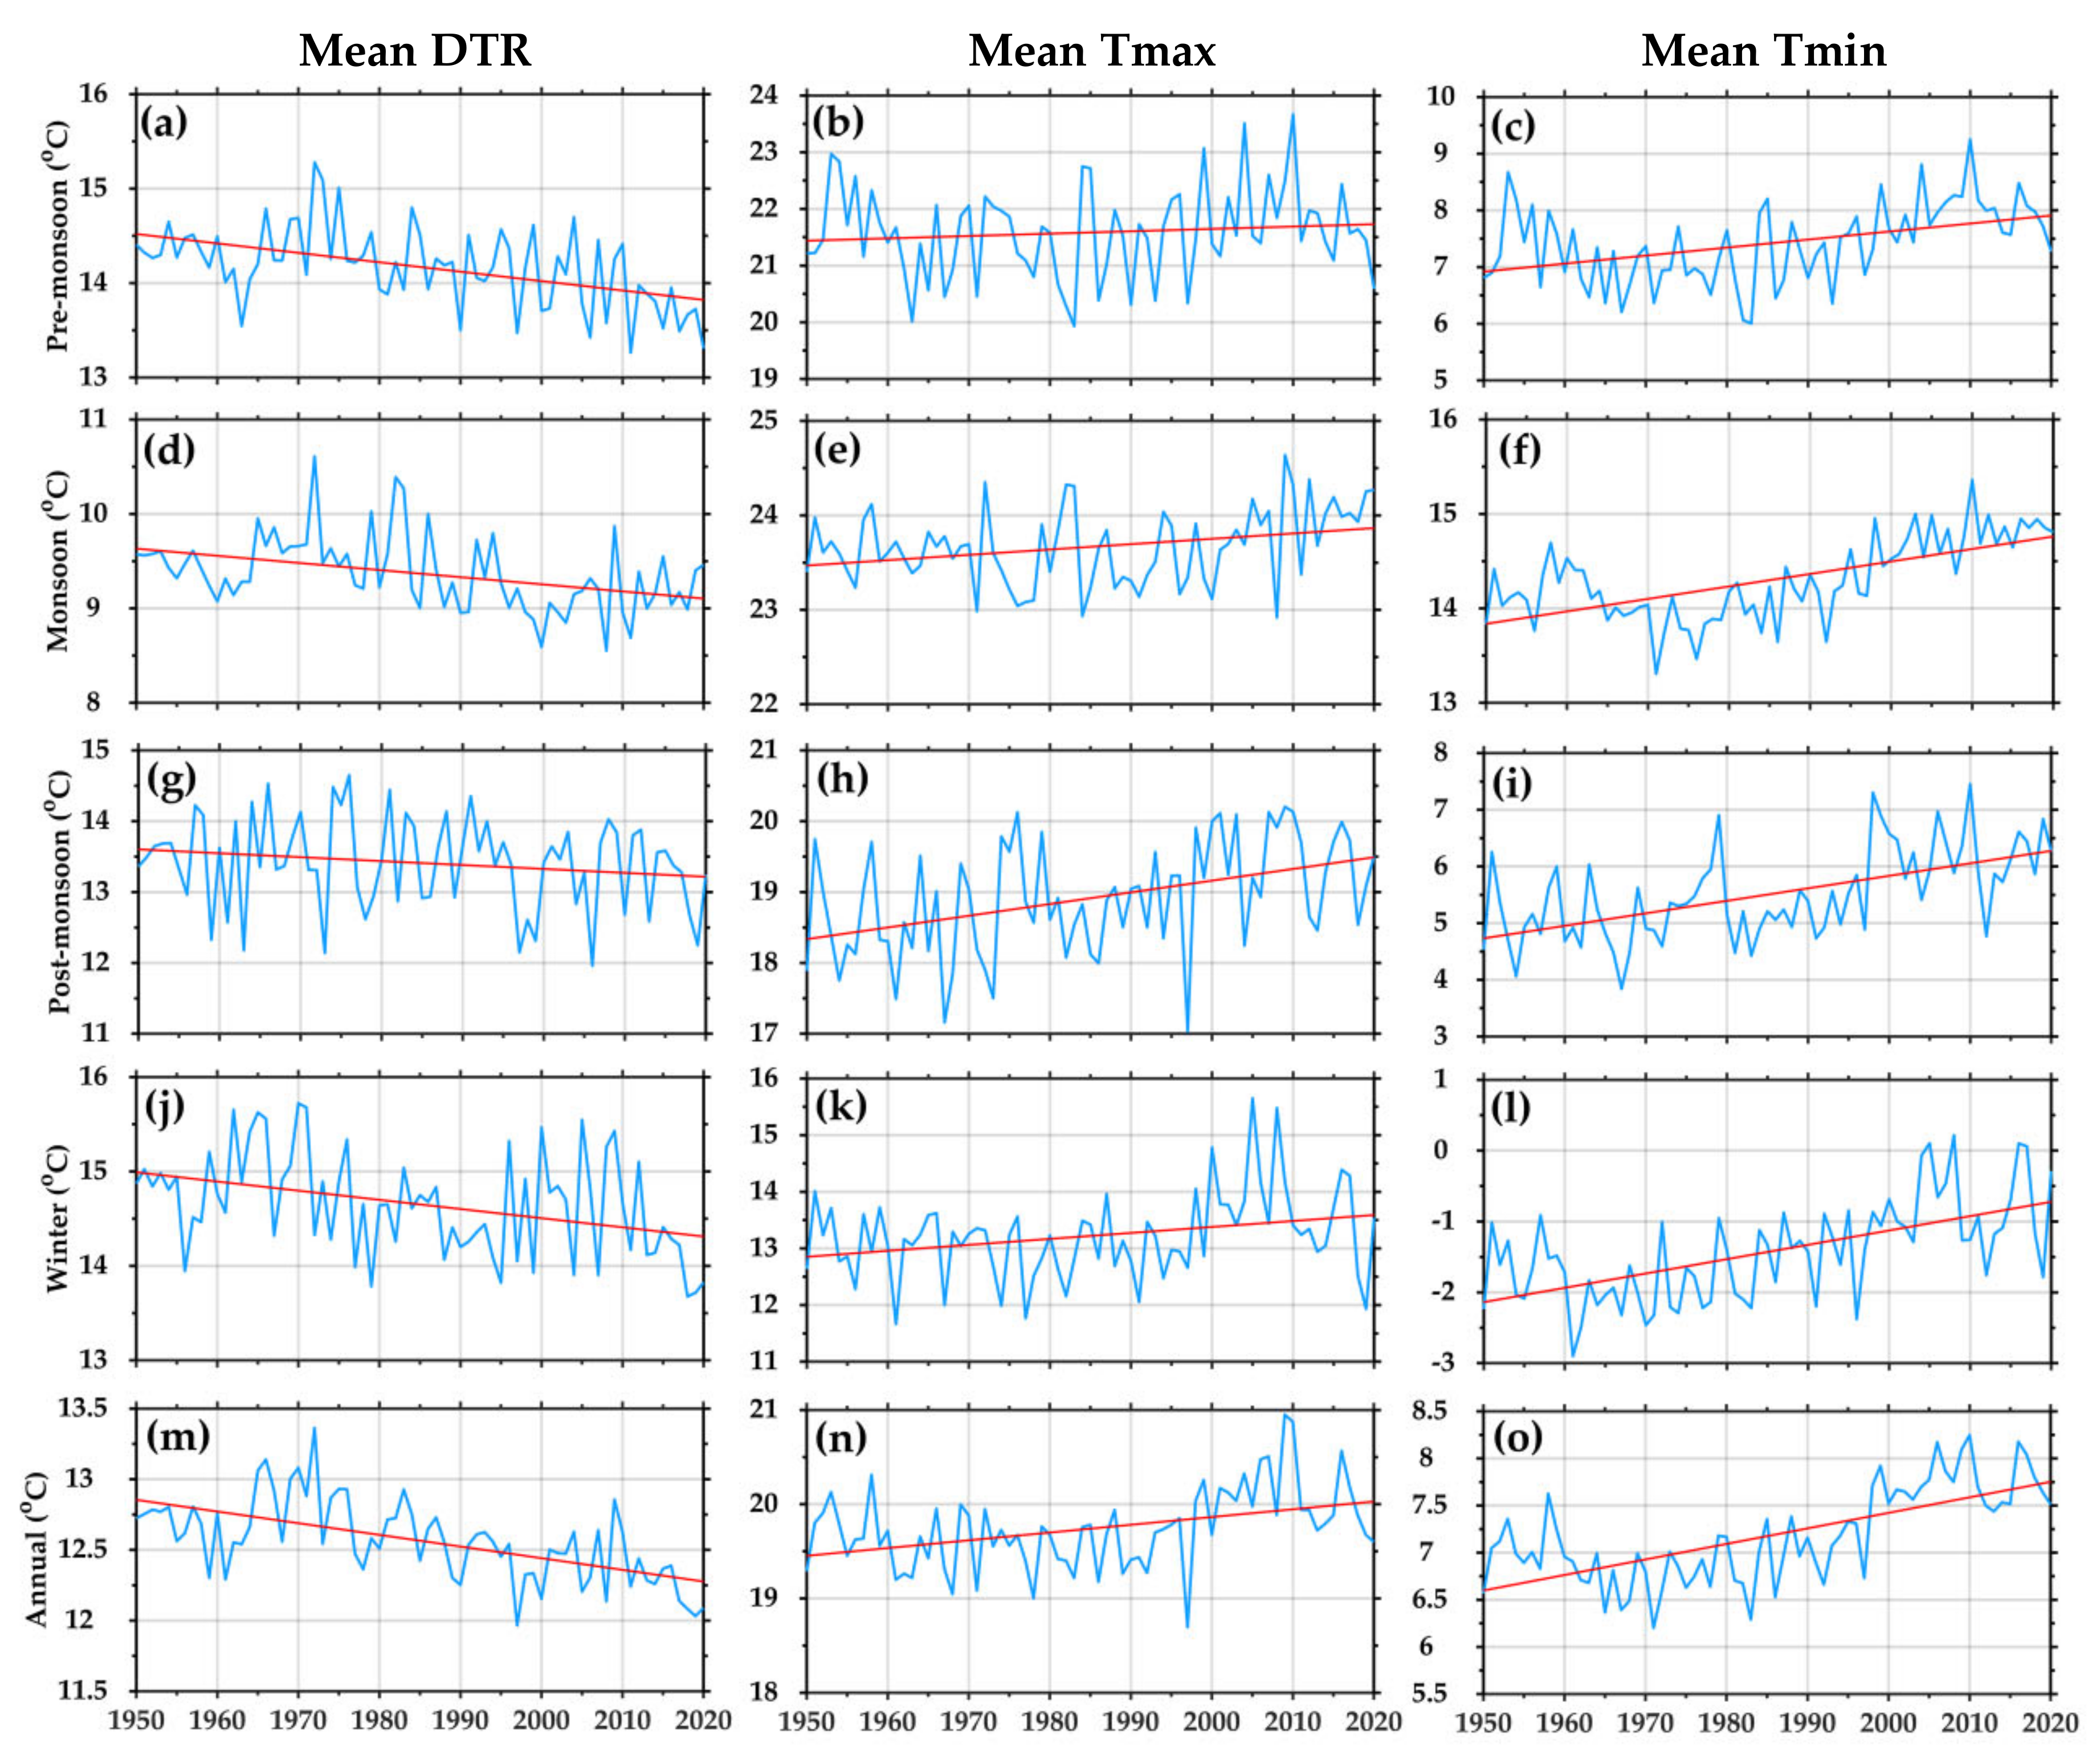
3.1. Seasonal and Annual DTR Trends over Nepal

The MK statistical test and Sen’s Slope estimator were performed using the CRU datasets to present the annual and seasonal DTR trends and their magnitudes across Nepal from 1950–2020. An increasing annual and seasonal Tmax and Tmin trends were observed across Nepal. The Tmin increment rate was faster, ~2 times higher than the Tmax (Figure 2 and Table 1). Meanwhile, [29] also mentioned the warming trend in all seasons, except the cooling in the winter season, especially over the southern lowland of Nepal. Decreasing seasonal DTR trends were observed during the study period, with a significant decrease (Figure 2a,d,g,j) in the pre-monsoon (−0.09 °C/decade) and winter (−0.09 °C/decade) compared to the monsoon (−0.07 °C/decade), and post-monsoon season (−0.06 °C/decade) (Table 1). It was found that, in the pre-monsoon and winter season, the Tmax increased at a rate of 0.06 and 0.11 °C/decade, respectively, which is smaller than Tmin (0.15 and 0.20 °C/decade, respectively) (Table 1). Similarly, a significant decreasing DTR trend at a rate of −0.08 °C/decade was observed in the annual timescale (Figure 2m, Table 1). Furthermore, a recent study noted the decreasing trend of annual DTR at a rate of 0.02 °C/decade during 1991–2016 in India [57]. The decreasing trend and higher DTR variability were observed mainly after the 1950s. This variation is similar to the global DTR trend (−0.036 °C/decade) from 1901–2014, mainly due to the significant decrease in DTR from 1951 to 2014 [6]. Overall, the results support the previous conclusion that the decreasing DTR is mainly due to the Tmin increasing faster than the Tmax [4,61]. A low DTR can exert adverse health impacts on human beings [10]; it has been observed that the increased occurrence of cardiovascular diseases is more pronounced in females and the elderly than males and adults [62].

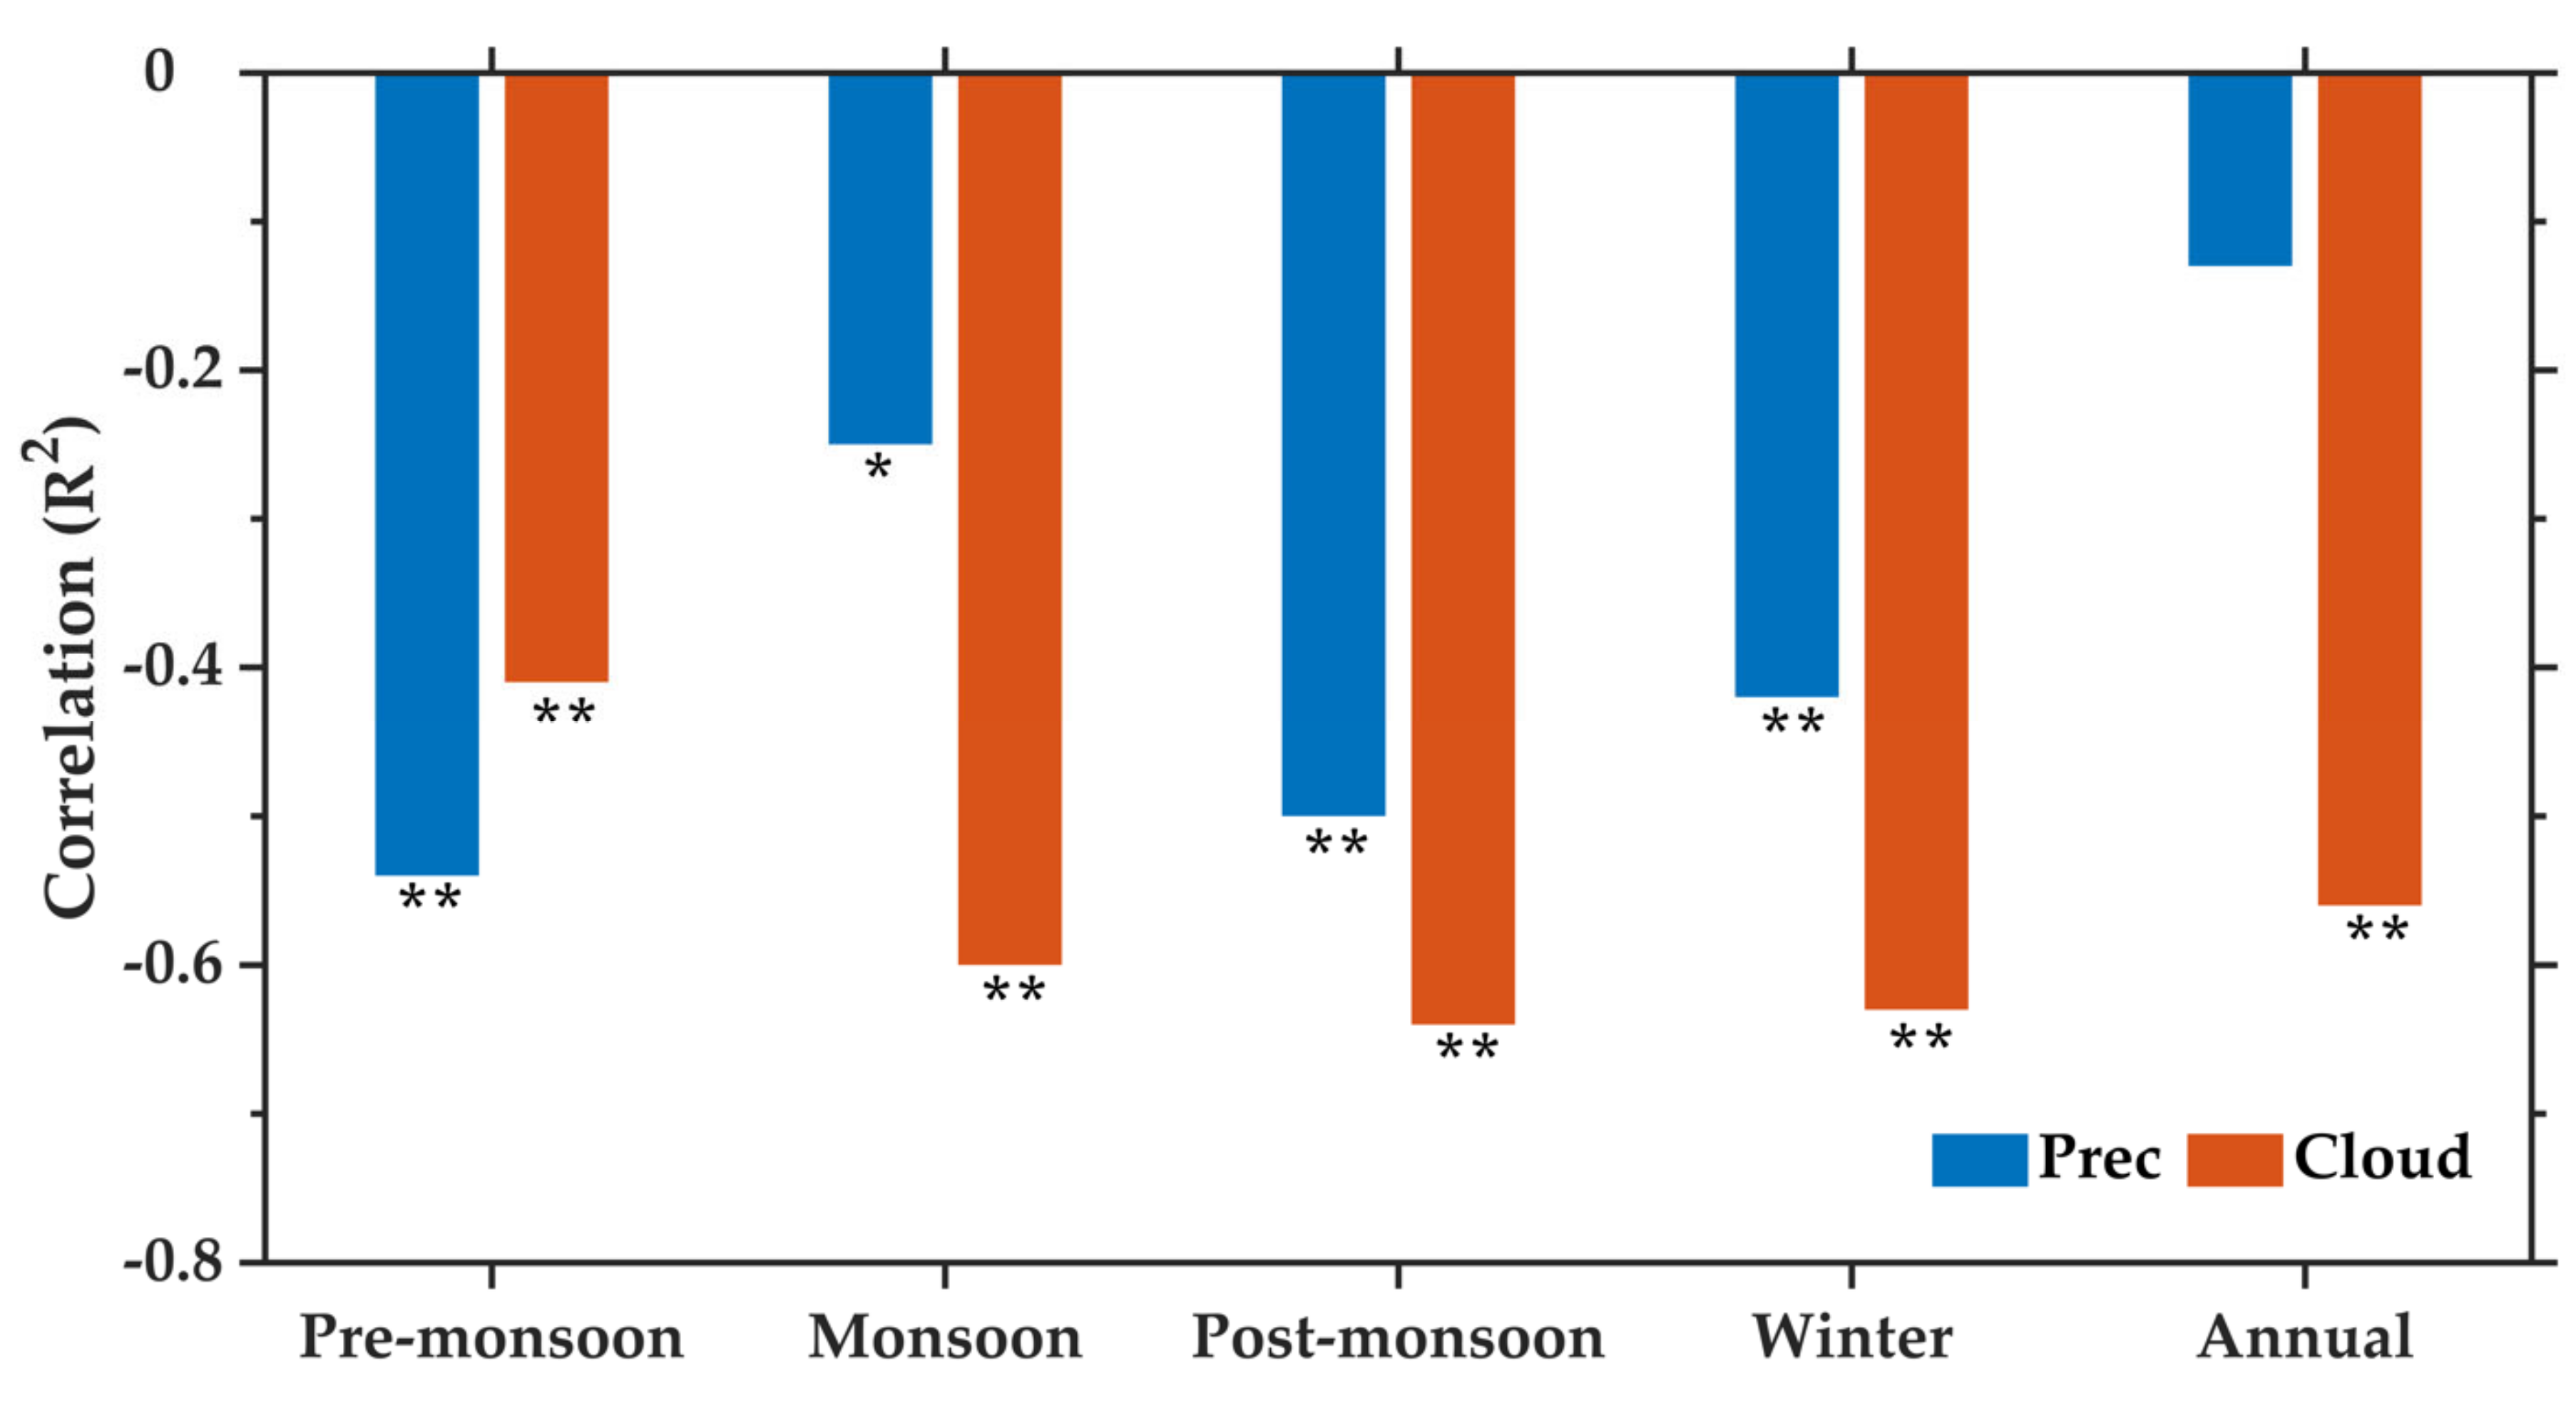
3.2. Factors Affecting DTR

The MK and Sen’s slope estimator was used to reveal the annual and seasonal cloud cover and precipitation trends and their magnitudes, presented in Table 2. It was found that cloud cover increased across Nepal, with a significant increasing trend in the pre-monsoon (0.56%/decade) and winter (0.42%/decade) at 99% and 95% confidence levels, respectively. However, an insignificant increasing trend was observed for the monsoon and post-monsoon seasons. The annual cloud cover displayed an increasing rate of 0.36%/decade (p < 0.05) during the study period. Similarly, increased cloud cover was observed over the Indo-Gangetic plains and northeast India during 1961–2010 [63]. The increase in the cloud cover over the country represents a cooling effect during those months [29]. Moreover, the precipitation trend over Nepal exhibited a decreasing trend, except during the pre-monsoon season. The pre-monsoon precipitation increased at a 3.90 mm/decade rate, significant at a 99% confidence level. By contrast, a larger decreasing rate was observed in the monsoon season (−4.36 mm/decade, p < 0.01) than in the post-monsoon (−0.79 mm/decade, p = 0.50) and winter (−0.42 mm/decade, p = 0.44). Moreover, the annual precipitation was observed to decrease by −0.48 mm/decade and p = 0.52. Similarly, a study that used 143 stations over Nepal also demonstrated decreasing annual precipitation, except for the western high-hills from 2001–2016 [45].
Previous studies have already highlighted that the considerable DTR variation is due to the total cloud cover and precipitation [61,64,65]; therefore, their correlation (Equation (6)) with the annual and seasonal DTR is presented in Figure 3. The DTR correlation with the cloud cover and precipitation was performed at different confidence levels. The weaker correlation in the annual timescale (−0.13, p = 0.28) indicates that precipitation may not influence DTR on an interannual timescale; however, this variation may change on the decadal and multidecadal timescales [64]. Conversely, a significant negative correlation was observed on a seasonal timescale for winter (−0.42, p < 0.01), pre-monsoon (−0.54, p < 0.01), monsoon (0.25, p < 0.05), and post-monsoon (−0.50, p < 0.01). The winter, pre-monsoon, and post-monsoon seasons are comparatively drier than the monsoon; therefore, the result indicates low DTR during high precipitation and vice-versa. Further, it was suggested that the precipitation deficit led to an increase in DTR extremes [66].
We further analyzed the possible relationship between DTR and the cloud cover over Nepal. A significant negative correlation was observed for all the seasons and annual time scales, with the cloud cover at a 99% confidence level. The correlation was <−0.55 for the monsoon, post-monsoon, winter, and annual, except for the pre-monsoon (−0.41); this indicates that cloud cover can substantially affect DTR variation over the country (Figure 3). Similarly, the inverse relationship between DTR and precipitation and cloud cover is reported in northern Pakistan [67] and Thailand [68]. Further, the cloud cover demonstrated increasing trends during all the seasons (Table 2), indicating that increased cloud cover results in a decrease in Tmax and an increase in Tmin. Moreover, air pollution and aerosols are highest during the winter in Nepal [69]; the increase of pollution in the air combined with temperature inversion creates smog and fog (https://airlief.com/air-pollution-during-winter/ (accessed on 1 September 2021)). The increasing cloud cover/fog over the country may have reduced the DTR by dampening the diurnal cycle of the radiation balance, as suggested by [70,71].
Additionally, to analyze the cloud and precipitation’s relationship with the DTR trend, we developed a linear regression model between the interannual variations of DTR and the climatic variables (DTR = a + b*cloud + c*precip). Comparing the regression-based trends in Appendix A Table A1 with the observed DTR trends in Table 1, the regression captures the sign of the DTR trends but not their full magnitude (particularly in the monsoon and post-monsoon seasons). The results further revealed that the significant decrease in DTR during pre-monsoon can be linked to the significantly increased precipitation over Nepal, as high precipitation dampens the Tmax through evaporative cooling [65]. Further, an increasing trend of cloud cover during pre-monsoon and winter matches well with the long-term decreasing trend of DTR. The increased cloudiness and precipitation reduced the DTR, mainly for the pre-monsoon and winter seasons, but additional factors such as attenuating solar radiation by increasing aerosols might also have played a role during other seasons.

3.3. Relation with Climatic Indices

The seasonal and annual DTR over Nepal is correlated with the NINO3.4 in winter and DMI in autumn, as presented in Table 3. The summer DTR corresponds positively with the ENSO but with a weak relationship (0.27, p < 0.05). A previous study has shown that the warmer surface air temperature of India is associated with the positive sea surface temperature (SST) anomalies over the equatorial eastern–central Pacific, representing El Niño effects [72]. La Nina Phase can be associated with decreased DTR, which induces stronger low-level winds and greater moisture availability, and reduces incoming radiation; the opposite is the case for warmer temperatures during the El Nino phase [73]. On the other hand, weak-to-moderate influences of DMI were observed in the spring, autumn, winter, and annual phases, in which the ENSO influence was not observed. The results indicate that the positive DMI phase (warming in the western Indian Ocean > cooling in the eastern Indian Ocean) can reduce DTR. Similarly, the temperature during spring, autumn, and winter can be influenced by the Indian Ocean SST [73]. Overall, the decrease in DTRs is weakly related to the Sea Surface Temperature (SST) variation in the tropical Pacific and the Indian Ocean.

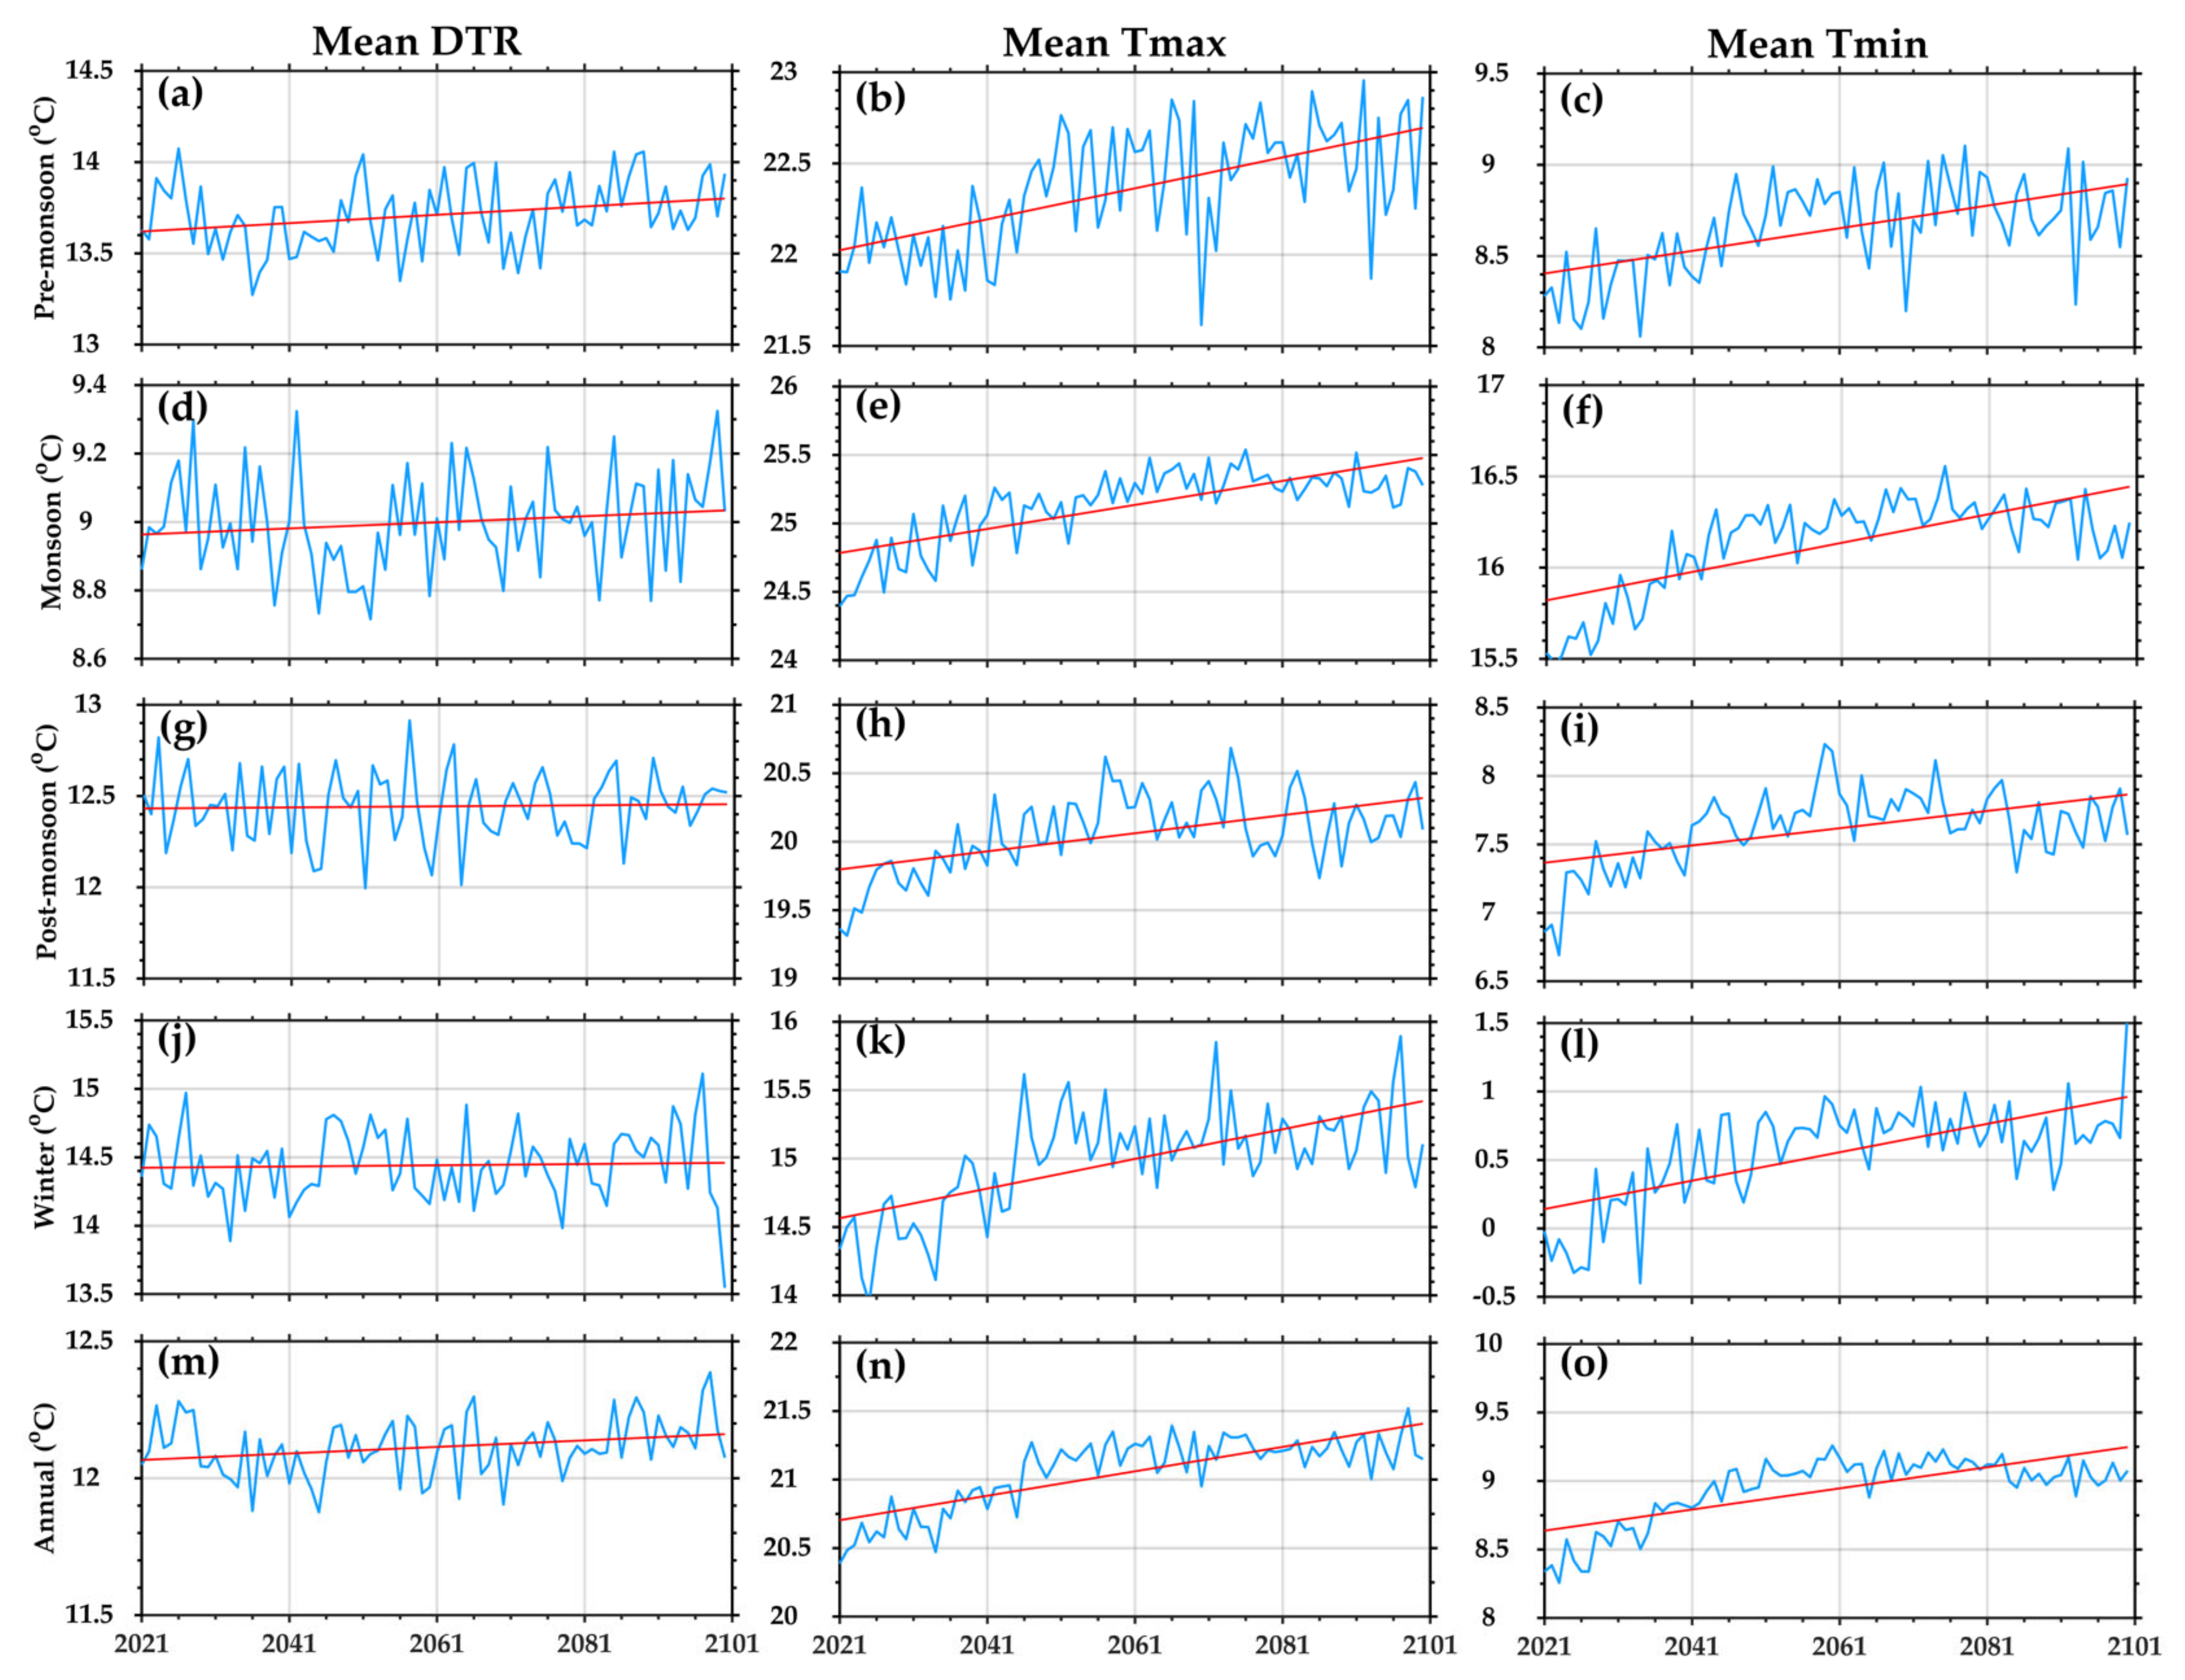
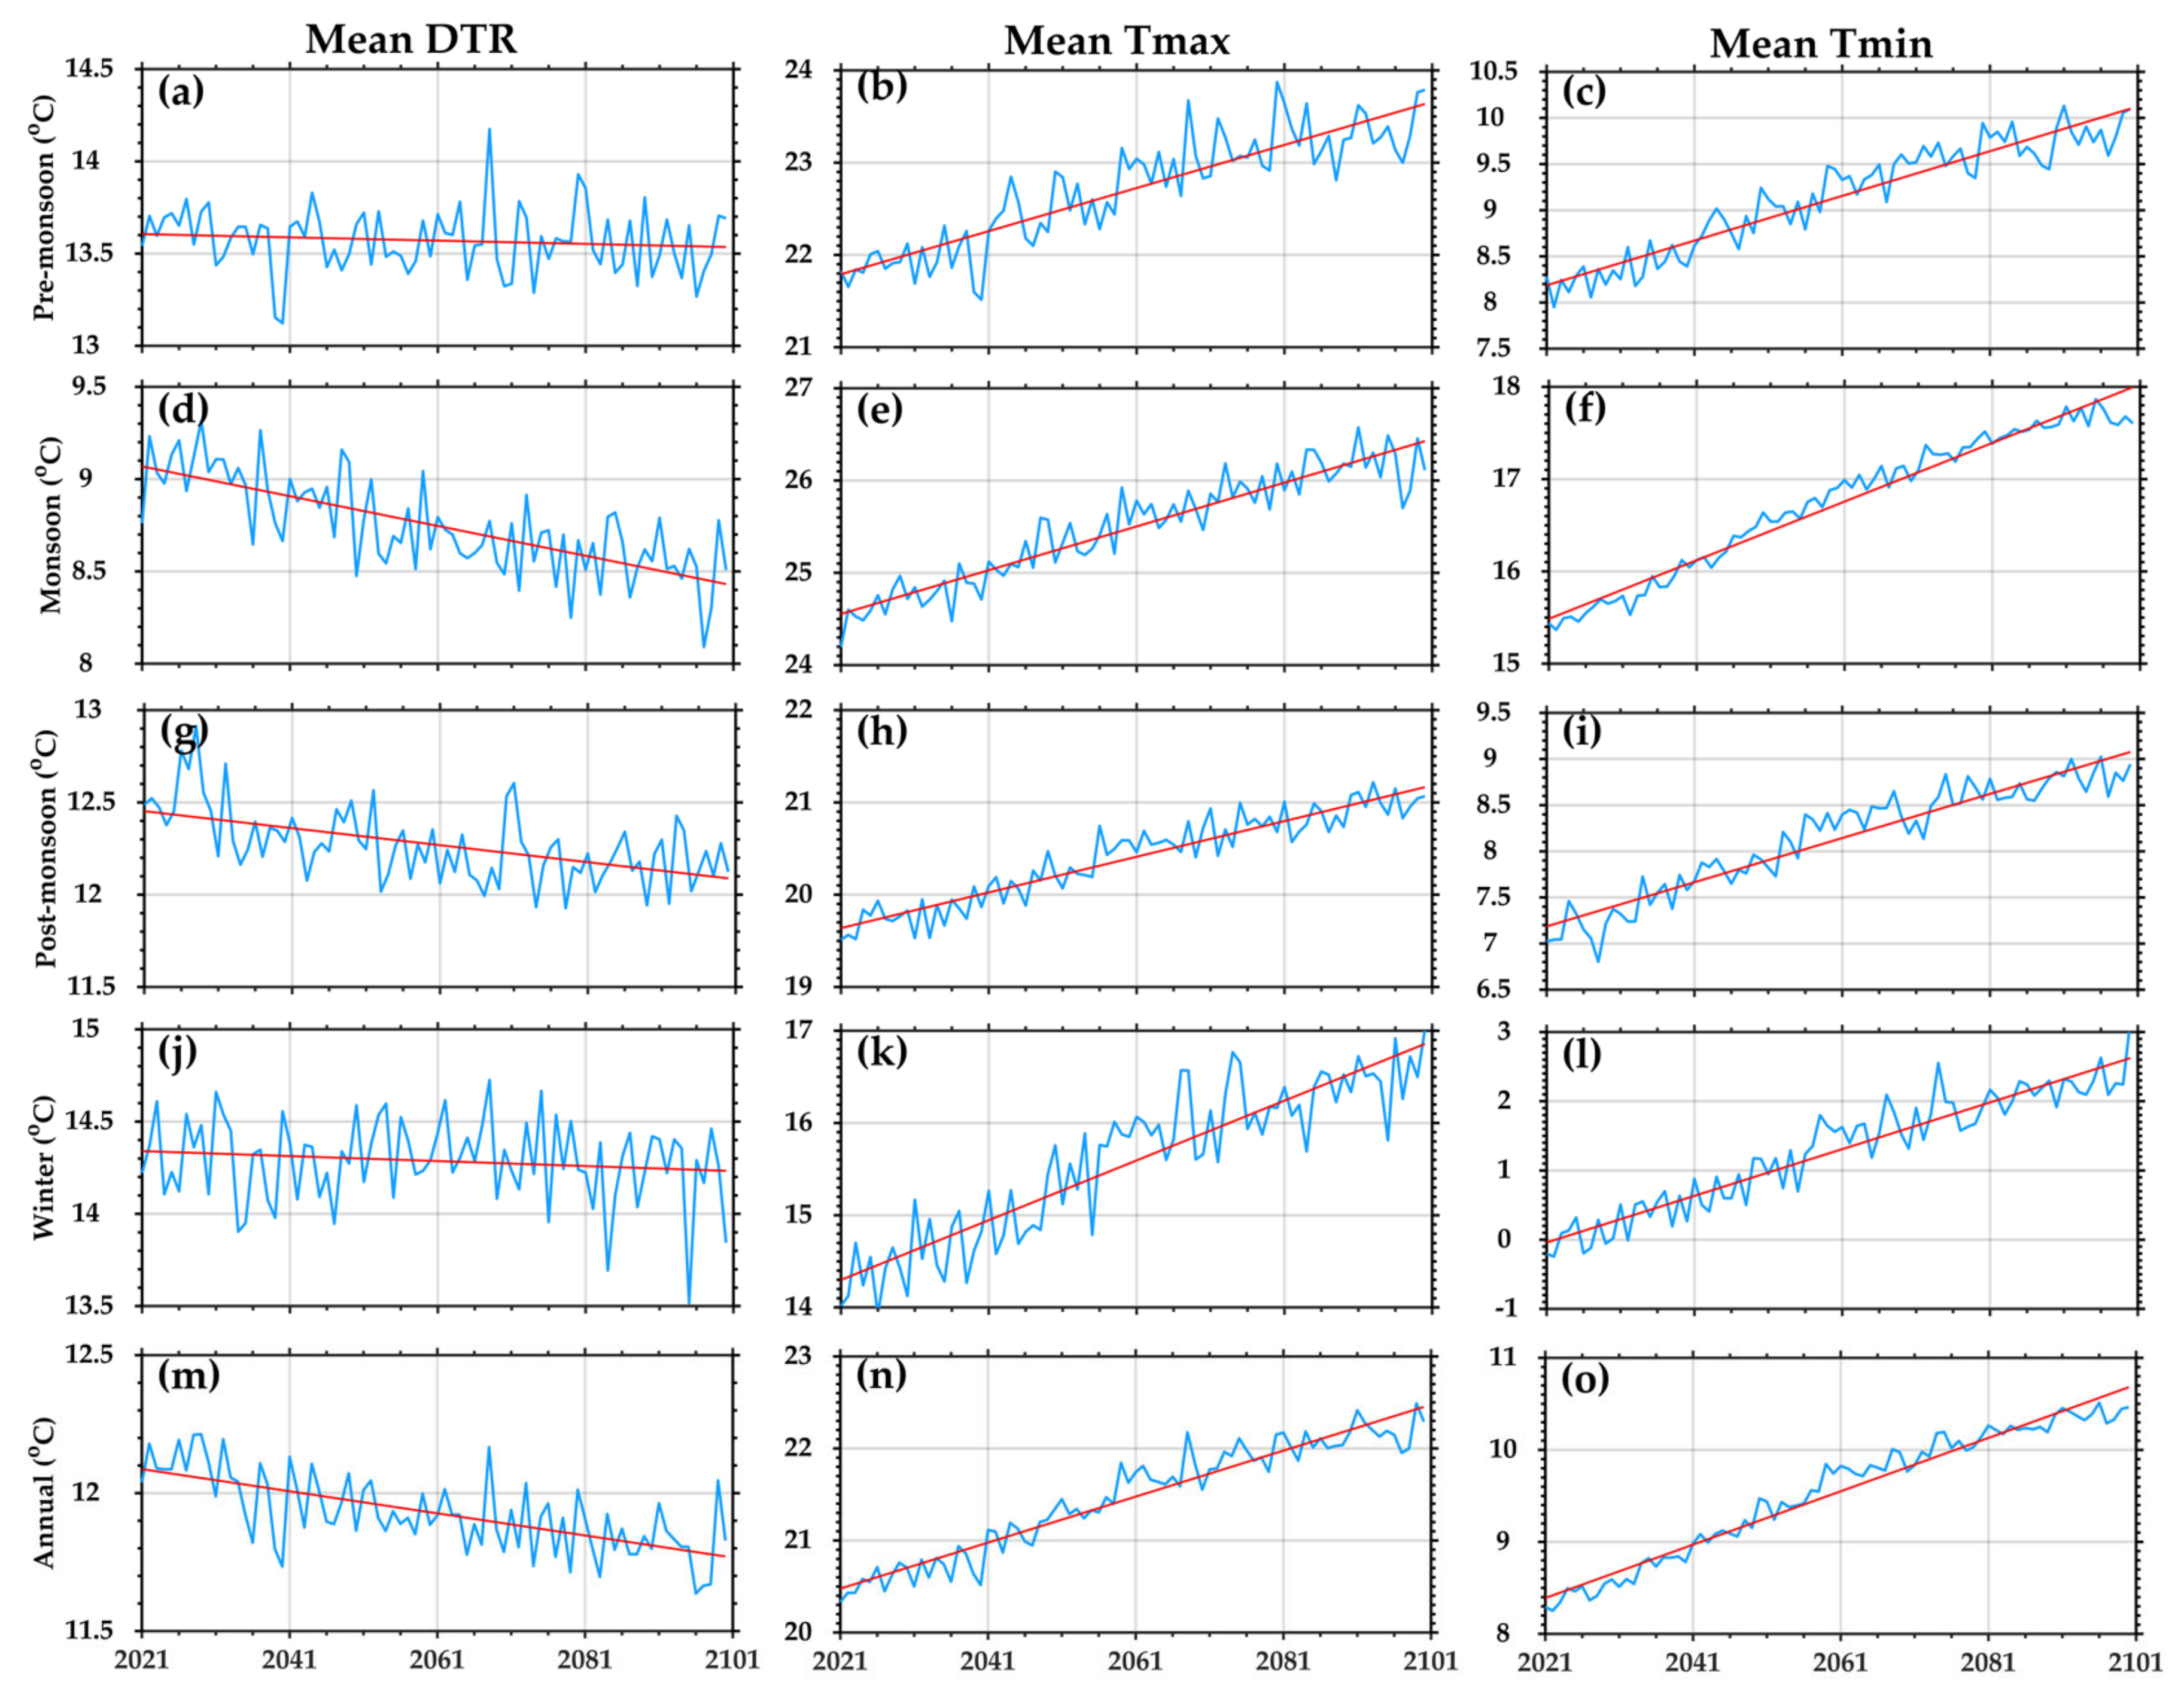
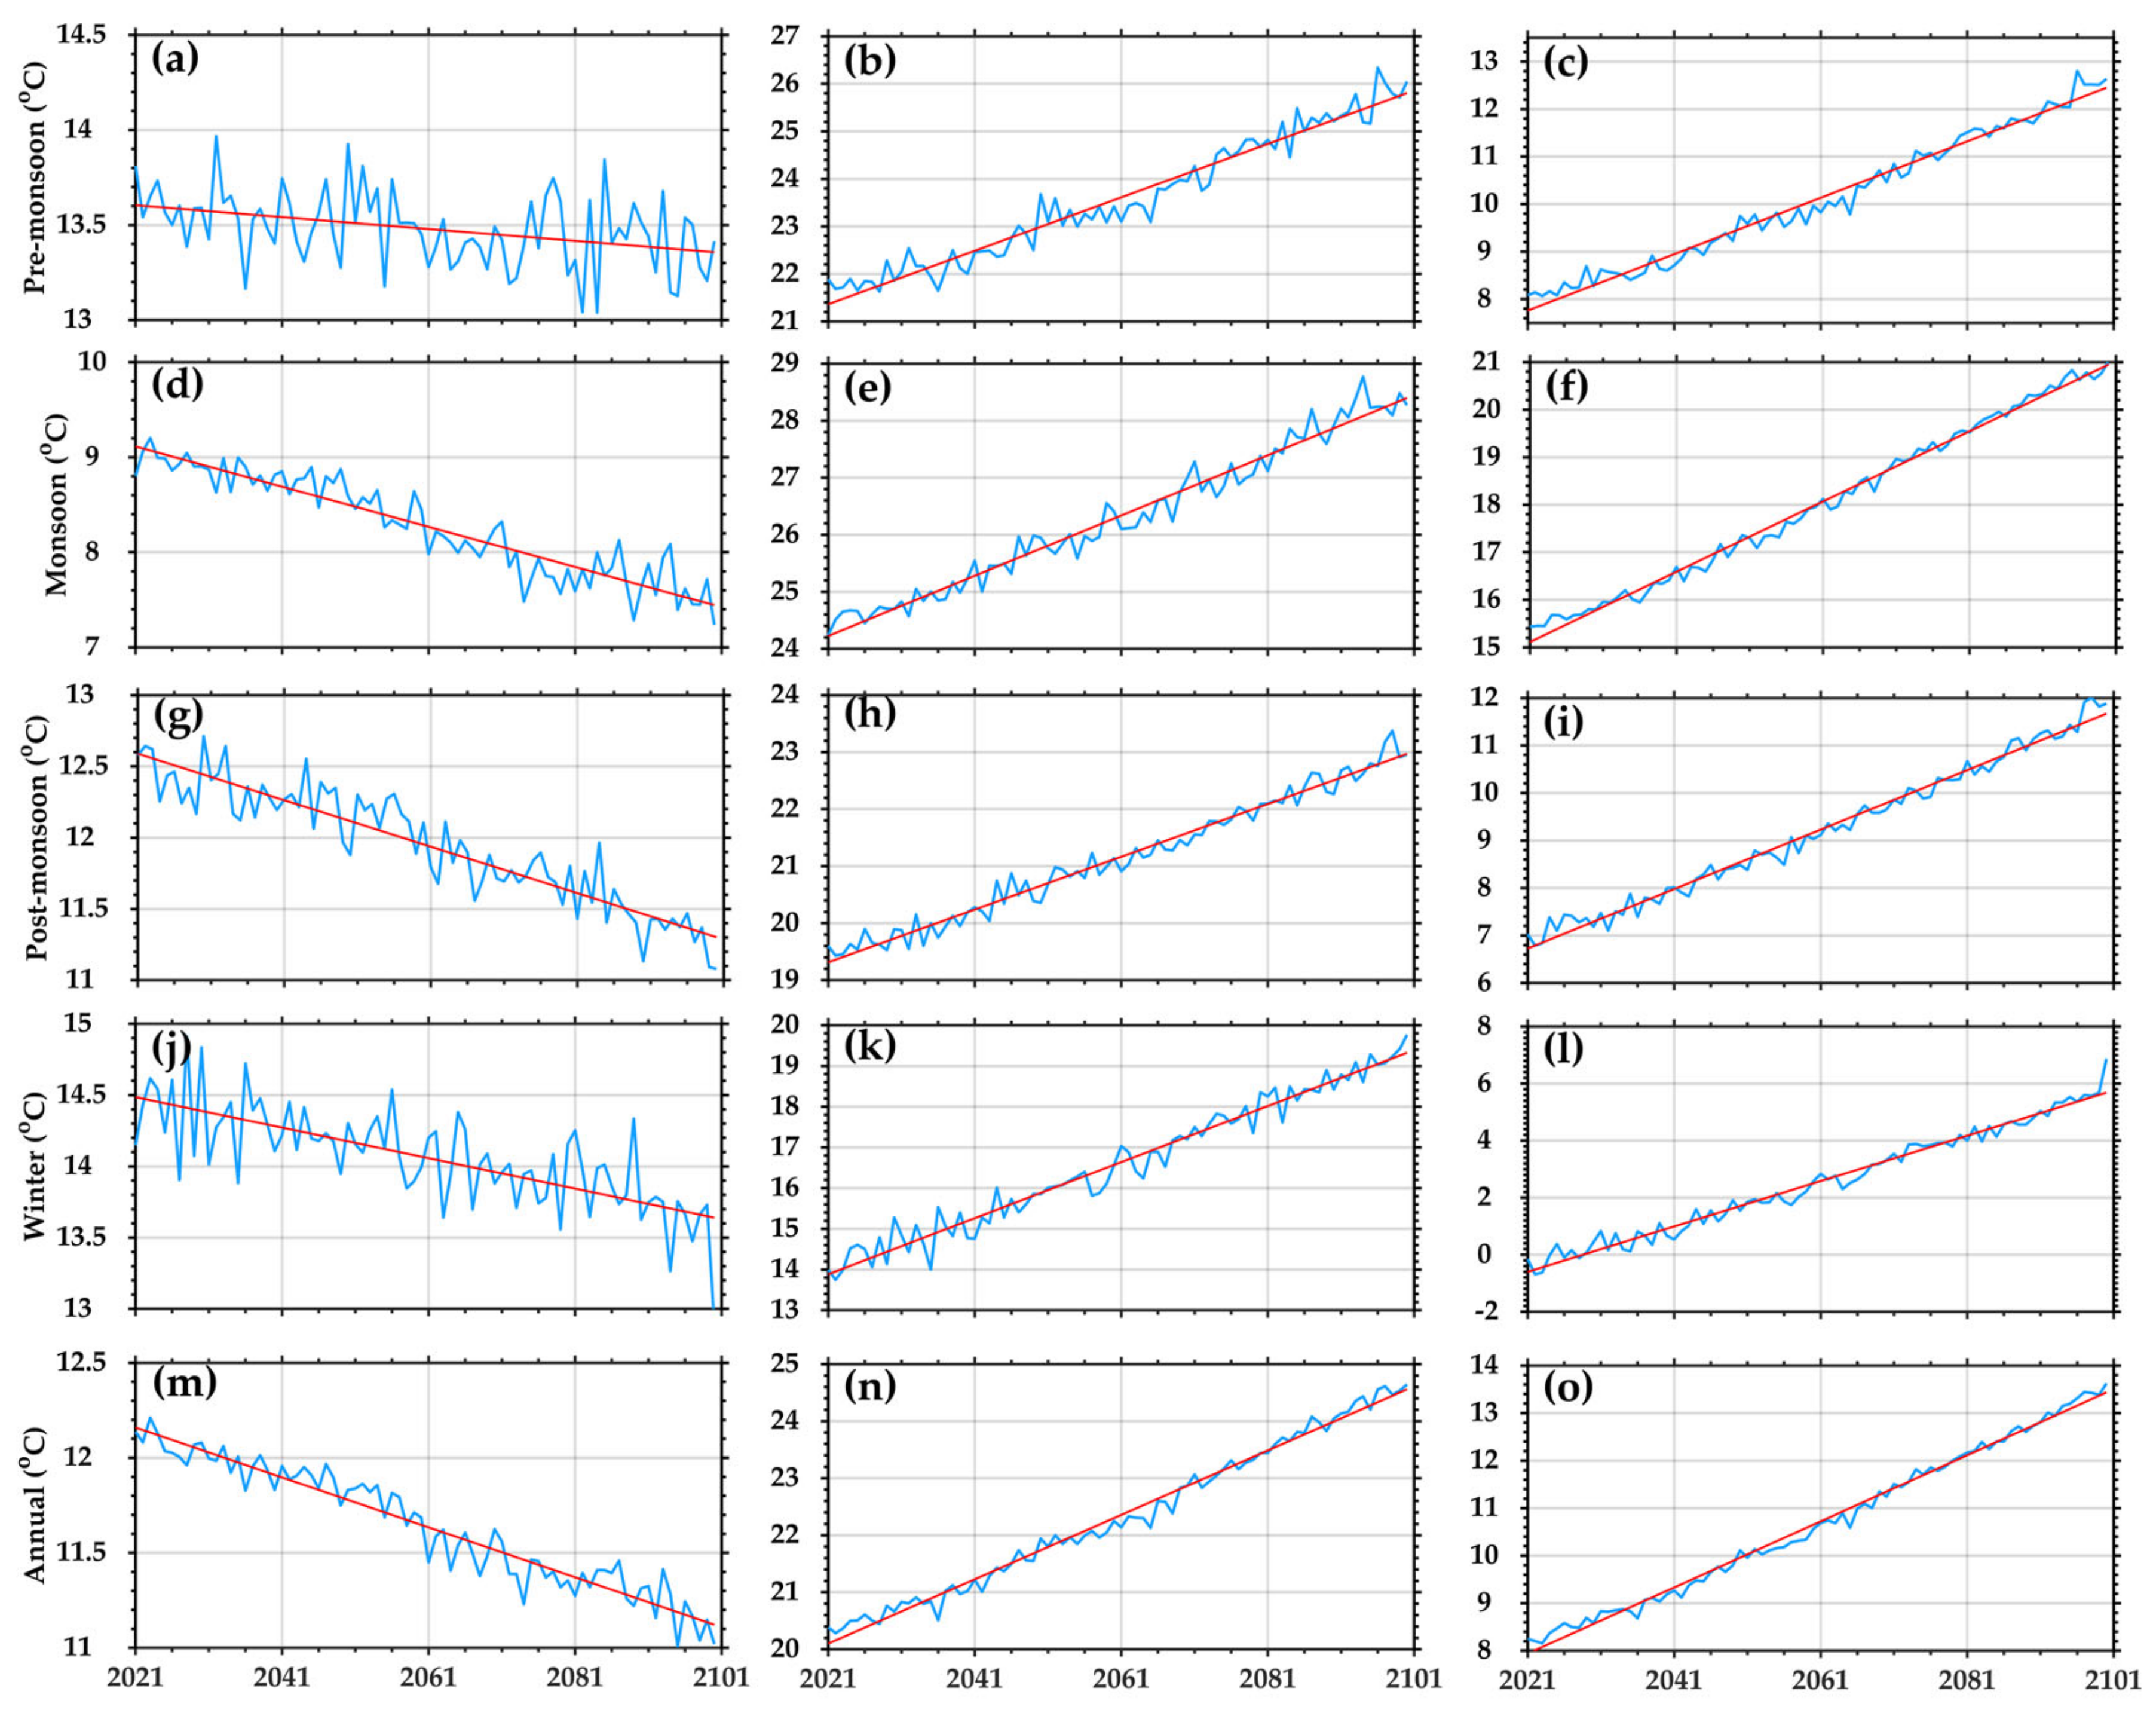
3.4. Future Projection of DTR

A significant decreasing trend in annual DTR was observed in both CMIP6 historical (−0.09 °C/decade, p < 0.01) and CRU data sets (−0.07 °C/decade, p < 0.01). The results indicate that CMIP6 can simulate the temporal trend of DTR across Nepal (Figure A1). The ensemble mean of the 13 bias-corrected CMIP6 datasets was used to project (2021–2100) the annual and seasonal trends of DTR, Tmax, and Tmin under three different scenarios. Under the SSP1-2.6, a significantly increasing trend in projected Tmax compared with Tmin for pre-monsoon leads to an increase in DTR at a rate of 0.02 °C/decade (p < 0.05) (Figure 4a–c and Table 4). The projected Tmax and Tmin feature the same increasing trends, presenting no change in DTR trend during the monsoon, post-monsoon, and winter seasons (Figure 4d–l). Annually, DTR is likely to increase at a rate of 0.01 °C/decade (p < 0.05) due to a slightly higher increasing trend in Tmax than in Tmin (Figure 4m–o, Table 4). A previous study projected an annual and seasonal temperature increase across Nepal for all three scenarios, in which the mean temperature is likely to increase by 1.3–4.5 °C [41].
The projected DTR, Tmax, and Tmin under the SSP2-4.5 scenario are presented in Figure 5. The result highlights that Tmin (monsoon, post-monsoon, winter, and annual) will feature a higher increasing trend than Tmax except for pre-monsoon. On a seasonal scale, the DTR is projected to decrease significantly at a rate of −0.08 °C, −0.05 °C, −0.02 °C per decade for monsoon, post-monsoon, and winter, respectively (Figure 5d–l, Table 4). However, Tmax and Tmin will feature a similar warming trend at a rate of 0.24 °C/decade, presenting no significant change in DTR during pre-monsoon (Figure 5a–c). In addition, a recent study projected an increase in summer temperature over south Asia in all scenarios [41]. The results further indicate that a higher decreasing trend in DTR is likely to be observed in the monsoon season compared to other seasons. Annually, the DTR will also exhibit a significantly decreasing trend, at a rate of −0.04 °C/decade until 2100 (Figure 5m–o, Table 4). These findings are generally consistent with [37], according to which the globally averaged reduction in DTR is projected to increase due to greenhouse gases.
In the SSP5-8.5 scenario, Tmin will increase significantly more than Tmax, exhibiting a significantly decreasing DTR seasonal and annual trend (Figure 6). Both Tmin and Tmax are projected to increase sharply in high-emission scenarios; this may lead to harsh weather conditions in the future. The increase in temperature was estimated over Central Nepal; moreover, Tmin and Tmax will be more pronounced in higher altitudinal stations than lower altitude stations [74]. Further, a recent study also estimated worsening extreme heat conditions in the south and east Asia by the end of this century [75]. The decreasing rate of DTR trend will be higher in monsoon (−0.21 °C/decade) than post-monsoon (−0.17 °C/decade), winter (−0.11 °C/decade), and pre-monsoon (−0.03 °C/decade) (Figure 6a–l, Table 4). Similarly, the DTR will decrease significantly on an annual timescale at a rate of −0.14 °C/decade, which is significant at a 99% confidence level (Figure 6m–o, Table 4). Overall, the decreasing rate of DTR is most likely to be higher in high (SSP5-8.5) than medium (SSP2-4.5) and low (SSP1-2.6) greenhouse emission scenarios. Further, unabated human-induced global warming is expected to enhance the decreasing rate of DTR. Alarmingly, the decreasing DTR trend is already causing an increase in mortality rates [10,76]; in addition to the DTR-related deaths, which are projected to increase by 1.4–10.3% in 2090–99, depending upon the variability, this pattern may vary between countries and regions [1].

4. Conclusions and Policy Suggestions

This study investigated historical (1950–2020) and projected (2021–2100) DTR trends on annual and seasonal timescales over the southern slope of Central Himalaya, Nepal, using CRU and 13 bias-corrected CMIP6 models. An increasing trend in Tmax and Tmin on seasonal and annual timescales was observed from 1950–2020 in Nepal; the Tmin’s increasing trend was ~2 times higher than that of the Tmax. This variational trend further decreased the DTR (0.08 °C/decade, p ≤ 0.01) on an annual timescale. Similarly, the magnitude of seasonal DTR has declined over Nepal, with a more significant decrease in pre-monsoon (−0.09 °C/decade, p ≤ 0.01) and winter (−0.09 °C/decade, p ≤ 0.01) compared to the monsoon (−0.07 °C/decade, p ≤ 0.01) and post-monsoon seasons (−0.06 °C/decade, p ≤ 0.05). A stronger relationship between DTR and precipitation was observed for dry seasons (winter, pre-monsoon, and post-monsoon) than for the wet season (monsoon). Meanwhile, a significant negative correlation was observed between DTR and cloud cover for all seasons, indicating that high cloud cover is responsible for decreasing DTR across Nepal. Further, weak-to-moderate correlations were observed between the DTR and the sea surface temperature variations in the tropical Pacific and Indian Oceans.
The CMIP6 historical and CRU exhibited a similar magnitude of temperature and DTR, indicating that the CMIP6 datasets can simulate temperature trends across Nepal. The ensemble of climate models projects an increase in Tmax and Tmin on seasonal and annual timescales in SSP1-2.6, SSP2-4.5, and SSP5-8.5 scenarios. In the SSP1-2.6 scenario, the DTR trend is projected to increase only in pre-monsoon. A decreasing DTR trend is anticipated in SSP2-4.5, with a higher increasing rate in the monsoon season followed by post-monsoon, winter, and no trend in the pre-monsoon. A similar DTR variation is projected in SSP5-8.5, with pre-monsoon featuring a smaller DTR decreasing trend (−0.03 °C/decade, p < 0.01). An increasing annual DTR trend is expected to be observed in the SSP1-2.6 scenario. By contrast, the annual DTR might decrease in the SSP2-4.5 and SSP5-8.5 scenarios. Our study suggests that the DTR is likely to decrease faster in SSP5-8.5 than in SSP2-4.5 and SSP1-2.6, indicating that high greenhouse emissions could lead to a higher increase in Tmin than in Tmax. In the context of ongoing climate change, this study could thus be helpful for the preparation and implementation of preparedness and adaptation strategies to counter imminent DTR-related threats. Moreover, this study only analyzed the temporal variation of DTR over Nepal; we recommend that further studies focus on the spatial pattern of DTR changes over the Central Himalayan region using fine-resolution satellite/reanalysis datasets.

Author Contributions

Conceptualization, R.T. and S.S.; methodology, K.H. and S.S.; software, K.H.; validation, S.S. and K.H.; formal analysis and investigation, K.H.; data curation, S.S.; writing—original draft preparation, K.H.; writing—review and editing, S.S., R.T., M.A., B.D. and Y.P.D.; visualization, S.S.; supervision, B.D.; project administration, T.X.; funding acquisition, B.D., T.X. All authors have read and agreed to the published version of the manuscript.

Funding

The APC was funded by Kathmandu Center for Research and Education, Chinese Academy of Sciences-Tribhuvan University.

Institutional Review Board Statement

Not applicable.

Informed Consent Statement

Not applicable.

Data Availability Statement

The CRU gridded precipitation, temperature, and cloud cover datasets used in this study can be freely accessed from https://crudata.uea.ac.uk/cru/data/hrg/ (accessed on 1 September 2021). The gridded bias-corrected CMIP6 datasets for Nepal were generated by Mishra et al. (2020) and are freely available at https://zenodo.org/record/3873998#.YKOjiqgzY2w (accessed on 1 February 2021).

Acknowledgments

We want to acknowledge the Climate Research Unit (CRU) for freely providing gridded temperature, precipitation, and cloud cover data. Mishra et al. (2020) are also greatly acknowledged for providing bias-corrected CMIP6 data for Nepal.

Conflicts of Interest

The authors declare that they have no conflict of interest.

Appendix A

Figure A1. DTR correlation between CRU (trend; –0.07 °C/decade, p < 0.01) and CMIP6 historical (trend; –0.09 °C/decade, p < 0.01 over Nepal from 1951–2014.
Atmosphere 12 01683 g0a1
Table A1. Trends in seasonal and annual average DTR (unit: °C/decade) using the linear trends in cloudiness and precipitation and the regression coefficients.
SeasonsDTR Trend
Pre-monsoon−0.06, p < 0.01
Monsoon−0.02, p = 0.30
Post-monsoon−0.01, p = 0.59
Winter−0.05, p < 0.01
Annual−0.03, p < 0.05
Note: p < 0.1, p < 0.05, and p < 0.01 represent 90, 95, and 99% confidence levels, respectively.

References

  1. Lee, W.; Kim, Y.; Sera, F.; Gasparrini, A.; Park, R.; Choi, H.M.; Prifti, K.; Bell, M.L.; Abrutzky, R.; Guo, Y. Projections of excess mortality related to diurnal temperature range under climate change scenarios: A multi-country modelling study. Lancet Planet. Health 2020, 4, e512. [Google Scholar] [CrossRef]
  2. Zhuang, Y.; Zhang, J. Diurnal asymmetry in future temperature changes over the main Belt and Road regions. Ecosyst. Health Sustain. 2020, 6, 1749530. [Google Scholar] [CrossRef] [Green Version]
  3. IPCC. Climate Change 2021: The Physical Science Basis; Contribution of Working Group I to the Sixth Assessment Report of the Intergovernmental Panel on Climate Change; Masson-Delmotte, V., Zhai, P., Pirani, A., Connors, S.L., Péan, C., Berger, S., Caud, N., Chen, Y., Goldfarb, L., Gomis, M.I., et al., Eds.; Cambridge University Press: Cambridge, UK, 2021; in press. [Google Scholar]
  4. Qu, M.; Wan, J.; Hao, X. Analysis of diurnal air temperature range change in the continental United States. Weather Clim. Extrem. 2014, 4, 86–95. [Google Scholar] [CrossRef] [Green Version]
  5. Rai, A.; Joshi, M.K.; Pandey, A. Variations in diurnal temperature range over India: Under global warming scenario. J. Geophys. Res. Atmos. 2012, 117. [Google Scholar] [CrossRef]
  6. Sun, X.; Ren, G.; You, Q.; Ren, Y.; Xu, W.; Xue, X.; Zhan, Y.; Zhang, S.; Zhang, P. Global diurnal temperature range (DTR) changes since 1901. Clim. Dyn. 2019, 52, 3343–3356. [Google Scholar] [CrossRef]
  7. Stocker, T.F.; Qin, D.; Plattner, G.-K.; Tignor, M.M.; Allen, S.K.; Boschung, J.; Nauels, A.; Xia, Y.; Bex, V.; Midgley, P.M. Climate Change 2013: The Physical Science Basis; Contribution of Working Group I to the fifth Assessment Report of IPCC the Intergovernmental Panel on Climate Change; Cambridge University Press: Cambridge, UK, 2014. [Google Scholar]
  8. Thorne, P.; Donat, M.; Dunn, R.; Williams, C.; Alexander, L.; Caesar, J.; Durre, I.; Harris, I.; Hausfather, Z.; Jones, P. Reassessing changes in diurnal temperature range: Intercomparison and evaluation of existing global data set estimates. J. Geophys. Res. Atmos. 2016, 121, 5138–5158. [Google Scholar] [CrossRef] [Green Version]
  9. Christidis, N.; Mitchell, D.; Stott, P.A. Anthropogenic climate change and heat effects on health. Int. J. Climatol. 2019, 39, 4751–4768. [Google Scholar] [CrossRef]
  10. Singh, N.; Mhawish, A.; Ghosh, S.; Banerjee, T.; Mall, R. Attributing mortality from temperature extremes: A time series analysis in Varanasi, India. Sci. Total Environ. 2019, 665, 453–464. [Google Scholar] [CrossRef]
  11. Sunoj, V.J.; Shroyer, K.J.; Jagadish, S.K.; Prasad, P.V. Diurnal temperature amplitude alters physiological and growth response of maize (Zea mays L.) during the vegetative stage. Environ. Exp. Bot. 2016, 130, 113–121. [Google Scholar] [CrossRef]
  12. Lobell, D.B.; Asseng, S. Comparing estimates of climate change impacts from process-based and statistical crop models. Environ. Res. Lett. 2017, 12, 015001. [Google Scholar] [CrossRef]
  13. Sun, X.-B.; Ren, G.-Y.; Shrestha, A.B.; Ren, Y.-Y.; You, Q.-L.; Zhan, Y.-J.; Xu, Y.; Rajbhandari, R. Changes in extreme temperature events over the Hindu Kush Himalaya during 1961–2015. Adv. Clim. Chang. Res. 2017, 8, 157–165. [Google Scholar] [CrossRef]
  14. Jaswal, A.; Kore, P.; Singh, V. Trends in diurnal temperature range over India (1961–2010) and their relationship with low cloud cover and rainy days. J. Clim. Chang. 2016, 2, 35–55. [Google Scholar] [CrossRef]
  15. Shahid, S.; Harun, S.B.; Katimon, A. Changes in diurnal temperature range in Bangladesh during the time period 1961–2008. Atmos. Res. 2012, 118, 260–270. [Google Scholar] [CrossRef]
  16. Waqas, A.; Athar, H. Observed diurnal temperature range variations and its association with observed cloud cover in northern Pakistan. Int. J. Climatol. 2018, 38, 3323–3336. [Google Scholar] [CrossRef]
  17. Hamal, K.; Sharma, S.; Baniya, B.; Khadka, N.; Zhou, X. Inter-Annual Variability of Winter Precipitation Over Nepal Coupled With Ocean-Atmospheric Patterns During 1987–2015. Front. Earth Sci. 2020, 8, 161. [Google Scholar] [CrossRef]
  18. Pokharel, B.; Wang, S.Y.S.; Meyer, J.; Marahatta, S.; Nepal, B.; Chikamoto, Y.; Gillies, R. The east–west division of changing precipitation in Nepal. Int. J. Climatol. 2019, 40, 3348–3359. [Google Scholar] [CrossRef]
  19. Sharma, S.; Hamal, K.; Khadka, N.; Joshi, B.B. Dominant pattern of year-to-year variability of summer precipitation in Nepal during 1987–2015. Theor. Appl. Climatol. 2020, 142, 1071–1084. [Google Scholar] [CrossRef]
  20. Poudel, A.; Cuo, L.; Ding, J.; Gyawali, A.R. Spatio-temporal variability of the annual and monthly extreme temperature indices in Nepal. Int. J. Climatol. 2020, 40, 4956–4977. [Google Scholar] [CrossRef]
  21. Aryal, D.; Wang, L.; Adhikari, T.R.; Zhou, J.; Li, X.; Shrestha, M.; Wang, Y.; Chen, D. A Model-Based Flood Hazard Mapping on the Southern Slope of Himalaya. Water 2020, 12, 540. [Google Scholar] [CrossRef] [Green Version]
  22. Hamal, K.; Sharma, S.; Khadka, N.; Haile, G.G.; Joshi, B.B.; Xu, T.; Dawadi, B. Assessment of drought impacts on crop yields across Nepal during 1987–2017. Meteorol. Appl. 2020, 27, e1950. [Google Scholar] [CrossRef]
  23. Khadka, D.; Babel, M.S.; Shrestha, S.; Tripathi, N.K. Climate change impact on glacier and snow melt and runoff in Tamakoshi basin in the Hindu Kush Himalayan (HKH) region. J. Hydrol. 2014, 511, 49–60. [Google Scholar] [CrossRef]
  24. Khadka, N.; Chen, X.; Yong, N.; Thakuri, S.; Zheng, G.; Zhang, G. Evaluation of Glacial Lake Outburst Flood susceptibility using multi-criteria assessment framework in Mahalangur Himalaya. Front. Earth Sci. 2020, 8, 748. [Google Scholar] [CrossRef]
  25. Sharma, S.; Hamal, K.; Khadka, N.; Shrestha, D.; Aryal, D.; Thakuri, S. Drought characteristics over Nepal Himalaya and their relationship with climatic indices. Meteorol. Appl. 2021, 28, e1988. [Google Scholar] [CrossRef]
  26. Karki, M.; Mool, P.; Shrestha, A. Climate change and its increasing impacts in Nepal. Initiation 2009, 3, 30–37. [Google Scholar] [CrossRef]
  27. Dhimal, M.N.; Nepal, B.; Bista, B.; Neupane, T.; Dahal, S.; Pandey, A.R.; Jha, A.K. Assessing Trends of Heat Waves and Perception of People about Health Risks of Heat Wave in Nepal; Nepal Health Research Council: Kathmandu, Nepal, 2018.
  28. DHM. Observed Climate Trend Analysis in the Districts and Physiographic Regions of Nepal (1971–2014); Department of Hydrology and Meteorology: Kathmandu, Nepal, 2017; Volume 1, p. 74.
  29. Karki, R.; ul Hasson, S.; Gerlitz, L.; Talchabhadel, R.; Schickhoff, U.; Scholten, T.; Böhner, J. Rising mean and extreme near-surface air temperature across Nepal. Int. J. Climatol. 2020, 40, 2445–2463. [Google Scholar] [CrossRef] [Green Version]
  30. Liu, B.; Xu, M.; Henderson, M.; Qi, Y.; Li, Y. Taking China’s temperature: Daily range, warming trends, and regional variations, 1955–2000. J. Clim. 2004, 17, 4453–4462. [Google Scholar] [CrossRef]
  31. Mohan, M.; Kandya, A. Impact of urbanization and land-use/land-cover change on diurnal temperature range: A case study of tropical urban airshed of India using remote sensing data. Sci. Total Environ. 2015, 506, 453–465. [Google Scholar] [CrossRef]
  32. Xia, X. Variability and trend of diurnal temperature range in China and their relationship to total cloud cover and sunshine duration. Ann. Geophys. 2013, 31, 795–804. [Google Scholar] [CrossRef] [Green Version]
  33. Tan, M.L.; Juneng, L.; Tangang, F.T.; Chung, J.X.; Radin Firdaus, R. Changes in Temperature Extremes and Their Relationship with ENSO in Malaysia from 1985 to 2018. Int. J. Climatol. 2021, 41, E2564–E2580. [Google Scholar] [CrossRef]
  34. Gilford, D.M.; Smith, S.R.; Griffin, M.L.; Arguez, A. Southeastern US Daily Temperature Ranges Associated with the El Niño–Southern Oscillation. J. Appl. Meteorol. Climatol. 2013, 52, 2434–2449. [Google Scholar] [CrossRef]
  35. Stjern, C.W.; Samset, B.H.; Boucher, O.; Iversen, T.; Lamarque, J.-F.; Myhre, G.; Shindell, D.; Takemura, T. How aerosols and greenhouse gases influence the diurnal temperature range. Atmos. Chem. Phys. 2020, 20, 13467–13480. [Google Scholar] [CrossRef]
  36. Touma, D.; Stevenson, S.; Lehner, F.; Coats, S. Human-driven greenhouse gas and aerosol emissions cause distinct regional impacts on extreme fire weather. Nat. Commun. 2021, 12, 212. [Google Scholar] [CrossRef]
  37. Lindvall, J.; Svensson, G. The diurnal temperature range in the CMIP5 models. Clim. Dyn. 2015, 44, 405–421. [Google Scholar] [CrossRef]
  38. Wang, K.; Clow, G.D. The Diurnal Temperature Range in CMIP6 Models: Climatology, Variability, and Evolution. J. Clim. 2020, 33, 8261–8279. [Google Scholar] [CrossRef]
  39. Mishra, V.; Bhatia, U.; Tiwari, A.D. Bias-corrected climate projections for South Asia from coupled model intercomparison project-6. Sci. Data 2020, 7, 338. [Google Scholar] [CrossRef] [PubMed]
  40. Riahi, K.; Van Vuuren, D.P.; Kriegler, E.; Edmonds, J.; O’neill, B.C.; Fujimori, S.; Bauer, N.; Calvin, K.; Dellink, R.; Fricko, O. The shared socioeconomic pathways and their energy, land use, and greenhouse gas emissions implications: An overview. Glob. Environ. Chang. 2017, 42, 153–168. [Google Scholar] [CrossRef] [Green Version]
  41. Almazroui, M.; Saeed, S.; Saeed, F.; Islam, M.N.; Ismail, M. Projections of precipitation and temperature over the South Asian countries in CMIP6. Earth Syst. Environ. 2020, 4, 297–320. [Google Scholar] [CrossRef]
  42. Karki, R.; ul Hasson, S.; Schickhoff, U.; Scholten, T.; Böhner, J. Rising Precipitation Extremes across Nepal. Climate 2017, 5, 4. [Google Scholar] [CrossRef] [Green Version]
  43. Nayava, J.L. Rainfall in Nepal. Himal. Rev. 1980, 12, 1–18. [Google Scholar]
  44. Hamal, K.; Sharma, S.; Pokharel, B.; Shrestha, D.; Talchabhadel, R.; Shrestha, A.; Khadka, N. Changing pattern of drought in Nepal and associated atmospheric circulation. Atmos. Res. 2021, 262, 105798. [Google Scholar] [CrossRef]
  45. Sharma, S.; Khadka, N.; Hamal, K.; Baniya, B.; Luintel, N.; Joshi, B.B. Spatial and temporal analysis of precipitation and its extremities in seven provinces of Nepal (2001–2016). Appl. Ecol. Environ. Sci. 2020, 8, 64–73. [Google Scholar]
  46. Sharma, S.; Khadka, N.; Hamal, K.; Shrestha, D.; Talchabhadel, R.; Chen, Y. How Accurately Can Satellite Products (TMPA and IMERG) Detect Precipitation Patterns, Extremities, and Drought Across the Nepalese Himalaya? Earth Space Sci. 2020, 7, e2020EA001315. [Google Scholar] [CrossRef]
  47. Sharma, S.; Khadka, N.; Nepal, B.; Ghimire, S.K.; Luintel, N.; Hamal, K. Elevation Dependency of Precipitation over Southern Slope of Central Himalaya. Jalawaayu 2021, 1, 1–14. [Google Scholar] [CrossRef]
  48. Harris, I.; Osborn, T.J.; Jones, P.; Lister, D. Version 4 of the CRU TS monthly high-resolution gridded multivariate climate dataset. Sci. Data 2020, 7, 109. [Google Scholar] [CrossRef] [PubMed] [Green Version]
  49. New, M.; Hulme, M.; Jones, P. Representing twentieth-century space–time climate variability. Part I: Development of a 1961–90 mean monthly terrestrial climatology. J. Clim. 1999, 12, 829–856. [Google Scholar] [CrossRef]
  50. Sheffield, J.; Goteti, G.; Wood, E.F. Development of a 50-year high-resolution global dataset of meteorological forcings for land surface modeling. J. Clim. 2006, 19, 3088–3111. [Google Scholar] [CrossRef] [Green Version]
  51. Li, S.-Y.; Miao, L.-J.; Jiang, Z.-H.; Wang, G.-J.; Gnyawali, K.R.; Zhang, J.; Zhang, H.; Fang, K.; He, Y.; Li, C. Projected drought conditions in Northwest China with CMIP6 models under combined SSPs and RCPs for 2015–2099. Adv. Clim. Chang. Res. 2020, 11, 210–217. [Google Scholar] [CrossRef]
  52. Kattel, D.; Yao, T.; Yang, K.; Tian, L.; Yang, G.; Joswiak, D. Temperature lapse rate in complex mountain terrain on the southern slope of the central Himalayas. Theor. Appl. Climatol. 2013, 113, 671–682. [Google Scholar] [CrossRef]
  53. Thakuri, S.; Dahal, S.; Shrestha, D.; Guyennon, N.; Romano, E.; Colombo, N.; Salerno, F. Elevation-dependent warming of maximum air temperature in Nepal during 1976–2015. Atmos. Res. 2019, 228, 261–269. [Google Scholar] [CrossRef]
  54. Mann, H.B. Non-parametric tests against trend. Econom. J. Econom. Soc. 1945, 245–259. [Google Scholar]
  55. Kendall, M.G. Rank Correlation Methods; Griffin: London, UK, 1948. [Google Scholar]
  56. Hirsch, R.M.; Slack, J.R. A non-parametric trend test for seasonal data with serial dependence. Water Resour. Res. 1984, 20, 727–732. [Google Scholar] [CrossRef] [Green Version]
  57. Mall, R.K.; Chaturvedi, M.; Singh, N.; Bhatla, R.; Singh, R.S.; Gupta, A.; Niyogi, D. Evidence of asymmetric change in diurnal temperature range in recent decades over different agro-climatic zones of India. Int. J. Climatol. 2021, 41, 2597–2610. [Google Scholar] [CrossRef]
  58. Hamal, K.; Khadka, N.; Rai, S.; Joshi, B.B.; Dotel, J.; Khadka, L.; Bag, N.; Ghimire, S.K.; Shrestha, D. Evaluation of the TRMM Product for Spatio-temporal Characteristics of Precipitation over Nepal (1998–2018). J. Inst. Sci. Technol. 2020, 25, 39–48. [Google Scholar] [CrossRef]
  59. Wang, F.; Shao, W.; Yu, H.; Kan, G.; He, X.; Zhang, D.; Ren, M.; Wang, G. Re-evaluation of the power of the mann-kendall test for detecting monotonic trends in hydrometeorological time series. Front. Earth Sci. 2020, 8, 14. [Google Scholar] [CrossRef]
  60. Sen, P.K. Estimates of the regression coefficient based on Kendall’s tau. J. Am. Stat. Assoc. 1968, 63, 1379–1389. [Google Scholar] [CrossRef]
  61. Wang, F.; Zhang, C.; Peng, Y.; Zhou, H. Diurnal temperature range variation and its causes in a semiarid region from 1957 to 2006. Int. J. Climatol. 2014, 34, 343–354. [Google Scholar] [CrossRef]
  62. Zhai, G.; Qi, J.; Chai, G. Impact of diurnal temperature range on cardiovascular disease hospital admissions among Chinese farmers in Dingxi (the Northwest China). BMC Cardiovasc. Disord. 2021, 21, 252. [Google Scholar] [CrossRef] [PubMed]
  63. Jaswal, A.; Kore, P.; Singh, V. Variability and trends in low cloud cover over India during 1961–2010. Mausam 2017, 68, 235–252. [Google Scholar] [CrossRef]
  64. Dai, A.; Trenberth, K.E.; Karl, T.R. Effects of clouds, soil moisture, precipitation, and water vapor on diurnal temperature range. J. Clim. 1999, 12, 2451–2473. [Google Scholar] [CrossRef]
  65. Shen, X.; Liu, B.; Li, G.; Wu, Z.; Jin, Y.; Yu, P.; Zhou, D. Spatiotemporal change of diurnal temperature range and its relationship with sunshine duration and precipitation in China. J. Geophys. Res. Atmos. 2014, 119, 13163–13179. [Google Scholar] [CrossRef]
  66. He, B.; Huang, L.; Wang, Q. Precipitation deficits increase high diurnal temperature range extremes. Sci. Rep. 2015, 5, 12004. [Google Scholar] [CrossRef] [PubMed] [Green Version]
  67. Waqas, A.; Athar, H.; Shahzad, M.I. Recent variability of the observed diurnal temperature range in the Karakoram and its surrounding mountains of northern Pakistan. In Proceedings of the 2016 AGU Fall Meeting, San Francisco, CA, USA, 12–16 December 2016. [Google Scholar]
  68. Beule, L.; Tantanee, S. The Relationship between Diurnal Temperature Range (DTR) and Rainfall over Northern Thailand. Adv. Mater. Res. 2014, 931–932, 614–618. [Google Scholar] [CrossRef]
  69. Kondo, A.; Kaga, A.; Imamura, K.; Inoue, Y.; Sugisawa, M.; Shrestha, M.L.; Sapkota, B. Investigation of air pollution concentration in Kathmandu valley during winter season. J. Environ. Sci. 2005, 17, 1008–1013. [Google Scholar]
  70. Pyrgou, A.; Santamouris, M.; Livada, I. Spatiotemporal analysis of diurnal temperature range: Effect of urbanization, cloud cover, solar radiation, and precipitation. Climate 2019, 7, 89. [Google Scholar] [CrossRef] [Green Version]
  71. Climate Change 2001: The Scientific Basis; Working Group I; Third Assessment Report of the Intergovernmental Panel on Climate Change; Cambridge University Press: New York, NY, USA, 2001.
  72. Zhou, Z.-Q.; Zhang, R.; Xie, S.-P. Interannual Variability of Summer Surface Air Temperature over Central India: Implications for Monsoon Onset. J. Clim. 2019, 32, 1693–1706. [Google Scholar] [CrossRef]
  73. Chowdary, J.; John, N.; Gnanaseelan, C. Interannual variability of surface air-temperature over India: Impact of ENSO and Indian Ocean Sea surface temperature. Int. J. Climatol. 2014, 34, 416–429. [Google Scholar] [CrossRef]
  74. Shrestha, D.; Sharma, S.; Bhandari, S.; Deshar, R. Statistical Downscaling and Projection of Future Temperature and Precipitation Change in Gandaki Basin. J. Inst. Sci. Technol. 2021, 26, 16–27. [Google Scholar] [CrossRef]
  75. Freychet, N.; Hegerl, G.; Mitchell, D.; Collins, M. Future changes in the frequency of temperature extremes may be underestimated in tropical and subtropical regions. Commun. Earth Environ. 2021, 2, 28. [Google Scholar] [CrossRef]
  76. Lee, W.-H.; Lim, Y.-H.; Dang, T.N.; Seposo, X.; Honda, Y.; Guo, Y.-L.L.; Jang, H.-M.; Kim, H. An investigation on attributes of ambient temperature and diurnal temperature range on mortality in five east-Asian countries. Sci. Rep. 2017, 7, 39956. [Google Scholar]
Figure 1. (a) Mean temperature (Tmean) from 1950–2020 over the study area; (b) annual cycle of Tmean, Tmax, and Tmin from 1951–2014; (c) anomalies of annual Tmean in CRU (trend; 0.12 °C/decade, p < 0.01) and CMIP6 (trend; 0.11 °C/decade, p < 0.01) historical data over the study region.
Atmosphere 12 01683 g001
Figure 2. Seasonal and annual trend of the mean DTR (a,d,g,j,m), Tmax (b,e,h,k,n), and Tmin (c,f,i,l,o) across Nepal from 1950–2020. The red line indicates the linear trend calculated by Sen’s non-parametric estimator.
Atmosphere 12 01683 g002
Figure 3. Correlation of DTR with precipitation and cloud cover during 1950–2020. * and ** represent the significance at 95 and 99% confidence levels.
Atmosphere 12 01683 g003
Figure 4. Projected seasonal and annual trend of mean DTR (a,d,g,j,m), Tmax (b,e,h,k,n), and Tmin (c,f,i,l,o) under SSP1-2.6 scenarios across Nepal. The red line indicates the linear trend calculated by Sen’s non-parametric estimator.
Atmosphere 12 01683 g004
Figure 5. Projected seasonal and annual trend of mean DTR (a,d,g,j,m), Tmax (b,e,h,k,n), and Tmin (c,f,i,l,o) under SSP2-4.5 scenarios across Nepal. The red line indicates the linear trend calculated by Sen’s non-parametric estimator.
Atmosphere 12 01683 g005
Figure 6. Projected seasonal and annual trend of mean DTR (a,d,g,j,m), Tmax (b,e,h,k,n), and Tmin (c,f,i,l,o) under SSP5-8.5 scenarios across Nepal. The red line indicates the linear trend calculated by Sen’s nonparametric estimator.
Atmosphere 12 01683 g006
Table 1. Trends of seasonal and annual average diurnal temperature range (DTR), maximum temperature (Tmax), and minimum temperature (Tmin) (unit: °C/decade) of Nepal. Trend values are calculated using Sen’s slope estimator, and the statistical significance of the trends is assessed by MK test (Equations (4) and (5)).
SeasonsDTRTmaxTmin
Pre-Monsoon−0.09, (p < 0.01)0.06, (p < 0.01)0.15, (p < 0.01)
Monsoon−0.07, (p < 0.01)0.06, (p < 0.05)0.13, (p < 0.01)
Post-Monsoon−0.06, (p < 0.05)0.16, (p < 0.01)0.22, (p < 0.01)
Winter−0.09, (p < 0.01)0.11, (p < 0.01)0.20, (p < 0.01)
Annual−0.08, (p < 0.01)0.08, (p < 0.01)0.16, (p < 0.01)
Note: p < 0.1, p < 0.05, and p < 0.01 represent 90, 95 and 99% confidence levels, respectively.
Table 2. Trends of seasonal and annual total cloud cover (%/decade) and precipitation (mm/decade) in Nepal from 1950–2020. Trend values are calculated using Sen’s slope estimator, and the statistical significance of the trends is assessed by MK test (Equations (4) and (5)).
SeasonsCloud Precipitation
Pre-monsoon0.56 (p < 0.01)3.90 (p < 0.01)
Monsoon0.20 (p = 0.14)−4.36 (p < 0.01)
Post-monsoon0.23 (p = 0.24)−0.79 (p = 0.50)
Winter0.42 (p < 0.05)−0.42 (p = 0.44)
Annual0.36 (p < 0.05)−0.48 (p = 0.52)
Note: p < 0.1, p < 0.05, and p < 0.01 represent 90, 95, and 99% confidence levels, respectively.
Table 3. Correlation of seasonal and annual DTR of Nepal with NINO3.4 and DMI during 1950–2020.
SeasonsNINO3.4-DJFDMI-ON
Pre-Monsoon0.03, p = 0.78−0.42, p < 0.01
Monsoon0.29, p < 0.050.08, p = 0.45
Post-Monsoon−0.05, p = 0.65−0.41, p < 0.01
Winter−0.14, p = 0.24−0.38, p < 0.01
Annual0.08, p = 0.50−0.33, p < 0.01
Note: p < 0.1, p < 0.05, and p < 0.01 represent 90, 95, and 99% confidence levels respectively.
Table 4. Trends of projected (2021–2100) seasonal and annual average diurnal temperature range (DTR), maximum temperature (Tmax), and minimum temperature (Tmin) (unit: °C/decade) under SSP1-2.6, SSP2-4.5, and SSP5-8.5 over Nepal. Trend values are calculated using Sen’s slope estimator, and the statistical significance of the trends is assessed by MK test (Equations (4) and (5)).
SeasonDTRTmaxTmin
SSP1-2.6SSP2-4.5SSP5-8.5SSP1-2.6SSP2-4.5SSP5-8.5SSP1-2.6SSP2-4.5SSP5-8.5
Pre-Monsoon0.02
(p < 0.05)
0−0.03
(p < 0.01)
0.08
(p < 0.01)
0.24
(p < 0.01)
0.56
(p < 0.01)
0.06
(p < 0.01)
0.24
(p < 0.01)
0.59
(p < 0.01)
Monsoon0−0.08
(p < 0.01)
−0.21
(p < 0.01)
0.09
(p < 0.01)
0.24
(p < 0.01)
0.53
(p < 0.01)
0.09
(p < 0.01)
0.32
(p < 0.01)
0.74
(p < 0.01)
Post-Monsoon0−0.05
(p < 0.01)
−0.17
(p < 0.01)
0.07
(p < 0.01)
0.19
(p < 0.01)
0.46
(p < 0.01)
0.07
(p < 0.01)
0.24
(p < 0.01)
0.63
(p < 0.01)
Winter0−0.02
(p < 0.05)
−0.11
(p < 0.01)
0.21
(p < 0.01)
0.30
(p < 0.01)
0.46
(p < 0.01)
0.24
(p < 0.01)
0.35
(p < 0.01)
0.54
(p < 0.01)
Annual0.01
(p < 0.05)
−0.04
(p < 0.01)
−0.14
(p < 0.01)
0.15
(p < 0.01)
0.21
(p < 0.01)
0.35
(p < 0.01)
0.19
(p < 0.01)
0.29
(p < 0.01)
0.46
(p < 0.01)
Note: p < 0.1, p < 0.05, and p < 0.01 represent 90, 95, and 99% confidence levels, respectively. Bold font indicates no trend.
Publisher’s Note: MDPI stays neutral with regard to jurisdictional claims in published maps and institutional affiliations.

