
Terrain Effects on Regional Precipitation in a Warm Season over Qinling-Daba Mountains in Central China


1
Shaanxi Key Laboratory of Earth Surface System and Environmental Carrying Capacity, College of Urban and Environmental Sciences, Northwest University, Xi’an 710127, China
2
Xi’an Institute of Meteorological Science and Technology, Northwest University, Xi’an 710127, China
*
Authors to whom correspondence should be addressed.
Atmosphere 2021, 12(12), 1685; https://0-doi-org.brum.beds.ac.uk/10.3390/atmos12121685
Submission received: 30 October 2021
/
Revised: 2 December 2021
/
Accepted: 14 December 2021
/
Published: 16 December 2021
(This article belongs to the Section Meteorology)
Abstract
:The terrain effects of Qinling–Daba Mountains on reginal precipitation during a warm season were investigated in a two-month day-to-day experiment using the Weather Research and Forecasting (WRF) model. According to the results from the terrain sensitivity experiment with lowered mountains, Qinling–Daba Mountains have been found to have an obvious effect on both the spatial-temporal distribution and diurnal cycle of reginal precipitation from July to August in 2019, where the Qinling Mountains mainly enhanced the precipitation around 34° N, and the Daba Mountains mainly enhanced it around 32° N at the time period of early morning and midnight. Horizontal distribution of water vapor and convective available potential energy (CAPE), as well as cross section of vertical velocity of wind and potential temperature has been studied to examine the key mechanisms for these two mountains’ effect. The existence of Qinling Mountains intercepted transportation of water vapor from South to North in the lower troposphere to across 34° N and caused an obvious enhancement of CAPE in the neighborhood, while the Daba Mountains intercepted the northward water vapor transportation to across 32° N and caused an enhanced CAPE nearby. The time period of the influence is in a good accordance with the diurnal cycle. In the cross-section, the existence of Qinling Mountains and Daba Mountains are found to stimulate the upward motion and unstable environment effectively at around 34° N and 32° N, separately. As a result, the existence of the two mountains lead to a favorable environment in water vapor, thermodynamic, and dynamic conditions for this warm season precipitation.
1. Introduction
The Qinling Mountains and Daba Mountains (Qinling–Daba Mountains), located mainly in the Gansu, Shaanxi, Henan, Sichuan, and Hubei provinces and Chongqing Municipality in central China, are referred to as the division of geology, geochemistry, physical geography and geography between north China and south China [1], which has become the focus of many geologists of the world [2,3]. Moreover, in terms of the climatology of China, the region in which the Qinling–Daba Mountains are located is basically consistent with the 0 °C isotherm in January, 800 mm precipitation isoline and 2000 h isoline of totals of sunshine duration, which is the boundary between subtropical and warm temperate zones, as well as in the humid and subhumid regions [4,5]. The climatic regionalization of Qinling–Daba Mountains is extremely sensitive to complex topographical conditions as well as climate change [6]. Investigating the role of Qinling–Daba Mountains effects on regional climate, especially on its precipitation in warm season, has been revealed as having great scientific relevance for water resource utilization [7]. As more and more studies show that mountain terrain can change reginal precipitation cycles [8], there is an increasing concern about the terrain effects caused by the Qinling–Daba Mountains on the regional water–energy cycle in the warm season. The barrier effect of Qinling Mountains has been revealed previously, mainly from the perspective of statistics of historical precipitation data in climate time scale [2,3,9], while few works has been done to analyze its physical processes effect.
It has long been known that precipitation over different kinds of terrain not only greatly affects local weather [10,11,12,13], but also plays an important role in the interaction between the land surface and atmosphere to impact the large-scale atmospheric circulations and even the global climate [14,15,16,17]. Numerous studies have been conducted to explore the relationship between terrains and precipitation in China. For example, large amounts of research have focused on the Tibetan Plateau [18,19,20,21,22], known as the Third Pole, whose huge terrain serve as a heat source that drives the South Asian summer monsoon and plays a significant role in determining the global water vapor and energy budget at the land-atmosphere interface, which in turn affects the nature of atmospheric circulation and even causes climate feedbacks in the long term. In addition to this kind of big terrain, there are some smaller multiscale terrains. Taihang Shan Mountain, dividing the northwest mountains and southeast plains of North China along 700 m topography line [23], has been found to drive a differential heating over inhomogeneous surfaces to cause the diurnal variation of precipitation over East Asia [24,25], where mountain-plains caused nocturnal rainfall is relatively confined to the plains adjacent to mountains from late night to morning because of the upward branch of the nighttime mountain-plains solenoid [23]. The primary convergence line responsible for convection initiation was induced by terrain at different scales including both the main mountain peaks and smaller-scale valleys in Dabie Mountain [26]. It has been found that convection-resolving numerical simulation is a good tool to examined the effect of terrain for orographic precipitation in eastern China with some single-case runs [14,26]. The multiscale orography in Taiyue Mountain was found a significance influence on the initiation and maintenance of the precipitating convective system by nighttime orographic gravity waves and mountain–plains solenoid due to the differential solar heating between mountain and basin in daytime [14]. In southern China, the role of ocean and coastline terrain in convection initiation and upscale convective growth has been widely documented to understand the mechanisms of topographic rainfall [27,28,29], where both coastal convergence and topographic lifting are found to influence convection initiation and upscale convective growth near the coastal terrain. The orographic influence of large island, like Taiwan Island and Hainan Island, has been found a great effect on the rainfall redistribution when the monsoon flow over centrally located mountains in these islands [12,13,30,31]. Over complex terrain regions, precipitation estimates can be associated with significant error due to variability and uncertainty introduced by orographic effects [32,33,34]. The diversity of mountains and coastlines across mainland China results in a broad spectrum of rainfall effects [27], proving an effective way to investigate the effects of the terrain on reginal precipitation by numerical sensitivity simulations. Most of these previous studies have shown that Weather Research and Forecasting (WRF) model has the capability in accurately simulating the rainfall events with complex terrain by convection-permitting simulations [12,16,18,22,26,27,35,36], as well as in terrain sensitivity experiment [12,13,27,31,36]. The widely used method of reinitialization by subdividing a long-term continuous integration into shorter ones has been proved an effective way to alleviate the problem of systematic model error [35,37].
However, there are few studies focused on the region over Qinling–Daba Mountains, especially using numerical sensitivities for its terrain effects. For instance, in the presence of both Qinling Mountains and Daba Mountains, what is the relative role of Qinling Mountains and Daba Mountains in reginal precipitation in a warm season? How do they separately affect both spatial distribution and diurnal variation for rainfall from dynamic and thermodynamic perspectives? To the south of the Qinling–Daba Mountains, Sichuan Basin is located immediately in southwestern China, which is one of the warm season precipitation maximum centers in China [38]. Precipitations over Sichuan Basin have been studied extensively using numerical simulations and most studies focused on the primary mechanism of summer precipitation diurnal variation of “Bashan Yeyu” (nocturnal precipitation in Daba Mountain) [39], in which water vapor related moisture flux from the southeast side of the basin accompanied with unstable energy plays a key role in diurnal cycle of precipitation, providing a reference for studying the diurnal variation characteristics of precipitation over Qinling–Daba Mountains. However, to the south of the Qinling–Daba Mountains, the Guanzhong Basin and the Chinese Loess Plateau are located successively, whose annual and summer rainfall has been greatly reduced especially in the Chinese Loess Plateau [38,40], but these studies do not address how the summer rainfall area will response when the Qinling–Daba Mountains terrain being modified. A lot of studies have highlighted the importance of the Qinling–Daba Mountains’ influence on climate or rainfall spatial distribution [9,41], however, the fact that high-frequency and high spatial resolution sensitivity simulation have not been generally applied until more recently, there have been few in-depth studies on the exact topography effects of the exit of, in particular, the warm season precipitation. Again, neither the relationship between the Qinling–Daba Mountains and diurnal cycle of rainfall nor theirs physical mechanisms has been investigated with high-resolution simulation.
To address the knowledge gap, in this study, we assess of the spatial-temporal precipitation variation in a warm season with a concurrent consideration of sensitivities to Qinling–Daba topographical height. We employ a sequential high-resolution simulation using the WRF model. Section 2 provides the details of the methodology, including model configuration, experimental design, and model evaluation. In Section 3, we show the results of the precipitation caused in different terrains. Discussions and conclusions are presented in Section 4.
2. Materials and Methods
2.1. Model Configuration
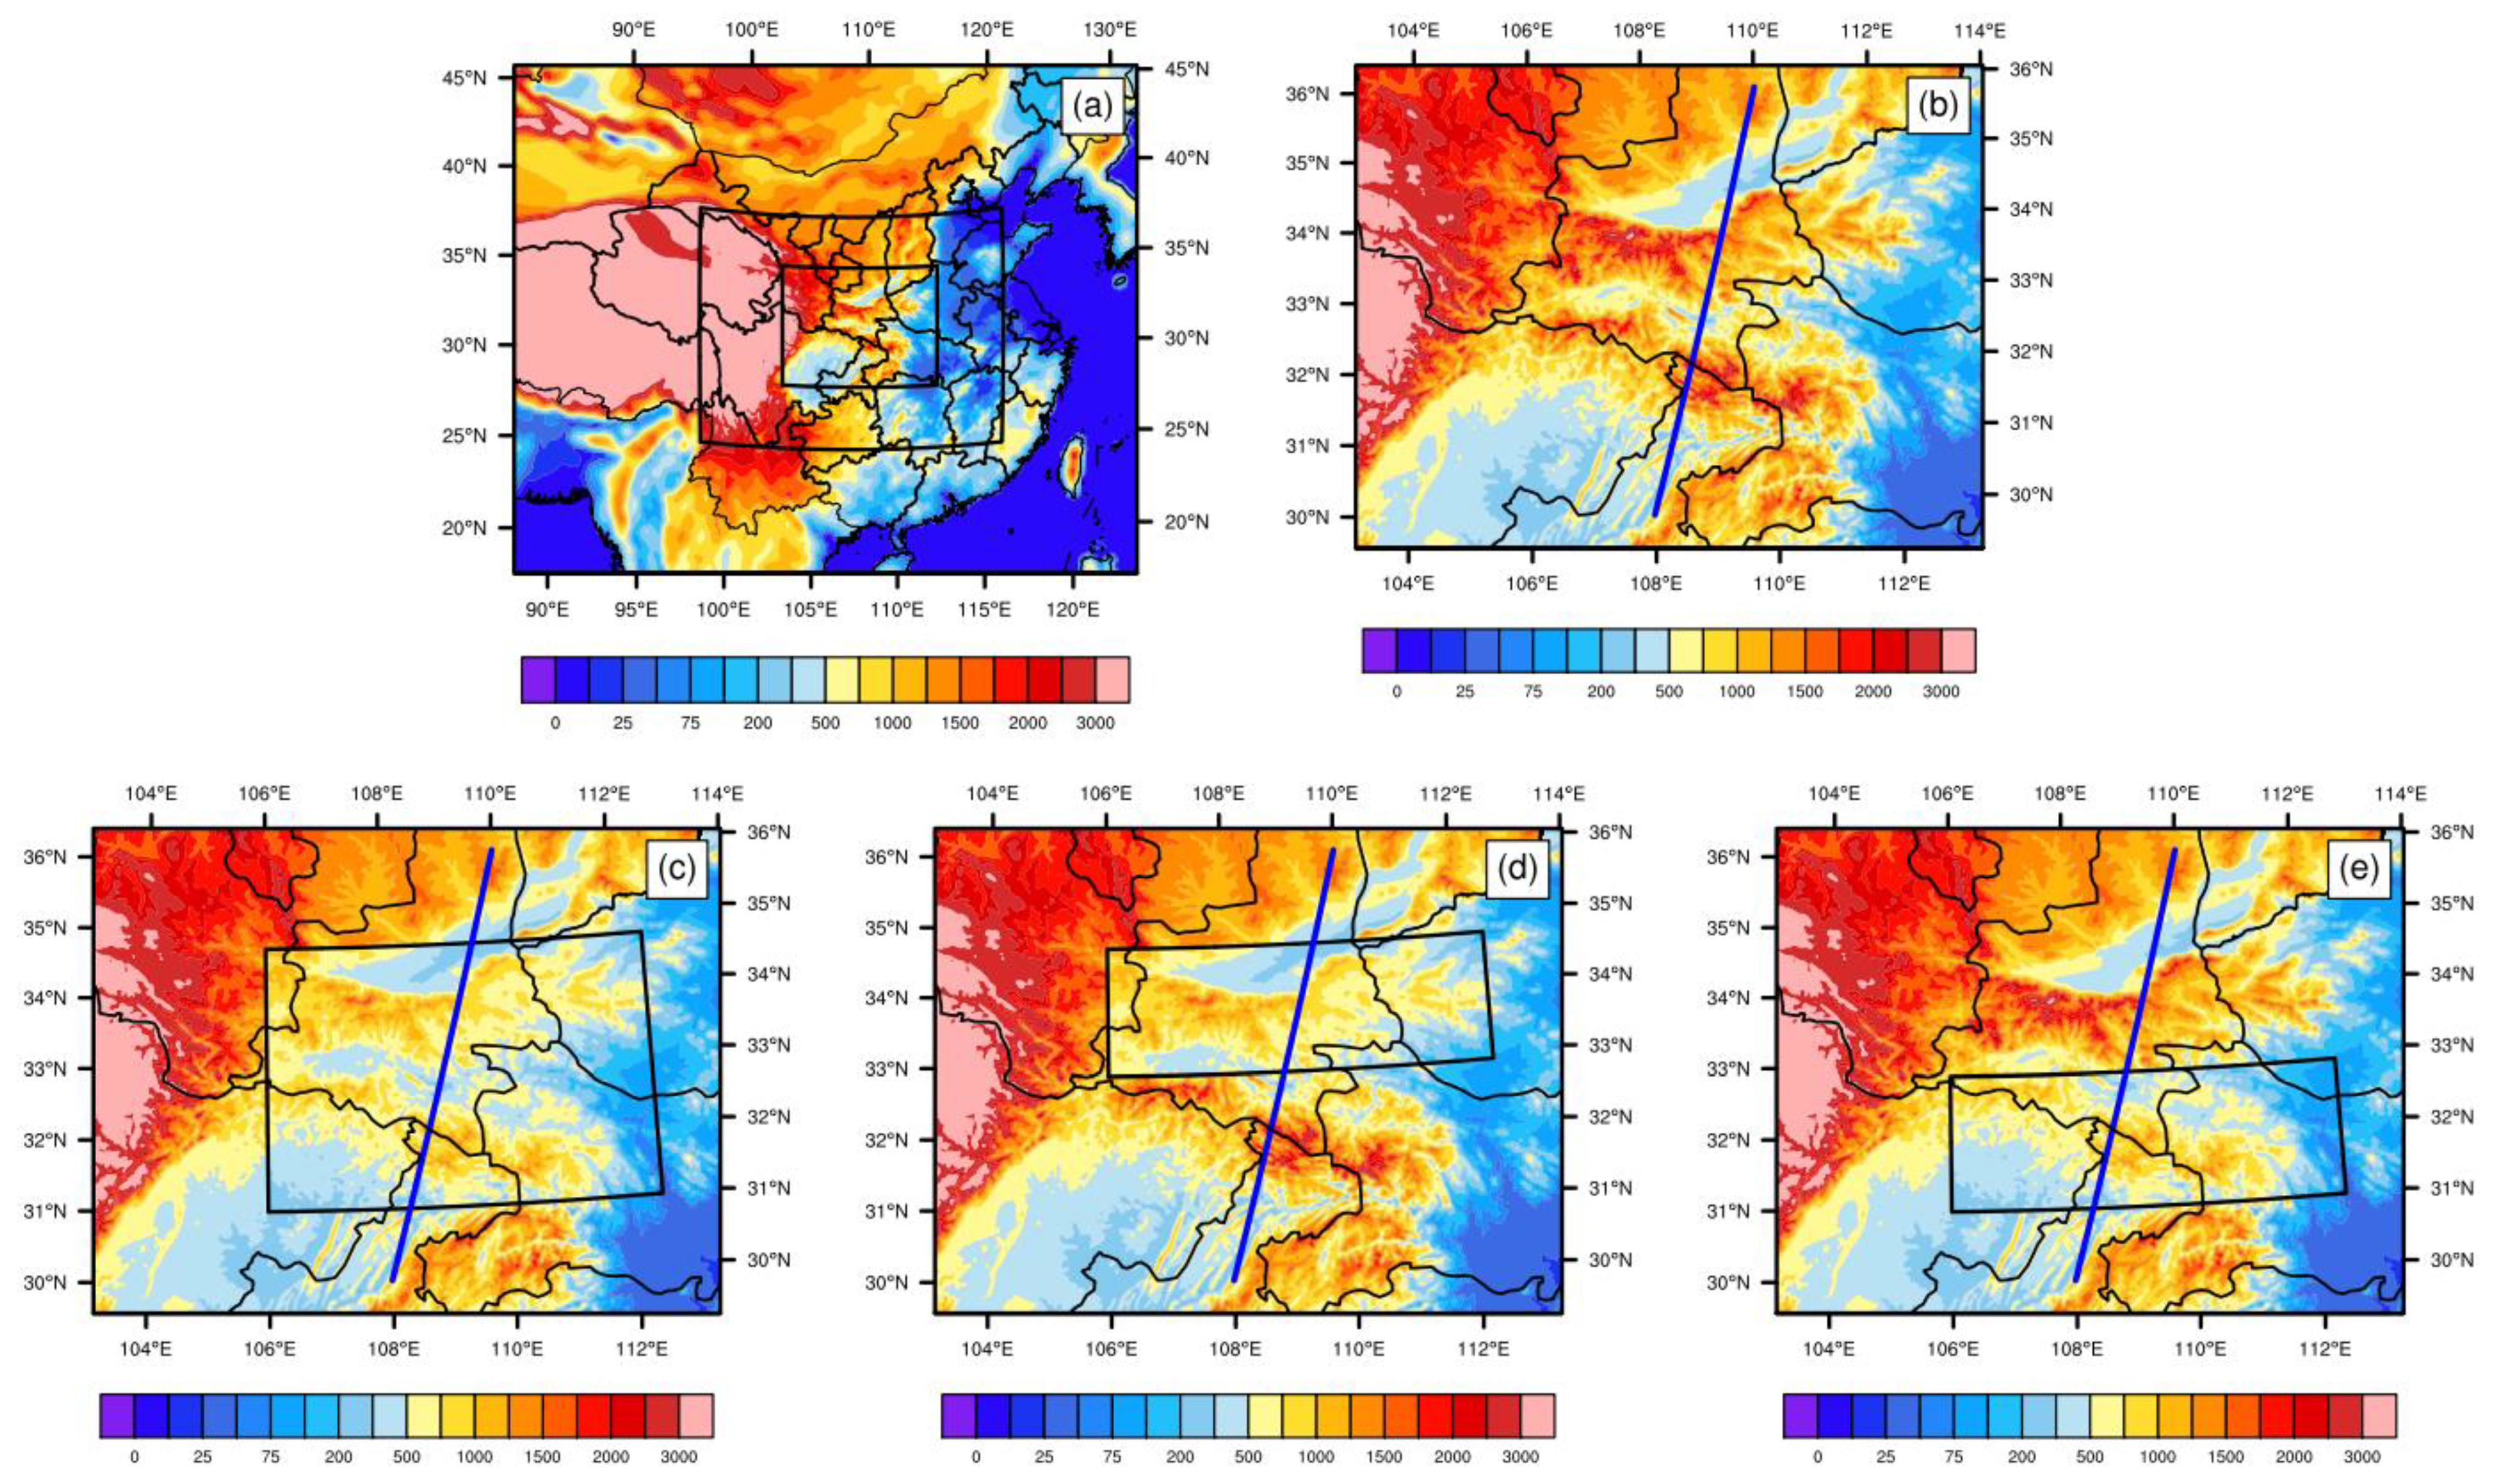
A mesoscale numerical weather prediction system of the WRF Model for Advanced Research (ARW) with the version of 4.0, released by National Center for Atmospheric Research (NCAR) in June 2018 [42], has been used in this study to investigate dynamical features of the diurnal cycle of precipitation and its physical mechanisms in particular with regards to terrain sensitivities. Initial and lateral boundary conditions were provided by the National Centers for Environmental Prediction (NCEP) final operational global analysis and forecast data (FNL) on 0.25 degree by 0.25 degree grids operationally every six hours [43]. The three simulation domains are as in Figure 1, in which the outermost one covers most part of China with 148 × 121 horizontal grids with 27 km grid spacing (Figure 1a), the middle one covers the area from eastern slope of the Tibetan Plateau to the eastern low-lying plains in China with 214 × 166 horizontal grids with 9 km grid spacing (Figure 1a), and the innermost one covers Qinling–Daba Mountains with 328 × 253 horizontal grids with 3 km grid spacing (Figure 1b). A total of 55 vertical levels were used with the model top at 50 hPa in every domain. The Thompson micro physics scheme [44], the Mellor–Yamada–Janjic (MYJ) planetary boundary layer (PBL) scheme [45], the Grell-Freitas cumulus parameterization scheme (turned off in domain 3) [46], RRTMG shortwave and longwave schemes [47], the unified Noah land surface scheme [48], and the Monin-Obukhov (Janjic Eta) Eta-Similarity surface layer scheme [45,49] were used in this study.
2.2. Experimental Design
Because of our interest in the Qinling–Daba terrain effect on the water–energy cycle and the possible linkage or differences between Qinling Mountains and Daba Mountains during a warm season, we choose to focus on continuous simulations of two representative months of July and August in 2019. July and August are the highest two months among monthly precipitation of the historical climatology [3]. All the time used in this paper is referred to the Universal Time Coordinated (UTC). The initial conditions of all simulations were the FNL reanalysis data at 18:00 UTC every day from 30 June to 30 August of 2019, and the lateral boundary conditions were obtained in the same way as the initial conditions from 18:00 UTC in every 6 h interval. The simulations last for 30 h every day, when the first 6 h were used as a spin-up period to alleviate the spin-up issue and day-to-day variability. As a result, the valid analyzed data is from 00:00 UTC 1 July to 00:00 UTC 1 September. This method on daily simulations has been widely used in some previous studies [35,37], which is an effective method to alleviate the problem of systematic model error that may grow in a long-term integration. The biggest advantage of this two-month simulation is that it is able to capture the general characteristics of the precipitation and the related dynamical processes instead of just focusing on a single case. The control experiment, named CTRL, was initialed with unmodified orography to simulate the diurnal precipitation characteristics. The experiment LowQD is the same as CTRL except that the orography over Qinling–Daba Mountains is lowered to isolate the influence of the mountains’ terrain (Figure 1c). In order to compare the Qinling Mountains and Daba Mountains quantitatively, similarly, LowQ and LowD are the same as CTRL except that the orography over Qinling Mountains or Daba Mountains is lowered, separately (Figure 1d,e). To make it a reasonable height reducing method in avoid of sharp dropping, the height of the terrain was set to 50% for the part of its original terrain height exceeding 300 m, following Equation (1):
where H0 is the original terrain height, H1 is the lowered terrain height. The original terrain height, which is less than or equal to 300 m will not be modified. Here, we only consider the effects of the Qinling–Daba orography height, by keep the land use/cover and the atmospheric forcing field unchanged. Except for the height change, all other terrain related settings are the default settings in the WRF mode. This is a similar methodology on terrain sensitivity experiment with some previous studies [12,36], where sensitivity simulations modify the height of terrain in the same region but retains the same land properties as those in the CTRL.
H1 = H0 − (H0 − 300) × 50%
2.3. Model Evaluation
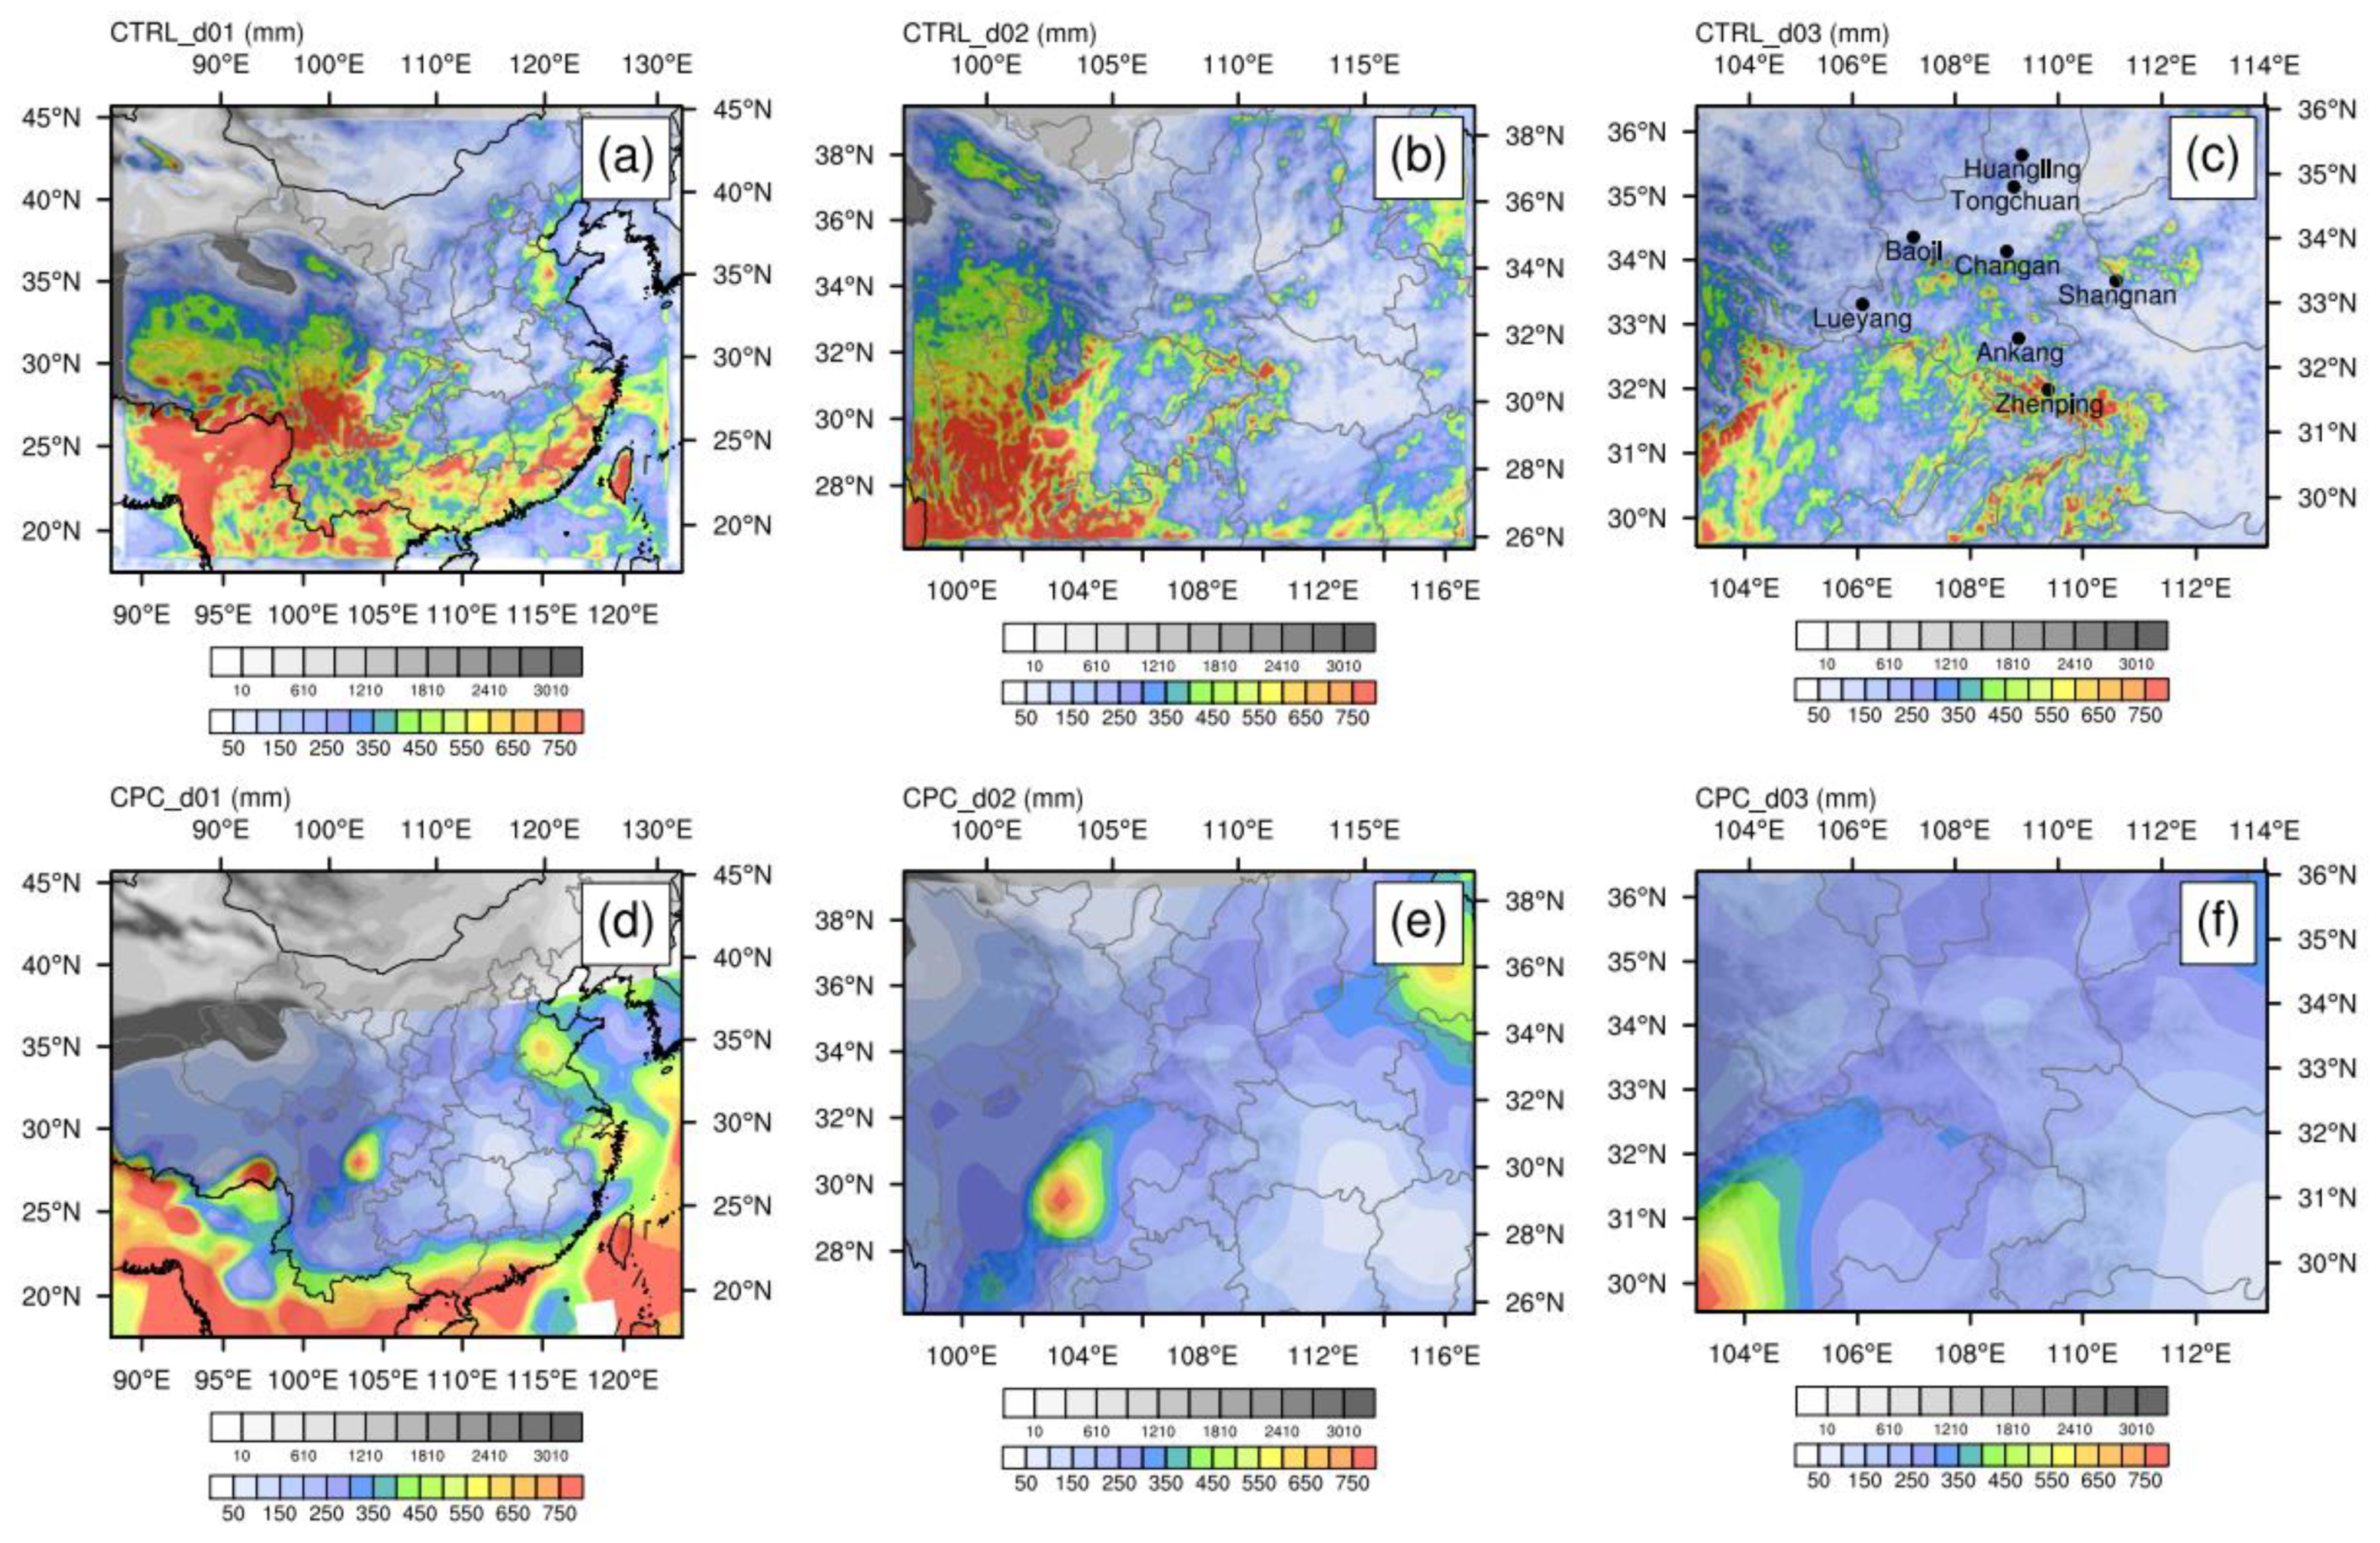
To evaluate the model capability on spatial patter of monthly precipitation, Figure 2 compares the monthly analysis of global land precipitation amount in 0.5 × 0.5 degree boxes from Climate Prediction Center (CPC), provided by Asia-Pacific Data Research Center, and model-simulated accumulated total precipitation for every domain of the control experiment CTRL. The model reproduces the general southwest to southeast elongated rainfall swaths along the coastline in southern China, as well as two precipitation centers in Sichuan Basin and North China Plain in domain 1 as analyzed from CPC (Figure 2a,d). Although, there are quantitative differences between the CPC precipitation and simulated precipitation, in both intensity and locations when examined in detail, especially in high-resolution domains (Figure 1b,c,e), when we focus on the precipitation near the Qinling–Daba Mountains. For example, the monthly accumulated total precipitation, is over-predicted by the model, with the peak values at isolated locations reaching over 750 mm/month, the simulated precipitation in some southwest mountain areas is noticeably more intense than CPC analyzed, which is in agreement with previous result that convective-permitting simulations tend to over-predict rainfall in the warm season of China [50]. Such differences can be due to both models forecast error and analyzed rainfall data uncertainty, in which observations from rain gauges are merged with precipitation estimates from several satellite-based algorithms (infrared and microwave). On the one hand, the rain gauge network and the analyzed box have a much lower resolution compared to that of model, so that the mountain areas are in the lack of comprehensive observation of precipitation, leading the rainfall extremes tend to be underestimated. On the other hand, convective-permitting simulations tend to over-predict rainfall in the warm season of China [51,52].
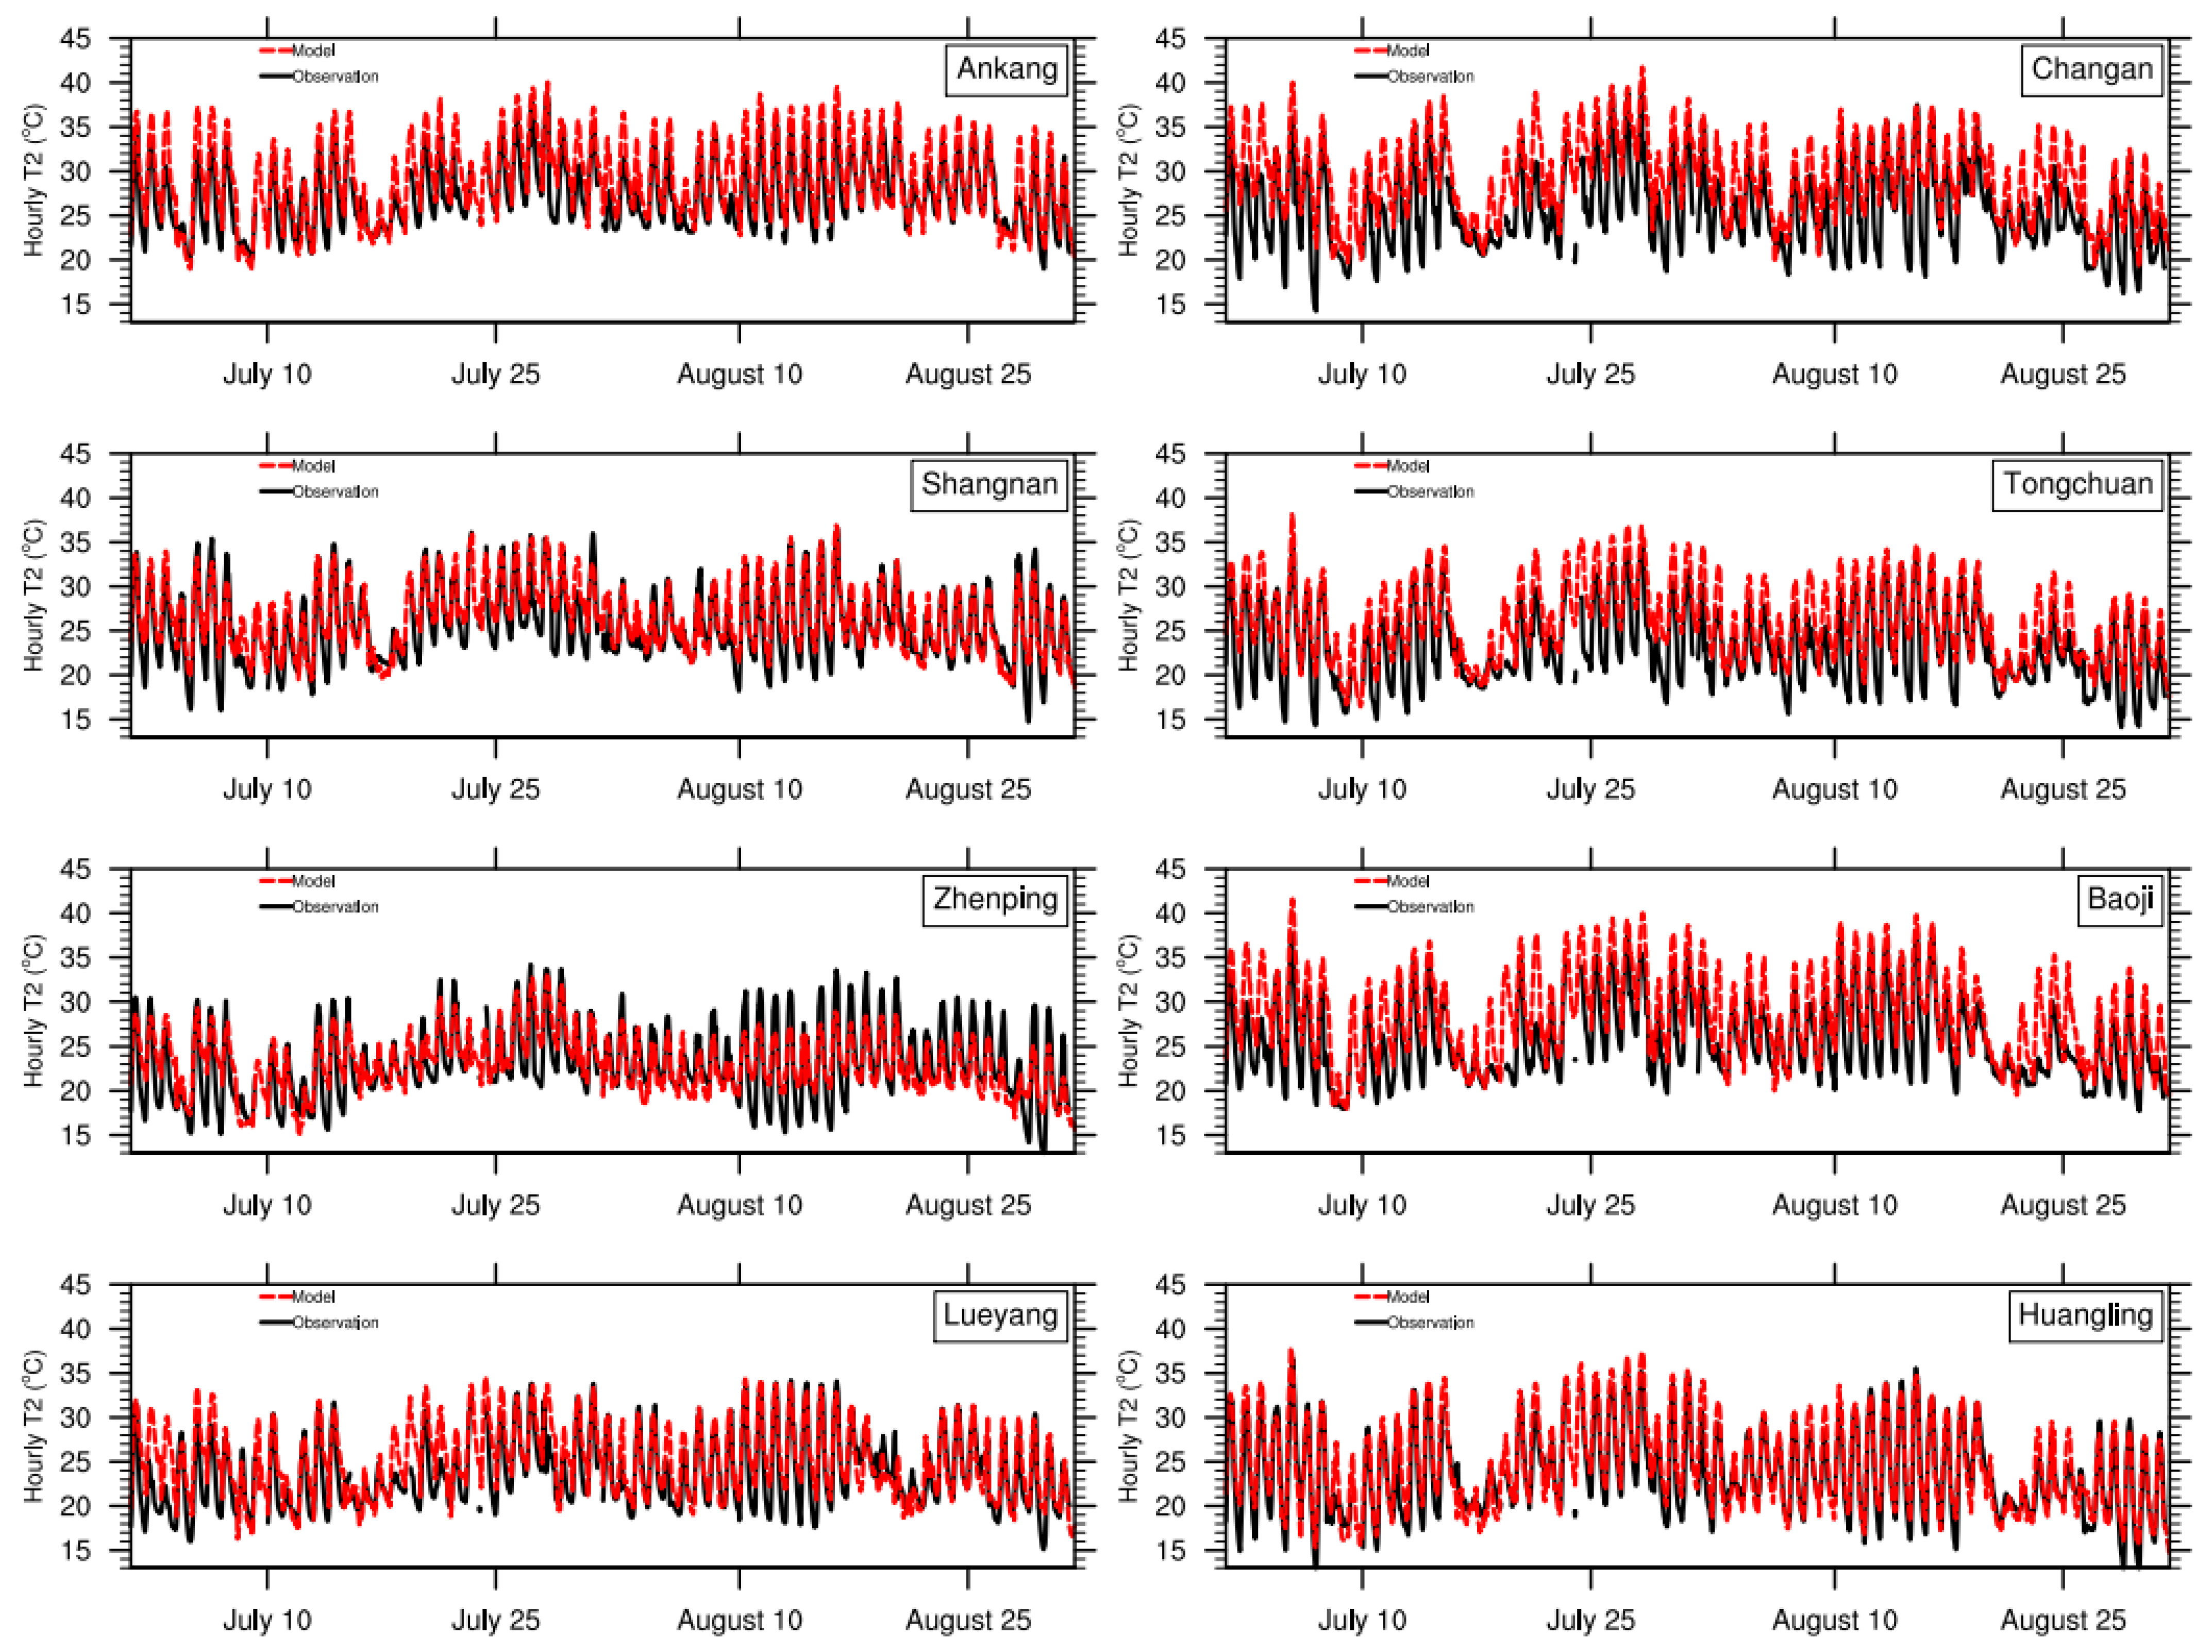
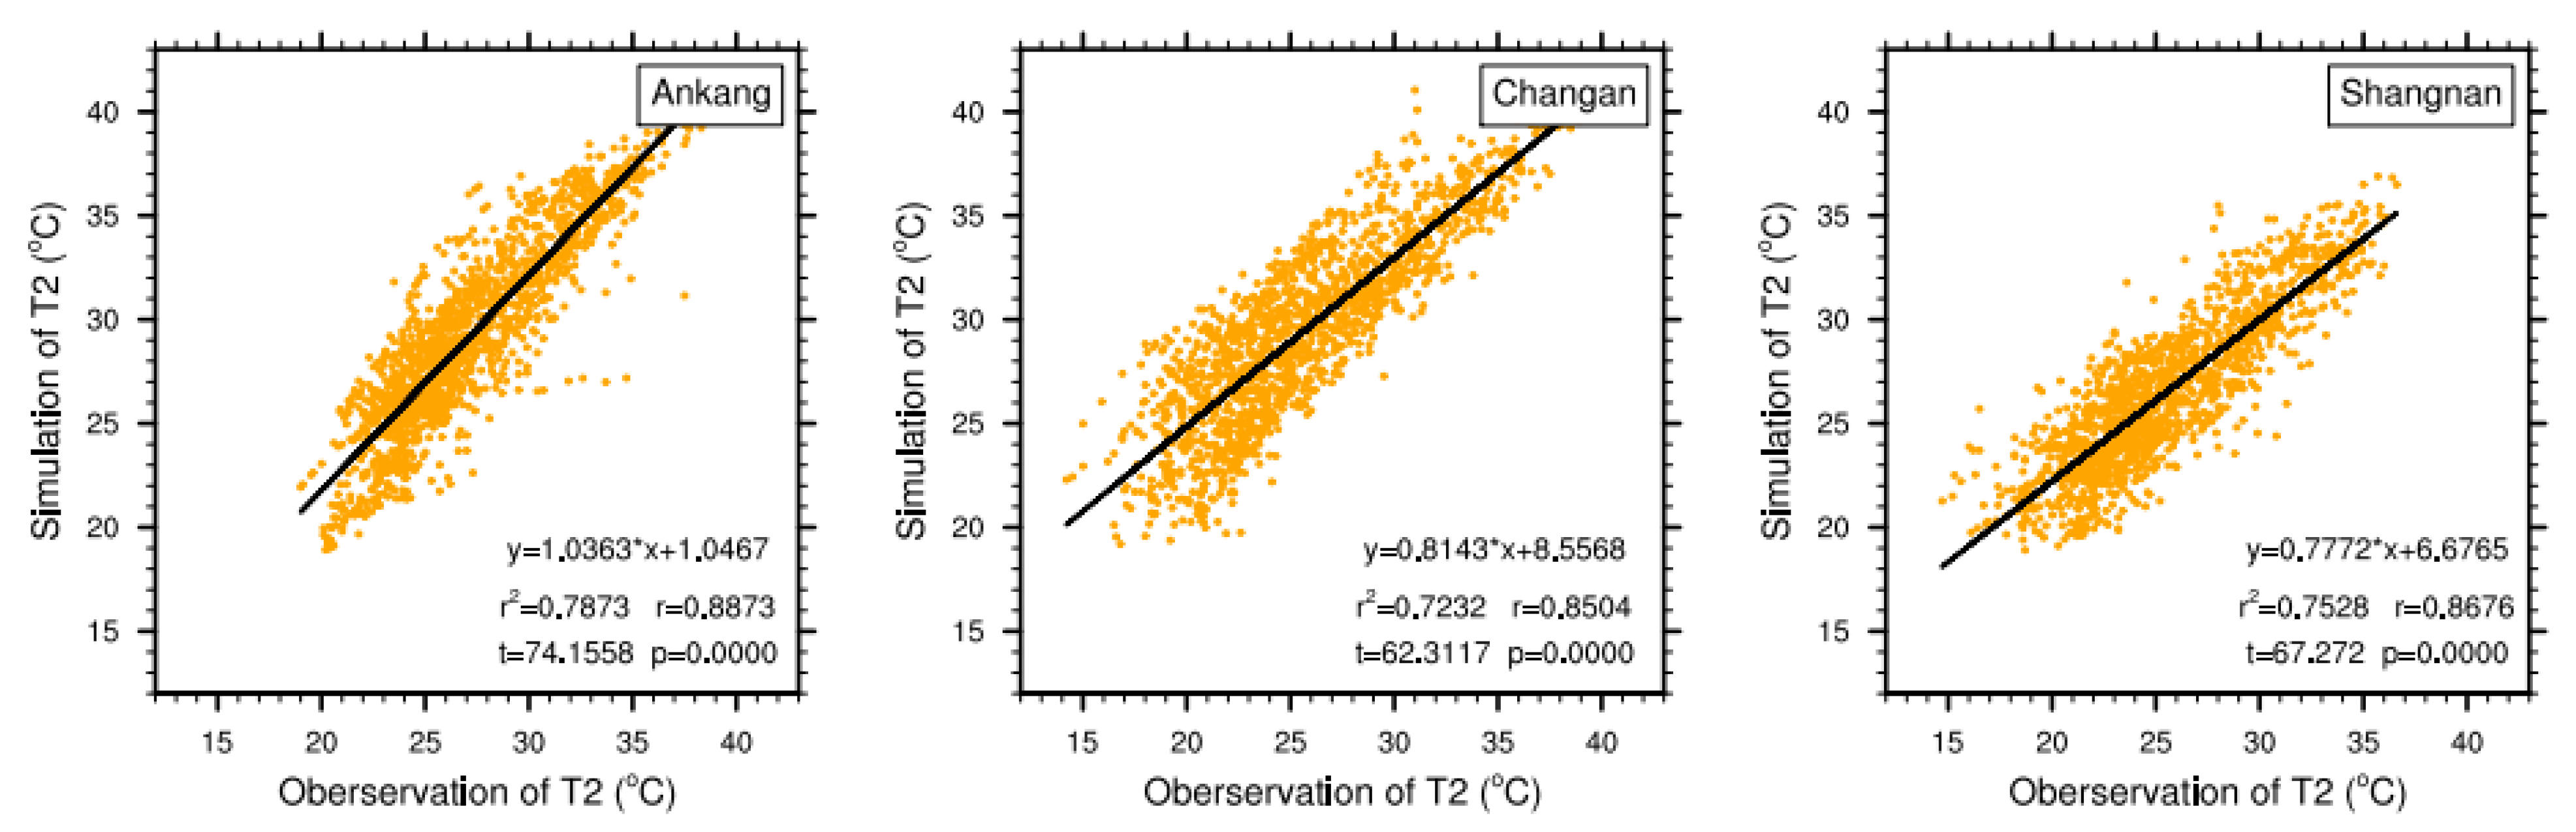
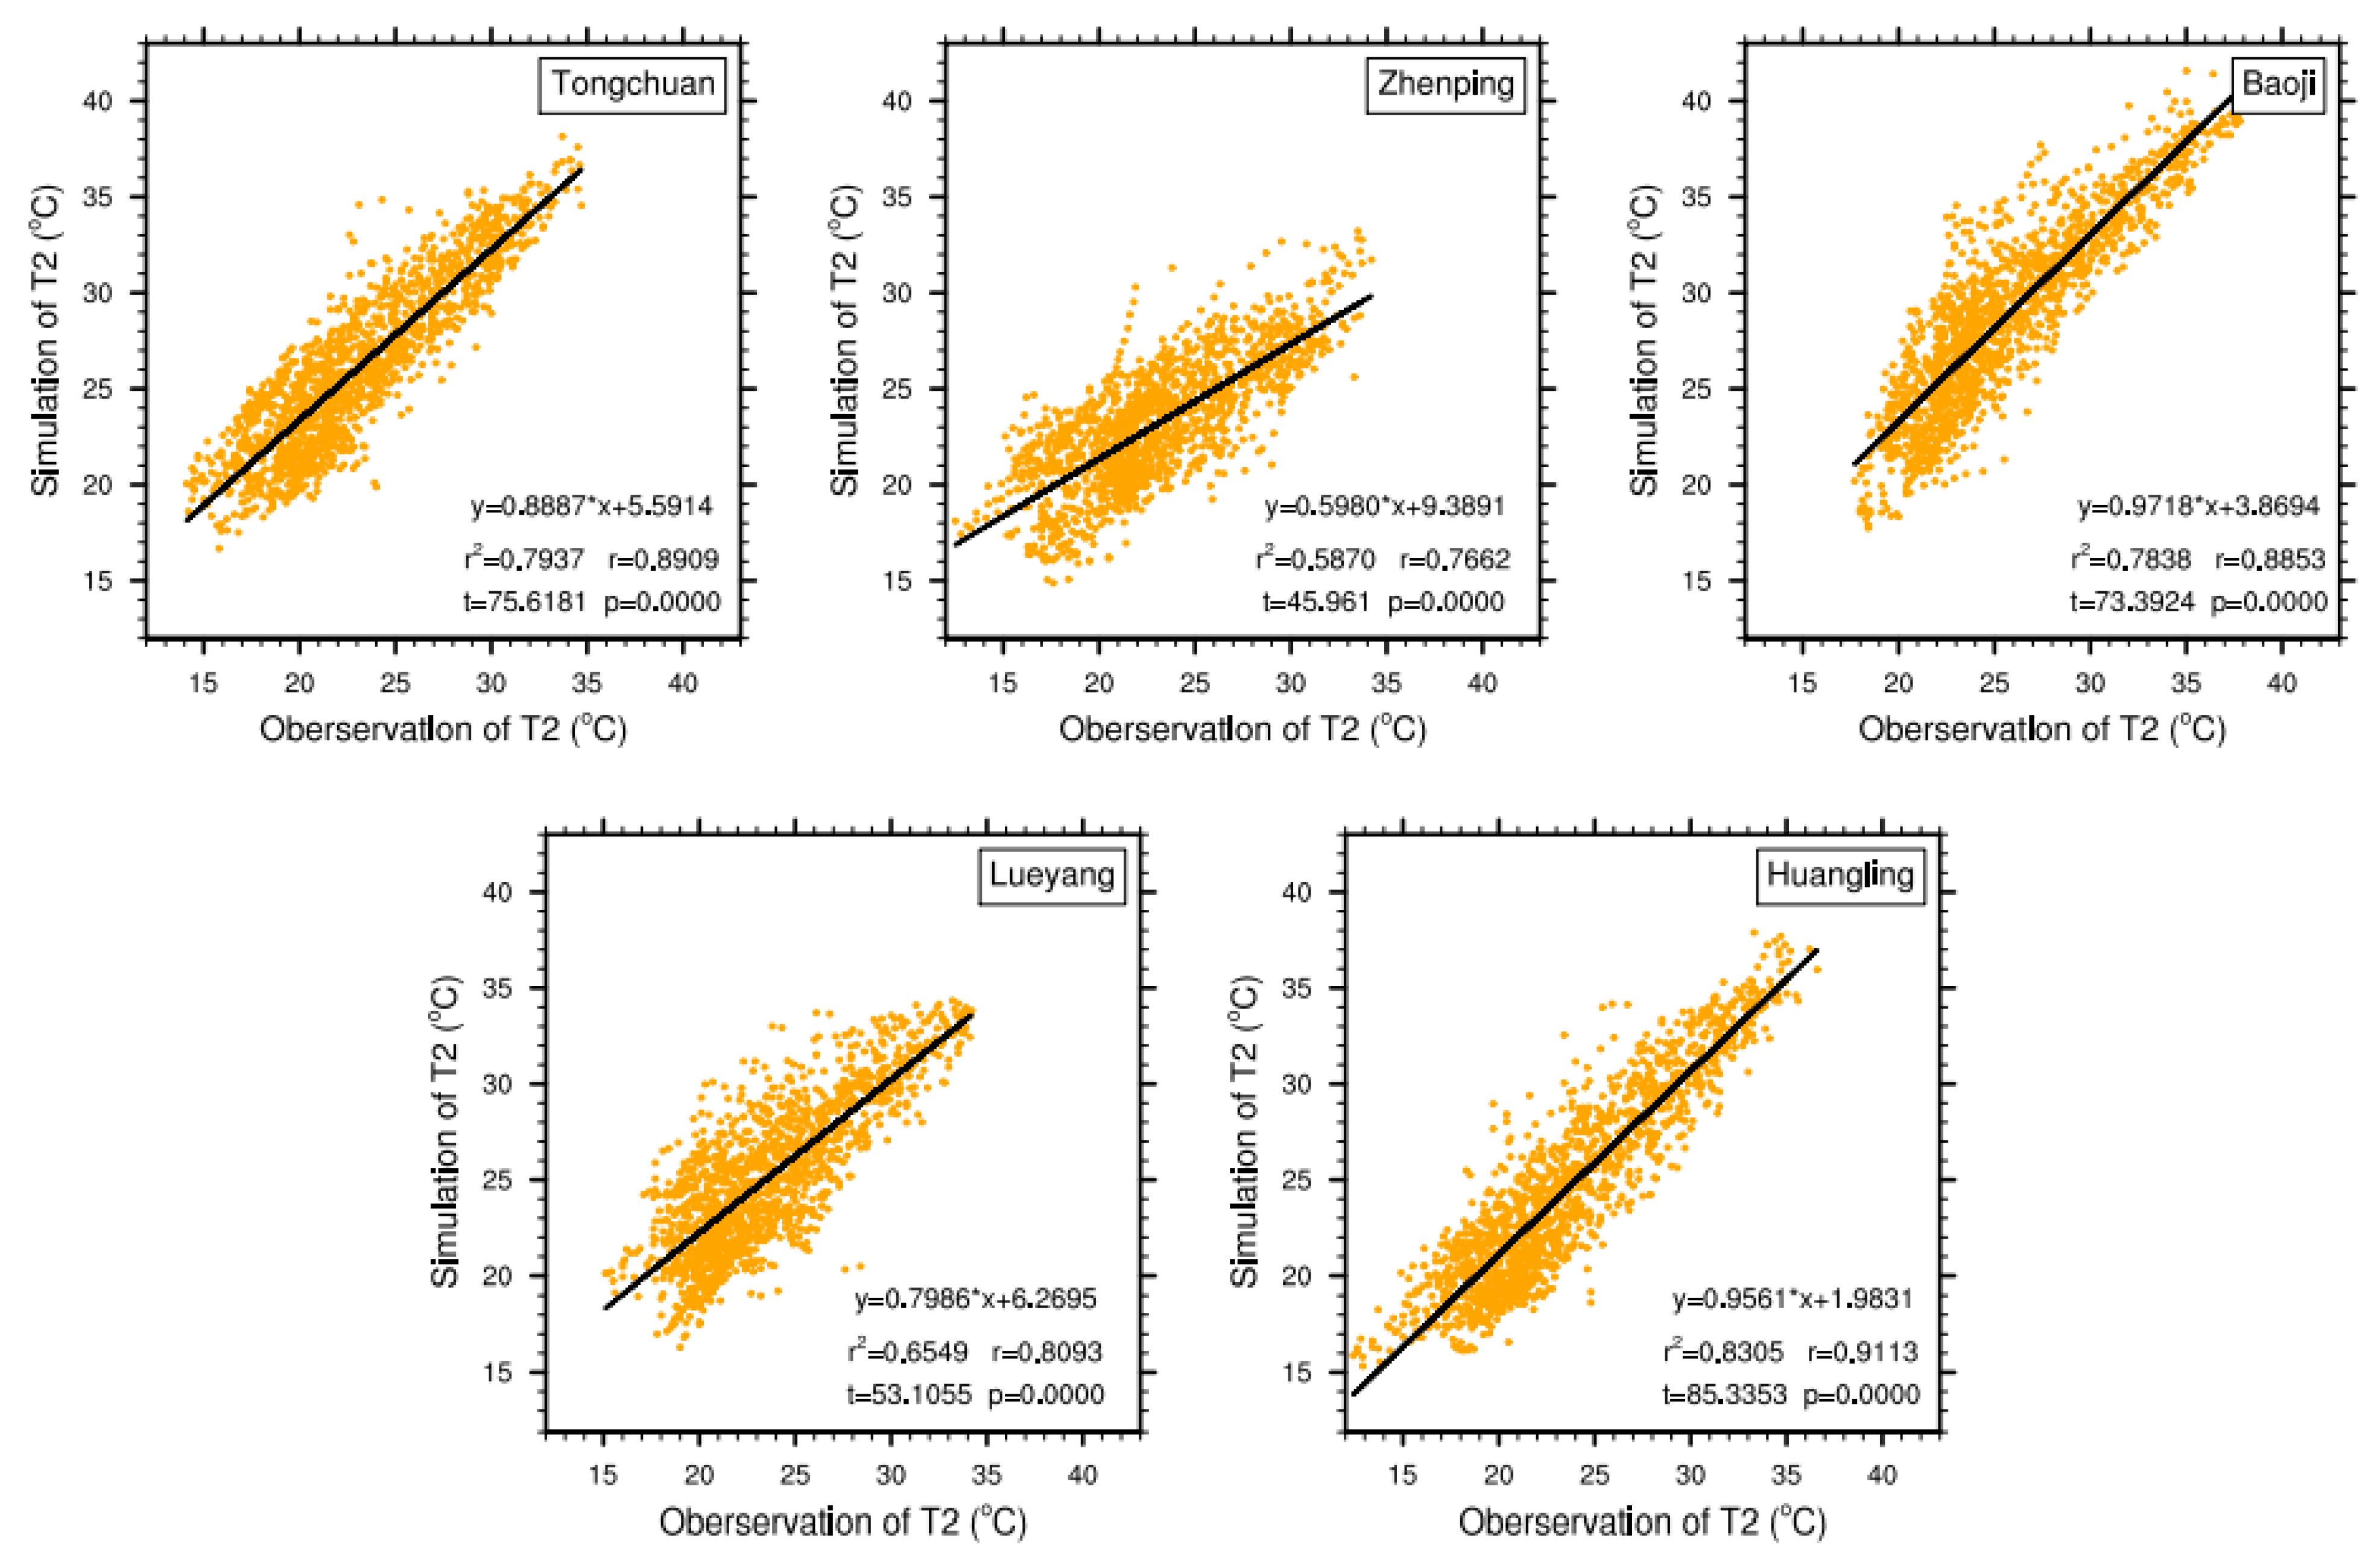
To make a more robust evaluation of the model, the hourly air temperature at 2 m (T2) dataset from 8 meteorological stations of Ankang, Changan, Shangnan, Tongchuan, Zhenping, Baoji, Lueyang, Huangling, around the target area and located in Loess Plateau, the Guanzhong Basin, Qinling Mountains, and Daba Mountains from north to south, was compared, which is obtained from the National Meteorological Information Center and Shaanxi Meteorological Bureau of the China Meteorological Administration (CMA). The temporal variation of the simulated T2m is in a good agreement with observation in each meteorological station (Figure 3), though the T2 are slightly higher than observations for daily minimum temperature at Changan and Tongchuan. The correlation of T2 between observations and simulations shows a strong linear relationship for all the 8 stations (Figure 4), resulting from t tests for the correlation, where all the p-values are on a significant result over 99% significance testing.
Given a higher consistency with the observed values in the surface accumulated precipitation and temporal pattern of air temperature, we will focus on investigating the on Qinling–Daba Mountains effects on regional precipitation pattern and diurnal cycle of it in warm season in the following sections based on simulation results.
3. Results
3.1. Daily Precipitation and Diurnal Cycle
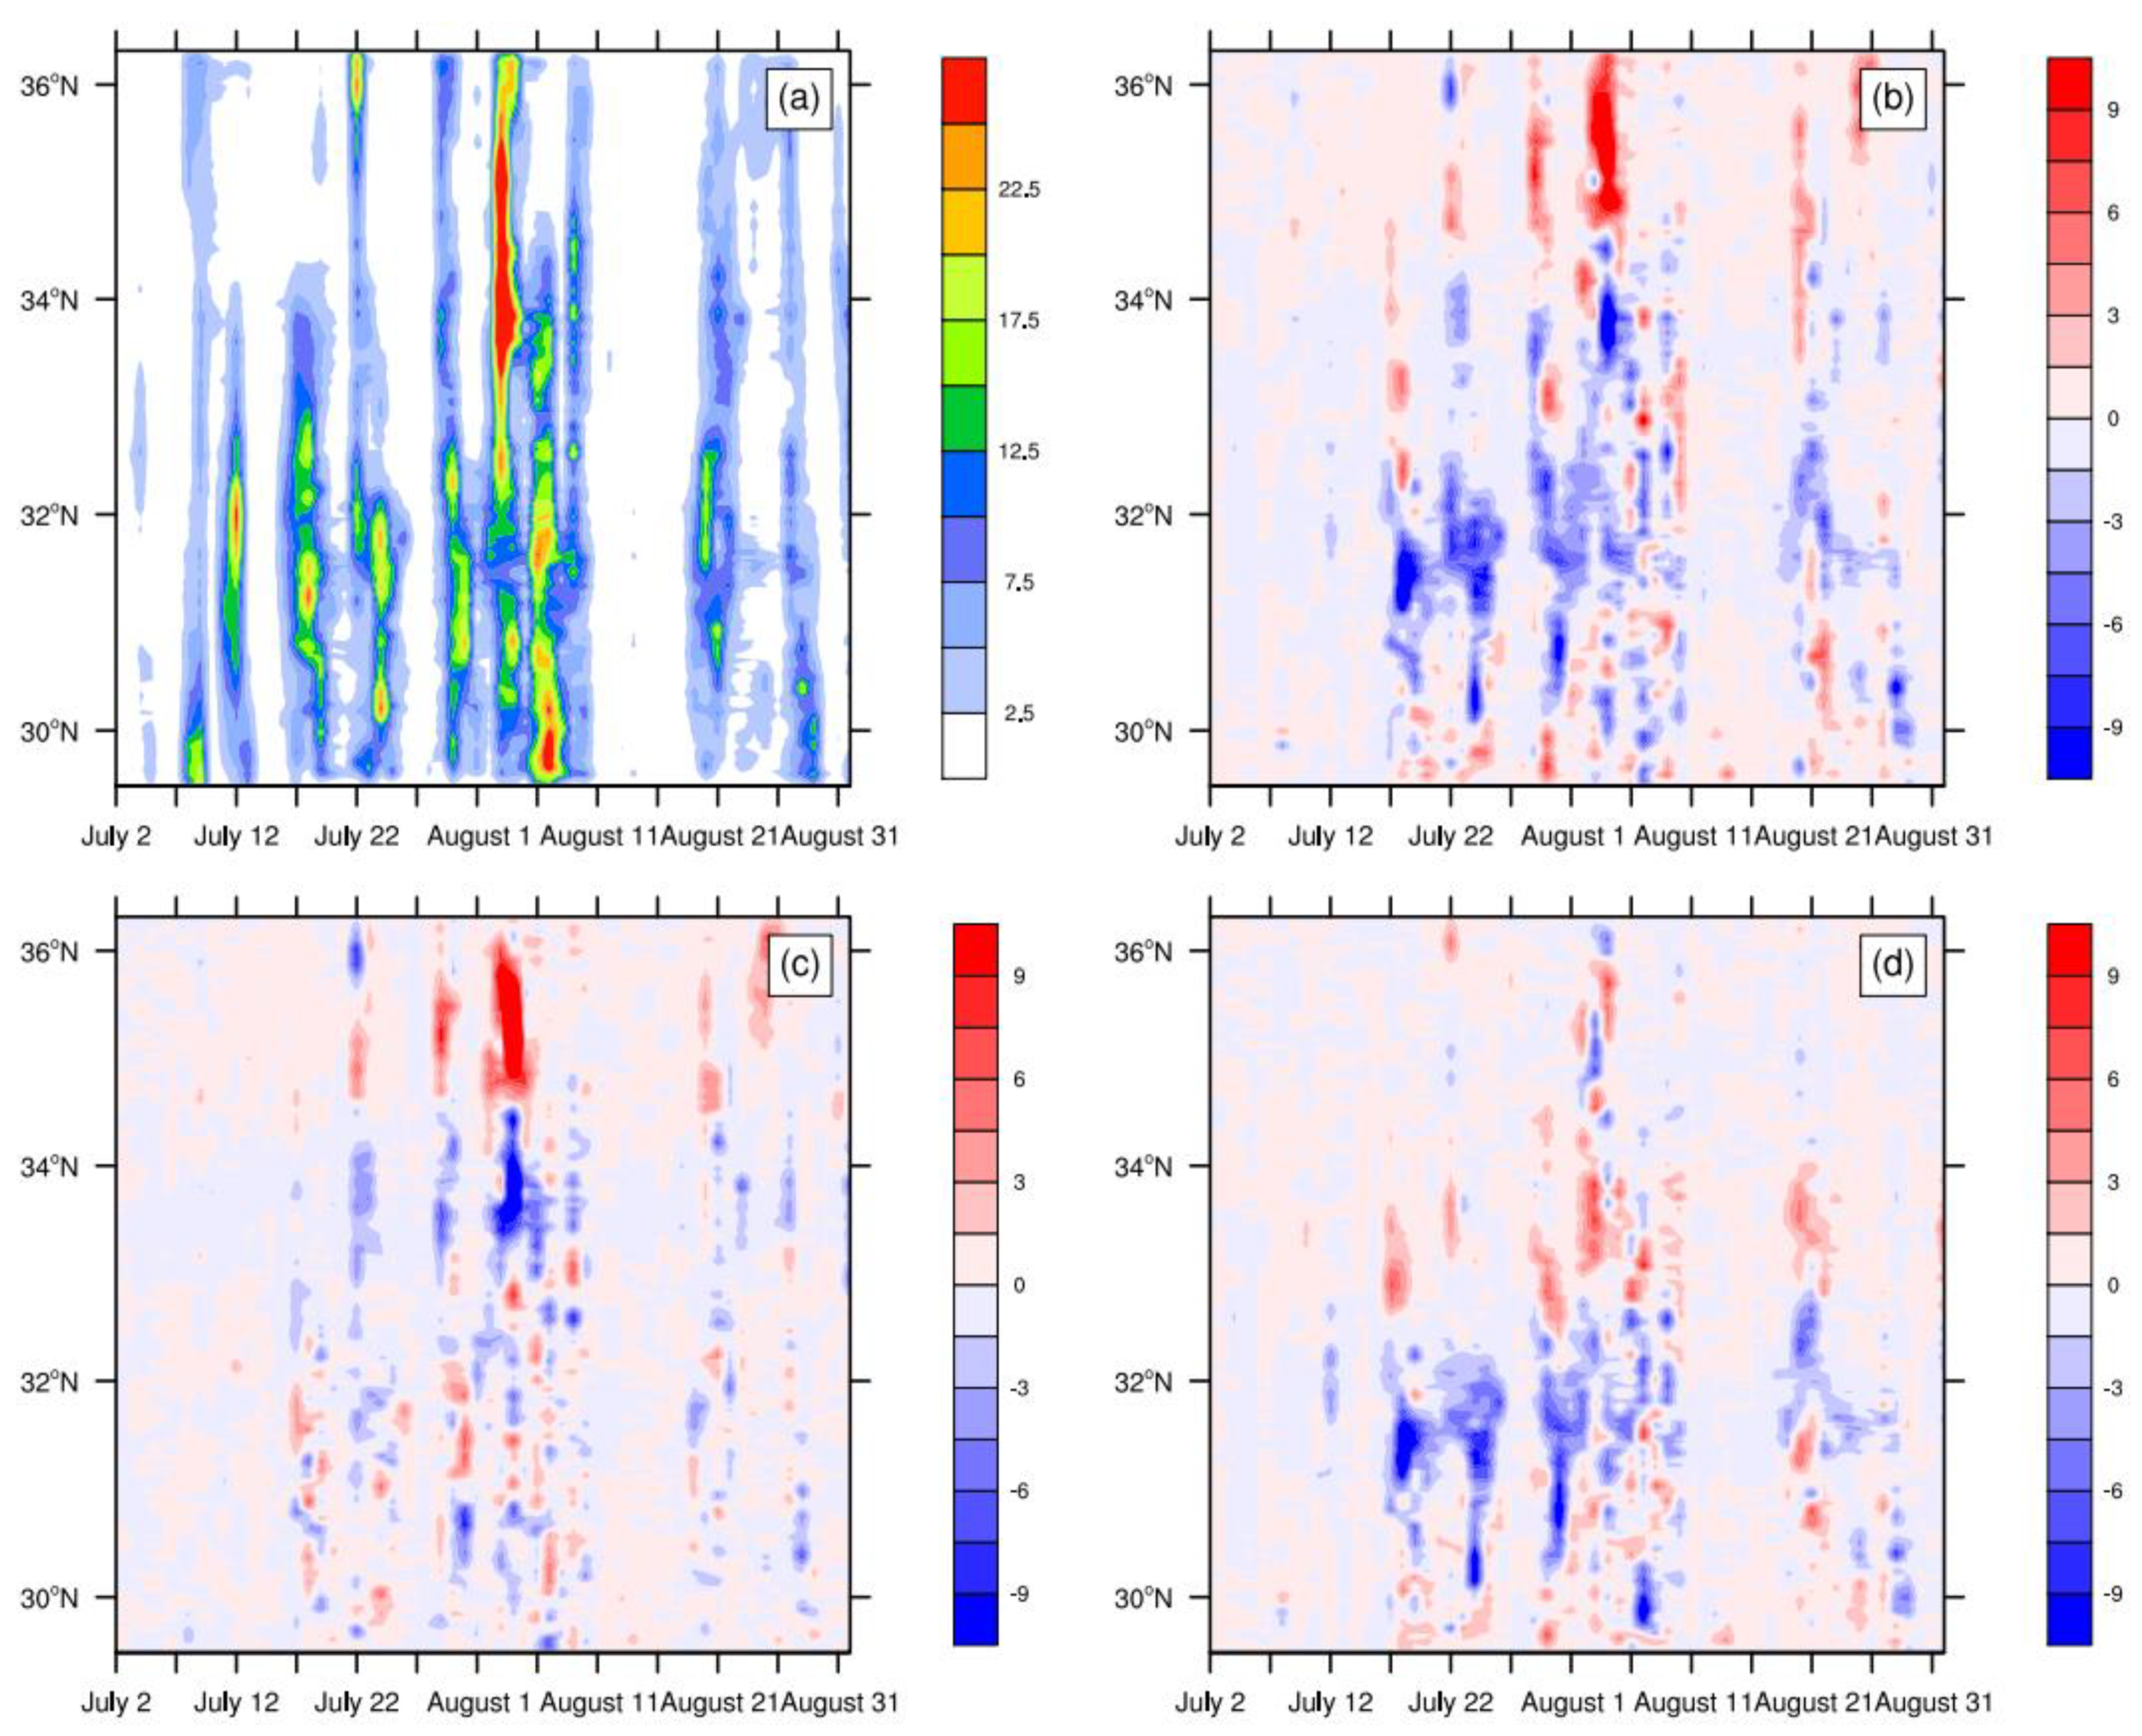
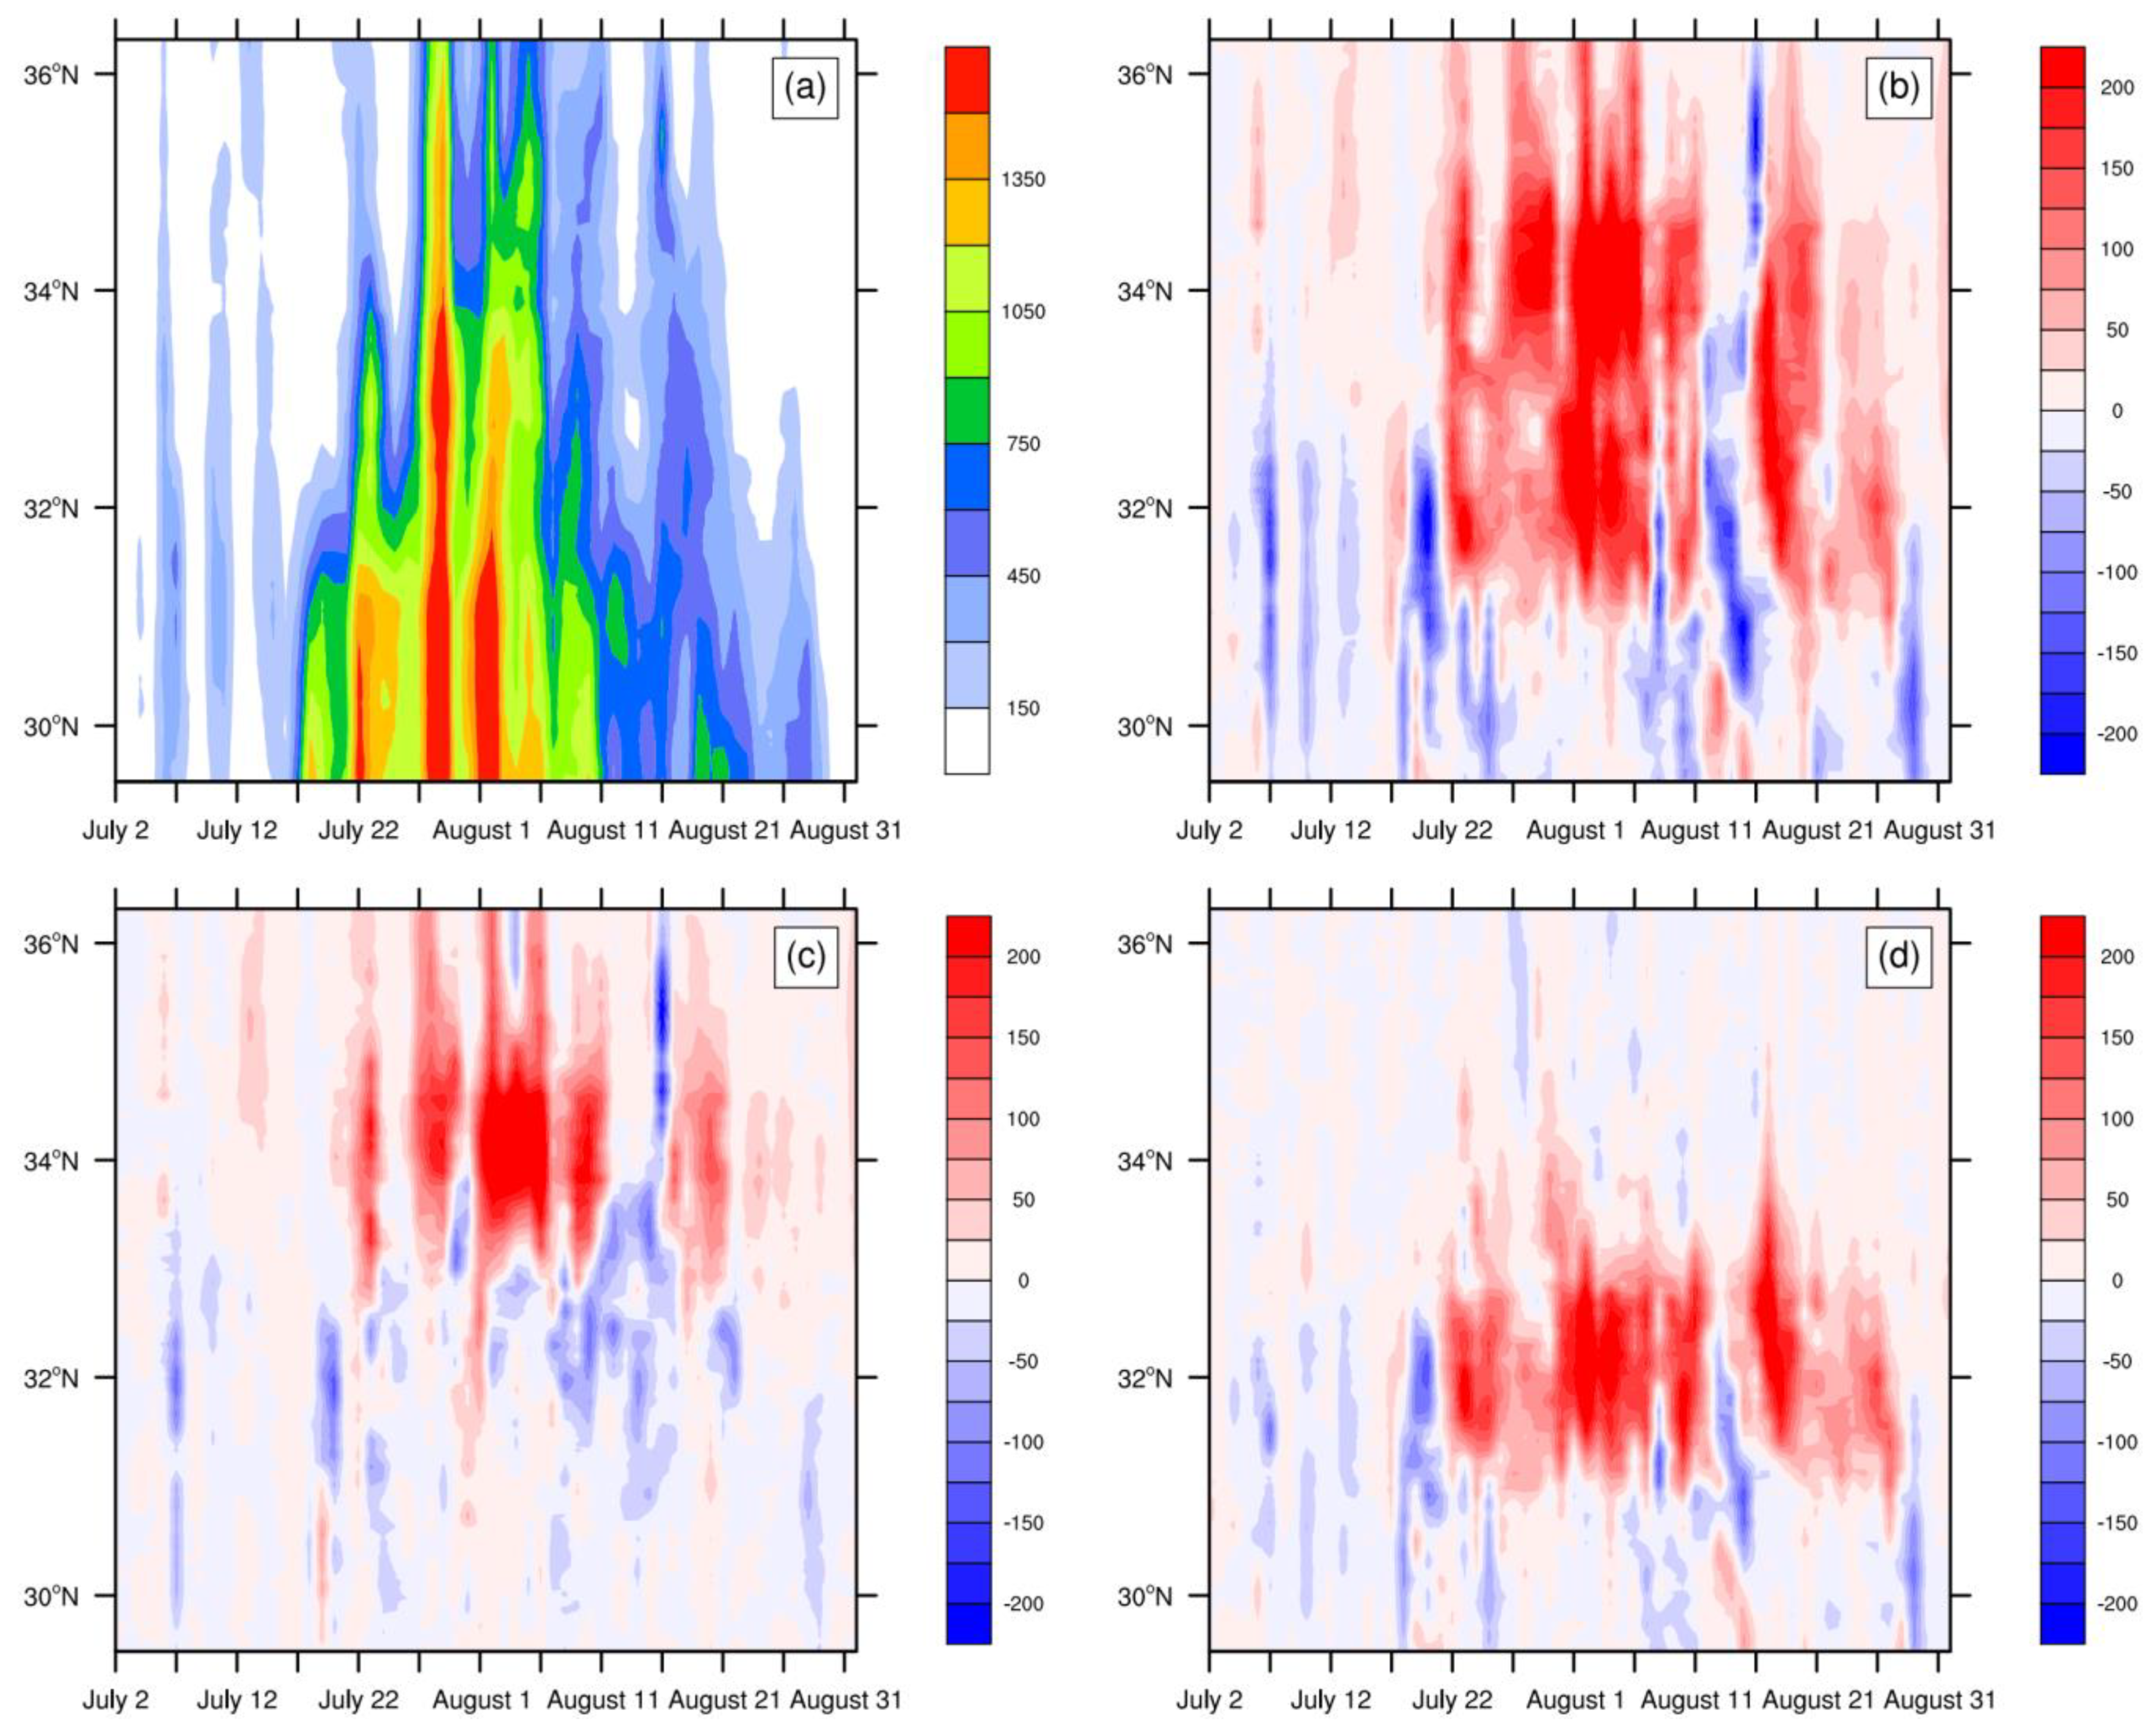
We first examine the terrain effect of Qinling–Daba Mountains on the zonal location of daily accumulated precipitation for reginal precipitation in summer in 2019. From 1 July to 31 August, the spatial location of daily accumulated precipitation is concentrated around 32° N, with two peaks around 34° N and 30° N (Figure 5a). However, the rain band shows an obvious enhancement over 5 mm/day to the north of 34° N to 36° N, while it generally performs a weakened precipitation between 30° N and 34° N in the sensitivity experiment LowQD with both lower height of Qinling Mountains and Daba Mountains (Figure 5b). Once we lower them separately, it results in a different pattern with LowQD. In LowQ (Figure 5c), alteration in the rain band are mainly concentrated around 34° N, to whose north there is an enhancement in an equal magnitude compared to the enhancement in LowQD, and to whose south there is a reduction southward only around 33° N, which does not go further to the south compared to the southern frontier of rain band reduction around 30° N. Differently to the results in LowQ, LowD mainly performs precipitation changes around 32° N (Figure 5d), where there is an obvious reduction between 30° N and 32° N and a slight enhancement between 32° N and 34° N. Generally speaking, both Qinling Mountains and Daba Mountains play an important role in intensities and spatial locations of reginal daily precipitation, and the effects of two mountains on re-location rain band are related to their geographical location. Qinling mountains affect precipitation mainly around 34° N, which is more northern than 32° N due to Daba Mountains effect.
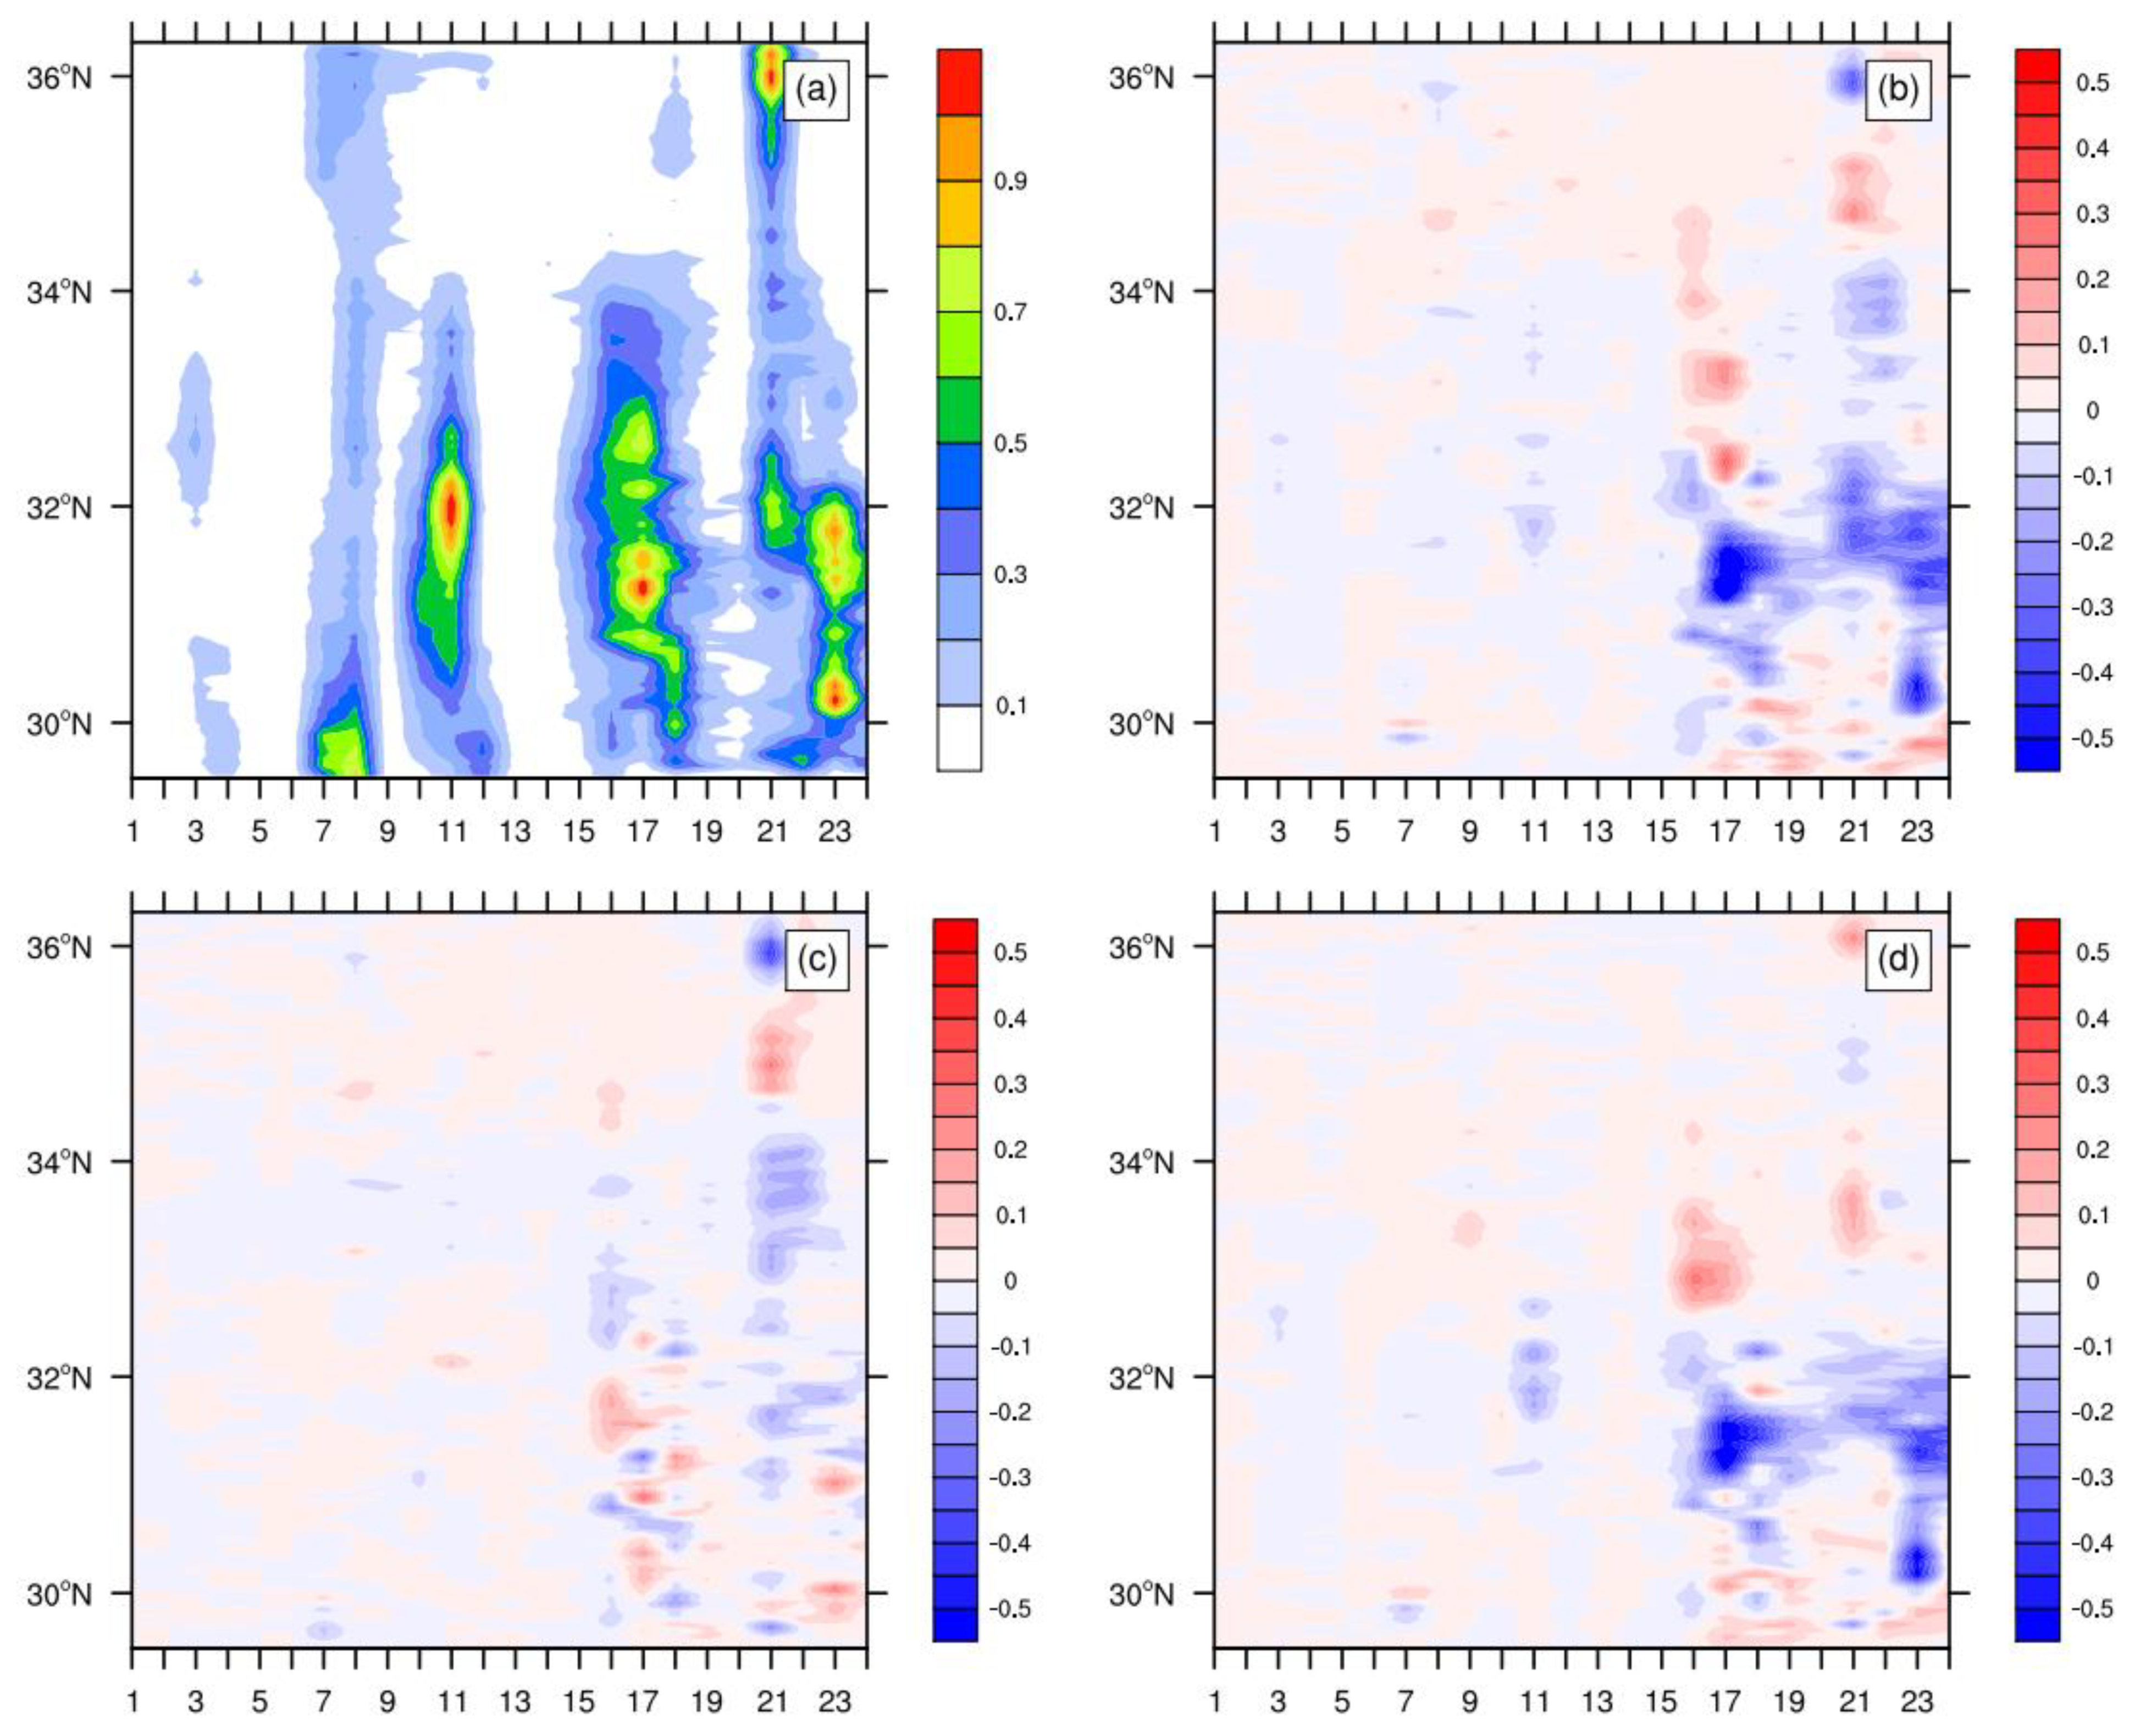
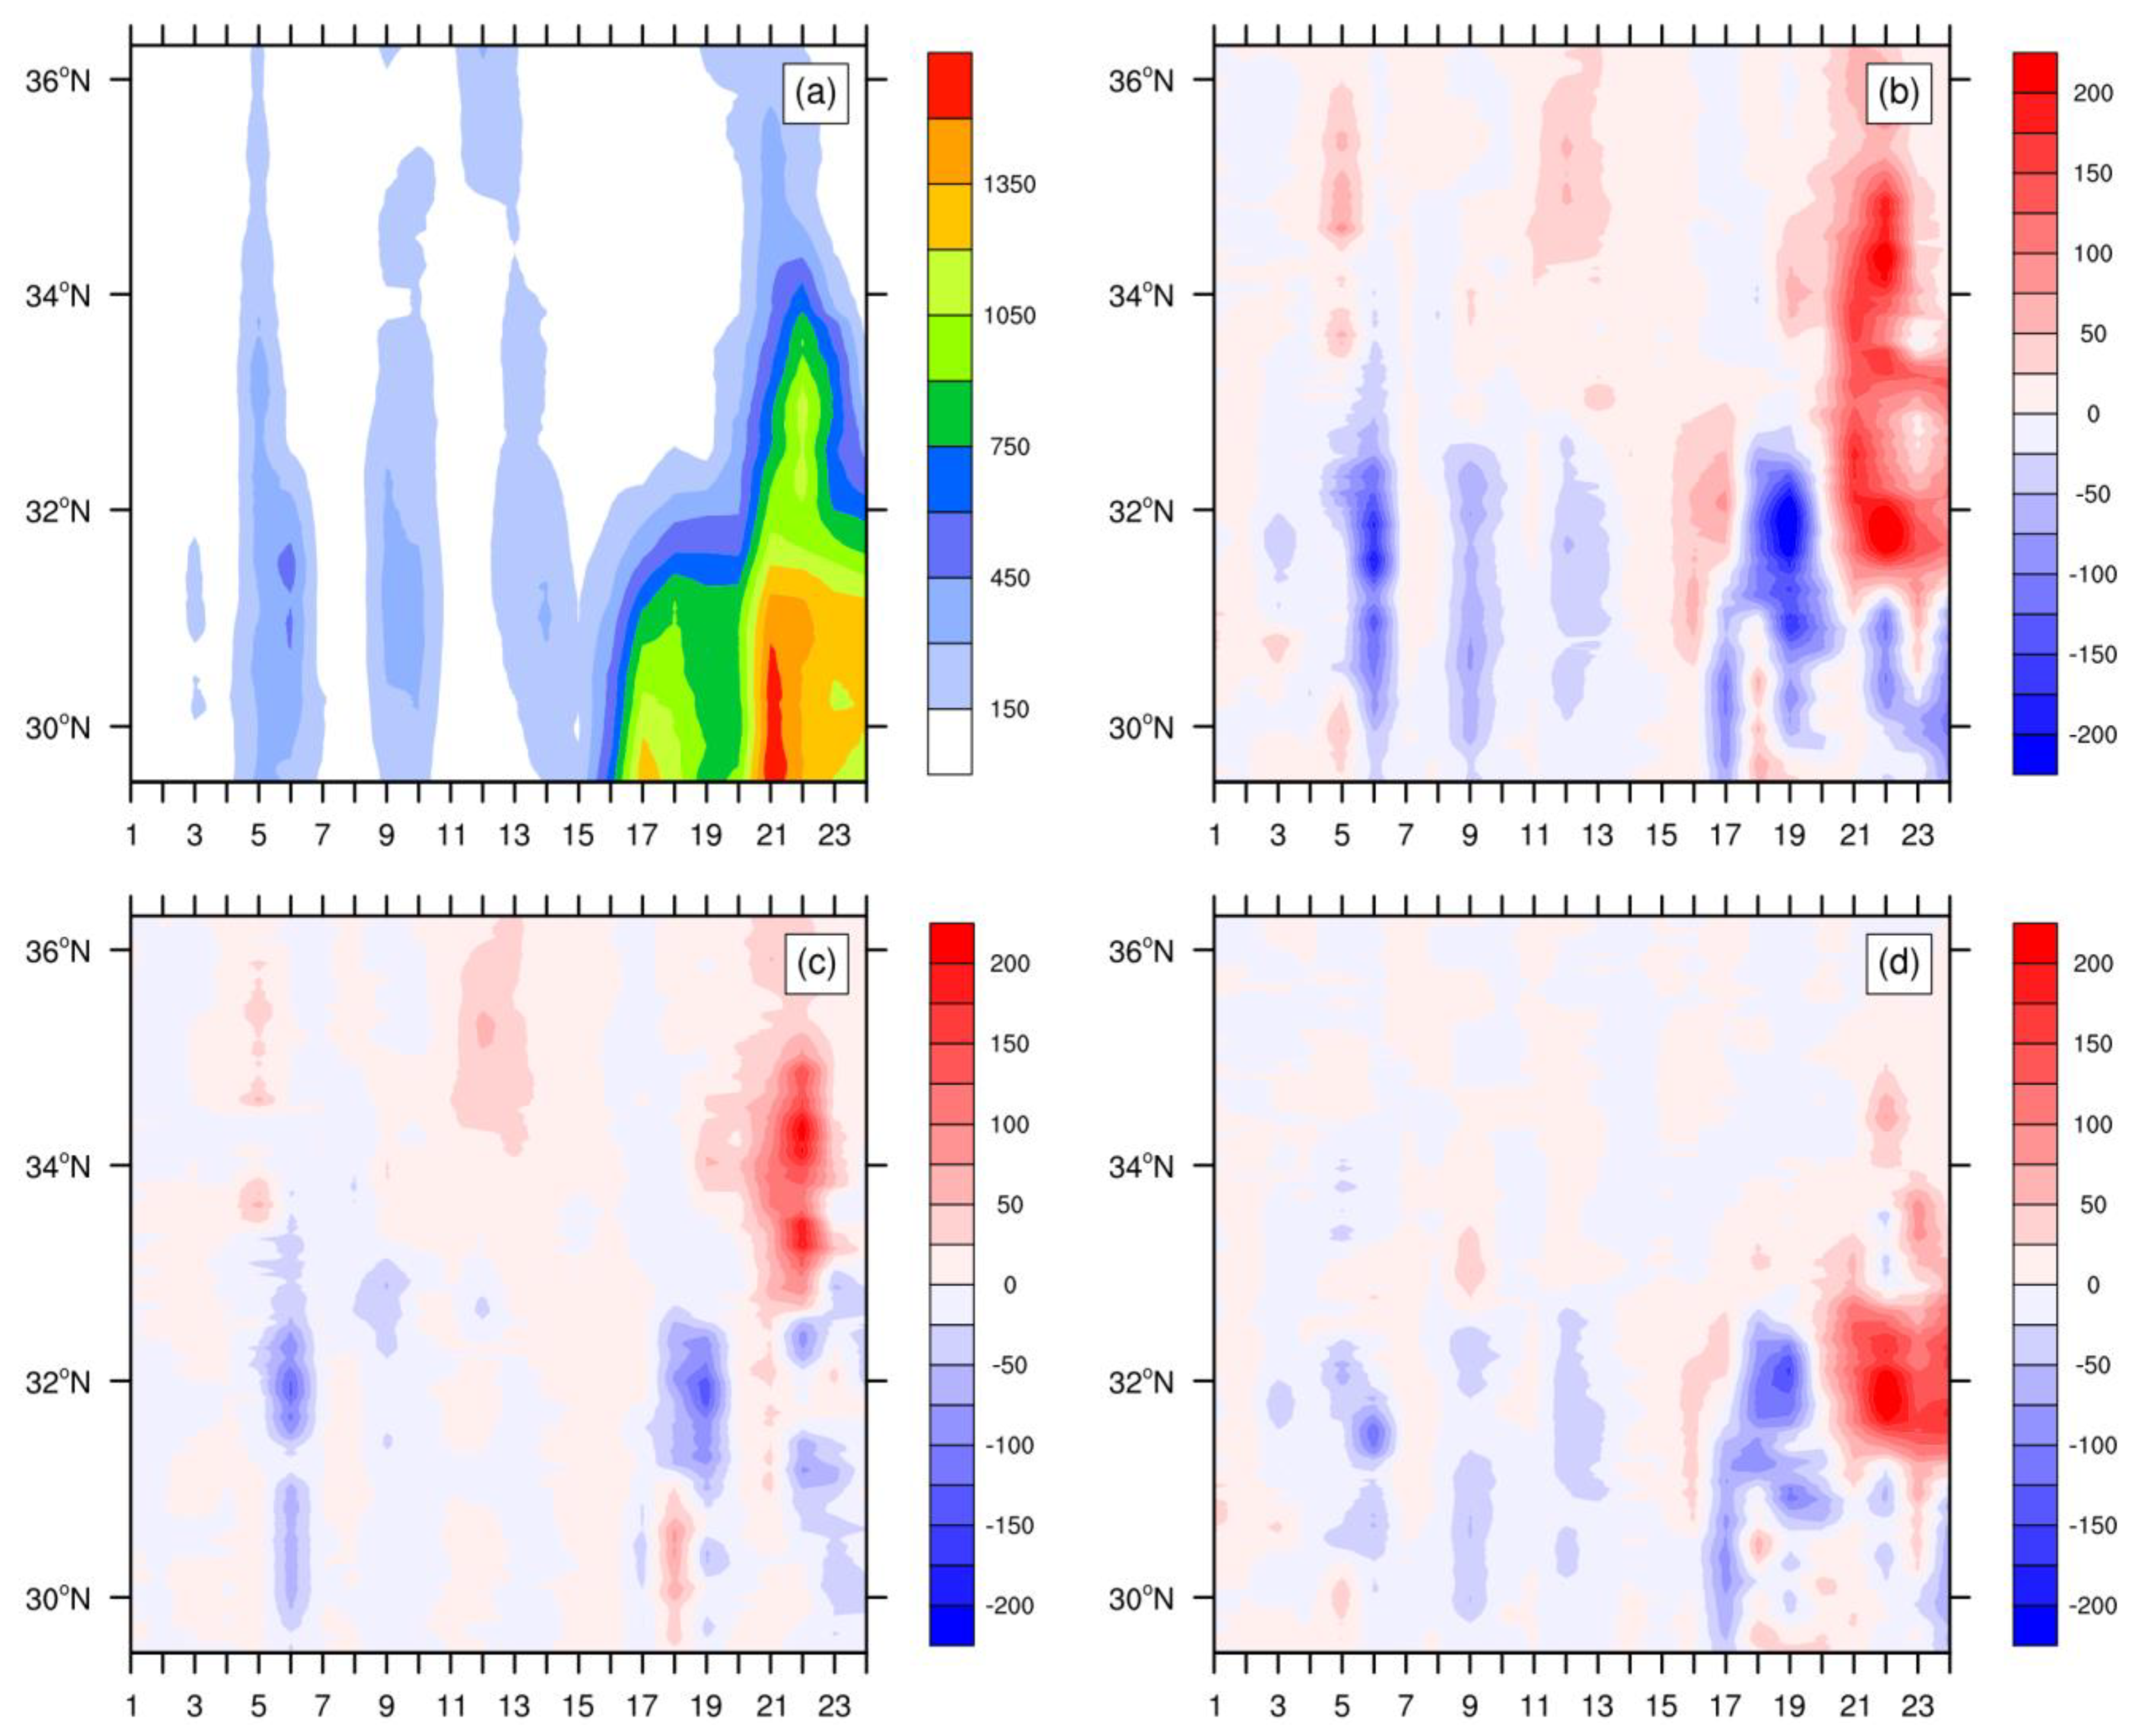
To investigate the influence of Qinling Mountains and Daba Mountains on reginal weather and climate, it is necessary to check the changes in diurnal cycle of precipitation, which is one of the most basic forms of climate patterns [24,25,39]. In the simulated region in CTRL (Figure 6a), as a whole, it showed three peak periods of 07:00–12:00 (UTC), 15:00–19:00 (UTC), and 21:00–24:00 (UTC), corresponding to 14:00–19:00 (local time, afternoon), 22:00–02:00 (Local time, midnight), and 04:00–07:00 (local time, early morning). The maximum in daily precipitation during the above three time periods are all located on the south of 32° N. In LowQD (Figure 6b), cutting both the two mountains height causes a great reduction in precipitation over the region between 30° N and 32° N from 15:00 UTC to 24:00 UTC, corresponding to from midnight to early morning, while a slight enhancement between 32° N and 34° N at midnight and between 34° N and 35° N in the early morning occurred. In LowQ (Figure 6c), it performs some reduction for precipitation between 32° N and 34° N from midnight to early morning and fragmentary enhancement between 30° N and 32° N at midnight. It is clear that the early morning precipitation variations in the north region are similar to it in LowQD. In LowD (Figure 6d), it shows a similar reduction between 30° N and 32° N from midnight to early morning with it in LowQD and an enhancement between 32° N and 34° N during the similar time period. More interestingly, the diurnal cycle of precipitation in all the three sensitive experiments does not show any significant change for the afternoon precipitation peak. It suggests that Qinling Mountains and Daba Mountains could modify the intensity and location of both early morning and midnight precipitation obviously, while the afternoon precipitation in this region has not been modified much. In another word, early morning and midnight precipitation seems to be more sensitive to the presence of the two mountains than afternoon precipitation in the corresponding region.
3.2. Interception of Water Vapor
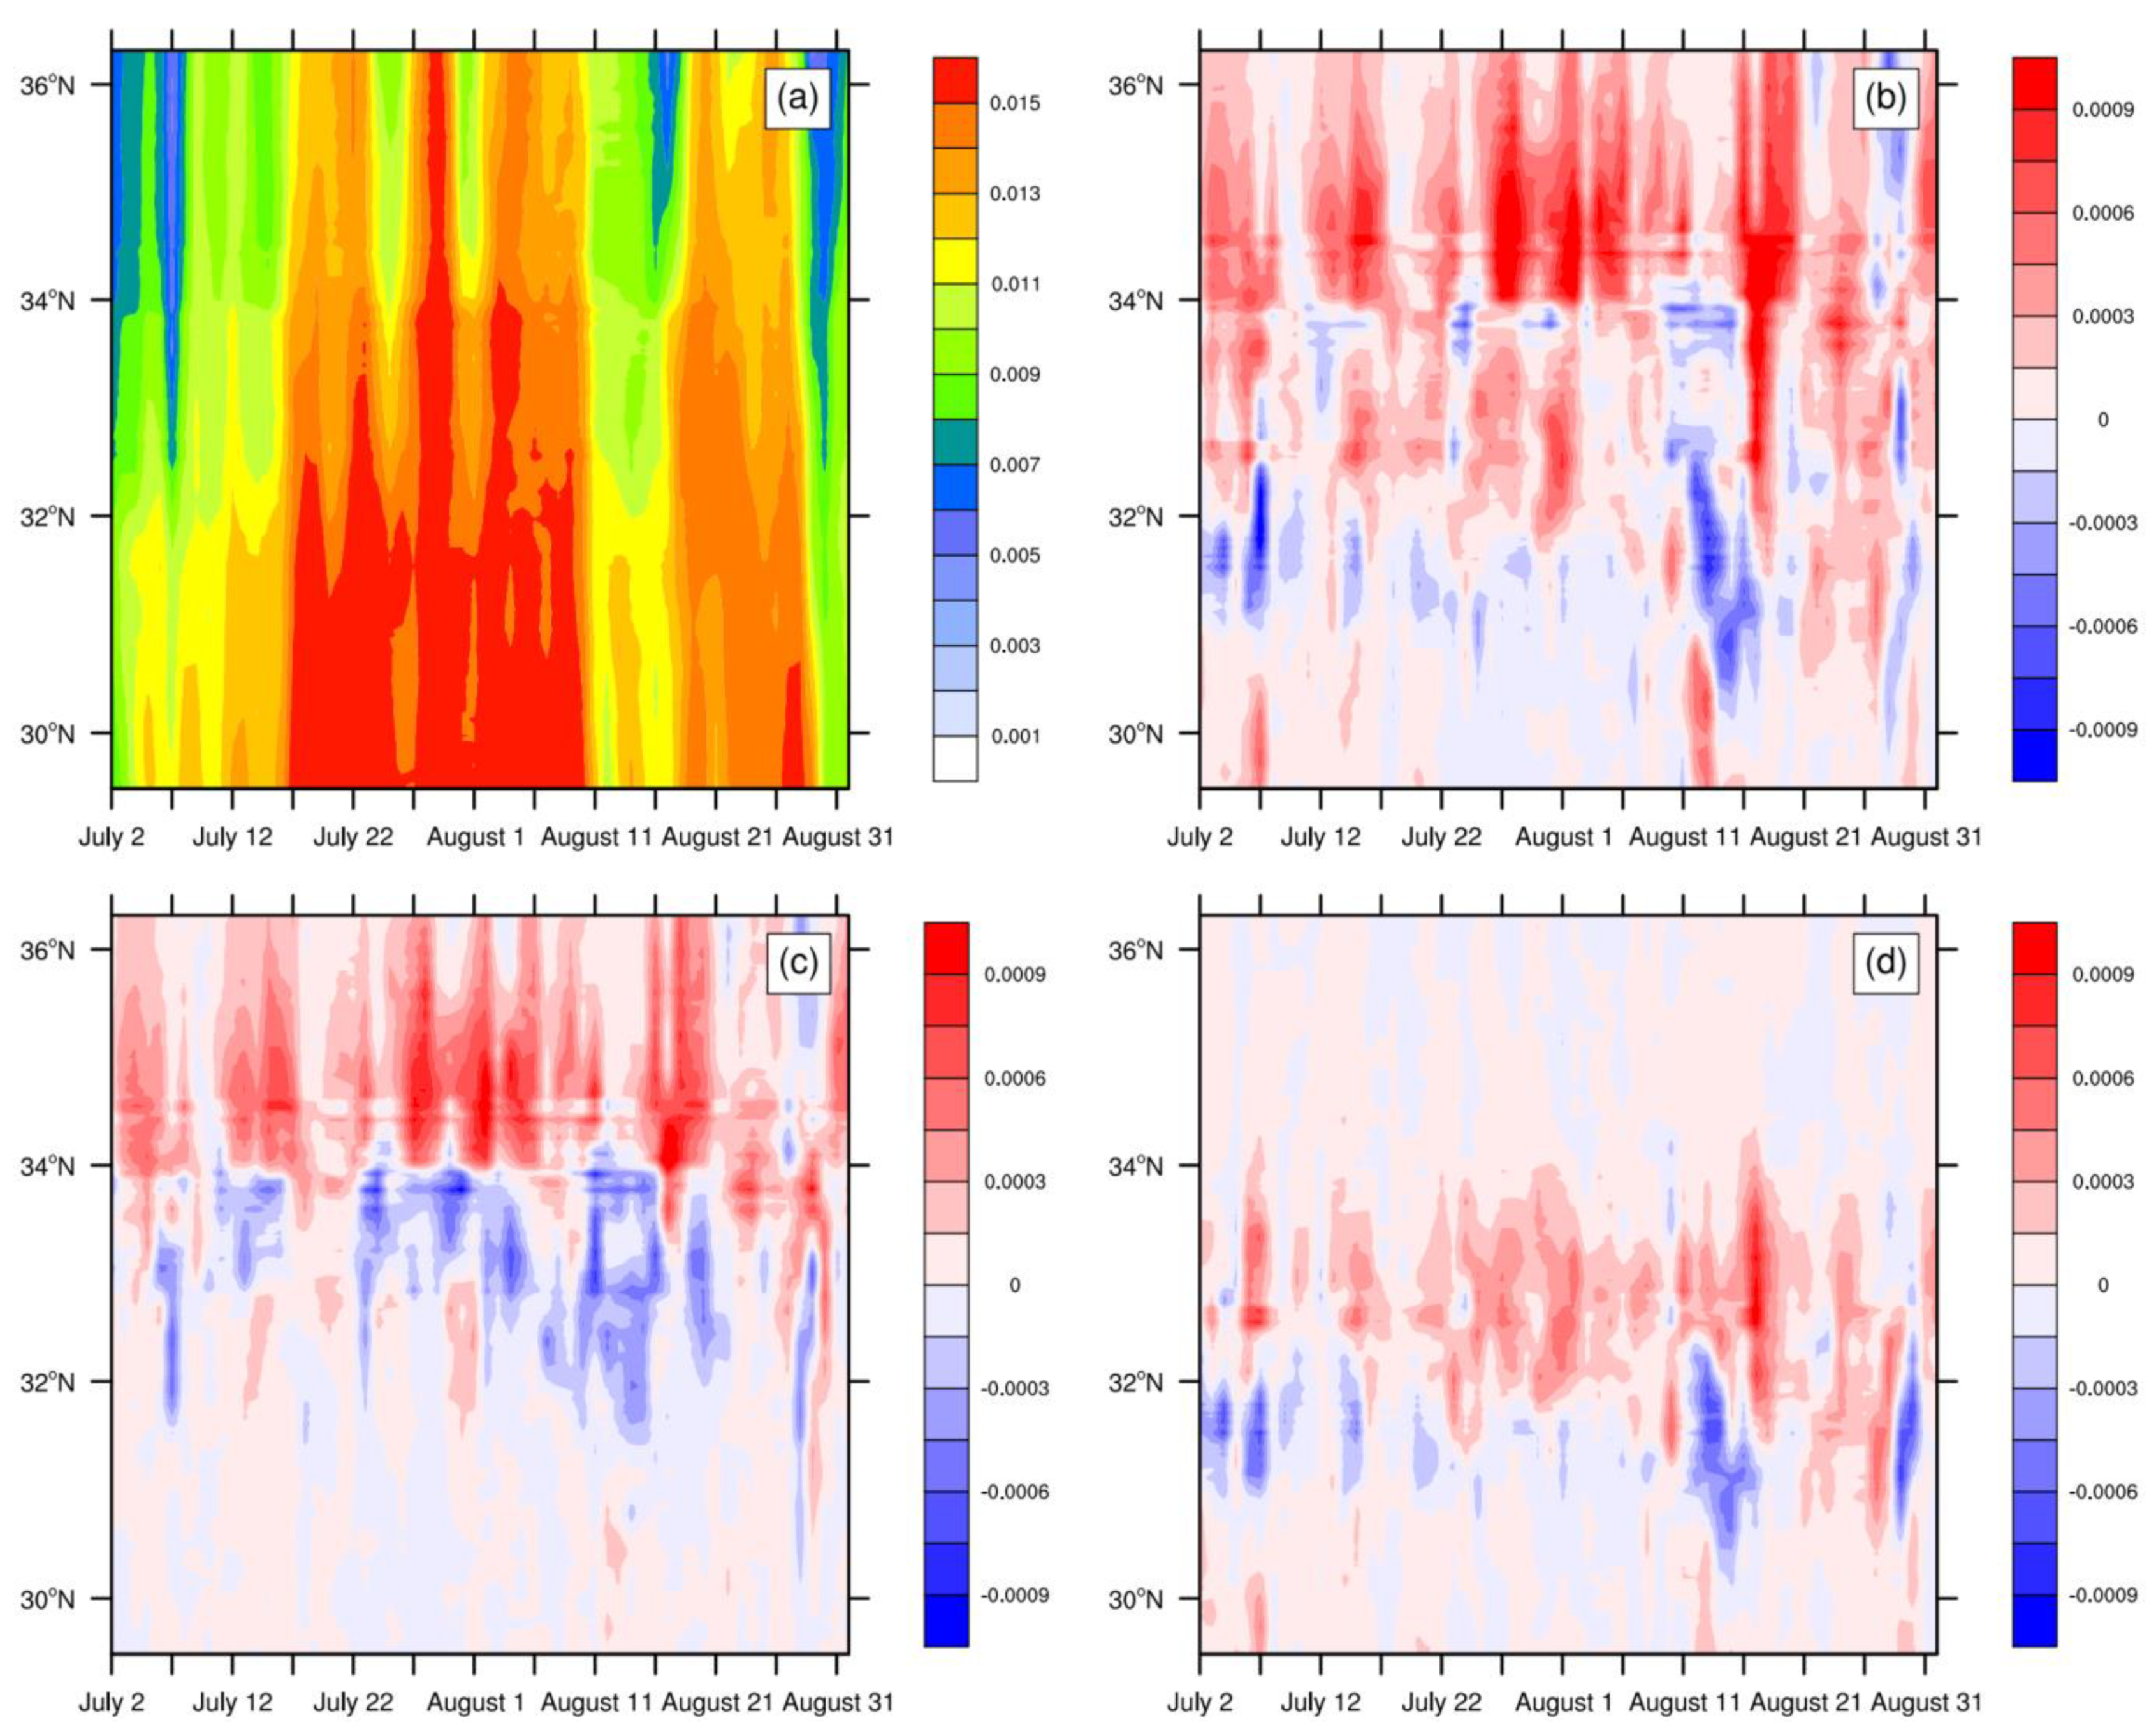
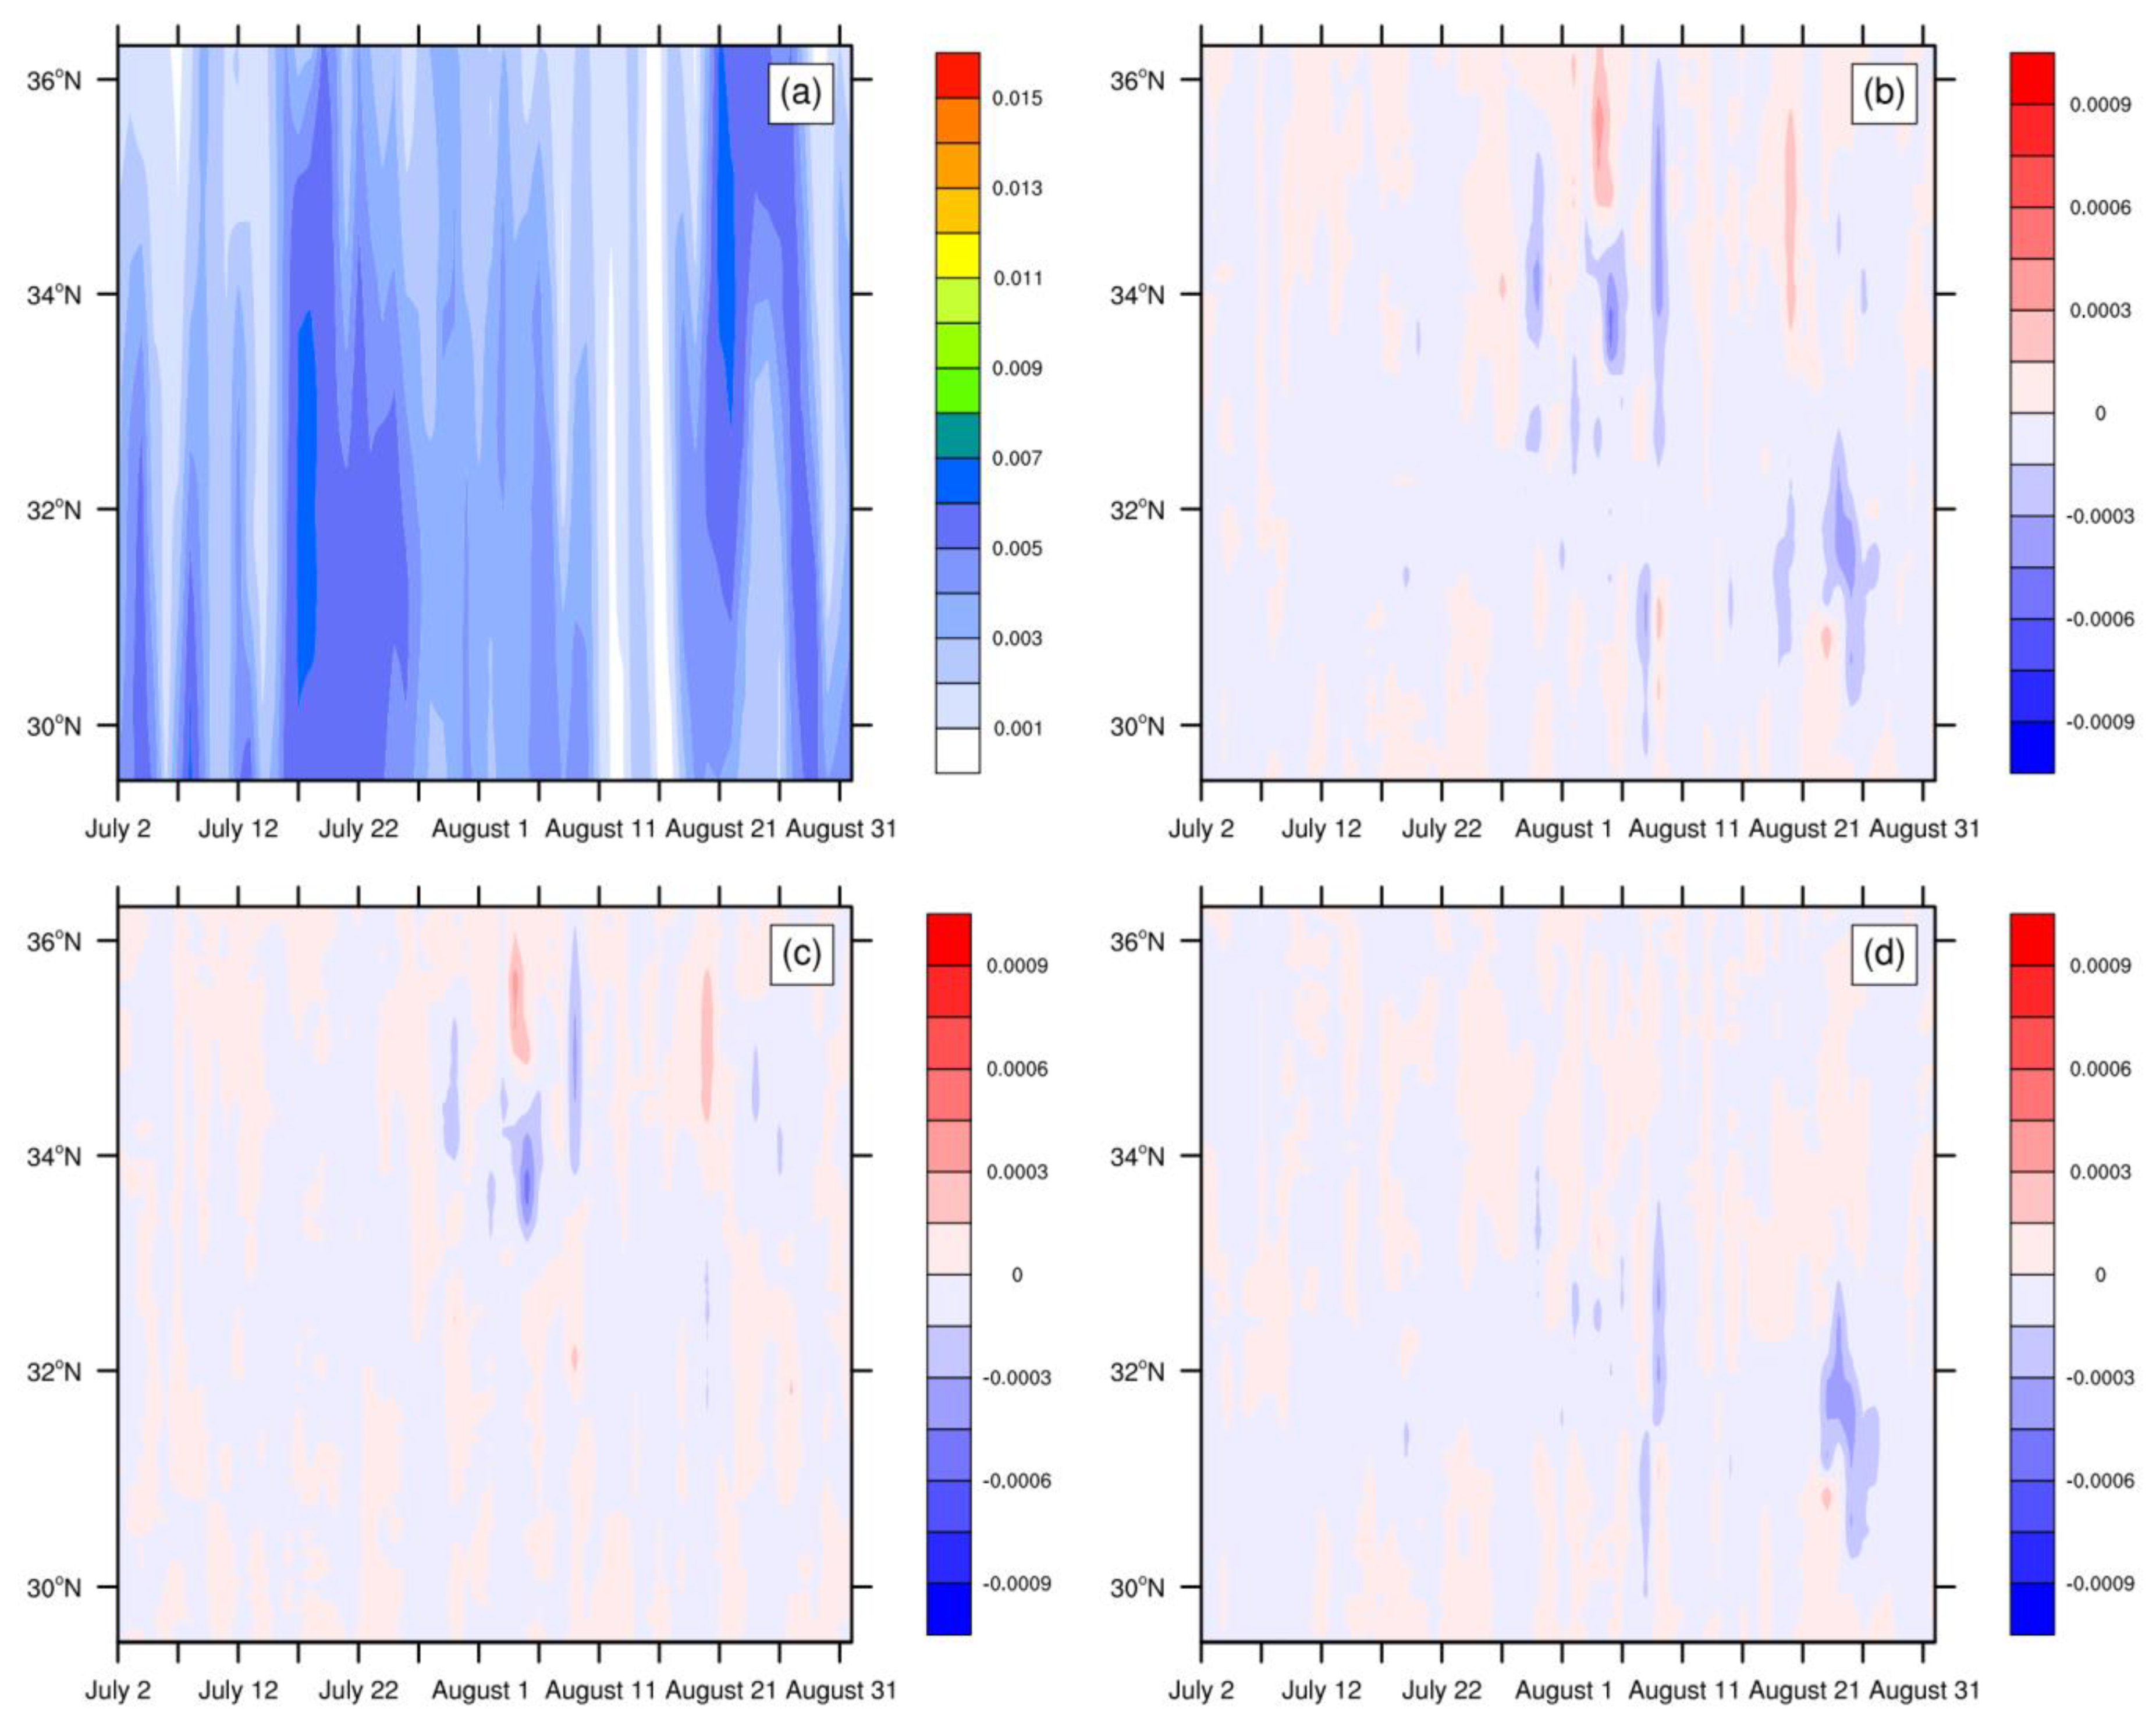
To clarify what cause the impacts of topography on previously mentioned daily precipitation and diurnal cycle of precipitation, we further examine the related water vapor. In the simulated region, water vapor mixing ratio act a peak time period from 17 July to 11 August both at 850 hPa (Figure 7a) and at 500 hPa (Figure 8a) from south to north, which is in good accordance with the daily precipitation in Figure 5a. When Qinling Mountains and Daba Mountains has been cut off a half in LowQD, water vapor is transmitted northward a lot at 850 hPa, where there is a distinct propagation across 34° N to the north and a somewhat weak propagation between 32° N and 34° N (Figure 7b), compared to the two mountains exists. When we cut off the two mountains separately, it showed a distinct propagation across 34° N to the north in LowQ and a distinct propagation between 32° N and 34° N at 850 hPa in LowD (Figure 7c,d). However, in contrast to the water vapor at 850 hPa, there is not any obvious propagation region at a higher level of 500 hPa (Figure 8b–d). Hence, the distribution of water vapor in the lower troposphere associated with the location of precipitation are potentially attributed to the terrain geometry location, where Daba Mountains mainly intercepts the northward water vapor transportation across 32° N and Qinling Mountains mainly intercepts it across 34° N in rapid sequence. Although, the interception effects of the two mountains has been revealed previously in some studies [3,4,6], we are not aware of any other study taking the same numerical approach to examine a clear interception latitude of the two mountains.
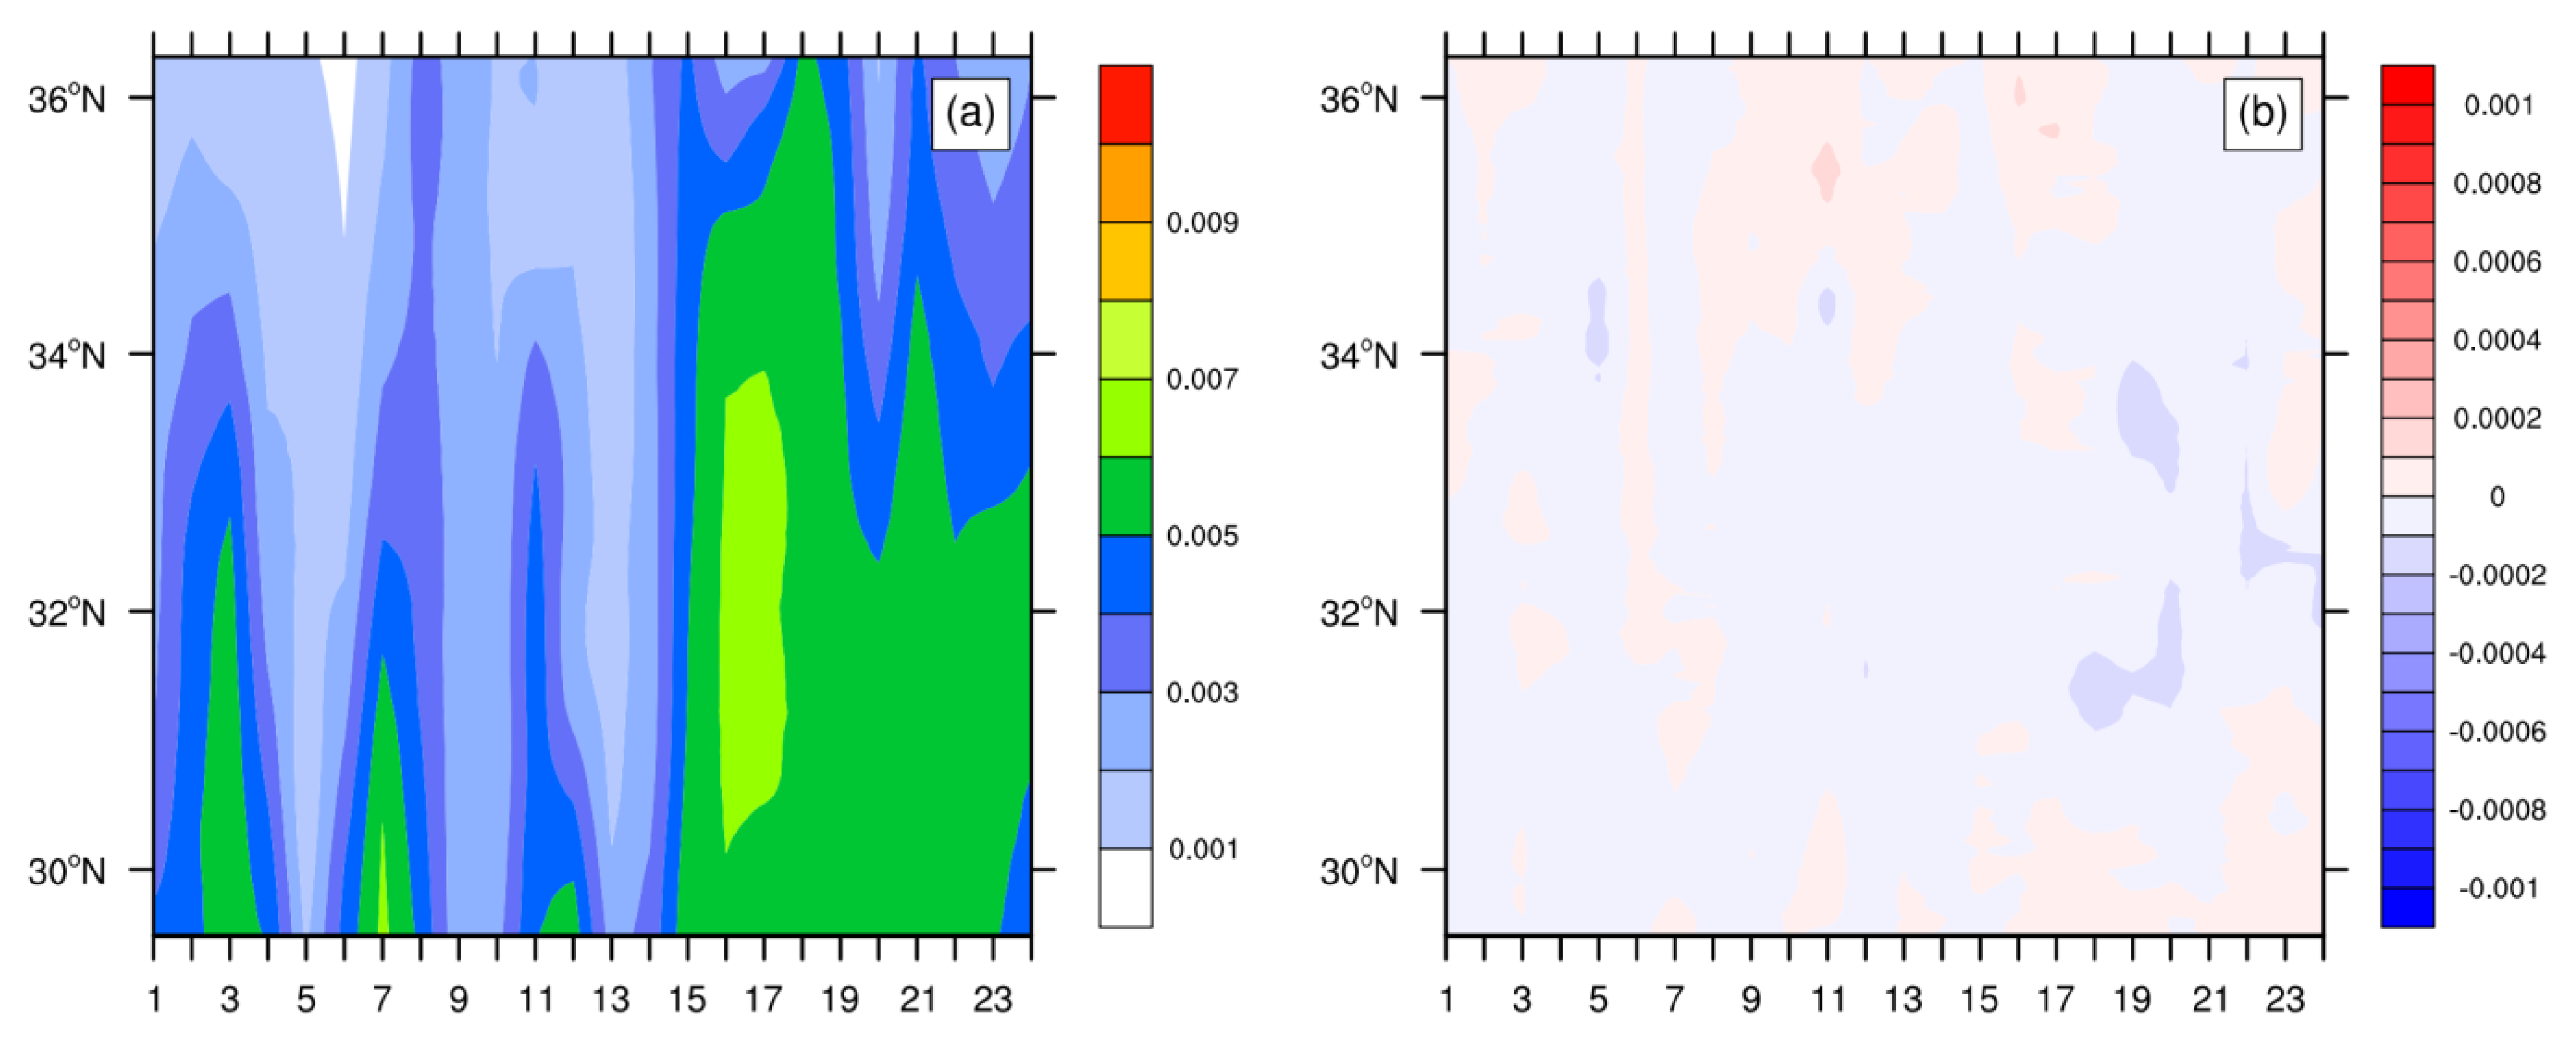
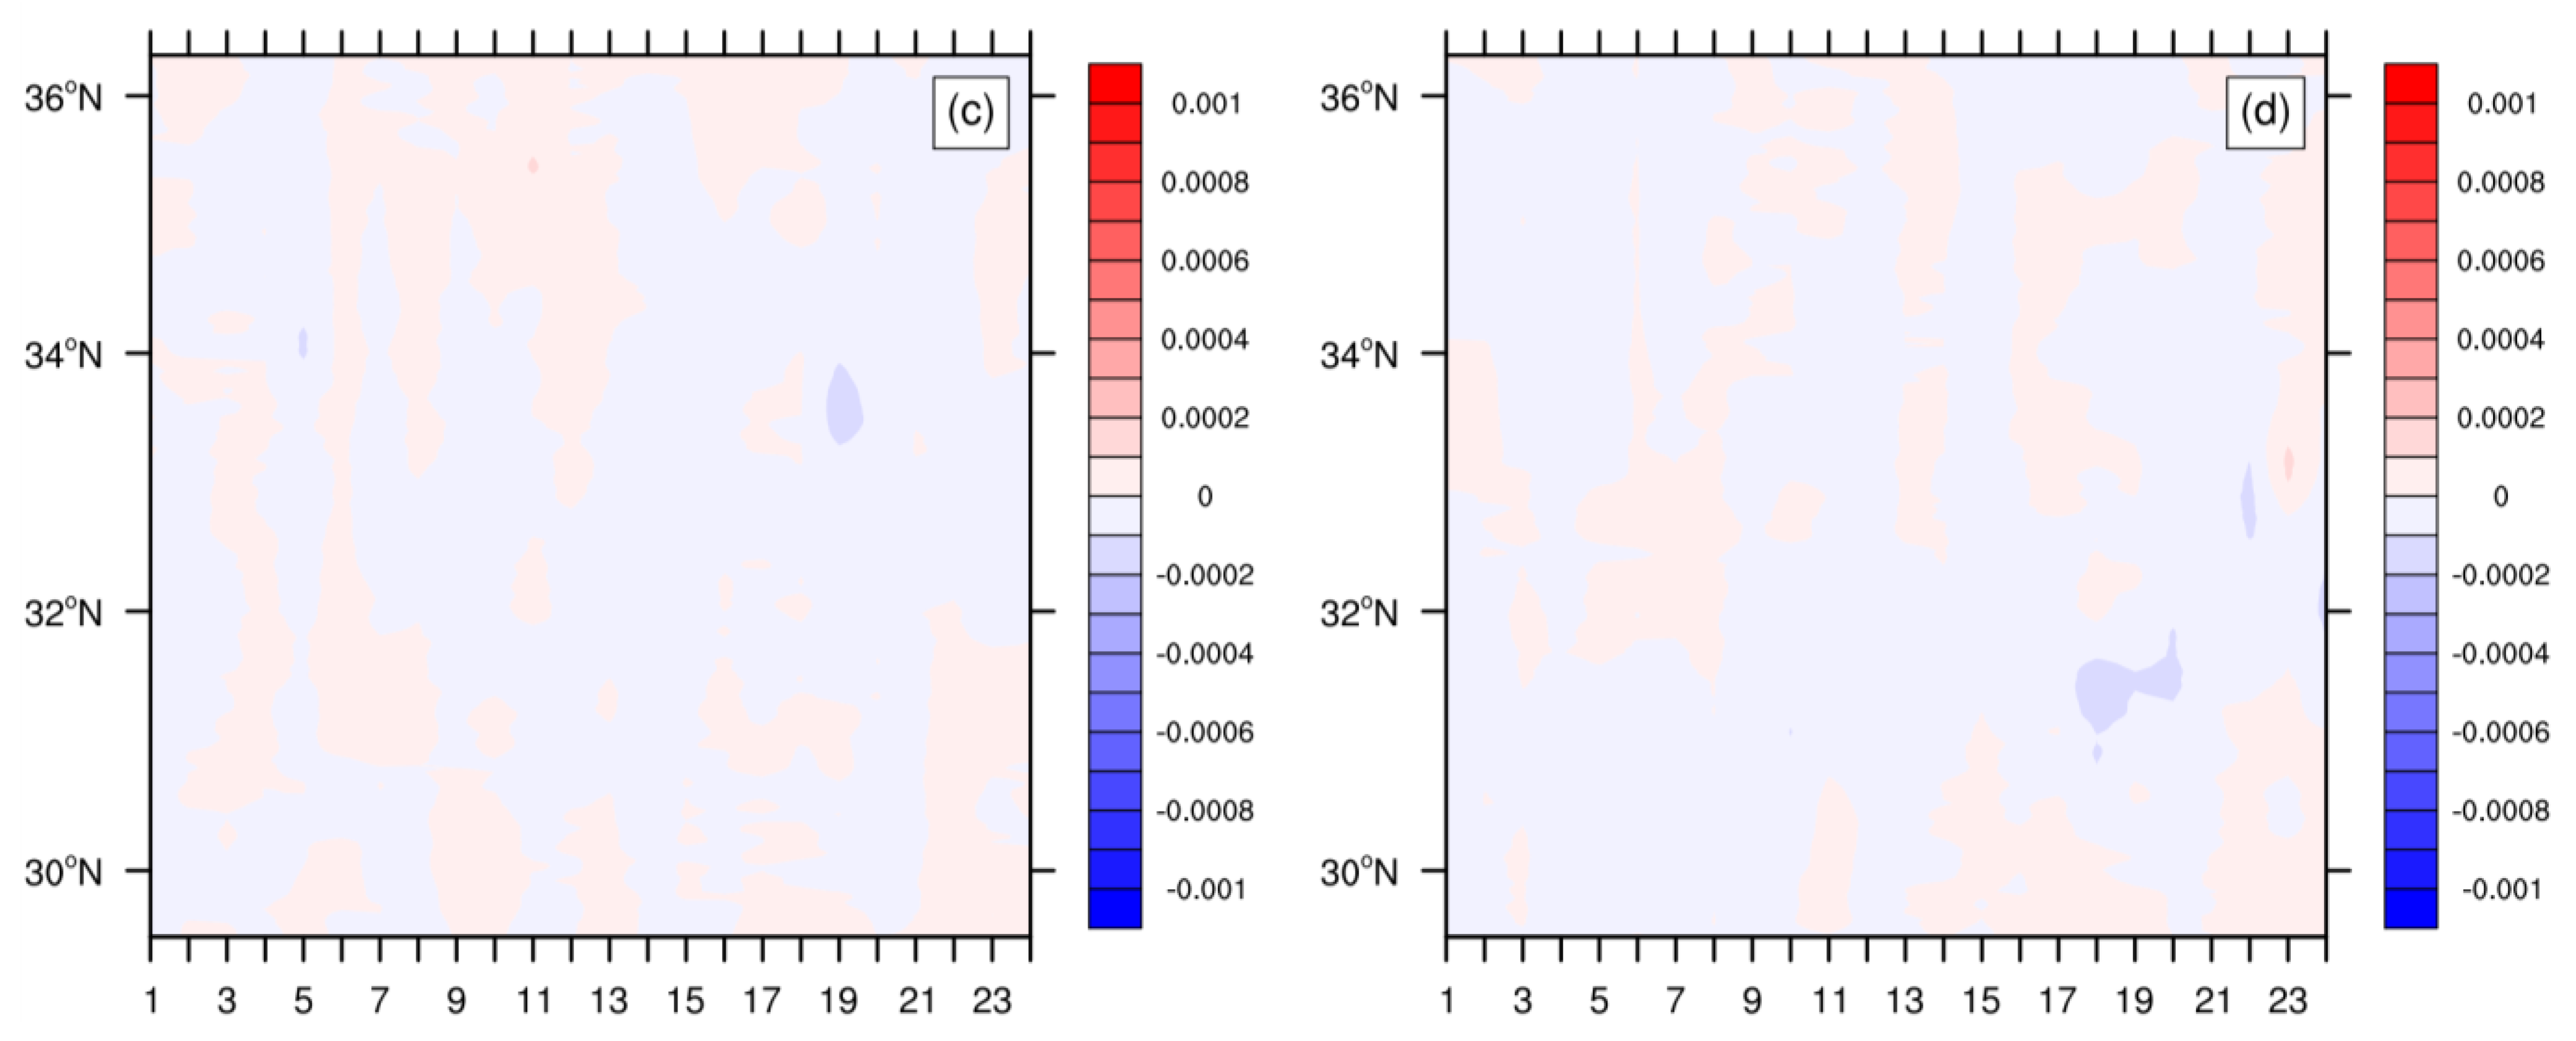
For the changes in diurnal cycle of water vapor in the sensitive experiments at 850 hPa (Figure 9), they performed a discordance with the changes in precipitation (Figure 6), while the variational tendency from north to south was consistent with the changes in Figure 7. Specifically, it is clarity that the peak time period of water vapor is from 16:00 UTC to 24:00 UTC (local time, 23:00 to 07:00) (Figure 9a), and the three sensitivity experiments shows a similar re-location pattern for water vapor from south to north (Figure 9b–d) during all the three peak time periods for diurnal cycle of precipitation in Figure 6a, which is in discordance with the changing time period in Figure 6b–d accidentally in afternoon. As a result, it can be inferred that, although, the presence of Qinling Mountains and Daba Mountains affect the transportation of water vapor, which attribute to the location of daily precipitation, it does not make sense for the afternoon precipitation in diurnal cycle. When the focused level moved up to 500 hPa, it showed a similar much less obvious changes for water vapor (Figure 10), referring to an obvious effect on water vapor distribution from the two mountains is concentrated in the lower troposphere.
3.3. Thermodynamic and Dynamic Effects
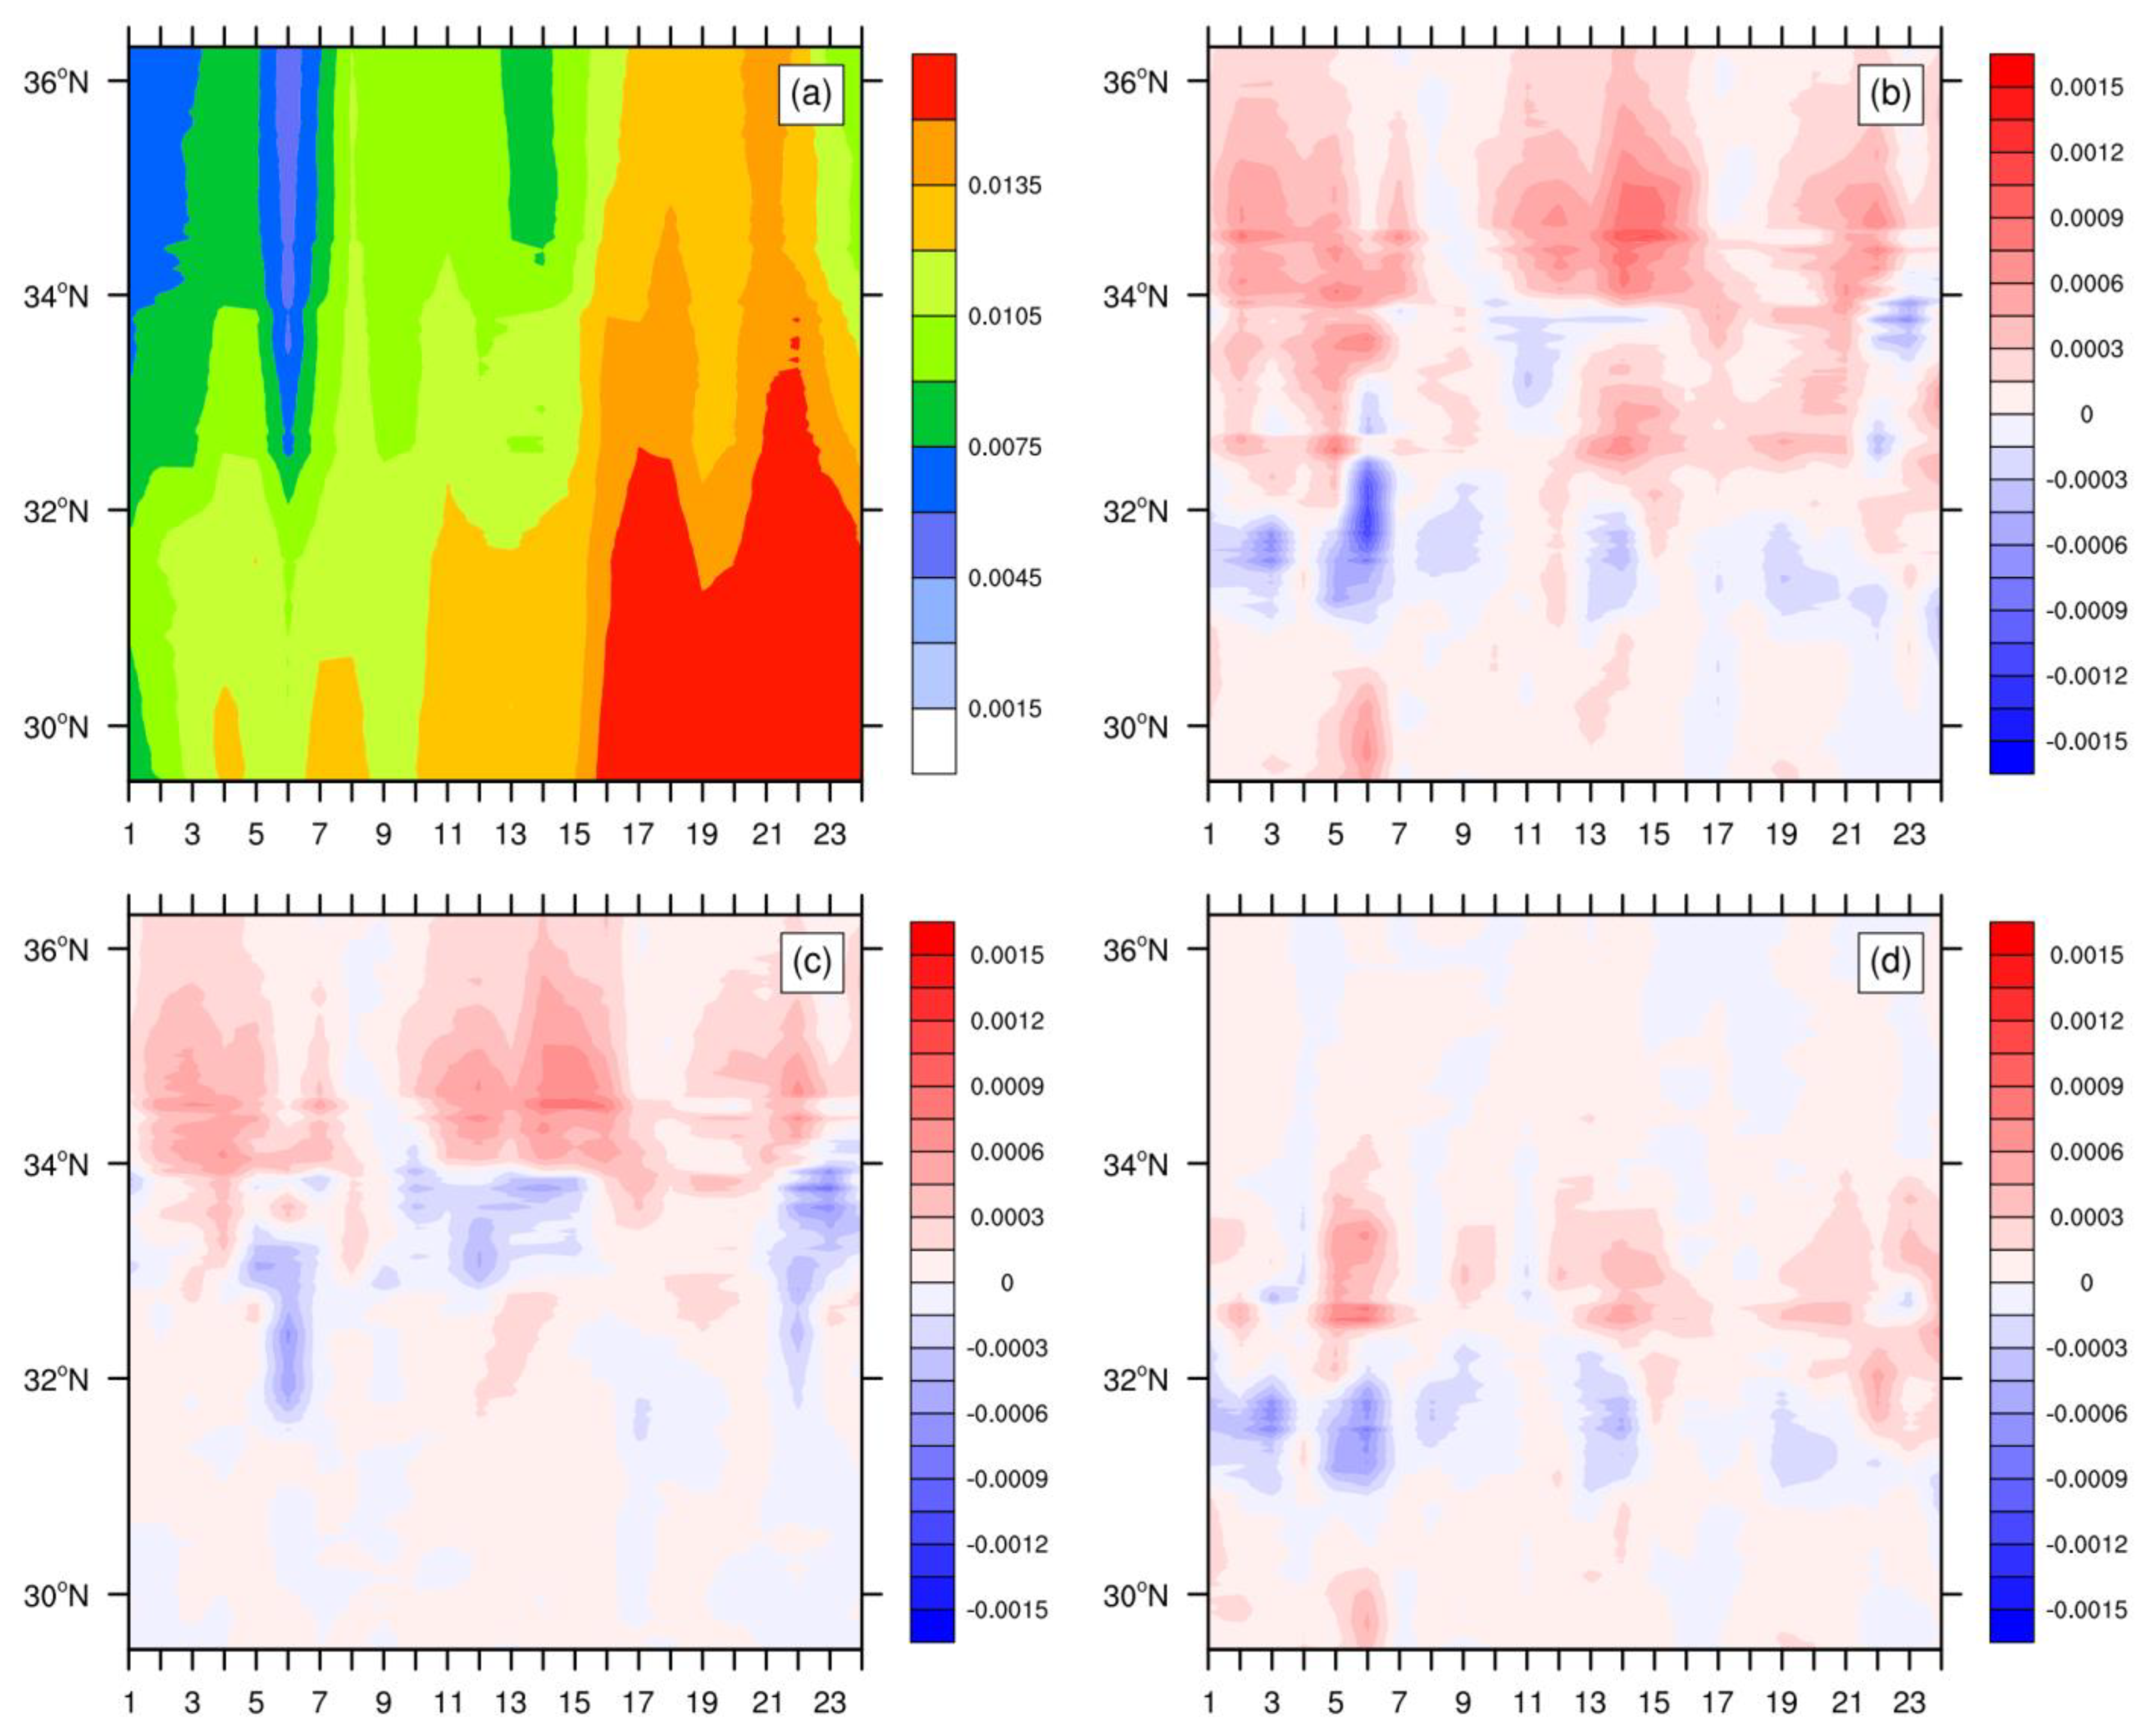
The daily accumulated precipitation occurred in a good accordance with convective available potential energy (CAPE) from late July to early August and distributed a similar pattern from south to north (Figure 5a and Figure 11a). And the large CAPE performs a consistent peak time period with sufficient water vapor from 16:00 UTC to 24:00 UTC (local time, 23:00 to 07:00) (Figure 9a and Figure 12a) in diurnal cycle. Similarly, the alteration of terrain height caused a similar change in spatial distribution for CAPE (Figure 11b–d), where there is a distinct propagation between 31° N and 36° N in LowQD, a distinct propagation between 33° N and 36° N in LowQ, and a distinct propagation between 31° N and 33° N in LowD. And a similar distinct propagation could be found in diurnal cycle in early morning period around 21:00–24:00 (UTC) (Figure 12b–d). As a result, we can infer that the existence of the two mountains could affect the CAPE notably especially in early morning, where Qinling Mountains mainly block the advance of CAPE crossing 34° N and Daba Mountains mainly block it around 32° N, which play an important role in the occurrence of summer precipitation in the region of Qinling–Daba Mountains.
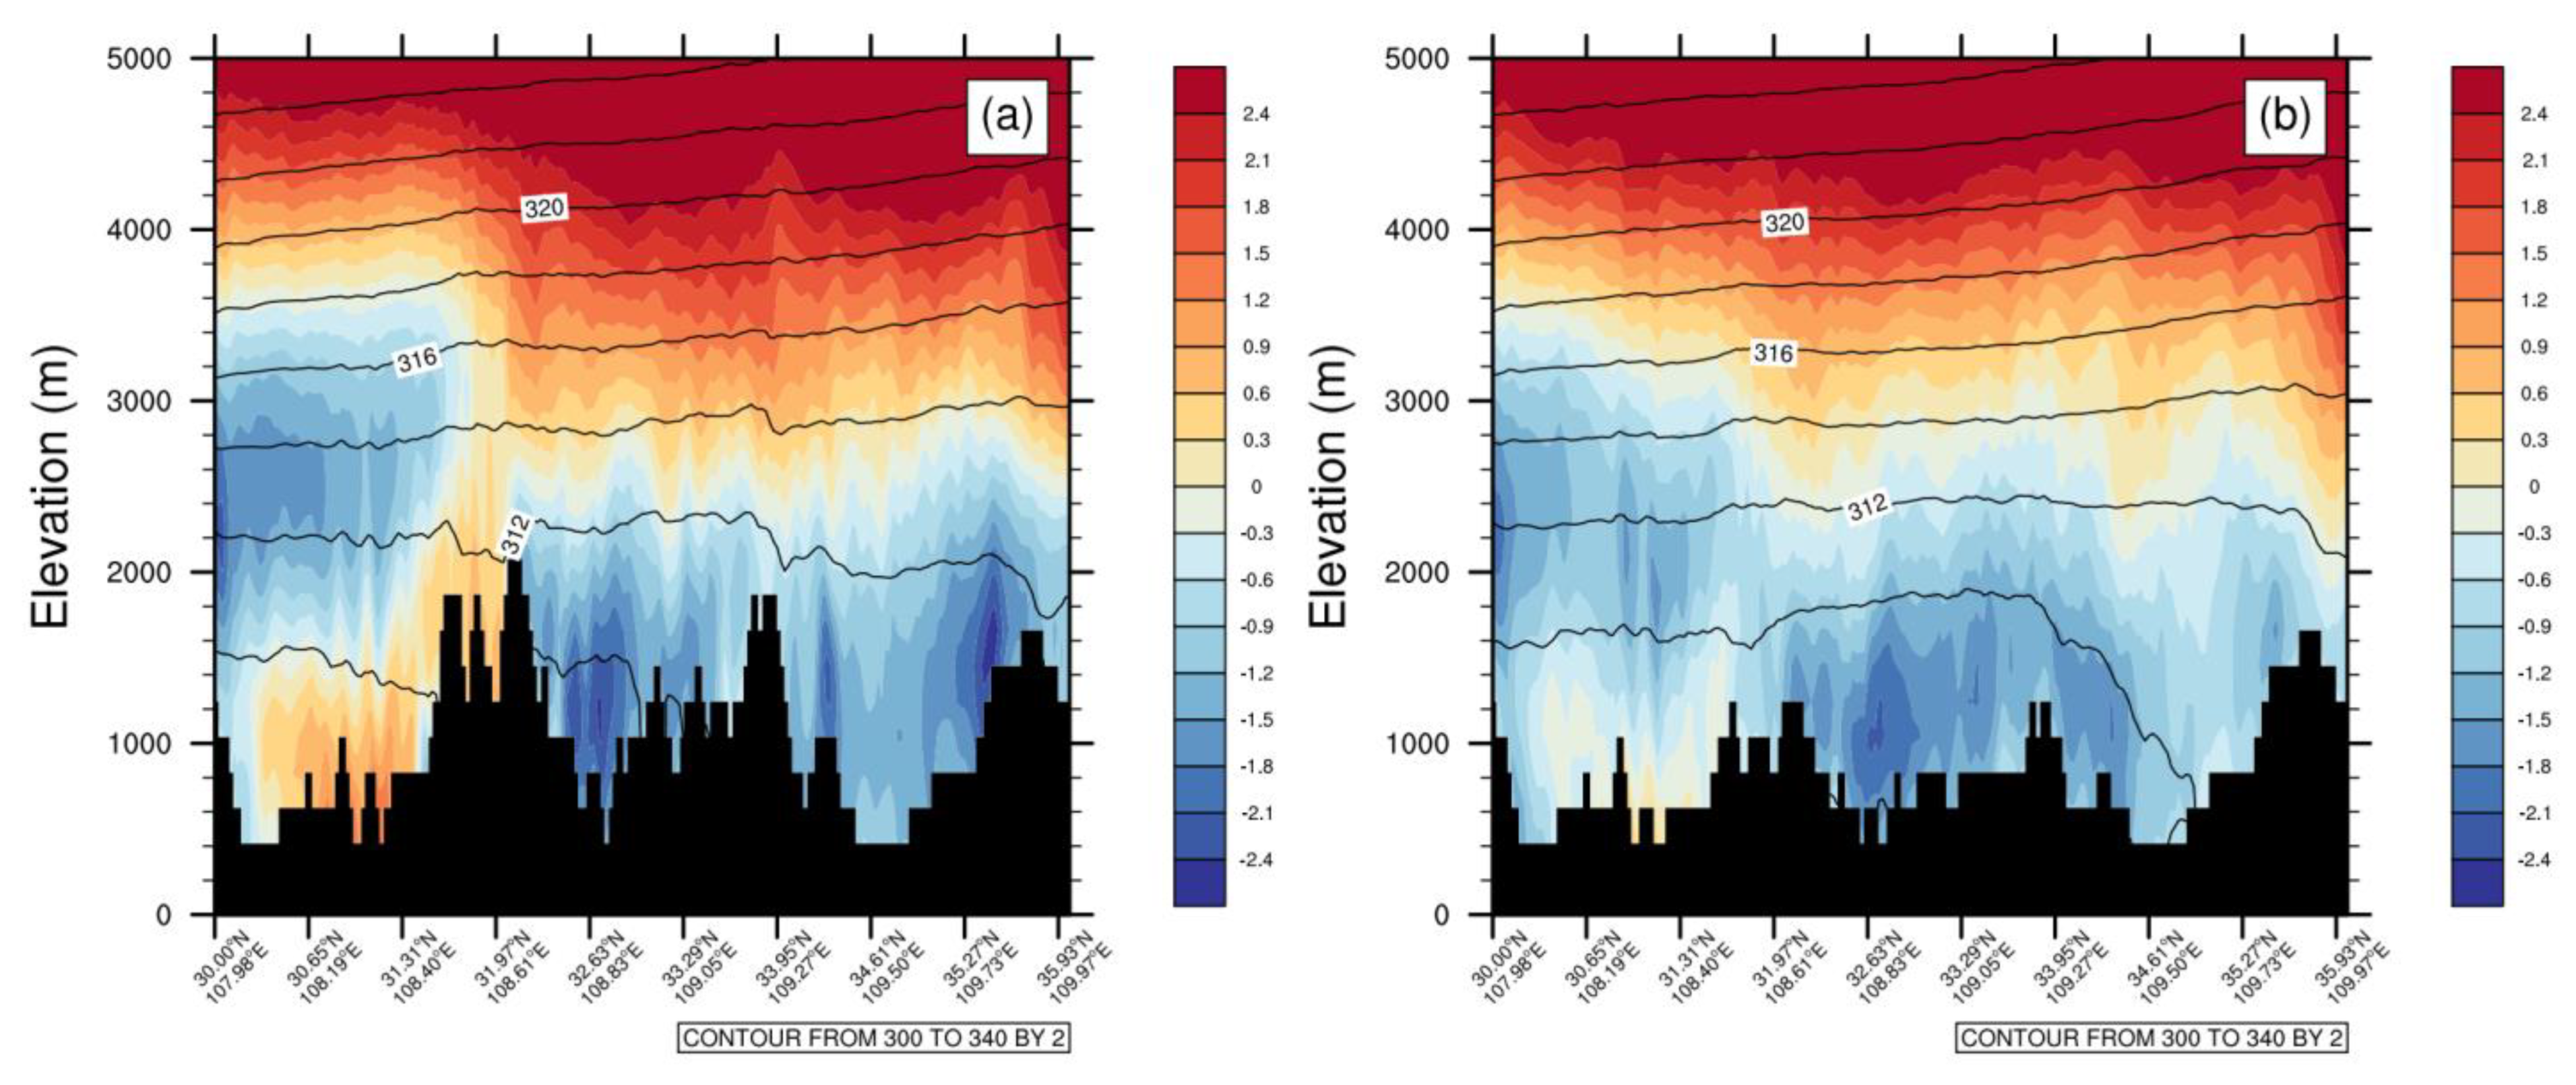
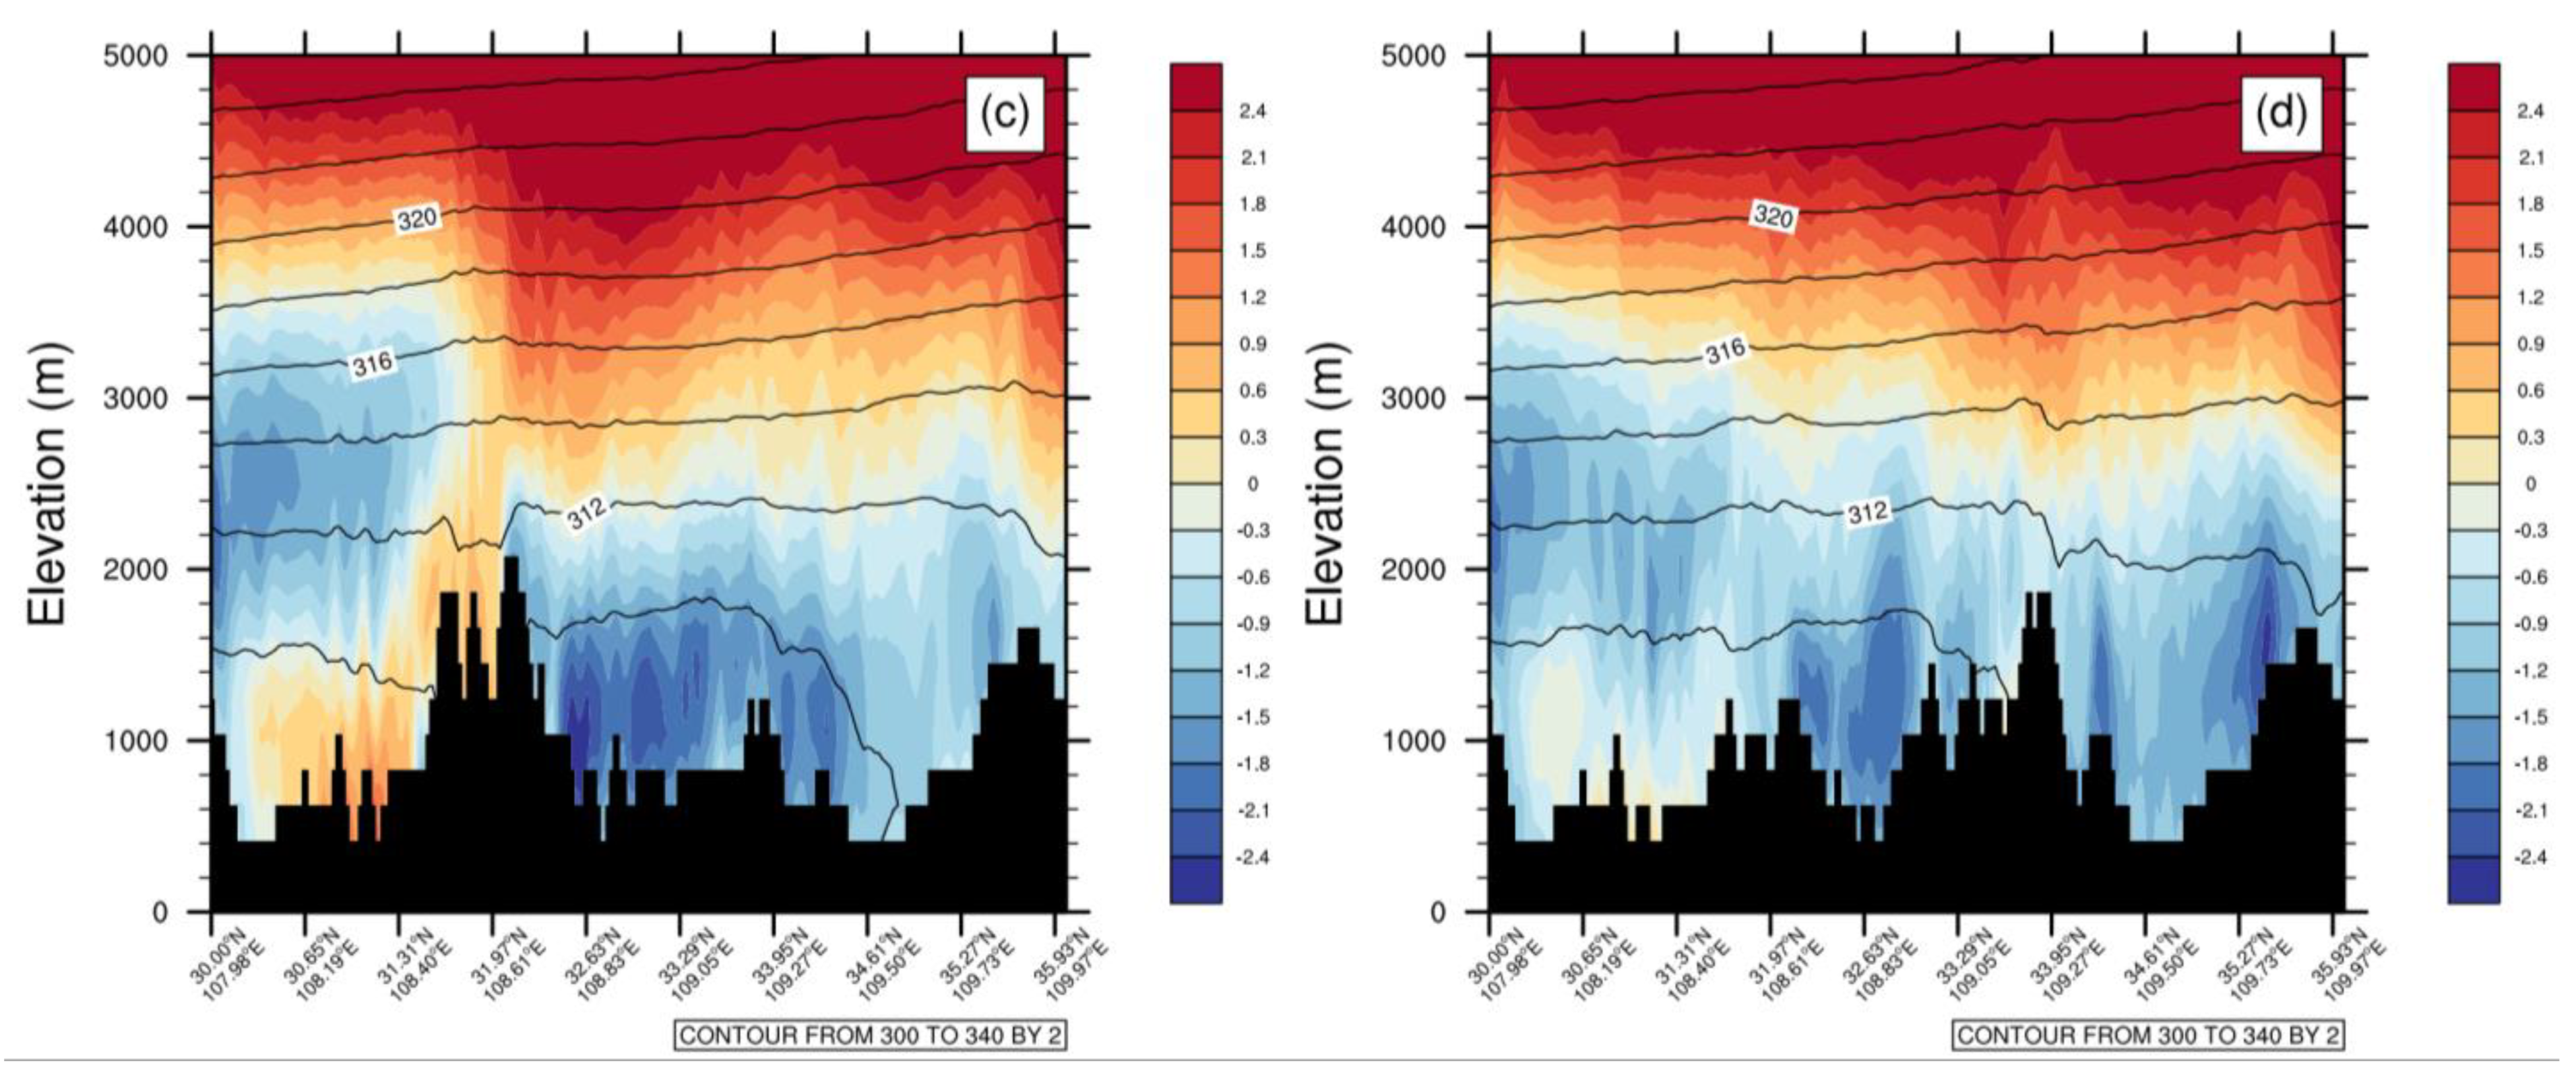
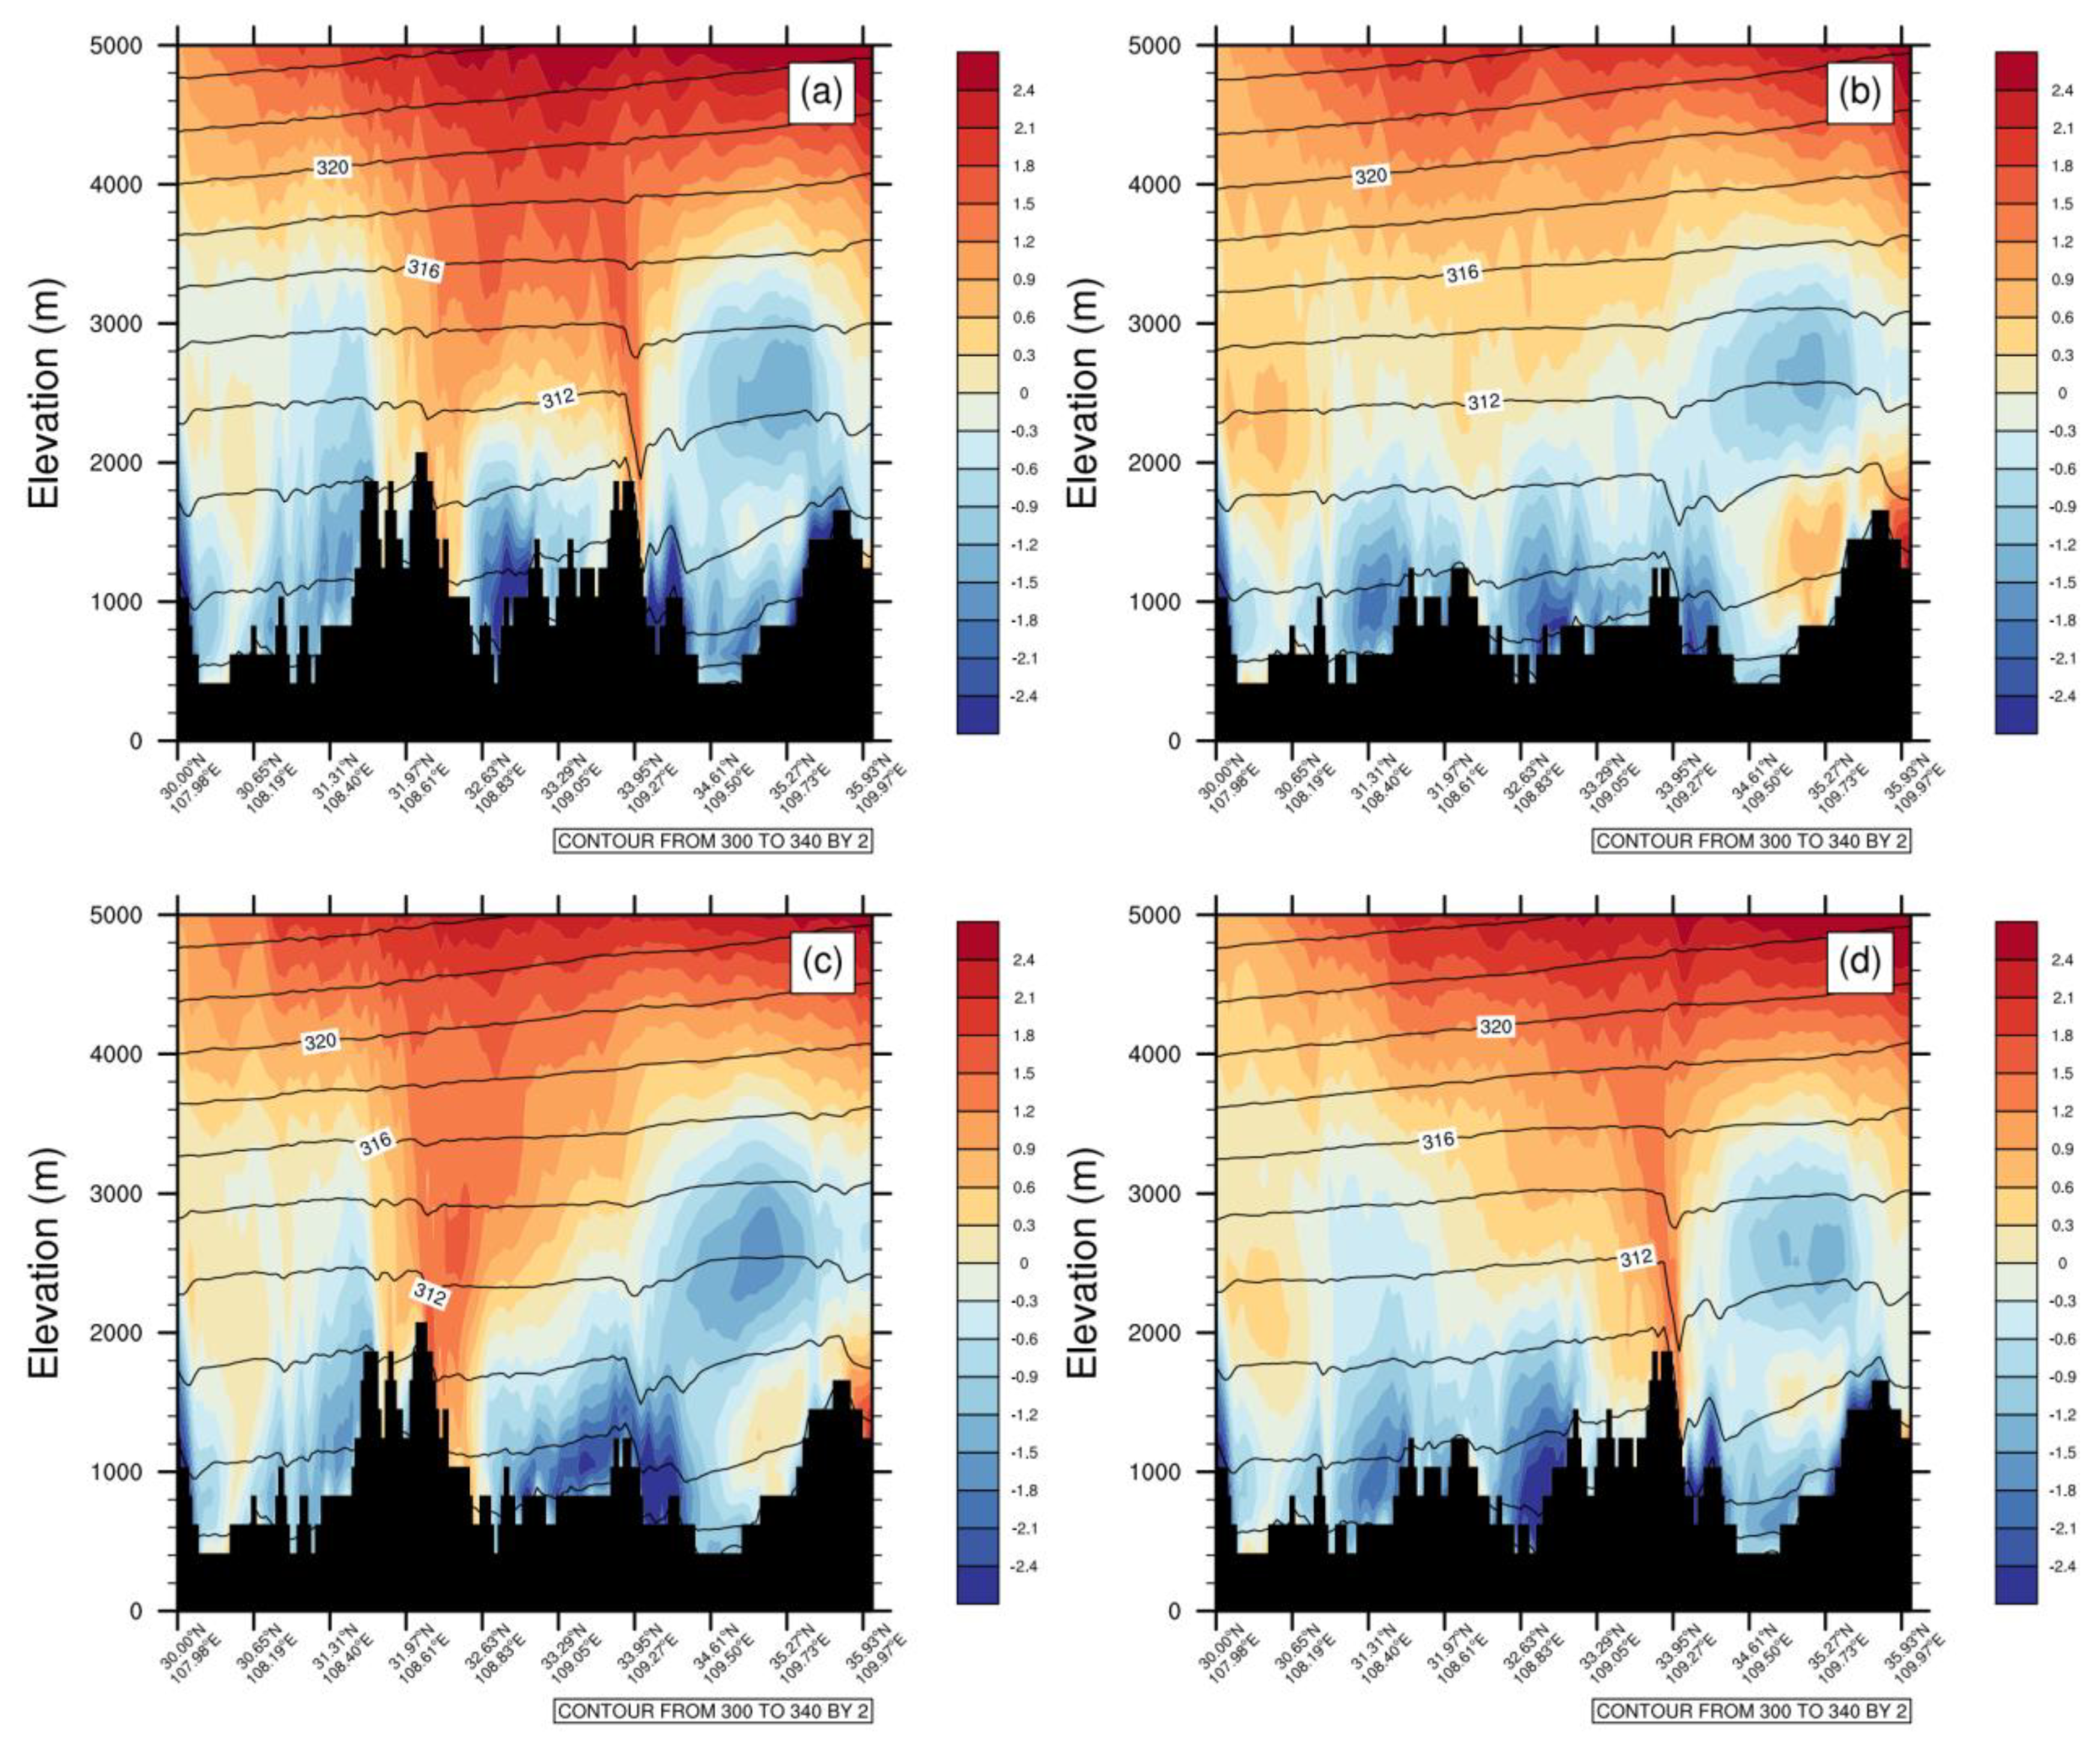
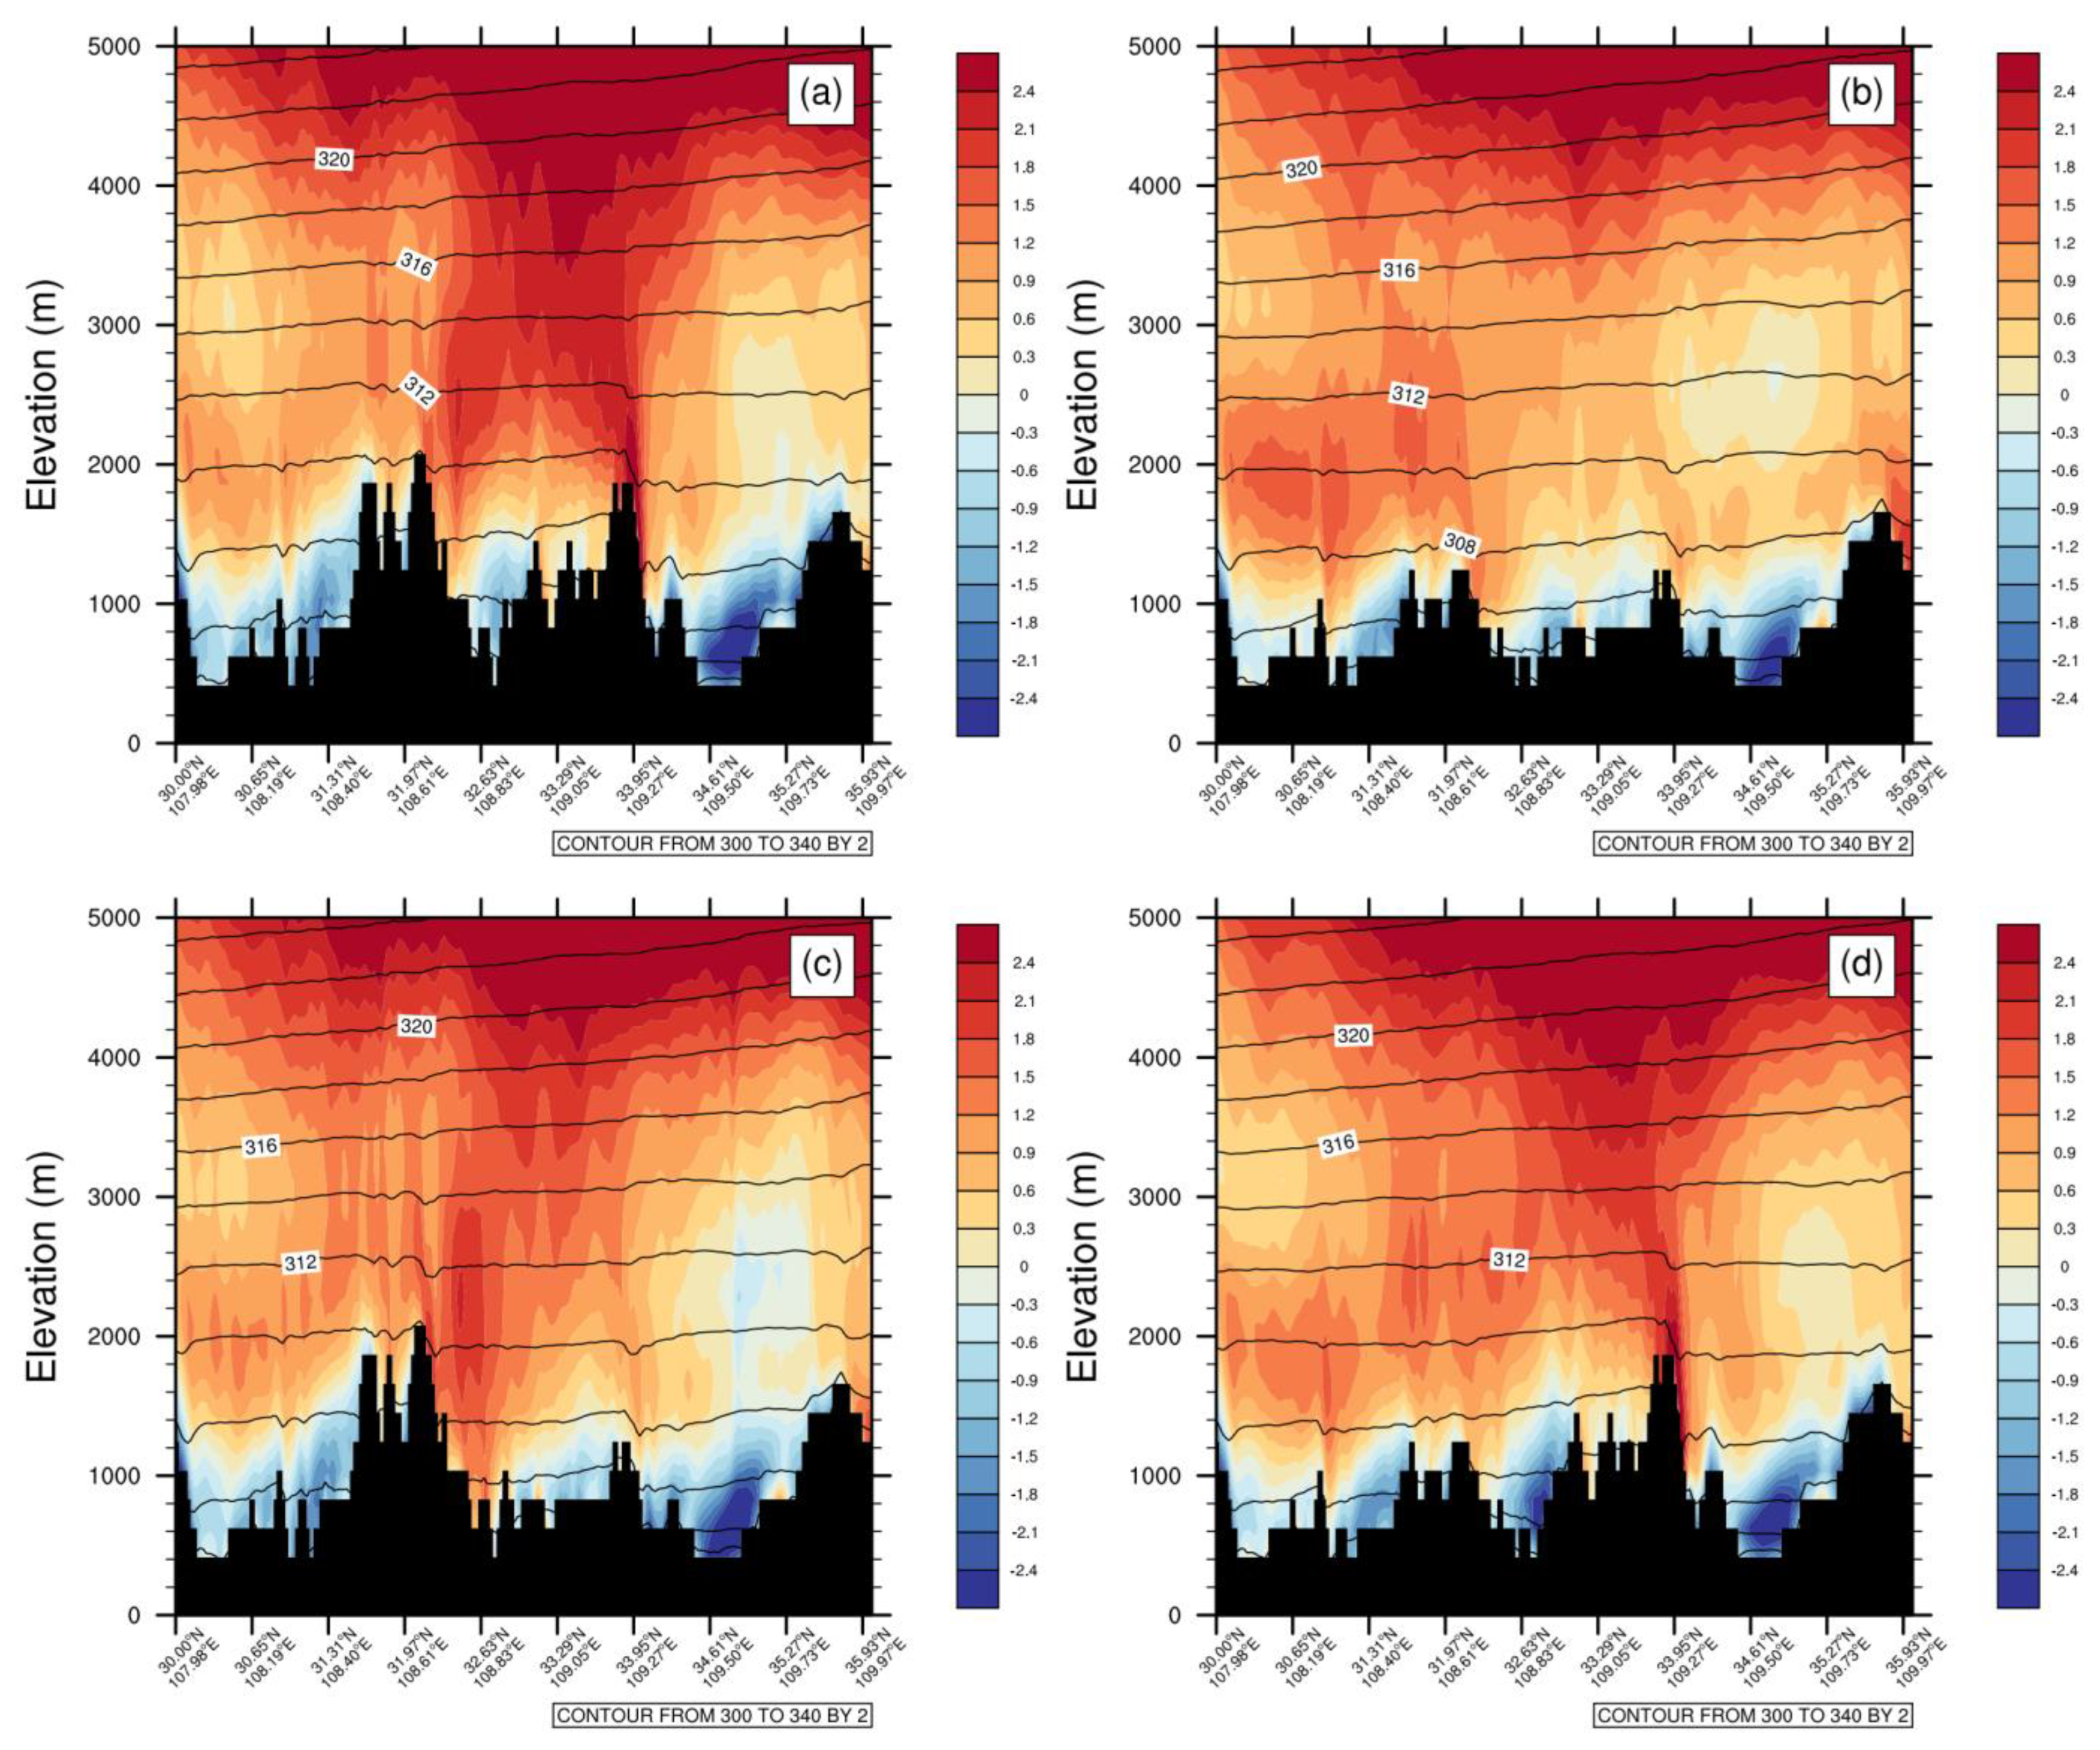
Air flowing over varying terrain can lead to obvious orographically induced wave motions, according to the cross sections of the four experiments (Figure 13, Figure 14 and Figure 15). In CTNL, an apparent upward or downward motion are found parallel to the main terrain feature (Figure 13a, Figure 14a and Figure 15a). Upward motion, typically a kind of valley wind, mainly concentrated on the south side of Daba Mountains and propagated into higher of the middle troposphere over 3 km in the afternoon (Figure 13a), when there is a heavy precipitation area located to the south of Daba Mountains corresponding very well to the result from Figure 6a. When the time comes to midnight and early morning, upward motion area tends to move northward and downward and mostly concentrated on the north side of the highest peak of both Qinling Mountains and Daba Mountains (Figure 14a and Figure 15a). When sufficient moisture is present (Figure 9a), such upward motions may lead to the formation of clouds and further result in precipitation (Figure 6a). After the orography being artificially reduced in Qinling Mountains in LowQD and LowQ, little has changed significantly for the upward motion, while a weakened downward motion and a tendency of unstable potential temperature curve can be found to the north of Qinling Mountains in the morning (Figure 13b,c). In the afternoon and midnight, the change of upward motion is going to be more positive to the north of 34° N and more negative around Qinling Mountains (Figure 14b,c and Figure 15b,c). The relative changes of upward motion are mainly differed above the ground and near the mountain, because of the gravity wave energy may be trapped in a layer near the surface extending downstream from the mountain. After the orography being artificially reduced in Daba Mountains in LowQD and LowD, the upward motion is almost out of sight on the south side of Daba Mountains in the afternoon and midnight (Figure 13b,d and Figure 14b,d), and a weakened upward motion could be found in the early morning (Figure 15b,d). The above analyses demonstrate that the existence of Qinling Mountains and Daba Mountains stimulates the upward motion and unstable environment effectively around 34° N and 32° N, separately, which plays a key role in providing air parcels with sustained lift for the formation of precipitation.
4. Conclusions and Discussion
The influence of the Qinling–Daba Mountain, one of the geographical dividing line between north and south China, on the spatial-temporal distribution of reginal precipitation in a warm season in 2019 over the regional area near the two mountains in central China, was examined with the help of a two-month day-to-day numerical simulation by WRF in high horizontal resolution. To study the two mountains terrain effect, the experiment was divided into four groups, including one control experiment, named CTRL, and three experimental groups, named LowQD, LowQ, and LowD. Capital Q and D represent the orography over Qinling Mountains or Daba Mountains is lowered, separately. The results demonstrate that the existence of Qinling Mountains and Daba Mountains has an obvious effect on spatial distribution and diurnal cycle of reginal precipitation, which is mainly affected by the location of Qinling Mountains around 34° N and around 32° N at the time period of early morning and midnight.
To investigate the key mechanisms for Qinling–Daba Mountains effect, horizontal distribution of water vapor and CAPE, as well as cross section of vertical velocity of wind and potential temperature has been examined. It has been found the two mountains plays an important role in interception of water vapor from south to north in the lower troposphere, where Daba Mountains mainly intercepts the northward water vapor transportation across 32° N and Qinling Mountains mainly intercepts it across 34° N in rapid sequence. From the perspective of thermodynamic and dynamic effects, the alteration of terrain height caused a similar change with water vapor in spatial distribution for CAPE, while we found the existence of the two mountains could affect the CAPE notably especially in the time period of early morning and midnight, which is in a good accordance in diurnal cycle. In cross section, existence of Qinling Mountains and Daba Mountains are found to stimulate the upward motion and unstable environment effectively around 34° N and 32° N, separately.
Features and meteorological effects of terrains in China are very diverse, as China has a complicated topography and terrain decomposition process from fine to coarse [14,22]. This study focuses on the impacts of Qinling–Daba orography on precipitation over complex topography, where the convection was usually initiated by the time of day or night, due to multiscale mountains in this area playing an important role by creating favorable conditions for convection initiation with insufficient water vapor and limited unstable energy, and with the two mountains affected areas are limited to 34° N and 32° N. In general, it is noted that although this study was restricted to a two-month warm season simulation in China, the understanding of the complex interactions between Qinling–Daba Mountains and reginal precipitation should be valuable. Quantitative water–energy budget analyses and the atmospheric conditions in representing the characteristics of the whole year for understanding the responses of the regional water–energy cycle to terrains can be performed to further our conclusions, although we believe the physical mechanisms proposed herein should be robust. Additionally, this research method has laid a certain foundation for future research to understand the role of land use/cover change over Qinling–Daba Mountains from the past to the present and future in relation to the regional water–energy cycle for ecological restoration by more complicated coupled models.
Author Contributions
Conceptualization, X.L. and N.W.; methodology, X.L.; software, X.L.; validation, X.L., N.W. and Z.W.; formal analysis, X.L.; investigation, X.L.; resources, X.L.; data curation, X.L.; writing—original draft preparation, X.L.; writing—review and editing, N.W. and Z.W.; visualization, X.L.; supervision, N.W.; project administration, X.L.; funding acquisition, X.L. All authors have read and agreed to the published version of the manuscript.
Funding
This study was supported by Young Talent fund of University Association for Science and Technology in Shaanxi (20210706), the Education Department of Shaanxi Province (20JK0925), and the National Natural Science Foundation of China (Grant Nos. 42005005 and 42130516).
Institutional Review Board Statement
Not applicable.
Informed Consent Statement
Not applicable.
Data Availability Statement
The initial data for WRF simulation presented in this study are openly available in National Centers for Environmental Prediction/National Weather Service/NOAA/U.S. Department of Commerce (2015), NCEP GDAS/FNL 0.25 Degree Global Tropospheric Analyses and Forecast Grids, https://0-doi-org.brum.beds.ac.uk/10.5065/D65Q4T4Z (accessed on 30 October 2021). All the results from WRF simulation can be reproduced by following the Materials and Methods in this study.
Acknowledgments
The simulations and visual presentation were carried out at high-performance computing platform of College of Urban and Environmental Sciences, Northwest University in Xi’ an in China. Data analysis and visualizations in this paper are created by the NCAR Command Language (NCL) (Version 6.6.2), which can be accessed via http://0-dx-doi-org.brum.beds.ac.uk/10.5065/D6WD3XH5 (accessed on 30 October 2021). All data for this paper comes from WRF (4.0) model (doi:10.5065/D6MK6B4K) simulations and is properly cited and referred to in the reference list to support reproducibility with the details in Ensemble Simulation Design.
Conflicts of Interest
The authors declare no conflict of interest.
References
- Liu, Y. On natural zonation in the Shanxi province. Acta Geogr. Sin. 1980, 03, 210–218. [Google Scholar]
- Zhang, Y.C.; Tan, K.Y. The studies of the northern boundary of subtropical zone and its transitional zone in China. Geogr. Res. 1991, 10, 85–91. [Google Scholar]
- Kang, M.; Zhu, Y. Discussion and analysis on the geo-ecological boundary in Qinling Range. Acta Ecol. Sin. 2007, 27, 2774–2784. [Google Scholar]
- He, H.; Zhang, Q.; Zhou, J.; Fei, J.; Xie, X. Coupling climate change with hydrological dynamic in Qinling Mountains, China. Clim. Chang. 2008, 94, 409–427. [Google Scholar] [CrossRef]
- Shao, Y.; Mu, X.; He, Y.; Sun, W.; Zhao, G.; Gao, P. Spatiotemporal variations of extreme precipitation events at multi-time scales in the Qinling-Daba mountains region, China. Quat. Int. 2019, 525, 89–102. [Google Scholar] [CrossRef]
- Zhou, Q.; Bian, J.; Zheng, J. Variation of air temperature and thermal resources in the northern and southern regions of the Qinling mountains from 1951 to 2009. Acta Geogr. Sin. 2011, 66, 1211–1218. [Google Scholar]
- Zhu, K. Subtropics of China. Chin. Sci. Bull. 1958, 17, 524–527. [Google Scholar]
- Hu, Y.; Yao, Y.; Kou, Z. Exploring on the climate regionalization of Qinling-Daba mountains based on Geodetector-SVM model. PLoS ONE 2020, 15, e0241047. [Google Scholar] [CrossRef]
- Li, C.; Zhang, H.; Singh, V.P.; Fan, J.; Wei, X.; Yang, J.; Wei, X. Investigating variations of precipitation concentration in the transitional zone between Qinling Mountains and Loess Plateau in China: Implications for regional impacts of AO and WPSH. PLoS ONE 2020, 15, e0238709. [Google Scholar] [CrossRef]
- Liu, R.F.; Li, P.Y.; Chen, X.T.; Hou, J.Z. Analysis of a flood rainstorm caused by MCC in Shaanxi. J. Chengdu Univ. Inf. Technol. 2012, 3, 306–313. [Google Scholar]
- Li, C.; Wang, R.H. Recent changes of precipitation in Gansu, Northwest China: An index-based analysis. Theor. Appl. Climatol. 2017, 129, 397–412. [Google Scholar] [CrossRef]
- Liu, Z.Y.; Zhang, X.; Fang, R.H. Multi-Scale linkages of winter drought variability to ENSO and the Arctic Oscillation: A case study in Shaanxi, North China. Atmos. Res. 2018, 200, 117–125. [Google Scholar] [CrossRef]
- Jiang, R.G.; Xie, J.C.; Zhao, Y.; He, H.L.; He, G.H. Spatiotemporal variability of extreme precipitation in Shaanxi province under climate change. Theor. Appl. Climatol. 2017, 130, 831–845. [Google Scholar] [CrossRef]
- Meng, Q.; Bai, H.; Zhao, T.; Guo, S.; Qi, G. Topographic characteristic of climate change in the Qinling mountains, China. Mt. Res. 2020, 38, 180–189. [Google Scholar]
- Viale, M.; Garreaud, R. Orographic effects of the subtropical and extratropical Andes on upwind precipitating clouds. J. Geophys. Res.-Atmos. 2015, 120, 4962–4974. [Google Scholar] [CrossRef]
- Houze, R.A. Orographic effects on precipitating clouds. Rev. Geophys. 2012, 50. [Google Scholar] [CrossRef]
- Zhu, L.; Meng, Z.; Zhang, F.; Markowski, P.M. The influence of sea- and land-breeze circulations on the diurnal variability in precipitation over a tropical island. Atmos. Chem. Phys. 2017, 17, 13213–13232. [Google Scholar] [CrossRef] [Green Version]
- Zhu, L.; Chen, X.; Bai, L. Relative roles of low-level wind speed and moisture in the diurnal cycle of rainfall over a tropical island under monsoonal flows. Geophys. Res. Lett. 2020, 47, e2020GL087467. [Google Scholar] [CrossRef]
- Hua, S.; Xu, X.; Chen, B. Influence of multiscale orography on the initiation and maintenance of a precipitating convective system in north China: A case study. J. Geophys. Res. Atmos. 2020, 125, e2019JD031731. [Google Scholar] [CrossRef]
- Kirshbaum, D.J.; Adler, B.; Kalthoff, N.; Barthlott, C.; Serafin, S. Moist orographic convection: Physical mechanisms and links to surface-exchange processes. Atmosphere 2018, 9, 80. [Google Scholar] [CrossRef] [Green Version]
- Wang, X.; Zhang, B.; Xu, X.; Tian, J.; He, C. Regional water-energy cycle response to land use/cover change in the agro-pastoral ecotone, Northwest China. J. Hydrol. 2020, 580, 124246. [Google Scholar] [CrossRef]
- Pielke, R.A.; Mahmood, R.; McAlpine, C. Land’s complex role in climate change. Phys. Today 2016, 69, 40–46. [Google Scholar] [CrossRef] [Green Version]
- Ashish Navale, C.S. Topographic sensitivity of WRF-simulated rainfall patterns over the North West Himalayan region. Atmos. Res. 2020, 242, 105003. [Google Scholar] [CrossRef]
- Boos, W.R.; Kuang, Z. Sensitivity of the south Asian monsoon to elevated and non-elevated heating. Sci. Rep. 2013, 3, 1192. [Google Scholar] [CrossRef] [PubMed]
- Wu, G.; Liu, Y.; Zhang, Q.; Duan, A.; Wang, T.; Wan, R.; Liu, X.; Li, W.; Wang, Z.; Liang, X. The influence of mechanical and thermal forcing by the Tibetan Plateau on Asian climate. J. Hydrometeorol. 2007, 8, 770–789. [Google Scholar] [CrossRef] [Green Version]
- Boos, W.R.; Kuang, Z. Dominant control of the South Asian monsoon by orographic insulation versus plateau heating. Nature 2010, 463, 218–222. [Google Scholar] [CrossRef] [PubMed]
- Liu, L.; Ma, Y.; Menenti, M.; Zhang, X.; Ma, W. Evaluation of WRF modeling in relation to different land surface schemes and initial and boundary conditions: A snow event simulation over the Tibetan Plateau. J. Geophys. Res. Atmos. 2019, 124, 209–226. [Google Scholar] [CrossRef] [Green Version]
- Pan, H.; Chen, G. Diurnal variations of precipitation over North China regulated by the mountain-plains solenoid and boundary-layer inertial oscillation. Adv. Atmos. Sci. 2019, 36, 863–884. [Google Scholar] [CrossRef]
- Li, P.; Furtado, K.; Zhou, T.; Chen, H.; Li, J.; Guo, Z.; Xiao, C. The diurnal cycle of East Asian summer monsoon precipitation simulated by the Met Office Unified Model at convection-permitting scales. Clim. Dyn. 2020, 55, 131–151. [Google Scholar] [CrossRef] [Green Version]
- Bao, X.; Zhang, F. Impacts of the mountain–plains solenoid and cold pool dynamics on the diurnal variation of warm-season precipitation over northern China. Atmos. Chem. Phys. 2013, 13, 6965–6982. [Google Scholar] [CrossRef] [Green Version]
- Wang, Q.; Xue, M.; Tan, Z. Convective initiation by topographically induced convergence forcing over the Dabie Mountains on 24 June 2010. Adv. Atmos. Sci. 2016, 33, 1120–1136. [Google Scholar] [CrossRef] [Green Version]
- Du, Y.; Chen, G.; Han, B.; Bai, L.; Li, M. Convection initiation and growth at the coast of south China. Part II: Effects of the terrain, coastline, and cold pools. Mon. Weather Rev. 2020, 148, 3871–3892. [Google Scholar] [CrossRef]
- Li, H.; Wan, Q.; Peng, D.; Liu, X.; Xiao, H. Multiscale analysis of a record-breaking heavy rainfall event in Guangdong, China. Atmos. Res. 2020, 232, 104703. [Google Scholar] [CrossRef]
- Luo, Y.; Zhang, R.; Wan, Q.; Wang, B.; Wong, W.K.; Hu, Z.; Jou, B.J.-D.; Lin, Y.; Johnson, R.H.; Chang, C.-P.; et al. The southern China monsoon rainfall experiment (SCMREX). Bull. Am. Meteorol. Soc. 2017, 98, 999–1013. [Google Scholar] [CrossRef]
- Tu, C.-C.; Chen, Y.-L.; Lin, P.-L.; Du, Y. Characteristics of the marine boundary layer jet over the south China sea during the early summer rainy season of Taiwan. Mon. Weather Rev. 2019, 147, 457–475. [Google Scholar] [CrossRef]
- Zhu, L.; Bai, L.; Chen, G.; Sun, Y.Q.; Meng, Z. Convection initiation associated with ambient winds and local circulations over a tropical island in south China. Geophys. Res. Lett. 2021, 48, e2021GL094382. [Google Scholar] [CrossRef]
- Yilmaz, K.K.; Derin, Y. Evaluation of multiple satellite-based precipitation products over complex topography. J. Hydrometeorol. 2014, 15, 1498–1516. [Google Scholar] [CrossRef] [Green Version]
- Anagnostou, E.N.; Nikolopoulos, E.I.; Ehsan Bhuiyan, M.A. Machine learning–based blending of satellite and reanalysis precipitation datasets: A multiregional tropical complex terrain evaluation. J. Hydrometeorol. 2019, 20, 2147–2161. [Google Scholar] [CrossRef]
- Mei, Y.; Nikolopoulos, E.I.; Anagnostou, E.N.; Borga, M. Evaluating satellite precipitation error propagation in runoff simulations of mountainous basins. J. Hydrometeorol. 2016, 17, 1407–1423. [Google Scholar] [CrossRef]
- Du, Y.; Zhang, Q.; Chen, Y.-l.; Zhao, Y.; Wang, X. Numerical simulations of spatial distributions and diurnal variations of low-level jets in China during early summer. J. Clim. 2014, 27, 5747–5767. [Google Scholar] [CrossRef]
- Du, Y.; Chen, G.; Han, B.; Mai, C.; Bai, L.; Li, M. Convection initiation and growth at the coast of south China. Part I: Effect of the marine boundary layer jet. Mon. Weather Rev. 2020, 148, 3847–3869. [Google Scholar] [CrossRef]
- Zhang, F.; Zhang, Q.; Du, Y.; Kong, H. Characteristics of coastal low-level jets in the Bohai sea, China, during the early warm season. J. Geophys. Res. Atmos. 2018, 123, 13763–13774. [Google Scholar] [CrossRef]
- Zheng, Y.; Xue, M.; Li, B.; Chen, J.; Tao, Z. Spatial characteristics of extreme rainfall over China with hourly through 24-hour accumulation periods based on national-level hourly rain gauge data. Adv. Atmos. Sci. 2016, 33, 1218–1232. [Google Scholar] [CrossRef] [Green Version]
- Zhang, Y.; Xue, M.; Zhu, K.; Zhou, B. What is the main cause of diurnal variation and nocturnal peak of summer precipitation in Sichuan Basin, China? The key role of boundary layer low-level jet inertial oscillations. J. Geophys. Res. Atmos. 2019, 124, 2643–2664. [Google Scholar] [CrossRef]
- Li, Z.; Zheng, F.-L.; Liu, W.-Z.; Flanagan, D.C. Spatial distribution and temporal trends of extreme temperature and precipitation events on the Loess Plateau of China during 1961–2007. Quat. Int. 2010, 226, 92–100. [Google Scholar] [CrossRef]
- Li, Y.; Yan, J.; Liu, Y. Relationship between dryness/wetness and precipitation heterogeneity in the north and south of the Qinling Mountains. Arid Zone Res. 2016, 33, 619–627. [Google Scholar]
- Skamarock, W.C.; Klemp, J.B.; Dudhia, J.; Gill, D.O.; Liu, Z.; Berner, J.; Wang, W.; Powers, J.G.; Duda, M.G.; Barker, D.; et al. A Description of the Advanced Research WRF Model. Version 4 (No. NCAR/TN-556+STR); National Center for Atmospheric Research: Boulder, CO, USA, 2019. [Google Scholar] [CrossRef]
- NCEP/NWS/NOAA. NCEP GDAS/FNL 0.25 Degree Global Tropospheric Analyses and Forecast Grids. National Center for Atmospheric Research, Computational and Information Systems Laboratory; NCEP/NWS/NOAA; National Center for Atmospheric Research: Boulder, CO, USA, 2015. [Google Scholar] [CrossRef]
- Thompson, G.; Field, P.R.; Rasmussen, R.M.; Hall, W.D. Explicit forecasts of winter precipitation using an improved bulk microphysics scheme. Part II: Implementation of a new snow parameterization. Mon. Weather Rev. 2008, 136, 5095–5115. [Google Scholar] [CrossRef]
- Janjić, Z.I. The step-mountain eta coordinate model: Further developments of the convection, viscous sublayer, and turbulence closure schemes. Mon. Weather Rev. 1994, 122, 927–945. [Google Scholar] [CrossRef] [Green Version]
- Grell, G.A.; Freitas, S.R. A scale and aerosol aware stochastic convective parameterization for weather and air quality modeling. Atmos. Chem. Phys. Discuss. 2013, 13, 23845–23893. [Google Scholar] [CrossRef] [Green Version]
- Iacono, M.J.; Delamere, J.S.; Mlawer, E.J.; Shephard, M.W.; Clough, S.A.; Collins, W.D. Radiative forcing by long-lived greenhouse gases: Calculations with the AER radiative transfer models. J. Geophys. Res. 2008, 113. [Google Scholar] [CrossRef]
Figure 1.
Configuration of model domains and the altitude (shaded, in m) of the orography in each run. (a) Geographic location of the three model domains, whose spacings are 27, 9, and 3 km, respectively. (b) The orography of the innermost domain of the control experiment (CTRL). (c) The orography of the innermost domain of the experiment with both lowered Qinling Mountains and Daba Mountains (LowQD). (d) The orography of the innermost domain of the experiment with lowered Qinling Mountains (LowQ). (e) The orography of the innermost domain of the experiment with both lowered Daba Mountains (LowD). The black boxes in c-d are the area for lowered mountains. The blue lines indicate the location of the vertical cross sections shown in latter figures, due to the precipitation difference is mainly reflected on the north-south direction.

Figure 2.
Comparison of accumulated precipitation (color-filled, in mm) in July and August in 2019 between CTRL simulation (a–c) and monthly analyzed precipitation (d–f) from the Climate Prediction Center (CPC) for domain 1 (a,d), domain 2 (b,e), and domain 3 (c,f) in Figure 1a. The altitude of the orography (in m) is in grey-filled. The black dots indicate the location of the 8 meteorological stations shown in Figure 3 and Figure 4.

Figure 3.
Comparison of evolution of hourly air temperature at 2 m (T2) between CTRL simulation (red dashed lines) and the dataset from 8 meteorological stations of Ankang, Changan, Shangnan, Tongchuan, Zhenping, Baoji, Lueyang, Huangling (black solid lines), whose location is showed in Figure 2.
Figure 3.
Comparison of evolution of hourly air temperature at 2 m (T2) between CTRL simulation (red dashed lines) and the dataset from 8 meteorological stations of Ankang, Changan, Shangnan, Tongchuan, Zhenping, Baoji, Lueyang, Huangling (black solid lines), whose location is showed in Figure 2.

Figure 4.
Relationships of T2 between CTRL simulation and observation in Figure 3. Regression lines are shown in black.
Figure 4.
Relationships of T2 between CTRL simulation and observation in Figure 3. Regression lines are shown in black.


Figure 5.
Time–latitude diagrams of daily accumulated precipitation (mm) averaged in domain 3 in CTRL (a). Panels (b–d) are the differences (b) between LowQD and CTRL (LowQD minus CTRL), (c) between LowQ and CTRL (LowQ minus CTRL), as well as (d) between LowD and CTRL (LowD minus CTRL), respectively. Blue (red) shading indicates negative (positive) variation.

Figure 6.
Diurnal-latitude diagrams, where diurnal-latitude diagrams of daily accumulated precipitation (mm) averaged in domain 3 in CTRL (a). Panels (b–d) are the differences (b) between LowQD and CTRL (LowQD minus CTRL), (c) between LowQ and CTRL (LowQ minus CTRL), as well as (d) between LowD and CTRL (LowD minus CTRL), respectively. Blue (red) shading indicates negative (positive) variation. The diurnal Universal Time Coordinated (UTC) is used.

Figure 7.
Time–latitude diagrams of water vapor mixing ratio (kg kg−1) at 850 hPa averaged in domain 3 in CTRL (a). Panels (b–d) are the differences (b) between LowQD and CTRL (LowQD minus CTRL), (c) between LowQ and CTRL (LowQ minus CTRL), as well as (d) between LowD and CTRL (LowD minus CTRL), respectively. Blue (red) shading indicates negative (positive) variation.

Figure 8.
Time–latitude diagrams of water vapor mixing ratio (kg kg−1) at 500 hPa averaged in domain 3 in CTRL (a). Panels (b–d) are the differences (b) between LowQD and CTRL (LowQD minus CTRL), (c) between LowQ and CTRL (LowQ minus CTRL), as well as (d) between LowD and CTRL (LowD minus CTRL), respectively. Blue (red) shading indicates negative (positive) variation.

Figure 9.
Diurnal-latitude diagrams, where diurnal-latitude diagrams of water vapor mixing ratio (kg kg−1) at 850 hPa averaged in domain 3 in CTRL (a). Panels (b–d) are the differences (b) between LowQD and CTRL (LowQD minus CTRL), (c) between LowQ and CTRL (LowQ minus CTRL), as well as (d) between LowD and CTRL (LowD minus CTRL), respectively. Blue (red) shading indicates negative (positive) variation.

Figure 10.
Diurnal-latitude diagrams, where diurnal-latitude diagrams of water vapor mixing ratio (kg kg−1) at 500 hPa averaged in domain 3 in CTRL (a). Panels (b–d) are the differences (b) between LowQD and CTRL (LowQD minus CTRL), (c) between LowQ and CTRL (LowQ minus CTRL), as well as (d) between LowD and CTRL (LowD minus CTRL), respectively. Blue (red) shading indicates negative (positive) variation.


Figure 11.
Time–latitude diagrams of convective available potential energy (CAPE) (J kg−1) averaged in domain 3 in CTRL (a). Panels (b–d) are the differences (b) between LowQD and CTRL (LowQD minus CTRL), (c) between LowQ and CTRL (LowQ minus CTRL), as well as (d) between LowD and CTRL (LowD minus CTRL), respectively. Blue (red) shading indicates negative (positive) variation. Here the CAPE refers to the MCAPE, which is maximum convective available potential energy.

Figure 12.
Diurnal-latitude diagrams, where diurnal-latitude diagrams of CAPE (J kg−1) averaged in domain 3 in CTRL (a). Panels (b–d) are the differences (b) between LowQD and CTRL (LowQD minus CTRL), (c) between LowQ and CTRL (LowQ minus CTRL), as well as (d) between LowD and CTRL (LowD minus CTRL), respectively. Blue (red) shading indicates negative (positive) variation.

Figure 13.
Vertical cross sections of vertical velocity of wind (m s−1, color filling) and potential temperature (K, contour line) along the blue lines in Figure 1 of (a) CTRL, (b) LowQD, (c) LowQ, and (d) LowD on an average on 09:00 UTC (local time of 16:00, afternoon) during the whole simulated time period.


Figure 14.
Vertical cross sections of vertical velocity of wind (m s−1, color filling) and potential temperature (K, contour line) along the blue lines in Figure 1 of (a) CTRL, (b) LowQD, (c) LowQ, and (d) LowD on an average on 17:00 UTC (local time of 00:00, midnight) during the whole simulated time period.

Figure 15.
Vertical cross sections of vertical velocity of wind (m s−1, color filling) and potential temperature (K, contour line) along the blue lines in Figure 1 of (a) CTRL, (b) LowQD, (c) LowQ, and (d) LowD on an average on 22:00 UTC (local time of 05:00, early morning) during the whole simulated time period.

Publisher’s Note: MDPI stays neutral with regard to jurisdictional claims in published maps and institutional affiliations. |
© 2021 by the authors. Licensee MDPI, Basel, Switzerland. This article is an open access article distributed under the terms and conditions of the Creative Commons Attribution (CC BY) license (https://creativecommons.org/licenses/by/4.0/).
Share and Cite
MDPI and ACS Style
Li, X.; Wang, N.; Wu, Z. Terrain Effects on Regional Precipitation in a Warm Season over Qinling-Daba Mountains in Central China. Atmosphere 2021, 12, 1685. https://0-doi-org.brum.beds.ac.uk/10.3390/atmos12121685
AMA Style
Li X, Wang N, Wu Z. Terrain Effects on Regional Precipitation in a Warm Season over Qinling-Daba Mountains in Central China. Atmosphere. 2021; 12(12):1685. https://0-doi-org.brum.beds.ac.uk/10.3390/atmos12121685
Chicago/Turabian StyleLi, Xiaofei, Ninglian Wang, and Zhanhao Wu. 2021. "Terrain Effects on Regional Precipitation in a Warm Season over Qinling-Daba Mountains in Central China" Atmosphere 12, no. 12: 1685. https://0-doi-org.brum.beds.ac.uk/10.3390/atmos12121685
Note that from the first issue of 2016, this journal uses article numbers instead of page numbers. See further details here.