
Distinct Evolution of Sea Surface Temperature over the Cold Tongue Region in South China Sea during Various El Niño Events

1
Key Laboratory of Meteorological Disaster of Ministry of Education (KLME), Nanjing University of Information Science and Technology, Nanjing 210000, China
2
Dongfang Meteorological Administration, Dongfang 572600, China
3
Key Laboratory of South China Sea Meteorological Disaster Prevention and Mitigation of Hainan Province, Haikou 570100, China
*
Author to whom correspondence should be addressed.
Atmosphere 2021, 12(12), 1689; https://0-doi-org.brum.beds.ac.uk/10.3390/atmos12121689
Submission received: 26 November 2021
/
Revised: 10 December 2021
/
Accepted: 13 December 2021
/
Published: 16 December 2021
(This article belongs to the Special Issue Impact of Climate Change on Vegetation and Water Scarcity using Remote Sensing)
Abstract
:This study investigates the evolution of the sea surface temperature (SST) over the cold tongue (CT) region in the central South China Sea (SCS) during various El Niño events. A significant and distinct double-peak warming evolution can occur during EP El Niño and CP El Niño events, with the former being more remarkable and robust than the latter. Further analyses show that the weak and insignificant CT SST anomaly in CP El Niño events is influenced by some CP El Niño events in which the warm sea surface temperature anomaly (SSTA) is located west of 175° E (WCP El Niño). The response of CT SSTA mainly depends on the warm SSTA location of CP El Niño. The different corresponding mechanisms in winter, spring and summer are discussed respectively in this work. Further analysis reveals that the weak and insignificant SST anomaly over the CT region in CP El Niño events is caused by the faint SSTA response during the WCP El Niño events. The results of this study call attention to the response of the SCS climate in both atmosphere and ocean to the diversity of ENSO, especially the CP El Niño.
1. Introduction
Many studies have demonstrated that the Indo-Pacific warm pool has a great influence on the global climate regime, where the energy released by deep convection is always considered as the source of the global circulation system [1,2]. The South China Sea (SCS) is the bridge to connect these systems together. More importantly, the central part of SCS, with a high sea surface temperature (SST) above 26 °C, is one of the most frequent genesis locations of tropical cyclones over the western North Pacific [3]. Consequently, interannual variations of SCS SST play a crucial role in weather and climate over local and surrounding regions.
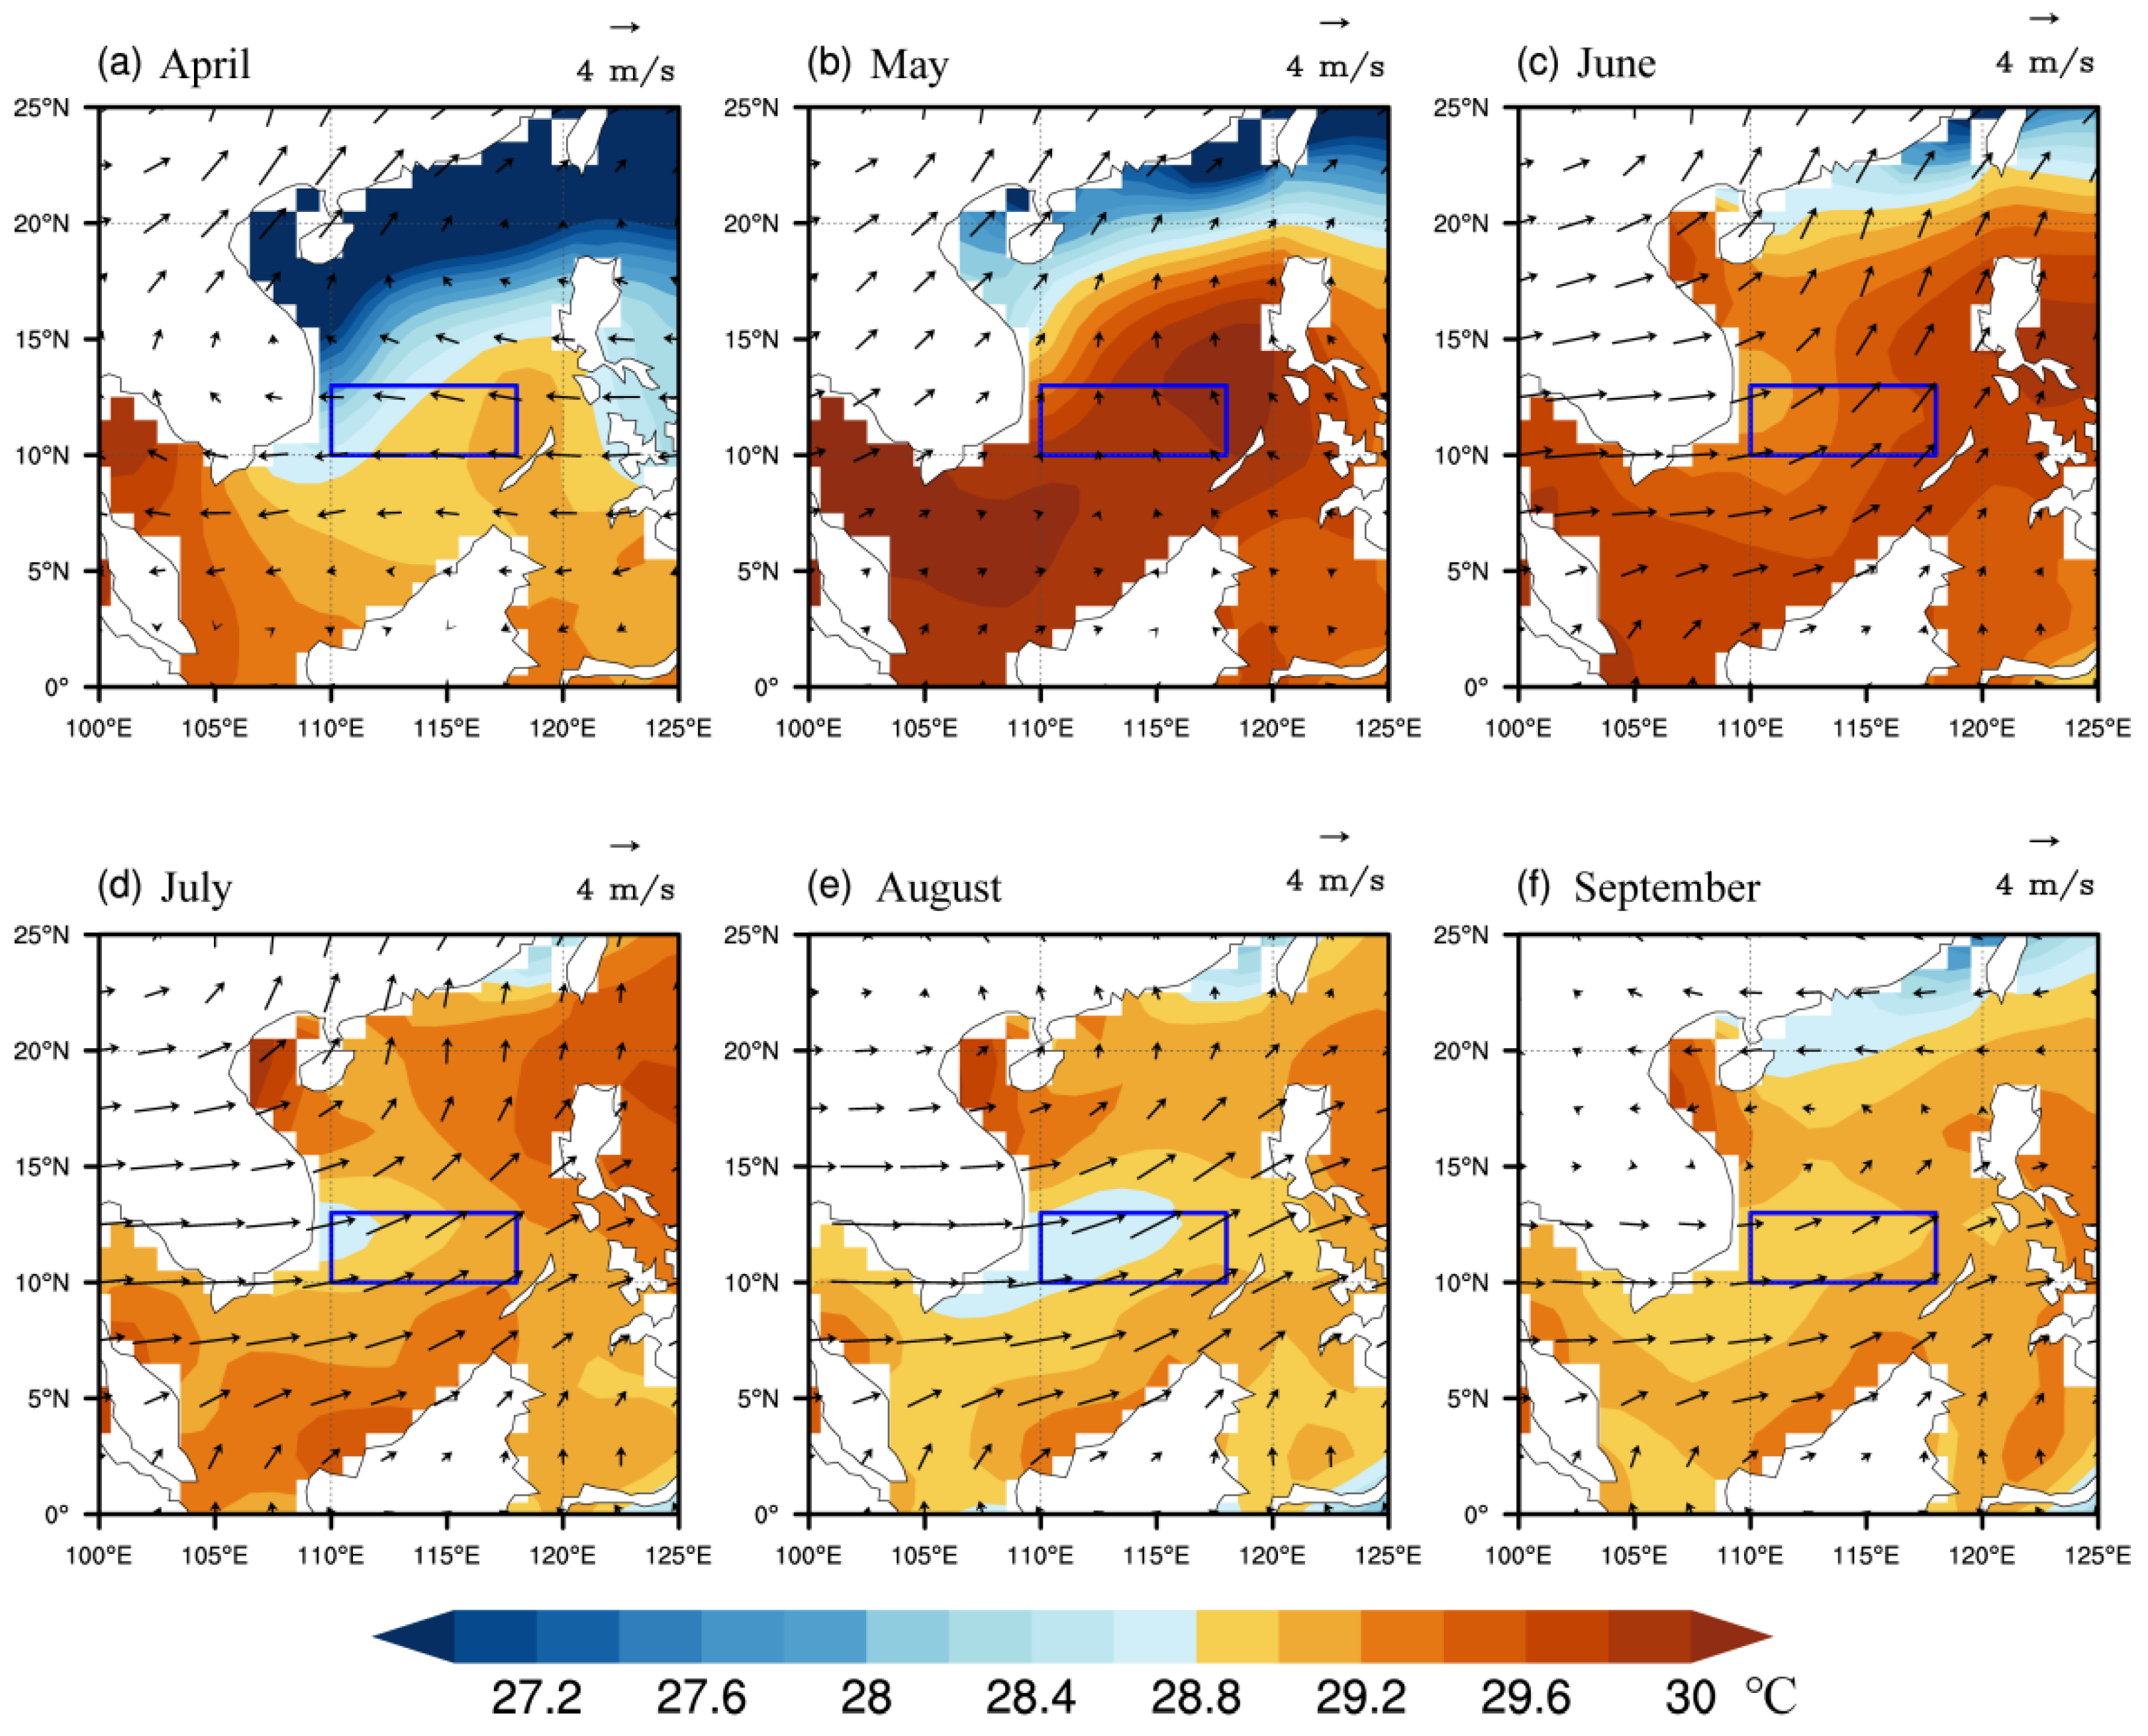
Interestingly, from spring to summer, the SST in central SCS does not warm monotonically as the solar radiation increases. In contrast, it begins to cool down after the southwest monsoon onset. Thus, an elongated region over the central SCS has a colder SST relative to its surroundings, which is known as the cold tongue (CT) (Figure 1). Wyrtki [4] first pointed out that the CT exerts a vital role on the interannual variations of the SCS climate. Regarding the mechanism of CT formation, Xie et al. [5] demonstrated that in summer, after the southwest monsoon onset, a strong wind jet occurs east of offshore Vietnam due to the semi-blocking effect of the Indo-China Peninsula. The wind jet gives rise to significant oceanic upwelling off the coast. Then, the CT forms over most of the central part of the SCS along with the cold upwell expanding eastward. It should be noted that the CT over the SCS can also be observed during the winter; however, its formation is closely related with oceanic advection transport, which is driven by wind rather than the upwelling effect [6].
The interannual variability of the CT SST is remarkably influenced by El Niño Southern Oscillation (ENSO) events during both the developing winter and decaying summer [3,5,7,8,9,10,11]. It is well known that ENSO is the strongest interannual signal of tropical air–sea interaction and has a great influence on the global climate by means of remote atmospheric circulation. Wang et al. [3] found that the CT SST represents a warming anomaly with a double-peak evolution during El Niño events. The first peak occurs in winter, which is mainly due to the shortwave radiation and latent heat flux anomalies, while the second peak in summer is caused by the mean meridional geostrophic heat advection. Yu et al. [12] indicated that when an El Niño event occurred, the basin-averaged SCS SST showed a surprisingly warming linear trend during 2011–2017 compared with that during 2003–2008. Wang and Wu [13] investigated the individual and combined roles of the ENSO and East Asian winter monsoon in the formation and development of the SCS CT during winter.
However, a new El Niño phenomenon (named CP El Niño) with a warm SSTA center located in the central equatorial Pacific has become a dominant mode of the ENSO warm phase in the last 20 years [14]. The CP El Niño has a remarkable but distinct impact on global climate relative to the traditional El Niño with a warming center over tropical eastern Pacific (named EP El Niño) [15,16,17]. For example, Chen and Tam [18] showed that the different heating source distribution of EP El Niño and CP El Niño events could result in distinct atmospheric circulation in the western North Pacific (WNP) during boreal summer and fall, thus resulting in different impacts on the tropical cyclone frequency. Weng et al. [19] investigated the influence of EP El Niño, CP El Niño and the Indian Ocean Dipole (IOD) on summer climate in China and found that the CP El Niño has the closest relationship with the WNP summer monsoon. Hence, the climate impact of El Niño exhibits a high degree of uncertainty due to inter-El Niño variations in its SST anomaly patterns. Over the SCS, the double-peak warming evolution of SST can be found in both CP and EP El Niño events, but the intensity of warm SST in CP El Niño is found to be relatively weaker than the latter [20,21]. The manner of the connection between CT SST and the regime change of ENSO is still an open question.
Wang and Wang [22] pointed out that CP El Niño could be divided into two sub-types due to its discrepant influence on precipitation over southern China. Chen et al. [23] demonstrated that those two sub-types of CP El Niño also produce opposite impacts on the anomalous anticyclone over WNP. Using observational data, Kim et al. [24] showed that EP El Niño and two sub-type CP El Niño events weaken the EAWM with varying degrees of impact. Based on the same classification as Wang and Wang [22], Tan et al. [21] found that two types of CP El Niño events also have opposite impacts on SCS SST during autumn. However, the classification of Wang and Wang [22], it should be noted, is only according to their climate impact during El Niño’s mature period. There is little consideration about the structure of CP El Niño’s warm SSTA itself. Therefore, the CT SST responses related with different types of El Niño are re-considered in this study, primarily on account of the distribution of El Niño’s warm SSTA.
The rest of the paper is organized as follows. A brief description of the datasets and methodology used in this study is illustrated in Section 2. In Section 3, different CT SST evolution characteristics among varying El Niño events and the corresponding mechanisms in winter, spring and summer are analyzed, respectively. Finally, conclusions and discussions are presented in Section 4.
2. Materials and Methods
The monthly SST dataset used in this study is the Hadley Centre Sea Ice and Sea Surface Temperature (HadISST) dataset from the Met Office Hadley Centre, with a spatial resolution of 1 × 1°, from 1970 to 2018 (Rayner et al. [25], http://www.opsi.gov.uk/advice/crown-copyright/copyright-guidance/index.htm, accessed on 1 November 2021). Atmospheric variables are examined based on the National Center for Environmental Prediction/National Center for Atmospheric Research (NCEP/NCAR) Reanalysis 1 with a resolution of 1 × 1° from 1970 to 2018, including winds, short-wave radiation, long-wave radiation, latent heat flux and sensible heat fluxes (Kalnay et al. [26], http://www.psl.noaa.gov/data/gridded/data.ncep.reanalysis.derived.html, accessed on 1 November 2021). Simple Ocean and Data Assimilation (SODA, https://www2.atmos.umd.edu/~ocean/index_files/soda3.3.1_mn_download.htm, accessed on 1 November 2021) dataset Version 3.3.1 is utilized to calculate the wind stress curl with a resolution of 0.25 × 0.25° during 1980–2015. Linear trends in all datasets were extracted by removing the climatological annual cycle (1970–2018) to avoid possible effects related to global warming. Statistical significance in all cases is determined with the two–tailed Student’s t-test.
El Niño events are identified according to Climate Prediction Center’s definition based on a threshold of 0.5 °C of the three month running Niño3.4 index (averaged SST anomaly in the domain of 5° S–5° N, 120°–170° W) for five consecutive months. Following previous studies [17,27], five EP El Niño events and seven CP El Niño events (Table 1) are identified based on the anomalous SST distribution during winter (DJF).
3. Results
3.1. Characteristics of the Cold Tongue Region under Two Typical El Niño Events
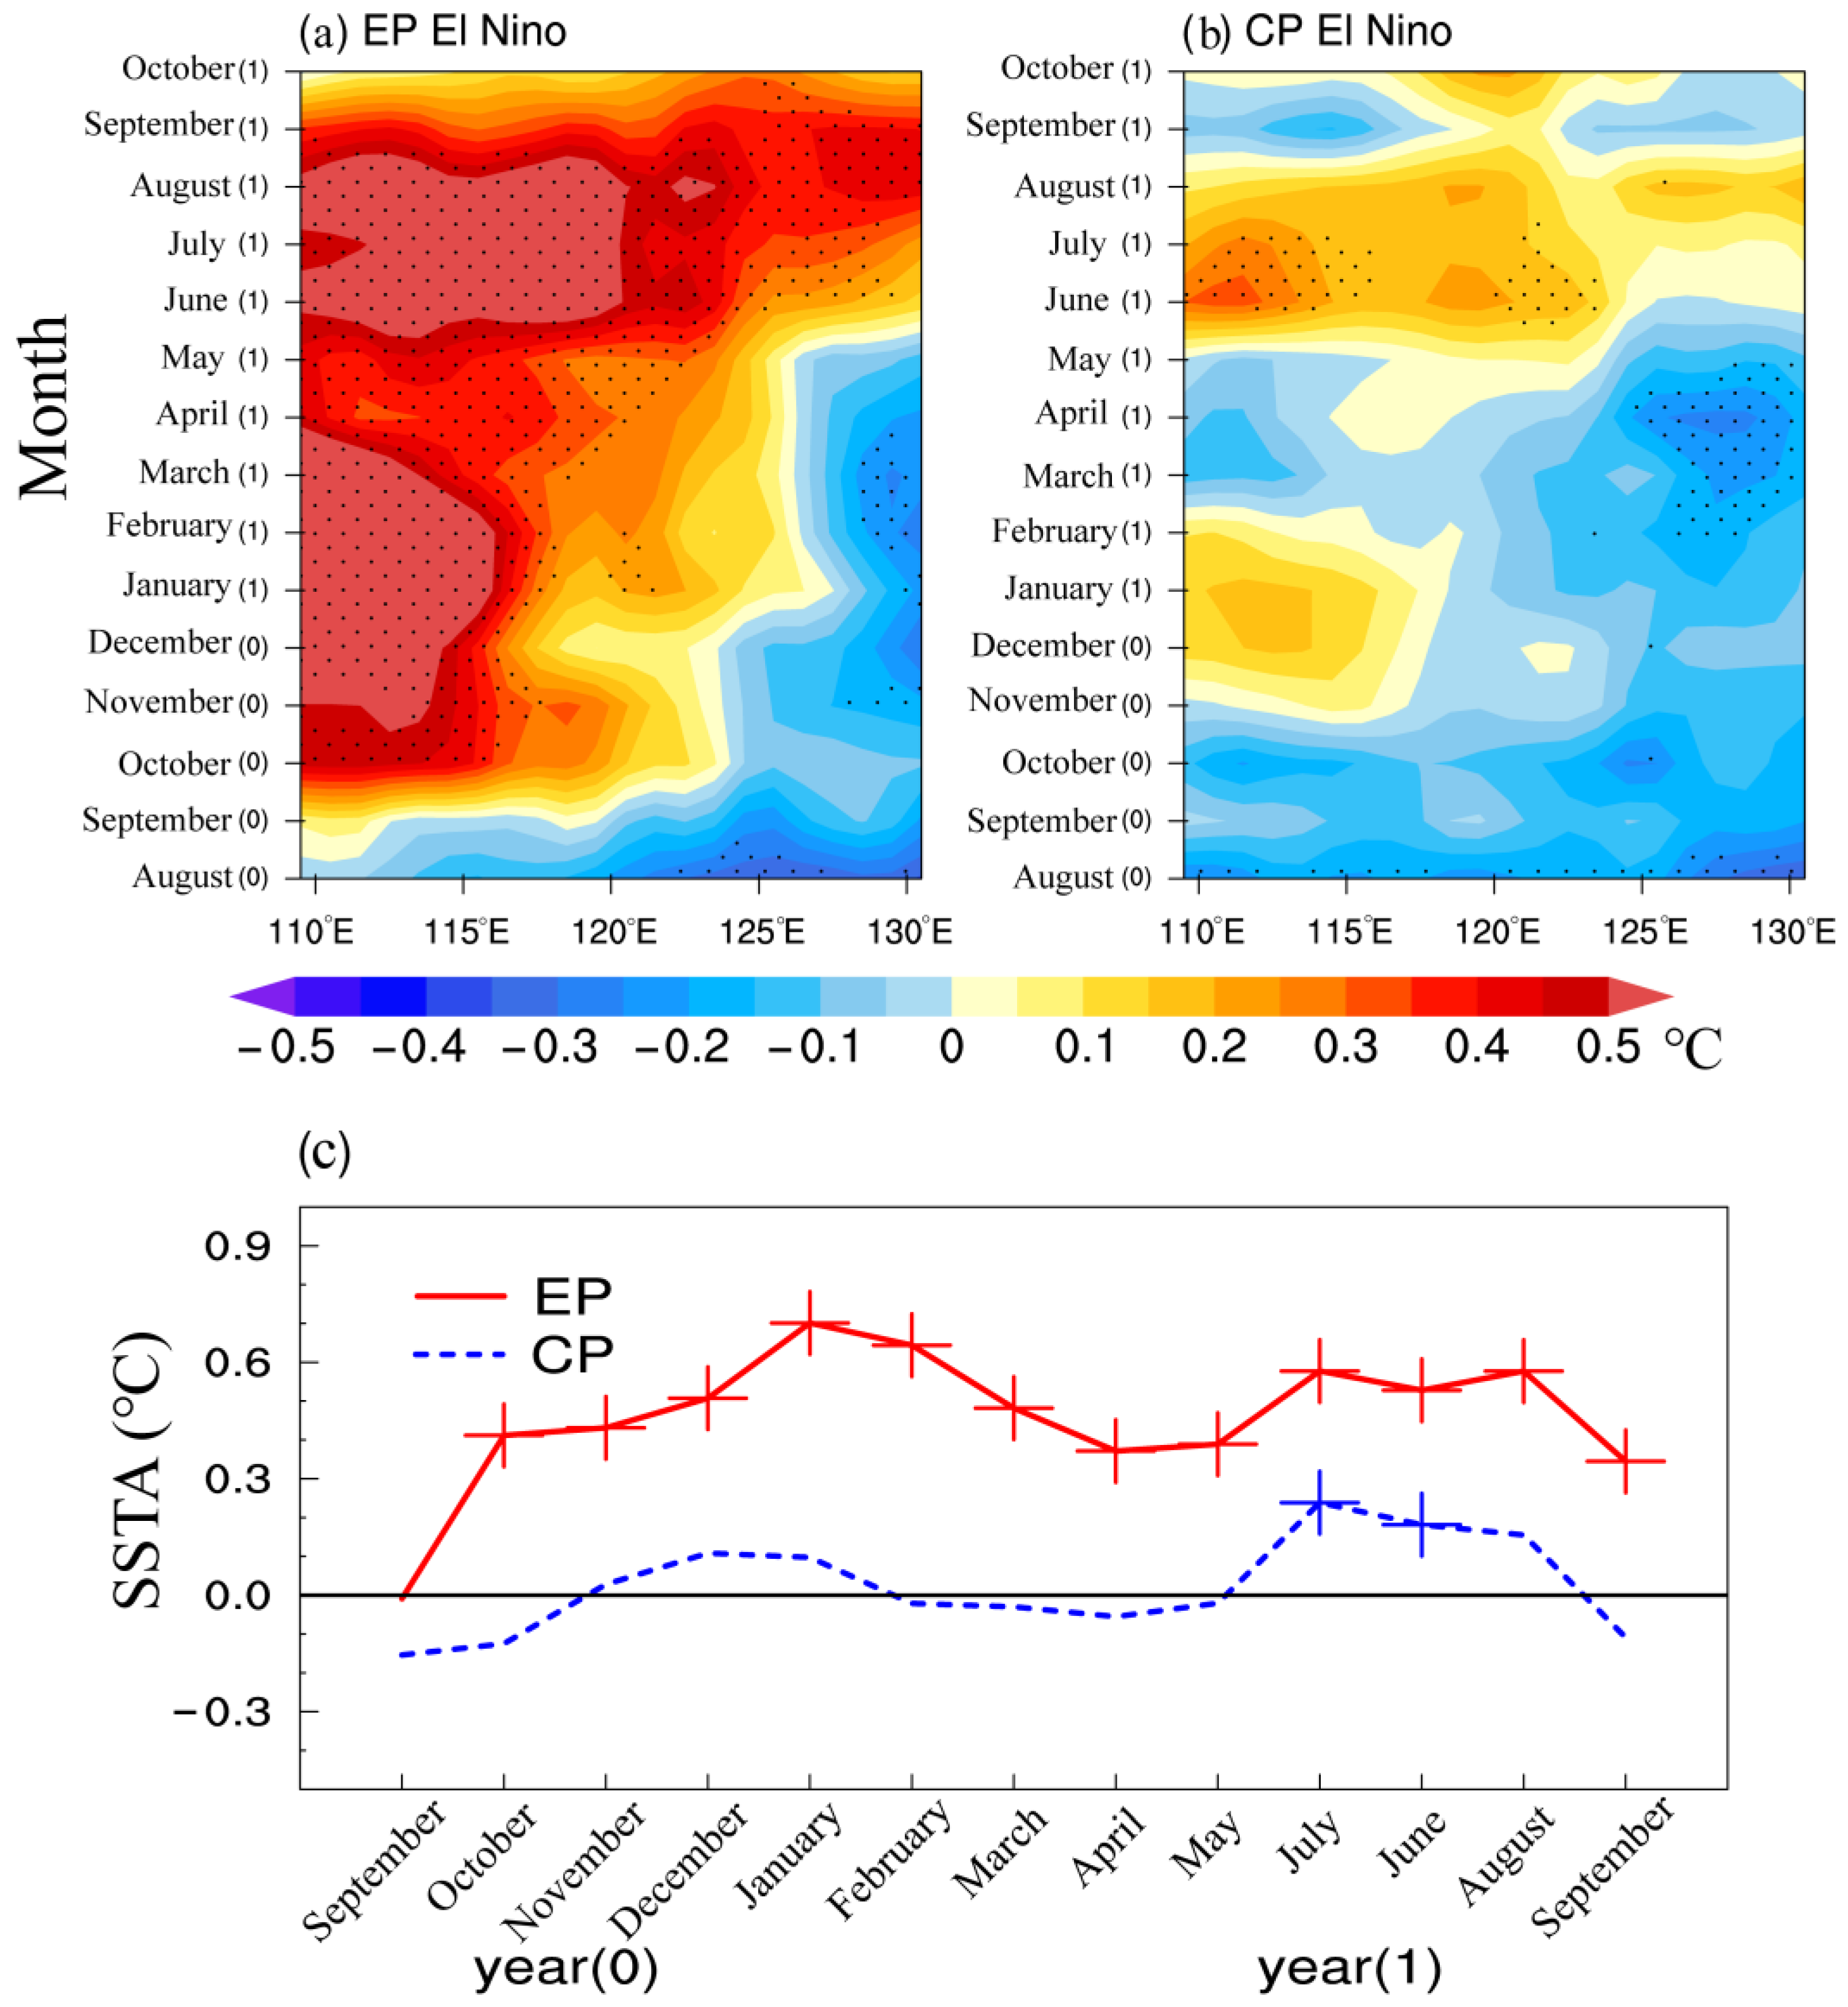
The anomalous SST presents a double-peak warming evolution over the CT region during both EP El Niño and CP El Niño events (Figure 2a,b), consistent with previous studies [3,20]. The intensity of the SSTA is much weaker in CP El Niño events relative to EP El Niño events. In the first peak during winter, a dramatic warm SSTA is observed over the CT region in EP El Niño events; the associated warm SSTA is greater than 0.5 °C (reaching 90% confidence level) and extends eastward as far as 125° E (Figure 2a). In sharp contrast, in CP El Niño, although the SSTA is also higher than normal, leading to the first warming peak, the warming peak is only 0.2 °C and located only west of 118° E (Figure 2b). Besides, in CP El Niño, the SSTA does not turn positive until November and decreases sharply to negative in February with a duration of only three months. However, in EP El Niño, the warming starts as early as September in the El Niño developing year. The SSTA greater than 0.5 °C could last to April and goes down slightly to 0.4 °C, but it strengthens again up to 0.5 °C quickly in June, leading to the second peak formation. The averaged SSTA evolution over the CT region (110–118° E, 10–13° N, Figure 2c) further proves the discrepant characteristic of the CT SST between EP El Niño and CP El Niño. In CP El Niño events, only the second peak in June and July is statistically significant, reaching a 90% confidence level. Below, we explore why the composite SSTA intensity in CP El Niño events is so much weaker compared to that of the EP El Niño.
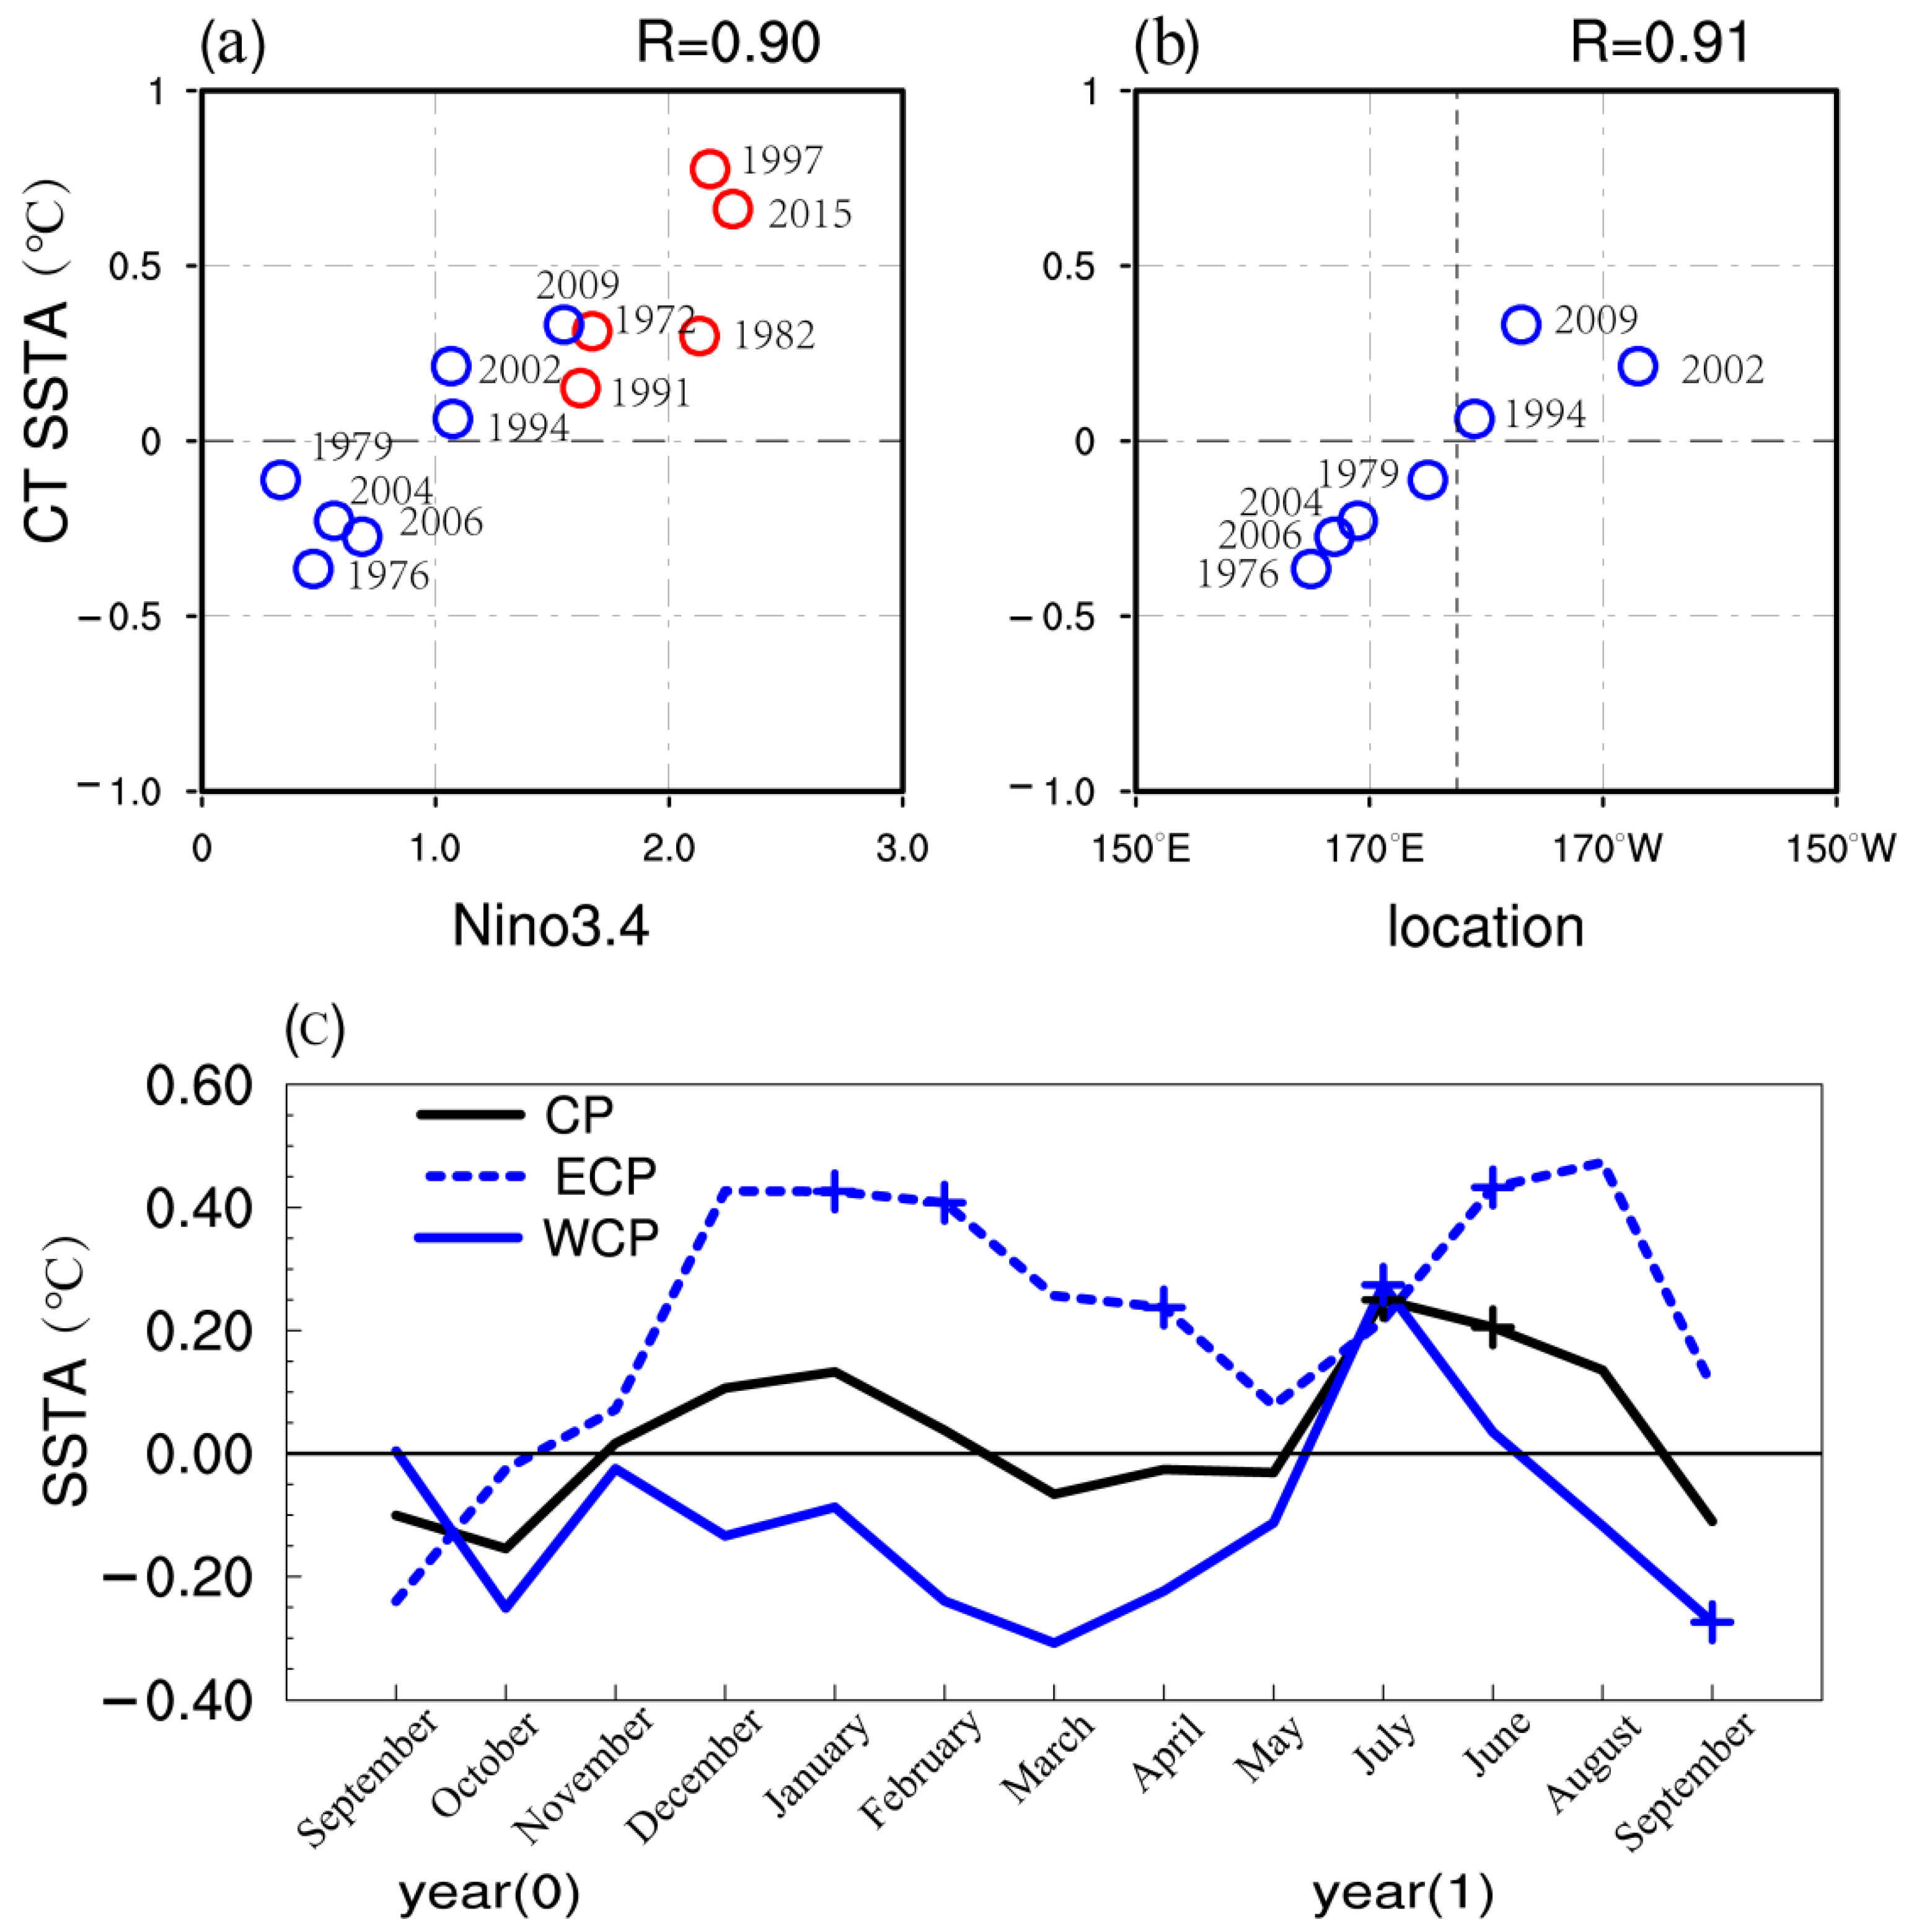
Figure 3a gives the scatter plot of the DJF El Niño intensity (averaged SSTA over the Niño3.4 region) and the DJF CT SSTA intensity (averaged SSTA over 110–118° E, 10–13° N), in which an apparent positive relationship could be found for all El Niño events with the correlation coefficient reaching 0.90. All EP El Niño events represent a positive SSTA over the CT region. However, in CP El Niño events, there are four cooling and three warming periods over the CT that occurred in the mature period of El Niño. This is the main reason for the insignificant response of the CT SST to CP El Niño shown in Figure 2. Next, we consider why the CT SSTA is below normal in the four CP El Niño events.
Zhang et al. [17,27] demonstrated that the atmospheric response over the Indian Ocean and East Asia is highly sensitive to the SSTA zonal location of CP El Niño. A consistent effect is observed in terms of the CT SST response in this study. Here, the zonal location of the CP El Niño is defined as the maximum zonal gradient of the CP El Niño warm SSTA (5° S–5° N mean). Therefore, according to Figure 3b, when the CP El Niño is located east of 175° E, a positive SSTA would be formed in the CT region. In sharp contrast, a cooling SSTA would be observed if the warming SSTA of the CP El Niño lies west of 175° E. Their correlation coefficient is up to 0.91, reaching a 95% confidence level. Therefore, the CP El Niño events are naturally divided into two sub-groups: east CP El Niño events (ECP), with the warm SSTA located east of 175° E, including the events of 1994, 2002 and 2009; and west CP El Niño events (WCP), with the warm SSTA located west of 175° E, including the events in 1976, 1979, 2004 and 2006. As a consequence, the response of CT SSTA mainly depends on the location of the warm SSTA center of CP El Niño (Figure 3c). For ECP El Niño events—that is, the warm SSTA of CP El Niño is located relatively eastward—the corresponding SSTA over the CT region exhibits a similar and comparable evolution with that of EP El Niño events. A robust warm SSTA with an intensity greater than 0.4 °C occurs during both the winter and the following summer. However, the CT SSTA of WCP El Niño events is below normal all the time during the developing and decaying period of El Niño, except in June, when it is rather weaker than that of ECP El Niño events. Without doubt, the expected first warm peak in winter does not happen, while the second peak only occurs in June. This means that the evolution of CT SSTA in WCP El Niño events is significant compared with that in ECP El Niño events not only during winter but also during the following spring and summer. Therefore, in the next study, different characteristics of the ECP and WCP El Niño events are compared in both atmospheric and oceanic fields in order to analyze the possible mechanisms during varying seasons.
3.2. Characteristics of the Cold Tongue Region under Various El Niño Events in Different Seasons
3.2.1. Winter
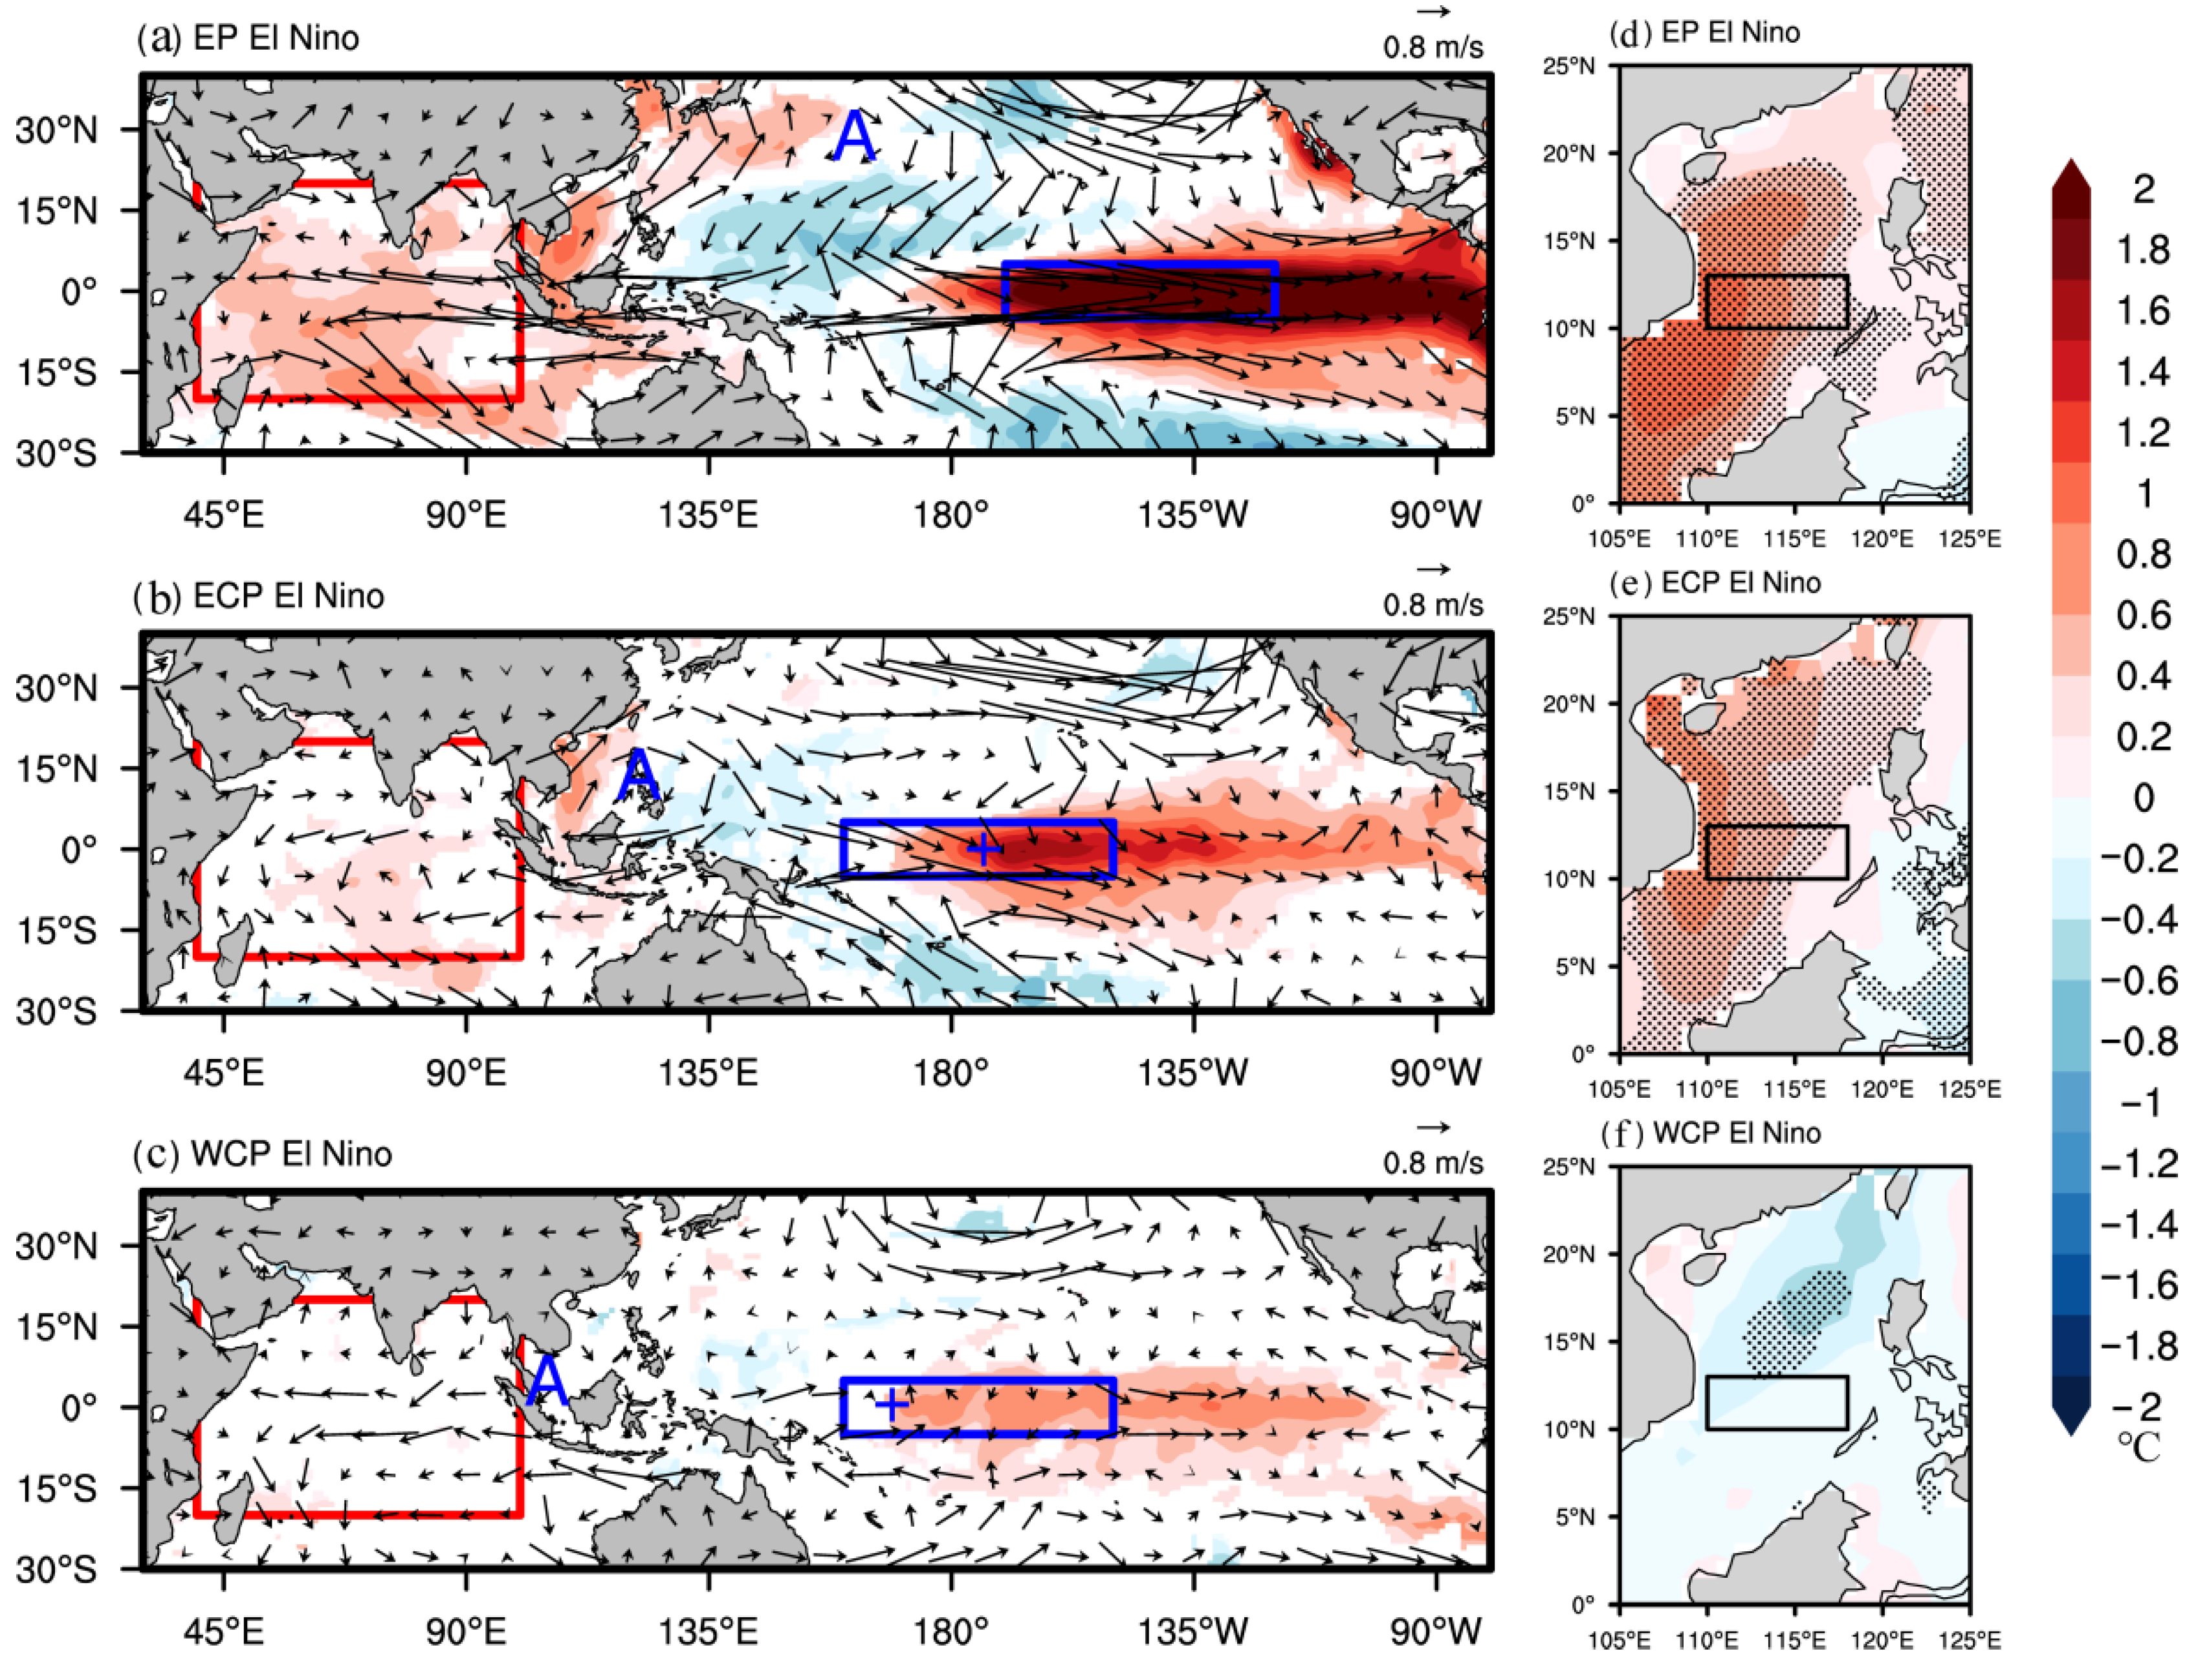
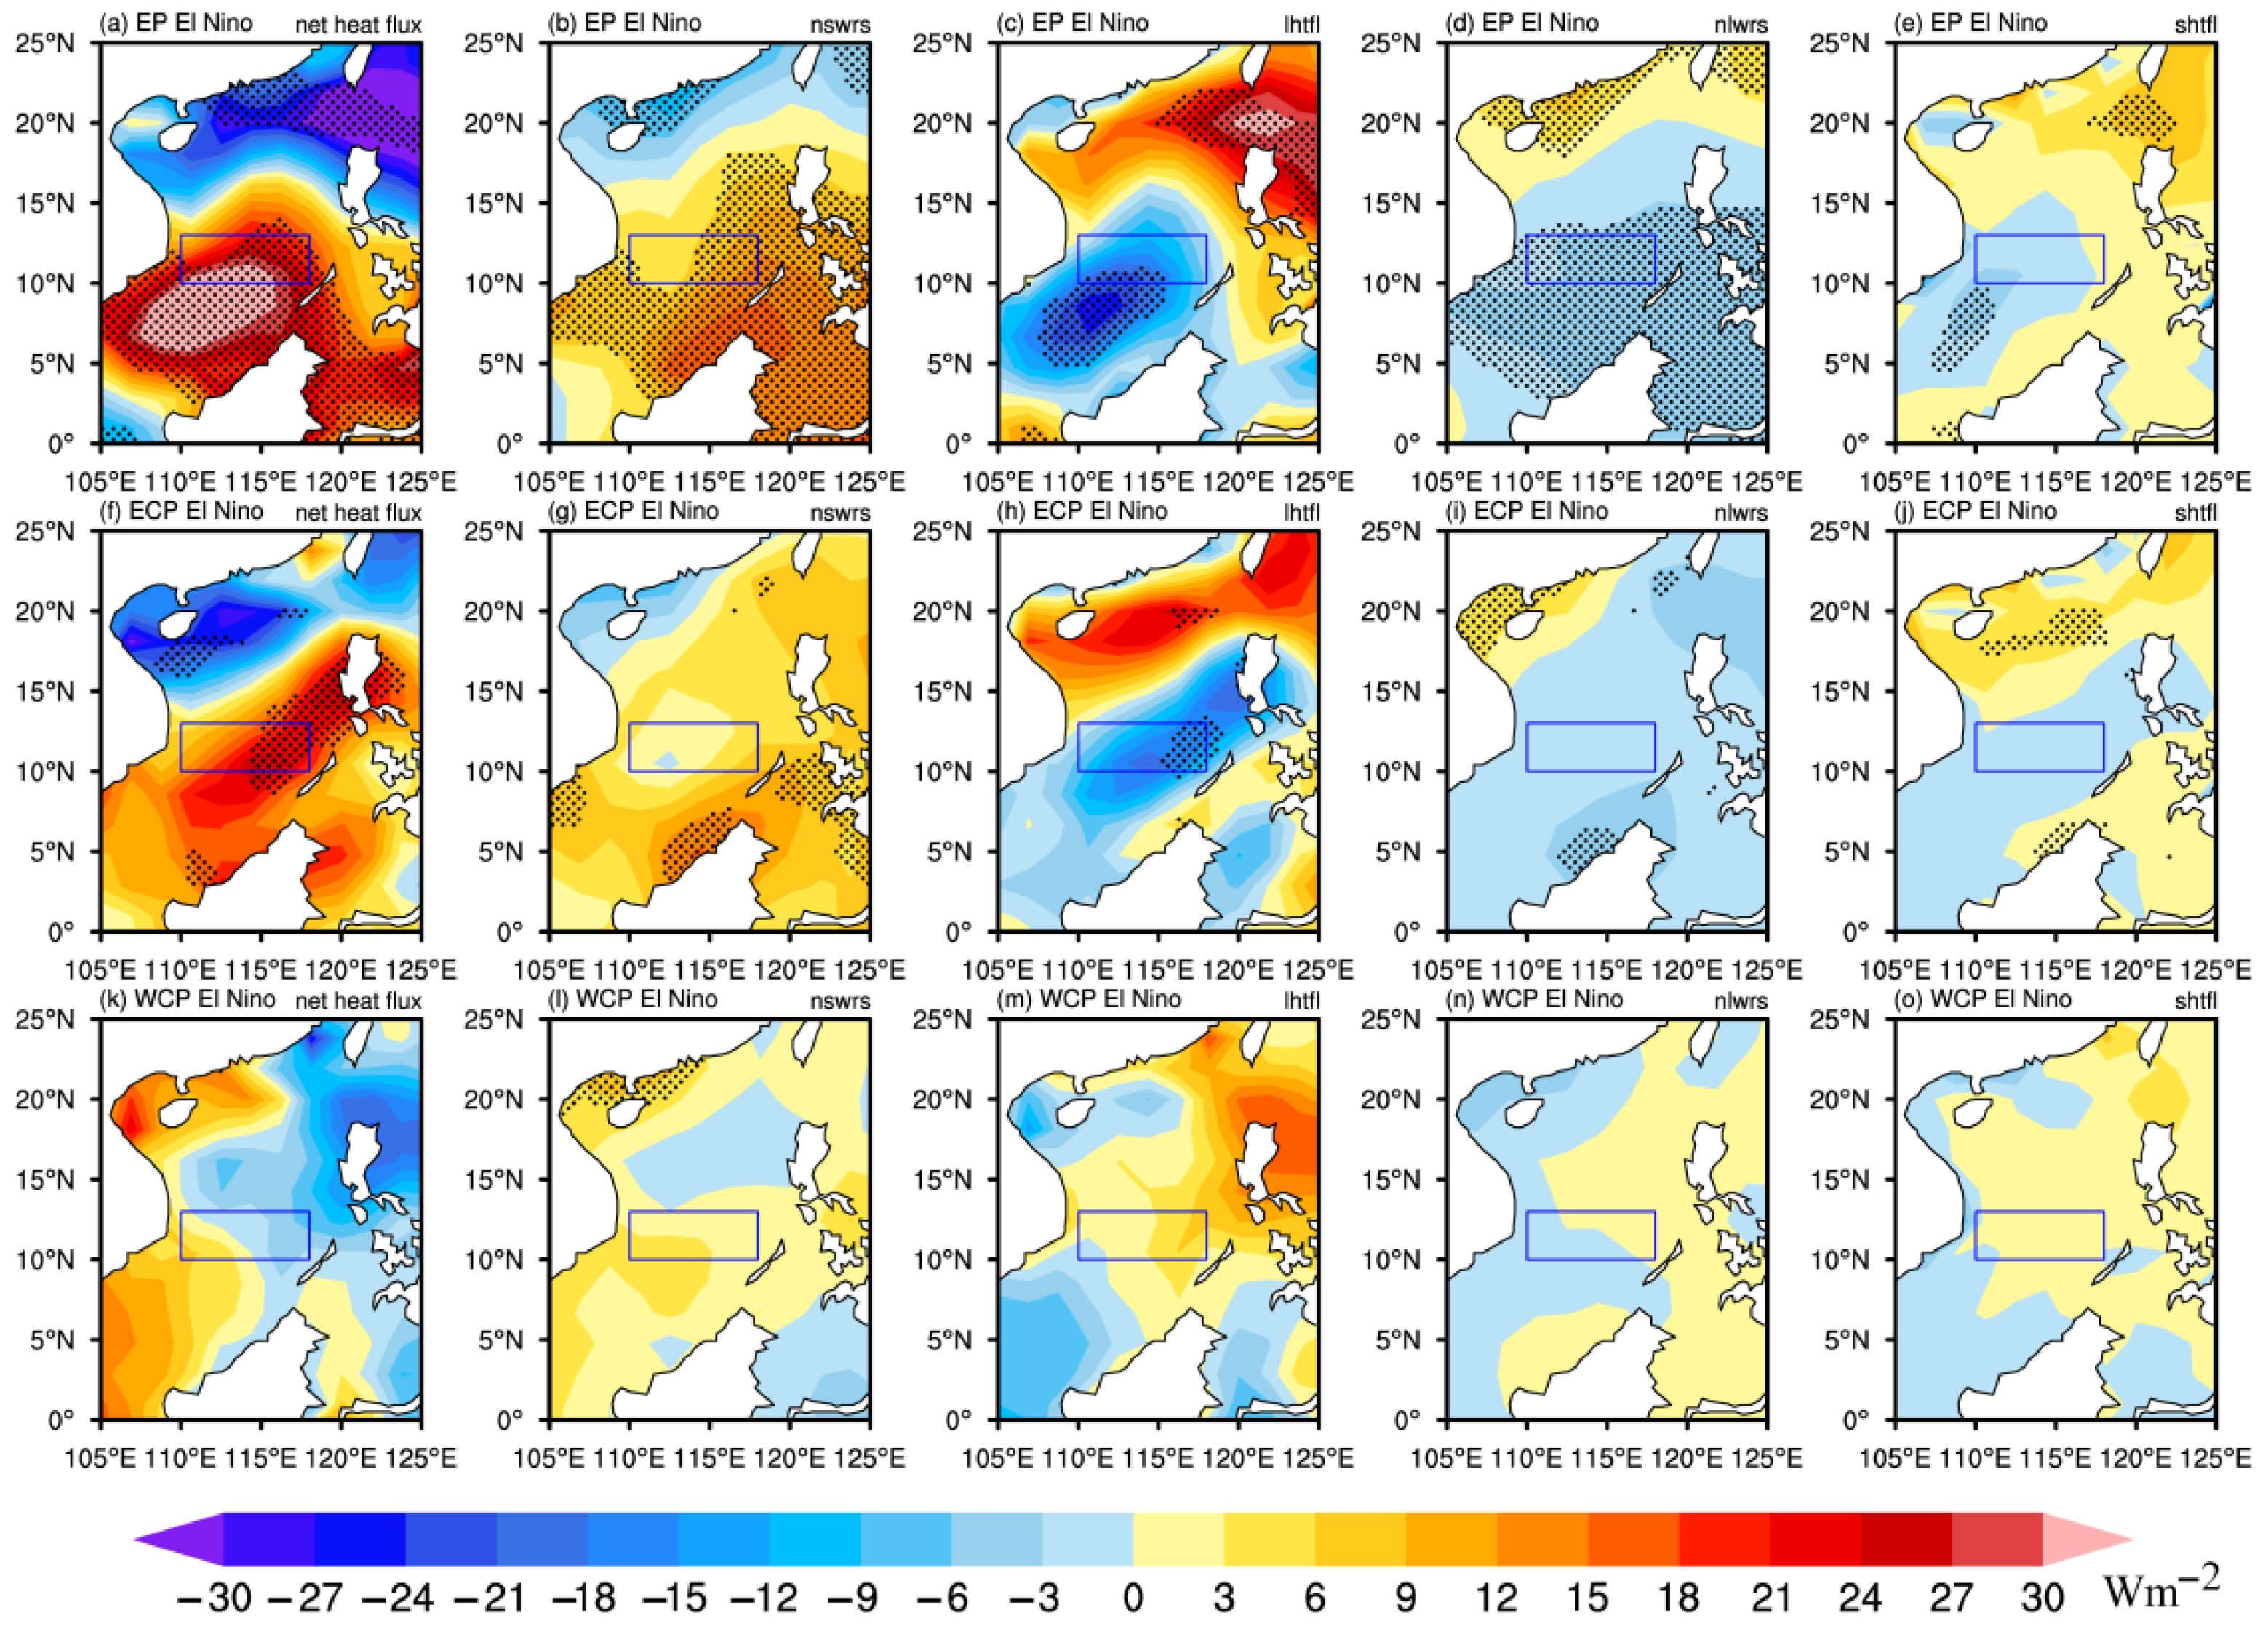
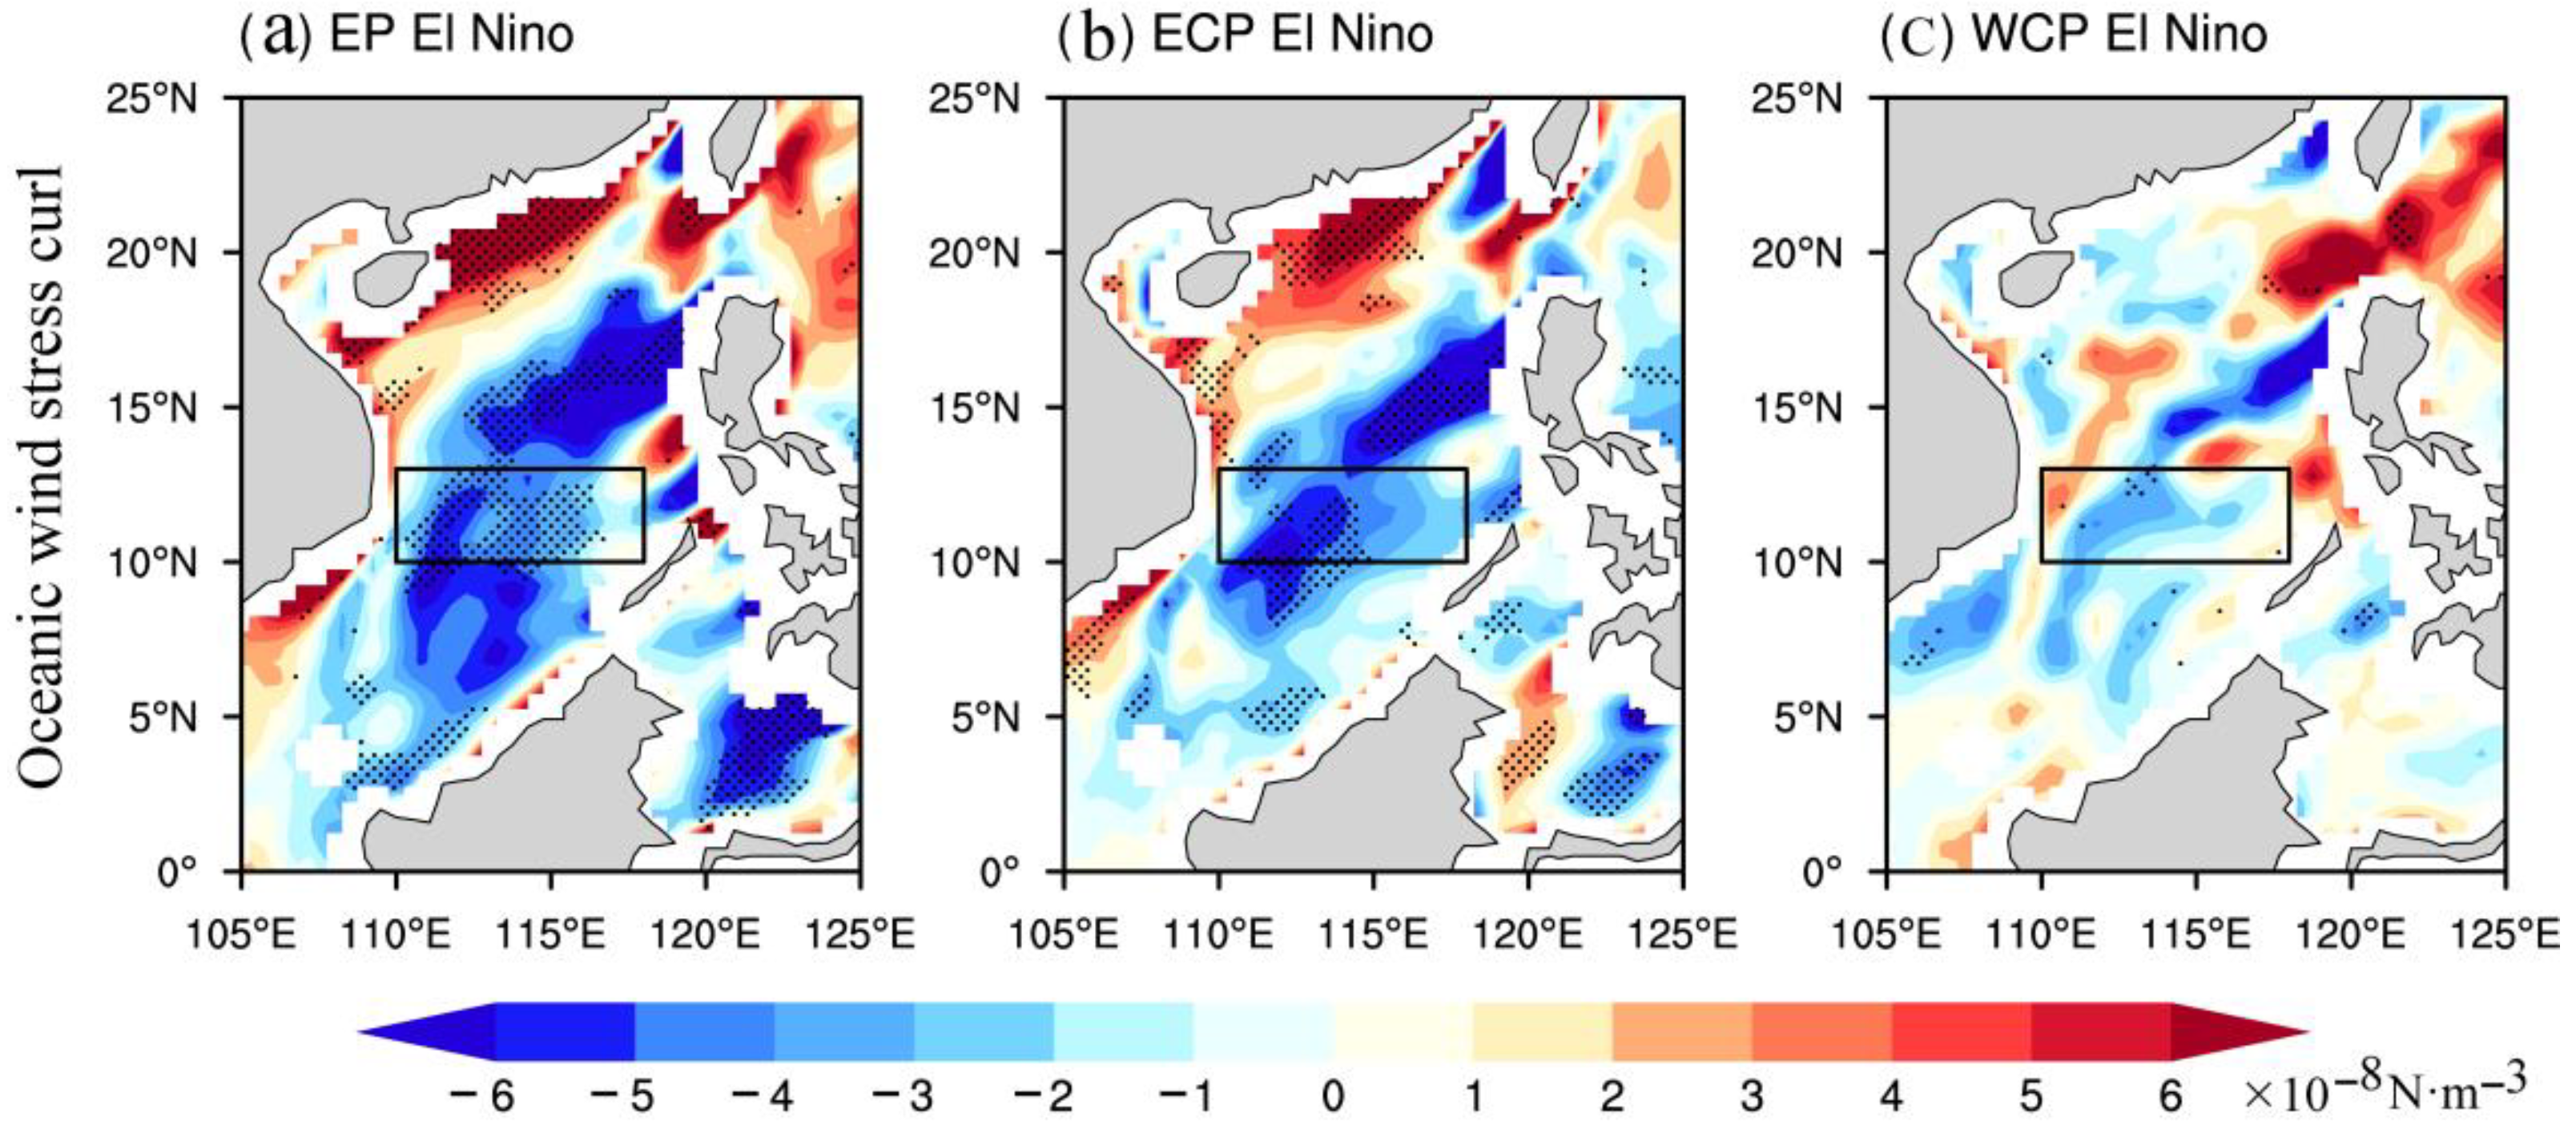
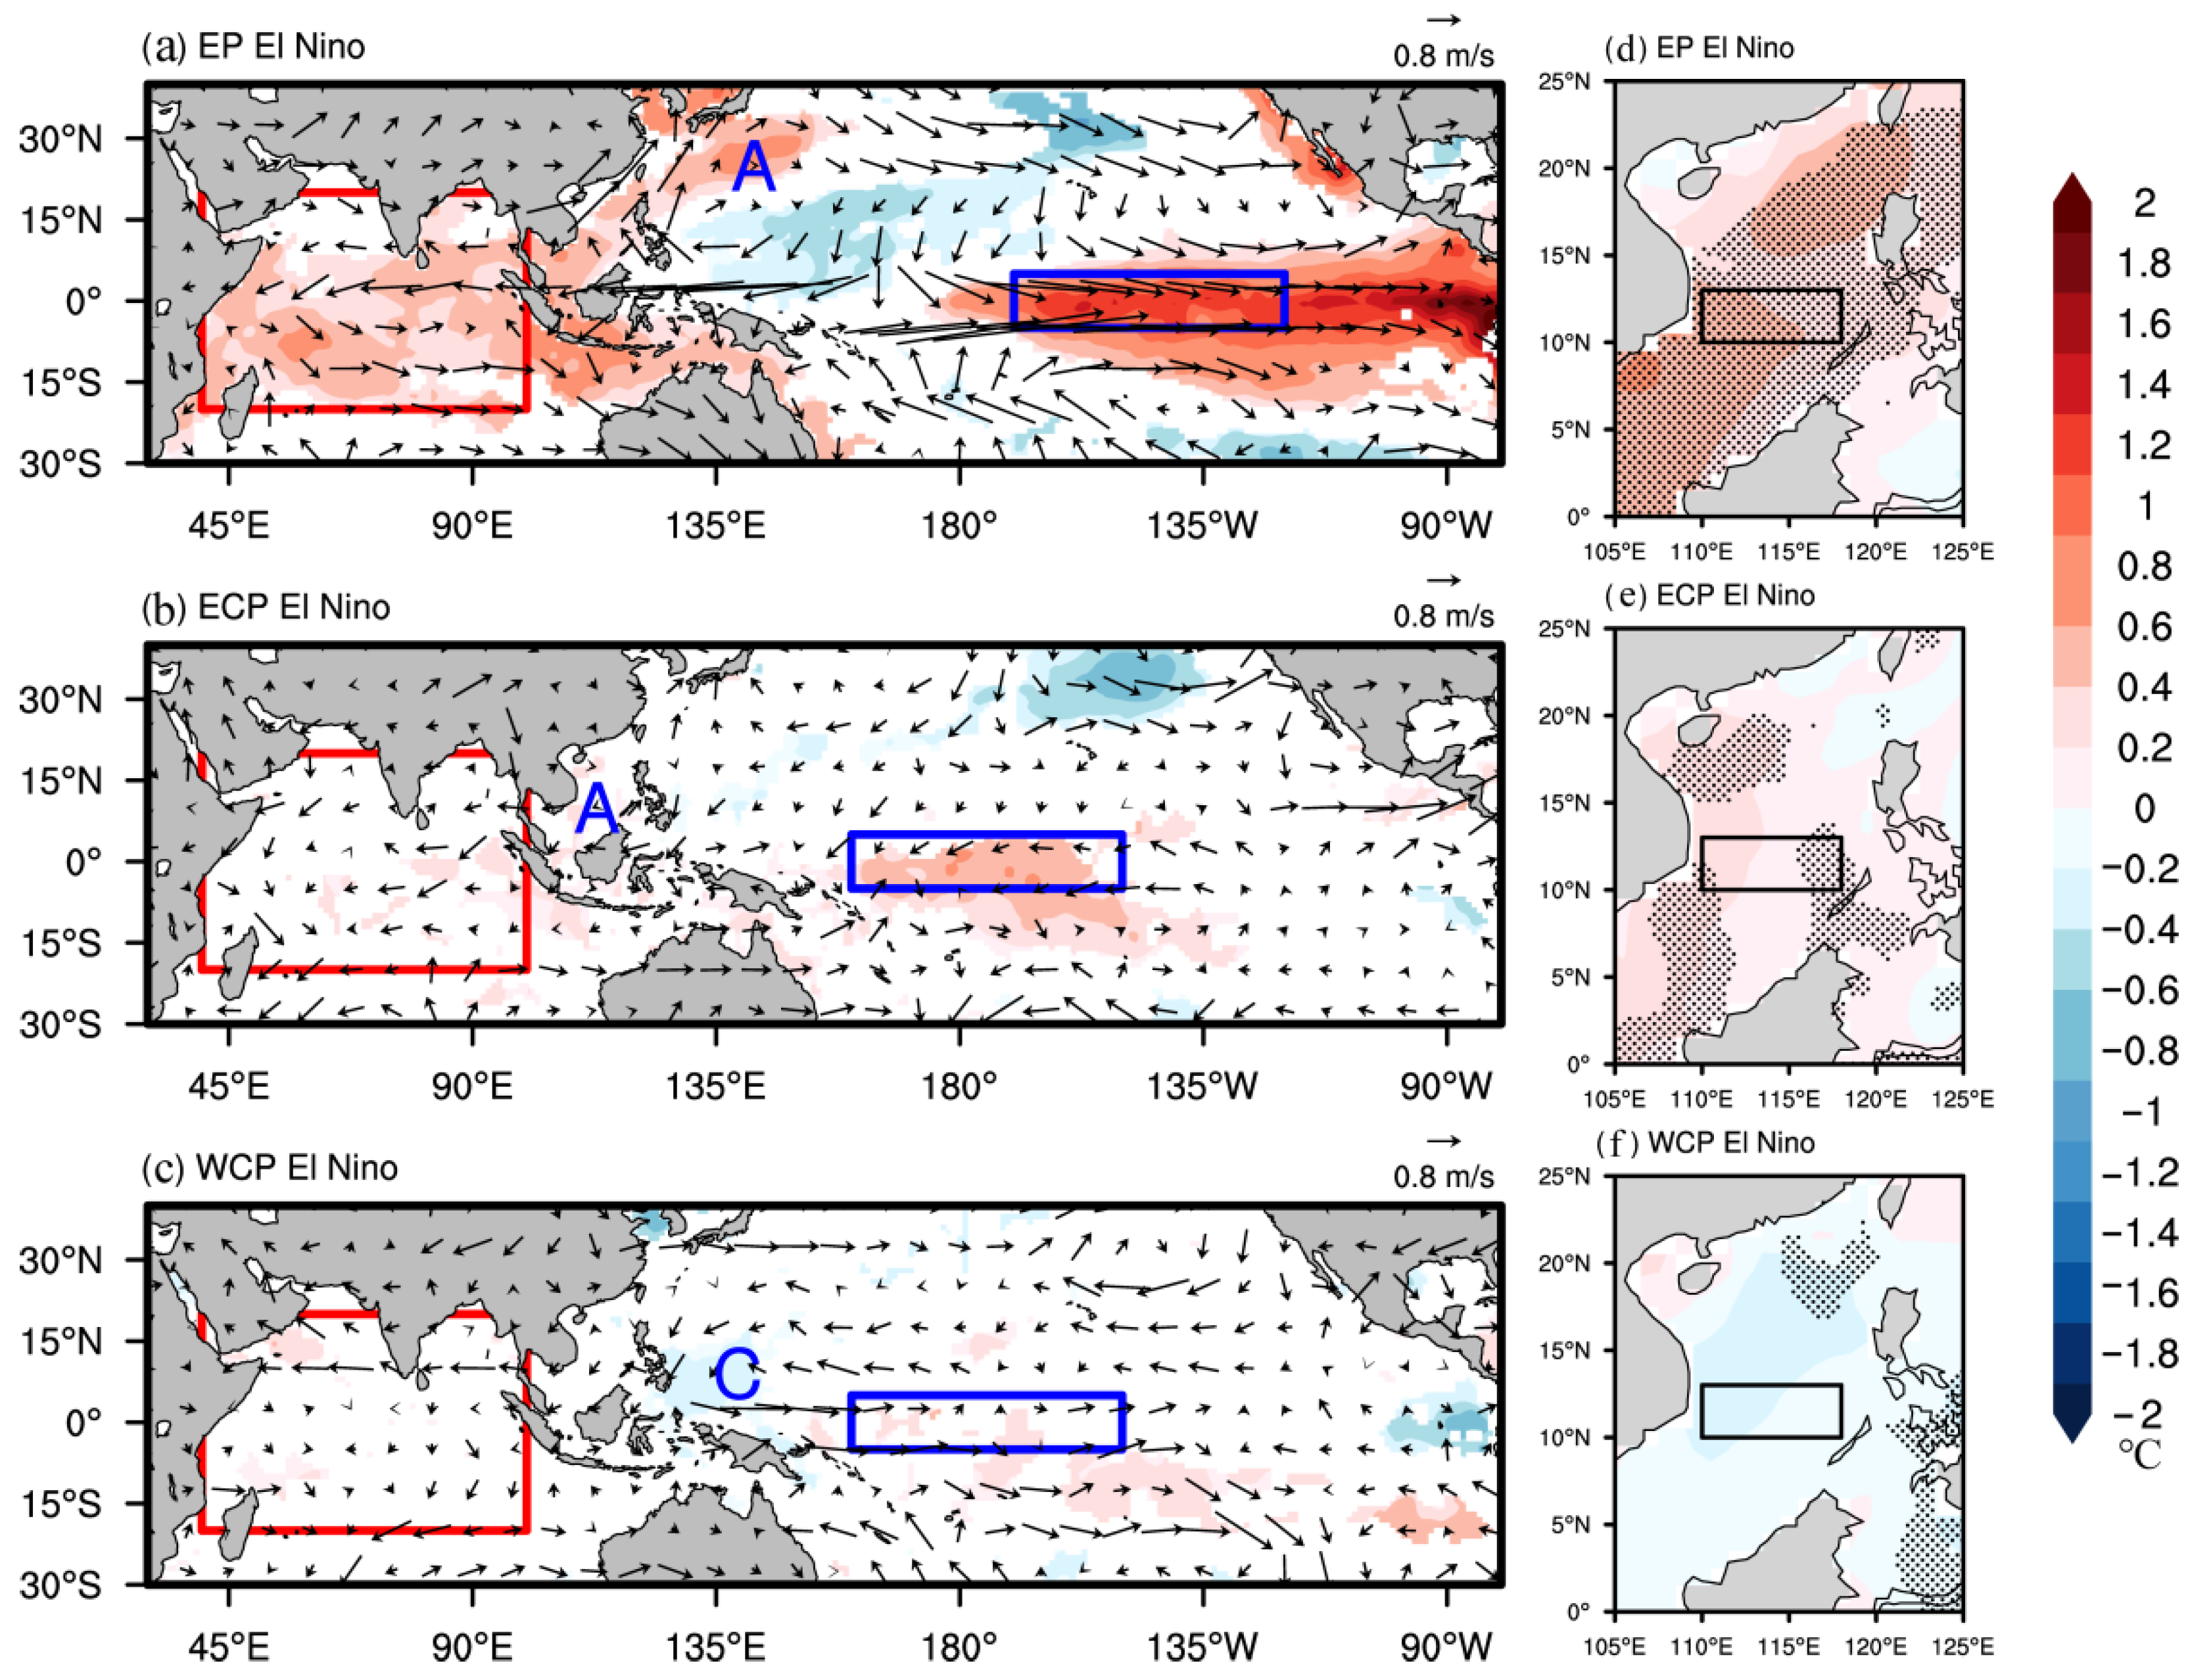
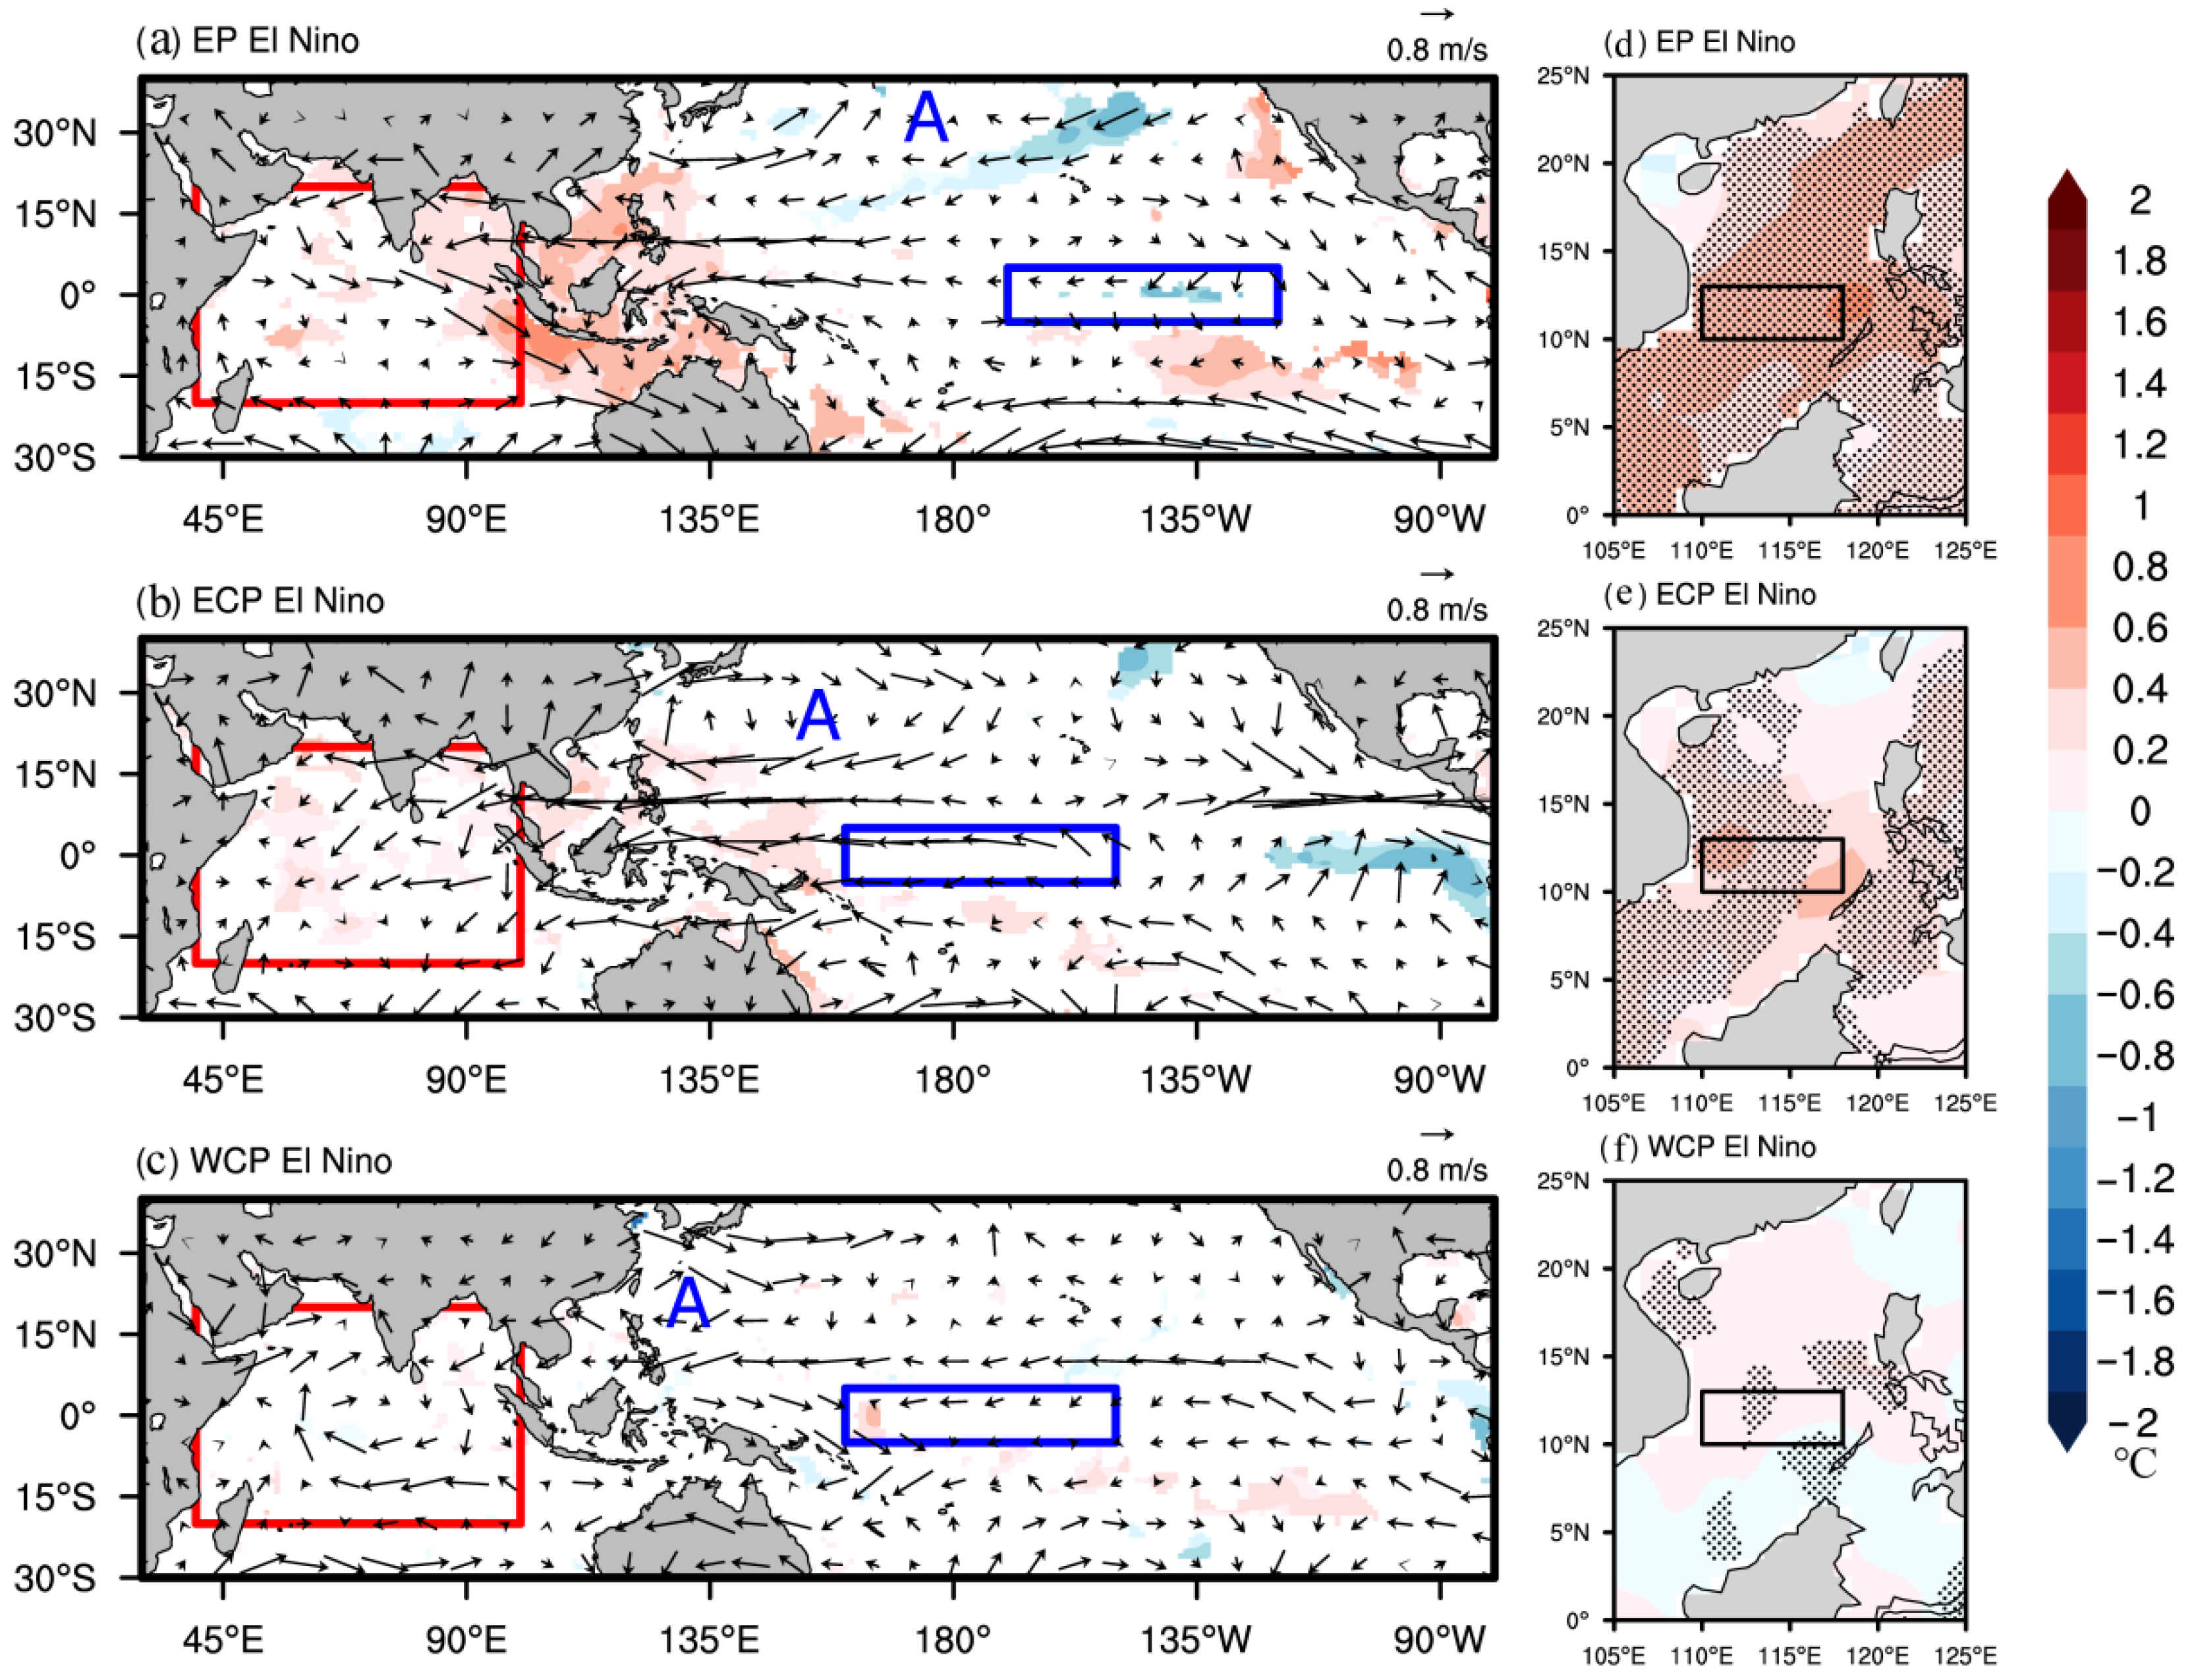
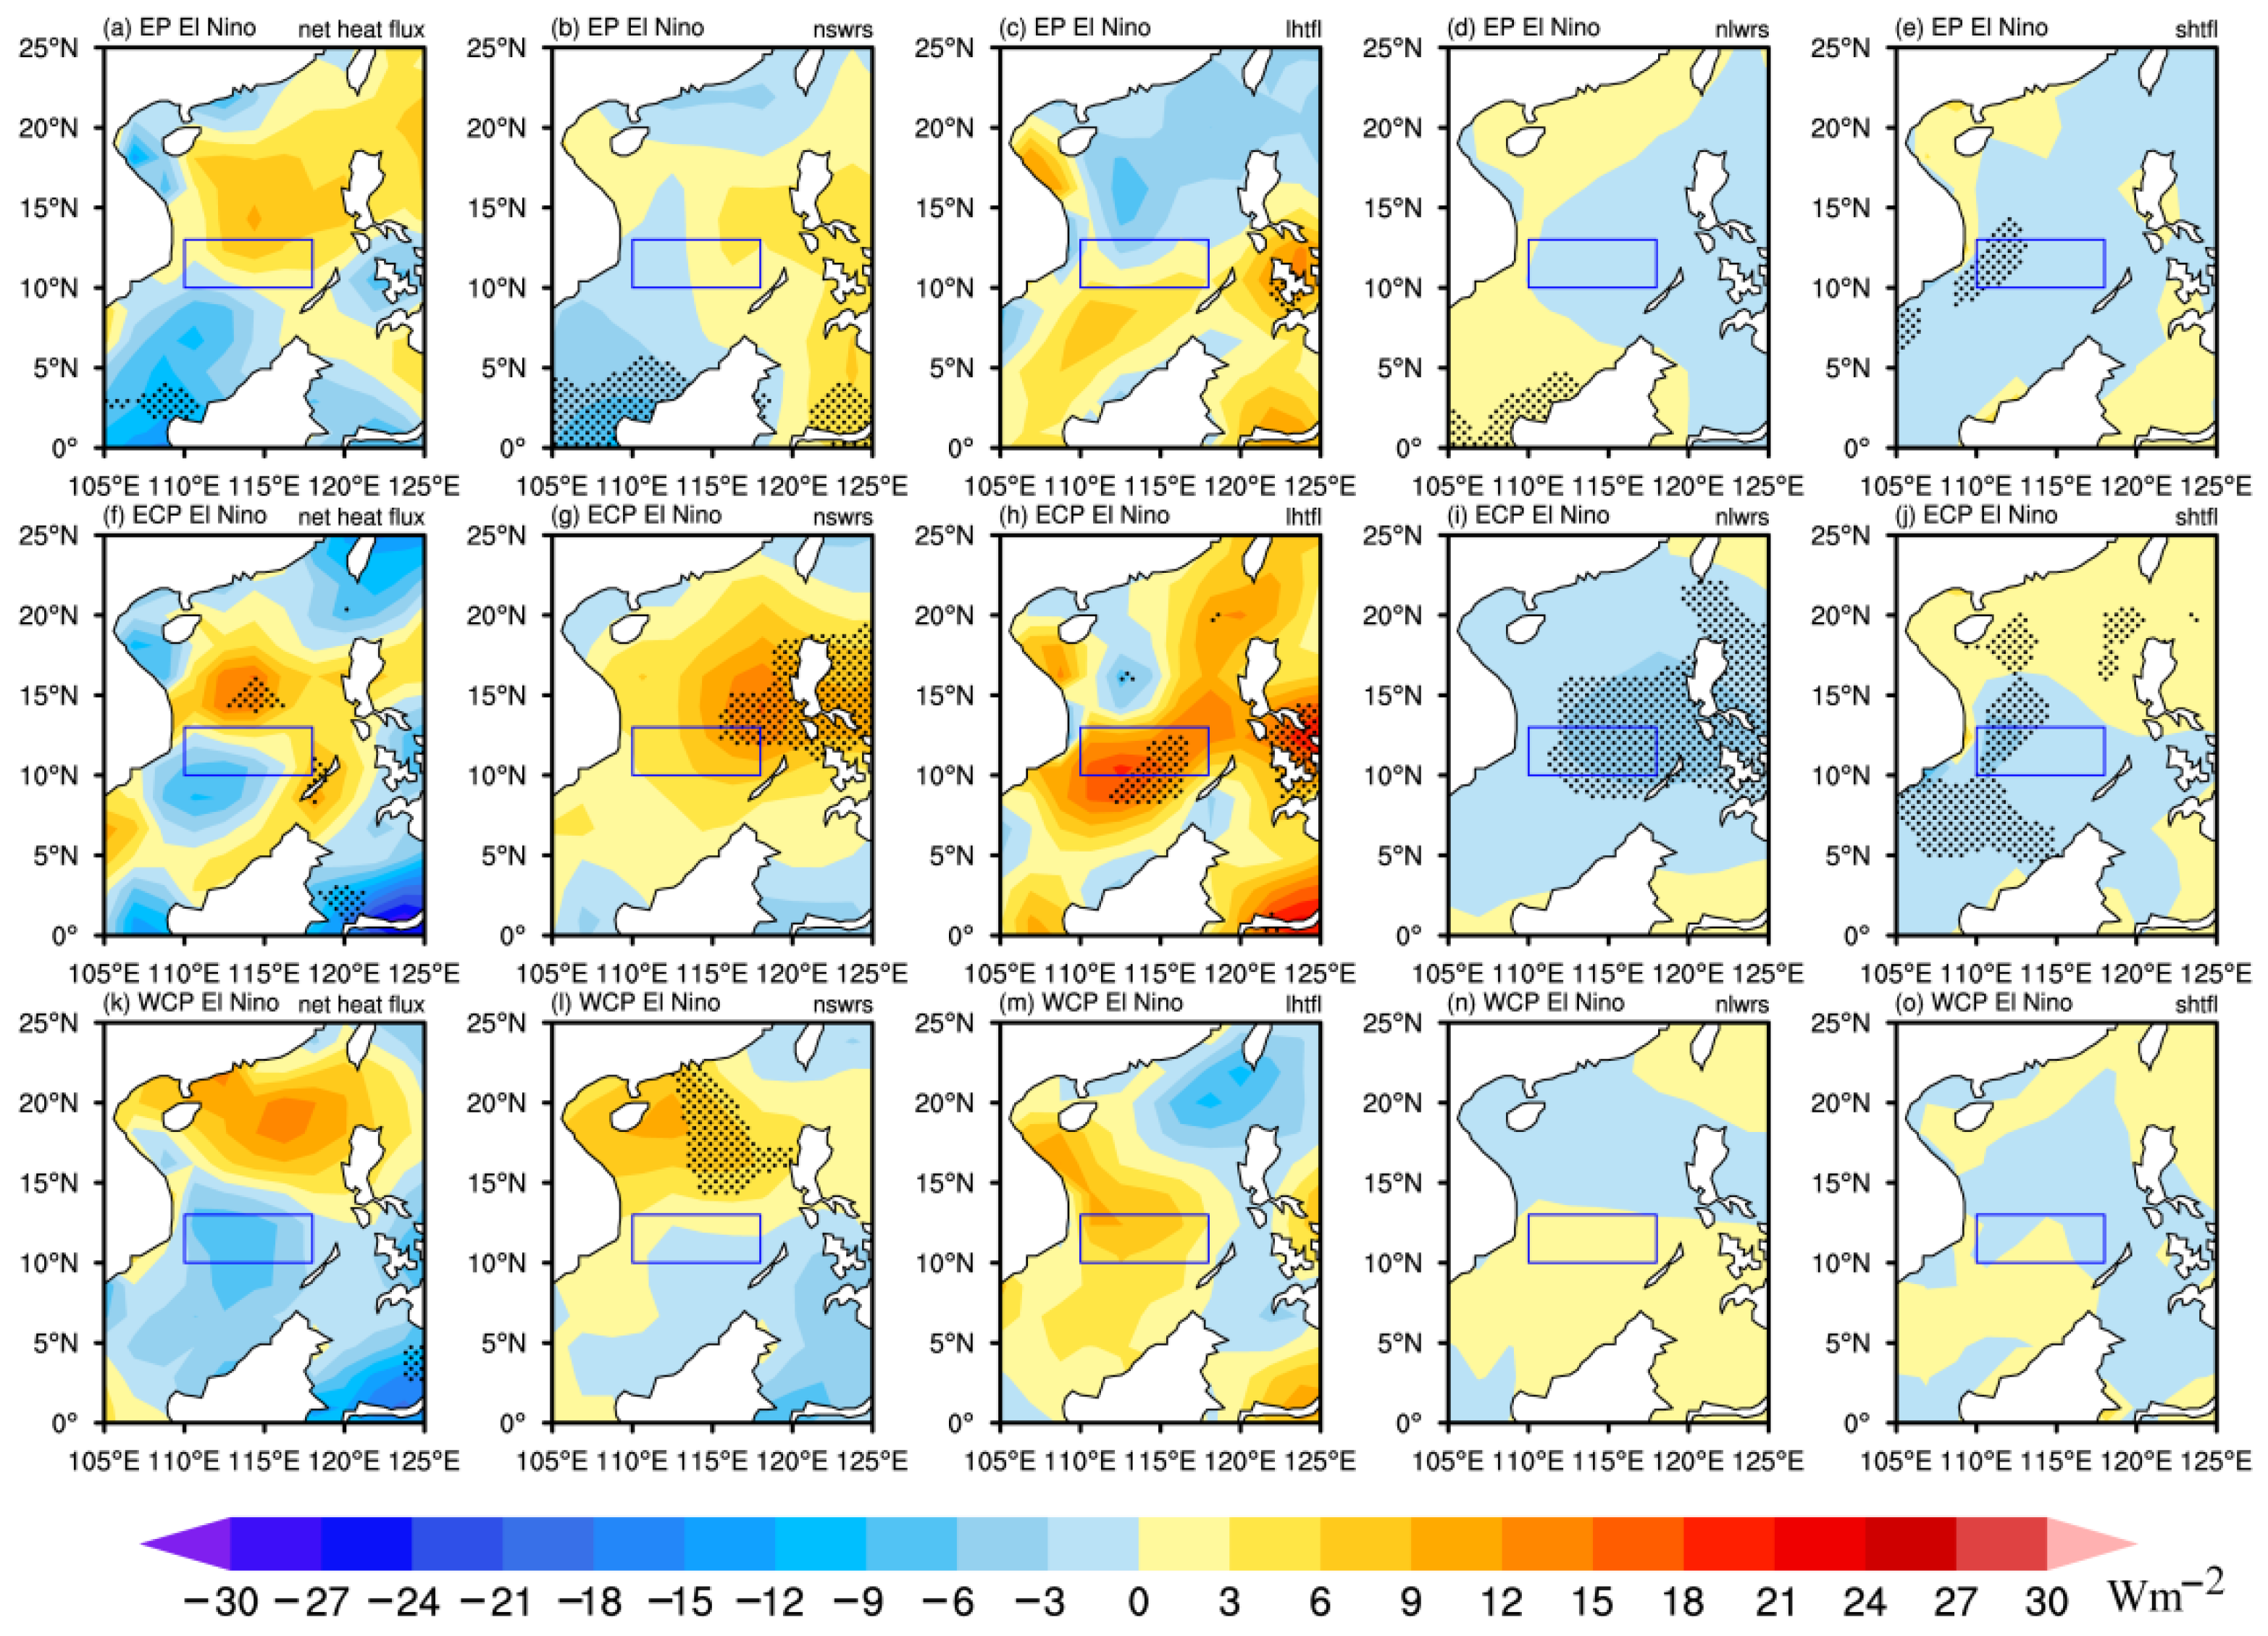
The composite DJF SSTA and corresponding 850 hPa wind anomalies during EP, ECP and WCP El Niño events are shown in Figure 4. A robust warm SSTA is present over the eastern tropical Pacific during EP El Niño events (Figure 4a). Accompanied by this warming, Walker circulation is dramatically weakened with anomalous westerly wind over the tropical Pacific and easterly wind over the tropical Indian Ocean. Thus, a powerful and extensive anomalous anticyclone is induced over WNP due to the ocean–air coupling over the Pacific–Indian Ocean [8,10,28,29,30]. Over the SCS region, just because of this WNP anomalous anticyclone, the suppressed convection allows the sky to clear and the ocean to receive more short-wave radiation from the atmosphere (Figure 5b), while less latent heat flux is released to the atmosphere simultaneously (Figure 5c). Therefore, the positive net heat flux warms the ocean and gives rise to a warm SSTA over the CT region (Figure 4d). Moreover, the WNP anomalous anticyclone also affects the ocean current, and the associated decreasing wind stress curl (Figure 6a) leads to an anomalous sinking motion and further makes a contribution to the warming of the CT SST.
For the ECP El Niño, its warm SSTA center is located westward to the middle tropical Pacific, mainly over the middle and east part of the Niño4 region (Figure 4b). Thus, the associated WNP anomalous anticyclone shifts westward and lies only over the SCS region. Meanwhile, the induced anomalous westerly wind over the tropical Pacific and anomalous easterly wind over the tropical Indian Ocean are both weaker relative to those of EP El Niño, with the latter further producing much weaker Indian Ocean warming. At last, the WNP anomalous anticyclone related to the ECP El Niño is weaker than that of the EP El Niño. As a consequence, this relatively weak WNP anomalous anticyclone gives rise to a weaker net heat flux, which is mainly contributed by the short-wave radiation absorbed and latent heat flux released (Figure 5). Certainly, the oceanic wind stress curl is also decreased (Figure 6b). Therefore, remarkable SST warming is also observed over the CT region during ECP El Niño, but its intensity is a bit weaker than EP El Niño (Figure 4e).
In sharp contrast, the WCP El Niño warm SSTA is located most westward, with the center located on the west edge of the Niño4 region (Figure 4c). Its strength is also the lowest of all El Niño events. Right now, the anomalous atmospheric circulation associated with El Niño is so weak that the WNP anomalous anticyclone could hardly be observed (Figure 4c). Thus, the heat flux (Figure 5) and oceanic wind stress curl (Figure 6c) do not have any significant response, finally having no influence on the SSTA over CT region. As a consequence, the CT SSTA is around normal during the winter of the WCP El Niño developing year (Figure 4f).
3.2.2. Spring
During the spring (MAM) of the El Niño decaying year, the composite SSTA distribution and anomalous wind field at 850 hPa are shown in Figure 7. Although the warm SSTA over Niño3.4 or Niño4 is decreasing from winter, the intensity of the EP El Niño is still higher than 1.0 °C (Figure 8). Thus, the anomalous westerly wind over the tropical Pacific and easterly wind over the tropical Indian Ocean still exist in the spring during the EP El Niño, as well as the Indian Ocean warming (Figure 7a).
However, the strength of ECP and WCP El Niño events are only below 0.2 °C (Figure 8). The associated anomalous atmospheric circulation is somewhat weaker than that of the EP El Niño. The Indian Ocean has no significant response to El Niño in terms of tropical wind and SSTA (Figure 7b,c and Figure 8). Therefore, due to the weak Rossby wave associated with El Niño warming and poor Kelvin wave related to weak Indian Ocean warming, the WNP anomalous anticyclone can hardly be found during ECP and WCP El Niño events (Figure 7b,c). The corresponding relative vorticity at 850 hPa over SCS is even positive during the WCP El Niño (Figure 8).
Relative to WCP El Niño events, the convection over SCS is still suppressed according to the OLR anomaly in the ECP El Niño (Figure 8), which leads to a positive short-wave anomaly and negative latent heat flux over SCS (Figure 9). Besides, the oceanic wind stress curl is still weakened during the spring. Therefore, the CT SST represents a weak warm anomaly in spring during the ECP El Niño (Figure 7e), while no significant signal is observed during the WCP El Niño (Figure 7f).
As a consequence, a conclusion could be made that the CT SST is also influenced by the El Niño event in spring by means of the same mechanism as that in winter; that is, the joint effect of the heat flux and oceanic wind stress curl.
3.2.3. Summer
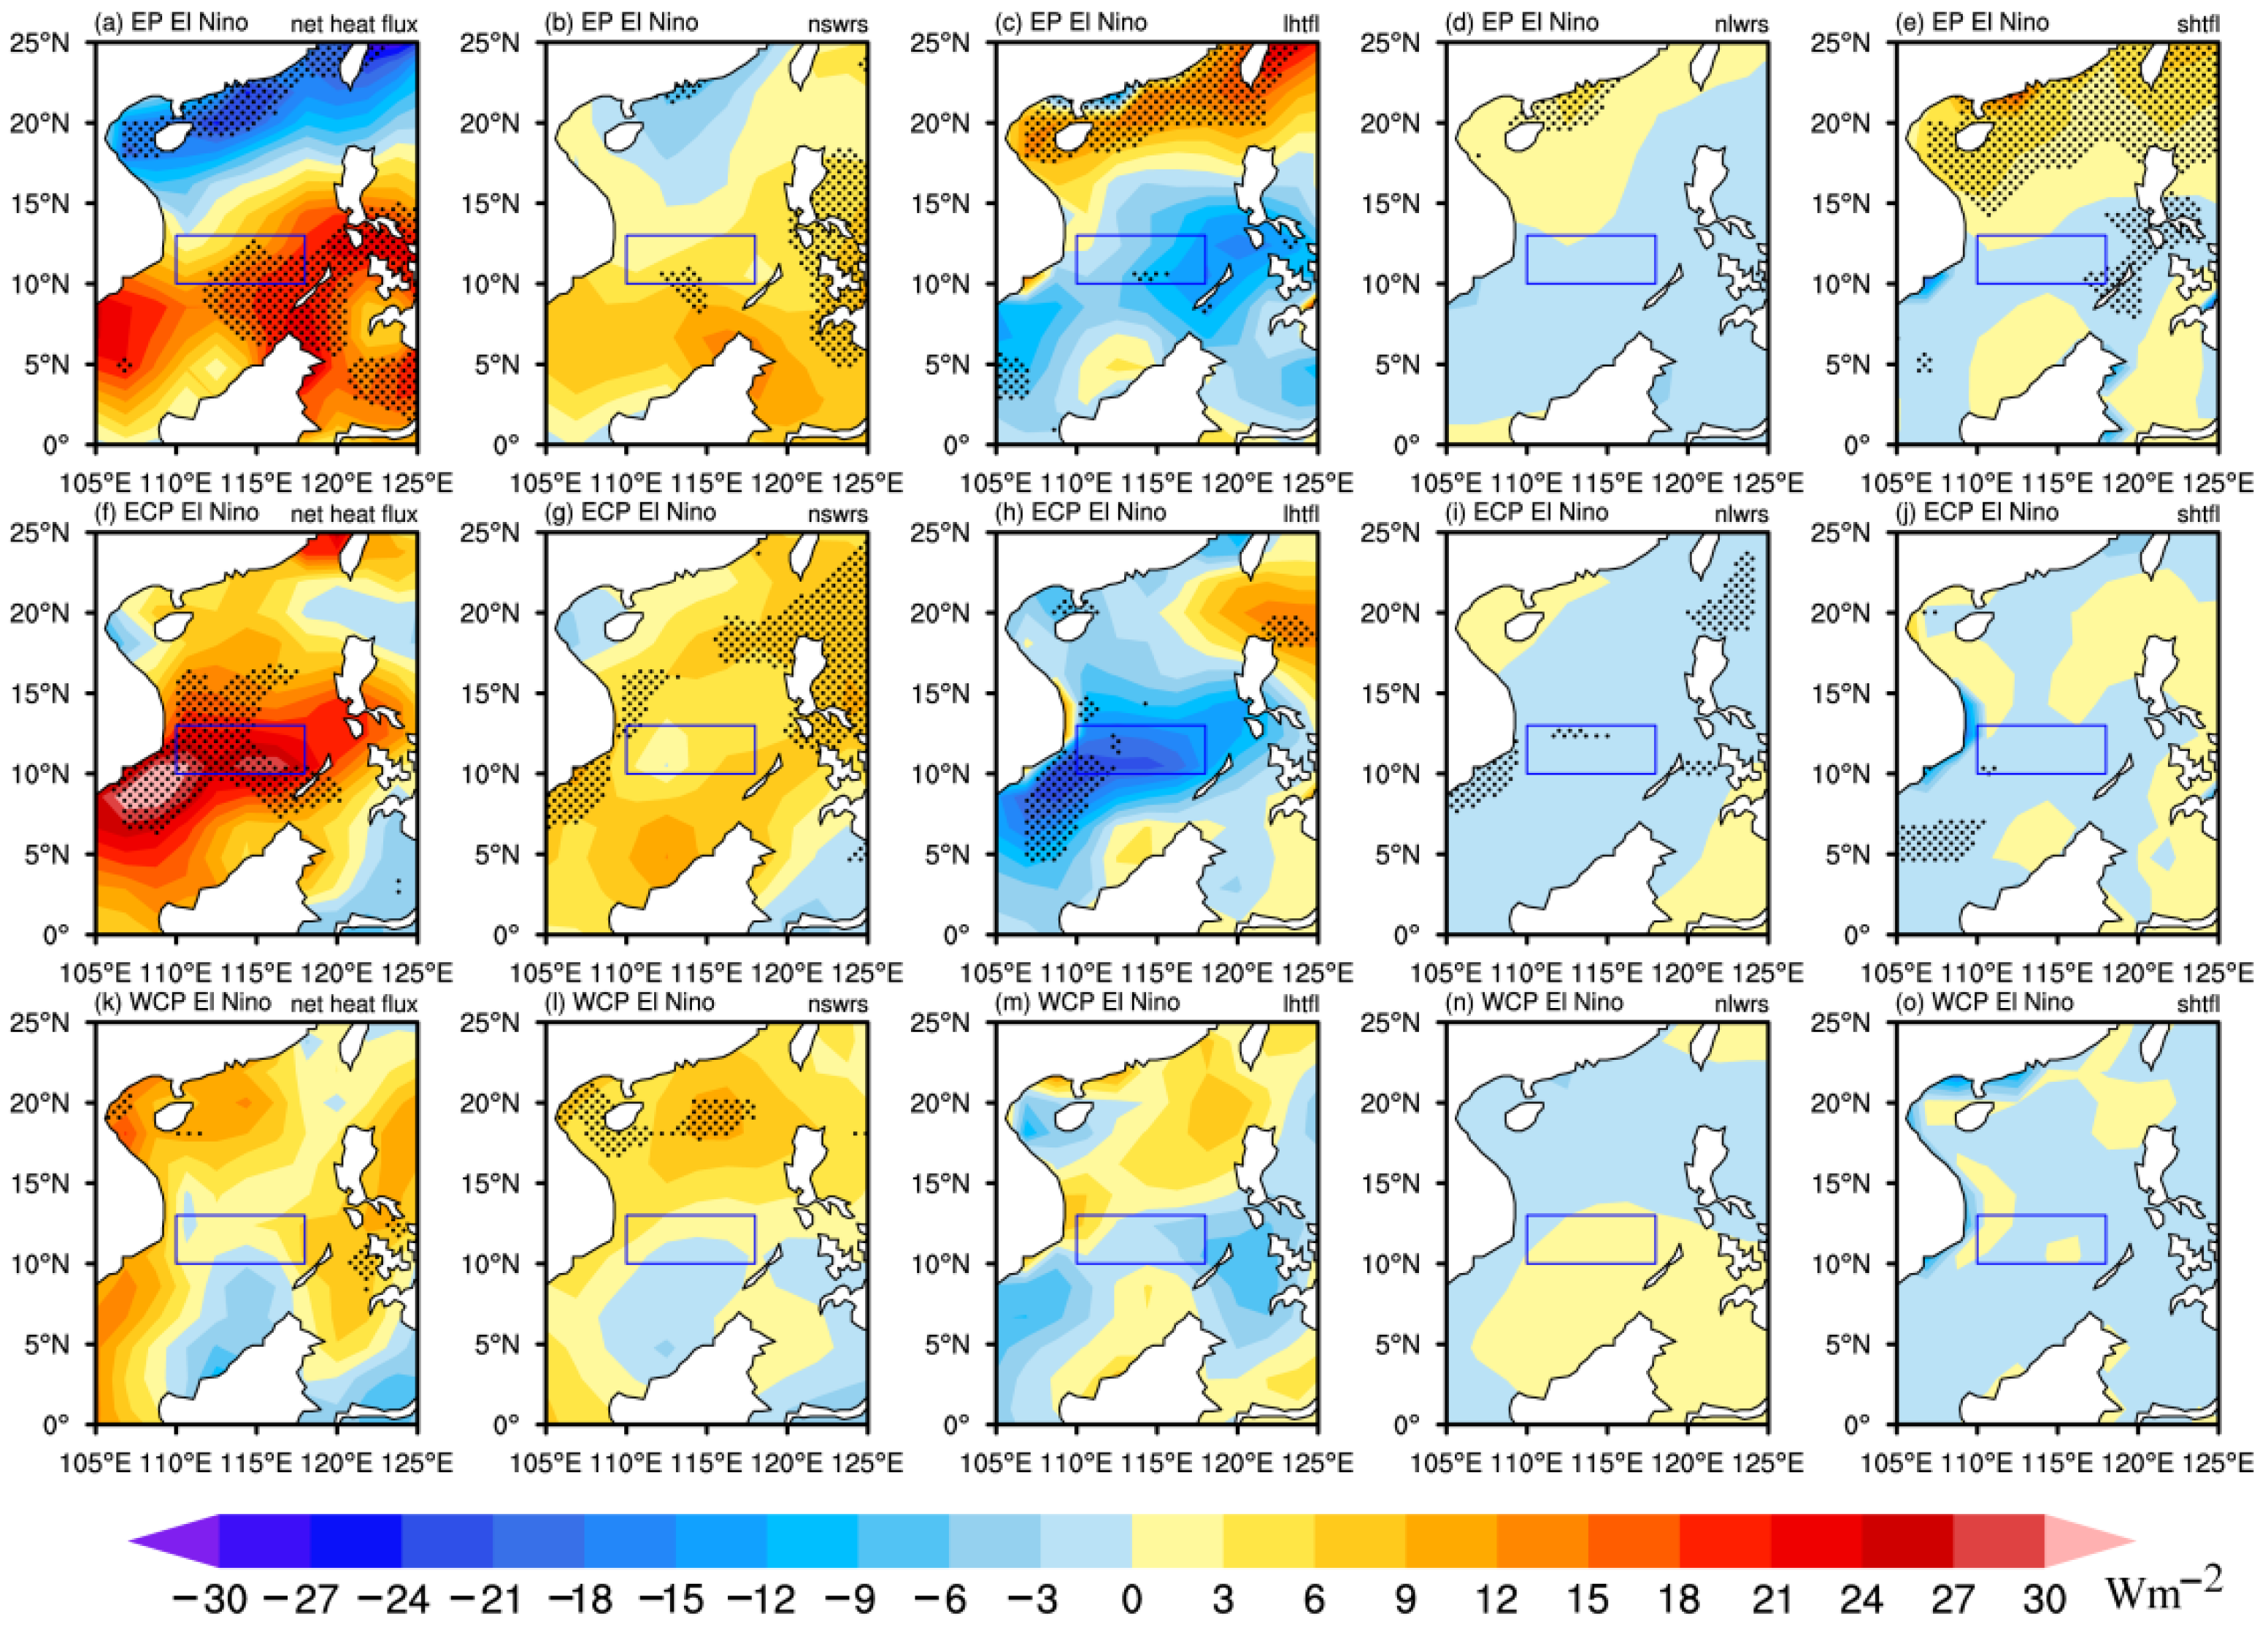
In the summer, the warm SSTA over the tropical eastern Pacific has turned to normal during the EP El Niño. Interestingly, weak cooling SSTA is found in the tropical central Pacific, forming a CP La Niña-like distribution (Figure 10a). In sharp contrast, the warm SSTA of the ECP El Niño also decays to the La Niña phase, but its cooling SSTA is located over the tropical eastern Pacific; that is, exhibiting an EP La Niña-like pattern (Figure 10b). Due to the forcing of the La Niña SSTA, at this moment, the SCS is still occupied by the WNP anomalous anticyclone both in EP El Niño and ECP El Niño events. A warm SSTA is clearly observed in the CT region (Figure 10d,e). However, the associated net heat flux over CT is not remarkable and does not significantly reach the 90% confidence level (Figure 11). This means that the second warming of the CT SST during EP El Niño and ECP El Niño events is not only formed by means of heat flux in atmosphere. In contrast, more latent heat flux is released in ECP El Niño than in EP El Niño events (Figure 11), which would lead to SST decreasing in the CT region. That is the reason that the CT warming during ECP El Niño is relatively weaker than that of EP El Niño. Therefore, this indicates that the atmospheric process exerts a negative role in CT warming in summer. This is in sharp contrast with the mechanism during winter and spring.
For WCP El Niño events, the associated warm SSTA located in the tropical Pacific decays almost to normal, with only a slightly higher SSTA than normal by 0.2 °C near 160° E (Figure 10c). The related WNP anomalous anticyclone shifts eastward to the east of Taiwan Island. Thus, there is a poor anomalous easterly wind found over the SCS, which would exert a low and unstable effect on the CT SST (Figure 11). As a consequence, the second warming peak of CT SST during WCP El Niño is not stable, only reaching the 90% confidence level in June (Figure 3 and Figure 10f).
4. Conclusions and Discussions
A region of colder sea surface temperature relative to its surroundings exists in the central part of the South China Sea during boreal summer, which is known as the South China Sea cold tongue. In this study, we concentrate on SST evolution over the CT region associated with varying El Niño events and their corresponding mechanisms. From the winter of the El Niño developing year to the following summer, the anomalous SST presents a double-peak warming evolution over the CT region. However, the intensity of the SSTA is weaker in CP El Niño events than that in EP El Niño events. Besides, in the CP El Niño, the SSTA does not turn positive until November and decreases sharply to negative on February with a short duration relative to the EP El Niño. Most importantly, in CP El Niño events, only the second warm peak in June–July is statistically significant, reaching a 90% confidence level. Zhang et al. [17,27] demonstrated that the atmospheric response over the Indian Ocean and East Asia is highly sensitive to the SSTA zonal location of the CP El Niño. However, the SST evolution of the cold tongue (CT) over the South China Sea is mainly focused on in our study because of its particular features and important climatic influence on its surroundings. For the ECP El Niño events, the CT SST has a similar double-warming evolution with a comparable intensity to that in EP El Niño events. In sharp contrast, for the WCP El Niño events, the CT SSTA is below normal all the time during the developing and decaying period of El Niño, except in June.
Further analysis reveals that the weak and insignificant SST anomaly over the CT region in CP El Niño events is caused by the faint SSTA response during CP El Niño events, with a warm SSTA located west of 175° E (called WCP El Niño events). During those CP El Niño events, the heat flux and oceanic wind stress curl over the CT do not have any significant response and have no influence on the SSTA due to the weak WNP anticyclone related with El Niño. As a consequence, for WCP El Niño, the CT SSTA is nearly around normal during the winter of the developing year and also has no significant signal during the spring of the decaying year. In sharp contrast, for those CP El Niño events with a warm SSTA located east of 175° E (called ECP El Niño events), the corresponding SSTA over the CT region exhibits a similar evolution with a comparable intensity to that of EP El Niño events.
In summer, there are La Niña-like SST distributions in EP and ECP El Niño events, favoring the maintenance of the WNP anticyclone. Thus, the warm SSTA is still clearly observed in the CT region. For WCP El Niño events, the related WNP anomalous anticyclone shifts eastward to the east of Taiwan Island, exerting a low and unstable effect on the CT region SST. It is worth noting that the atmospheric process exerts a negative role in CT warming in summer, in sharp contrast with the mechanism during winter and spring.
Our results call attention to the response of SCS climate in both atmosphere and ocean to the diversity of ENSO, especially the CP El Niño. Our work reveals that the weak and insignificant SST anomaly over the CT region in CP El Niño events is caused by the faint SSTA response during the WCP El Niño events. Therefore, against the background of global warming, the frequent activity of CP El Niño events would give rise to more uncertainty and complexity in SCS climate forecasts in the future. Certainly, it is necessary to verify the findings of our work further by simulations of CGCM. The relative contributions of the atmospheric and oceanic process are also necessary to diagnose quantificationally and compare.
Furthermore, Figure 3 demonstrated that, except for the location of the warm SSTA, the intensity of CP El Niño events may also make a contribution to the contrasting features between WCP and ECP El Niño events. The values of the warm SSTA are all under 1 °C during WCP El Niño events but greater than 1 °C during all ECP El Niño events. The location difference between the WCP and ECP El Niño events is mainly focused on in our work; however, the level of the contribution that this intensity difference makes is also necessary to confirm in further work.
Author Contributions
M.W. and L.Q. carried out the concepts and design. M.W. and L.Q. contributed to the methodology and writing—original draft. M.W. performed the data analysis. All authors have read and agreed to the published version of the manuscript.
Funding
This work was jointly supported by the National Key R&D Program on Monitoring, Early Warning and Prevention of Major Natural Disaster (2017YFA0603803) and Technology Innovation project of Hainan Meteorological Bureau (hnqxSJ202125).
Institutional Review Board Statement
Not applicable.
Informed Consent Statement
Not applicable.
Data Availability Statement
All datasets presented in this study are included in the article.
Conflicts of Interest
The authors declare that the research was conducted in the absence of any commercial or financial relationships that could be construed as a potential conflict of interest.
References
- Lestari, R.K.; Watanabe, M.; Kimoto, M. Role of Air-Sea Coupling in the Interannual Variability of the South China Sea Summer Monsoon. J. Meteorol. Soc. Jpn. 2011, 89, 283–290. [Google Scholar] [CrossRef] [Green Version]
- He, Z.; Wu, R. Coupled seasonal variability in the South China Sea. J. Oceanogr. 2012, 69, 57–69. [Google Scholar] [CrossRef]
- Wang, C.; Wang, W.; Wang, D.; Wang, Q. Interannual variability of the South China Sea associated with El Niño. J. Geophys. Res. Space Phys. 2006, 111, 03023. [Google Scholar] [CrossRef]
- Wyrtki, K. Physical Oceanography of the Southeastern Asia waters. Scientific results of marine investigations of the South China Sea and Gulf of Thailand. Naga Rep. 1961, 2, 195. [Google Scholar]
- Xie, S.-P.; Xie, Q.; Wang, D.; Liu, W.T. Summer upwelling in the South China Sea and its role in regional climate variations. J. Geophys. Res. Space Phys. 2003, 108. [Google Scholar] [CrossRef] [Green Version]
- Thompson, B.; Tkalich, P.; Malanotte-Rizzoli, P.; Fricot, B.; Mas, J. Dynamical and thermodynamical analysis of the South China Sea winter cold tongue. Clim. Dyn. 2016, 47, 1629–1646. [Google Scholar] [CrossRef] [Green Version]
- Tomita, T.; Yasunari, T. Role of the Northeast Winter Monsoon on the Biennial Oscillation of the ENSO/Monsoon System. J. Meteorol. Soc. Jpn. 1996, 74, 399–413. [Google Scholar] [CrossRef] [Green Version]
- Yang, J.; Liu, Q.; Xie, S.-P.; Liu, Z.; Wu, L. Impact of the Indian Ocean SST basin mode on the Asian summer monsoon. Geophys. Res. Lett. 2007, 34, 02708. [Google Scholar] [CrossRef] [Green Version]
- Du, Y.; Xie, S.P.; Huang, G.; Hu, K. Role of Air-Sea Interaction in the Long Persistence of El Niño-Induced North Indian Ocean Warming. J. Climate. 2009, 22, 2023–2038. [Google Scholar] [CrossRef] [Green Version]
- Xie, S.-P.; Hu, K.; Hafner, J.; Tokinaga, H.; Du, Y.; Huang, G.; Sampe, T. Indian Ocean Capacitor Effect on Indo–Western Pacific Climate during the Summer following El Niño. J. Clim. 2009, 22, 730–747. [Google Scholar] [CrossRef]
- Lau, N.-C.; Nath, M.J. A Model Investigation of the Role of Air–Sea Interaction in the Climatological Evolution and ENSO-Related Variability of the Summer Monsoon over the South China Sea and Western North Pacific. J. Clim. 2009, 22, 4771–4792. [Google Scholar] [CrossRef] [Green Version]
- Yu, Y.; Zhang, H.-R.; Jin, J.; Wang, Y. Trends of sea surface temperature and sea surface temperature fronts in the South China Sea during 2003–2017. Acta Oceanol. Sin. 2019, 38, 106–115. [Google Scholar] [CrossRef]
- Wang, Z.; Wu, R. Individual and combined impacts of ENSO and East Asian winter monsoon on the South China Sea cold tongue intensity. Clim. Dyn. 2021, 56, 3995–4012. [Google Scholar] [CrossRef]
- Ashok, K.; Behera, S.K.; Rao, S.A.; Weng, H.; Yamagata, T. El Niño Modoki and its possible teleconnection. J. Geophys. Res. Ocean. 2007, 112. [Google Scholar] [CrossRef]
- Yu, J.-Y.; Kim, S.T. Three evolution patterns of Central-Pacific El Niño. Geophys. Res. Lett. 2010, 37. [Google Scholar] [CrossRef] [Green Version]
- Kim, S.T.; Yu, J.-Y. The two types of ENSO in CMIP5 models. Geophys. Res. Lett. 2012, 39, 11704. [Google Scholar] [CrossRef] [Green Version]
- Zhang, W.J.; Jin, F.F.; Stuecker, M.F.; Turner, A.G. Impact of different El Niño types on the El Niño/IOD relationship. Geophys. Res. Lett. 2015, 42, 8570–8576. [Google Scholar] [CrossRef] [Green Version]
- Chen, G.; Tam, C.Y. Different impacts of two kinds of Pacific Ocean warming on tropical cyclone frequency over the western North Pacific. Geophys. Res. Lett. 2010, 37, L01803. [Google Scholar] [CrossRef] [Green Version]
- Weng, H.; Wu, G.; Liu, Y.; Behera, S.K.; Yamagata, T. Anomalous summer climate in China influenced by the tropical Indo-Pacific Oceans. Clim. Dyn. 2011, 36, 769–782. [Google Scholar] [CrossRef] [Green Version]
- Liu, Q.-Y.; Wang, D.; Wang, X.; Shu, Y.; Xie, Q.; Chen, J. Thermal variations in the South China Sea associated with the eastern and central Pacific El Niño events and their mechanisms. J. Geophys. Res. Oceans 2014, 119, 8955–8972. [Google Scholar] [CrossRef]
- Tan, W.; Wang, X.; Wang, W.; Wang, C.; Zuo, J. Different Responses of Sea Surface Temperature in the South China Sea to Various El Niño Events during Boreal Autumn. J. Clim. 2016, 29, 1127–1142. [Google Scholar] [CrossRef]
- Wang, C.; Wang, X. Classifying El Niño Modoki I and II by Different Impacts on Rainfall in Southern China and Typhoon Tracks. J. Clim. 2013, 26, 1322–1338. [Google Scholar] [CrossRef]
- Chen, M.; Yu, J.Y.; Wang, X.; Jiang, W. The changing impact mechanisms of a diverse El Niño on the Western Pacific Sub-tropical high. Geophys. Res. Lett. 2019, 46, 953–962. [Google Scholar] [CrossRef] [Green Version]
- Kim, J.W.; Chang, T.H.; Lee, C.T.; Yu, J.Y. On the varying responses of East Asian winter monsoon to three types of El Niño, Observations and Model Hindcasts. J. Clim. 2021, 34, 4089–4101. [Google Scholar] [CrossRef]
- Rayner, N.A.; Parker, D.E.; Horton, E.B.; Folland, C.K.; Alexander, L.V.; Rowell, D.P.; Kent, E.C.; Kaplan, A. Global analyses of sea surface temperature sea ice and night marine air temperature since the late nine-teenth century. J. Geophys. Res. 2003, 108, 4407. [Google Scholar] [CrossRef]
- Kalnay, E.; Kanamitsu, M.; Kistler, R.; Collins, W.G.; Deaven, D.; Gandin, L.S.; Iredell, M.; Saha, S.; White, G.; Woollen, J.; et al. The NCEP/NCAR reanalysis project. Bull. Am. Meteor. Soc. 1996, 77, 437–471. [Google Scholar] [CrossRef] [Green Version]
- Zhang, W.; Jin, F.-F.; Zhao, J.-X.; Qi, L.; Ren, H.-L. The Possible Influence of a Nonconventional El Niño on the Severe Autumn Drought of 2009 in Southwest China. J. Clim. 2013, 26, 8392–8405. [Google Scholar] [CrossRef]
- Wang, B.; Wu, R.; Fu, X. Pacific-East Asian teleconnection, how does ENSO affect East Asian climate? J. Clim. 2000, 13, 1517–1536. [Google Scholar] [CrossRef]
- Stuecker, M.F.; Timmermann, A.; Jin, F.F.; Mcgregor, S.; Ren, H.L. A combination mode of the annual cycle and the El Ni-ño/Southern Oscillation. Nat. Geosci. 2013, 6, 540–544. [Google Scholar] [CrossRef] [Green Version]
- Stuecker, M.F.; Jin, F.F.; Timmermann, A.; McGregor, S. Combination mode dynamics of the anomalous Northwest Pacifific anticyclone. J. Clim. 2015, 28, 1093–1111. [Google Scholar] [CrossRef]
Figure 1.
Climatological monthly mean South China Sea SST (°C) and winds (m/s) at 850 hPa in (a) April, (b) May, (c) June, (d) July, (e) August, and (f) September for the period 1970–2018. The blue rectangle denotes the CT region.
Figure 1.
Climatological monthly mean South China Sea SST (°C) and winds (m/s) at 850 hPa in (a) April, (b) May, (c) June, (d) July, (e) August, and (f) September for the period 1970–2018. The blue rectangle denotes the CT region.

Figure 2.
Evolution of the composite SSTA (°C) within the 10–13° N band for (a) EP El Niño and (b) CP El Niño events. (c) Time series of the averaged SSTA (°C) over the CT region (110–118° E, 10–13° N) in EP (red solid line) and CP (blue dashed line) El Niño events. The stippled areas in (a,b) and “+” symbols in (c) indicate values exceeding the 90% confidence level.

Figure 3.
Scatter plots of DJF CT SSTA (°C, 110–118° E, 10–13° N averaged) with (a) DJF Niño3.4 index, (b) the position of CP El Niño’s warm SSTA, which is defined as the maximum zonal gradient. In (a,b), the red (blue) circles represent EP (CP) El Niño events. (c) Time series of averaged SSTA (°C) over the CT region (110–118° E, 10–13° N averaged) in ECP (dash blue line), WCP (solid blue line) and CP El Niño events (black line). “+” symbols in (c) indicate values exceeding the 90% confidence level.

Figure 4.
Composite SST anomalies (shaded, °C) over tropical India–Pacific (a–c) and SCS regions (d–f) during boreal winter (DJF) for (a,d) EP El Niño, (b,e) ECP El Niño and (c,f) WCP El Niño. Only values reaching 85% significance level are shown in (a–c), the stippled area in (d–f) represents the values exceeding the 85% significance level. Vectors in (a–c) show anomalous wind (m·s−1) at 850 hPa. The blue rectangle denotes the Niño3.4 region in (a) and the Niño4 region in (b,c), with “+” symbols standing for the location of the maximum zonal gradient of the equatorial (5° S–5° N) mean SSTA. Symbols A in (a–c) represent anomalous anticyclone and cyclone. Red rectangles in (a–c) represent the tropical Indian Ocean. Black rectangles in (d–f) represent the CT region.

Figure 5.
Composite DJF anomalies of net surface heat flux (a,f,k), short-wave radiation flux (b,g,l), latent heat flux (c,h,m), long-wave radiation flux (d,i,n) and sensible heat flux (e,j,o) (W·m−3) over the SCS for EP El Niño (a–e), ECP El Niño (f–j) and WCP El Niño (k–o). The stippled areas represent the values exceeding the 90% significance level. Rectangles represent the CT region. Long-wave radiation, latent heat flux and sensible heat flux are upward positive and short-wave radiation is downward positive.

Figure 6.
Composite DJF anomalies of oceanic wind stress curl (10−8 N·m−3) (a–c). The stippled areas represent the values exceeding the 90% significance level. Black rectangles represent the CT region.
Figure 6.
Composite DJF anomalies of oceanic wind stress curl (10−8 N·m−3) (a–c). The stippled areas represent the values exceeding the 90% significance level. Black rectangles represent the CT region.

Figure 7.
Composite SST anomalies (shaded, °C) over tropical India–Pacific (a–c) and SCS regions (d–f) during boreal spring (MAM) for (a,d) EP El Niño, (b,e) ECP El Niño and (c,f) WCP El Niño. Only values reaching 85% significance level are shown in (a–c), the stippled area in (d–f) represents the values exceeding the 85% significance level. Vectors in (a–c) show anomalous wind (m·s−1) at 850 hPa. The blue rectangle denotes the Niño3.4 region in (a) and the Niño4 region in (b,c), with “+” symbols standing for the location of the maximum zonal gradient of the equatorial (5° S–5° N) mean SSTA. Symbols A and C in (a–c) represent anomalous anticyclone and cyclone, respectively. Red rectangles in (a–c) represent the tropical Indian Ocean. Black rectangles in (d–f) represent the CT region.

Figure 8.
Regional mean wind stress curl (10−8 N·m−3), 850 hPa vorticity (10−6 S−1) and OLR (101 W·m−2) over SCS, SSTA over the Indian Ocean (°C) and ENSO SSTA (°C) or EP El Niño (red), ECP El Niño (blue) and WCP El Niño (gray) during spring (MAM). The ENSO SSTA is defined as the mean SSTA over the Niño3.4 region for EP El Niño and Niño4 region for ECP and WCP El Niño.

Figure 9.
Composite MAM anomalies of net surface heat flux (a,f,k), short-wave radiation flux (b,g,l), latent heat flux (c,h,m), long-wave radiation flux (d,i,n) and sensible heat flux (e,j,o) (W·m−3) over the SCS for EP El Niño (a–e), ECP El Niño (f–j) and WCP El Niño (k–o). The stippled areas represent the values exceeding the 90% significance level. Rectangles represent the CT region. Long-wave radiation, latent heat flux and sensible heat flux are upward positive and short-wave radiation is downward positive.

Figure 10.
Composite SST anomalies (shaded, °C) over tropical India–Pacific (a–c) and SCS regions (d–f) during boreal summer (JJA) for (a,d) EP El Niño, (b,e) ECP El Niño and (c,f) WCP El Niño. Only values reaching 85% significance level are shown in (a–c), the stippled area in (d–f) represents the values exceeding the 85% significance level. Vectors in (a–c) show anomalous wind (m·s−1) at 850 hPa. The blue rectangle denotes the Niño3.4 region in (a) and the Niño4 region in (b,c), with “+” symbols standing for the location of the maximum zonal gradient of the equatorial (5° S–5° N) mean SSTA. Symbols A in (a–c) represent anomalous anticyclone and cyclone. Red rectangles in (a–c) represent the tropical Indian Ocean. Black rectangles in (d–f) represent the CT region.

Figure 11.
Composite JJA anomalies of net surface heat flux (a,f,k), short-wave radiation flux (b,g,l), latent heat flux (c,h,m), long-wave radiation flux (d,i,n) and sensible heat flux (e,j,o) (W·m−3) over the SCS for EP El Niño (a–e), ECP El Niño (f–j) and WCP El Niño (k–o). The stippled areas represent the values exceeding the 90% significance level. Rectangles represent the CT region. Long-wave radiation, latent heat flux and sensible heat flux are upward positive and short-wave radiation is downward positive.


Table 1.
Identified El Niño events.
| EP El Niño Events | 1972, 1982, 1991, 1997, 2015 |
|---|---|
| CP El Niño events | 1976, 1979, 1994, 2002, 2004, 2006, 2009 |
Publisher’s Note: MDPI stays neutral with regard to jurisdictional claims in published maps and institutional affiliations. |
© 2021 by the authors. Licensee MDPI, Basel, Switzerland. This article is an open access article distributed under the terms and conditions of the Creative Commons Attribution (CC BY) license (https://creativecommons.org/licenses/by/4.0/).
Share and Cite
MDPI and ACS Style
Wu, M.; Qi, L. Distinct Evolution of Sea Surface Temperature over the Cold Tongue Region in South China Sea during Various El Niño Events. Atmosphere 2021, 12, 1689. https://0-doi-org.brum.beds.ac.uk/10.3390/atmos12121689
AMA Style
Wu M, Qi L. Distinct Evolution of Sea Surface Temperature over the Cold Tongue Region in South China Sea during Various El Niño Events. Atmosphere. 2021; 12(12):1689. https://0-doi-org.brum.beds.ac.uk/10.3390/atmos12121689
Chicago/Turabian StyleWu, Min, and Li Qi. 2021. "Distinct Evolution of Sea Surface Temperature over the Cold Tongue Region in South China Sea during Various El Niño Events" Atmosphere 12, no. 12: 1689. https://0-doi-org.brum.beds.ac.uk/10.3390/atmos12121689
Note that from the first issue of 2016, this journal uses article numbers instead of page numbers. See further details here.