Article

Investigating the Climate-Growth Response of Scots Pine (Pinus sylvestris L.) in Northern Poland

by
Nella Waszak
1,*,
Iain Robertson
2,
Radosław Puchałka
1,3,
Rajmund Przybylak
3,4,
Aleksandra Pospieszyńska
3,4 and
Marcin Koprowski
1,3
1
Department of Ecology and Biogeography, Faculty of Biological and Veterinary Sciences, Nicolaus Copernicus University, ul. Lwowska 1, 87-100 Torun, Poland
2
Department of Geography, Faculty of Science and Engineering, Singleton Campus, Swansea University, Swansea SA2 8PP, UK
3
Centre for Climate Change Research, Nicolaus Copernicus University, ul. Lwowska 1, 87-100 Torun, Poland
4
Department of Meteorology and Climatology, Faculty of Earth Sciences and Spatial Management, Nicolaus Copernicus University, ul. Lwowska 1, 87-100 Torun, Poland
*
Author to whom correspondence should be addressed.
Submission received: 10 November 2021 / Revised: 12 December 2021 / Accepted: 13 December 2021 / Published: 16 December 2021
(This article belongs to the Special Issue Climate Change and Forest Environment)

Abstract

:
Research Highlights: This study used a 99-year time-series of daily climatic data to determine the climate-growth relationship for Scots Pine (Pinus sylvestris L.) growing in Northern Poland. The use of daily climatic data improved the calculated climatic response of the trees. Background and Objectives: It was hypothesised that daily temperature and precipitation data would more precisely identify climate–growth relationships than monthly data. We compared our results to a previous study conducted in the 1990s that utilised monthly precipitation and temperature data. Materials and Methods: The chronology construction and data analyses were performed using CooRecorder, CDendro and R packages (dplR, treeclim, dendrotools). Forty-nine cores from 31 trees were included in the final chronology. Results: The precipitation and temperature of March had the strongest influence upon ring-widths. Despite a statistically significant correlation between monthly temperature and ring-widths, reduction of error (RE) and coefficient of efficiency (CE) statistics confirmed that daily data better describe the effect of climate on tree rings width than monthly data. Conclusions: At this site, the growing season of Scots pine has changed with the observed association with precipitation now starting as early as February–March and extending to June–July.

1. Introduction

Scots pine (Pinus sylvestris L.) is one of the common tree species found in Central and Eastern Europe and is often used in dendroclimatological studies [1,2,3,4]. It is also found growing in the upland and mountainous areas of Western Europe [5], and its wider distribution extends to Northern Europe [6,7,8] and Eastern Siberia [9]. Dendroclimatological research in Poland using the ring-widths of Scots pine has been widely reported [4,10,11,12,13,14,15]. Several long-term pine chronologies were constructed for Poland [16,17,18,19,20,21,22] and for the neighbouring countries of Germany, Estonia and Lithuania [23,24,25]. The wide spatial distribution and existing ring-width chronologies highlight the potential for future research on this species. Tree rings in Poland can be a source of information about both hydroclimatic events, such as droughts and air temperature [2,13,15,26,27,28,29,30]. Some factors, such as frost or summer drought may have an immediate effect on ring width, whereas other factors, such as winter drought, may have a delayed effect on ring widths. The effect of different factors is seen as variations in ring size and structure [31] with droughts causing narrow rings [2,15,30]. Droughts are considered to be one of the most stressful factors for trees [32,33,34]. Research on the influence of different climatic factors on changes in the tree-ring widths in conifers has been carried out since the mid-20th century [35]. The observation of changes in annual tree growth under the influence of the climate, and the response of trees to a range of extreme climatic conditions in specific years is an increasingly widespread branch of science [36,37,38]. The widely observed climate changes in recent decades [39] incline us to undertake a deeper analysis and a closer look at the reactions of individual tree species to changes in pluvial and thermal conditions. The analysis of changes in annual tree growth in the context of past climatic events allows us to predict how current tree stands may react in the future [40]. In order to analyse changes in tree growth in relation to climate over the last one hundred and fifty years, records of meteorological data from weather stations are required. Such data are available, among others, in the format of daily and monthly observations. Due to the wide availability of monthly data, they are commonly used in dendroclimatological analyses [8,15], both for deciduous and coniferous species worldwide. Nowadays, daily data are used more often in such kind of analysis [41,42,43,44]. Daily data can explain climate–growth relations better than monthly data as tree growth does not take place at a monthly scale as it is a living organism in which life processes are constantly taking place [45]. While daily data can describe climate–growth relations more precisely, it was decided to compare the climate–growth responses using daily and monthly data. We used a continuous series of daily and monthly data from nearby meteorological stations for our study. Daily climatic data are much more challenging to access but are often considered a better option than gridded daily [46] and monthly data for dendroclimatological analysis [46,47,48].
The main aim of this paper was to study the relationships between the tree ring width index, called tree rings in the following text, and monthly and daily climatic data. Due to the fact that monthly data are the mean values of the daily data from 28–31 days and artificially divide the vegetation period into smaller time spans, daily data have the potential to be more reliable for reconstructing past climates. To investigate the potential for climatic reconstruction, the data set was divided into two periods: the calibration and verification periods. The use daily/monthly climate data with appropriate statistical tests allowed for more precise analyses of the potential for climatic reconstruction. Having long-time daily climatic data from meteorological stations, we have the exceptional chance for a more precise study of climate growth relationships on tree rings of Scots pine growing in the neighbourhoods of the meteorological station. We also hypothesised that daily air temperature and precipitation data are better for identifying climate–growth relationships and can also be used to reconstruct past climates. For this purpose, we used one of the longest daily climate data series for Poland, covering the period 1740–2019, together with long-living Scots pine located about 3 kilometres from the existing meteorological station. In this location, instrumental observations were initiated in 1740 with homogenous monthly series available since 1871 and continuous daily data since 1921. The results of this research could be applicable to the long chronologies constructed from historical buildings in the Toruń region [15].
As droughts are considered to be one of the most stressful factors for trees [32,33,34] and the extreme drought events and extreme drought years are becoming more frequent we hypothesised that the daily climatic data are better at identifying shorter duration extreme events. We determined the presence of extreme years from daily resolution data wherever they were available. We wanted to establish if the extreme years calculated from daily data differed from those based on monthly data. In our research, extreme years are defined as years in which extremely wide or narrow tree rings, late or early wood layers, were created.

2. Materials and Methods
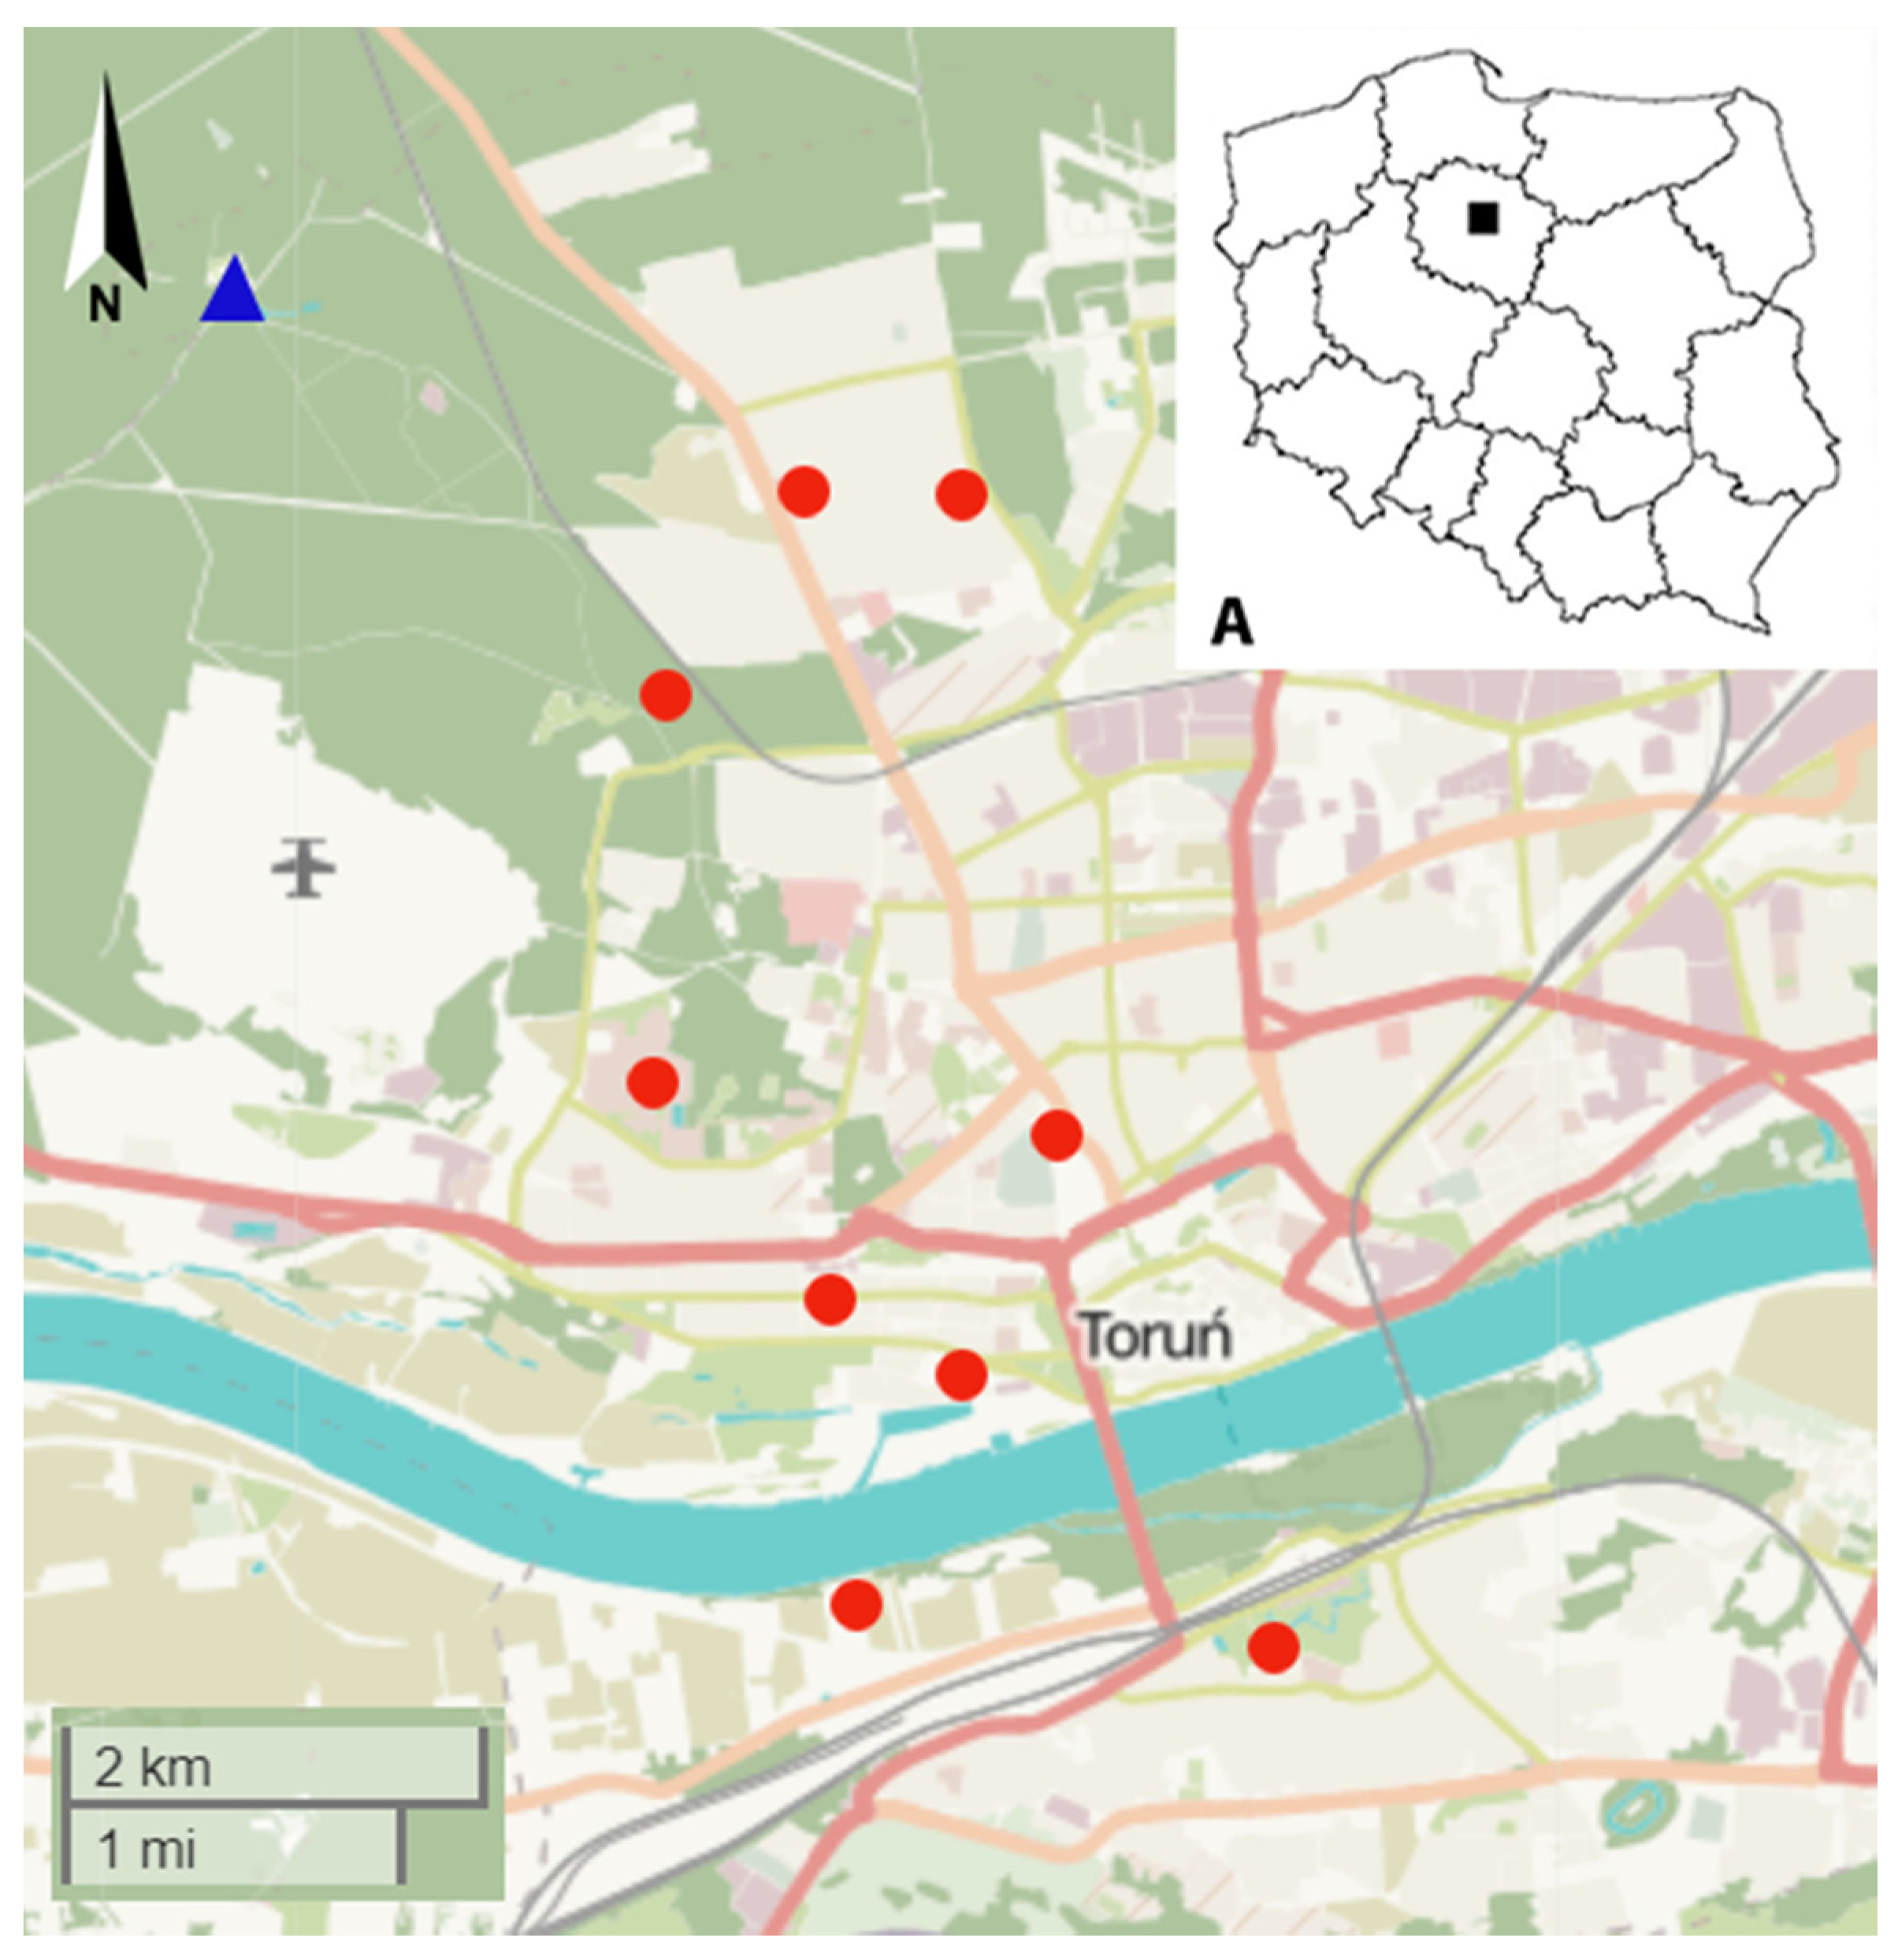
2.1. Study Area

The study area covers a region located in the eastern part of Toruń Basin [49], 53°3′18.68″ N; 18°32′30.26″ E, in the Kuyavian-Pomeranian region, in Northern Poland, with a mean altitude of 65 m. The area is part of the Chełmno Lakeland Region and is located less than 5 km from the Vistula River. Water flows into the Vistula river system and further downstream into the Gulf of Gdańsk in the Baltic Sea. The study site is located in the northern part of the city of Toruń, covered by a fresh mixed forest dominated by Scots pine (Pinus sylvestris L.) and Pedunculate oak (Quercus robur L.). The site is a moderately fertile habitat, rather humid, with a low groundwater level and a relatively low sum of precipitation (the mean sum of annual precipitation for years 1961–2004 was 536 mm).

2.2. Climate Data, Sampling, Tree Rings Measuring

Climate data with daily and monthly resolution are available for Toruń for different periods, since 1740 (see [50]). The location of weather stations covering the years 1871–2019 in Toruń is shown in Figure 1. The changes in the location of the weather stations were the results of historical changes, including two World Wars as well as an urban expansion [49]. The earliest available continuous homogenised series of monthly precipitation and mean monthly temperature starts in the year 1871 (for details see [50]). Continuous series of both variables with a daily resolution are available since 1921. For this reason, tree growth-climate relationships, were studied using both daily and monthly data taken from the common period 1921–2019. For the period 1921–2019, the data were provided by the Institute of Meteorology and the Water Management-National Research Institute in Poland.
In order to assess whether daily or monthly meteorological data were better at characterising the relationship with ring-widths, the sums of precipitation and average temperatures from the same meteorological station located in Northern Poland were compared. Tree cores were collected from about 175 years old Scots pines, with the oldest tree-ring dated to 1847. The tree ring width chronology was constructed with minimum samples depth of 20 over the period 1856–2019 (Figure 2). Samples were taken after the end of the growing season, during the late autumn and winter months in 2019. The trees selected for sampling were healthy, with a straight trunk and a regular crown. Some of the trees showed traces of resin extraction 50 years ago; however, it was still decided to utilise these samples due to their age and healthy appearance. Two samples were taken from each tree at breast height with a 5 mm diameter increment borer using standard techniques. In total 100 samples were taken from 50 trees. The cores were prepared for measurement using standard dendrochronological procedures [16]. All of the samples were air-dried, prepared with a sharp knife and scanned with 1200 dpi resolution using a standard scanner (Epson Perfection V700 Photo) to enhance the tree ring structure. CooRecorder 9.3.1 and the related CDendro 9.3.1 software (http://www.cybis.se; Accessed on 10 December 2021) were used to measure tree-ring widths to the nearest 0.01 mm. COFECHA 6.06P software [51] was used to check series intercorrelation, missing rings and detect possible dating errors. A smoothing cubic spline curve with a 50% wavelength frequency cut-off and response period of 32 years was fitted to each individual tree-ring widths series. Segments were examined in value of 50 years lagged successively by 25 years. The autoregressive model was applied to the time-series.

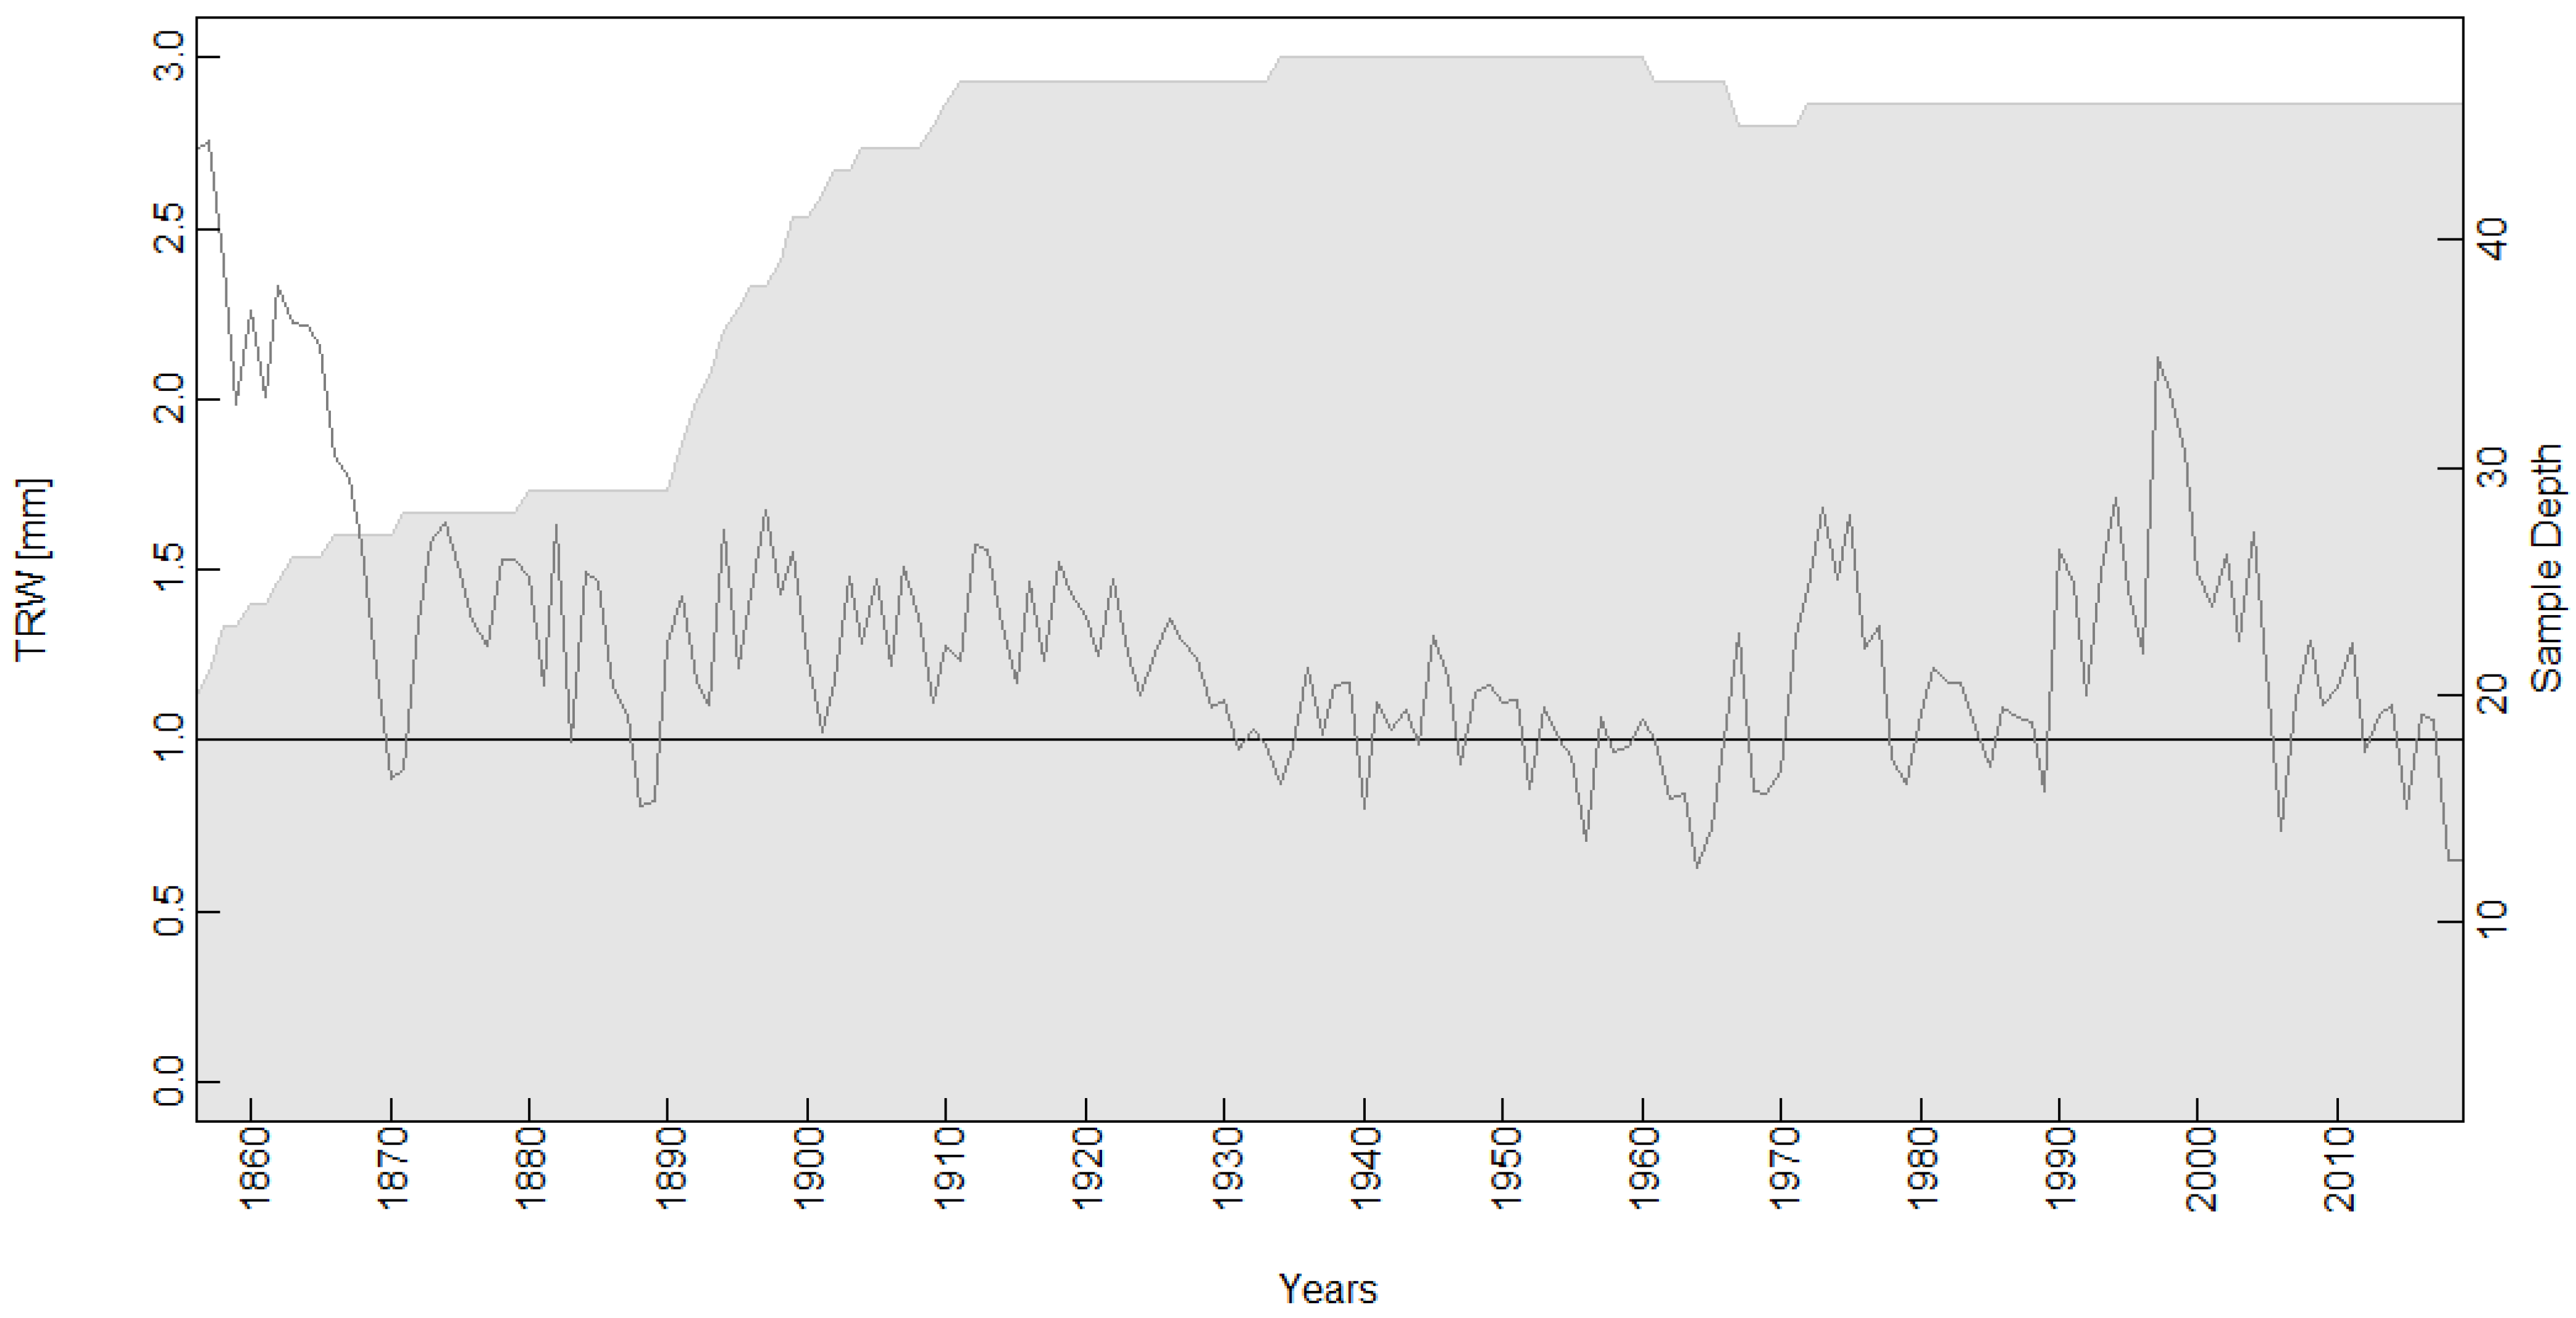
2.3. Chronology Building and Climatic Calibrations

A ring-width chronology was constructed from living trees covering the period 1856–2019. The tree ring widths of 49 cores from 31 trees were included in the final chronology. Some of the samples were rejected due to the presence of wood decay. Dendrochronological and statistical calculations were performed using R [52] with the application of selected packages: (i) the ‘‘dplR’’ [53] package was used to detrend the series by removing age-related growth trends and competition effects using Spline detrending method, (ii) the “treeclim” software [54] used a classical bootstrapped and Pearson correlation to calibrate the proxy–climate relationships and (iii) the “dendroTools” [55,56] package was used determine the optimal proxy–climate response window. Based upon the Pearson correlations over the period 1921–2019, a 30–60 day window was selected to study the relationship with daily temperature and a 60–180 day window was selected to study the relationship with precipitation (Table 1). Daily data rather than monthly data were used, which allowed a more accurate time intervals to be determined. The “daily response” function from “dendroTools” [55] R package was used, in which calculations are based on moving window which is defined with two arguments: window width (e.g., 30 days, 60 days and 180 days) and a location in a matrix of daily sequences of environmental data (precipitation, temperatures). The time intervals of 30 days, 60 days and 180 days were separated to obtain comparable information.
For the analysis with daily precipitation values, periods of 60 and 180 days were selected due to observed statistical significance of monthly values, e.g., June–July or September–October for 60 days’ time span each. Analyses performed on daily data were based on specific time intervals shown in Table 1 (e.g., 60 days: 22 May–20 July), which was selected on the basis of the dendrotools: daily response function [55] with the highest statistical significance. Analyses conducted on monthly data were based on the same time interval as for daily data, and those months were selected that coincided most closely with the dates of the daily data. So, for example, if the interval chosen for the daily data was 60 days: 22 May–20 July, then the interval was chosen for the monthly data was June and July. Using the same approach for temperatures, 30 and 60 day periods were selected (Figure 3). The chosen number of days were compared with the results of previous research conducted in this region [10,11,12].
The data were subjected to selected statistical tests, such as the Pearson correlation coefficient (r), reduction of error (RE), coefficient of efficiency (CE) and root-mean-square error (RMSE) tests, which were then compared with each other. The extreme years were selected and compared with extreme meteorological events in the last century. A cross-calibration and verification method [57,58] was carried out to test the regression equations. Both the independent and dependent variables, tree rings, precipitation and temperature series were divided into two groups of equal length (1921–1970 and 1971–2019). The time series was divided in two periods; one period was used for calibration with the other was used for verification. This approach enabled continuous data to be selected covering a long period without any gaps dividing the verification and calibration periods. As the selected time intervals were superior in calibration performance (Table 1), the relationship was calibrated and verified over two periods of equal length in order to examine the temporal stability [8]. For the calibration period, the Pearson correlation coefficient together with a statistical significance check (p-value) of 0.05 and 0.01 was performed. For the verification period several statistics were used including the reduction of error (RE), coefficient of error (CE) and root mean square error (RMSE) [31,59,60,61].

2.4. Extremely Narrow and Wide Tree Rings

The use of daily climatic data, gave the unique chance to check if extreme years calculated using daily data differ from those calculated using monthly data. The identification of extreme years using daily data enables an investigation as to whether the magnitude of results obtained from monthly data was diminished. The daily resolution climatic data records the exact days on which extreme weather events occurred. If they occur on the border of two months, they can be averaged and flattened during the analysis of monthly data. The aim of the analysis of extreme years was to find those years in which extremely narrow or wide tree rings were detected. The extreme years were selected and compared with meteorological data in the last century. Extreme years were determined with COFECHA 6.06P software using a procedure that averages the values inside the 50 year time window and 25 years lag time window [62]. The series reflects a residual time series that has been standardized to a mean of zero and a standard deviation of 1.0. Narrow rings are indicated by negative values and wide rings are indicated by positive values. Because values of −2.0 and +2.0 indicate departures from the mean by two standard deviations or greater, values of this magnitude are rare in the series and indicate very narrow and very wide rings, which are useful to confirm the independent cross-dating of the time-series.

3. Results

3.1. Daily and Monthly Data Comparison: Correlation of Tree Ring width Index to Climate Data

In order to check the association between tree-ring widths and both types of meteorological data (i.e., daily and monthly sums of precipitation and, daily and monthly average air temperatures), the same statistical tests (see Section 3.2) were used to investigate the correlation using data from period 1921–2019. Monthly data shows significant, positive correlations with precipitation in March (r = 0.22, p < 0.05), April (r = 0.16, p < 0.05) and June (r = 0.26, p < 0.05), while for temperature in February (r = 0.40, p < 0.05) and March (r = 0.35, p < 0.05) and negative effect in previous September (r = −0.33, p < 0.05) (Figure 3). Using daily data, for precipitation 60 days period the highest positive correlation was noted between 22nd of May and 20th of July (r = 0.329, p < 0.05) for 180 days between 7th and between February and 5th of the August (r = 0.386, p < 0.05). For temperature for 30 days between 21st of February and 22nd of March (r = 0.413, p < 0.05), for 60 days between 21st of January and 21st of March (r = 0.414, p < 0.05) (Table 1).

3.2. Monthly Climate Data

All time intervals (30, 60 and 180 days) for calibration period A (1921–1970), yielded significant (p < 0.02) reconstruction skills both for precipitation and temperature (Table 2). For calibration period B (1971–2019) only temperature data yielded significant (p < 0.01) reconstruction skill (Table 3). For precipitation data, both 60 days and 180 days intervals appeared to be insignificant but also resulted in the lowest correlation r ≤ 0.22. For calibration period A (1921–1970), RE and CE verification statistics yielded negative values for precipitation and acceptable RMSE values [57]. Both 30 days and 60 days’ time intervals for temperature data showed acceptable results for the RE statistic and slightly negative values for CE, the RMSE test was very good with values below 1 [63]. For calibration period B (1971–2019), verification statistics of RE and CE tests yielded a reasonable model for precipitation data but poor results for the RMSE test. For temperature values, the RE test yielded a reasonable model, but the CE test results yielded negative values. The RMSE test yielded low values, below 1.3.

3.3. Daily Climate Data

All time intervals (30, 60 and 180 days) for calibration period A (1921–1970) yielded significant (p < 0.01) reconstruction models both for precipitation and temperature. Additionally, almost all-time intervals for calibration period B (1971–2019) yielded significant (p < 0.02) reconstruction models besides the 60 day interval for precipitation which appeared to be insignificant but also resulted in the lowest correlation r = 0.25. Verification statistics were performed resulting in a reasonable model for RE test for both types of meteorological data. CE test yielded reasonable models in 1921–1970 and 1971–2019 calibration periods for precipitations but had a slightly negative value in 1921–1970 and 1971–2019 calibration periods for temperature. For both 1921–1970 and 1971–2019 verification periods, RMSE value was low and close to null for precipitation showing even values below 0.6.

3.4. Daily Climate Data vs. Monthly Climate Data

During the calibration period 1921–1970, the association between ring widths and, daily and monthly data were similar. The precipitation data showed a similar correlation with the width of tree rings as the temperature data. However, the situation was very different when the RE, CE and RMSE statistics were calculated. Analysing the results based on monthly precipitation data, the calculated RE and CE values were slightly negative, and the RMSE indicator was far higher than the results based on daily data. For temperature, the results were comparable, which means that results for RE were positive numbers both for daily and monthly data, while for the CE values were negative numbers both for daily and monthly data and, RMSE values were similar.
During the calibration period 1971–2019, the association between ring widths and, daily and monthly data, were not similar. In most cases, the association between ring widths and precipitation was not significant (p > 0.05). For temperature, the results of RE, CE and RMSE tests were comparable, which means that results for RE were positive both for daily and monthly data, for CE were negative numbers both for daily and monthly data and the RMSE values were similar.

3.5. Extremely Narrow and Wide Tree Rings

Extreme years analysis was performed on time span of 172 years, from 1856 to 2019. Six years with extreme rings width were found. Analysis of extreme ring widths revealed the occurrence of extremely narrow rings in 1871, 1901, 1940, 1956, 1964 and 2006. In these years, the residual values of the master dating series were, at least, below −2.0. There were no results higher than +2.0. The highest result of ring width occurred in 1997 and achieved a value of 1.981, which showed that there were no extreme positive years interpreted as exceptionally wide rings. Extreme years were compared with climatic data and it was observed that the main factors limiting growth were low temperature at the end of winter and a low sum of precipitation during the vegetation season. For example, in the year 2006 mean temperature from 21 January to 21 March was −4.3 °C and the sum of precipitation from 22 May to 20 July was 56.5 mm (Table 4). Climatic data showed extreme values for both temperature and precipitation, presenting exceptionally cold winters as well as droughts in the vegetation period of the plants. Years of extremely low growth rate were analysed and these pointer years were attributed to cases in which severe winters were followed by spring-early summer droughts. However, the question arises: were there other years with similar weather conditions which were not associated with significant growth reduction? There was not observed similar weather conditions in other years, when both temperatures at the end of winter and sum of precipitation during the vegetation season were low. The plot of minimum winter temperatures (December–February) and May–July precipitation constructed for the whole period (1921–2019), based on daily data, answer this question (Figure S1 in Supplementary Materials; Accessed on 14 December 2021). No other extremely narrow or wide annual increments were noted.
Comparing mean temperature and precipitation in extreme years obtained from daily and monthly data, the difference in values obtained is clearly visible (Table 4). In each case, the values differ significantly and are over- or underestimated irrespective of the selected period. These results demonstrate that daily data are more precise indicators for extreme weather events, such as periods of drought or extremely low temperatures, than monthly data.

4. Discussion

One of the aims of this paper was to re-investigate the observed relationship between ring widths with monthly and daily climatic data for the Toruń region [10]. We constructed a ring-width chronology and updated the daily and monthly climate data [50]. In Poland, the relationship between monthly climate data and the ring-widths from the long Scots pine chronologies has already been established at several locations. For stands in Southern Poland in the Dąbrowa Tarnowska Forest Distinct, Feliksik 1988 [64] reported that the trees responded to winter temperatures, which was confirmed by stands in the Świętokrzyski National Park that were influenced by the temperatures of January to March and precipitation from April to August [65]. Analyzing Scots pine stands in South-Western Poland in the lowlands [66], and the Sudety Mountains [67,68] it was found that the temperatures for February–March and summer precipitation influenced growth. Many dendroclimatological analyses with chronologies of more than 100 years have been made for Northern [10,11] and North-Western Poland [69] where they found that February–April temperature and June–July and December precipitation primarily influenced ring widths. By analysing new material, we found a significant climate signal for February–March and previous September temperatures, as well as March–April and June precipitation (Figure 3). In the case of monthly temperatures, the results confirm previous studies [10], as well as the relationships observed for pine stands in southern Poland [66,67,68]. In these studies the significance of the effect of precipitation on growth was determined for the summer months, June–July, both in the south and north of Poland [10,11,65,66,68]; only for the Świętokrzyski National Park was the relationship with precipitation from April to August significant [66]. Repeating the tree rings width-climate correlation study after 20 years, we find a significant climate signal for precipitation for March, April and June (Figure 3). At the same time, the value of the correlation coefficient for precipitation is similar for February and July. A previous study revealed the significance of precipitation in February, which is reported elsewhere for other conifer species, spruce and larch in Northern Poland [70]. Cedro and Lamentowicz 2011 [71] analysed the increment-climate correlation for pines growing on the edge of a swamp, in Northern Poland, defining their climate signal as typical for this species, indicating the significance of the effect of precipitation in February. Our results confirm previous studies, but it is worth noting the influence of both March precipitation and temperature. In Northern Poland, with the current climatic changes, warmer winters and earlier spring, intensive potential thaw and rainfall begin as early as February-March resulting in a more intensive substrate water supply than before [72]. The change in climatic conditions may cause a change in growing conditions, accelerating the period of rainfall significance and starting as early as February–March and extending to June–July. Due to rising winter temperatures and changes in evapotranspiration pattern the effect of climate change on individual species can be either positive or negative, depending on the site conditions and regional climate changes [73]. Responses simulated with 70 different models of climate change variations vary considerably, which is adding considerable uncertainty [74]. It is crucial due to the fact that Scots pine trees are the main forest-forming species in the European lowlands, Northern Europe, and Northern Asia.
Using daily measurement data from the nearby meteorological station we elucidated a clear relationship between ring widths and climate. It is the first time for Northern Poland that the proxy–climate relationship has been investigated with daily climate data. In general, we found in the years 1921–2019 the highest correlation for temperature between 21 February to 22 March and 21 January to 21 March depending on a time span. For precipitation, we found the highest correlation from 22 May–20 July and 7 February–5 August (Table 1). The comparable results were presented by Liang et al. 2013 [75], who analysed Scots pine in North-Eastern Germany. The results are comparable for precipitation, where the authors indicate the period with the highest climate–growth correlation on 26 May–18 June and 29 June–25 July, which is in agreement almost every day with our results falling on 22 May–20 July. However, in the case of temperature influence the results differ considerably, as Liang et al. 2013 [75] indicates the interval 24 March–23 May, while in the case of the site analysed by us, in Northern Poland, it is the period 21 January–21 March or 21 February–22 March depending on the selected time interval. It is worth noting, however, that the sites, although quite similar, are under the influence of different climatic conditions, with the German site under the influence of an oceanic climate, characterised by milder climatic conditions, and the Polish site under the influence of a transitional climate with a colder winter and more variable climate. In addition, the study is separated by a period of almost 10 years, during which a number of warm winters occurred. This may partly explain the discrepancy in results, but further research into this phenomenon is needed. Studies using daily data have also been performed by Pritzkow et al. 2014 [76] on Scots pine in Northern Sweden, at the Arctic Circle, and by Kaczka et al. 2017 [44] on Norway spruce in the Tatra Mountains in Southern Poland. Kaczka et al. 2017 [44] indicates that the highest temperature relevance for tree growth occurs between Jun 9th and Jul 19th while Pritzkow et al. 2014 [76] determines it between Jul 7th and Jul 29th, which in both cases highlights the relevance of summer temperatures on tree growth, where in Northern Poland we define the early spring period as thermally relevant.
Seo et al. 2008 [77], Kaczka et al. 2017 [44], Nagavciuc et al. 2019 [78] reported that the use of daily climatic data was more reliable as there was a higher correlation with ring-widths. Moreover, they found that the flexible time interval based upon days rather than months adapted to the vegetation period of plants better. In our paper, we expanded upon this initial research and used additional statistical tests, such as RE, CE and RSME, to investigate the temporal stability of this relationship. The data presented in Table 2 and Table 3 demonstrate that the correlation coefficient (r) alone is not sufficient to conclude that there is a stable association between the ring widths of Scots pine and precipitation at this site. Even though the correlation (r) with ring-widths was sometimes lower for daily data (r = 0.47) than for monthly data (r = 0.50) it yielded, significant RE and CE values (>0) and a very accurate RSME response (<1) (Table 2). The equivalent tests using monthly precipitation data were not temporally stable (Table 2). These results highlight the importance of calculating RE, CE and RSME values to investigate the temporal stability of the climate response [63]. Consequently, existing dendroclimatological research based solely upon p-values may not be as reliable as once thought. It is recommended that the temporal stability of tree-climate growth responses should always be investigated [61].
Moreover, it was found that daily climatic data were statistically more reliable, although they may have a slightly lower correlation coefficient compared to monthly data. In some cases, results based on monthly data, despite a high correlation coefficient r > 0.50 and a statistical significance at p-value <0.01, RE and CE values demonstrated the lack of temporal stability. For daily data during the calibration period 1921–1970, the value of the correlation coefficient was similar for temperature and precipitation data, but the value of the correlation coefficient was higher for precipitation. In addition, for precipitation, the other statistical tests are better because both RE and CE values were positive. During the calibration period 1971–2019 the correlation coefficient was higher for temperature data with r = 0.42; however, the results of RE, CE, RMSE tests are more reliable for precipitation data for a six-month period (180 days). For monthly data, the precipitation results for the calibration period 1971–2019 were statistically insignificant (p > 0.05), so the analysis of the other statistical tests was futile. For the calibration period 1921–1970, the results for the precipitation data had a high correlation coefficient r > 0.50 but were statistically unreliable because the results of RE and CE tests were negative. The interpretation of these results was based upon previous research in life sciences [63,79,80].
In addition, it was noted that regardless of whether daily or monthly data were used for the analysis, the correlation between the annual tree rings width and temperatures or precipitation is significantly lower 0.20 < r < 0.38 in calibration period B (1971–2019) than in calibration period A (1921–1970) where it is in the range 0.44 < r < 0.54. A similar correlation has been observed among other conifers in the northern hemisphere, also since 1970, and has been described as the ‘divergence problem’ [81]. The ‘divergence problem’ was also observed in other tree ring proxies such as blue intensity [82] and stable isotopes [83].

Extreme Years

Analysis of extreme ring widths revealed the occurrence of extremely narrow rings in 1871, 1901, 1940, 1956, 1964 and 2006. A negative effect of cold winters in 1940 and 1956 was observed in southern Germany [84]. Neuwirth et al. 2007 [85] noticed the year 1956 as a strong negative effect in fields of Central Europe lowlands, including northern areas in Poland due to a very warm spring combined with below average rainfall in at least one month in the first half of the growing season. They also point the year 1964, as a negative for tree stands in Northern and Northern-East Germany. Since the results of our research showed that daily data are better suited for dendroclimatological analyses (Table 2 and Table 3), daily resolution data were used to analyse extreme years wherever they were available (Table 4). Where daily data were not available or did not cover the whole range of time intervals, monthly data were used. It turns out that in the case of temperature data, in all cases, the average temperature values for the winter months (60 days) differed significantly from the multi-annual average (−0.6 °C), reaching the average temperature value for that period even −6.6 °C. In the case of precipitation data, in all years except 1871, the average sum of precipitation for the selected periods in each case was significantly lower than the multi-annual average over the 1871–2019 time period. Although 1871 had a higher than the average sum of precipitation, the record low temperatures of February had an extremely negative impact on the formation of the annual tree ring and caused its exceptionally low growth. For each of the five next extreme years there was an exceptional combination of high frosts in winter and drought in the growing season. The combination of these two climatic factors in the indicated years significantly influenced the formation of exceptionally narrow tree rings in the examined Scots pine trees in Northern Poland. All the extreme years are confirmed by Pospieszyńska et al. 2013 [86], who, on the basis of instrumental measurements, analysed the extreme climatic conditions in the years 1871–2010 in the research region. They confirm the occurrence of exceptionally low air temperatures and exceptionally small amounts of precipitation in those extreme years (Table 5). Przybylak et al. 2020 [30] discussing the occurrence of droughts in Poland, lists the years 1956, 1964 and 2006 as years with low annual rainfall. Zielski 1997 [10] indicates the occurrence of a very cold winter in 1940 and a combination of harsh winter and very dry year in 1956 and 1964. Koprowski et al. 2012 [15] also mention these years as indicator years for Scots’ pine. Based upon this evidence, we conclude that the extreme years’ analyses conducted from daily climatological measurements do not differ from the results based on monthly data and gives typical results for the area of Poland. Furthermore, all of the above extreme years are confirmed by specific climate events recorded in the instrumental measurements.

5. Conclusions

In the study, the growing season of Scots pine has changed with the observed association with precipitation now starting as early as February–March and extending to June–July. These phenological changes indicate that the climate–growth response of Scots pine is not stable in this region. Despite a statistically significant correlation between monthly temperature and ring-widths, reduction of error (RE) and coefficient of efficiency (CE) statistics confirmed that daily data better describe the effect of climate on tree rings width than monthly data. A change in growth patterns can cause far-reaching changes in the structure of tree-stands and affect the economic market, which has serious implications as Scots pine trees are the main forest-forming species in the European lowlands, Northern Europe, and Northern Asia.

Supplementary Materials

The following are available online at https://0-www-mdpi-com.brum.beds.ac.uk/article/10.3390/atmos12121690/s1, Figure S1: Minimum winter temperatures (December–February) and May–July precipitation over the period (1921–2019).

Author Contributions

Conceptualization, N.W. and M.K.; methodology, N.W, R.P. (Rajmund Przybylak), A.P.; software, N.W., M.K.; formal analysis, N.W.; investigation, N.W.; writing—original draft preparation, N.W.; writing—review and editing, N.W., M.K., I.R., R.P. (Radosław Puchałka); field work, N.W., M.K., R.P. (Radosław Puchałka); climate data preparation, R.P. (Rajmund Przybylak), A.P. All authors have read and agreed to the published version of the manuscript.

Funding

The work was supported by the NCN project no. DEC 2020/37/B/ST10/00710). The research was fund by the Nicolaus Copernicus University–Emerging field: Global Environmental Changes; Department of Ecology and Biogeography and Academia Copernicana.

Institutional Review Board Statement

Not applicable.

Informed Consent Statement

Not applicable.

Acknowledgments

We want to thank the authority of Wrzosy forest inspectorate for permission of doing research. The work of Marcin Koprowski, Aleksandra Pospieszyńska, Radosław Puchałka and Rajmund Przybylak was conducted within the NCN project (grant no. DEC-2020/37/B/ST10/00710).

Conflicts of Interest

The authors declare no conflict of interest.

References

  1. Gričar, J. Biomass allocation shifts of Fagus sylvatica L. and Pinus sylvestris L. seedlings in response to temperature / Prerazporeditev biomase pri sadikah Fagus sylvatica L. in Pinus sylvestris L. kot odziv na temperaturo. Folia Biol. Geol. 2019, 59, 45. [Google Scholar] [CrossRef]
  2. Opała, M. The 443-Year Tree-Ring Chronology for the Scots Pine from Upper Silesia (Poland) as A Dating Tool and Climate Proxy. Geochronometria 2015, 42, 41–52. [Google Scholar] [CrossRef] [Green Version]
  3. Bouriaud, O.; Popa, I. Comparative dendroclimatic study of Scots pine, Norway spruce, and silver fir in the Vrancea Range, Eastern Carpathian Mountains. Trees—Struct. Funct. 2009, 23, 95–106. [Google Scholar] [CrossRef]
  4. Harvey, J.E.; Smiljanić, M.; Scharnweber, T.; Buras, A.; Cedro, A.; Cruz-García, R.; Drobyshev, I.; Janecka, K.; Jansons, Ā.; Kaczka, R.; et al. Tree growth influenced by warming winter climate and summer moisture availability in northern temperate forests. Glob. Chang. Biol. 2020, 26, 2505–2518. [Google Scholar] [CrossRef] [PubMed]
  5. Matyas, C.; Ackzell, L.; Samuel, C.J.A. EUFORGEN Technical Guidelines for Genetic Conservation and Use for Scots Pine (Pinus sylvestris); Biodiversity International: Rome, Italy, 2004; Volume 6. [Google Scholar]
  6. Helama, S.; Holopainen, J.; Timonen, M.; Mielikainen, K. An 854-year tree-ring chronology of scots pine for South-West Finland. Stud. Quat. 2014, 31, 61–68. [Google Scholar] [CrossRef] [Green Version]
  7. Hökkä, H.; Salminen, H.; Ahti, E. Effect of temperature and precipitation on the annual diameter growth of Scots pine on drained peatlands and adjacent mineral soil sites in Finland. Dendrochronologia 2012, 30, 157–165. [Google Scholar] [CrossRef]
  8. Helama, S.; Lindholm, M. Droughts and rainfall in south-eastern Finland since AD 874, inferred from Scots pine ring-widths. Boreal Environ. Res. 2003, 8, 171–183. [Google Scholar]
  9. Shestakova, T.A.; Voltas, J.; Saurer, M.; Siegwolf, R.T.W.; Kirdyanov, A.V. Warming effects on Pinus sylvestris in the cold-dry Siberian forest-steppe: Positive or negative balance of trade? Forests 2017, 8, 490. [Google Scholar] [CrossRef] [Green Version]
  10. Zielski, A. Uwarunkowania środowiskowe przyrostów radialnych sosny zwyczajnej (Pinus sylvestris L.) w Polsce północnej na podstawie wielowiekowej chronologii. Wydaw. UMK Toruń. 1997, 15, 44. [Google Scholar]
  11. Zielski, A.; Sygit, W. Wpływ klimatu na przyrost radialny sosny w borach i borach mieszanych na transektach badawczych: Klimatycznym (wzdłuż 52°n, od 12°–32°e) i śląskim’. In Dokumentacja Geograficzna 13—Bory Sosnowe w Gradiencie Kontynentalizmu i Zanieczyszczeń Europie Środkowej—Badania Geoekologiczne; Breymeyr, A., Roo-Zielińska, E., Eds.; Dokumentacja Geograficzna: Wrocław, Poland, 1998. [Google Scholar]
  12. Zielski, A.; Krąpiec, M.; Koprowski, M. Dendrochronological data. In The Polish Climate in the European Context: An Historical Overview; Przybylak, R., Majorowicz, J., Brázdil, R.K.M., Eds.; Springer: Berlin/Heidelberg, Germany, 2010; pp. 191–217. ISBN 978-90-481-3167-9. [Google Scholar]
  13. Opała, M.; Mendecki, M.J. An attempt to dendroclimatic reconstruction of winter temperature based on multispecies tree-ring widths and extreme years chronologies (example of Upper Silesia, Southern Poland). Theor. Appl. Climatol. 2014, 115, 73–89. [Google Scholar] [CrossRef] [Green Version]
  14. Przybylak, R.; Majorowicz, J.; Wójcik, G.; Zielski, A.; Chorązyczewski, W.; Marciniak, K.; Nowosad, W.; Oliński, P.; Syta, K. Temperature changes in Poland from the 16th to the 20th centuries. Int. J. Climatol. 2005, 25, 773–791. [Google Scholar] [CrossRef]
  15. Koprowski, M.; Przybylak, R.; Zielski, A.; Pospieszyńska, A. Tree rings of Scots pine (Pinus sylvestris L.) as a source of information about past climate in northern Poland. Int. J. Biometeorol. 2012, 56, 1–10. [Google Scholar] [CrossRef] [PubMed] [Green Version]
  16. Zielski, A.; Krąpiec, M. Dendrochronologia; PWN: Warszawa, Poland, 2004. [Google Scholar]
  17. Szychowska-Krąpiec, E. Long-term chronologies of pine (Pinus sylvestris L.) and fir (Abies alba Mill.) from the Małopolska Region and their paleoclimatic interpretation. Folia Quat. 2010, 79, 915. [Google Scholar]
  18. Zielski, A. Long term chronology of Scots Pine (Pinus sylvestris L.) in the Northern part of Poland. Dendrochronologia 1992, 10, 77–90. [Google Scholar]
  19. Szychowska-Krapiec, E. Dendrochronological pine scale (1622–1966 AD) for the Malopolska area (south Poland). Bull.—Pol. Acad. Sci. Earth Sci. 1997, 45, 1–13. [Google Scholar]
  20. Szychowska-Krąpiec, E.; Krąpiec, M. Dendrochronological studies on construction of pine (Pinus sylvestris L.) standard for SW Poland. Geochronometria 2001, 20, 51–56. [Google Scholar]
  21. Zielski, A.; Krąpiec, M.; Wilczyński, S.; Szychowska-Krąpiec, E. Chronologie przyrostów radialnych sosny zwyczajnej w Polsce [Chronologies of radial growth of Scots pine in Poland]. Sylwan 2001, 5, 105–120. [Google Scholar]
  22. Szychowska-Krąpiec, E.; Krąpiec, M. The Scots Pine Chronology (1582–2004 AD) for the Suwałki Region, NE Poland. Geochronometria 2005, 24, 41–51. [Google Scholar]
  23. Heußner, K. Zum Stand der Dendrochronologie im unteren Odergebiet (The state of dendrochronology in the lower Oder region). In Człowiek a Środowisko w Środkowym i Dolnym Nadodrzu. Spotkania Bytomskie 2; Instytut Archeologii i Etnologii PAN: Wrocław, Poland, 1996; pp. 207–211. [Google Scholar]
  24. Läänelaid, A.; Eckstein, D. Development of a tree-ring chronology of Scots pine (Pinus sylvestris L.) for Estonia as a dating tool and climatic proxy. Balt. For. 2003, 9, 76–82. [Google Scholar]
  25. Vitas, A. Tree-ring chronology of Scots pine (Pinus sylvestris L.) for Lithuania. Balt. For. 2008, 14, 110–115. [Google Scholar]
  26. Büntgen, U.; Frank, D.C.; Kaczka, R.J.; Verstege, A.; Zwijacz-Kozica, T.; Esper, J. Growth responses to climate in a multi-species tree-ring network in the Western Carpathian Tatra Mountains, Poland and Slovakia. Tree Physiol. 2007, 27, 689–702. [Google Scholar] [CrossRef] [PubMed] [Green Version]
  27. Büntgen, U.; Brázdil, R.; Heussner, K.U.; Hofmann, J.; Kontic, R.; Kyncl, T.; Pfister, C.; Chromá, K.; Tegel, W. Combined dendro-documentary evidence of Central European hydroclimatic springtime extremes over the last millennium. Quat. Sci. Rev. 2011, 30, 3947–3959. [Google Scholar] [CrossRef]
  28. Pritzkow, C.; Wazny, T.; Heußner, K.; Słowiński, M.; Bieber, A.; Liñán, I.; Helle, G.; Heinrich, I. Minimum winter temperature reconstruction from average earlywood vessel area of European oak (Quercus robur) in N-Poland. Palaeogeography 2016, 449, 520–530. [Google Scholar] [CrossRef]
  29. Balanzategui, D.; Knorr, A.; Heussner, K.-U.; Wazny, T.; Beck, W.; Słowinski, M.; Helle, G.; Buras, A.; Wilmking, M.; Van Der Maaten, E.; et al. An 810-year history of cold season temperature variability for northern Poland. Boreas 2017, 47, 443–453. [Google Scholar] [CrossRef]
  30. Przybylak, R.; Oliński, P.; Koprowski, M.; Filipiak, J.; Pospieszyńska, A.; Chora, C.; Zyczewski, W.; Puchalka, R.; Dabrowski, H.P. Droughts in the area of Poland in recent centuries in the light of multi-proxy data. Clim. Past 2020, 16, 627–661. [Google Scholar] [CrossRef] [Green Version]
  31. Fritts, H. Tree Rings and Climate; Academic Press: London, UK, 1976. [Google Scholar]
  32. Vitas, A. Drought of 1992 in Lithuania and consequences to Norway Spruce. Balt. For. 2001, 7, 25–30. [Google Scholar]
  33. Allen, C.D.; Macalady, A.K.; Chenchouni, H.; Bachelet, D.; McDowell, N.; Vennetier, M.; Kitzberger, T.; Rigling, A.; Breshears, D.D.; Hogg, E.H.; et al. A global overview of drought and heat-induced tree mortality reveals emerging climate change risks for forests. For. Ecol. Manag. 2010, 259, 660–684. [Google Scholar] [CrossRef] [Green Version]
  34. Sohar, K.; Helama, S.; Läänelaid, A.; Raisio, J.; Tuomenvirta, H. Oak decline in a Southern finnish forest as affected by a drought sequence. Geochronometria 2014, 41, 92–103. [Google Scholar] [CrossRef] [Green Version]
  35. Sheppard, P.R. Dendroclimatology: Extracting climate from trees. Wiley Interdiscip. Rev. Clim. Chang. 2010, 1, 343–352. [Google Scholar] [CrossRef]
  36. Arzac, A.; Babushkina, E.A.; Fonti, P.; Slobodchikova, V.; Sviderskaya, I.V.; Vaganov, E.A. Evidences of wider latewood in Pinus sylvestris from a forest-steppe of Southern Siberia. Dendrochronologia 2018, 49, 1–8. [Google Scholar] [CrossRef] [Green Version]
  37. Martinez del Castillo, E.; Prislan, P.; Gričar, J.; Gryc, V.; Merela, M.; Giagli, K.; de Luis, M.; Vavrčík, H.; Čufar, K. Challenges for growth of beech and co-occurring conifers in a changing climate context. Dendrochronologia 2018, 52, 1–10. [Google Scholar] [CrossRef]
  38. Matisons, R.; Jansone, D.; Elferts, D.; Adamovičs, A.; Schneck, V.; Jansons, Ā. Plasticity of response of tree-ring width of Scots pine provenances to weather extremes in Latvia. Dendrochronologia 2019, 54, 1–10. [Google Scholar] [CrossRef]
  39. Bindoff, N.L.; Stott, P.A.; AchutaRao, K.M.; Allen, M.R.; Gillett, N.; Gutzler, D.; Hansingo, K.; Hegerl, G.; Hu, Y.; Jain, S.; et al. Detection and attribution of climate change: From global to regional. In Climate Change 2013: The Physical Science Basis. Contribution of Working Group I to the Fifth Assessment Report of the Intergovernmental Panel on Climate Change; Stocker, T.F., Qin, D., Plattner, G.-K., Tignor, M., Allen, S.K., Doschung, J., Nauels, A., Xia, Y., Bex, V., Midgley, P.M., Eds.; Cambridge University Press: Cambridge, UK, 2013; pp. 867–952. [Google Scholar]
  40. Sullivan, P.F.; Pattison, R.R.; Brownlee, A.H.; Cahoon, S.M.P.; Hollingsworth, T.N. Effect of tree-ring detrending method on apparent growth trends of black and white spruce in interior Alaska. Environ. Res. Lett. 2016, 11, 7. [Google Scholar] [CrossRef]
  41. Aykroyd, R.G.; Lucy, D.; Pollard, A.M.; Carter, A.H.C.; Robertson, I. Temporal variability in the strength of proxy-climate correlations. Geophys. Res. Lett. 2001, 28, 1559–1562. [Google Scholar] [CrossRef]
  42. Robertson, I.; Loader, N.J.; Mccarroll, D.; Carter, A.H.C.; Cheng, L.; Leavitt, S.W. δ13C of tree-ring lignin as an indirect measure of climate change. Water. Air Soil Pollut. 2004, 4, 531–544. [Google Scholar] [CrossRef]
  43. Land, A.; Remmele, S.; Schönbein, J.; Küppers, M.; Zimmermann, R. Climate-growth analysis using long-term daily-resolved station records with focus on the effect of heavy precipitation events. Dendrochronologia 2017, 45, 156–164. [Google Scholar] [CrossRef]
  44. Kaczka, R.; Janecka, K.; Hulist, A.; Czajka, B. Linking the growth/climate response of daily resolution with annual ring formation of Norway spruce in the Tatra Mountains. Trace 2017, 15, 13–22. [Google Scholar]
  45. Drew, D.M.; Downes, G.M. The use of precision dendrometers in research on daily stem size and wood property variation: A review. Dendrochronologia 2009, 27, 159–172. [Google Scholar] [CrossRef]
  46. Chojnacka, L.; Wojciech, O.; Bolibok, L. Ocena przydatności danych gridowych w badaniach dendroklimatologicznych. Stud. Mater. CEPL Rogowie 2016, 18, 71–79. [Google Scholar]
  47. Hofstra, N.; Haylock, M.; New, M.; Jones, P.D. Testing E-OBS European high-resolution gridded data set of daily precipitation and surface temperature. J. Geophys. Res. Atmos. 2009, 114, 1799. [Google Scholar] [CrossRef]
  48. Yin, H.; Donat, M.G.; Alexander, L.V.; Sun, Y. Multi-dataset comparison of gridded observed temperature and precipitation extremes over China. Int. J. Climatol. 2015, 35, 2809–2827. [Google Scholar] [CrossRef]
  49. Kondracki, J. Geografia Regionalna Polski; PWN: Warszawa, Poland, 2002; ISBN 83-01-13897-1. [Google Scholar]
  50. Pospieszyńska, A.; Przybylak, R. Air temperature changes in Toruń (central Poland) from 1871 to 2010. Theor. Appl. Climatol. 2019, 135, 707–724. [Google Scholar] [CrossRef] [Green Version]
  51. Grissino-Mayer, H. Evaluating Crossdating Accuracy: A Manual and Tutorial for the Computer Program COFECHA. Tree-Ring Res. 2001, 57, 205–221. [Google Scholar]
  52. R Core Team. R: A Language and Environment for Statistical Computing; R Foundation for Statistical Computing: Vienna, Austria, 2016. [Google Scholar]
  53. Bunn, A.G. A dendrochronology program library in R (dplR). Dendrochronologia 2008, 26, 115–124. [Google Scholar] [CrossRef]
  54. Zang, C.; Biondi, F. Treeclim: An R package for the numerical calibration of proxy-climate relationships. Ecography 2015, 38, 431–436. [Google Scholar] [CrossRef]
  55. Jevšenak, J.; Levanič, T. dendroTools: R package for studying linear and nonlinear responses between tree-rings and daily environmental data. Dendrochronologia 2018, 48, 32–39. [Google Scholar] [CrossRef] [Green Version]
  56. Jevšenak, J. New features in the dendroTools R package: Bootstrapped and partial correlation coefficients for monthly and daily climate data. Dendrochronologia 2020, 63, 125753. [Google Scholar] [CrossRef]
  57. Briffa, K.; Jones, P.B. Basic chronology statistics and assessmentle. In Methods of Dendrochronology: Applications in the Environmental Sciences; Cook, E.R., Kairiukstis, L., Eds.; Kluwer Academic Publishers: Dordrecht, The Netherlands, 1990; pp. 137–152. [Google Scholar]
  58. Lindholm, M.; Eggertsson, Ó.; Lovelius, N.; Raspopov, O.; Shumilov, O.; Läänelaid, A. Growth indices of North European Scots pine record the seasonal North Atlantic Oscillation. Boreal Environ. Res. 2001, 6, 275–284. [Google Scholar]
  59. Briffa, K.R.; Jones, P.D.; Pilcher, J.R.; Hughes, M.K. Reconstructing summer temperatures in northern Fennoscandinavia back to AD 1700 using tree-ring data from Scots pine. Arct. Alp. Res. 1988, 20, 385–394. [Google Scholar] [CrossRef]
  60. Fritts, H.C.; Guiot, J.; Gordon, G.A.; Schweingruber, F. Methods of Calibration, Verification, and Reconstruction. In Methods of Dendrochronology; Springer: Dordrecht, The Netherlands, 1990; pp. 163–217. [Google Scholar]
  61. National Research Council. Surface Temperature Reconstructions For the Last 2000 Years; The National Academies Press: Washington, DC, USA, 2006; ISBN 9780309102254.
  62. Meyer, F. Pointer year analysis in dendroecology: A comparison of methods. Dendrochronologia 1998, 16–17, 193–204. [Google Scholar]
  63. McCarroll, D. Simple Statistical Tests for Geography; Chapman and Hall/CRC: Boca Raton, FL, USA, 2016; ISBN 9781498758819. [Google Scholar]
  64. Feliksik, E. Badania wpływu klimatu na szerokość przyrostów rocznych drewna sosny pospolitej. AT-R Im. J. J.Śniadeckich Bydgoszczy Zesz. Nauk. Rol. 1988, 27, 11–17. [Google Scholar]
  65. Feliksik, E.; Wilczyński, S.; Podlaski, R. Wpływ warunków termiczno-pluwialnych na wielkość przyrostów radialnych sosny (Pinus sylvestris L.), jodły (Abies alba Mill.) i buka (Fagus sylvatica L.) ze Świętokrzyskiego Parku Narodowego. Sylwan 2000, 9, 53–59. [Google Scholar]
  66. Feliksik, E.; Wilczyński, S. The influence of thermal and pluvial conditions on the radial increment of the Scots pine (Pinus sylvestris L.) from the area of Dolny Śląsk. Folia For. Pol. Ser. A For. 2000, 42, 55–66. [Google Scholar]
  67. Wilczyński, S.; Skrzyszewski, J. Dependence of Scots pine tree-rings on climatic conditions in southern Poland (Carpathian Mts). EJPAU Ser. For. 2002, 5, 2. [Google Scholar]
  68. Wilczyński, S. The pointer and exceptional years in assessment of relationships “radial growth-climate”. Sylwan 2004, 5, 30–40. [Google Scholar]
  69. Cedro, A. Comparative Dendroclimatological Studies of the Impact of Temperature and Rainfall on Pinus nigra Arnold and Pinus sylvestris in Northwestern Poland. Balt. For. 2006, 12, 110–116. [Google Scholar]
  70. Koprowski, M. Reaction of silver fir (Abies alba) growing outside its natural range to extreme weather events and a long-term increase in march temperature. Tree-Ring Res. 2013, 69, 49–61. [Google Scholar] [CrossRef] [Green Version]
  71. Cedro, A.; Lamentowicz, M. Contrasting responses to environmental changes by pine (Pinus sylvestris L.) growing on peat and mineral soil: An example from a Polish Baltic bog. Dendrochronologia 2011, 29, 211–217. [Google Scholar] [CrossRef]
  72. Kopeć, D.; Ratajczyk, N.; Wolańska-Kamińska, A.; Walisch, M.; Kruk, A. Floodplain forest vegetation response to hydroengineering and climatic pressure—A five decade comparative analysis in the bzura river valley (central poland). For. Ecol. Manag. 2014, 314, 120–130. [Google Scholar] [CrossRef]
  73. Lindner, M.; Garcia-Gonzalo, J.; Kolström, M.; Green, T.; Reguera, R.; Maroschek, M.; Seidl, R.; Lexer, M.J.; Netherer, S.; Schopf, A.; et al. Impacts of Climate Change on European Forests and Options for Adaptation. AGRI-2007-G4-06, Report to the European Commission Directorate-General for Agriculture and Rural Development; Springer: Berlin/Heidelberg, Germany, 2008. [Google Scholar]
  74. Kellomäki, S.; Leinonen, S. Management of European Forests under Changing Climatic Conditions; University of Joensuu: Joensuu, Finland, 2005. [Google Scholar]
  75. Liang, W.; Heinrich, I.; Simard, S.; Helle, G.; Liñán, I.D.; Heinken, T. Climate signals derived from cell anatomy of scots pine in NE Germany. Tree Physiol. 2013, 33, 833–844. [Google Scholar] [CrossRef]
  76. Pritzkow, C.; Heinrich, I.; Grudd, H.; Helle, G. Relationship between wood anatomy, tree-ring widths and wood density of Pinus sylvestris L. and climate at high latitudes in northern Sweden. Dendrochronologia 2014, 32, 295–302. [Google Scholar] [CrossRef]
  77. Seo, J.W.; Eckstein, D.; Jalkanen, R.; Rickebusch, S.; Schmitt, U. Estimating the onset of cambial activity in Scots pine in northern Finland by means of the heat-sum approach. Tree Physiol. 2008, 28, 105–112. [Google Scholar] [CrossRef] [PubMed] [Green Version]
  78. Nagavciuc, V.; Roibu, C.C.; Ionita, M.; Mursa, A.; Cotos, M.G.; Popa, I. Different climate response of three tree ring proxies of Pinus sylvestris from the Eastern Carpathians, Romania. Dendrochronologia 2019, 54, 56–63. [Google Scholar] [CrossRef] [Green Version]
  79. Cook, R.D. Using dimension-reduction subspaces to identify important inputs in models of physical systems. Proc. Sect. Phys. Eng. Sci. 1994, 9, 18–25. [Google Scholar]
  80. Wilson, R.; Tudhope, A.; Brohan, P.; Briffa, K.; Osborn, T.; Tett, S. Two-hundred-fifty years of reconstructed and modeled tropical temperatures. J. Geophys. Res. Oceans 2006, 111, 1–13. [Google Scholar] [CrossRef] [Green Version]
  81. D’Arrigo, R.; Wilson, R.; Liepert, B.; Cherubini, P. On the “Divergence Problem” in Northern Forests: A review of the tree-ring evidence and possible causes. Glob. Planet. Chang. 2008, 60, 289–305. [Google Scholar] [CrossRef]
  82. Wilson, R.; Anchukaitis, K.; Andreu-Hayles, L.; Cook, E.; D’Arrigo, R.; Davi, N.; Haberbauer, L.; Krusic, P.; Luckman, B.; Morimoto, D.; et al. Improved dendroclimatic calibration using blue intensity in the southern Yukon. Holocene 2019, 29, 1817–1830. [Google Scholar] [CrossRef] [Green Version]
  83. Savard, M.M.; Daux, V. An overview on isotopic divergences—Causes for instability of tree-ring isotopes and climate correlations. Clim. Past 2020, 16, 1223–1243. [Google Scholar] [CrossRef]
  84. Elling, W.; Dittmar, C.; Pfaffelmoser, K.; Rötzer, T. Dendroecological assessment of the complex causes of decline and recovery of the growth of silver fir (Abies alba Mill.) in Southern Germany. For. Ecol. Manag. 2009, 257, 1175–1187. [Google Scholar] [CrossRef]
  85. Neuwirth, B.; Schweingruber, F.H.; Winiger, M. Spatial patterns of central European pointer years from 1901 to 1971. Dendrochronologia 2007, 24, 79–89. [Google Scholar] [CrossRef]
  86. Pospieszyńska, A.; Przybylak, R. Tytuł oryginału: Ekstremalne warunki klimatyczne w Toruniu w okresie pomiarów instrumentalnych 1871-2010. In Od powietrza, Głodu, Ognia i Wojny…, Klęski Elementarne na Przestrzeni Wieków; Tomasza, G., Elżbiety, K., Eds.; Wydawnictwo GAJT: Wrocław, Poland, 2013; pp. 187–196. [Google Scholar]
Figure 1. General location of the study area in Poland (A), location of meteorological stations in Toruń over the years 1871–2010 (dots, for more details see [50], location of the research site in the forest (triangle). Basic map and data from OpenStreetMap and OpenStreetMap Foundation © autorsOpenStreetMap.
Atmosphere 12 01690 g001
Figure 2. The tree ring width chronology and sample depth for years 1856–2019.
Atmosphere 12 01690 g002
Figure 3. The relationships between the ring widths of Scots pine and climatic data over the period 1921–2019. Statistically significant months are marked with an asterisk * (p < 0.05).
Atmosphere 12 01690 g003
Table 1. The time intervals and calendar dates selected due to observed statistical significance of monthly values used to investigate the tree-climate growth responses.
PrecipitationTemperature
Time IntervalPeriodTime IntervalPeriod
60 days22 May–20 July30 days21 February–22 March
180 days7 February–5 August60 days21 January–21 March
Table 2. Results of statistical tests for daily and monthly data in calibration period A: calibration period: 1921–1970 and verification period: 1971–2019. Statistical significance at level * p < 0.02, ** p < 0.01.
Calibration Period AVerification Period
1921–19701971–2019
rRECERMSE
precipitation
daily60 days0.54 **0.070.011.24
monthly0.52 **−0.04−0.048.49
daily180 days0.47 **0.070.050.44
monthly0.50 **−0.04−0.045.19
temperature
daily30 days0.52 **0.04−0.393.14
monthly0.54 *0.17−0.010.81
daily60 days0.42 **0.17−0.231.11
monthly0.44 *0.1500.75
Table 3. Results of statistical tests for daily and monthly data in calibration period B: calibration period: 1971–2019 and verification period: 1921–1970. Statistical significance at level * p < 0.02, ** p < 0.01.
Calibration Period BVerification Period
1971–20191921–1970
rRECERMSE
precipitation
daily60 days0.250.270.080.58
monthly0.200.10017.38
daily180 days0.33 *0.200.170.35
monthly0.220.100.0710.97
temperature
daily30 days0.33 *0.17−0.163.05
monthly0.38 **0.21−0.061.28
daily60 days0.42 **0.16−0.161.08
monthly0.30 **0.16−0.151.28
Table 4. Climate conditions in the extreme years. In years with missing daily data, monthly data were used. Grey fields-monthly data. White fields- daily data.
Extreme YearMean Temperature (°C)Precipitation Total (mm)
30 Days60 Days60 Days180 Days
18712.8 (March)−2.3 (February–March, extreme February = −7.4)230.8 (June–July)292.2 (February–July)
19011.0 (March)−2.7 (February–March)22 May–20 July55.1186.9 (February–July)
May–July60.7
194021 February–22 March−2.4−6.0 (February–March)22 May–20 July69.87 February–5 August183.7
February–March−6.0May–July105.9February–August225.3
195621 February–22 March−3.221 January–21 March−6.622 May–20 July102.37 February–5 August201.4
February–March−5.6January–March−4.0May–July282.9February–August306.3
196421 February–22 March−4.721 January–21 March−3.722 May–20 July79.27 February–5 August160.3
February–March−3.3January–March−3.3May–July111.8February–August251.1
200621 February–22 March−3.421 January–21 March−4.322 May–20 July56.57 February–5 August198.3
February–March−1.4January–March−3.6May–July95.4February–August335.9
1871–20190.3 (February–March)−0.6 (January–March)190.1 (May–July)275.2 (February–July)
Table 5. Pointer years and their explanations.
Pointer YearsZielski et al., 1997 [10]Pospieszyńska and Przybylak, 2013 [86]Przybylak et al., 2020 [30]
1871 very cold year
1901 very dry year
1940very cold wintervery cold year
1956harsh winter, very dry yearvery cold yearlow precipitation
1964harsh winter, very dry yearvery dry yearlow precipitation
2006 very warm summer and autumnlow precipitation
Publisher’s Note: MDPI stays neutral with regard to jurisdictional claims in published maps and institutional affiliations.

