Article

Environmental Benefits of Ultra-Low Emission (ULE) Technology Applied in China

1
Technology Support Center, China Coal Research Institute, Beijing 100013, China
2
Laboratory for Climate and Ocean-Atmosphere Studies, Department of Atmospheric and Oceanic Sciences, School of Physics, Peking University, Beijing 100871, China
3
National Institute of Clean-and-Low-Carbon Energy (NICE), Beijing 102211, China
4
Department of Chemical Engineering, Faculty of Engineering and Technology, University of Ilorin, Ilorin 240003, Nigeria
5
Key Laboratory of Physical Oceanography, College of Oceanic and Atmospheric Sciences, Ocean University of China, Qingdao 266100, China
6
Sichuan Academy of Environmental Policy and Planning, Chengdu 610041, China
*
Authors to whom correspondence should be addressed.
Submission received: 7 November 2021 / Revised: 12 December 2021 / Accepted: 14 December 2021 / Published: 17 December 2021

Abstract

:
Seven scenarios were designed to study the national environmental benefits of ULE in coal-fired power plants (CPPs), ULE in industrial coal burning (ICB) and NH3 emission reduction by using the GEOS-Chem model. The results showed that although the CPPs have achieved the ULE transformation target, the PM2.5 concentration across the country has decreased by 4.8% (1.4 μg/m3). Due to the complex non-linear chemical competition mechanism among nitrate and sulfate, the average concentration of nitrate in the country has increased by 1.5% (0.1 μg/m3), which has reduced the environmental benefits of the power plant emission reduction. If the ULE technology is applied to the ICB to further reduce NOx and SO2, although the PM2.5 concentration can be reduced by 10.1% (2.9 μg/m3), the concentration of nitrate will increase by 2.7% (0.2 μg/m3). Based on the CPPs-ULE, NH3 emissions reduced by 30% and 50% can significantly reduce the concentration of ammonium and nitrate, so that the PM2.5 concentration is decreased by 11.5% (3.3 μg/m3) and 16.5% (4.7 μg/m3). Similarly, based on the CPPs-ICB-ULE, NH3 emissions can be reduced by 30% and 50% and the PM2.5 concentration reduced by 15.6% (4.4 μg/m3) and 20.3% (5.8 μg/m3). The CPPs and ICB use the ULE technology to reduce NOx and SO2, thereby reducing the concentration of ammonium and sulfate, causing the PM2.5 concentration to decline, and NH3 reduction is mainly achieved through reducing the concentration of ammonium and nitrate to reduce the concentration of PM2.5. In order to better reduce the concentration of PM2.5, NOx, SO2 and NH3 emission reduction control measures should be comprehensively considered in different regions of China. By comprehensively considering the economic cost and environmental benefits of ULE in ICB and NH3 emission reduction, an optimal haze control scheme can be determined.

1. Introduction

Haze pollution is a complex phenomenon, resulting from primary emissions from multiple sources interacting with meteorology and atmospheric photochemistry. Over the past decade, China has experienced severe haze pollution, marked by fine particulate matter (PM), especially in the Beijing–Tianjin–Hebei (BTH) regions, according to the air quality status reports released by China’s Ministry of Environmental Protection [1]. Fine particulate matter smaller than 2.5 μg (PM2.5) is particularly troublesome and has been implicated in a range of adverse health outcomes [2,3]. The annual mean PM2.5 concentration in the BTH region was 77 μg/m3 in 2015 (MEP., 2015), far beyond the World Health Organization’s (WHO) interim target (35 μg/m3) for annual mean PM2.5 concentration and 1.20 times the secondary class standard in China’s new National Ambient Air Quality Standard [4].
The high ambient PM2.5 concentration is believed to be closely related to China’s large primary energy consumption, especially coal consumption. Specific pollutants emitted from coal combustion, such as SO2, NOx and primary PM, have been implicated as major contributors to haze episodes in China [5]. Aimed at mitigating the severe air pollution situation, the Chinese government has issued several regulations to reduce emissions from coal combustion since 2013. The most important efforts to reduce air pollution include the installation of (ULE) technology at all coal-fired power plants (CPPs) by 2020, and these efforts have already produced measurable reductions in primary NOx, SO2 and particulate matter (PM) emissions [6]. Regulatory policies have also been issued for coal consumption for industrial and residential use, as well as separate policies related to emissions from the transportation sector [7,8]. The cumulative effect of these measures is an improvement in air quality, but there still remains room for a deeper understanding of the effectiveness of different politic strategies for emission control to guide policymakers in their efforts to make further progress.
Thus far, the goal of ULE in power plants in China has been exceeded [9]. However, the concentration of PM2.5 in the atmosphere has been reduced by around 2.5 μg/m3 [10], and haze pollution is still severe. Previous studies indicate that industrial coal combustion dominates the coal consumption, with a 40% contribution to all coal consumption, followed by coal combustion in power plants and the domestic sector [11]. Thus, emissions from the industrial sector are significant contributors to ambient PM2.5 over most of China [12,13,14]. However, most studies have focused on exploring the environmental benefits from ULE facilities installed in coal-fired power plants (CPPs), neglecting the effects of ULE in industrial coal burning (ICB).
Here, three scenarios were designed to assess the environmental benefits of ULE technology further applied to ICB and to quantify the cumulative effects of ULE installed both in CPPs and ICB. In addition, the main source of PM2.5 is secondary inorganic aerosol (SIA), which accounts for 43.6–53.3%, mainly composed of sulfate ( SO 4 2 ), nitrate ( NO 3 ) and ammonium ( NH 4 + ) [15,16]. Researchers have found that NH3 in the atmosphere plays a crucial role in the formation of sulfate and nitrate, and there is a competitive mechanism [17]. Thus, NH3 emission control is directly beneficial for reducing PM2.5 [18,19]. By considering the importance of NH3 emissions, four scenarios were further conducted to quantify the environmental benefits of NH3 emission reduction on the basis of ULE applied in CPPs and ICB.
All of the scenarios are described in Section 2. Section 2 also presents the data source used in this study and the description of the GEOS-Chem model. Section 3 then provides the analysis of the results regarding the emission reduction of NOx and SO2 from all CPPs and ICB in China in 2015 in the context of the ULE levels of CPPs, updated from our previous study [20]; comparisons between the simulated results and observations to evaluate the model are shown in Section 4; Section 5 discusses the environmental benefits brought about by ULE facilities installed in CPPS and ICB, accompanied by NH3 emission reductions in different scenarios; and the last section summarizes the conclusions.

2. Data Source, Method and Model Description

2.1. Data Source and Method

The environmental benefits of using GEOS-Chem to quantify the application of ULE in CPPs and ICB are based on the data source shown in Table 1. Firstly, an emission inventory of NOx, SO2 and PM as air pollutants after ULE technology is applied in CPPs and ICB in China, based on reasonable assumptions, was established. Then, the environmental benefits brought about by the application of ULE technology in CPPs and ICB in China were quantified by using the GEOS-Chem model. Finally, some policy suggestions for achieving greater environmental benefits in the future were put forward.
In order to establish the emissions inventory of air pollutants by using ULE technology in CPPs, the emission factors of air pollutants after ULE technology are used in CPPs were ensured to be consistent with Liu et al.’s research results [20], which updated the emission factors of ULE technology applied in CPPs in China, and according to the national energy statistics yearbook [21], to obtain the coal consumption data of different provinces. Only NOx, SO2 and PM pollutant emissions were considered, when estimating the emissions after the ULE technology was applied to the CPPs in China, given the limited data availability for the emission factor of CPPs that install ULE facilities.
The application of GEOS-Chem to quantify the environmental benefits in different scenarios is based on MEIC emission data and the corresponding spatial distribution. In order to quantify the environmental benefits brought about by the application of ULE technology in the CPPs and ICB, the total emissions from the power and industry sectors provided by MEIC were used. However, the total emissions from the power and industry sectors include not only coal combustion emissions but also other emissions (oil, gas and others); MEIC does not provide these detailed data. Due to the data limitations, the proportion of coal combustion and non-coal combustion obtained from GAINS was used. Moreover, we assumed that the proportion of emissions from coal combustion and non-coal combustion in the power and industry sectors on the MEIC was the same as the proportion of emissions from coal combustion and non-coal combustion in the power and industry sectors on the GAINS.

2.2. Simulation Scenario Design

2.2.1. Emissions Calculation

The emission of each species (NOx, SO2 and PM) from CPPs after applying the ULE technology can be calculated as:
E C P P s = W S × E F U L E
Here, E F U L E is the emission factor after the ULE technology is applied in the CPP; W S is the standard coal consumption in the CPP. Since raw coal consumption is recorded in the yearbook, the standard coal consumption was converted:
W S = W R × Q R / Q S
Here, Q S is the lower heating value for standard coal (29,307.6 J/kg), Q R is the lower heating value for raw coal (defined by the type of coal), and W R is the raw coal consumption by mass.
P C M = P C G = E C G / E G
Here, P C M , P C G is the proportion of pollutants emitted by CPPs in the total emissions in MEIC and GAINS, respectively; E C G is the amount of pollutants emitted by CPPs in GAINS; E G is the total pollutant emissions from the power sector in GAINS.
Thus, we can determine the pollutant emission amount of the power sector after ULE technology is applied in CPPs:
E P = E C P P s + 1 P C M × E M
Similarly, we assumed that ULE technology can be used in ICB and achieve the same emission level as CPPs. Therefore, the emission can be obtained after the application of ULE technology in ICB, based on a similar calculation method. It is also assumed that the proportion of emissions from ICB in the industry sector on the MEIC is the same as the proportion of emissions from ICB in the industry sector on the GAINS, and the GAINS provides detailed data of pollutant classification emissions.
Finally, the new emission inventory is obtained after the application of the ULE technology in CPPs and ICB. The difference between the new emission and MEIC inventory is that it reveals the emission reduction of NOx, SO2 and PM after applying ULE technology in CPPs and ICB. The emission reduction ratio of different pollutants after the application of ULE technology in CPPs and ICB can be obtained as follows:
R = 1 E U L E / E M
Here, R is the emission reduction ratio; E U L E is the total pollutant emissions of the new emission inventory.

2.2.2. Scenario Design

Seven simulation scenarios were designed by using the GEOS-Chem model to computationally estimate the environmental benefits of the application of ULE technology in CCPs and ICB, which are listed in Table 2. All scenarios used the spatial distribution and seasonal variation of the MEIC emission inventory, and we assumed the same meteorological field as the STD scenario to minimize the impact of weather effects. The period for these simulations was 16 December 2014 to 31 January 2015. December 2014 was used as the spin-up period to eliminate the influence of initial conditions. The simulations predicted the daily concentrations of PM2.5, sulfate, nitrate and ammonium. The average values for each of these components were computed using data from 1 January 2015 to 31 January 2015. January was selected as it is the most polluted month and can best reflect the environmental benefits brought about by ULE emission reduction.
The standard scenario (STD) is based on the situations before implementing ULE facilities in January 2015. The remaining situations cover different scenarios of interest. The CPPs-ULE scenario assumes that all of China’s CPPs have been retrofitted for ULE. The CPPs-ICB-ULE scenario assumes that the ICB process reaches the same emission level as that in the CPPs. The other four scenarios are used to further assess the environmental benefits of NH3 emission reduction based on the CPPs-ULE scenario and CPPs-ICB-ULE scenario at a national level. NH3 emission reduction refers to the total emission reduction of industries, residents, transportation and agriculture. The ammonia emission model (PKU-NH3) used in the study has been proven to accurately describe the spatial distribution and seasonal characteristics of NH3 emissions in China [18,25], and to simulate the changes in secondary inorganic aerosols in atmospheric chemical transmission models [26]. Regarding China’s agricultural production, the excessive use of nitrogen fertilizer and extensive animal husbandry caused by NH3 accounted for 80% of the country’s total emissions, based on PKU-NH3 model estimates, through the peak nitrogen fertilizer emissions during the growing season (spring and summer) to implement reasonable fertilization (i.e., avoid excessive fertilization and the implementation of deep fertilizer) and so on; optimizing agricultural management can achieve an NH3 emission reduction of 50% [18]. In the field of livestock manure management, promoting the optimization of animal and poultry manure management, such as reducing the surface area and exposure time of the waste in the house, covered storage, low protein feeding and deep burial of feces at the depth of cultivated land, can significantly reduce NH3 emissions [27,28]. If agriculture and animal husbandry take concerted measures to control NH3 emissions, China’s NH3 emissions can reach more than 50%; therefore, this study selected NH3 emission reductions of 30% and 50% to explore the potential environmental benefits.

2.3. Model Description and Sensitivity Tests

To assess the impacts of the emission reduction brought about by applying ULE facilities in CPPs and CIB on the ambient PM2.5 concentration, several simulations using the GEOS-Chem (version 11-01) chemical transport model were conducted. To obtain more accurate results, the GEOS-Chem nested model at a high resolution of 0.25° latitude × 0.3125° longitude was used. Boundary conditions needed by the nested model were derived from the global atmospheric chemical model with a resolution of 2° latitude × 2.5° longitude every 3 h. Both the nested model and global model are driven by the GEOS-FP meteorology fields, which is from the National Aeronautics and Space Administration (NASA) Global Modeling Assimilation Office. Both models have 47 layers in the vertical direction, and the lowest 10 layers are almost 130 thick. Model convection is parameterized by the relaxed Arakawa–Schubert scheme [29] and the vertical mixing scheme in the planetary boundary layer employs a non-local scheme implemented by Lin and McElroy (2010) [30].
All simulations were run with the full chemistry mechanism (Ox-NOx-CO-VOC-HOx) and aerosols, which include secondary inorganic aerosols (SIOA, including sulfate, nitrate and ammonium), black carbon (BC), primary organic carbon (POA), dust and sea salts, were calculated online. Modifications of the full chemistry mechanism followed Ni et al., (2018) [31]. The ammonium–sulfate–nitrate aerosol system, which uses the ISORROPIA II thermodynamic equilibrium model [32] to simulate SIOA, was coupled to the full chemistry mechanism and implemented in GEOS-Chem [33]. The parameterization of heterogeneous aerosol chemistry was treated as uptake coefficients [34]. Mineral dust aerosols were calculated online by the DEAD scheme [35] and the implementation of sea salt aerosol parameterization followed Jaegle et al., (2011) [36]. In addition to natural dust aerosols, anthropogenic sources of dust have been verified to play an important role in the total PM2.5 concentration over China. Thus, the contribution of anthropogenic dust emissions was explicitly considered by adding the gridded monthly PM emission inventory from MEIC into GEOS-Chem.
Compared to observations, standard GEOS-Chem tends to underestimate the ambient concentration of sulfate due to the simplified sulfate production mechanism implemented in the model [37,38]. The standard GEOS-Chem model simulates sulfate production by considering the gas-phase oxidation of SO2 by OH [39] and the aqueous-phase oxidation of S(IV) (including dissolvedSO42−, HSO3 and SO32−) by hydrogen peroxide (H2O2) and ozone (O3) in cloud droplets. To comprehensively present the process of sulfate production, Wang et al., (2014) [40] and Zhang et al., (2015) [41] assessed the heterogeneous uptake of SO2 on the surface of deliquesced aerosols under high relative humidity conditions and the mechanism of the aqueous-phase oxidation of S(IV) by dissolved nitrogen dioxide (NO2) in cloud droplets and aerosols with high relative humidity was followed. In addition, primary sulfate emissions are also important, accounting for 3.1% of the total Chinese anthropogenic sulfur emissions. The share of primary sulfate emissions over China could be underestimated; thus, the contribution was increased to 4.5%. These updates are well-documented and are believed to bring the model predictions into closer agreement with measurements, especially for the winter months.
Global anthropogenic emissions were taken from EDGAR v4.2, with regional emissions overwritten by regional inventories such as the MIX Asian emission inventory over Asia [42], EMEP over Europe and NEI2011 over the US. Anthropogenic emissions over China of the standard scenario were taken from MEIC, except NH3 emissions, which were from PKU-NH3 [18]. Gridded monthly anthropogenic emissions for simulations conducted for other scenarios were customized and are summarized in Table 2. Parameterization of soil NOx emissions followed Hudman et al., (2012) [43]. Biomass burning emissions were taken from the Global Fire Emission Database version 4 (GFED v4) [44]. Biogenic non-methane volatile organic compound (NMVOC) emissions were calculated online by using the Model of Emissions of Gases and Aerosols from Nature version 2.1 (MEGAN v2.1) [45]. The model simulation results with hourly ground PM2.5 concentration observation data were verified and evaluated, which concluded that the improved model used in this study can better calculate the concentration and spatial distribution of PM2.5 in China on the whole, which also indicates that this model can be used for subsequent simulation studies [46].

3. Pollutant Reduction Potential

Before analyzing the environmental benefits of the application of ULE technology in CCPs and ICB by using GEOS-Chem, the pollutant reduction potential of ULE technology application in CPPs and ICB was analyzed. Based on MEIC, the total national NOx and SO2 emissions in 2015 were calculated as 23.7 Tg and 18.2 Tg, respectively (Figure 1). Among them, the amounts of NOx and SO2 emitted by the power sector were 5.1 Tg and 4.0 Tg, representing 21.5% and 21.9%, respectively; the amounts of NOx and SO2 emitted by the industrial sector were 9.7 Tg and 11.0 Tg, representing 40.9% and 60.4%, respectively. The ULE of CPPs in China (CHN) can reduce the NOx and SO2 of CPPs themselves by 87.0% and 93.3%, while the emission reduction of the whole power plant sector is 83.3% and 91.6%, accounting for 17.9% and 20.0% of the total NOx and SO2 emissions, respectively. If ULE facilities are installed both in CPPs and ICB, the total NOx and SO2 can be reduced by 34.2% (8.1 Tg) and 51.0% (9.3 Tg), respectively. Due to the differences in the industrial structure of coal-based energy in various provinces and regions, under the CPPs-ULE and CPPs-ICB-ULE scenarios, the emission reductions of NOx and SO2 are different. Environmental benefits are brought about by the reduction of NOx and SO2 in regions such as Beijing–Tianjin–Hebei (BTH), the Yangtze River Delta (YRD), the Sichuan–Chongqing Economic Circle (SCC) and the Pearl River Delta (PRD), etc., from the promotion of ULE technology nationwide.

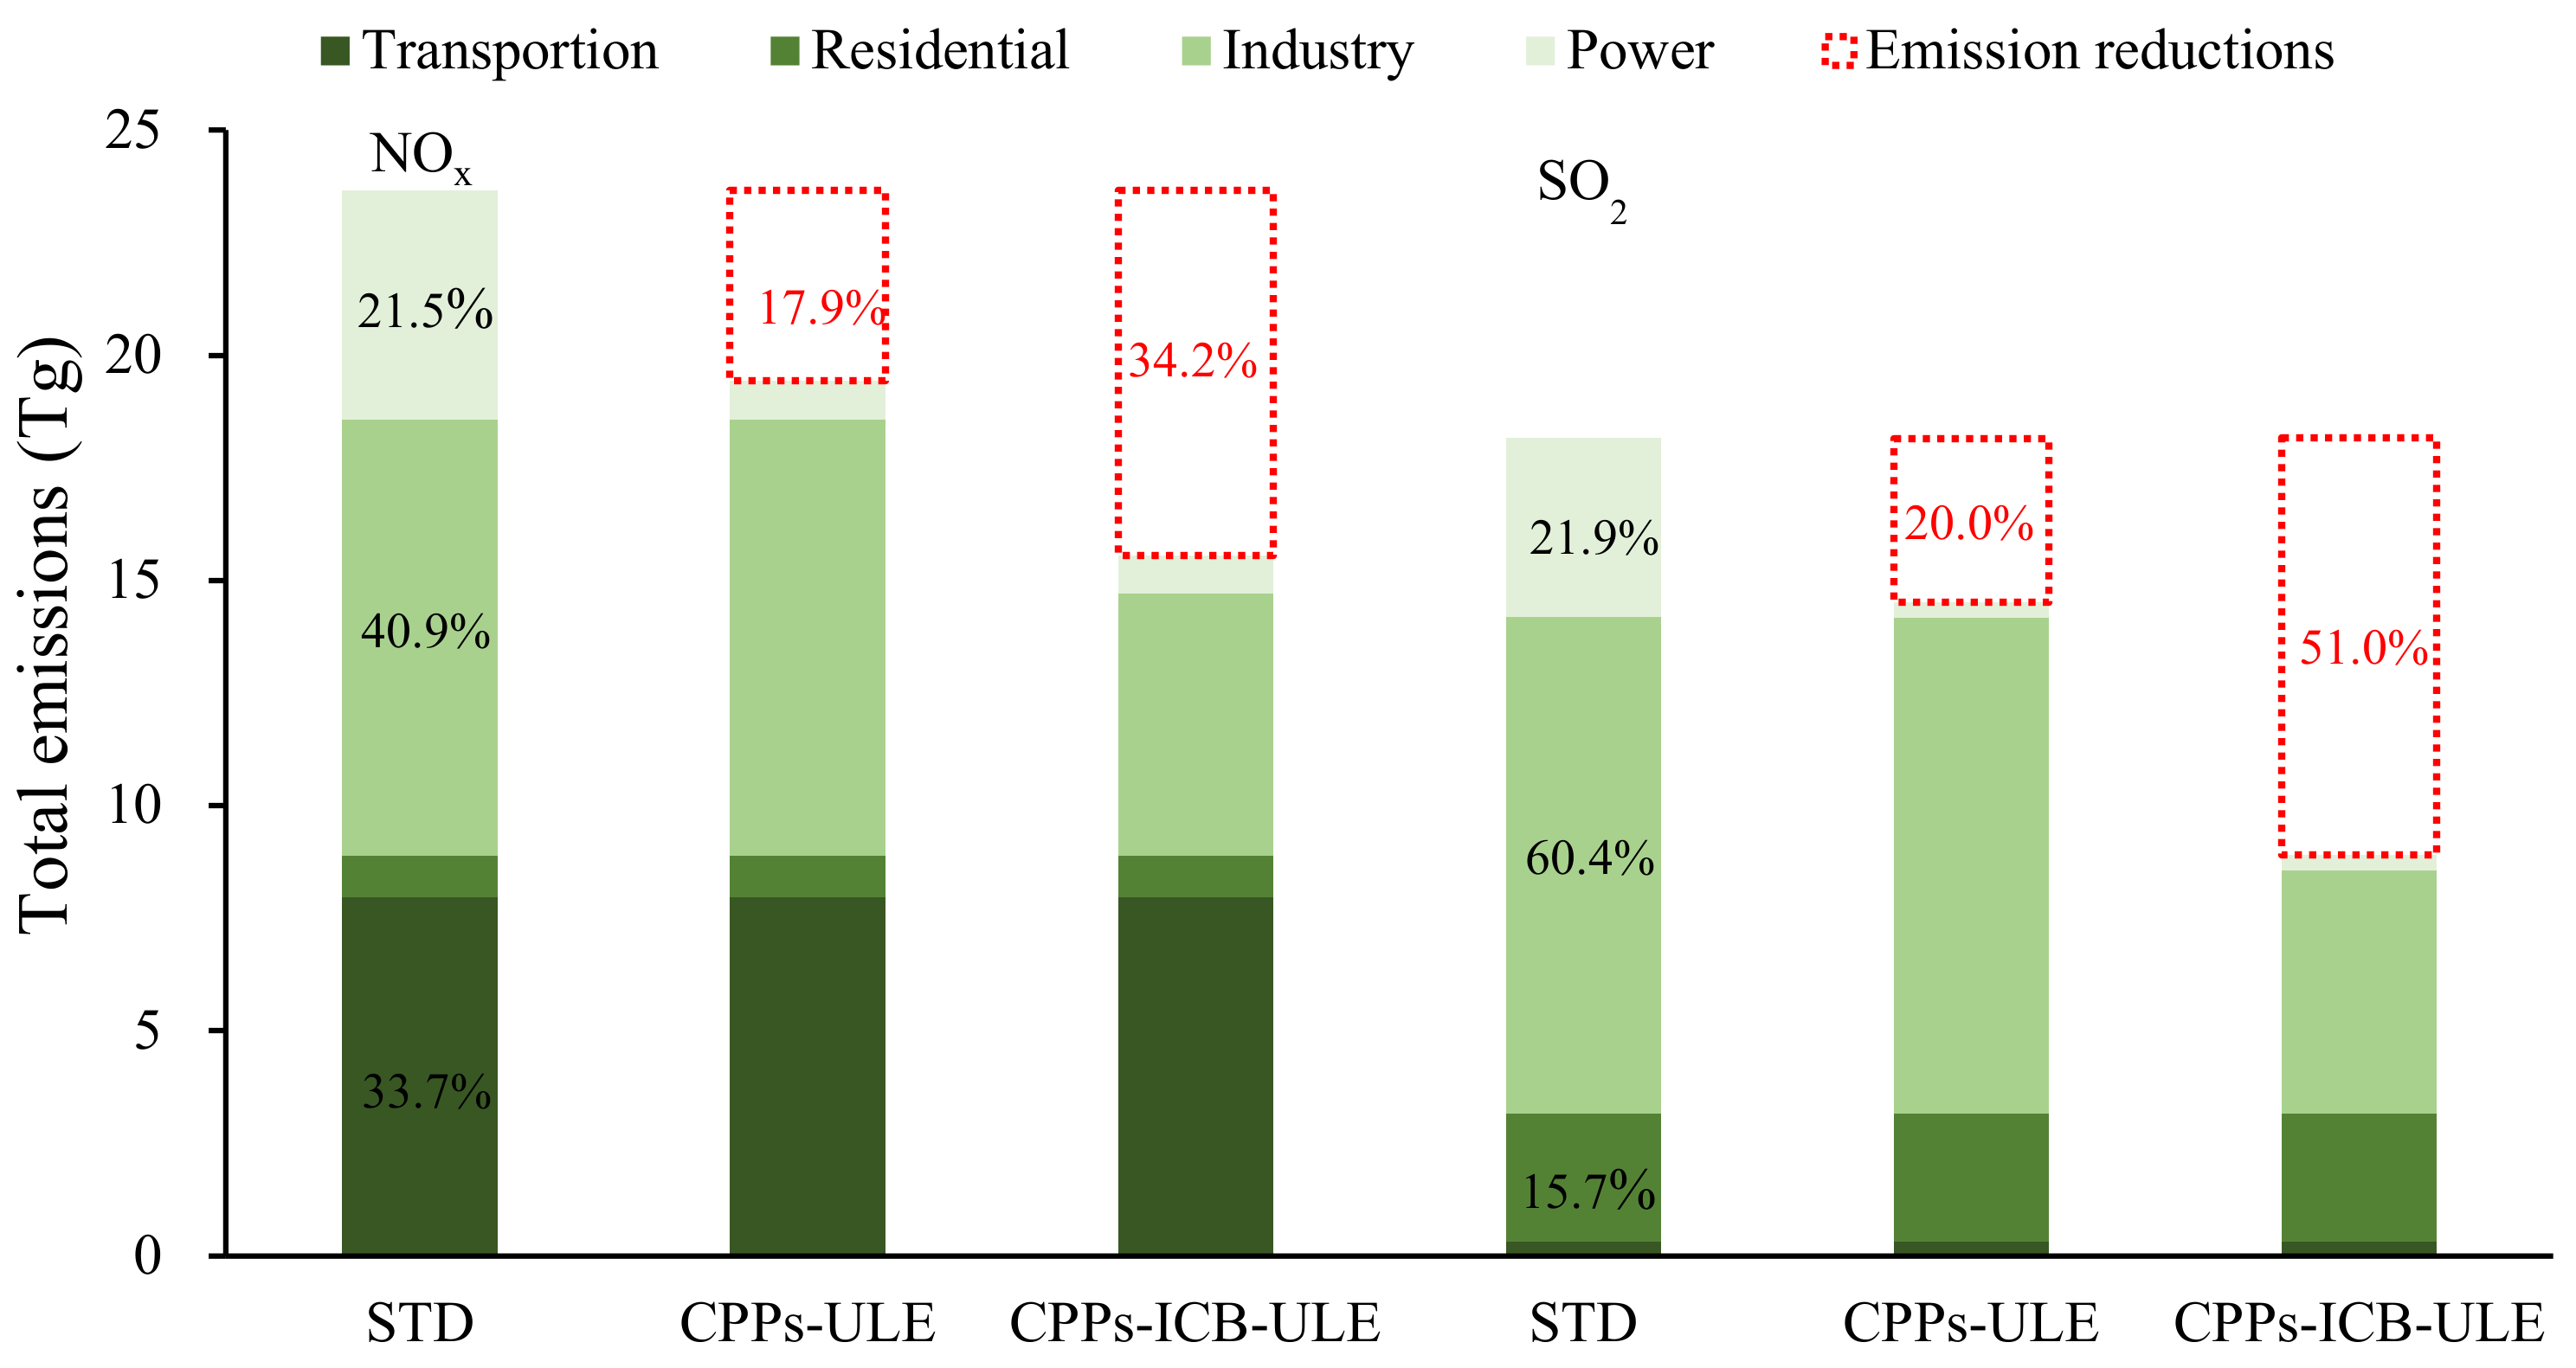
3.1. Regional Sector Emission Reduction

The reduction ratios of NOx and SO2 in the power industry and the total of different regions under different scenarios are shown in Figure 2. The ICB-ULE refers to the realization of ULE transformation in the ICB process, which was only used to calculate the pollutant reduction and does not quantify the corresponding environmental benefits separately.
As shown in Figure 2, under the CPPs-ULE scenario, the NOx and SO2 emission reductions in the power sector in BTH, YRD, SCC and PRD reached 76.2%, 81.4%, 85.4%, 77.2% and 85.2%, 87.1%, 96.4%, 85.9%, respectively. It can be seen that the emissions of CPPs account for an absolute proportion of the emissions of the power sector, and the ULE of CPPs has greatly reduced the emissions of NOx and SO2 from the power plants. The larger the reduction ratio of NOx and SO2 in the power sector, the more urgent it is to promote the ULE transformation, and the more significant the environmental benefits will be. Under the ICB-ULE scenario, the NOx and SO2 emission reductions of the industrial sectors in BTH, YRD, SCC and PRD reach 59.9%, 40.8%, 32.8%, 18.4% and 66.2%, 48.3%, 69.4%, 29.0%, respectively. The difference in the emission reduction ratio of NOx and SO2 reflects the difference in industrial structure. For BTH, the emission reduction ratio is as high as 60%, indicating that the ICB emissions occupy a dominant position, while for PRD, the emission reduction ratio is less than 1/3, indicating that the ICB emissions occupy a relatively small proportion in the industrial structure. The emission reductions of NOx and SO2 in the power and industrial sectors of BTH, YRD, SCC and PRD reach 64.3%, 55.0%, 42.6%, 42.1% and 68.6%, 58.3%, 73.5%, 45.9%, respectively, under the CPPs-ICB-ULE scenario.

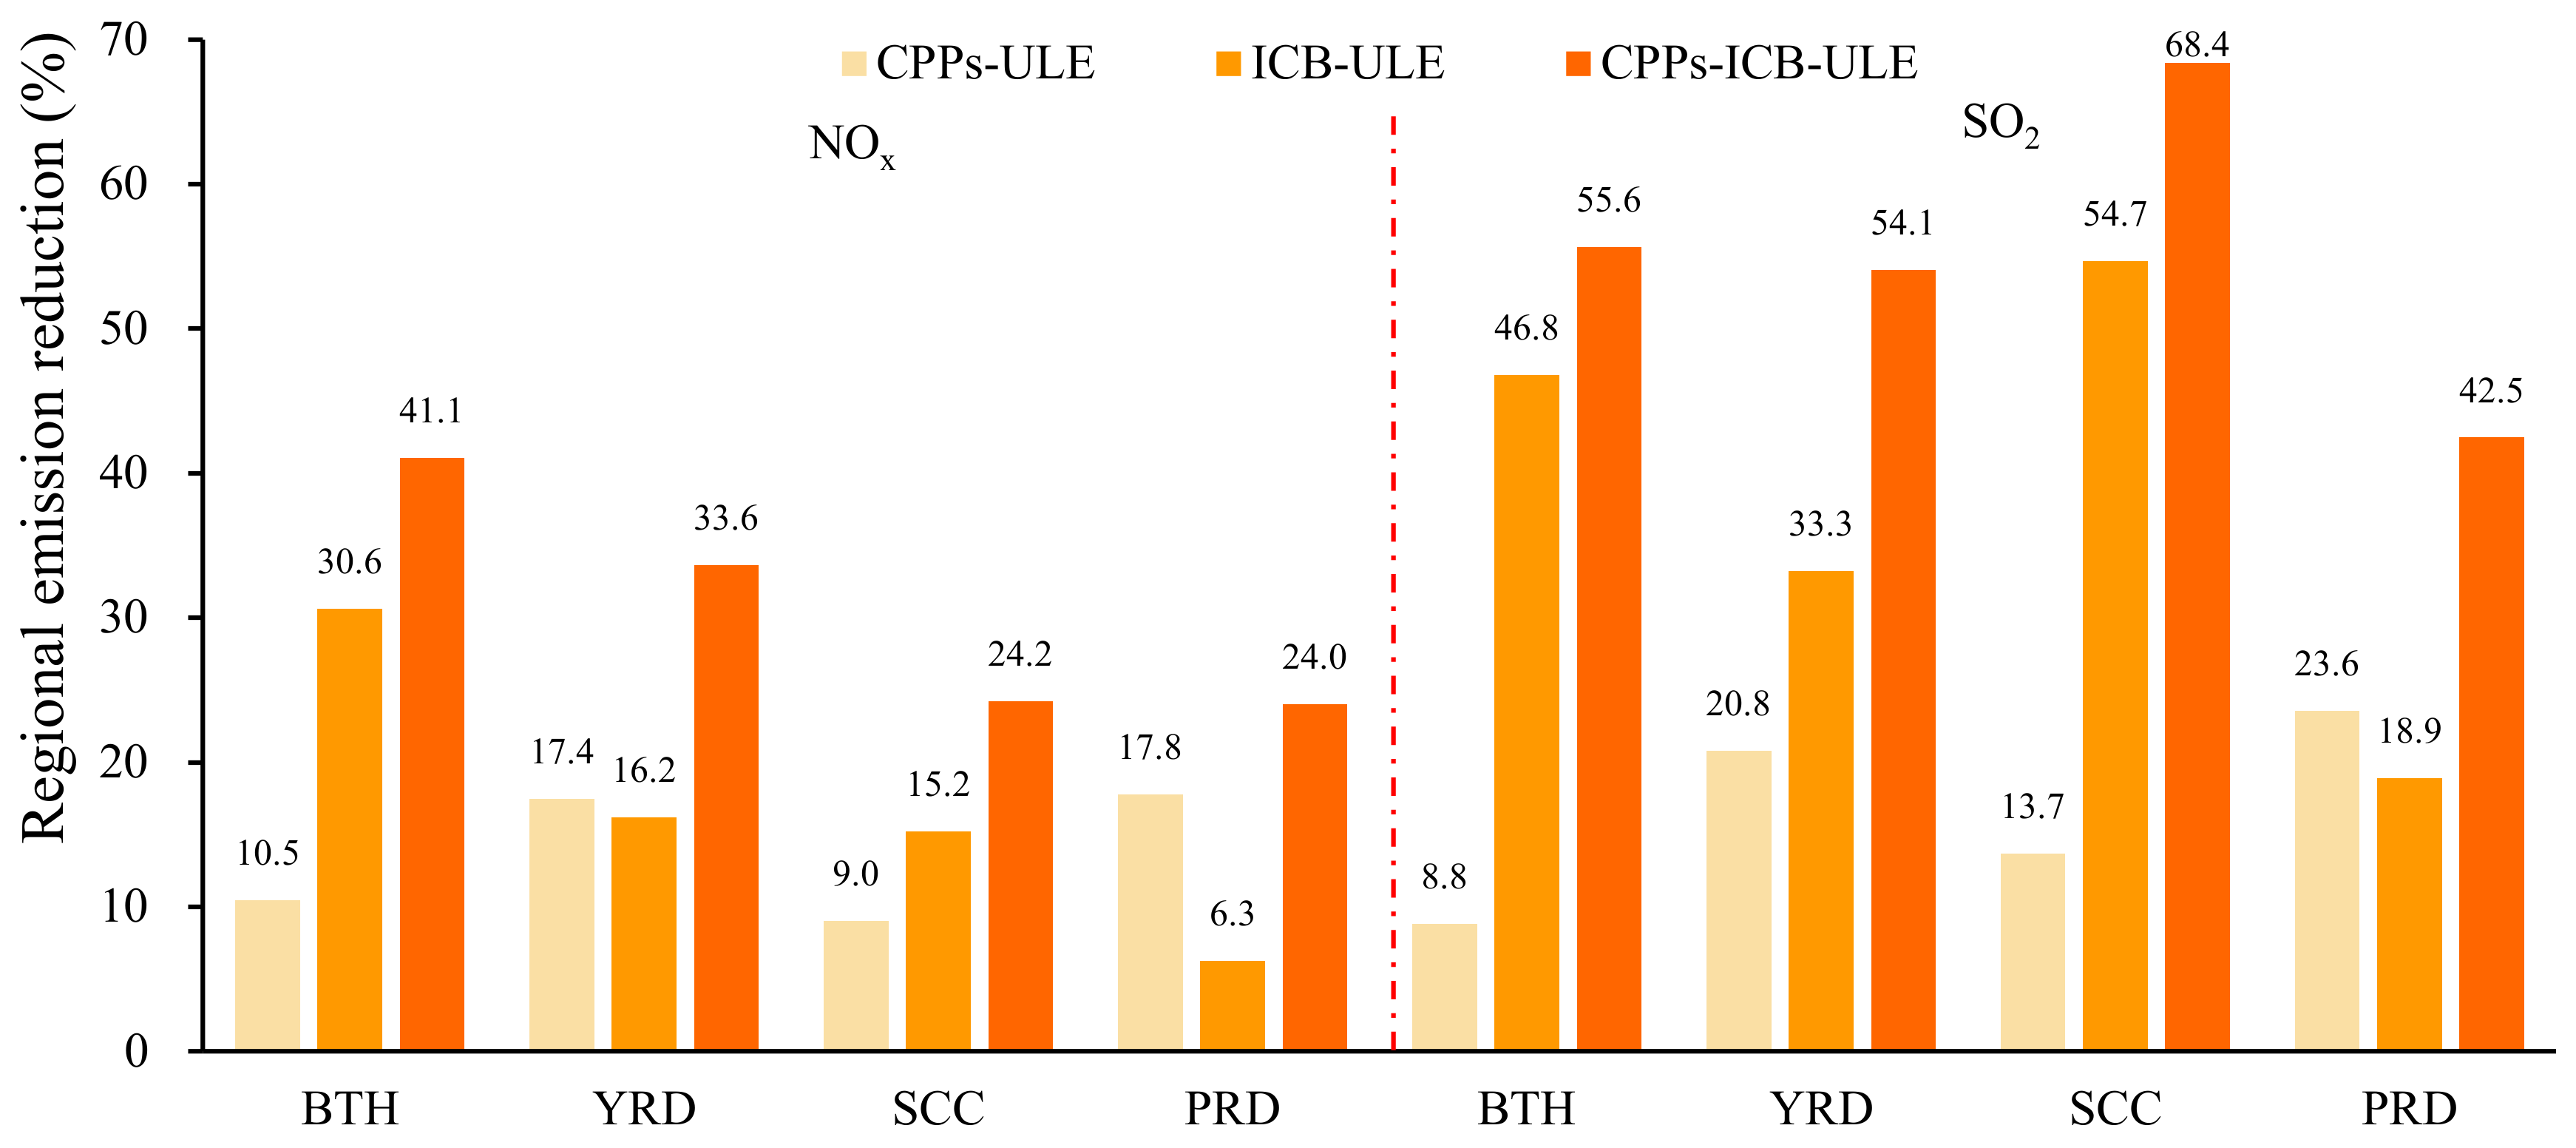
3.2. Regional Emission Reduction

The reduction ratios of NOx and SO2 in different regions under different scenarios are shown in Figure 3.
As shown in Figure 3, under the CPPs-ULE scenario, the NOx and SO2 emission reductions of the BTH, YRD, SCC and PRD regions reached 10.5%, 17.4%, 9.0%, 17.8% and 8.8%, 20.8%, 13.7%, 23.6%, respectively, in total NOx and SO2 emissions in each region. It can be seen that the ULE of CPPs in the BTH and YRD region reduced the total NOx and SO2 emissions in the region by around 10%, while the emission reduction of CPPs in the SCC and PRD region reduced the total NOx and SO2 emissions by around 20%. Under the ICB-ULE scenario, the emission reductions of NOx and SO2 in the industrial sectors of BTH, YRD, SCC and PRD reached 30.6%, 16.2%, 15.2%, 6.3% and 46.8%, 33.3%, 54.7%, 18.9%, respectively, in total NOx and SO2 emissions in each region. Under the CPPs-ICB-ULE scenario, the emission reductions of NOx and SO2 of BTH, YRD, SCC and PRD reached 41.1%, 33.6%, 24.2%, 24.0% and 55.6%, 54.1%, 68.4, 42.5%, respectively, in total NOx and SO2 emissions in each region.
For the BTH region, the NOx and SO2 emission reduction ratios for ICB-ULE are 2.9 and 5.3 times higher than CPPs-ULE, indicating that ICB-ULE in this region can significantly reduce pollutant emissions. For the YRD region, the NOx and SO2 emission reduction ratios for ICB-ULE are 0.9 and 1.6 times those of the CPPs-ULE. For the SCC region, the NOx and SO2 emission reduction ratios for ICB-ULE are 1.7 and 4.0 times higher than CPPs-ULE. For the PRD region, the NOx and SO2 emission reduction ratios for ICB-ULE are 1.7 and 4.0 times higher than CPPs-ULE. For the PRD region, the NOx and SO2 emission reduction ratios for ICB-ULE are 0.4 and 0.8 times those of the CPPs-ULE, indicating that the different emission reduction ratios of various regions are determined by differences in the energy industry structure.

4. Environmental Benefits of ULE

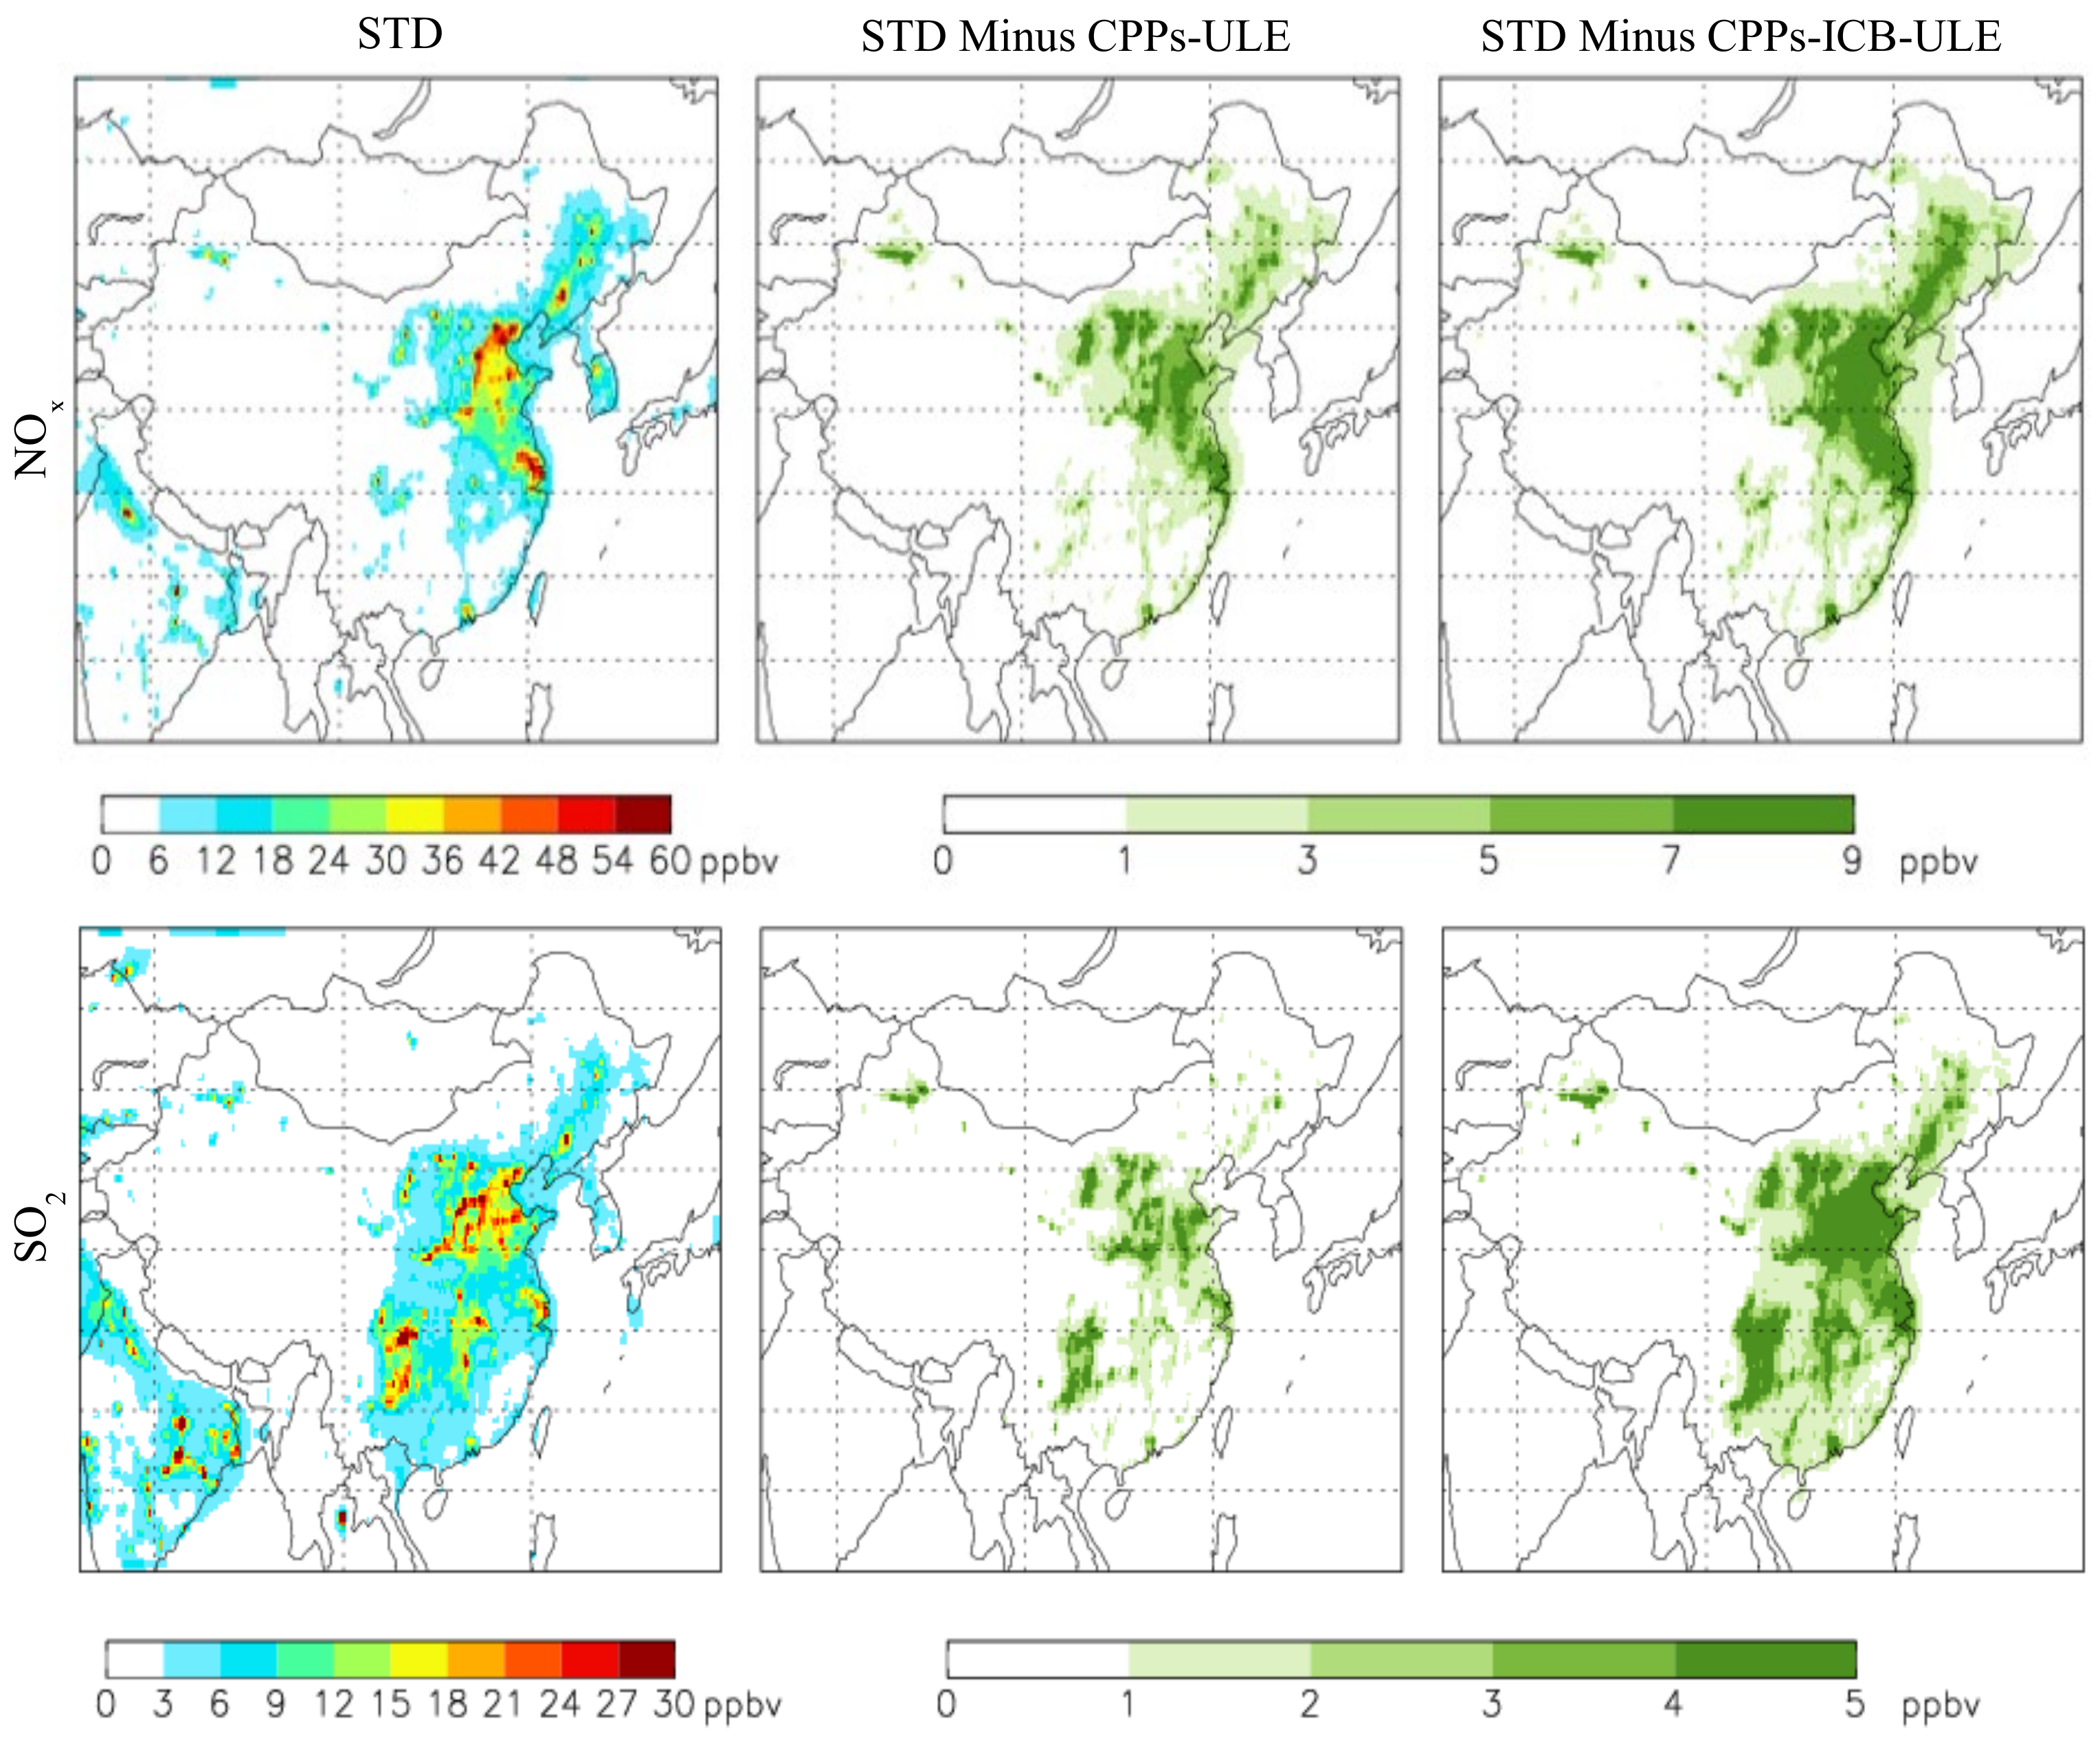
4.1. Benefits of Primary Pollutant Emission Reduction

The spatial distribution of the concentrations of the primary pollutants, NOx and SO2, under different scenarios based on GEOS-Chem simulation is shown in Figure 4.
Figure 4 shows that under the STD scenario, the average NOx concentration in January 2015 in the North China Plain and the Yangtze River Delta was as high as 42–60 ppbv. Over other densely populated regions in Eastern China, the concentration of NOx was 6–24 ppbv, while, in the central and western regions of China, due to the relatively weak human activities, the emission of NOx was relatively low. This concentration was also very low, only 0.5–6 ppbv. The spatial distribution of the SO2 concentration was slightly different from that of NOx. The difference lies in the high SO2 concentration of 15–30 ppbv in Chongqing, Guizhou and Hunan province, which is caused by the energy structure. Under the CPPs-ULE scenario, the NOx and SO2 emission reductions are mainly concentrated in high-value regions, and CPPs-ICB-ULE reduces the NOx and SO2 emissions more significantly than CPPs-ULE. Figure 5 shows the changes in the average concentrations of NOx and SO2 in different regions under different scenarios.
It can be seen from Figure 5 that, under the CPPs-ULE and CPPs-ICB-ULE scenarios, the concentration of NOx in the BTH region decreased from 24.9 ppbv to 20.7 ppbv and 13.5 ppbv, a decrease of 17.1% and 45.9%, respectively, while the concentration of SO2 was reduced from 11.4 ppbv to 10.2 ppbv and 6.5 ppbv, a decrease of 10.7% and 42.7%, respectively, compared with the STD scenario. Similarly, the concentration of NOx in the YRD region was reduced from 19.9 ppbv to 14.9 ppbv and 11.9 ppbv, a decrease of 25.2% and 40.1%, and the concentration of SO2 was decreased from 7.7 ppbv to 6.0 ppbv and 3.8 ppbv, a decrease of 22.0% and 51.0%, respectively. The concentration of NOx in the SCC region decreased from 4.6 ppbv to 3.8 ppbv and 3.3 ppbv, a decrease of 25.2% and 40.1%, and the concentration of SO2 decreased from 8.9 ppbv to 7.3 ppbv and 4.8 ppbv, a decrease of 18.6% and 45.9%, respectively. The concentration of NOx in the PRD region was reduced from 6.8 ppbv to 5.3 ppbv and 4.6 ppbv, a reduction of 23.0% and 33.1%, and the concentration of SO2 was reduced from 4.0 ppbv to 3.1 ppbv and 2.0 ppbv, a reduction of 23.0% and 49.4%, respectively. The concentration of NOx in the CHN region was reduced from 5.0 ppbv to 3.8 ppbv and 3.0 ppbv, a decrease of 24.7% and 39.8%, and the concentration of SO2 was reduced from 3.6 ppbv to 2.9 ppbv and 2.2 ppbv, a decrease of 18.4% and 40.0%, respectively. By comparison with the actual emission reductions of NOx and SO2 in the different regions in Figure 1 and Figure 3, it can be seen that the emission reduction ratio of primary pollutants NOx and SO2 is not consistent with the actual emission reduction ratio. For example, in the CPPs-ULE and CPPs-ICB-ULE scenarios, the actual NOx and SO2 emission reduction ratios corresponding to BTH are 10.5%, 41.1%, 8.8% and 55.6%, while the corresponding primary pollutant emission reduction ratios are 17.1%, 45.9%, 10.7% and 42.7%, which is mainly because the actual NOx and SO2 emitted into the atmosphere is also affected by atmospheric transport [47]. It is also affected by complex atmospheric chemical reactions [48,49].

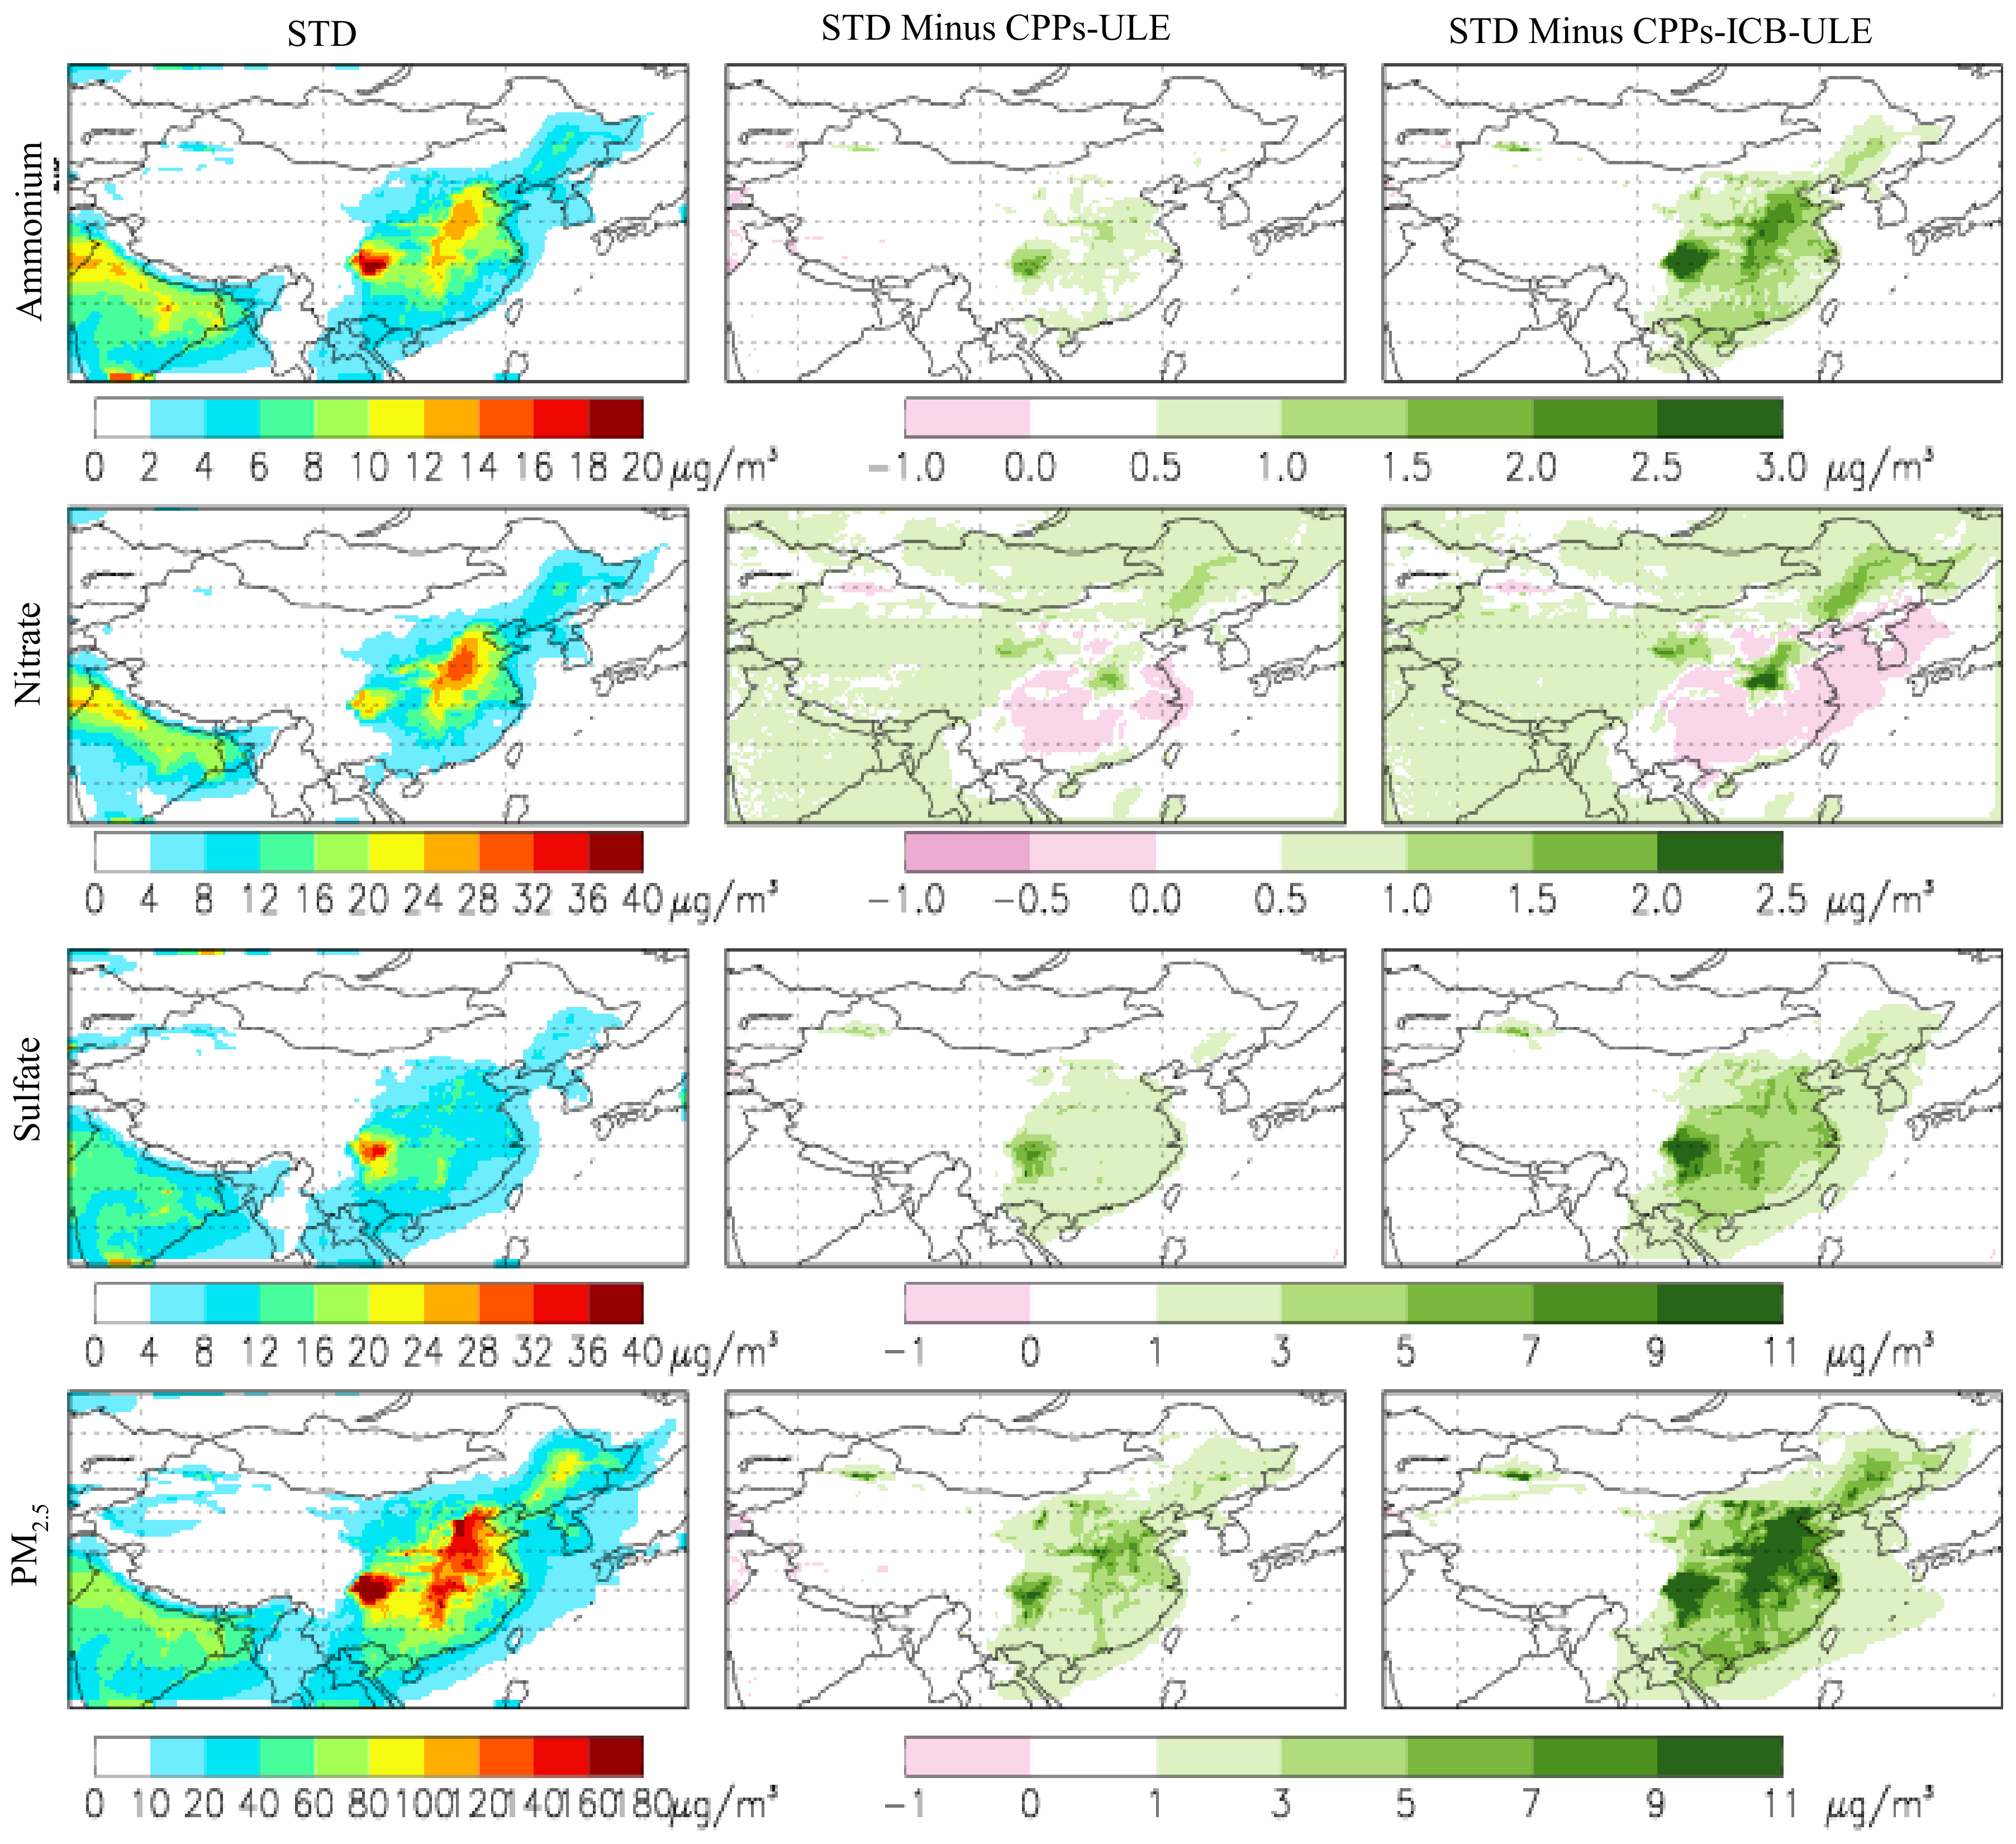
4.2. Benefits of Secondary Pollutant Emission Reduction

The spatial distribution of the concentrations of the secondary pollutants, ammonium, nitrate, sulfate and PM2.5, under different scenarios based on GEOS-Chem simulation is shown in Figure 6.
It can be seen from Figure 6 that the high-value regions of ammonium, nitrate and sulfate in January 2015 are not consistent under the STD scenario. The high-value regions of ammonium are mainly concentrated in North China, Central China and the SCC regions. Among them, the high ammonium concentration in SCC is greater than 14 μg/m3, while in North and Central China, the high ammonium salt concentration is 6–14 μg/m3. The high concentration of nitrate is also mainly concentrated in North China, Central China and the SCC regions. The high-value region in North China has a concentration greater than 32 μg/m3, while that in the high-value region in SCC is relatively low, at 12–32 μg/m3. The concentration distribution of sulfate is mainly concentrated in the SCC region, and the concentration is usually 16–36 μg/m3. Ammonium, nitrate and sulfate are important components of PM2.5, so the high concentration of PM2.5 is a combination of the three, mainly concentrated in the North China, Central China and SCC regions, where the PM2.5 concentration in some regions is greater than 180 μg/m3.
Under the CPPs-ULE scenario, the reduction in the ammonium concentration is mainly concentrated in Central China, South China and the SCC region, especially in the SCC region, where it is as high as 3 μg/m3 compared with the STD scenario. The decrease in the nitrate concentration occurs mainly in the northeast, Henan and part of the western regions. Among them, the nitrate concentration in Henan decreased from 24.9 μg/m3 to 24.4 μg/m3, a decrease of 2.0%, while in Urumqi, North China, SCC, the PRD and South China, the concentration of nitrate increased. The decrease in the sulfate concentration was mainly concentrated in North China, Central China, Southeastern China and the SCC regions. Among them, the concentration of sulfate in SCC decreased by as much as 11 μg/m3. The concentration of PM2.5 decreased mainly in Xinjiang Urumqi, North China, Central China, SCC and other economically developed and popular regions in Southern and Eastern China.
Under the CPPs-ICB-ULE scenario, the ICB has achieved ULE, further reducing NOx and SO2 emissions, making the national emission reductions of ammonium, sulfate and PM2.5 more obvious. The nitrate reduction regions are also concentrated in Northeast China, Henan and part of the western regions. Among them, the decrease in Henan is more obvious (reduced by 4.9%), while in Urumqi, North China, South China, SCC and PRD, the concentration of nitrate increased more significantly.
The formation of ammonium, nitrates and sulfates in the atmosphere is all related to NH3 emissions, and there is a competition mechanism between nitrates and sulfates [17]: the ammonium ions (NH4+) in the atmosphere are more likely to combine with sulfate ions (SO42−) to generate ammonium sulfate ((NH4)2SO4). Only when NH3 is abundant will it continue to react with nitrate ions (NO3) to produce ammonium nitrate (NH4NO3), so the reaction between inorganic substances has the following four situations: (a) the emission of NH3 is particularly low, and there are not enough NH4+ combined with SO42−; as a result, ammonium hydrogen sulfate (NH4HSO4) is formed instead of (NH4)2SO4, and no NH4NO3 is formed at this time; (b) the emission of NH3 is less, and there is enough NH4+ combined with SO42− to form (NH4)2SO4 and NH4HSO4, but no NH4NO3 is formed; (c) the emission of NH3 is greater, there is enough NH4+ combined with SO42− to form (NH4)2SO4, and the remaining NH4+ combines with NO3 to form NH4NO3, but cannot completely consume NO3; (d) the emission of NH3 is sufficient, and there is enough NH4+ combined with SO42− to form (NH4)2SO4, and the remaining NH4+ is enough to combine with the NO3 to form a sufficient amount of NH4NO3.
It can be seen that under the CPPs-ULE and CPPs-ICB-ULE scenarios, the primary pollutant NOx and SO2 emissions are significantly reduced, while the NH3 emissions in different regions remain unchanged. Based on the competition mechanism between nitrate and sulfate, the concentration of ammonium and sulfate decreases, while the concentration of nitrate decreases in some regions, but increases in other regions. The main reason is that NOx and SO2 are greatly reduced, which reduces the concentration of NO3 and SO42− in the atmosphere. For regions with low NH3 emissions, because NH3 emissions are lower, NH4+ can only be combined with SO42−, and it is not sufficient to consume all of it. After SO2 emission reduction, NH4+, originally combined with SO42−, can be combined with SO42− to form NH4HSO4, but cannot be combined with NO3 to form nitrate, thus reducing the concentrations of ammonium, nitrate and sulfate.
For regions with high NH3 emissions, because NH3 emissions are high, NH4+ will consume all the SO42−, but it is not enough to combine with all NO3. When SO2 is reduced, the NH4+ originally combined with SO42− will combine with the remaining NO3 to form NH4NO3, so the concentration of nitrate will increase, and there will be surplus after the combination of NH4+ and NO3, which cannot form ammonium. Thus, the concentration of ammonium will also decrease.
Because the sulfur content of coal used in different regions, power plant boiler technology, industrial coal use, agricultural NH3 emissions, etc., are different, their individual NOx, SO2 and NH3 emission ratios are different, which makes the implementation of ULE reduction technology challenging. The emission reduction effects in the past were different, which is ultimately reflected in the different non-linear chemical mechanisms between ammonium, nitrate and sulfate in the atmosphere of various provinces and regions, which affects the environmental benefits brought about by emission reduction policies. Therefore, in order to better reduce the concentration of PM2.5, the SCC region should focus on the emission reduction of ammonium and sulfate precursors NH3 and SO2, while, for the North and Central China areas, the focus should be on the reduction of ammonium and nitrate precursors NH3 and NOx.
It can be seen from Figure 7 that, under the CPPs-ULE scenario, the emissions of primary pollutants NOx and SO2 are significantly reduced (24.7% and 18.4%), causing the CHN concentrations of ammonium, nitrate, sulfate and PM2.5 to decrease from 3.1 μg/m3, 5.0 μg/m3, 4.7 μg/m3 and 28.2 μg/m3 to 2.9 μg/m3, 5.1 μg/m3, 3.9 μg/m3 and 26.8 μg/m3, and decrease by 7.5%, −1.5%, 16.9% and 4.9%, respectively. Under the CPPs-ICB-ULE scenario, the emissions of primary pollutants NOx and SO2 are reduced (39.8% and 40.0%), reducing the CHN ammonium, nitrate, sulfate and PM2.5 concentrations to 2.6 μg/m3, 5.2 μg/m3, 3.0 μg/m3 and 25.3 μg/m3, which were reduced by 16.5%, −2.7%, 35.2%, and 10.1%, respectively.
In CPPs and ICB, the application of ULE reduction technology can greatly reduce the NOx and SO2 emissions, and then decrease ammonium sulfate and PM2.5 concentrations, but it increases the concentration of nitrate; therefore, the CHN regional NH3 emissions are too high, and only NOx and SO2 emissions are reduced; therefore, this is not the best method to reduce PM2.5 measures, and other methods should be considered according to different regional condition NH3 emissions.
Under the CPPs-ULE scenario, the BTH concentrations of ammonium, nitrate, sulfate and PM2.5 decreased from 6.8 μg/m3, 14.0 μg/m3, 7.3 μg/m3 and 75.8 μg/m3 to 6.4 μg/m3, 14.0 μg/m3, 6.3 μg/m3 and 73.4 μg/m3, respectively, which decreased by 5.0%, −0.2%, 13.2% and 3.1%, respectively. With the realization of ULE of CPPs in the BTH region, the emissions of primary pollutants NOx and SO2 were significantly reduced (17.1% and 10.7%), leading to a significant decrease in the concentration of ammonium and sulfate. However, due to the competition mechanism between nitrate and sulfate, the concentration of nitrate was increased, but the proportion of the increase in nitrate concentration was relatively low (0.2%). Under the CPPs-ICB-ULE scenario, the emissions of primary pollutants NOx and SO2 were reduced (45.9% and 42.7%), which could reduce the concentrations of ammonium, nitrate, sulfate and PM2.5 in the BTH region to 5.7 μg/m3, 14.1 μg/m3, 4.3 μg/m3 and 68.6 μg/m3, respectively, compared to the baseline scenario, which indicates reductions of 15.7%, −0.3%, 40.7% and 9.5%, respectively. It can be seen that for the BTH region, there are greater NH3 emissions, but the region is not particularly affluent, because the concentration of nitrate under the different scenarios only increases by 0.2% and 0.3%.
Under the CPPs-ULE scenario, the emissions of primary pollutants NOx and SO2 are significantly reduced (25.2% and 22.0%), causing the YRD concentrations of ammonium, nitrate, sulfate and PM2.5 to decrease from 7.3 μg/m3, 14.0 μg/m3, 9.2 μg/m3 and 72.8 μg/m3 to 6.8 μg/m3, 14.5 μg/m3, 7.3 μg/m3 and 69.5 μg/m3, respectively, which are decreased by 6.1%, −3.9%, 20.3% and 4.5%, respectively. Under the CPPs-ICB-ULE scenario, the emissions of primary pollutants NOx and SO2 are reduced (40.1% and 51.0%), which can reduce the concentrations of ammonium, nitrate, sulfate and PM2.5 in the YRD region to 6.2 μg/m3, 15.1 μg/m3, 5.0 μg/m3 and 65.8 μg/m3, respectively, compared to the baseline scenario, with reductions of 14.7%, −8.2%, 45.9% and 9.6%, respectively. It can be seen that, compared with the BTH region, YRD is richer in NH3 emissions. After the ULE of CPPs is completed, the nitrate concentration is increased by 3.9%. With the completion of the ULE of ICB, it has further reduced the emissions of NOX and SO2 and has increased the concentration of nitrate to 8.2%. The YRD region pays more attention to NH3 emission reduction control than the BTH region.
Under the CPPs-ULE scenario, the emissions of primary pollutants NOx and SO2 are significantly reduced (15.2% and 18.6%), causing the SCC concentrations of ammonium, nitrate, sulfate and PM2.5 to decrease from 7.9 μg/m3, 10.3 μg/m3, 13.5 μg/m3 and 69.6 μg/m3 to 7.2 μg/m3, 11.1 μg/m3, 10.8 μg/m3 and 66.4 μg/m3, respectively, amounting to reductions of 8.8%, −7.5%, 20.0% and 4.6%, respectively. Under the CPPs-ICB-ULE scenario, the emissions of primary pollutants NOx and SO2 are reduced (26.1% and 45.9%), which can reduce the concentrations of ammonium, nitrate, sulfate and PM2.5 in the SCC region to 6.3 μg/m3, 11.7 μg/m3, 7.8 μg/m3 and 62.4 μg/m3, respectively, compared to the baseline scenario, with reductions of 20.3%, −13.4%, 42.2% and 10.4%, respectively. It can be seen that, compared with the BTH and YRD regions, SCC has the most abundant NH3 emissions. After the ULE of CPPs is completed, the nitrate concentration is increased by 7.5%. With the completion of the ULE of ICB, it has further reduced the emissions of NOX and SO2 and has increased the concentration of nitrate to 13.4%. The SCC region is in urgent need of NH3 emission control compared with the PRD region.
Under the CPPs-ULE scenario, the emissions of primary pollutants NOx and SO2 are significantly reduced (23.0% and 23.0%), causing the PRD concentrations of ammonium, nitrate, sulfate and PM2.5 to decrease from 4.8 μg/m3, 5.9 μg/m3, 8.2 μg/m3 and 44.3 μg/m3 to 4.2 μg/m3, 6.0 μg/m3, 6.7 μg/m3 and 41.6 μg/m3, respectively, amounting to reductions of 11.4%, −1.0%, 18.8% and 6.2%, respectively. Under the CPPs-ICB-ULE scenario, the emissions of primary pollutants NOx and SO2 are reduced (33.1% and 49.4%), which can reduce the concentrations of ammonium, nitrate, sulfate and PM2.5 in the PRD region to 3.6 μg/m3, 6.2 μg/m3, 4.9 μg/m3 and 38.7 μg/m3, respectively, compared to the baseline scenario, with reductions of 23.9%, −4.9%, 40.5% and 12.7%, respectively.
It can be seen that the PRD area has more NH3 emissions than the BTH, but it is not richer than YRD and SCC. Therefore, after the ULE of CPPs is completed, the nitrate concentration is increased by 1.0%. With the completion of the ULE of ICB, it has further reduced the emissions of NOX and SO2 and has increased the concentration of nitrate to 4.9%.

4.3. Environmental Benefits of NH3 Emission Reduction

The spatial distribution of the concentrations of secondary pollutants, ammonium, nitrate, sulfate and PM2.5, under the NH3 emission reduction control scenario based on GEOS-Chem simulation is shown in Figure 8.
As can be seen from Figure 8, under the CPPs-ULE-NH3-30% scenario, the ULE of CPPs with NH3 emission reduced by 30% at the same time can cause the national ammonium, nitrate and PM2.5 concentrations to significantly decrease, and the concentration of sulfate has no obvious change relative to the STD scenario. The main reason for this is the reduction of NH3 in the atmosphere, which reduces the concentration of NH4+. Because of the non-linear mechanism of ammonium, nitrate and sulfate, NH4+ is preferentially combined with SO42− to form sulfate, and there is not enough NH4+ to combine with NO3 to produce nitrate, so the concentration of ammonium and nitrate is significantly reduced. As the NH3 emission reduction reaches 50%, the concentrations of ammonium, nitrate and PM2.5 can still be further reduced, but this cannot cause a significant change in the concentration of sulfate. This shows that when NH3 is reduced by 50%, the combination of NH4+ and SO42− is not affected. In order to better reduce PM2.5, the emission of one or more pollutants can be further reduced according to the cost of the emission reduction of NOx, SO2 and NH3. On the basis of CPPs-ICB-ULE, the NH3 emission reduction was 30% and 50%, respectively, making the changes of ammonium salt, nitrate, sulfate and PM2.5 in the atmosphere consistent with the changes in the NH3 emission reduction on the basis of CPPs-ULE. NH3 emission reduction can significantly reduce the concentration of nitrate while reducing the ammonium and sulfate in PM2.5.
As can be seen from Figure 9, compared with the STD scenario, NH3 was reduced by 30% on the basis of CPPs-ULE, and the concentrations of CHN ammonium, nitrate, sulfate and PM2.5 decreased from 3.1 μg/m3, 5.0 μg/m3, 4.7 μg/m3 and 28.2 μg/m3 to 2.4 μg/m3, 3.7 μg/m3, 3.9 μg/m3 and 24.9 μg/m3, amounting to reductions of 21.8%, 26.0%, 17.3% and 11.5%, respectively. With the reduction of NH3 by 50%, the concentration of CHN ammonium, nitrate, sulfate and PM2.5 decreased to 2.1 μg/m3, 2.7 μg/m3, 3.8 μg/m3 and 23.5 μg/m3, with reductions of 33.4%, 46.8%, 17.8% and 16.5%, respectively. Compared with the STD scenario, NH3 was reduced by 30% on the basis of CPPs-ICB-ULE, and the concentrations of CHN ammonium, nitrate, sulfate and PM2.5 were reduced to 2.2 μg/m3, 4.0 μg/m3, 3.0 μg/m3 and 23.8 μg/m3, amounting to 28.3%, 20.7%, 35.4% and 15.6%, respectively. With the reduction of NH3 by 50%, the concentrations of CHN ammonium, nitrate, sulfate and PM2.5 decreased to 1.9 μg/m3, 3.0 μg/m3, 3.0 μg/m3 and 22.4 μg/m3, amounting to 38.4%, 40.4%, 35.6% and 20.3%, respectively.
Compared with the STD scenario, NH3 was reduced by 30% on the basis of CPPs-ULE, and the concentrations of BTH ammonium, nitrate, sulfate and PM2.5 decreased from 6.8 μg/m3, 14.0 μg/m3, 7.3 μg/m3 and 75.8 μg/m3 to 5.4 μg/m3, 10.8 μg/m3, 6.2 μg/m3 and 69.0 μg/m3, amounting to 20.0%, 23.1%, 14.8% and 8.9%, respectively. With the reduction of NH3 by 50%, the concentration of BTH ammonium, nitrate, sulfate and PM2.5 decreased to 4.5 μg/m3, 8.0 μg/m3, 6.1 μg/m3 and 65.2 μg/m3, amounting to 33.0%, 42.8%, 16.5% and 13.9%, respectively. Compared with the STD scenario, NH3 was reduced by 30% on the basis of CPPs-ICB-ULE, and the concentrations of BTH ammonium, nitrate, sulfate and PM2.5 were reduced to 4.9 μg/m3, 11.4 μg/m3, 4.3 μg/m3 and 65.1 μg/m3, which were reduced by 18.4%, 20.7%, 41.5% and 14.1%, respectively. With the reduction of NH3 by 50%, the concentration of BTH ammonium, nitrate, sulfate and PM2.5 decreased to 4.1 μg/m3, 9.0 μg/m3, 4.2 μg/m3 and 61.8 μg/m3, which were reduced by 38.6%, 36.0%, 42.4% and 18.4%, respectively.
Compared with the STD scenario, NH3 was reduced by 30% on the basis of CPPs-ULE, and the concentrations of YRD ammonium, nitrate, sulfate and PM2.5 decreased from 7.3 μg/m3, 14.0 μg/m3, 9.2 μg/m3 and 72.8 μg/m3 to 5.5 μg/m3, 10.2 μg/m3, 7.3 μg/m3 and 63.8 μg/m3, which were reduced by 24.6%, 26.8%, 21.0% and 12.3%, respectively. With the reduction of NH3 by 50%, the concentration of YRD ammonium, nitrate, sulfate and PM2.5 decreased to 4.4 μg/m3, 7.0 μg/m3, 7.2 μg/m3 and 59.5 μg/m3, which were reduced by 39.0%, 49.5%, 21.7% and 18.2%, respectively. Compared with the STD scenario, NH3 was reduced by 30% on the basis of CPPs-ICB-ULE, and the concentrations of YRD ammonium, nitrate, sulfate and PM2.5 were reduced to 5.0 μg/m3, 11.2 μg/m3, 4.9 μg/m3 and 60.8 μg/m3, amounting to 30.6%, 19.5%, 46.3% and 16.5%, respectively. With the reduction of NH3 by 50%, the concentrations of CHN ammonium, nitrate, sulfate and PM2.5 decreased to 4.1 μg/m3, 8.1 μg/m3, 4.9 μg/m3 and 56.7 μg/m3, which were reduced by 43.7%, 41.7%, 46.7% and 22.1%, respectively.
Compared with the STD scenario, NH3 was reduced by 30% on the basis of CPPs-ULE, and the concentrations of SCC ammonium, nitrate, sulfate and PM2.5 decreased from 7.9 μg/m3, 10.3 μg/m3, 13.5 μg/m3 and 69.6 μg/m3 to 6.0 μg/m3, 7.1 μg/m3, 10.7 μg/m3 and 61.2 μg/m3, which were reduced by 24.4%, 30.7%, 20.3% and 12.1%, respectively. With the reduction of NH3 by 50%, the concentrations of SCC ammonium, nitrate, sulfate and PM2.5 decreased to 5.0 μg/m3, 4.2 μg/m3, 10.7 μg/m3 and 57.2 μg/m3, which were reduced by 37.2%, 59.1%, 20.4% and 17.8%, respectively. Compared with the STD scenario, NH3 was reduced by 30% on the basis of CPPs-ICB-ULE, and the concentrations of SCC ammonium, nitrate, sulfate and PM2.5 were reduced to 5.3 μg/m3, 8.5 μg/m3, 7.8 μg/m3 and 58.2 μg/m3, which were reduced by 32.4%, 17.4%, 42.4% and 16.3%, respectively. With the reduction of NH3 by 50%, the concentrations of SCC ammonium, nitrate, sulfate and PM2.5 decreased to 4.5 μg/m3, 5.7 μg/m3, 7.7 μg/m3 and 54.5 μg/m3, which were reduced by 43.3%, 45.0%, 42.5% and 21.7%, respectively.
Compared with the STD scenario, NH3 was reduced by 30% on the basis of CPPs-ULE, and the concentrations of PRD ammonium, nitrate, sulfate and PM2.5 decreased from 4.8 μg/m3, 5.9 μg/m3, 8.2 μg/m3 and 44.3 μg/m3 to 3.5 μg/m3, 3.8 μg/m3, 6.7 μg/m3 and 38.7 μg/m3, which were reduced by 25.5%, 36.2%, 19.0% and 12.7%, respectively. With the reduction of NH3 by 50%, the concentrations of PRD ammonium, nitrate, sulfate and PM2.5 decreased to 3.1 μg/m3, 2.4 μg/m3, 6.7 μg/m3 and 36.8 μg/m3, which were reduced by 35.3%, 59.7%, 19.2% and 17.0%, respectively. Compared with the STD scenario, NH3 was reduced by 30% on the basis of CPPs-ICB-ULE, and the concentrations of PRD ammonium, nitrate, sulfate and PM2.5 were reduced to 3.0 μg/m3, 4.2 μg/m3, 4.9 μg/m3 and 36.1 μg/m3, which were reduced by 36.5%, 29.5%, 40.6% and 18.6%, respectively. With the reduction of NH3 by 50%, the concentrations of CHN ammonium, nitrate, sulfate and PM2.5 decreased to 2.6 μg/m3, 2.8 μg/m3, 4.9 μg/m3 and 34.2 μg/m3, amounting to reductions of 45.3%, 53.1%, 40.6% and 22.7%, respectively.

4.4. Discussion

Although the CPPs have achieved the ULE transformation target, the PM2.5 concentration across the country has decreased by 4.8% (1.4 μg/m3) compared with January 2015, and haze pollution is still very serious. In addition, ammonium, nitrate and sulfate are important components of PM2.5. Due to the complex non-linear chemical competition mechanism among them, the average concentration of nitrate in CHN increases by 1.5% (0.1 μg/m3) under the condition of a large reduction in NOx and SO2 emissions, which reduces the environmental benefits of power plant emission reduction. If the ULE technology is applied to the ICB to further reduce NOx and SO2, although the PM2.5 concentration can be reduced by 10.1% (2.9 μg/m3), the concentration of nitrate will increase by 2.7% (0.2 μg/m3). It can be seen that reducing the emission of NOx and SO2 does not reduce the concentration of PM2.5 well, and the haze pollution is still very serious.
On the basis of CPPs-ULE, NH3 emissions are reduced by 30%, which can reduce the national PM2.5 concentration by 11.5% (reduced by 3.3 μg/m3), by significantly reducing the ammonium (reduced by 21.8%) and nitrate (reduced by 26.0%) concentrations, to achieve a better PM2.5 reduction effect than ULE of ICB. If the NH3 emission reduction reaches 50%, the concentrations of ammonium (reduced by 33.4%), nitrate (reduced by 46.8%) and sulfate can be further reduced, and the PM2.5 concentration can be reduced by 16.5% (4.7 μg/m3). Similarly, on the basis of CPPs-ICB-ULE, NH3 emissions are reduced by 30% and 50%, which can reduce the national PM2.5 concentration by 15.6% (4.4 μg/m3) and 20.3% (5.8 μg/m3), by significantly reducing the ammonium and nitrate concentrations.
In conclusion, NOx, SO2 and NH3 emission reduction have the same PM2.5 reduction effect. ULE of CPPs and ICB reduces the PM2.5 concentration by reducing NOx and SO2, and then reducing the concentrations of ammonium and sulfate, while NH3 emission reduction mainly reduces the PM2.5 concentration by reducing the concentration of ammonium and nitrate. In order to better reduce the concentration of PM2.5, the emission reduction control measures of NOx, SO2 and NH3 should be formulated according to the specific conditions of different regions.
As can be seen from Figure 10, for the BTH region in the CPPs-ULE scenario, as with the NOx and SO2 emission reduction, the concentrations of ammonium and sulfate were reduced by 5.0% and 13.2% respectively, while the concentration of nitrate increased by 0.2%, and the concentration of PM2.5 was reduced by 3.1% (2.5 μg/m3). Under the CPPs-ICB-ULE scenario, with the further decrease in NOx and SO2, the concentrations of ammonium and sulfate decreased by 15.7% and 40.7%, respectively, while the concentration of nitrate increased by 0.3%, and the concentration of PM2.5 decreased by 9.5% (7.2 μg/m3). Therefore, relative to the CPPs-ULE scenario, reducing the emissions of NH3 can significantly reduce the concentrations of nitrate and ammonium, and reduces the sulfate concentration by 1.6%. This indicates that the atmospheric NH3 emission in the BTH region is insufficient, and NH4+ is insufficient to combine with all SO42−. When the NH3 emission is reduced to 50%, the concentrations of ammonium, nitrate and sulfate can be reduced by 33.0%, 42.8% and 16.5%, respectively, and the concentration of PM2.5 can be reduced by 13.9% (10.6 μg/m3). On the basis of CPPs-ICB-ULE, the emission of NH3 was reduced by 30%, the concentrations of ammonium, nitrate and sulfate were reduced by 27.5%, 18.4% and 41.5%, respectively, and the concentration of PM2.5 was decreased by 14.1% (10.7 μg/m3). With the reduction of NH3 to 50%, the concentrations of ammonium, nitrate and sulfate were decreased by 38.6%, 36.0% and 42.5%, respectively, and the concentration of PM2.5 was decreased by 18.4% (14.0 μg/m3). In conclusion, after the completion of ULE of CPPs in the BTH region, the synergistic effect of NH3 emission reduction should be comprehensively considered while promoting ULE technology in the field of ICB.
For the YRD region in the CPPs-ULE scenario, as with the NOx and SO2 emission reduction, the concentrations of ammonium and sulfate were reduced by 6.1% and 20.3%, respectively, while the concentration of nitrate increased by 3.9% (0.5 μg/m3), and the concentration of PM2.5 was reduced by 4.5% (3.3 μg/m3). Under the CPPs-ICB-ULE scenario, with the further decrease in NOx and SO2, the concentration of ammonium and sulfate decreased by 14.7% and 45.9%, respectively, while the concentration of nitrate increased by 8.2% (1.1 μg/m3), and the concentration of PM2.5 decreased by 9.6% (7.0 μg/m3). Therefore, relative to the CPPs-ULE scenario, an emission reduction of NH3 by 30% can significantly reduce the concentrations of nitrate and ammonium, and also reduces the sulfate concentration by 0.7%. This indicates that the atmospheric NH3 emission in the YRD region is insufficient, and NH4+ is insufficient to combine with all SO42−. When the NH3 emission is reduced to 50%, the concentrations of ammonium, nitrate and sulfate can be reduced by 39.0%, 49.5% and 21.7%, respectively, and the concentration of PM2.5 can be reduced by 18.2% (13.3 μg/m3). On the basis of CPPs-ICB-ULE, the emission of NH3 was reduced by 30%, the concentrations of ammonium, nitrate and sulfate were reduced by 30.6%, 19.5% and 46.3%, respectively, and the concentration of PM2.5 was decreased by 16.5% (12.0 μg/m3). With the reduction of NH3 to 50%, the concentrations of ammonium, nitrate and sulfate were decreased by 43.7%, 41.7% and 46.7%, respectively, and the concentration of PM2.5 was decreased by 22.1% (16.1 μg/m3). In conclusion, relative to the BTH region, the emission of NH3 in the YRD region is higher, severely weakening the reduction effect of ULE in CPPs and ICB. After the completion of ULE of CPPs, an NH3 emission reduction by 30% can achieve a better PM2.5 reduction effect than that of ULE of ICB. Therefore, after the completion of ULE of CPPs, priority should be given to the environmental benefits brought about by NH3 emission reduction, and then to ULE of ICB.
For the SCC region in the CPPs-ULE scenario, as with the NOx and SO2 emission reduction, the concentrations of ammonium and sulfate were reduced by 8.8% and 20.0%, respectively, while the concentration of nitrate increased by 7.5% (0.8 μg/m3), and the concentration of PM2.5 was reduced by 4.6% (3.2 μg/m3). Under the CPPs-ICB-ULE scenario, with the further decrease in NOx and SO2, the concentration of ammonium and sulfate decreased by 20.3% and 42.2%, respectively, while the concentration of nitrate increased by 13.4% (1.4 μg/m3), and the concentration of PM2.5 decreased by 10.4% (7.2 μg/m3). Therefore, relative to the CPPs-ULE scenario, an emission reduction of NH3 by 30% can significantly reduce the concentrations of nitrate and ammonium, and also reduces the sulfate concentration by 0.3%. This indicates that the atmospheric NH3 emission in the SCC region is insufficient, and NH4+ is insufficient to combine with all SO42−. When the NH3 emission is reduced to 50%, the concentrations of ammonium, nitrate and sulfate can be reduced by 37.2%, 59.1% and 20.4%, respectively, and the concentration of PM2.5 can be reduced by 17.8% (12.4 μg/m3), relative to the STD scenario. On the basis of CPPs-ICB-ULE, the emission of NH3 was reduced by 30%, the concentrations of ammonium, nitrate and sulfate were reduced by 32.4%, 17.4% and 42.4%, respectively, and the concentration of PM2.5 was decreased by 16.3% (11.4 μg/m3). With the reduction of NH3 to 50%, the concentrations of ammonium, nitrate and sulfate were decreased by 43.3%, 45.0% and 42.5%, respectively, and the concentration of PM2.5 was decreased by 21.7% (15.1 μg/m3). In conclusion, the relative to the YRD region, the emission of NH3 in SCC region is higher, severely weakening the reduction effect of ULE in CPPs and ICB. After the completion of ULE of CPPs, an NH3 emission reduction by 30% can achieve a better PM2.5 reduction effect than that of ULE of ICB, and an NH3 emission reduction by 50% can achieve a better PM2.5 reduction effect than that of ULE of ICB with NH3 emissions reduced by 30%. Therefore, after the completion of ULE of CPPs, priority should be given to the environmental benefits brought about by NH3 emission reduction, and then to ULE of ICB.
For the PRD region in the CPPs-ULE scenario, as with the NOx and SO2 emission reduction, the concentrations of ammonium and sulfate were reduced by 11.4% and 18.8%, respectively, while the concentration of nitrate increased by 1.0% (0.1 μg/m3), and the concentration of PM2.5 was reduced by 6.2% (2.7 μg/m3). Under the CPPs-ICB-ULE scenario, with the further decrease in NOx and SO2, the concentrations of ammonium and sulfate decreased by 23.9% and 40.5%, respectively, while the concentration of nitrate increased by 4.9% (0.3 μg/m3), and the concentration of PM2.5 decreased by 12.7% (5.6 μg/m3). Therefore, relative to the CPPs-ULE scenario, an emission reduction of NH3 by 30% can significantly reduce the concentrations of nitrate and ammonium, and also reduces the sulfate concentration by 0.2%. This indicates that the atmospheric NH3 emission in the PRD region is insufficient after a 30% reduction in NH3, and NH4+ is insufficient to combine with all SO42−. When the NH3 emission is reduced to 50%, the concentrations of ammonium, nitrate and sulfate can be reduced by 35.3%, 59.7% and 19.2%, respectively, and the concentration of PM2.5 can be reduced by 17.0% (7.5 μg/m3), relative to the STD scenario. On the basis of CPPs-ICB-ULE, the emission of NH3 was reduced by 30%, the concentrations of ammonium, nitrate and sulfate were reduced by 36.5%, 29.5% and 40.6%, respectively, and the concentration of PM2.5 was decreased by 18.6% (8.2 μg/m3). With the reduction of NH3 to 50%, the concentrations of ammonium, nitrate and sulfate were decreased by 45.3%, 53.1% and 40.6%, respectively, and the concentration of PM2.5 was decreased by 22.7% (10.1 μg/m3).
In conclusion, the emission of NH3 in the PRD region is relatively high, severely weakening the reduction effect of the ULE in CPPs and ICB. After the completion of ULE of CPPs, an NH3 emission reduction by 30% can achieve the same PM2.5 reduction effect as that of ULE of ICB, and an NH3 emission reduction by 50% is weaker than that of ULE of ICB with NH3 emissions reduced by 30% for a PM2.5 reduction effect. Therefore, after the completion of ULE of CPPs, the formulation of environmental policies should refer to the BTH region, and the synergistic effect of NH3 emission reduction should be comprehensively considered during the ULE of ICB. Based on the competitive mechanism of sulfate and nitrate, the emission reduction of NH3 makes the NH3 content in the atmosphere change from “surplus” to “insufficient”, and the concentration of nitrate is significantly reduced in the process of transformation to ammonia deficiency, followed by the concentrations of ammonium and sulfate, which is consistent with the conclusions of other scholars [50]. NH3 emission reduction converts NH4SO4 into NH4HSO4. In addition, SO2 reacts in various ways to form sulfate [48], so, with the increase in the NH3 emission reduction ratio, the sulfate concentration decreases slowly. The main reason for the decrease in the nitrate and ammonium concentrations caused by NH3 emission reduction is the reduction in NH3 available for reaction in the atmosphere and the reduction in precursors of this reaction. Other related chemical reaction mechanisms need to be further studied [49,51,52].

5. Conclusions

Although the CPPs have achieved the ULE transformation target, the PM2.5 concentration across the country has decreased by 4.8% (1.4 μg/m3) compared with January 2015, and the haze pollution is still very serious. In addition, ammonium, nitrate and sulfate are important components of PM2.5. Due to the complex non-linear chemical competition mechanism among them, the average concentration of nitrate in the country increases by 1.5% (0.1 μg/m3) under the condition of a large reduction in NOx and SO2 emissions, which reduces the environmental benefits of ULE of CPPs. If the ULE technology is applied to the ICB to further reduce NOx and SO2, the PM2.5 concentration can be reduced by 10.1% (2.9 μg/m3), and the concentration of nitrate will increase by 2.7% (0.2 μg/m3). Therefore, it is concluded that simply reducing NOx and SO2 emissions cannot sufficiently reduce the concentration of PM2.5. Targeted pollutant emission reduction control measures should be formulated according to the specific conditions of different regions to achieve a better reduction in PM2.5 concentration.
Based on the CPPs-ULE, an NH3 emission reduction of 30% can significantly reduce the concentrations of ammonium and nitrate, so that the PM2.5 concentration decreases by 11.5% (3.3 μg/m3), to achieve a better PM2.5 reduction effect than ULE of ICB. If the NH3 emission reduction reaches 50%, the concentrations of ammonium, nitrate and sulfate can be further reduced, and the PM2.5 concentration can be reduced by 16.5% (4.7 μg/m3). Similarly, based on the CPPs-ICB-ULE, NH3 is reduced by 30% and 50%, and the PM2.5 concentration is reduced by 15.6% (4.4 μg/m3) and 20.3% (5.8 μg/m3). In summary, NOx, SO2 and NH3 emission reduction have the same PM2.5 reduction effect. The ULE of CPPs and ICB can reduce NOx and SO2, thereby reducing the concentrations of ammonium and sulfate, causing the PM2.5 concentration to be reduced, and NH3 reduction is achieved mainly through reducing the concentrations of ammonium and nitrate to reduce the concentration of PM2.5. In order to better reduce the concentration of PM2.5, NOx, SO2 and NH3 emission reduction control measures should be comprehensively considered in different regions of China.
The emission bases of NOx, SO2 and NH3 in different regions of China are different, so the changes in regional PM2.5 and its important components under different scenarios are also quite different. For the BTH and PRD regions, after the ULE of CPPs is completed, the synergistic effects of NH3 emission reduction should be comprehensively considered while promoting ULE reduction technologies in the field of ICB. For the YRD and SCC regions, after the completion of ULE of CPPs, priority should be given to the environmental benefits brought about by NH3 emission reduction, and then to the ULE transformation of ICB. In conclusion, in order to reduce PM2.5 more effectively, the economic cost and environmental benefits of emission reduction control measures for NOx, SO2, NH3 and other pollutants should be taken into account comprehensively.

Supplementary Materials

The following are available online at https://0-www-mdpi-com.brum.beds.ac.uk/article/10.3390/atmos12121693/s1, Table S1. Definition of Coal-fired Sectors, Table S2. The Sectors Definition of the GAINS.

Author Contributions

Data curation, J.A.A.; Formal analysis, L.C. and J.W.; Investigation, J.A.A.; Methodology, R.N.; Project administration, S.R. and X.L.; Resources, Y.C.; Software, L.C. and H.W.; Supervision, R.N.; Writing–review & editing, X.J. All authors have read and agreed to the published version of the manuscript.

Funding

This research was funded by Natural Science Foundation of Shandong Province (ZR2021QD119) and the Fundamental Research Funds for the Central Universities (202113005). The APC was funded by the Strategic Consulting Project of Chinese Academy of Engineering (2021-XY-25).

Institutional Review Board Statement

Not applicable.

Informed Consent Statement

Not applicable.

Data Availability Statement

Not applicable.

Acknowledgments

This research is supported by the Strategic Consulting Project of Chinese Academy of Engineering (2021-XY-25). J.W. is supported by the Natural Science Foundation of Shandong Province (ZR2021QD119) and the Fundamental Re-search Funds for the Central Universities (202113005).

Conflicts of Interest

The authors declare no conflict of interest.

References

  1. MEP Ministry of Environmental Protection of China. Report on the State of Environment in China. 2015. Available online: http://www.mee.gov.cn/gkml/sthjbgw/qt/201606/t20160602_353138.htm (accessed on 10 December 2021).
  2. Gao, M.; Beig, G.; Song, S.; Zhang, H.; Hu, J.; Ying, Q.; Liang, F.; Liu, Y.; Wang, H.; Lu, X.; et al. The impact of power generation emissions on ambient PM2.5 pollution and human health in China and India. Environ. Int. 2018, 121, 250–259. [Google Scholar] [CrossRef] [PubMed]
  3. Lelieveld, J.; Evans, J.S.; Fnais, M.; Giannadaki, D.; Pozzer, A. The contribution of outdoor air pollution sources to premature mortality on a global scale. Nature 2015, 525, 367–371. [Google Scholar] [CrossRef]
  4. NAAQS. National Ambient Air Quality Standards: Ambient Air Quality Standards (GB 3095-2012) (Environmental Science Press, Beijing 2011) [R]. The Chinese Ministry of Environmental Protection (MEP). Available online: http://www.gov.cn/hudong/2018-07/23/5308497/files/4f9af7c863b149a783f41be590bc4a22.pdf (accessed on 10 December 2021).
  5. Ma, J.; Chu, B.; Liu, J.; Liu, Y.; Zhang, H.; He, H. NO promotion of SO2 conversion to sulfate: An important mechanism for the occurrence of heavy haze during winter in Beijing. Environ. Pollut. 2018, 233, 662–669. [Google Scholar] [CrossRef] [PubMed]
  6. Jiao, X.; Liu, X.; Gu, Y.; Wu, X.; Wang, S.; Zhou, Y. Satellite verification of ultra-low emission reduction effect of coal-fired power plants. Atmospheric Pollut. Res. 2020, 11, 1179–1186. [Google Scholar] [CrossRef]
  7. Zheng, B.; Tong, D.; Li, M.; Liu, F.; Hong, C.; Geng, G.; Li, H.; Li, X.; Peng, L.; Qi, J.; et al. Trends in China’s anthropogenic emissions since 2010 as the consequence of clean air actions. Atmos. Chem. Phys. Discuss. 2018, 18, 14095–14111. [Google Scholar] [CrossRef] [Green Version]
  8. Cai, S.; Wang, Y.; Zhao, B.; Wang, S.; Chang, X.; Hao, J. The impact of the “Air Pollution Prevention and Control Action Plan” on PM2.5 concentrations in Jing-Jin-Ji region during 2012–2020. Sci. Total Environ. 2016, 580, 197–209. [Google Scholar] [CrossRef]
  9. Tang, L.; Qu, J.; Mi, Z.; Bo, X.; Chang, X.; Anadon, L.D.; Wang, S.; Xue, X.; Li, S.; Wang, X.; et al. Substantial emission reductions from Chinese power plants after the introduction of ultra-low emissions standards. Nat. Energy 2019, 4, 929–938. [Google Scholar] [CrossRef]
  10. Wu, R.; Liu, F.; Tong, D.; Zheng, Y.; Lei, Y.; Hong, C.; Li, M.; Liu, J.; Zheng, B.; Bo, Y.; et al. Air quality and health benefits of China’s emission control policies on coal-fired power plants during 2005–2020. Environ. Res. Lett. 2019, 14, 094016. [Google Scholar] [CrossRef]
  11. Ma, Q.; Cai, S.; Wang, S.; Zhao, B.; Martin, R.V.; Brauer, M.; Cohen, A.; Jiang, J.; Zhou, W.; Hao, J.; et al. Impacts of coal burning on ambient PM2.5 pollution in China. Atmos. Chem. Phys. 2017, 17, 4477–4491. [Google Scholar] [CrossRef] [Green Version]
  12. Wang, D.; Hu, J.; Xu, Y.; Lv, D.; Xie, X.; Kleeman, M.; Xing, J.; Zhang, H.; Ying, Q. Source contributions to primary and secondary inorganic particulate matter during a severe wintertime PM2.5 pollution episode in Xi’an, China. Atmos. Environ. 2014, 97, 182–194. [Google Scholar] [CrossRef]
  13. Wang, L.T.; Wei, Z.; Yang, J.; Zhang, Y.; Zhang, F.F.; Su, J.; Meng, C.C.; Zhang, Q. The 2013 severe haze over southern Hebei, China: Model evaluation, source apportionment, and policy implications. Atmos. Chem. Phys. Discuss. 2014, 14, 3151–3173. [Google Scholar] [CrossRef] [Green Version]
  14. Zhang, X.Y.; Wang, J.Z.; Wang, Y.Q.; Liu, H.L.; Sun, J.Y.; Zhang, Y.M. Changes in chemical components of aerosol particles in different haze regions in China from 2006 to 2013 and contribution of meteorological factors. Atmos. Chem. Phys. Discuss. 2015, 15, 12935–12952. [Google Scholar] [CrossRef] [Green Version]
  15. Lang, J.; Zhang, Y.; Zhou, Y.; Cheng, S.; Chen, D.; Guo, X.; Chen, S.; Li, X.; Xing, X.; Wang, H. Trends of PM2.5 and Chemical Composition in Beijing, 2000–2015. Aerosol. Air Qual. Res. 2017, 17, 412–425. [Google Scholar] [CrossRef]
  16. Huang, X.; Liu, Z.; Liu, J.; Hu, B.; Wen, T.; Tang, G.; Zhang, J.; Wu, F.; Ji, D.; Wang, L.; et al. Chemical characterization and source identification of PM2.5 at multiple sites in the Beijing–Tianjin–Hebei region, China. Atmos. Chem. Phys. Discuss. 2017, 17, 12941–12962. [Google Scholar] [CrossRef]
  17. Fu, X.; Wang, S.; Xing, J.; Zhang, X.; Wang, T.; Hao, J. Increasing ammonia concentrations reduce the effectiveness of particle pollution control achieved via SO2 and NO X emissions reduction in east China. Environ. Sci. Technol. Lett. 2017, 4, 221–227. [Google Scholar] [CrossRef]
  18. Liu, M.; Huang, X.; Song, Y.; Tang, J.; Cao, J.; Zhang, X.; Zhang, Q.; Wang, S.; Xu, T.; Kang, L.; et al. Ammonia emission control in China would mitigate haze pollution and nitrogen deposition, but worsen acid rain. Proc. Natl. Acad. Sci. USA 2019, 116, 7760–7765. [Google Scholar] [CrossRef] [Green Version]
  19. Geng, G.; Xiao, Q.; Zheng, Y.; Tong, D.; Zhang, Y.; Zhang, X.; Zhang, Q.; He, K.; Liu, Y. Impact of China’s Air Pollution Prevention and Control Action Plan on PM2.5 chemical composition over eastern China. Sci. China Earth Sci. 2019, 62, 1872–1884. [Google Scholar] [CrossRef]
  20. Liu, X.; Gao, X.; Wu, X.; Yu, W.; Chen, L.; Ni, R.; Zhao, Y.; Duan, H.; Zhao, F.; Chen, L.; et al. Updated Hourly Emissions Factors for Chinese Power Plants Showing the Impact of Widespread Ultralow Emissions Technology Deployment. Environ. Sci. Technol. 2019, 53, 2570–2578. [Google Scholar] [CrossRef]
  21. CESY. Department of Energy Statistics, China Energy Statistics Yearbook 2016. Available online: http://www.stats.gov.cn/tjsj/tjcbw/201706/t20170621_1505833.html (accessed on 10 December 2021).
  22. Li, M.; Liu, H.; Geng, G.; Hong, C.; Liu, F.; Song, Y.; Tong, D.; Zheng, B.; Cui, H.; Man, H.; et al. Anthropogenic emission inventories in China: A review. Natl. Sci. Rev. 2017, 4, 834–866. [Google Scholar] [CrossRef]
  23. Rafaj, P.; Amann, M. Decomposing Air Pollutant Emissions in Asia: Determinants and Projections. Energies 2018, 11, 1299. [Google Scholar] [CrossRef] [Green Version]
  24. Saikawa, E.; Kim, H.; Zhong, M.; Avramov, A.; Zhao, Y.; Janssens-Maenhout, G.; Kurokawa, J.I.; Klimont, Z.; Wagner, F.; Naik, V.; et al. Comparison of emissions inventories of anthropogenic air pollutants and greenhouse gases in China. Atmos. Chem. Phys. 2017, 17, 6393–6421. [Google Scholar] [CrossRef] [Green Version]
  25. Kang, Y.; Liu, M.; Song, Y.; Huang, X.; Yao, H.; Cai, X.; Zhang, H.; Kang, L.; Liu, X.; Yan, X.; et al. High-resolution ammonia emissions inventories in China from 1980 to 2012. Atmos. Chem. Phys. 2016, 16, 2043–2058. [Google Scholar] [CrossRef] [Green Version]
  26. Huang, X.; Song, Y.; Zhao, C.; Cai, X.; Zhang, H.; Zhu, T. Direct Radiative Effect by Multicomponent Aerosol over China. J. Clim. 2015, 28, 3472–3495. [Google Scholar] [CrossRef]
  27. Wang, Y.; Li, X.; Yang, J.; Tian, Z.; Sun, Q.; Xue, W.; Dong, H. Mitigating Greenhouse Gas and Ammonia Emissions from Beef Cattle Feedlot Production: A System Meta-Analysis. Environ. Sci. Technol. 2018, 52, 11232–11242. [Google Scholar] [CrossRef]
  28. Chadwick, D.; Wei, J.; Yan’An, T.; Guanghui, Y.; Qirong, S.; Qing, C. Improving manure nutrient management towards sustainable agricultural intensification in China. Agric. Ecosyst. Environ. 2015, 209, 34–46. [Google Scholar] [CrossRef]
  29. Rienecker, M.M.; Suarez, M.J.; Todling, R.; Bacmeister, J.; Takacs, L.; Liu, H.C.; Gu, W.; Sienkiewicz, M.; Koster, R.D.; Gelaro, R.; et al. The GEOS-5 Data Assimilation System: Documentation of Versions 5.0. 1, 5.1. 0, and 5.2. 0. In Technical Report Series on Global Modeling and Data Assimilation, (NASA/TM-2008-104606); NASA: Washington, DC, USA, 2008; pp. 1–118. [Google Scholar]
  30. Lin, J.-T.; McElroy, M.B.; Boersma, K.F. Constraint of anthropogenic NOx emissions in China from different sectors: A new methodology using multiple satellite retrievals. Atmos. Chem. Phys. Discuss. 2010, 10, 63–78. [Google Scholar] [CrossRef] [Green Version]
  31. Ni, R.; Lin, J.; Yan, Y.; Lin, W. Foreign and domestic contributions to springtime ozone over China. Atmos. Chem. Phys. Discuss. 2018, 18, 11447–11469. [Google Scholar] [CrossRef] [Green Version]
  32. Fountoukis, C.; Nenes, A. ISORROPIA II: A computationally efficient thermodynamic equilibrium model for K+–Ca2+–Mg2+–NH4+–Na+–SO42−–NO3–Cl–H2O aerosols. Atmos. Chem. Phys. Discuss. 2007, 7, 4639–4659. [Google Scholar] [CrossRef] [Green Version]
  33. Pye, H.; Liao, H.; Wu, S.; Mickley, L.J.; Jacob, D.J.; Henze, D.K.; Seinfeld, J.H. Effect of changes in climate and emissions on future sulfate-nitrate-ammonium aerosol levels in the United States. J. Geophys. Res. Space Phys. 2009, 114. [Google Scholar] [CrossRef]
  34. Fairlie, T.D.; Jacob, D.J.; Dibb, J.E.; Alexander, B.; Avery, M.A.; van Donkelaar, A.; Zhang, L. Impact of mineral dust on nitrate, sulfate, and ozone in transpacific Asian pollution plumes. Atmos. Chem. Phys. Discuss. 2010, 10, 3999–4012. [Google Scholar] [CrossRef] [Green Version]
  35. Fairlie, T.D.; Jacob, D.J.; Park, R.J. The impact of transpacific transport of mineral dust in the United States. Atmos. Environ. 2007, 41, 1251–1266. [Google Scholar] [CrossRef]
  36. Jaeglé, L.; Quinn, P.K.; Bates, T.S.; Alexander, B.; Lin, J.-T. Global distribution of sea salt aerosols: New constraints from in situ and remote sensing observations. Atmos. Chem. Phys. Discuss. 2011, 11, 3137–3157. [Google Scholar] [CrossRef] [Green Version]
  37. Zhang, H.; Wang, Y.; Hu, J.; Ying, Q.; Hu, X.-M. Relationships between meteorological parameters and criteria air pollutants in three megacities in China. Environ. Res. 2015, 140, 242–254. [Google Scholar] [CrossRef] [PubMed]
  38. He, H.; Wang, Y.; Ma, Q.; Ma, J.; Chu, B.; Ji, D.; Tang, G.; Liu, C.; Zhang, H.; Hao, J. Mineral dust and NOx promote the conversion of SO2 to sulfate in heavy pollution days. Sci. Rep. 2014, 4, 4172. [Google Scholar] [CrossRef]
  39. Park, R.J.; Jacob, D.J.; Field, B.D.; Yantosca, R.M.; Chin, M. Natural and transboundary pollution influences on sulfate-nitrate-ammonium aerosols in the United States: Implications for policy. J. Geophys. Res. Space Phys. 2004, 109. [Google Scholar] [CrossRef]
  40. Wang, G.H.; Cheng, C.L.; Huang, Y.; Tao, J.; Ren, Y.Q.; Wu, F.; Meng, J.J.; Li, J.J.; Cheng, Y.T.; Cao, J.J.; et al. Evolution of aerosol chemistry in Xi’an, inland China, during the dust storm period of 2013—Part 1: Sources, chemical forms and formation mechanisms of nitrate and sulfate. Atmos. Chem. Phys. Discuss. 2014, 14, 11571–11585. [Google Scholar] [CrossRef] [Green Version]
  41. Zhang, L.; Liu, L.; Zhao, Y.; Gong, S.; Zhang, X.; Henze, D.K.; Capps, S.; Fu, T.-M.; Zhang, Q.; Wang, Y. Source attribution of particulate matter pollution over North China with the adjoint method. Environ. Res. Lett. 2015, 10, 084011. [Google Scholar] [CrossRef]
  42. Li, M.; Zhang, Q.; Kurokawa, J.-I.; Woo, J.-H.; He, K.; Lu, Z.; Ohara, T.; Song, Y.; Streets, D.G.; Carmichael, G.R.; et al. MIX: A mosaic Asian anthropogenic emission inventory under the international collaboration framework of the MICS-Asia and HTAP. Atmos. Chem. Phys. 2017, 17, 935–963. [Google Scholar] [CrossRef] [Green Version]
  43. Hudman, R.C.; Moore, N.E.; Mebust, A.K.; Martin, R.V.; Russell, A.R.; Valin, L.C.; Cohen, R.C. Steps towards a mechanistic model of global soil nitric oxide emissions: Implementation and space based-constraints. Atmos. Chem. Phys. Discuss. 2012, 12, 7779–7795. [Google Scholar] [CrossRef] [Green Version]
  44. Giglio, L.; Randerson, J.T.; van der Werf, G.R. Analysis of daily, monthly, and annual burned area using the fourth-generation global fire emissions database (GFED4). J. Geophys. Res. Biogeosci. 2013, 118, 317–328. [Google Scholar] [CrossRef] [Green Version]
  45. Guenther, A.B.; Jiang, X.; Heald, C.L.; Sakulyanontvittaya, T.; Duhl, T.; Emmons, L.K.; Wang, X. The Model of Emissions of Gases and Aerosols from Nature version 2.1 (MEGAN2. 1): An extended and updated framework for modeling biogenic emissions. Geosci. Model Dev. 2012, 5, 1471–1492. [Google Scholar] [CrossRef] [Green Version]
  46. Jiao, X.M.; Ren, S.H.; Zhang, W. The promotion of ultra-low emission (ULE) transformation and NH3 emission reduction on the environmental benefits of Beijing-Tianjin-Hebei in winter. Acta Sci. Circumst. 2021. [Google Scholar] [CrossRef]
  47. Liu, X.; Liu, Z.; Jiao, W.; Li, X.; Lin, J.; Ku, A. Impact of “ultra-low emission” technology of coal-fired power on PM2.5 pollution in the Jing-Jin-Ji Region. Front. Energy 2017, 15, 235–239. [Google Scholar] [CrossRef]
  48. Li, X.; Wang, L.; Ji, D.; Wen, T.; Pan, Y.; Sun, Y.; Wang, Y. Characterization of the size-segregated water-soluble inorganic ions in the Jing-Jin-Ji urban agglomeration: Spatial/temporal variability, size distribution and sources. Atmos. Environ. 2013, 77, 250–259. [Google Scholar] [CrossRef]
  49. Cheng, Y.; Zheng, G.; Wei, C.; Mu, Q.; Zheng, B.; Wang, Z.; Gao, M.; Zhang, Q.; He, K.; Carmichael, G.; et al. Reactive nitrogen chemistry in aerosol water as a source of sulfate during haze events in China. Sci. Adv. 2016, 2, e1601530. [Google Scholar] [CrossRef] [Green Version]
  50. Wu, S.Y.; Hu, J.L.; Zhang, Y.; Aneja, V.P. Modeling atmospheric transport and fate of ammonia in North Carolina—Part II: Effect of ammonia emissions on fine particulate matter formation. Atmos. Environ. 2008, 42, 3437–3451. [Google Scholar] [CrossRef]
  51. Lou, Z.G.; Wang, Z.H.; Yang, F. Variation characteristics and source analysis of ammonium salt in typical air pollution processes. Acta Sci. Circumst. 2021, 41, 2577–2583. [Google Scholar]
  52. Liu, X.J.; Sha, Z.P.; Song, Y.; Dong, H.M.; Pan, Y.P.; Gao, Z.L.; Li, Y.E.; Ma, L.; Dong, W.X.; Hu, C.S.; et al. China’s Atmospheric Ammonia Emission Characteristics, Mitigation Options and Policy Recommendations. Res. Environ. Sci. 2021, 34, 149–157. [Google Scholar] [CrossRef]
Figure 1. The total emissions of NOx and SO2 under different scenarios and the reduction ratio relative to the STD scenario.
Atmosphere 12 01693 g001
Figure 2. The reduction ratios of NOx and SO2 emissions in different regions under different scenarios.
Atmosphere 12 01693 g002
Figure 3. The reduction ratios of NOx and SO2 emissions in different regions under different scenarios.
Atmosphere 12 01693 g003
Figure 4. GEOS-Chem simulation results for distributions of primary pollutants, NOx and SO2. The concentrations of (ppbv) NOx and SO2 in the atmospheric surface layer under two scenarios.
Atmosphere 12 01693 g004
Figure 5. The reduction ratio of NOx and SO2 emissions in different regions under different scenarios.
Atmosphere 12 01693 g005
Figure 6. GEOS-Chem simulation results for nationwide distributions of ammonium, nitrate, sulfate and PM2.5. The concentrations (μg/m3) of ammonium, nitrate, sulfate and PM2.5 in the atmospheric surface layer under two scenarios (STD, first column, STD Minus CPPs-ULE, second column; STD Minus CPPs-ICB-ULE, third column).
Atmosphere 12 01693 g006
Figure 7. The reduction ratio of ammonium, nitrate, sulfate and PM2.5 in different regions under different scenarios.
Atmosphere 12 01693 g007
Figure 8. GEOS-Chem simulation results for nationwide distributions of ammonium, nitrate, sulfate and PM2.5. The concentrations (μg/m3) of ammonium, nitrate, sulfate and PM2.5 in the atmospheric surface layer relative to STD scenarios (STD Minus CPPs-ULE-NH3-30%, first column, STD Minus CPPs-ULE-NH3-50%, second column; STD Minus CPPs-ICB-ULE-NH3-30%, third column; STD Minus CPPs-ICB-ULE-NH3-50%, fourth column).
Atmosphere 12 01693 g008
Figure 9. The reduction ratio of ammonium, nitrate, sulfate and PM2.5 in different regions under different scenarios.
Atmosphere 12 01693 g009
Figure 10. The average concentration reduction ratios of secondary pollutants ammonium, nitrate, sulfate and PM2.5 of China simulated by GEOS-Chem under different scenarios relative to STD scenario.
Atmosphere 12 01693 g010
Table 1. Description of data used in this study.
DataDescriptionReference
The emission factor of CPPs that install ULE facilitiesULE emission factors of CPPs in China (EFSO2 = 0.17 g/Kg, EFNOx = 0.41 g/Kg, EFPM = 0.03 g/Kg)Liu et al., (2019) [20]
Coal consumption dataRaw coal consumption in power plants and industries in different provinces in 2015 (detailed classification of the power and industrial sectors is listed in Table S1).China Energy Statistics Yearbook [21]
Multi-Resolution Emission Inventory for China (MEIC)The MEIC data on spatial distribution and seasonal variation of pollutants as well as total NOx, SO2, PM emissions from power plants and industrial sectors were used.MEIC [7,22]
Greenhouse Gas and Air Pollution Interactions and Synergies (GAINS)The GAINS inventory provides provincial-level emission data for 11 detailed sectors (details are listed in Table S2). The GAINS data on pollutant emissions from different fuel types in the power sector and industrial combustion and industrial processes and production in the industrial sector were used.GAINS [23,24]
Table 2. Summary of simulation scenarios.
ScenariosScenario DescriptionDescription
PowerIndustryNH3
STDThe standard scenario
CPPs-ULEULE assembled in coal-fired power plants over China.ULE
CPPs-ICB-ULEULE assembled in coal-fired power plants and industrial boilers over China.ULEULE
CPPs-ULE-NH3-30%ULE assembled in coal-fired power plants with NH3 reduced by 30% over China.ULE Reduced by 30%
CPPs-ULE-NH3-50%ULE assembled in coal-fired power plants with NH3 reduced by 50% over China.ULE Reduced by 50%
CPPs-ICB-ULE-NH3-30%ULE assembled in coal-fired power plants and industrial boilers with NH3 reduced by 30% over China.ULEULEReduced by 30%
CPPs-ICB-ULE-NH3-50%ULE assembled in coal-fired power plants and industrial boilers with NH3 reduced by 50% over China.ULEULEReduced by 50%
Publisher’s Note: MDPI stays neutral with regard to jurisdictional claims in published maps and institutional affiliations.

