Is Hadley Cell Expanding?
by
 , , , , and
Tao Xian
1,2,3 ,
,
Jingwen Xia
4,
Wei Wei
5,
Zehua Zhang
1,
Rui Wang
6,
Lian-Ping Wang
1,3 and
Yong-Feng Ma
1,3,* 1
Guangdong Provincial Key Laboratory of Turbulence Research and Applications, Center for Complex Flows and Soft Matter Research, Department of Mechanics and Aerospace Engineering, Southern University of Science and Technology, Shenzhen 518055, China
2
School of Earth and Space Science, University of Science and Technology of China, Hefei 230026, China
3
Southern Marine Science and Engineering Guangdong Laboratory (Guangzhou), Guangzhou 511458, China
4
Ningbo Yinzhou Meteorological Bureau, Yinzhou District, Ningbo 315194, China
5
School of Atmospheric Sciences, Sun Yat-sen University, Zhuhai 519082, China
6
Key Laboratory for Semi-Arid Climate Change of the Ministry of Education, College of Atmospheric Sciences, Lanzhou University, Lanzhou 730020, China
*
Author to whom correspondence should be addressed.
Atmosphere 2021, 12(12), 1699; https://0-doi-org.brum.beds.ac.uk/10.3390/atmos12121699
Submission received: 19 September 2021
/
Revised: 21 November 2021
/
Accepted: 14 December 2021
/
Published: 18 December 2021
(This article belongs to the Section Climatology)
Abstract
:This review provides a comprehensive coverage of changes of the Hadley Cell extent and their impacts on the weather, climate, and society. The theories predicting the Hadley Cell width are introduced as a background for the understanding of the circulation changes and the metrics used for detection. A variety of metrics derived from various data sources have been used to quantify the Hadley Cell width. These metrics can be classified as dynamical, hydrological, thermal, and chemical metrics, based on the properties of the variables used. The dynamical metrics have faster trends than those based on thermal or hydrological metrics, with the values exceeding 1 degree per decade. The hydrological metric edge poleward trends were found a slightly faster expansion in the Northern Hemisphere than its southern counterpart. The chemical metrics show a poleward trend of more than 1 degree per decade in both hemispheres. We also suggest a few reasons for the discrepancy among trends in Hadley Cell expansion found in previous studies. Multiple forcings have been found responsible for the expansion, which seems to be more attributed to the natural variability than anthropogenic forcing. Validation of the scaling theories by the trends in Hadley Cell width suggests that theories considering the extratropical factor would be better models for predicting the Hadley Cell width changes. The Hadley Cell has an impact on different atmospheric processes on varying spatio-temporal scales, ranging from weather to climate, and finally on society. The remaining questions regarding Hadley Cell climate are briefly summarized at the end.
1. What Is the Hadley Cell?
The Hadley Cell is a salient feature of Earth’s atmospheric circulation spanning half the globe. Such circulation is thermally closed, with warm buoyant fluid rising near the equator then moving poleward and cold fluid descending in the subtropics then moving equatorward. This circulation reduces the equator-to-pole temperature gradient associated with the incoming solar radiation, and makes the extratropics a milder climate. Its ascending branch forms the Inter Tropical Convergence Zone (ITCZ) containing vigorous thunderstorms in the deep tropics, while the descending branch produces a semipermanent high atmospheric pressure lying (mainly over the oceans) between 20 and 40 of latitude in both the Northern and Southern Hemispheres. The Hadley Cell is named after George Hadley, a British amateur meteorologist who put forward perhaps the first scientific model of the meridional overturning circulation, by which the northern hemispheric trade winds flowing from northeast to southwest over the tropical ocean are sustained. This is a key factor in the early 18th century that ensures European sailing vessels reaching North American shores.
The descending branch of Hadley Cell has a large impact on the weather and climate in the subtropics. The weather there is cloudless and rainless, and thus makes a large extent of arid regions including the largest desert in the world. The poleward extension of the Hadley Cell may result in the extension of these arid regions to higher latitudes. For example, reduced precipitation and more frequent droughts have been observed in the subtropics (e.g., Southern Australia, the Mediterranean region, and Northern China), which are linked to the expansion of Hadley Cell for the past few decades, e.g., [1,2] and others. The frequent extreme events of heat waves occurring in Europe in recent years are attributed to the poleward extension of the subtropical high due to the Hadley Cell expansion and the northward shift of the westerly jet in summer.
The monsoon regions, where about three-quarters of the ITCZ is embedded within [3], are home to about 50% of the world’s population and more than 80% of the terrestrial biome. In the Coupled Model Intercomparison Project (CMIP) models, the stronger Hadley Cell is associated with enhanced monsoon rainfall in the Northern Hemisphere [3,4]. Further, the intensity and extent of the subsidence-induced high pressure can influence the monsoon circulations and tropical cyclone paths. The poleward extension of the western Northern Pacific subtropical high may result in the drying trend in southern China and increasing rainfall over the Yangtze River Valley in spring [5]. It may also lead the tropical cyclones to higher latitudes, threatening Northeast Asia.
The Hadley Cell plays an important role in the Earth’s climate by transporting energy and angular momentum poleward [6,7]. Thus, it is important to understand the physical mechanism for variation in the Hadley Cell extension and shed some light on the debate on the long-term change in the Hadley Cell. The expanding Hadley Cell is characterized as its edge shifting poleward. Since the Hadley Cell determines how far the tropics extend, the Hadley Cell expansion is also known as the tropical widening. Earlier reviews summarized the basic understanding of Hadley Cell expansion; however, much remains unclear, including the metrics describing the Hadley Cell edge, the magnitudes of observed change, and the mechanisms responsible for the expansion. Here, we will review (1) the theories predicting the Hadley Cell width, (2) the metrics describing the Hadley Cell edge, (3) datasets used for the studies for Hadley Cell edge climate change, (4) the amount of Hadley Cell extent changes found by previous studies, (5) the forcings responsible for these changes, and (6) the impacts of Hadley Cell expansion on the weather and society.
2. Hadley Cell Edge Identifications
2.1. Theories for Hadley Cell Width
There are five plausible (and not mutually exclusive) theories predicting the Hadley Cell width based on different thermodynamics considerations. Examining the changes of the variables related to different theories enables us to obtain a better understanding of Hadley Cell width changes.
The first theory, proposed by Schneider [8] and developed by Held and Hou [9], posits that the Hadley Cell is a thermally closed circulation and that the poleward flowing air at its upper branch conserves its angular momentum without the effects of eddy and friction, resulting in a narrow band of fast flow called subtropical jet. Constraints by the thermodynamic, the Hadley Cell edge in this theory scales as follows:
where s is Earth’s rotation rate, m is the mean radius of Earth, is a reference potential temperature, m s is the acceleration due to gravity, is the equator-to-pole potential temperature difference in radiative equilibrium, and is the tropical tropopause height. The proportional relationship in Equation (1) implies that the Hadley Cell will expand when the tropical tropopause height raises and/or meridional temperature gradient strengthens. For example, an increasing tropopause height in the tropics is most likely related to stronger ascending branch of the Hadley Cell in the tropics, which also affects the Hadley Cell expansion [7]. This theory indicates that the width of Hadley Cell is sensitive to the thermal structure in the tropics.
If the air moving poleward at the upper branch of the Hadley Cell conserves its angular momentum, while the equatorward return flow at the lower level is smaller (less than 3 m s) due to surface friction, then there will be a large vertical shear increases with latitude, and eventually this will become baroclinically unstable, which leads to the non-conservation of angular momentum. The second theory, proposed by Held [10], posits that the Hadley Cell edge corresponds to the latitude where the vertical shear of the angular momentum-conserving flow becomes baroclinically unstable, when the shear between upper and lower levels reaches a critical value. Using the two-layer model criterion of Phillips [11], the Hadley Cell width can be calculated as follows:
where is the vertically average Brunt–Väisälä frequency measuring the tropospheric static stability, which employs the subtropical value here, and is the subtropical tropopause height. This theory predicts that the Hadley Cell will expand when the tropopause raises and/or the static stability enhances in the subtropics. Meanwhile, the rising tropopauses [12,13] enhance the meridional temperature gradient in the upper troposphere [14]. This theory attributes the extent of the Hadley Cell to the changes in the stability and the tropopause height in the subtropics.
However, there is not a critical shear for baroclinic instability in a continuously stratified atmosphere, which makes the critical shear become an artifact of the vertical truncation of the two-layer model. The third theory based on the supercriticality of the slope of isentropes, proposed by Korty and Schneider [15], posits that the Hadley Cell edge can be characterized by a critical value of supercriticality over which vertical wave activity fluxes extend in the dry atmosphere [16]. This theory does not require angular momentum conservation of the tropical upper-tropospheric flow or use an expression for baroclinic instability. The supercriticality is a nondimensional measure of slope of isentropes, which can be calculated as follows:
where , , and are time- and zonally-averaged pressures at the surface, tropopause, and the level up to which vertical wave activity fluxes extend, respectively. The critical value of supercriticality depends on both the meridional near-surface temperature gradient and subtropical static stability. Sensitivity simulation results performed by Korty and Schneider [15] suggested that the Hadley Cell terminates at the latitude where first exceeds ∼0.6. Although this theory provides a more general foundation for the relation of baroclinic eddies and Hadley Cell extent without assuming a critical shear, it cannot obtain a closed theory for the Hadley Cell scale. It is also unclear if this supercriticality based formula can be maintained in moist atmospheres.
The fourth theory relates the circulation poleward shift to the upper-tropospheric baroclinicity changes in the subtropics, based on the studies on the poleward shift of the storm track [17,18,19], in which occurs frequent synoptic-scale baroclinic wave activities [20]. The Hadley Cell edge is set by the location of the sign switch of the eddy momentum flux [10,15,21,22], and thus the shift of the Hadley Cell edge is strongly influenced by the shift of the zone of baroclinic instability. The baroclinic instability can be represented by the maximum Eady growth rate [23], which can be calculated as
where T is the zonal mean temperature, is the meridional temperature gradient. In the extratropical regions with high occurrence frequencies of subtropical jet, Eady growth rates increase according to the thermal wind balance, then Equation (4) becomes
where is Coriolis parameter with as latitude, and is the vertical wind shear, is the zonal wind difference between the upper and lower troposphere. As a measure of the baroclinicity, this maximum Eady growth rate can be seen to depend on the vertical wind shear, the static stability, and rotation rate. In addition, the rising tropopauses reduce the baroclinicity in the subtropics, eventually widening the Hadley Cell.
On the flanks of the Hadley Cell, Rossby waves propagating away from their source leave behind westerly zonal wind anomalies that drive the so-called polar-front or eddy-driven jet [24,25,26]. On the other hand, the Rossby waves propagate into and break within the Hadley Cells, then force easterly zonal wind anomalies, modifying the strength and position of the subtropical jets and the Hadley Cell edges. The fifth theory relates the Hadley Cell edge changes to the Rossby wave breaking between the tropics and extratropics above the subtropical jet [27,28]. For the anticyclonically wave breaking (AWB; anticyclonic shear favoring equatorward breaking) events [29], the vertical shear of the stratospheric zonal flow increases, thereby a poleward displacement of eddy-driven jet [27]. Homeyer and Bowman [30] found that anticyclonically sheared wave-breaking events dominate in both hemispheres in the 30 year (1981–2010) ERA-Interim reanalysis; therefore, a transition in the mode of wave breaking from cyclonically wave breaking (CWB) [29] to AWB would increase mixing on the equatorward side of the eddy-driven jet, which induces the Hadley Cell broadening [27,31].
Each of the causes for Hadley Cell width change discussed here probably operates through one or more of the mechanisms above. Further, realistic widening includes the complicating effects of terrain and season. The validation of each mechanism is discussed in Section 4.2: How important each cause is in driving the Hadley Cell? How sensitive the latitudinal extent of the Hadley Cell is to each cause?
2.2. Metrics of Hadley Cell Edge
In previous studies, a variety of metrics have been used to quantify the edge of the Hadley Cell. These metrics can generally be classified as dynamical, hydrological, thermal, and chemical metrics, based on the properties of the variables used. It is important to note that choosing different metrics can result in large differences in the calculated expansion rates of the Hadley Cell.
2.2.1. Dynamical Metrics
The Hadley Cell is generally considered as a temporal and zonal mean circulation. The average meridional streamfunction defined on a latitude and pressure plane is usually employed to describe the Hadley Cell, which is defined as follows:
where p is the pressure, v the meridional wind, and the overbar a zonal average. An enhanced intensity of streamfunction (i.e., stronger upward/downward branches and poleward/equatorward branches of the circulation) means a stronger Hadley Cell [7]. The zero-crossing latitude, polewards of the ITCZ, of the meridional overturning streamfunction at 500 hPa , or of averaged over the troposphere column e.g., [32] are widely used as a dynamical metric of the Hadley Cell poleward edge location (Table 1 and Figure 1).
The atmosphere flow in the subtropics is dominated by downward movement, accompanied with a high pressure near the sea surface level. The latitude of maximum downwelling is associated with the location where the meridional gradient of the streamfunction (the vertical velocity) is the largest. The steepest meridional gradient of generally lies poleward of its zero-crossing latitude. The subtropical sea-level high-pressure ridge (SLP) is a conventional metric since the surface pressure is one of the mandatory weather observations.
According to Equations (4) and (5), the meridional temperature gradient is the strongest at the edge of the subtropics, which is associated with the subtropical jet stream (STJ). The STJ is the location of maximum winds in the upper troposphere. In the time and zonal mean and assuming linear surface drag, the vertically averaged zonal-mean quasigeostrophic zone momentum equation reduces to a balance between the vertically averaged eddy momentum flux convergence and surface drag on the zonal-mean surface zonal wind:
where is the surface zonal wind, a time scale for drag, the eddy momentum flux where primes indicate deviations from the zonal mean, and angled brackets the vertical average. Based on Equation (7), we can use the latitude of zero-crossing zonal mean surface wind , or the maximum eddy momentum flux to locate the Hadley Cell edge [32,38,39]. The maximum of the vertically integrated zonal momentum can be used to define the Hadley Cell edge as well [32,38]. As found by Davis and Birner [36], the metric is well correlated with the metric (Figure 1). Alternatively, the surface wind may be subtracted from the winds aloft to isolate the STJ from the eddy-driven jet (EDJ), which is defined as the maximum wind at 850 hPa in each hemisphere [37]. Although EDJ is not a part of the Hadley Cell, given the tendency of baroclinic eddies on the flank of the Hadley Cell. On all timescales, there are strong correlation relationships between the EDJ latitudes and the Hadley Cell edge latitudes (e.g., , , and ) [32,37].
2.2.2. Hydrological Metrics
The tropical hydrological cycle affects the Hadley Cell by linking radiative forcing and moisture transport to the global distribution of sea surface temperature. The subsidence in the edge of the Hadley Cell is featured as an arid zone accompanied by the absence of clouds in the subtropics; therefore, the minimum total precipitation , or evaporation exceeding precipitation , and the minimum cloud coverage can be used to locate the Hadley Cell edge, e.g., [38,43]. There are other hydrological metrics being employed to describe the edge of the Hadley Cell listed in Table 2. The latitude of often lies within the subsidence of the Hadley Cell, while the location of the is associated with the climatological mean subsidence in the vicinity of (generally polewards of) . On the poleward flank of the Hadley Cell, the active eddies in the storm track play a role in the moving Hadley Cell edge [39]. The changes in the location of storm track, featuring as the midlatitude total precipitation maximum , can be used to represent the shift in the Hadley Cell edge [44]. These hydrological metrics are related to precipitation, which has relevant implications for society.
The cloudless region characterized by the subtropical cloud cover minimum induces a high outgoing longwave radiation (OLR) due to the increased thermal emission from surface. The OLR higher than a given radiation threshold, e.g., 250 [33,40,48,49], is widely used to describe the Hadley Cell edge. Since the numerical OLR threshold is a bit arbitrary, an objective OLR metric is proposed based on the meridional difference in OLR [40,47]. For instance, the Hadley Cell edge can be estimated as the latitude where the zonal mean OLR drops 20 on the poleward side of the position of its subtropical maximum (OLR). Note that the behavior of OLR in response to the climate change is complex. Changes to the surface, tropospheric, and stratospheric temperatures all play a role, as does the variability in water vapor, clouds, and aerosol. These effects vary in different regions of the spectrum, with sources often making opposite contributions [50].
2.2.3. Thermal Metrics
In the subtropical upper troposphere, there is a sharp discontinuity of lapse rate tropopause [51] near the STJ known as the “tropopause break” TPB; [52,53,54], where the tropopause altitudes change from the tropical one to the extratropical one well below abruptly. For simplicity, the latitude where the tropopause altitudes have a given threshold (e.g., ) is used to locate the Hadley Cell edge [55]. The poleward latitude of a given frequency of high tropical tropopause altitudes is another widely used metric [52]. Alternatively, the latitude at which the greatest meridional gradient in tropopause altitude occurs (Table 3) is employed to locate tropopause break. The subtropical tropopause altitudes increase as the STJ shifts poleward, resulting in a broader Hadley Cell according to Held [10]. Longitudinal variability in the amount of Hadley Cell expansion was also noted with this methodology [54]. Fu and Lin [56] found a significant cooling in the lower stratosphere due to the subtropical jet poleward shifting, and thus the maximum cooling (LST) can be adopted to represent the Hadley Cell edge. As the temperature changes in troposphere and stratosphere oppositely in response to the global warming, Fu et al. [57] estimated the shift of subtropical jet using the global temperature trends (GTT) in these two layers, indicating the change of the Hadley Cell width.
2.2.4. Chemical Metrics
There is a large discrepancy in the chemical components concentration between troposphere and stratosphere, with the tropopause as the boundary between these two layers. There is a causal relationship between tropopause altitude and total column amounts of chemical components: the higher the tropopause altitude, the larger the region containing tropospheric chemical components, and vice versa. For instance, the concentrations of tropospheric gases such as and are the highest in the tropics and minimum in the poles, e.g., [42]. As most of the Earth’s ozone stays in the middle of stratosphere, total column ozone (TCO) is lower in the tropics (where the troposphere is deeper) than at high latitude (polewards of the tropopause break), with the mean total ozone values of 280 DU, 333 DU, and 407 DU for the tropics, midlatitudes, and poles [58], respectively; therefore, the chemical tracer-based metrics can be adapted to locate the Hadley Cell edge; however, the numerical thresholds might not be valid for different periods. For example, the ozone hole in the Antarctic was found recovered as a result of the Montreal Protocol, which aims at controlling the emission of the ozone-depleting substances. Hudson et al. [58,59] proposed an objectively slope-based ozone metrics. Some other objective methods were proposed as listed in Table 4. The latitude at which tracer concentrations deviate by 1 (standard deviation) from their tropical means can be used to describe the Hadley Cell edge [42]. The gradient-weighted latitude (GWL) is an alternatively metric [42], which locates the region of steep gradients of chemical tracers. In addition, the latitude of subtropical minimum in the probability density function (PDF) of tracer concentration is employed to define the Hadley Cell edge [60,61]. More recently, the PDF method is also employed to locate the tropopause break latitude [54]. The 1 method’s edge generally lies polewards of the GWL metrics, while the PDF method locations are on the equatorwards of the GWL metrics. There is a strong correlation between 1-based and GWL-based locations, with the correlation coefficient over 0.75 for 30-year period of 1995–2004 [42]. The exceptions to the reliability of the PDF tracer metric occur in spring and fall seasons [61] due to the frequent wave-driven excursions of air between the tropics and subtropics, and also fewer points for generating a more accurate PDF when using lower temporal resolution data. As the total column tracer concentration depends largely on the depth of the troposphere [62], tracer-based metrics correlate well with the tropopause break metrics in both the Northern and Southern Hemispheres [42]. Similarly, there is a large equator-to-pole gradient in the chemical tracer concentration, such as TCO, associated with the tropopause break [58,59]. Note that there is a close relationship between chemical tracer concentrations and tropopause, the tracer-based metrics have a larger latitudinal variability than that in the tropopause-based metrics [42] due to the regional difference of tracer emission.
2.3. Datasets for Hadley Cell Edge Studies
Several datasets are in widespread use for studying Hadley Cell climate change today.
2.3.1. Mandatory Observations
The surface weather stations and radiosonde stations provide the mandatory observations of the atmospheric states (e.g., temperature, wind, cloud, and precipitation) on a 1 h/12 h temporal resolution for surface/radiosonde observations and with ∼1.5 km vertical resolution for radiosonde observations. Oort and Yienger [63] computed the maximum streamfunction from the monthly mean latitude versus pressure cross section of meridional wind component measured by radiosonde. The maximum overall wind speed between the 100 and the 850 hPa levels derived from radiosonde observations was used to locate the subtropical jet stream, and thus the Hadley Cell edge location [45]. A primary shortcoming of radiosonde observations is the inhomogeneous spatial coverage since radiosondes are mostly launched from land masses with much less density in harsh climatic conditions (e.g., dessert, open sea, and high mountain). Another limitation is that not all radiosonde flights from a given location are successful, leading to discontinuities in the data record.
2.3.2. Satellite
Satellite observations can provide atmospheric thermal and chemical states with continuous observations by geostationary satellites (e.g., GOES, FengYun-2, and Himawari) or periodical ones by sun-synchronous orbit satellites (e.g., FengYun-3, CloudSat, and Aura). Satellite observations can provide those properties with high spatiotemporal inhomogeneity such as precipitation and cloud over the globe, which is often not possible using weather stations observations alone. A few of the dynamical parameters, such as surface wind field, can be obtained by satellite observation as well (e.g., QuikScat, WindSat, and ASCAT).
There are varied metrics derived from satellite-based platforms being widely used to investigate Hadley Cell edge. The most common metric based on the satellite observations is OLR [33,40,64], which is sensitive to the cloud coverage and indicates the long-wave radiation emitted from Earth–Atmosphere system. Another widely used methodology is arranging a given field in a zonal mean array, with clearly distinct value for different latitude zones (tropics, midlatitudes, and poles). This methodology is widely used to compensate for missing observation for some regions via using sun-synchronous satellites, especially for those with a narrow Field of View (FOV) projected onto the Earth’s surface.
2.3.3. Reanalysis
Reanalysis products are syntheses of assimilated data from various observational platforms over the globe and numerical weather forecast model results. These data adequately reproduce past three-dimensional atmospheric states and can be adopted to develop a broader understanding of atmospheric processes across different spatiotemporal scales and climate changes [65,66]. Reanalyses provide nearly continuous (mostly with an interval at every 6 h), three-dimension atmosphere structure from near surface to the top of atmosphere over the globe, by which we can examine all of the dynamical-based Hadley Cell edge variability, e.g., [32]. Several reanalysis products are publicly available and cover historical periods of 40 years or longer, with predecessor reanalyses such as NCEP/NCAR (National Centers for Environmental Prediction/National Center for Atmospheric Research reanalysis) and ECMWF ERA40 (the second generation reanalysis of European Centre for Medium Range Weather Forecasts), and modern reanalyses such as ERA-Interim and ERA5 (the third and fifth generation reanalysis of ECMWF), JRA-55 (the Japanese Meteorological Association 55-year reanalysis), and MERRA-2 (the National Aeronautics and Space Administration Modern-Era Retrospective analysis for Research and Applications, Version 2) being widely used for research today, e.g., [53,66].
However, in data-sparse regions of the globe and for poorly measured fields, a lack of observations cannot fully constrain the model output and thus allow possibly unrealistic representations of the atmosphere to dominate. Comparisons of radiosonde and reanalysis-based estimates of Hadley Cell expansion indicate that inhomogeneities in assimilated observations may be behind the discrepancies in estimates of the expansion of the Hadley Cell [67]. In addition to the assimilation systems, differences in the physics of the underlying models used within the various reanalyses can result in different representations of the circulation. The strong Hadley Cell intensification in the ERA40 was demonstrated to be a result of an unrealistic tropical mid-tropospheric cooling trend [68]. The Northern Hemisphere winter cells in the NCEP and ERA40 reanalyses show significant differences, driven by the differing cloud amounts and radiation budgets predicted by the two products [69]. Modern reanalyses are not free from these shortcomings. Considerable variability is presented in the strength and width of the Hadley Cell within the different products [54,70,71]. Simpler metrics, such as changes to the mean jet stream position, are better-captured by the reanalyses and have less scatter in the estimates. More complex metrics, such as tropopause altitude, or , are more subject to the vagaries of the reanalysis models and cover a broader range, even within a given metric. The scatter in the estimates is often larger in the Southern Hemisphere, where fewer in situ observations are available and the reanalyses are more reliant on their internal dynamics and assimilated satellite data [72].
2.3.4. Climate Model Outputs
Essentially, climate modeling is just an extension of weather forecasting, but focusing on changes over decades rather than hours. Climate models predict how average conditions will change in a region over the coming decades, helping scientists understand how human activity is affecting the Earth’s climate. However, such a simulation brings problems of its own, for example understanding the simulation itself and discerning whether it is a good representation of reality. The poleward expansion of the Hadley Cell is one of the most robust aspects of the atmospheric general circulation’s response to a warming climate in global climate models. This response is seen in models of varying complexity, ranging from idealized aquaplanet simulations [73] to comprehensive general circulation model experiment [74], such as those from phases 3 and 5 of the Coupled Model Intercomparison Project (CMIP). The trend in the strength of the Northern Hemisphere cell shows much greater weakening in CMIP6 than in CMIP5, while the trend in its counterpart in the Southern Hemisphere shows slight strengthening. Davis and Birner [32] analyzed CMIP5 simulations and four modern reanalyses using an ensemble of objective tropical belt width metrics and found that reanalysis trends in the tropical belt width fall within the range of model trends for any given metric. Note that differences in climate feedbacks among models can produce significant intermodel variations in the Hadley Cell widening; however, the physical processes driving such variability in the Hadley Cell width are unclear.
3. Is the Hadley Cell Expanding?
3.1. Rates of Hadley Cell Expansion
The Hadley Cell is found to be expanding by a flurry of studies. However, previous studies have not agreed on the magnitudes of the observed change, with the magnitudes of the widening trend varying greatly from 0 to 2 decade e.g., [40,52,75]. Here, we synthesize the current state of understanding regarding metrics mentioned in Section 2.2. Figure 2 summaries the values of Hadley Cell edge shifting trend from studies using observations (mainly from satellite) and reanalyses based on different metrics. Data used in this figure are collected from previous studies mentioned in Section 3. Most of these values indicate an expansion of less than 0.5 decade in each hemisphere. The metrics based on middle troposphere data have greater magnitudes in the Northern Hemisphere, while the metrics inferring the upper troposphere situation (Z and ) expand with larger rates in the Southern Hemisphere. This could be related to a significant poleward shift of jet caused by the Antarctic ozone hole. In addition, there is a much stronger dependence on the Quasi-Biennial Oscillation (QBO) in the Southern Hemisphere than in the Northern Hemisphere. The QBO is a quasiperiodic oscillation of the equatorial zonal wind between easterlies and westerlies in the tropical stratosphere with a mean period of about 2.5 years. The alternating wind regimes develop at the bottom of the middle stratosphere and propagate downwards until they are dissipated at the tropical tropopause. A reversion in the equatorial zonal winds from easterlies to westerlies (an increase in the QBO index) leads to a poleward shifting of the ozone-based Hadley Cell edge [76].
The dynamical metrics have faster trends than those based on thermal or hydrological metrics, with the values exceeding 1 decade (Figure 2). Multiple studies using reanalysis data to examine streamfunction location show a wide range of trends, e.g., [32,40,44,45,71,74,77,78,79,80,81,82,83,84]. These studies indicate that the Northern Hemisphere has widened more rapidly than the Southern Hemisphere, with the trends reaching 1.3 decade for the Southern Hemisphere and over 2 decade for the Northern Hemisphere (Figure 2). Additionally, there is a greater seasonality and a high uncertainty in the Hadley Cell expansion. For the edges defined by the STJ locations, trends of less than 0.2 decade are generally found in reanalysis, while trends of larger than 1.2 decade are obtained from the satellite data (Figure 2). The STJs in the Northern Hemisphere experience a more poleward displacement ( decade) than those in the Southern Hemisphere. The EDJs have a poleward trend of less than 0.5 decade in each hemisphere from reanalyses. The satellite-derived trends in EDJ are much greater with estimates of poleward shifting from ∼0.5 to ∼1.2 decade during different study periods [58]. Seasonal differences in EDJ-based trends are also presented, which suggest a greater expansion in summer and fall seasons for each hemisphere.
The subjective tropopause-metric edge with a given threshold ( and ) show small broaden trends or even contraction in the Northern Hemisphere, while they generally show expansion in the Southern Hemisphere [85]. The objective tropopause-break-based edge (TPB) experiences a poleward shifting in those using monthly zonal mean view, e.g., [32], while this edge experiences a slight equatorward displacement in those using instantaneous data allowing longitudinal variability, e.g., [54] associated with El Niño-Southern Oscillation ENSO; [86]. This discrepancy is likely caused by the large contraction of the Hadley Cell in the east Pacific [54]. The trends in the Hadley Cell width associated with tropopause break location vary significantly for both hemispheres, with ∼0.5 decade widening in some cases and contraction in others. Overall, expansion rates of temperature-based metrics (LST and GTT) are below 0.5 decade, with little difference between the hemispheres. The changes in the near surface temperature show a slightly faster rate than that in the lower stratosphere, with a ∼ decade broaden trend for GTT-based edge and a ∼ decade broaden in LST-based edge.
Expansion estimates using OLR as a metric indicate that the Northern Hemisphere Hadley Cell generally has expanded twice rapidly than the Southern Hemisphere one. Previous studies examined the hydrological metric edge trends and found consistent poleward trends in the , , and , with a slightly faster expansion in the Northern Hemisphere [43,45,64].
The TCO-based metrics show a poleward trend of more than 1 decade in each hemisphere, although there is considerable difference between investigation periods [59,76]. There is a much larger rate of expansion at 2 decade in the Southern Hemisphere than in the Northern Hemisphere. This is associated with a much stronger cooling in the lower stratosphere due to a significant ozone hole over the Antarctic, in agreement with previous results [55,76].
The consistent rates in the metrics based on tropopause break location and the near surface ( and ) in the Southern Hemisphere indicate the tropopause-relative Hadley Cell edge marks the poleward flank of the subtropical dry zone. This suggests the tropopause-based location can be important for the hydrological cycle in the atmosphere. In the Northern Hemisphere, the greater poleward shifting of precipitation pattern may induce more significant impact on the society. The narrowing trends of the tropopause-based metrics indicate the complexity of Rossby wave activity associated with significant regionality difference and/or atmosphere-ocean coupling (e.g., ENSO). All the metrics show a broadening Hadley Cell except TPB-metrics location, which indicates that the Hadley Cell expansion induces more frequent stratosphere–troposphere exchange [53].
3.2. Reasons for Discrepancy among Trends in Hadley Cell Expansion
The wide range of the expansion estimates may be the result of different metrics, dataset, and time periods.
First, the wide range of observed trends is mostly due to the wide range of metrics used to define the Hadley Cell edge (e.g., tropopause height, subtropical jet, streamfunction, precipitation and evaporation, and outgoing longwave radiation). It has been shown that many of the metrics that were originally used do not correlate with the streamfunction expansion [32,46]. Metrics present different perspectives of the Hadley Cell, and thus there are discrepancies among the Hadley Cell widening trends using different metrics. For example, the streamfunction-based metrics generally denote the dynamical perspective of the Hadley Cell in the middle troposphere, while the TPB metrics relate the Hadley Cell edge with the thermal structure in the upper troposphere (Figure 1). Davis and Birner [36] examined the relationship among the diagnostics on seasonal and interannual time scales and found that the EDJ locations agree fairly consistently with some of the dynamical Hadley Cell edge diagnostics (e.g., , , and ). This can be attributed to the balance between zero surface zonal wind and the vertically averaged momentum. On the other hand, there is a synchronous seasonal cycle in location shifting of the tropopause break and subtropical jet [36]; however, the relationship between EDJ latitude and tropopause break (subtropical jet) latitude is loose [36,41,46]. This might suggest that the dynamical field can be solved better in the models, while this is not true for the thermal fields. Furthermore, the effects of moisture, which play key roles in the real atmosphere, are highly complex for modeling. Previous studies showed that the different evolution of the latitudes of and suggests that different physical mechanisms control them [39,87,88].
In addition, the discrepancy among different metric-based trends may be largely attributed to the different levels of troposphere representing by metrics, since the Hadley Cell tilts. For instance, Archer and Caldeira [75] examined the changes in wind field in the upper troposphere between the 100 and 400 hPa levels. By contrast, Strong and Davis [89] focused on the trends in the surface wind field and so will have missed the changes of the Hadley Cell in the upper troposphere. The metrics over different temporal and spatial scales also result in the different trends. Martin et al. [54] studied the Hadley Cell width change using a longitudinally varying tropopause-break method demonstrating the regionality of Hadley Cell change. They found a significant contraction of the Hadley Cell over the eastern Pacific between 1981 and 2015, and slight but statistically significant expansion in other subtropical regions.
The climate projections for different periods under similar atmospheric forcing may not produce a resembling Hadley Cell change [90,91]. This discrepancy between these projections could be attributed to both different metrics used to describe the Hadley Cell scale and climate sensitivities to various climate forcings of a given metric [90,92].
Second, the bias and uncertainty of the input data can induce inconsistency of estimates of Hadley Cell change. Inhomogeneity of observations will have a great impact on the quality of in situ and satellite data, as well as the reanalyses. The reanalyses are not fully constrained in data-poor regions, allowing the internal model dynamics to drive the variability of atmosphere. For example, there are biases and uncertainties in tropopause altitudes in the modern reanalyses [53], which can be attributed to the issues confronted by any model-related studies such as data assimilation, model vertical resolution, and parameterization schemes, e.g., [53,54,93].
The climate sensitivity of a given model can also have an impact on future trends in the circulation [94]. The changes of Hadley Cell width are sensitive to radiative cooling in the upper troposphere and stratosphere, sea surface temperature distributions, and land surface temperature changes, especially in the Northern Hemisphere [95,96,97]. Different cloud and convective parameterization schemes appear to contribute to the intermodel discrepancies in modeled Hadley Cell intensity [68]. Recently, CMIP6 historical all-forcing simulations show an expansion rate at per decade over 1970–2014, which is almost the same as that in CMIP5, with a larger contraction of Northern Hemisphere summertime Hadley Cell in CMIP6 models due to their higher average climate sensitivity [98]. Moreover, the satellite-derived data are sensitive to the accuracy of instrument detection and retrieval algorithms.
Third, there is regionality in atmosphere circulation largely owing to the land–ocean difference. Temperatures increase about twice as rapidly over land as over the oceans [99]. This inconsistency might cause regional difference of Hadley Cell change, as well as the inter-hemisphere difference. Regional processes, such as changes of available moisture provided by atmospheric advection, can explain the differences in trends among the metrics. The disagreements discussed above show the relevance of regional processes when comparing different metrics. Otto-Bliesner and Clement [100] reported that the formulation of the ocean model plays a strong role in determining the final characteristics of the Hadley Cell. Previous studies generally treated the Hadley Cells as occurring in a two-dimensional latitude-height plane, but cannot account for changes in tropical width associated with zonally asymmetric phenomena such as land–sea distribution and ENSO. In particular, the forced poleward shift of the storm track is most significant over the North Atlantic, which highlights the importance of a regional perspective when considering Hadley Cell width variations. More recent studies investigated the Hadley Cell edge based on the longitudinally varying methods and higher temporal resolution information [2,54]. For example, Martin et al. [54] found significant contraction of the tropics over the eastern Pacific between 1981 and 2015, and slight but significant expansion in other region. D’Agostino et al. [2] found that the poleward shift of the Northern Hadley Cell edge potentially increases serious droughts in Mediterranean/Middle East and Western Pacific. Based on the analysis of the climate model output, Amaya et al. [101] suggested that regional changes in hydrology largely follow the zonal mean in the Southern Hemisphere but exhibit strong regional differences in the Northern Hemisphere.
Fourth, the edge of Hadley Cell not only varies with the change of geographic location, but also changes in season. Hadley Cell becomes stronger in winter sphere due to a larger meridional temperature gradient and the strengthening of eddy momentum and buoyancy flux [33,44,55,64,74,102]. The -based metrics show a strong seasonality with the largest changes in each hemisphere’s respective summer and autumn [33,71]. The EDJ metric based on the position of the peak zonal-mean 850 hPa zonal wind shows notable seasonal differences in the Southern Hemisphere [40]. Seasonal variability can be found in other metrics [40,43]. As noted earlier, some of the metrics, particularly during the warm season, may not produce robust results. The poleward shift of the subtropical high is most robust in spring and fall seasons [103] as the regional signal of the expansion of the Hadley Cell [6].
Part of the discrepancy stemming from the fact that different time periods were chosen by different studies, which implies the complexity of the climate changes, e.g., [104]. Different studies can induce variant long-term trends of Hadley Cell change, which depend (at least in part) on the starting and ending points. Amaya et al. [101] investigated the changes in Hadley Cell width and its relationship with anthropogenic and internal forcings and found that the Hadley Cell width will expand during a prolonged cold ENSO phase.
Different response time of each metrics will contribute to the discrepancy. Studying the evolution of the atmospheric circulation to abrupt change, Wu et al. [105] showed that under abrupt double CO forcing the stratosphere is first to respond. While the Hadley Cell edge and global-mean surface temperature () show different response times to quadrupling CO, the poleward expansion of the dry zone was found to follow the slower changes in global-mean , rather than the rapid changes in the Hadley Cell width. This implies that in spite of the high correlation between the edge of the Hadley Cell (streamfunction expansion) and the edge of the dry zone [46,106], different mechanisms control them. At steady state, changes in precipitation and evaporation are in balance with moisture flux divergence changes. Both long-term [107] and transient [87] responses point to the importance of the time-mean circulation and transient eddies in shifting the edge of the dry zone poleward. Chemke and Polvani [39] found that the stationary eddy moisture fluxes, on the other hand, acts to push dry zone equatorward. The cancellation of the transient and stationary eddy moisture fluxes results in a minor contribution in the expansion of the dry zone.
The narrowing Hadley Cell in the east Pacific found by Martin et al. [54] contributes to zonal mean narrowing, contradicting prior work, and is attributed to the use of monthly and zonal mean data in prior studies. This indicates that monthly mean data calculated from daily data can be strongly impacted by extremes at the daily scale, leading to unrealistic trends that depend more over variability. The sign of the trend in tropical width changes from narrowing in the instantaneous analysis to widening in the monthly mean analysis.
Fifth, one of the main difficulties in observing a significant trend is the presence of both the internal variability of the climate system (e.g., Pacific decadal oscillation and ENSO) and the multiplicity of anthropogenic forcing agents [41,47,82,92,106] that are able to affect the width of the tropical circulation. For example, while enhanced greenhouse gas (GHG) emissions were found to expand the tropical circulation in recent decades, e.g., [74,108], the buildup of anthropogenic aerosols in the Northern Hemisphere were found to contract the circulation, and thus offset the expansion signal [109]. In the Southern Hemisphere, ozone depletion was found to be the main forcing of tropical expansion in the second half of the twentieth century [78,110], and the ongoing recovery of ozone hole will therefore cancel the effect of greenhouse gases throughout the first half of the twenty-first century [111]. These will be further discussed in Section 4.
4. What Are the Factors behinds the Expansion?
4.1. Sensitivity of Hadley Cell Extent to Different Forcings
In order to better understand the natural and anthropogenic forcings that contribute to the Hadley Cell width changes, previous studies performed a suite of climate model simulations given different internal modes and external forcings. The Hadley Cell expansion rates under these different forcings for both historical and future climate in the previous studies were summarized in Figure 3 and Figure 4. Data used in Figure 3 and Figure 4 are extracted from previous studies [38,44,45,54,55,80,82,83,84], respectively.
4.1.1. Nature Variability
A flurry of studies has suggested that the changes in the surface temperature are the main driver of the Hadley Cell expansion, e.g., [73,112]. SSTs exhibit a strong control over the tropospheric circulation, as they largely indicate the temperature and humidity structure of the entire troposphere. The SST warming produces stronger dipole wind anomalies about the midlatitude jet than that produced by either GHG increases or ozone changes alone [44]. The SST warming near the equatorward flank of the Hadley Cell edge causes the Hadley Cell narrowing due to the weakening temperature meridional gradient, while the warming over the tropical area can result in a Hadley Cell widening.
The Hadley Cell edges are projected to shift poleward at a rate of 0.06–0.2 decade during the 21-century due to the SST warming (Figure 4), while the dry zone edge and Ferrel Cell location have a higher sensitivity to the combined forcings from SST warming [44]. Moreover, the precise geographical distribution of the SST trends is crucial for seizing the contraction of Northern Hemisphere summer Hadley Cell. The Hadley Cell edge shifts poleward in response to the SST warming over the subtropical regions near and on the equatorward flank of the Hadley Cell edge, and shifts equatorward in response to warming over the tropical area except for the Western Pacific Ocean and Indian Ocean. It is estimated that more than half of the SST-induced Hadley Cell widening in 1980–2014 is caused by changes in the spatial pattern of SST [113,114].
An apparent intensified and poleward expansion of the Hadley Cell was found in recent decades based on reanalyses [71,115], whereas most global climate models, including those that participated in the CMIP3, CMIP5, and the latest CMIP6 have suggested that the Hadley Cell will become weaker with a future warmer climate. There are still many disputes about the reliability of climate model projected Hadley Cell changes. Some studies have attributed the weakening of the Hadley Cell in the models to their overestimation of the increase in atmospheric stability in the tropics with warming climate due to their tendency to adjust atmosphere temperature profiles to the moist adiabatic lapse rate [68]. However, most previous studies have accepted the weakening of the Hadley Cell as a likely outcome in a future warmer climate [90,97].
Recently, Chemke and Polvani [39] examined the different response time between the Hadley Cell edge and global-mean surface temperature, and found that the slow processes associated with the ocean dynamics are more responsible for widening the Hadley Cell. This indicates the importance of ocean circulation and oscillation in widening the Hadley Cell. The Pacific Decadal Oscillation (PDO) is a climate phenomenon that occurs primarily in the Northern Pacific Ocean, which phases are associated with different distribution patterns of SST. The Hadley Cell expansion in both hemispheres can be contributed to the cool or negative PDO-like SST pattern [82,101,116,117] as a consequence of perturbations in the meridional temperature gradient at the edge of the Hadley Cell. This is more significant during the equinox seasons [116]. Meanwhile, the jet stream becomes weaker during the negative PDO phase [118,119].
The ENSO has been hypothesized to impact the Hadley Cell width as well [68]. The various reanalysis products indicate that the -based Hadley Cell width becomes narrower during El Niño phase and wider during La Niña phases [70,71,101]. This general tendency is also suggested in general circulation model (GCM) simulations [22], which show an equatorial shift of the STJ during El Niño. Using the high vertical resolution GPS radio occultation observations, however, Wilhelmsen et al. [86] found a much lower tropopause altitude during La Niña in the east Equatorial Pacific Ocean, indicating a narrower Hadley Cell in these regions.
There are some other ocean–atmosphere oscillations being used to investigate their impacts on the Hadley Cell width. For example, weakened jet and Hadley Cell were found during positive tropical North Atlantic Oscillation (NAO) [119]. An increase in the QBO index, by cooling the stratosphere, leads to a poleward shift of the subtropical jet. There is a much stronger dependence on the QBO in the Southern Hemisphere than in the Northern Hemisphere, resulting from the stronger ozone depletion in the Southern Hemisphere.
4.1.2. Volcanic Eruptions
Globally large volcanic eruptions can lead to changes in the physical and chemical characteristics of the atmosphere that can ultimately impact on circulation and climate. Major eruptions can increase stratospheric aerosol, warming the lower stratosphere and cooling the troposphere, which depresses the tropopause height [13]. Large eruptions were also found acting as a trigger for El Niño [120], and causing a narrower Hadley Cell with a magnitude of this effect estimating to be ∼ latitude [67].
4.1.3. Ozone Depletion
The ozone concentration in the stratosphere plays a crucial role in determining the stratospheric dynamical state, which is a factor affecting the baroclinic instability. The significant ozone depletion over the Antarctic as known as the “ozone hole” have caused the expansion of the Hadley Cell in the Southern Hemisphere (up to 0.02 decade as shown in Figure 3), e.g., [96]. Over 30 years after the Montreal Protocol came into effect, the ozone hole over the Antarctica is finally showing signs of healing, GCMs studies found that ozone recovery may approximately cancel the effects of GHG on climate change in the first half of the 21st century, resulting in a reduced or near-zero trends in the Hadley Cell width, tropopause, and jet location [77,111]. This might be due to the striking difference between GHG- and ozone recovery-induced changes in wave drag [31].
4.1.4. Greenhouse Gases
Extra absorption of longwave radiation by increased GHG concentrations warms the troposphere and cools the stratosphere. Increasing greenhouse gas concentrations contribute to stratospheric cooling above 60 hPa (the middle stratosphere) during both boreal winter and summer, intensifying with height at least up to 10 hPa. An unambiguous increase in tropopause altitude was found as a response to increased GHGs [13,121]. Eventually, this allows the circulating air of the Hadley Cell to travel further, as tropopause altitude was shown to be important for its poleward limit [9,10]. This could also push the midlatitude westerly winds poleward [122]. Regarding the Hadley Cell meridional width, it was found to follow the latitude where the angular momentum conserving flow becomes baroclinically unstable [10]. Under increased GHG, the stabilization of the subtropics and its associated reduction in baroclinicity were found to shift the Hadley Cell edge poleward [22,112].
Historical forcing simulations suggest that, as shown in Figure 3, GHG concentration enhancements produce a widening of Hadley Cell of about 0.02 decade for both hemisphere [44,45,74,117]. During the twentieth century, the increased CO concentration pushes the Hadley Cell edges poleward up to 0.03 decade, which is slightly stronger than the effect caused by ozone depletion. In recent decades, the poleward shift of the Northern Hemisphere annual-mean Hadley Cell edge is slightly larger than that in CMIP6 models. Increasing greenhouse gases drive similar trends in CMIP5 and CMIP6 models, so the larger recent Northern Hemisphere trends in CMIP6 models point to the role of other forcings, such as aerosols [123].
4.1.5. Anthropogenic Aerosols
Atmospheric aerosols play an important role in regulating radiation budget in the Earth–atmosphere system. They can directly alter the incoming solar radiation through directly absorbing (primarily by black carbon) or scattering (primarily by sulfate aerosol), which contribute to tropospheric warming and surface cooling. They can also semi-directly and indirectly affect the lifetime and albedo of clouds [124,125,126,127]. These aerosol forcings further alter the precipitation and atmospheric thermal structure, as well as hydrological cycle and climate system [128,129].
There is heavier loading of anthropogenic aerosol in the Northern Hemisphere, which creates an inter-hemispheric radiative imbalance. The atmosphere tends to moderate this asymmetry by altering the zonal-mean circulation in the tropics. The direct radiative forcing of black carbon induces a stronger Hadley Cell in the Northern Hemisphere, and a weaker one in the Southern Hemisphere [130], while radiative cooling from aerosol results in a weakened (strengthen) Hadley Cell in the Northern (Southern) Hemisphere [131].
The direct effects of anthropogenic aerosols tend to have a net local warming effect, which shifts the Hadley Cell poleward. The observed shift in the Hadley Cell in the Northern Hemisphere has been attributed to midlatitude heating by direct effects of anthropogenic aerosols and tropospheric ozone emitting from industrialized countries and regions [130,132]. A comparison of groups of coupled models from the CMIP3 with and without black carbon change suggests an opposite shift of the Hadley Cell edge [45].
Outside of the tropics, Ming et al. [133] simulated a wintertime equatorward shift of the subtropical jet and middle storm tracks in the Northern Hemisphere, particularly in the North Pacific, due to the pronounced cooling effect of aerosols. Wang et al. [134] further attributed the weakened and expanded Hadley Cell to global redistribution of aerosol emission from traditional industrialized countries to fast-developing Asia, which has weakened the meridional temperature gradient. The increasing pollution in Asia accounts for the widening of the Hadley Cell, while the decreasing pollution in Europe and United States tends to narrow the Hadley Cell. Rotstayn et al. [135] further argued that anthropogenic aerosol effects in the Southern Hemisphere tend to weaken the subtropical jet in the Southern Hemisphere by decreasing the midtropospheric temperature gradient between the tropics and extratropics. Although aerosol loadings are regional in scope, they can have circulation impacts on remote regions around the globe [130,136]. Xie et al. [136] analyzed the simulations results from the CMIP5 and suggested that through the ocean–atmosphere feedback in the coupled models, counter-intuitively, the aerosol direct forcing in the Northern Hemisphere caused a reduction in surface temperature and wind speed over the Southern Ocean.
An examination of the aerosol effects on the global circulation in greater detail performed by Wang et al. [134] suggests that aerosol indirect forcing (aerosol–cloud interactions) is predominant over the total aerosol forcing in magnitude. Meanwhile, aerosol radiative (direct) and microphysical (indirect) effects jointly shape the meridional energy distributions and modulate the circulation systems.
The concern about the impacts of anthropogenic forcings on climate change was growing since 1970s [137]; however, the natural internal variability might obscure the anthropogenic forcings on the Hadley Cell changes. Previous studies found that the natural low-frequency variability associated with ocean dynamics has probably caused at least as much of the recent trend in Hadley Cell widening as human activity [82,101], which indicates that the Hadley Cell widening may not be predominantly human-induced. Using the largest ensemble available among the climate models Max Planck Institute–Grand Ensemble, the impacts of the internal climate variability and anthropogenic forcing have been disentangled by D’Agostino et al. [2]. They suggested that the trends in a widening of Hadley Cell in reanalyses over last decades cannot be considered a robust signal of anthropogenic forcing, while the internal variability will prevail over the forced response until 2100.
4.2. Validation of Scaling Theories
The Held and Hou [9] theory defines a steady, inviscid, zonally symmetric flow without considering the impacts of eddies. By benchmarking the behavior of the axisymmetric flow against that described [9], however, Kim and Lee [138] found that the latitudinal extent of Hadley Cell is sensitive to the viscosity, resulting from changes in the diabatic heating and surface friction. Likewise, the Hadley Cell scale is sensitive to the meridional temperature gradient. In both increasing viscosity and enhanced meridional temperature gradient, the changes in the static stability change are found to be of secondary importance. However, when the static stability is decreased (increased) by a sufficient amount, the Hadley Cell becomes narrower (broader).
The strength of the Hadley Cell predicted by Held and Hou [9] increases nonlinearly with distance between heating center latitude and the equator due to asymmetric solar heating, the time-average strength of the Hadley Cell with seasonal forcing is stronger than that produced by annually averaged forcing; however, this does not appear to be a feature of either the observations or more complete numerical simulations, suggesting that this angular-momentum-conserving model has some deficiencies [139,140]. Most previous studies argued that the theory proposed by Held and Hou [9] has focused on tropical thermodynamics, but has not included the eddy activity, which plays a crucial role in the real world, will fail to predict the Hadley Cell extent accurately. By analyzing the combining satellite observations of precipitation, cloud, and radiation; however, Zhou et al. [43] found the intensification of ITCZ and poleward shift of the subtropical dry zones consistent with a widening Hadley Cell due to the increasing GHGs. Lau and Kim [91] proposed that the Hadley Cell will become more intense and broader during a future warmer climate. The stronger convection in the deep tropics induced by GHG forcing can adjust atmosphere temperature profiles to the moist lapse rate [68], and raise the tropopause that can ultimately broaden the Hadley Cell [9]. Interestingly, among a series of CMIP5 climate model studies using similar forcings according to Representative Concentration Pathway (RCP) 8.5 future projections [90], only Lau and Kim [91] reported an intensifying Hadley Cell for the period of 2081–2100.
Comparing different models in the Intergovernmental Panel on Climate Change Fourth Assessment Report, the individual long-term trends in Hadley Cell extent show only a small correlation to the trends in the tropical tropopause height. In fact, within each model, the detrended annual mean time series of tropical tropopause height and Hadley Cell extent tend to be anti-correlated. Furthermore, the long-term trend in the tropopause altitude [53] shows that considerably upward trends are found in the subtropics rather than in the deep tropics. This is considered as the results of global warming, which warms the troposphere and cools the lower stratosphere, and adjusts atmosphere temperature profiles to the moist adiabatic lapse rate [68]. By analyzing the long-term changes in in ERA5, we found dry subtropics predicted by Lau and Kim [91] only significant in the western United States as shown in Figure 5 (similar trend map for P not shown), while the central Africa experiences the most significant decreasing trend of precipitation. This indicates that the tropical tropopause altitude may play less role than Held and Hou [9] expected.
The Hadley Cell extent in the Held [10] theory may be interpreted as being limited by the latitude at which the thermally driven wind becomes baroclinically unstable, rather than by the energetic closure of the thermally driven cell. Under global warming conditions, rising tropospheric static stability (tropopause altitude) due to the modification of lapse rate [68], which is an established consequence of moist thermodynamics, stabilizes the subtropical jet streams at the poleward flank of the Hadley Cell to what is required by baroclinic instability considerations, and consequently, the Hadley Cell extends poleward.
Using idealized GCMs [21,73,141], full atmospheric-only GCMs, e.g., [73], and coupled GCMs, e.g., [6,22], it has been shown that, under global warming, the latitudinal extent of the Hadley Cell follows the Held [10] scaling. The tropical widening was found to be correlated with both the increase in subtropical static stability, e.g., [22,112] and the subtropical tropopause height, which pushes the baroclinic zone poleward, e.g., [6]. For example, using idealized heating profiles reminiscent of those expected from global warming scenarios, Butler et al. [142] found that both tropical upper-tropospheric heating and stratospheric cooling results in a higher tropopause and a poleward shift in midlatitude jet, and ultimately an expansion of the Hadley Cell. This supports the theory proposed by Held and Hou [9] that tropical thermal structure is crucial for Hadley Cell edge changing. Most previous studies investigated the long-term response of the Hadley Cell expansion by correlating it with the above suggested components (e.g., surface temperature, tropopause height, static stability, and eddy phase speed); however, comparing different studies, the contribution of each parameter is inconsistent. With an idealized dry GCM, Walker and Schneider [21] found a large sensitivity of the Hadley Cell width to the lapse rate parameter associated with static stability in their convective parameterization, a factor that they interpret with the Held [10] scaling. With a set of aquaplanet simulations using both a full GCM and an idealized moist GCM, Frierson et al. [73] showed that the Held [10] scaling fits the simulated Hadley Cell widths over a wide parameter range. In coupled climate model simulations, Lu et al. [6] found that the Held [10] scaling is more relevant to the dynamics that controls the extent of the Hadley Cell in the present-day climate.
The theories mentioned in Section 2.1 treat the tropospheric circulation as occurring in a two-dimensional latitude-height plane, and predicts a reasonable climatological Hadley Cell, but cannot account for changes in Hadley Cell width associated with zonally asymmetric phenomena such as ENSO and land–sea distribution. The streamfunction-based width is found coupled well with the STJ and with no significant lag on monthly time scales in Southern Hemisphere. This is consistent with angular-momentum-conserving theories for the width of the Hadley Cell, where angular momentum conservation in the Hadley Cell and its terminating latitude due to baroclinic instability essentially controls the latitude of the subtropical jet; however, the well-documented relationship between STJ (and ) and is not valid in Northern Hemisphere. The Northern Hemisphere subtropical jet leads the edge of the Hadley Cell by 1 month, which could be due to zonal asymmetries in the Northern Hemisphere, such as the monsoonal circulations and longitudinal variations in topography [36].
The poleward of STJ indicating an increase in latitude of TPB, leads to a rising of subtropical tropopause and finally widens the Hadley Cell according to Held [10]. For example, Lorenz and DeWeaver [14] linked the poleward shift in zonal mean circulation to the rise of the extratropical tropopause, a feature that has been found to be effective in driving the jet shift in other independent studies [143,144]. Lu et al. [22] and Chen et al. [145] further proposed that the increased meridional temperature gradient associated with the extratropical tropopause rise can lead to faster phase speeds of the baroclinic waves based on linear quasigeostrophic analysis [28]. More recently, based on the changes in the latitude of and Held [10] scaling with fixed tropopause height, which is determined by subtropical static stability, Chemke and Polvani [39] suggested the importance of the static stability, rather than the tropopause height, in widening Hadley circulation.
Although the Hadley Cell widening was found correlated with the warming in the troposphere, e.g., [55,73,108,112], the increased eddy phase speed, e.g., [22,146], the rising subtropical tropopause altitude [12,13,14,22], and associated increased subtropical static stability, e.g., [10,22,112], or increased wind shear [147]; however, most of these parameters do not synchronize with each other. The different response time to CO greenhouse effect between Hadley Cell edge and global-mean surface temperature indicates that global-mean temperature is not the main driver of the Hadley Cell expansion [87] and is modulated by slow-response processes in the ocean circulation and oscillations. Changes in eddy phase speed deviate from Hadley Cell edge changes as indicated by [148,149]. While changes in circulation have a rapid response with a response time of ∼4 years, changes in moisture are slower and constantly increasing with a response time of ∼100 years [39].
By examining the evolutions of atmospheric parameters, Chemke and Polvani [39] found that the Hadley Cell widening is due to changes in the extratropical baroclinicity. A reduction in baroclinity in the subtropics dampens eddy activity there and extends the Hadley Cell further poleward. This reduction is a result of an increase in the dry static stability, related to a quasi-moist adiabatic adjustment to increasing specific humidity. Kim and Lee [138] suggests that changing characteristics of viscosity and meridional temperature gradient are predominant over static stability changes. Furthermore, the urbanization changing the landscape of cities enormously can increase surface friction and changes the surface thermal emission, ultimately increases the viscosity. In addition, the changes in the vertical wind shear can play an important role to this mechanism.
A warmer climate adjusts atmosphere temperature profiles to the moist adiabatic lapse rate [68] and raises the tropopause altitude. Although qualitatively similar in terms of the jet response, the resulting circulations due to GHG forcings from the two regions were different. Allen et al. [150] performed a suite of simulations using a range of idealized heating profiles, both stratospheric cooling and tropospheric heating. In their experiments, heating in the deep tropics resulted in little change in jet stream and Hadley Cell, while midlatitude heating produced a poleward jet shift and expansion of the Hadley Cell. Tandon et al. [147] examined the circulation response to a series of tropospheric heating profiles of varying widths. Heating near the equator produced a contraction of the tropics, while subtropical heating produced the opposite responses. The meridional extent of the forcing appears to be particularly important factor in determining the response of Hadley Cell in these idealized experiments. These results support the theory proposed by Held [10] that subtropical thermal structure plays an important role in determining Hadley Cell width.
In the Held [10] theory, an increase in tropopause height should increase the critical shear necessary for baroclinic instability, and thus push poleward the latitude where it is equal to the angular momentum conserving shear. Anomalously high tropical tropopause height is associated with the more active tropical convective heating during El Niño, which usually drives a stronger and narrower Hadley Cell [6,151]. The contraction of the Hadley Cell under the El Niño condition may be interpreted as the consequence of the intensified subtropical jet, which attracts equatorward the critical latitudes of the eddy propagation and the associated eddy-driven subtropical subsidence near the Hadley Cell edge [151], rather than variation of the Hadley Cell width should be proportional to the tropical tropopause height. Further, the more intense warming in the subtropics increases the baroclinicity poleward [152], which in turn suppresses eddy growth due to the reduced , ultimately expands the Hadley Cell.
However, there are some deviations in the changes between the latitude of and Held [10] predicted scale. Chemke and Polvani [39] showed that the rapid increase in static stability (i.e., rapid decrease in the subtropical lapse rate) in the first ∼10 years decreases the baroclinicity, and explains most of the poleward shift of the Hadley Cell and of the eddy momentum flux. The tropopause height, on the other hand, seems to have a minor effect on baroclinicity, and thus shows different response time than the Hadley Cell width. This is in agreement with the results of Son et al. [112], who found high correlation between changes in subtropical static stability and Hadley Cell shift in past and projected climates. In addition, the slower changes in tropopause height relative to the static stability indicate the stratospheric impacts play an important role on the tropopause evolution [104], while the static stability reveals the thermal change in the troposphere alone.
According to the eddy-driven Hadley Cell model, if static stability is small, then the circulation will become stronger if the other terms remain the same [153]. That is, a dry atmosphere with a lapse rate close to that of a dry adiabat (i.e., N = 0) may have a stronger overturning circulation than otherwise, because the air can circulate without transporting any heat.
In winter, the increased strength of eddy momentum and buoyancy fluxes will drive a stronger Hadley Cell. This constitutes a different mechanism from that given in the difference between the solved temperature from the energy equatiion and the radiative equilibrium temperature for the increased strength of the winter cell. The winter Hadley Cell is quite distinct from the midlatitude circulation, suggesting the dominance of axisymmetric dynamics, for if it were solely a response to eddy heat and momentum fluxes one might expect it to join more smoothly with the midlatitude Ferrel Cell. The axisymmetric winter Hadley Cell is naturally stronger than its summer counterpart, even in a dry atmosphere, and the further effects of condensation and the concomitant concentration of the thermodynamic source may strengthen it further, giving the axisymmetric circulation a dominant role.
In summer, in contrast, there is virtually no recirculation within the Hadley Cell and it does not appear as a self-contained structure, suggestive of baroclinic eddy effects and/or a strong midlatitude influence; even without baroclinic eddies, zonally asymmetric circulations are important, for the Hadley Cell over India and South East Asian is intimately linked with monsoonal circulations; however, tying the monsoon circulation into a theory of the Hadley Cell, and in particular into the transition from winter to summer dynamics is a task for the future. The atmosphere is further from its radiative equilibrium in winter than summer, indicating a larger heat transport. The transport occurs because polewards moving air tends to have a higher static energy (for dry air; in addition there is some energy transport associated with water vapor evaporation and condensation) than the equatorwards moving, and thus the ensuing circulation seeks to reduce this gradient [153].
Lu et al. [6] find that the extratropical tropopause height, which is a good proxy of the static stability, varies in concert with the width of the Hadley Cell on both the interannual and longer time scales. The increase in the stability near the subtropics acts to suppress baroclinic instability, which is a critical factor controlling the limits of the Hadley Cell. The extratropical stabilization inhibits the breakdown of the thermally driven cell, allowing it to reach higher latitudes, as a result the edges of the Hadley Cell expand poleward. Shaw and Tan [154] and Chemke and Polvani [39] have recently demonstrated the importance of subtropical static stability in modulating the width of Hadley Cell under increased GHGs. While analyzing different idealized warming patterns, Tandon et al. [147] argued that the wind shear, rather than static stability, is the most important for changing subtropical baroclinicity and the edge of the Hadley Cell. Thus, the widening of the circulation in recent years, which is likely driven by both internal variability [38,47,82,92,106] and different forcing agents [38,45,155], may stem from other components and not only from static stability. Some sensitivity studies showed that changes in baroclinicity from global warming experiments were mainly attributed to the meridional temperature gradient, e.g., [17], while others contribute a reduction in baroclinicity in the subtropics to an increase in static stability. The decrease in the vertical wind shear also acts to suppress baroclinic instability [156]. Previous studies found that the reduced baroclinicity in the subtropics causes eddy activity to retreat to higher latitude, as a result the edges of the Hadley Cell shift poleward [6,17]. There is a consistent poleward and upward shift and intensification of the storm tracks found in an ensemble of 21st-century climate simulations performed by 15 coupled climate models [17]. The shift of the storm tracks is accompanied by a poleward shift and upward expansion of the midlatitude baroclinic regions associated with increased tropopause height.
An increase in the phase speed of upper-tropospheric baroclinic waves may be a factor of Hadley Cell expansion. The faster moving waves are unable to penetrate as far equatorward, producing a poleward shift in eddy momentum flux convergence and an associated shift in the position of the EDJ. The increase in phase speeds does not allow as much penetration of the eddies into the subtropics, moving the subtropical breaking region polewards, which is associated with the coupling between upper troposphere and lower stratosphere that results in baroclinic eddy production. A more significant warming due to GHGs was observed in the midlatitude, which can reduce the equator-to-pole temperature gradient. According to Equation (4), both the heating and meridional temperature gradient reduction can dampen eddy activity, and thus extends the Hadley Cell poleward.
Increasing stratospheric shear increases the phase speed of growing baroclinic waves that can produce a transition from anticyclonic (AWB) to cyclonic (CWB) behavior at wavenumber 7 [27]. Based on the climate model simulation, the increase (reduction) frequency of the AWB (CWB) occurrence at the poleward (equatorward) side of the corresponding climatological distribution is exactly what is ascribed to the changes of upper-level wave breaking statistics due to the GHG forcings. Wittman et al. [27] confirmed that a transition from AWB to CWB may play a role in broadening Hadley Cell; however, there is no sufficient observation supporting this wave type mode transition theory. Changes to the eddy length scale may also be a factor, perhaps in response to an increase in upper-tropospheric baroclinicity in the midlatitudes [19,157]. More recently, Chemke and Polvani [39] confirmed that only the transient eddies in the storm track play a role in pushing Hadley Cell edge polewards, while the stationary eddies in the subtropics pull the edge equatorward. Eddy moisture flux was found to have a minor contribution to shifting the dry zone edge poleward, due to the cancelling effects of transient and stationary eddies, which, respectively, diverge and converge moisture in the subtropics.
In summary, theories considering the extratropical factor are better models for predicting the Hadley Cell width changes.
5. What Are the Impacts Caused by the Tropical Widening?
The Hadley Cell has an impact on different atmospheric processes on varying scales of time and space, ranging from weather to climate (Figure 6). Weather systems in the midlatitude tend to follow the jet streams that are embedded in the subtropical and polar fronts. Hence a poleward movement of the fronts leads to a net movement of the weather patterns towards the poles. A consistent poleward and upward shift and intensification of the storm tracks is found in reanalysis-based studies, e.g., [158,159] and in climate simulations, e.g., [17,160]. A shift in the storm track results in less precipitation over subtropical regions. The observed poleward movement in the storm track will lead to a significant latitudinal shifts in the global weather patterns, temperatures, precipitation and the hydrologic cycle. The expansion of Hadley Cell with the poleward extension of the the subtropical dry zone may shift precipitation patterns and bring more frequent droughts to many densely populated regions that currently enjoy mild weather [161], which has potential to expand subtropical deserts and induce wildfires [1,162]. The Mediterranean/Middle East, Western Pacific, and Asian monsoon region will be exposed to more frequent droughts due to the poleward shift of Northern Hemisphere Cell [2,163]. Meanwhile, the subtropical highs over ocean coincide with regions of high salinity featuring low marine bioproductivity, and a widening Hadley Cell implies an expansion of these regions. Furthermore, the amount of convection has been found reduced in climate models [163,164,165,166].
Because the poleward shift of the subtropical high is the most robust in spring and fall seasons [103] as the regional signal of the expansion of the Hadley Cell [6], a poleward shift of the mean circulation may also project on a weakening of the atmospheric rivers. This is because the poleward shift of the mean circulation structure will shift the origins and pathways of the atmospheric river to higher latitudes, as atmospheric rivers have been associated with wave breaking in the storm track [167]. As a consequence the atmospheric rivers may be weakened by the reduced water vapor available from the cooler surface that provides the moisture for atmospheric rivers near their origins and/or along their pathways [168], although other factors such as weakening in wind speed may also play important roles.
The near-surface wind speed trends derived from ERA5 during 1979–2020 shows a significant strengthening trend in the trade wind, with the maximum occurring in the Pacific (not shown). This is consistent well with the stronger Hadley Cell [7]. The Northern Hemisphere terrestrial near-surface wind speed experienced significant decreasing trends during 1980–2010, when the Southern Hemisphere ocean near-surface wind speed was characterized by significant upward trends; however, global near-surface wind speed trends during 2010–2019 shifted in their sign: they became positive over the Northern Hemisphere land, and turned into negative in the Southern Hemisphere trade wind zone [169]. For instance, Zeng et al. [119] found that wind over Northern America has been increasing since 2010. The CMIP6 model simulations demonstrated that the GHG warming plays an important role in triggering the near-surface wind speed trends over land and the oceans during 1980–2010 through modulating the atmospheric circulation. Wang et al. [134] found a reduced zonal winds over the tropics due to the global redistribution of aerosol emissions from traditional industrialized countries to fast-developing Asia, which has caused a weakening of the meridional temperature gradient.
Tropical cyclones are among the most catastrophic weather events and can cause severe economic loss and casualties over populated coastal regions in the tropics and subtropics. Concurrent with the changes in the Hadley Cell edge, a poleward displacement in the tropical cyclones has been found in both hemispheres, with rates of 0.48 and 0.56 decade between 1982 and 2012 in the Northern and Southern Hemispheres, respectively [170,171]. Sharmila and Walsh [172] have shown that the recent anomalous upper-level weakening of the rising branch of the Hadley Cell in the deep tropics may suppress the tropical cyclone genesis over most ocean basins through anomalous large-scale subsidence. The expansion shift of Hadley Cell’s meridional extent have also accomplished a favorable condition for tropical cyclone activity in higher latitudes. Simulation studies suggested that tropical cyclone genesis will also continue to shift poleward, which in turn possibly increases threats to the high-latitude coastal regions that have not been historically inclined to tropical-cyclone-related hazards [173,174].
Interactions between weather and the tropopause layer can lead to changes in the physical and chemical characteristics of the stratosphere that can ultimately impact climate. Namely, transport of air and greenhouse gases across the tropopause (stratosphere-troposphere exchange) can lead to changes in radiative forcing seasonally and annually that drive climate variability and change.
According to the cloud–circulation–radiation feedback processes proposed by Lau and Kim [91], the changes in the circulation can lead to changes in the cloud generation that can impact radiative forcing, e.g., [175]. The changes in the radiative transfer will in turn modify the general circulation and the hydrologic cycle [176].
6. Summary
Considerable efforts have been made to understand the causes and effects of Hadley Cell expansion, as summarized in the schematic illustration in Figure 6. This article reviews the theories for explaining the Hadley Cell extent, and the metrics and datasets for describing the Hadley Cell edge, summarizes various long-term trends of Hadley Cell expansion from previous studies, and suggests several reasons for the discrepancy among them. Although there is a wide range in the Hadley Cell widening rates based on different metrics, especially for those using streamfunction, the reported upper-tropospheric and lower-tropospheric metrics show a similar magnitude of trend in Hadley Cell expansion. The discrepancy between Hadley Cell expansion rates in observations and models has not been conclusively settled largely owing to a lack of observation over the ocean, as well as the model assimilation systems. The sensitivity of the Hadley Cell edge to different natural and anthropogenic forcings is discussed. Although the concern about the impacts of anthropogenic forcings on climate change has been growing since 1970s, the natural internal variability might still obscure the anthropogenic forcings on the Hadley Cell changes until the end of this century. The superposition of natural internal variabilities and anthropogenic forcings (e.g., low-carbon economy, and reduction in ozone-depleting substances) has resulted in a period of decelerated global warming by around 2010. For example, the historical trend in the Hadley Cell expansion in the Southern Hemisphere is much larger than the Northern Hemisphere largely due to the ozone hole in the Antarctic. The discrepancy in trends between two hemispheres might become smaller due to the ozone hole recovery in the future. The theories of Hadley Cell scaling are validated by the results based on observations and model simulations, suggesting that those considering the extratropical factors can predict the Hadley Cell width better; however, many questions about Hadley Cell climate still remain for future research. The linkages between different metrics need to be clarified. The lack of cloud observations in the vast ocean limits our understanding of the climate change of cloud characteristics (e.g., cloud vertical extent, cloud hydrometers) especially in the ITCZ. The significant regionality of topography prevents from getting a consensus prediction of Hadley Cell change for some regions. The good agreement among metrics over some regions suggests that these regions will be future hot spots [2]. Moreover, much remains to be researched regarding the question of how sensitive are the projections to the changes of clouds, precipitation, sea surface and land surface temperature, and aerosols in the climate models simulations.
Author Contributions
Conceptualization, T.X. and Y.-F.M.; investigation, T.X. and J.X.; data collection from literature, J.X. and Z.Z.; visualization, Y.-F.M. and T.X.; formal analysis, T.X.; writing—original draft preparation, T.X.; writing—review and editing, T.X., Y.-F.M., Z.Z., W.W., R.W. and L.-P.W.; funding acquisition, T.X., Y.-F.M. and L.-P.W. All authors have read and agreed to the published version of the manuscript.
Funding
This work was supported by the National Natural Science Foundation of China (NSFC award No.: 42075071, 42075078), and Key Special Project for Introduced Talents Team of Southern Marine Science and Engineering Guangdong Laboratory (Guangzhou) (GML2019ZD0103).
Institutional Review Board Statement
Not applicable.
Informed Consent Statement
Not applicable.
Data Availability Statement
The data presented in this study are available on reasonable request from the authors.
Conflicts of Interest
The authors declare no conflict of interest.
References
- Feng, S.; Fu, Q. Expansion of global drylands under a warming climate. Atmos. Chem. Phys. 2013, 13, 10081–10094. [Google Scholar] [CrossRef] [Green Version]
- D’Agostino, R.; Scambiati, A.L.; Jungclaus, J.; Lionello, P. Poleward shift of northern subtropics in winter: Time of emergence of zonal versus regional signals. Geophys. Res. Lett. 2020, 47, e2020GL089325. [Google Scholar] [CrossRef]
- Wang, B.; Jin, C.; Liu, J. Understanding future change of global monsoons projected by CMIP6 models. J. Clim. 2020, 33, 6471–6489. [Google Scholar] [CrossRef]
- Wang, B.; Biasutti, M.; Byrne, M.P.; Castro, C.; Chang, C.P.; Cook, K.; Fu, R.; Grimm, A.M.; Ha, K.J.; Hendon, H.; et al. Monsoons climate change assessment. Bull. Am. Meteorol. Soc. 2021, 102, E1–E19. [Google Scholar] [CrossRef]
- Li, Z.; Yang, S.; He, B.; Hu, C. Intensified springtime deep convection over the South China Sea and the Philippine Sea Dries Southern China. Sci. Rep. 2016, 6, 30470. [Google Scholar] [CrossRef]
- Lu, J.; Vecchi, G.A.; Reichler, T. Expansion of the Hadley cell under global warming. Geophys. Res. Lett. 2007, 34, L06805. [Google Scholar]
- Cai, M.; Shin, C.S. A total flow perspective of atmospheric mass and angular momentum circulations: Boreal winter mean state. J. Atmos. Sci. 2014, 71, 2244–2263. [Google Scholar] [CrossRef]
- Schneider, E.K. Axially symmetric steady-state models of the basic state for instability and climate studies. Part II. Nonlinear calculations. J. Atmos. Sci. 1977, 34, 280–296. [Google Scholar] [CrossRef] [Green Version]
- Held, I.M.; Hou, A.Y. Nonlinear axially symmetric circulations in a nearly inviscid atmosphere. J. Atmos. Sci. 1980, 37, 515–533. [Google Scholar] [CrossRef] [Green Version]
- Held, I.M. The General Circulation of the Atmosphere: 2000 Program in Geophysical Fluid Dynamics; Woods Hole Oceanographic Institution: Falmouth, MA, USA, 2000; p. 66. [Google Scholar]
- Phillips, N.A. Energy transformations and meridional circulations associated with simple baroclinic waves in a two-level, quasi-geostrophic model. Tellus 1954, 6, 274–286. [Google Scholar] [CrossRef] [Green Version]
- Thuburn, J.; Craig, G.C. GCM tests of theories for the height of the tropopause. J. Atmos. Sci. 1997, 54, 869–882. [Google Scholar] [CrossRef]
- Santer, B.D.; Wehner, M.F.; Wigley, T.M.L.; Sausen, R.; Meehl, G.A.; Taylor, K.E.; Ammann, C.; Arblaster, J.; Washington, W.M.; Boyle, J.S.; et al. Contributions of anthropogenic and natural forcing to recent tropopause height changes. Science 2003, 301, 479–483. [Google Scholar] [CrossRef] [PubMed] [Green Version]
- Lorenz, D.J.; DeWeaver, E.T. Tropopause height and zonal wind response to global warming in the IPCC scenario integrations. J. Geophys. Res. Atmos. 2007, 112, D10119. [Google Scholar] [CrossRef] [Green Version]
- Korty, R.L.; Schneider, T. Extent of Hadley circulations in dry atmospheres. Geophys. Res. Lett. 2008, 35, L23803. [Google Scholar] [CrossRef] [Green Version]
- Schneider, T.; Walker, C.C. Self-organization of atmospheric macroturbulence into critical states of weak nonlinear eddy–eddy interactions. J. Atmos. Sci. 2006, 63, 1569–1586. [Google Scholar] [CrossRef] [Green Version]
- Yin, J.H. A consistent poleward shift of the storm tracks in simulations of 21st century climate. Geophys. Res. Lett. 2005, 32, L18701. [Google Scholar] [CrossRef] [Green Version]
- Sampe, T.; Nakamura, H.; Goto, A.; Ohfuchi, W. Significance of a midlatitude SST frontal zone in the formation of a storm track and an eddy-driven westerly jet. J. Clim. 2010, 23, 1793–1814. [Google Scholar] [CrossRef]
- Rivière, G. A dynamical interpretation of the poleward shift of the jet streams in global warming scenarios. J. Atmos. Sci. 2011, 68, 1253–1272. [Google Scholar] [CrossRef]
- Blackmon, M.L.; Wallace, J.M.; Lau, N.C.; Mullen, S.L. An observational study of the Northern Hemisphere wintertime circulation. J. Atmos. Sci. 1977, 34, 1040–1053. [Google Scholar] [CrossRef]
- Walker, C.C.; Schneider, T. Eddy influences on Hadley circulations: Simulations with an idealized GCM. J. Atmos. Sci. 2006, 63, 3333–3350. [Google Scholar] [CrossRef]
- Lu, J.; Chen, G.; Frierson, D.M.W. Response of the zonal mean atmospheric circulation to El Niño versus global warming. J. Clim. 2008, 21, 5835–5851. [Google Scholar] [CrossRef] [Green Version]
- Lindzen, R.S.; Farrell, B. The role of polar regions in global climate, and a new parameterization of global heat transport. Mon. Weather Rev. 1980, 108, 2064–2079. [Google Scholar] [CrossRef]
- Williams, G.P. Planetary circulations: II. The Jovian quasi-geostrophic regime. J. Atmos. Sci. 1979, 36, 932–968. [Google Scholar] [CrossRef] [Green Version]
- Panetta, R.L.; Held, I.M. Baroclinic eddy fluxes in a one-dimensional model of quasi-geostrophic turbulence. J. Atmos. Sci. 1988, 45, 3354–3365. [Google Scholar] [CrossRef] [Green Version]
- Lee, S. Maintenance of multiple jets in a baroclinic flow. J. Atmos. Sci. 1997, 54, 1726–1738. [Google Scholar] [CrossRef]
- Wittman, M.A.H.; Charlton, A.J.; Polvani, L.M. The effect of lower stratospheric shear on baroclinic instability. J. Atmos. Sci. 2007, 64, 479–496. [Google Scholar] [CrossRef]
- Lu, J.; Sun, L.; Wu, Y.; Chen, G. The role of subtropical irreversible PV mixing in the zonal mean circulation response to global warming–like thermal forcing. J. Clim. 2014, 27, 2297–2316. [Google Scholar] [CrossRef] [Green Version]
- Thorncroft, C.D.; Hoskins, B.J.; McIntyre, M.E. Two paradigms of baroclinic-wave life-cycle behaviour. Q. J. R. Meteorol. Soc. 1993, 119, 17–55. [Google Scholar] [CrossRef]
- Homeyer, C.R.; Bowman, K.P. Rossby wave breaking and transport between the tropics and extratropics above the subtropical jet. J. Atmos. Sci. 2013, 70, 607–626. [Google Scholar] [CrossRef]
- McLandress, C.; Shepherd, T.G.; Scinocca, J.F.; Plummer, D.A.; Sigmond, M.; Jonsson, A.I.; Reader, M.C. Separating the dynamical effects of climate change and ozone depletion. Part II: Southern Hemisphere troposphere. J. Clim. 2011, 24, 1850–1868. [Google Scholar] [CrossRef] [Green Version]
- Davis, N.; Birner, T. On the discrepancies in tropical belt expansion between reanalyses and climate models and among tropical belt width metrics. J. Clim. 2017, 30, 1211–1231. [Google Scholar] [CrossRef]
- Hu, Y.; Fu, Q. Observed poleward expansion of the Hadley circulation since 1979. Atmos. Chem. Phys. 2007, 7, 5229–5236. [Google Scholar] [CrossRef] [Green Version]
- Davis, N.; Birner, T. Climate model biases in the width of the tropical belt. J. Clim. 2016, 29, 1935–1954. [Google Scholar] [CrossRef]
- Choi, J.; Son, S.W.; Lu, J.; Min, S.K. Further observational evidence of Hadley cell widening in the Southern Hemisphere. Geophys. Res. Lett. 2014, 41, 2590–2597. [Google Scholar] [CrossRef]
- Davis, N.; Birner, T. Seasonal to multidecadal variability of the width of the tropical belt. J. Geophys. Res. Atmos. 2013, 118, 7773–7787. [Google Scholar] [CrossRef] [Green Version]
- Kang, S.M.; Polvani, L.M. The interannual relationship between the latitude of the eddy-driven jet and the edge of the Hadley cell. J. Clim. 2011, 24, 563–568. [Google Scholar] [CrossRef] [Green Version]
- Allen, R.J.; Norris, J.R.; Kovilakam, M. Influence of anthropogenic aerosols and the Pacific Decadal Oscillation on tropical belt width. Nat. Geosci. 2014, 7, 270–274. [Google Scholar] [CrossRef]
- Chemke, R.; Polvani, L.M. Exploiting the abrupt 4×CO2 scenario to elucidate tropical expansion mechanisms. J. Clim. 2019, 32, 859–875. [Google Scholar] [CrossRef] [Green Version]
- Davis, S.M.; Rosenlof, K.H. A multidiagnostic intercomparison of tropical width time series using reanalyses and satellite observations. J. Clim. 2012, 25, 1061–1078. [Google Scholar] [CrossRef]
- Waugh, D.W.; Grise, K.M.; Seviour, W.J.M.; Davis, S.M.; Davis, N.; Adam, O.; Son, S.W.; Simpson, I.R.; Staten, P.W.; Maycock, A.C.; et al. Revisiting the relationship among metrics of tropical expansion. J. Clim. 2018, 31, 7565–7581. [Google Scholar] [CrossRef]
- Shah, K.S.; Solomon, S.; Thompson, D.W.J.; Kinnison, D.E. Evaluating stratospheric tropical width using tracer concentrations. J. Geophys. Res. Atmos. 2020, 125, e2020JD033081. [Google Scholar] [CrossRef]
- Zhou, Y.P.; Xu, K.M.; Sud, Y.C.; Betts, A.K. Recent trends of the tropical hydrological cycle inferred from Global Precipitation Climatology Project and International Satellite Cloud Climatology Project data. J. Geophys. Res. Atmos. 2011, 116, D09101. [Google Scholar] [CrossRef] [Green Version]
- Staten, P.W.; Rutz, J.J.; Reichler, T.; Lu, J. Breaking down the tropospheric circulation response by forcing. Clim. Dyn. 2012, 39, 2361–2375. [Google Scholar] [CrossRef]
- Allen, R.J.; Sherwood, S.C.; Norris, J.R.; Zender, C.S. Recent Northern Hemisphere tropical expansion primarily driven by black carbon and tropospheric ozone. Nature 2012, 485, 350–354. [Google Scholar] [CrossRef]
- Solomon, A.; Polvani, L.M.; Waugh, D.W.; Davis, S.M. Contrasting upper and lower atmospheric metrics of tropical expansion in the Southern Hemisphere. Geophys. Res. Lett. 2016, 43, 10496–10503. [Google Scholar] [CrossRef] [Green Version]
- Mantsis, D.F.; Sherwood, S.; Allen, R.; Shi, L. Natural variations of tropical width and recent trends. Geophys. Res. Lett. 2017, 44, 3825–3832. [Google Scholar] [CrossRef]
- Johanson, C.M.; Fu, Q. Hadley cell widening: Model simulations versus observations. J. Clim. 2009, 22, 2713–2725. [Google Scholar] [CrossRef]
- Adam, O.; Grise, K.M.; Staten, P.; Simpson, I.R.; Davis, S.M.; Davis, N.A.; Waugh, D.W.; Birner, T.; Ming, A. The TropD software package (v1): Standardized methods for calculating tropical-width diagnostics. Geosci. Model Dev. 2018, 11, 4339–4357. [Google Scholar] [CrossRef] [Green Version]
- Koll, D.D.B.; Cronin, T.W. Earth’s outgoing longwave radiation linear due to H2O greenhouse effect. Proc. Natl. Acad. Sci. USA 2018, 115, 10293–10298. [Google Scholar] [CrossRef] [PubMed] [Green Version]
- World Meteorologcial Organization. Meteorology—A three-dimensional science: Second session of the commission for aerology. WMO Bull. 1957, 4, 134–138. [Google Scholar]
- Seidel, D.J.; Randel, W.J. Recent widening of the tropical belt: Evidence from tropopause observations. J. Geophys. Res. Atmos. 2007, 112, D20113. [Google Scholar] [CrossRef] [Green Version]
- Xian, T.; Homeyer, C.R. Global tropopause altitudes in radiosondes and reanalyses. Atmos. Chem. Phys. 2019, 19, 5661–5678. [Google Scholar] [CrossRef] [Green Version]
- Martin, E.R.; Homeyer, C.R.; McKinzie, R.A.; McCarthy, K.M.; Xian, T. Regionally varying assessments of upper–level tropical width in reanalyses and CMIP5 models using a tropopause break metric. J. Clim. 2020, 33, 5885–5903. [Google Scholar] [CrossRef] [Green Version]
- Lu, J.; Deser, C.; Reichler, T. Cause of the widening of the tropical belt since 1958. Geophys. Res. Lett. 2009, 36, L03803. [Google Scholar] [CrossRef] [Green Version]
- Fu, Q.; Lin, P. Poleward shift of subtropical jets inferred from satellite-observed lower-stratospheric temperatures. J. Clim. 2011, 24, 5597–5603. [Google Scholar] [CrossRef]
- Fu, Q.; Johanson, C.M.; Wallace, J.M.; Reichler, T. Enhanced mid-latitude tropospheric warming in satellite measurements. Science 2006, 312, 1179. [Google Scholar] [CrossRef] [PubMed]
- Hudson, R.D.; Andrade, M.F.; Follette, M.B.; Frolov, A.D. The total ozone field separated into meteorological regimes. Part II: Northern Hemisphere mid-latitude total ozone trends. Atmos. Chem. Phys. 2006, 6, 5183–5191. [Google Scholar] [CrossRef] [Green Version]
- Hudson, R.D.; Frolov, A.D.; Andrade, M.F.; Follette, M.B. The total ozone field separated into meteorological regimes. Part I: Defining the regimes. J. Atmos. Sci. 2003, 60, 1669–1677. [Google Scholar] [CrossRef]
- Sparling, L.C. Statistical perspectives on stratospheric transport. Rev. Geophys. 2000, 38, 417–436. [Google Scholar] [CrossRef]
- Neu, J.L.; Sparling, L.C.; Plumb, R.A. Variability of the subtropical “edges” in the stratosphere. J. Geophys. Res. Atmos. 2003, 108, 4482. [Google Scholar] [CrossRef] [Green Version]
- Pan, L.L.; Paulik, L.C.; Honomichl, S.B.; Munchak, L.A.; Bian, J.; Selkirk, H.B.; Vömel, H. Identification of the tropical tropopause transition layer using the ozone-water vapor relationship. J. Geophys. Res. Atmos. 2014, 119, 3586–3599. [Google Scholar] [CrossRef]
- Oort, A.H.; Yienger, J.J. Observed interannual variability in the Hadley circulation and its connection to ENSO. J. Clim. 1996, 9, 2751–2767. [Google Scholar] [CrossRef] [Green Version]
- Hu, Y.; Zhou, C.; Liu, J. Observational evidence for poleward expansion of the Hadley circulation. Adv. Atmos. Sci. 2011, 28, 33–44. [Google Scholar] [CrossRef]
- Fujiwara, M.; Wright, J.S.; Manney, G.L.; Gray, L.J.; Anstey, J.; Birner, T.; Davis, S.; Gerber, E.P.; Harvey, V.L.; Hegglin, M.I.; et al. Introduction to the SPARC Reanalysis Intercomparison Project (S-RIP) and overview of the reanalysis systems. Atmos. Chem. Phys. 2017, 17, 1417–1452. [Google Scholar] [CrossRef] [Green Version]
- Manney, G.L.; Hegglin, M.I.; Daffer, W.H.; Schwartz, M.J.; Santee, M.L.; Pawson, S. Climatology of upper tropospheric–lower dtratospheric (UTLS) jets and tropopauses in MERRA. J. Clim. 2014, 27, 3248–3271. [Google Scholar] [CrossRef]
- Lucas, C.; Nguyen, H.; Timbal, B. An observational analysis of Southern Hemisphere tropical expansion. J. Geophys. Res. Atmos. 2012, 117, D17112. [Google Scholar] [CrossRef] [Green Version]
- Mitas, C.M.; Clement, A. Has the Hadley cell been strengthening in recent decades? Geophys. Res. Lett. 2005, 32, L03809. [Google Scholar] [CrossRef] [Green Version]
- Song, H.; Zhang, M. Changes of the boreal winter Hadley circulation in the NCEP–NCAR and ECMWF reanalyses: A comparative study. J. Clim. 2007, 20, 5191–5200. [Google Scholar] [CrossRef]
- Stachnik, J.P.; Schumacher, C. A comparison of the Hadley circulation in modern reanalyses. J. Geophys. Res. Atmos. 2011, 116, D22102. [Google Scholar] [CrossRef] [Green Version]
- Nguyen, H.; Evans, A.; Lucas, C.; Smith, I.; Timbal, B. The Hadley circulation in reanalyses: Climatology, variability, and change. J. Clim. 2013, 26, 3357–3376. [Google Scholar] [CrossRef]
- Bengtsson, L.; Hagemann, S.; Hodges, K.I. Can climate trends be calculated from reanalysis data? J. Geophys. Res. Atmos. 2004, 109, D11111. [Google Scholar] [CrossRef] [Green Version]
- Frierson, D.M.W.; Lu, J.; Chen, G. Width of the Hadley cell in simple and comprehensive general circulation models. Geophys. Res. Lett. 2007, 34, L18804. [Google Scholar] [CrossRef] [Green Version]
- Hu, Y.; Tao, L.; Liu, J. Poleward expansion of the Hadley circulation in CMIP5 simulations. Adv. Atmos. Sci. 2013, 30, 790–795. [Google Scholar] [CrossRef]
- Archer, C.L.; Caldeira, K. Historical trends in the jet streams. Geophys. Res. Lett. 2008, 35, L08803. [Google Scholar] [CrossRef]
- Hudson, R.D. Measurements of the movement of the jet streams at mid-latitudes, in the Northern and Southern Hemispheres, 1979 to 2010. Atmos. Chem. Phys. 2012, 12, 7797–7808. [Google Scholar] [CrossRef] [Green Version]
- Son, S.W.; Tandon, N.F.; Polvani, L.M.; Waugh, D.W. Ozone hole and Southern Hemisphere climate change. Geophys. Res. Lett. 2009, 36, L15705. [Google Scholar] [CrossRef] [Green Version]
- Son, S.W.; Gerber, E.P.; Perlwitz, J.; Polvani, L.M.; Gillett, N.P.; Seo, K.H.; Eyring, V.; Shepherd, T.G.; Waugh, D.; Akiyoshi, H.; et al. Impact of stratospheric ozone on Southern Hemisphere circulation change: A multimodel assessment. J. Geophys. Res. Atmos. 2010, 115, D00M07. [Google Scholar] [CrossRef] [Green Version]
- Min, S.K.; Son, S.W. Multimodel attribution of the Southern Hemisphere Hadley cell widening: Major role of ozone depletion. J. Geophys. Res. Atmos. 2013, 118, 3007–3015. [Google Scholar] [CrossRef]
- Garfinkel, C.I.; Waugh, D.W.; Polvani, L.M. Recent Hadley cell expansion: The role of internal atmospheric variability in reconciling modeled and observed trends. Geophys. Res. Lett. 2015, 42, 10824–10831. [Google Scholar] [CrossRef]
- Tao, L.; Hu, Y.; Liu, J. Anthropogenic forcing on the Hadley circulation in CMIP5 simulations. Clim. Dyn. 2016, 46, 3337–3350. [Google Scholar] [CrossRef]
- Allen, R.J.; Kovilakam, M. The role of natural climate variability in recent tropical expansion. J. Clim. 2017, 30, 6329–6350. [Google Scholar] [CrossRef]
- Grise, K.M.; Davis, S.M.; Simpson, I.R.; Waugh, D.W.; Fu, Q.; Allen, R.J.; Rosenlof, K.H.; Ummenhofer, C.C.; Karnauskas, K.B.; Maycock, A.C.; et al. Recent tropical expansion: Natural variability or forced response? J. Clim. 2019, 32, 1551–1571. [Google Scholar] [CrossRef]
- Watt-Meyer, O.; Frierson, D.M.W.; Fu, Q. Hemispheric asymmetry of tropical expansion under CO2 forcing. Geophys. Res. Lett. 2019, 46, 9231–9240. [Google Scholar] [CrossRef] [Green Version]
- Birner, T. Recent widening of the tropical belt from global tropopause statistics: Sensitivities. J. Geophys. Res. Atmos. 2010, 115, D23109. [Google Scholar] [CrossRef] [Green Version]
- Wilhelmsen, H.; Ladstädter, F.; Schmidt, T.; Steiner, A.K. Double tropopauses and the tropical belt connected to ENSO. Geophys. Res. Lett. 2020, 47, e2020GL089027. [Google Scholar] [CrossRef] [PubMed]
- Grise, K.M.; Polvani, L.M. Understanding the time scales of the tropospheric circulation response to abrupt CO2 forcing in the Southern Hemisphere: Seasonality and the role of the stratosphere. J. Clim. 2017, 30, 8497–8515. [Google Scholar] [CrossRef]
- Seviour, W.J.M.; Davis, S.M.; Grise, K.M.; Waugh, D.W. Large uncertainty in the relative rates of dynamical and hydrological tropical expansion. Geophys. Res. Lett. 2018, 45, 1106–1113. [Google Scholar] [CrossRef] [Green Version]
- Strong, C.; Davis, R.E. Winter jet stream trends over the Northern Hemisphere. Q. J. R. Meteorol. Soc. 2007, 133, 2109–2115. [Google Scholar] [CrossRef]
- Seo, K.H.; Frierson, D.M.W.; Son, J.H. A mechanism for future changes in Hadley circulation strength in CMIP5 climate change simulations. Geophys. Res. Lett. 2014, 41, 5251–5258. [Google Scholar] [CrossRef]
- Lau, W.K.M.; Kim, K.M. Robust Hadley circulation changes and increasing global dryness due to CO2 warming from CMIP5 model projections. Proc. Natl. Acad. Sci. USA 2015, 112, 3630–3635. [Google Scholar] [CrossRef] [Green Version]
- Lucas, C.; Timbal, B.; Nguyen, H. The expanding tropics: A critical assessment of the observational and modeling studies. WIREs Clim. Chang. 2014, 5, 89–112. [Google Scholar] [CrossRef]
- Boothe, A.C.; Homeyer, C.R. Global large-scale stratosphere-troposphere exchange in modern reanalyses. Atmos. Chem. Phys. 2017, 17, 5537–5559. [Google Scholar] [CrossRef] [Green Version]
- Arblaster, J.M.; Meehl, G.A.; Karoly, D.J. Future climate change in the Southern Hemisphere: Competing effects of ozone and greenhouse gases. Geophys. Res. Lett. 2011, 38, L02701. [Google Scholar] [CrossRef]
- Knutson, T.R.; Manabe, S. Time-mean response over the tropical Pacific to increased CO2 in a coupled ocean-atmosphere model. J. Clim. 1995, 8, 2181–2199. [Google Scholar] [CrossRef] [Green Version]
- Kang, S.M.; Polvani, L.M.; Fyfe, J.C.; Sigmond, M. Impact of polar ozone depletion on subtropical precipitation. Science 2011, 332, 951–954. [Google Scholar] [CrossRef] [Green Version]
- Ma, J.; Xie, S.P.; Kosaka, Y. Mechanisms for tropical tropospheric circulation change in response to global warming. J. Clim. 2012, 25, 2979–2994. [Google Scholar] [CrossRef]
- Xia, Y.; Hu, Y.; Liu, J. Comparison of trends in the Hadley circulation between CMIP6 and CMIP5. Sci. Bull. 2020, 65, 1667–1674. [Google Scholar] [CrossRef]
- Diffenbaugh, N.S.; Field, C.B. Changes in ecologically critical terrestrial climate conditions. Science 2013, 341, 486–492. [Google Scholar] [CrossRef] [Green Version]
- Otto-Bliesner, B.L.; Clement, A. The sensitivity of the Hadley circulation to past and future forcings in two climate models. In The Hadley Circulation: Present, Past and Future; Diaz, H.F., Bradley, R.S., Eds.; Springer: Dordrecht, The Netherlands, 2004; pp. 437–464. [Google Scholar]
- Amaya, D.J.; Siler, N.; Xie, S.P.; Miller, A.J. The interplay of internal and forced modes of Hadley Cell expansion: Lessons from the global warming hiatus. Clim. Dyn. 2018, 51, 305–319. [Google Scholar] [CrossRef]
- Grise, K.M.; Davis, S.M.; Staten, P.W.; Adam, O. Regional and seasonal characteristics of the recent expansion of the tropics. J. Clim. 2018, 31, 6839–6856. [Google Scholar] [CrossRef]
- Simpson, I.R.; Shaw, T.A.; Seager, R. A diagnosis of the seasonally and longitudinally varying midlatitude circulation response to global warming. J. Atmos. Sci. 2014, 71, 2489–2515. [Google Scholar] [CrossRef]
- Xian, T.; Fu, Y. A hiatus in the tropopause layer change. Int. J. Climatol. 2017, 37, 4972–4980. [Google Scholar] [CrossRef]
- Wu, Y.; Seager, R.; Ting, M.; Naik, N.; Shaw, T.A. Atmospheric circulation response to an instantaneous doubling of carbon dioxide. Part I: Model experiments and transient thermal response in the troposphere. J. Clim. 2012, 25, 2862–2879. [Google Scholar] [CrossRef] [Green Version]
- Quan, X.W.; Hoerling, M.P.; Perlwitz, J.; Diaz, H.F.; Xu, T. How fast are the tropics expanding? J. Clim. 2014, 27, 1999–2013. [Google Scholar] [CrossRef]
- Seager, R.; Naik, N.; Vecchi, G.A. Thermodynamic and dynamic mechanisms for large-scale changes in the hydrological cycle in tesponse to global warming. J. Clim. 2010, 23, 4651–4668. [Google Scholar] [CrossRef] [Green Version]
- Bony, S.; Bellon, G.; Klocke, D.; Sherwood, S.; Fermepin, S.; Denvil, S. Robust direct effect of carbon dioxide on tropical circulation and regional precipitation. Nat. Geosci. 2013, 6, 447–451. [Google Scholar] [CrossRef] [Green Version]
- Allen, R.J.; Ajoku, O. Future aerosol reductions and widening of the northern tropical belt. J. Geophys. Res. Atmos. 2016, 121, 6765–6786. [Google Scholar] [CrossRef] [Green Version]
- Polvani, L.M.; Waugh, D.W.; Correa, G.J.P.; Son, S.W. Stratospheric ozone depletion: The main driver of twentieth-century atmospheric circulation changes in the Southern Hemisphere. J. Clim. 2011, 24, 795–812. [Google Scholar] [CrossRef]
- Polvani, L.M.; Previdi, M.; Deser, C. Large cancellation, due to ozone recovery, of future Southern Hemisphere atmospheric circulation trends. Geophys. Res. Lett. 2011, 38, L04707. [Google Scholar] [CrossRef] [Green Version]
- Son, S.W.; Kim, S.Y.; Min, S.K. Widening of the Hadley cell from last glacial maximum to future climate. J. Clim. 2018, 31, 267–281. [Google Scholar] [CrossRef]
- Zhou, W.; Xie, S.P.; Yang, D. Enhanced equatorial warming causes deep-tropical contraction and subtropical monsoon shift. Nat. Clim. Chang. 2019, 9, 834–839. [Google Scholar] [CrossRef]
- Zhou, C.; Lu, J.; Hu, Y.; Zelinka, M.D. Responses of the Hadley circulation to regional sea surface temperature changes. J. Clim. 2020, 33, 429–441. [Google Scholar] [CrossRef]
- Wilcox, L.J.; Hoskins, B.J.; Shine, K.P. A global blended tropopause based on ERA data. Part II: Trends and tropical broadening. Q. J. R. Meteorol. Soc. 2012, 138, 576–584. [Google Scholar] [CrossRef] [Green Version]
- Grassi, B.; Redaelli, G.; Canziani, P.O.; Visconti, G. Effects of the PDO phase on the tropical belt width. J. Clim. 2012, 25, 3282–3290. [Google Scholar] [CrossRef]
- Staten, P.W.; Lu, J.; Grise, K.M.; Davis, S.M.; Birner, T. Re-examining tropical expansion. Nat. Clim. Chang. 2018, 8, 768–775. [Google Scholar] [CrossRef]
- Zhu, Y.; Wang, H.; Ma, J.; Wang, T.; Sun, J. Contribution of the phase transition of Pacific Decadal Oscillation to the late 1990s’ shift in East China summer rainfall. J. Geophys. Res. Atmos. 2015, 120, 8817–8827. [Google Scholar] [CrossRef] [Green Version]
- Zeng, Z.; Ziegler, A.D.; Searchinger, T.; Yang, L.; Chen, A.; Ju, K.; Piao, S.; Li, L.Z.X.; Ciais, P.; Chen, D.; et al. A reversal in global terrestrial stilling and its implications for wind energy production. Nat. Clim. Chang. 2019, 9, 979–985. [Google Scholar] [CrossRef]
- Emile-Geay, J.; Seager, R.; Cane, M.A.; Cook, E.R.; Haug, G.H. Volcanoes and ENSO over the past millennium. Clim. Dyn. 2008, 21, 3134–3148. [Google Scholar] [CrossRef]
- Vallis, G.K.; Zurita-Gotor, P.; Cairns, C.; Kidston, J. Response of the large-scale structure of the atmosphere to global warming. Q. J. R. Meteorol. Soc. 2015, 141, 1479–1501. [Google Scholar] [CrossRef] [Green Version]
- Deser, C.; Phillips, A.S. Atmospheric circulation trends, 1950–2000: The relative roles of sea surface temperature forcing and direct atmospheric radiative forcing. J. Clim. 2009, 22, 396–413. [Google Scholar] [CrossRef] [Green Version]
- Grise, K.M.; Davis, S.M. Hadley cell expansion in CMIP6 models. Atmos. Chem. Phys. 2020, 20, 5249–5268. [Google Scholar] [CrossRef]
- Charlson, R.J.; Schwartz, S.E.; Hales, J.M.; Cess, R.D.; Coakley, J.A.J.; Hansen, J.E.; Hofmann, D.J. Climate forcing by anthropogenic aerosols. Science 1992, 255, 423–430. [Google Scholar] [CrossRef] [PubMed]
- Hansen, J.; Sato, M.; Ruedy, R.; Lacis, A.; Oinas, V. Global warming in the twenty-first century: An alternative scenario. Proc. Natl. Acad. Sci. USA 2000, 97, 9875–9880. [Google Scholar] [CrossRef] [PubMed] [Green Version]
- Penner, J.E.; Dong, X.; Chen, Y. Observational evidence of a change in radiative forcing due to the indirect aerosol effect. Nature 2004, 427, 231–234. [Google Scholar] [CrossRef]
- Bellouin, N.; Boucher, O.; Haywood, J.; Reddy, M.S. Global estimate of aerosol direct radiative forcing from satellite measurements. Nature 2005, 438, 1138–1141. [Google Scholar] [CrossRef]
- Bollasina, M.A.; Ming, Y.; Ramaswamy, V. Anthropogenic aerosols and the weakening of the South Asian summer monsoon. Science 2011, 334, 502–505. [Google Scholar] [CrossRef] [Green Version]
- Menon, S.; Hansen, J.; Nazarenko, L.; Luo, Y. Climate effects of black carbon aerosols in China and India. Science 2002, 297, 2250–2253. [Google Scholar] [CrossRef] [Green Version]
- Wang, C. Impact of direct radiative forcing of black carbon aerosols on tropical convective precipitation. Geophys. Res. Lett. 2007, 34, L05709. [Google Scholar] [CrossRef] [Green Version]
- Ming, Y.; Ramaswamy, V. A model investigation of aerosol-induced changes in tropical circulation. J. Clim. 2011, 24, 5125–5133. [Google Scholar] [CrossRef]
- Tosca, M.G.; Randerson, J.T.; Zender, C.S. Global impact of smoke aerosols from landscape fires on climate and the Hadley circulation. Atmos. Chem. Phys. 2013, 13, 5227–5241. [Google Scholar] [CrossRef] [Green Version]
- Ming, Y.; Ramaswamy, V.; Chen, G. A model investigation of aerosol-induced changes in boreal winter extratropical circulation. J. Clim. 2011, 24, 6077–6091. [Google Scholar] [CrossRef]
- Wang, Y.; Jiang, J.H.; Su, H. Atmospheric responses to the redistribution of anthropogenic aerosols. J. Geophys. Res. Atmos. 2015, 120, 9625–9641. [Google Scholar] [CrossRef]
- Rotstayn, L.D.; Collier, M.A.; Jeffrey, S.J.; Kidston, J.; Syktus, J.I.; Wong, K.K. Anthropogenic effects on the subtropical jet in the Southern Hemisphere: Aerosols versus long-lived greenhouse gases. Environ. Res. Lett. 2013, 8, 014030. [Google Scholar] [CrossRef]
- Xie, S.P.; Lu, B.; Xiang, B. Similar spatial patterns of climate responses to aerosol and greenhouse gas changes. Nat. Geosci. 2013, 6, 828–832. [Google Scholar] [CrossRef]
- Charney, J.; Arakawa, A.; Baker, D.; Bolin, B.; Dickinson, R.; Goody, R.; Leith, C.; Stommel, H.; Wunsch, C. Carbon Dioxide and Climate: A Scientific Assessment; The National Academies Press: Washington, DC, USA, 1979; p. 34. [Google Scholar]
- Kim, H.K.; Lee, S. Hadley cell dynamics in a primitive equation model. Part I: Axisymmetric flow. Geophys. Res. Lett. 2001, 58, 2845–2858. [Google Scholar] [CrossRef] [Green Version]
- Dima, I.M.; Wallace, J.M. On the seasonality of the Hadley Cell. J. Atmos. Sci. 2003, 60, 1522–1527. [Google Scholar] [CrossRef]
- Fang, M.; Kit Tung, K. Time-dependent nonlinear Hadley circulation. J. Atmos. Sci. 1999, 56, 1797–1807. [Google Scholar] [CrossRef]
- Levine, X.J.; Schneider, T. Baroclinic eddies and the extent of the Hadley circulation: An idealized GCM study. J. Atmos. Sci. 2015, 72, 2744–2761. [Google Scholar] [CrossRef] [Green Version]
- Butler, A.H.; Thompson, D.W.J.; Heikes, R. The steady-state atmospheric circulation response to climate change–like thermal forcings in a simple general circulation model. J. Clim. 2010, 23, 3474–3496. [Google Scholar] [CrossRef]
- Haigh, J.D.; Blackburn, M.; Day, R. The response of tropospheric circulation to perturbations in lower-stratospheric temperature. J. Clim. 2005, 18, 3672–3685. [Google Scholar] [CrossRef]
- Williams, G.P. Circulation sensitivity to tropopause height. J. Atmos. Sci. 2006, 63, 1954–1961. [Google Scholar] [CrossRef]
- Chen, G.; Lu, J.; Frierson, D.M.W. Phase speed spectra and the latitude of surface westerlies: Interannual variability and global warming trend. J. Clim. 2008, 21, 5942–5959. [Google Scholar] [CrossRef]
- Ceppi, P.; Hartmann, D.L. On the speed of the eddy-driven jet and the width of the Hadley cell in the Southern Hemisphere. J. Clim. 2013, 26, 3450–3465. [Google Scholar] [CrossRef] [Green Version]
- Tandon, N.F.; Gerber, E.P.; Sobel, A.H.; Polvani, L.M. Understanding Hadley cell expansion versus contraction: Insights from simplified models and implications for recent observations. J. Clim. 2013, 26, 4304–4321. [Google Scholar] [CrossRef]
- Wu, Y.; Seager, R.; Shaw, T.A.; Ting, M.; Naik, N. Atmospheric circulation response to an instantaneous doubling of carbon dioxide. Part II: Atmospheric transient adjustment and its dynamics. J. Clim. 2013, 26, 918–935. [Google Scholar] [CrossRef]
- Staten, P.W.; Reichler, T.; Lu, J. The transient circulation response to radiative forcings and sea surface warming. J. Clim. 2014, 27, 9323–9336. [Google Scholar] [CrossRef] [Green Version]
- Allen, R.J.; Sherwood, S.C.; Norris, J.R.; Zender, C.S. The equilibrium response to idealized thermal forcings in a comprehensive GCM: Implications for recent tropical expansion. Atmos. Chem. Phys. 2012, 12, 4795–4816. [Google Scholar] [CrossRef] [Green Version]
- Seager, R.; Harnik, N.; Kushnir, Y.; Robinson, W.; Miller, J. Mechanisms of hemispherically symmetric climate variability. J. Clim. 2003, 16, 2960–2978. [Google Scholar] [CrossRef]
- Butler, A.H.; Thompson, D.W.J.; Birner, T. Isentropic slopes, downgradient eddy fluxes, and the extratropical atmospheric circulation response to tropical tropospheric heating. J. Atmos. Sci. 2011, 68, 2292–2305. [Google Scholar] [CrossRef] [Green Version]
- Vallis, G.K. Atmospheric and Oceanic Fluid Dynamics: Fundamentals and Large-Scale Circulation, 2th ed.; Cambridge University Press: Cambridge, UK, 2017; p. 946. [Google Scholar]
- Shaw, T.A.; Tan, Z. Testing latitudinally dependent explanations of the circulation response to increased CO2 using aquaplanet models. Geophys. Res. Lett. 2018, 45, 9861–9869. [Google Scholar] [CrossRef]
- Waugh, D.W.; Garfinkel, C.I.; Polvani, L.M. Drivers of the recent tropical expansion in the Southern Hemisphere: Changing SSTs or ozone depletion? J. Clim. 2015, 28, 6581–6586. [Google Scholar] [CrossRef]
- Ma, J.; Chadwick, R.; Seo, K.H.; Dong, C.; Huang, G.; Foltz, G.R.; Jiang, J.H. Responses of the tropical atmospheric circulation to climate change and connection to the hydrological cycle. Annu. Rev. Earth Planet Sci. 2018, 46, 549–580. [Google Scholar] [CrossRef] [Green Version]
- Kidston, J.; Dean, S.M.; Renwick, J.A.; Vallis, G.K. A robust increase in the eddy length scale in the simulation of future climates: An increase in the eddy length scale. Geophys. Res. Lett. 2010, 37, L03806. [Google Scholar] [CrossRef] [Green Version]
- McCabe, G.J.; Clark, M.P.; Serreze, M.C. Trends in Northern Hemisphere surface cyclone frequency and intensity. J. Clim. 2001, 14, 2763–2768. [Google Scholar] [CrossRef]
- Fyfe, J.C. Extratropical Southern Hemisphere cyclones: Harbingers of climate change? J. Clim. 2003, 16, 2802–2805. [Google Scholar] [CrossRef]
- Eichler, T.P. The impacts of a warming climate on winter mid-latitude cyclones in the NARCCAP model suite. Clim. Dyn. 2020, 54, 4379–4398. [Google Scholar] [CrossRef]
- Seidel, D.J.; Fu, Q.; Randel, W.J.; Reichler, T.J. Widening of the tropical belt in a changing climate. Nat. Geosci. 2008, 1, 21–24. [Google Scholar] [CrossRef]
- Scheff, J.; Frierson, D.M.W. Robust future precipitation declines in CMIP5 largely reflect the poleward expansion of model subtropical dry zones. Geophys. Res. Lett. 2012, 39, L18704. [Google Scholar] [CrossRef] [Green Version]
- Ha, K.J.; Moon, S.; Timmermann, A.; Kim, D. Future changes of summer monsoon characteristics and evaporative demand over Asia in CMIP6 simulations. Geophys. Res. Lett. 2020, 47, e2020GL087492. [Google Scholar] [CrossRef] [Green Version]
- Held, I.M.; Soden, B.J. Robust responses of the hydrological cycle to global warming. J. Clim. 2006, 19, 5686–5699. [Google Scholar] [CrossRef]
- Chadwick, R.; Boutle, I.; Martin, G. Spatial patterns of precipitation change in CMIP5: Why the rich do not get richer in the tropics. J. Clim. 2013, 26, 3803–3822. [Google Scholar] [CrossRef]
- Su, H.; Jiang, J.H.; Zhai, C.; Shen, T.J.; Neelin, J.D.; Stephens, G.L.; Yung, Y.L. Weakening and strengthening structures in the Hadley circulation change under global warming and implications for cloud response and climate sensitivity. J. Geophys. Res. Atmos. 2014, 119, 5787–5805. [Google Scholar] [CrossRef] [Green Version]
- Ryoo, J.M.; Kaspi, Y.; Waugh, D.W.; Kiladis, G.N.; Waliser, D.E.; Fetzer, E.J.; Kim, J. Impact of Rossby wave breaking on US west coast winter precipitation during ENSO events. J. Clim. 2013, 26, 6360–6382. [Google Scholar] [CrossRef] [Green Version]
- Hagos, S.; Leung, L.R.; Yang, Q.; Zhao, C.; Lu, J. Resolution and dynamical core dependence of atmospheric river frequency in global model simulations. J. Clim. 2015, 28, 2764–2776. [Google Scholar] [CrossRef]
- Deng, K.; Azorin-Molina, C.; Minola, L.; Zhang, G.; Chen, D. Global near-surface wind speed changes over the last decades revealed by reanalyses and CMIP6 model simulations. J. Clim. 2021, 34, 2219–2234. [Google Scholar] [CrossRef]
- Kossin, J.P.; Emanuel, K.A.; Vecchi, G.A. The poleward migration of the location of tropical cyclone maximum intensity. Nature 2014, 509, 349–352. [Google Scholar] [CrossRef] [PubMed] [Green Version]
- Studholme, J.; Gulev, S. Concurrent changes to Hadley circulation and the meridional distribution of tropical cyclones. J. Clim. 2018, 31, 4367–4389. [Google Scholar] [CrossRef] [Green Version]
- Sharmila, S.; Walsh, K.J.E. Recent poleward shift of tropical cyclone formation linked to Hadley cell expansion. Nat. Clim. Chang. 2018, 8, 730–736. [Google Scholar] [CrossRef]
- Song, J.; Klotzbach, P.J. What has controlled the poleward migration of annual averaged location of tropical cyclone lifetime maximum intensity over the western North Pacific since 1961? Geophys. Res. Lett. 2018, 45, 1148–1156. [Google Scholar] [CrossRef]
- Widlansky, M.J.; Annamalai, H.; Gingerich, S.B.; Storlazzi, C.D.; Marra, J.J.; Hodges, K.I.; Choy, B.; Kitoh, A. Tropical cyclone projections: Changing climate threats for Pacific Island defense installations. Geophys. Res. Lett. 2019, 11, 3–15. [Google Scholar] [CrossRef] [Green Version]
- Lau, W.K.M.; Kim, K.M.; Chern, J.D.; Tao, W.K.; Leung, L.R. Structural changes and variability of the ITCZ induced by radiation–cloud–convection–circulation interactions: Inferences from the Goddard Multi-Scale Modeling Framework (GMMF) experiments. Clim. Dyn. 2020, 54, 211–229. [Google Scholar] [CrossRef] [Green Version]
- Wallace, J.M.; Hobbs, P.V. Atmospheric Science: An Introductory Survey; Academic Press: New York, NY, USA, 1977; p. 467. [Google Scholar]
Figure 1.
Schematic representation of commonly used zonal mean Hadley Cell edge metrics, and the fields from which they are derived, as a function of latitude (and pressure in the upper two panels). The top panel shows the chemical metrics according to different chemical metrics, with PDF as orange cross, GWL in magenta diamond, and as blue circle. The middle panel depicts the Hadley circulation (red shading, positive streamfunction), the Ferrel Cell (blue shading, negative streamfunction), zonal mean zonal winds (black contours with the interval of 10 m s; the thick line is the zero isotach), and the lapse-rate tropopause (purple dotted line). TPB (the latitude of tropopause breaks, purple circle), STJ (the latitude of subtropical jet, black circle), (the latitude of zero zonal mean surface wind, black asterisk), EDJ (the latitude of eddy-driven jet, blue asterisk), (the latitude of zero meridional mass function at 500 hPa, orange closed diamond), (the latitude of maximum eddy momentum flux, magenta open diamond). The bottom panel depicts the zonal mean outgoing longwave radiation (OLR, red curve), precipitation minus evaporation (, blue curve), and sea level pressure (SLP, light blue curve). The blue, light blue, and red open circles respectively represent the latitude where , latitude of SLP, and latitude where OLR = 250 W m. The latitude where zonal mean OLR drops 20 W m on the poleward side of its subtropical maximum. This figure is redrawn in accordance with Figure 1 in Davis and Rosenlof [40] and Figure 1 in Waugh et al. [41] with the permission of © American Meteorological Society., and Figure 3 in Shah et al. [42] with the permission of © WILEY.

Figure 2.
Hadley Cell expansion rate for Southern and Northern Hemispheres in previous studies. The negative values indicate a southward shift of the Hadley Cell edge, while those positive ones indicate a northward shift. The dots represent observations and the triangles are reanalyses. The annual (red) and seasonal values are represented by different colors (MAM in black: March-April-May, JJA in purple: June-July-August, and SON in green: September-October-November, and DJF in blue: December-January-February).

Figure 3.
The historical Hadley Cell expansion rates for annual mean scale under different forcings in previous studies, with negative values indicating a southward shift of the Hadley Cell edge and positive ones indicating a northward shift. The red and blue arrows represent Hadley Cell expanding and narrowing, respectively. The forcing “All” means all forcings, “-BC-O” represents all forcings excluding black carbon (BC) and tropospheric ozone (O), “Anthro.” means anthropogentic aerosols, “Rad.” represents radiactive forcing from both natural and anthropogenic aerosols, “OC” means organic carbon, and “ODS” represents ozone-depleting substances.

Figure 4.
The future Hadley Cell expansion rates under different forcings in previous studies. The red and blue arrows represent Hadley Cell expanding and narrowing, respectively. The “n” in the “nCO” (“nSST” ) ranging from 1 to 3 means that CO (SST) is set at present-day, 2050, and 2100 levels, respectively. The “O” means recovered stratospheric ozone. The “RCP8.5” represents the top-of-atmosphere radiative forcing gradually increasing to 8.5 W m by 2100.

Figure 5.
Trends of the during 1979–2020 for ERA5 reanalysis. Colored areas of the reanalysis maps are statistically significant at the 99% confidence level, while line-filled regions are not.
Figure 5.
Trends of the during 1979–2020 for ERA5 reanalysis. Colored areas of the reanalysis maps are statistically significant at the 99% confidence level, while line-filled regions are not.

Figure 6.
Schematic representation of Hadley Cell expansion mechanisms and impacts mentioned in this paper.
Figure 6.
Schematic representation of Hadley Cell expansion mechanisms and impacts mentioned in this paper.


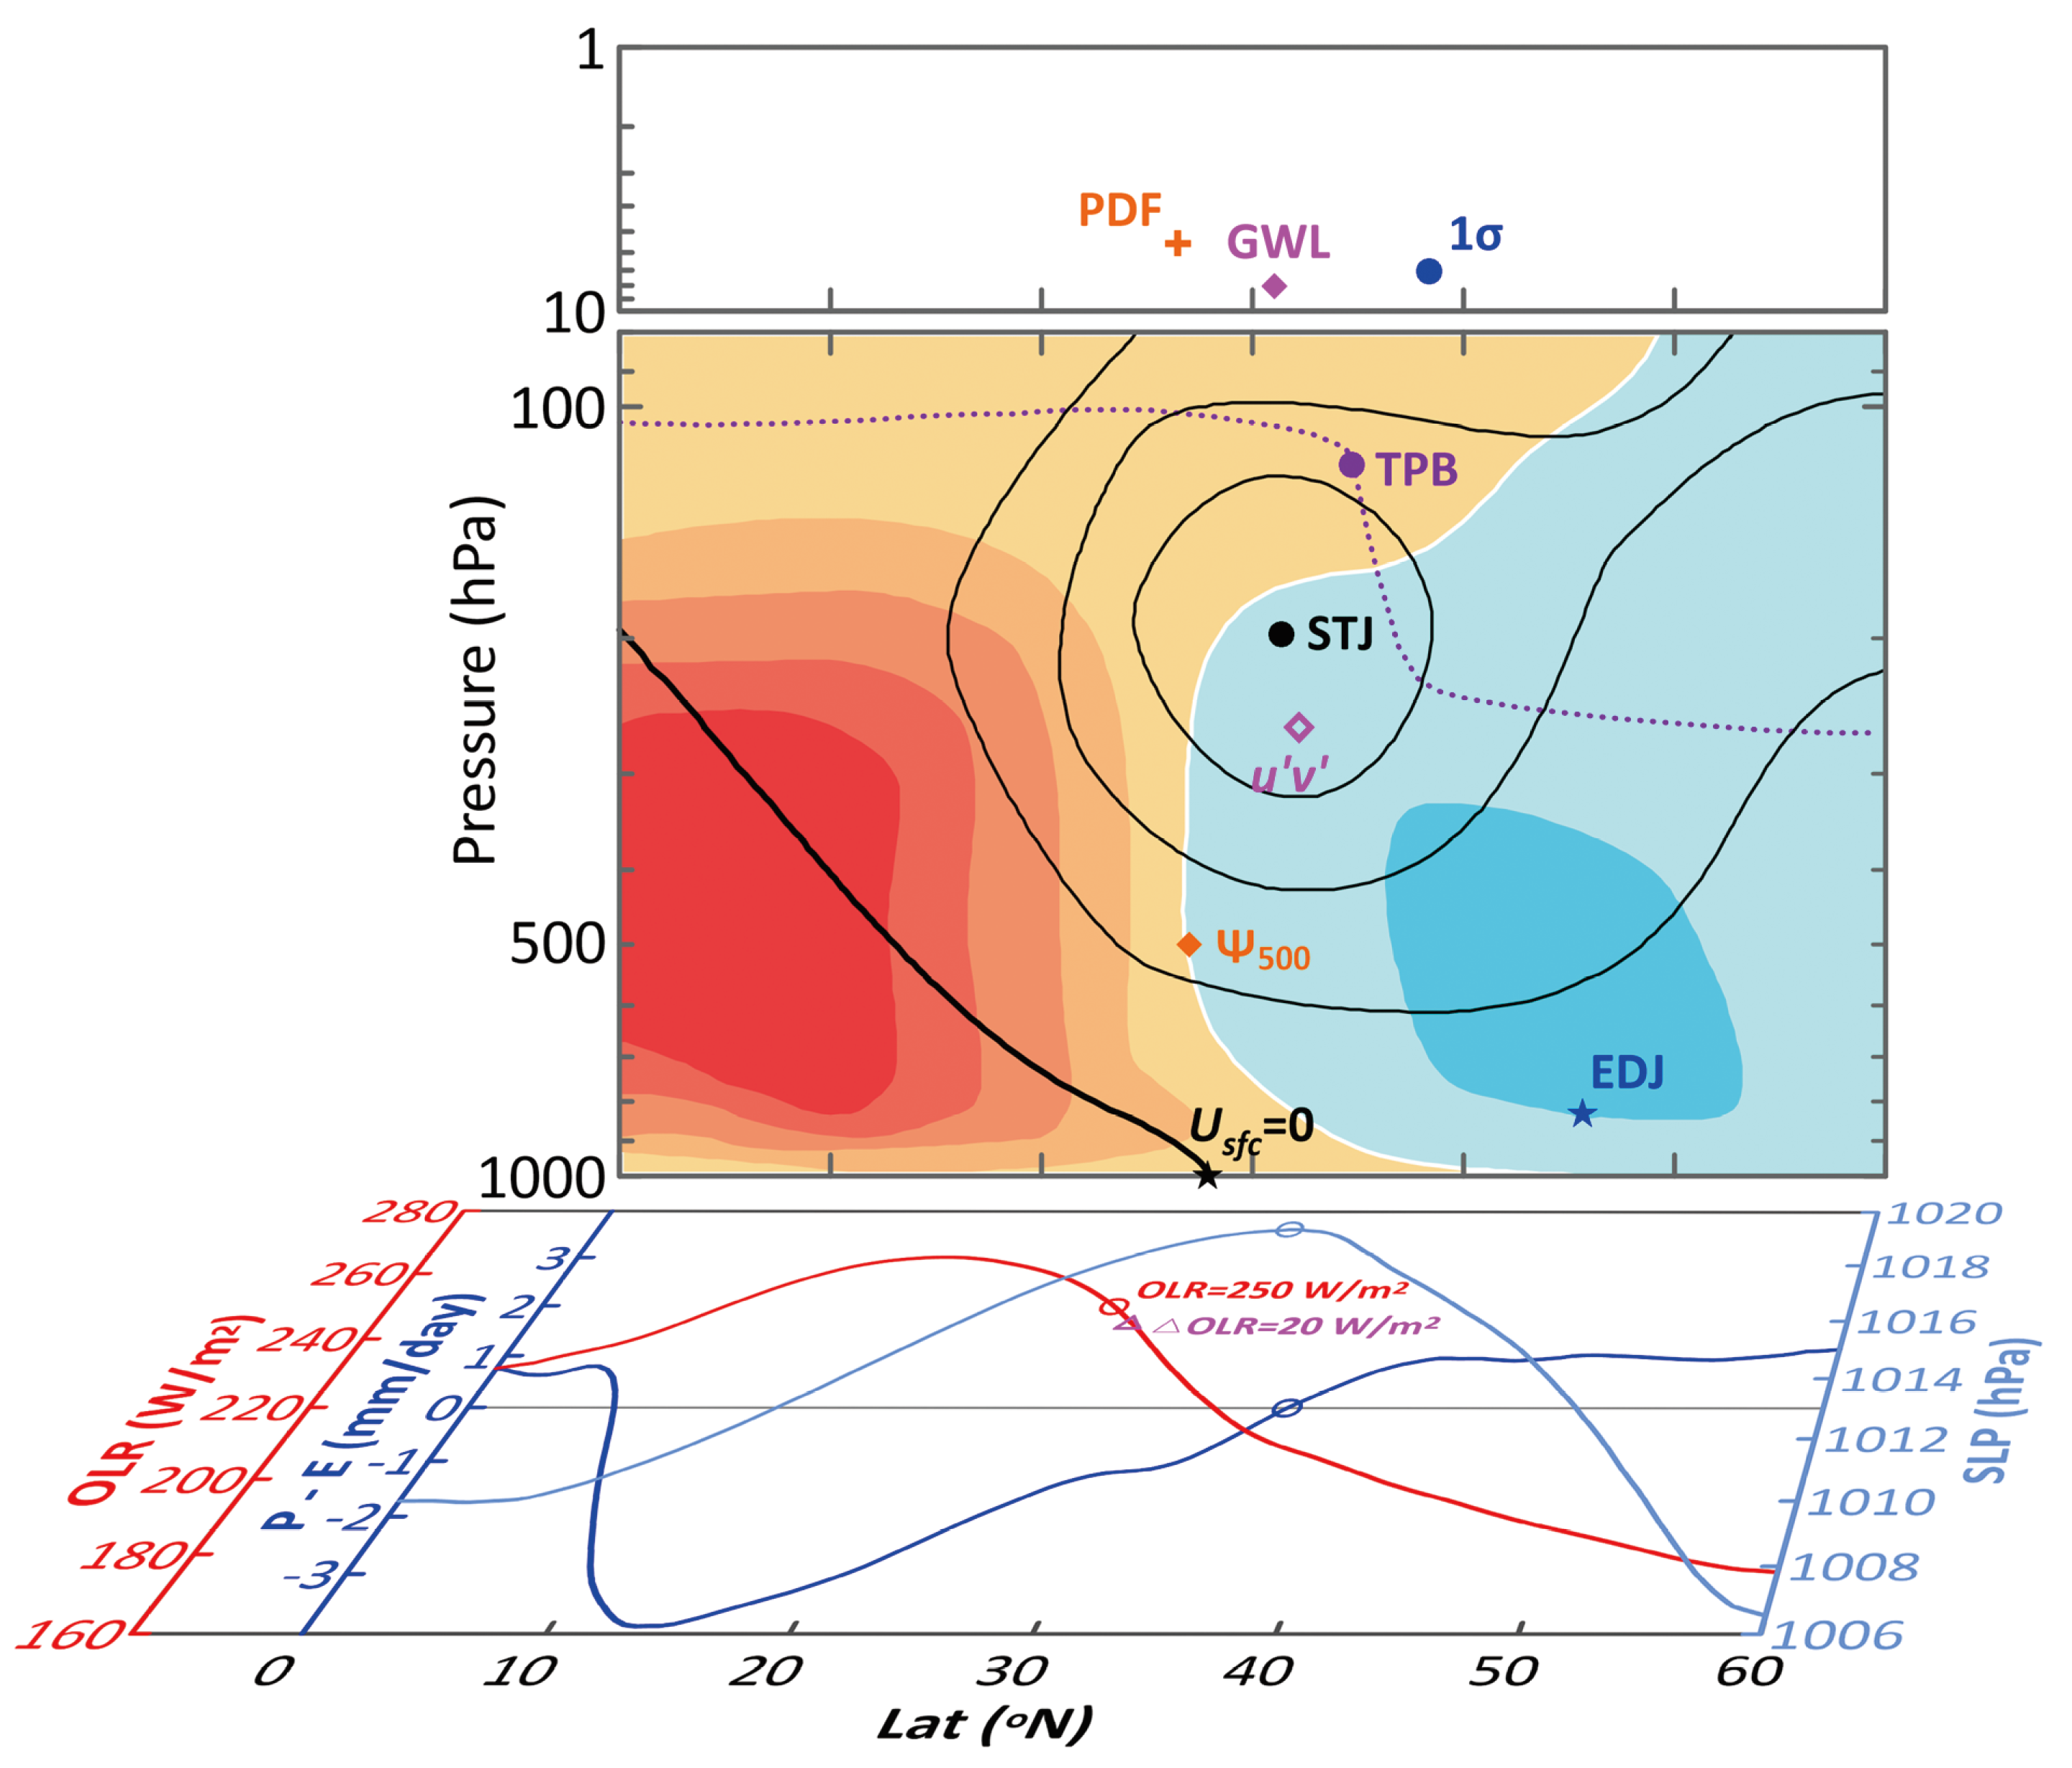
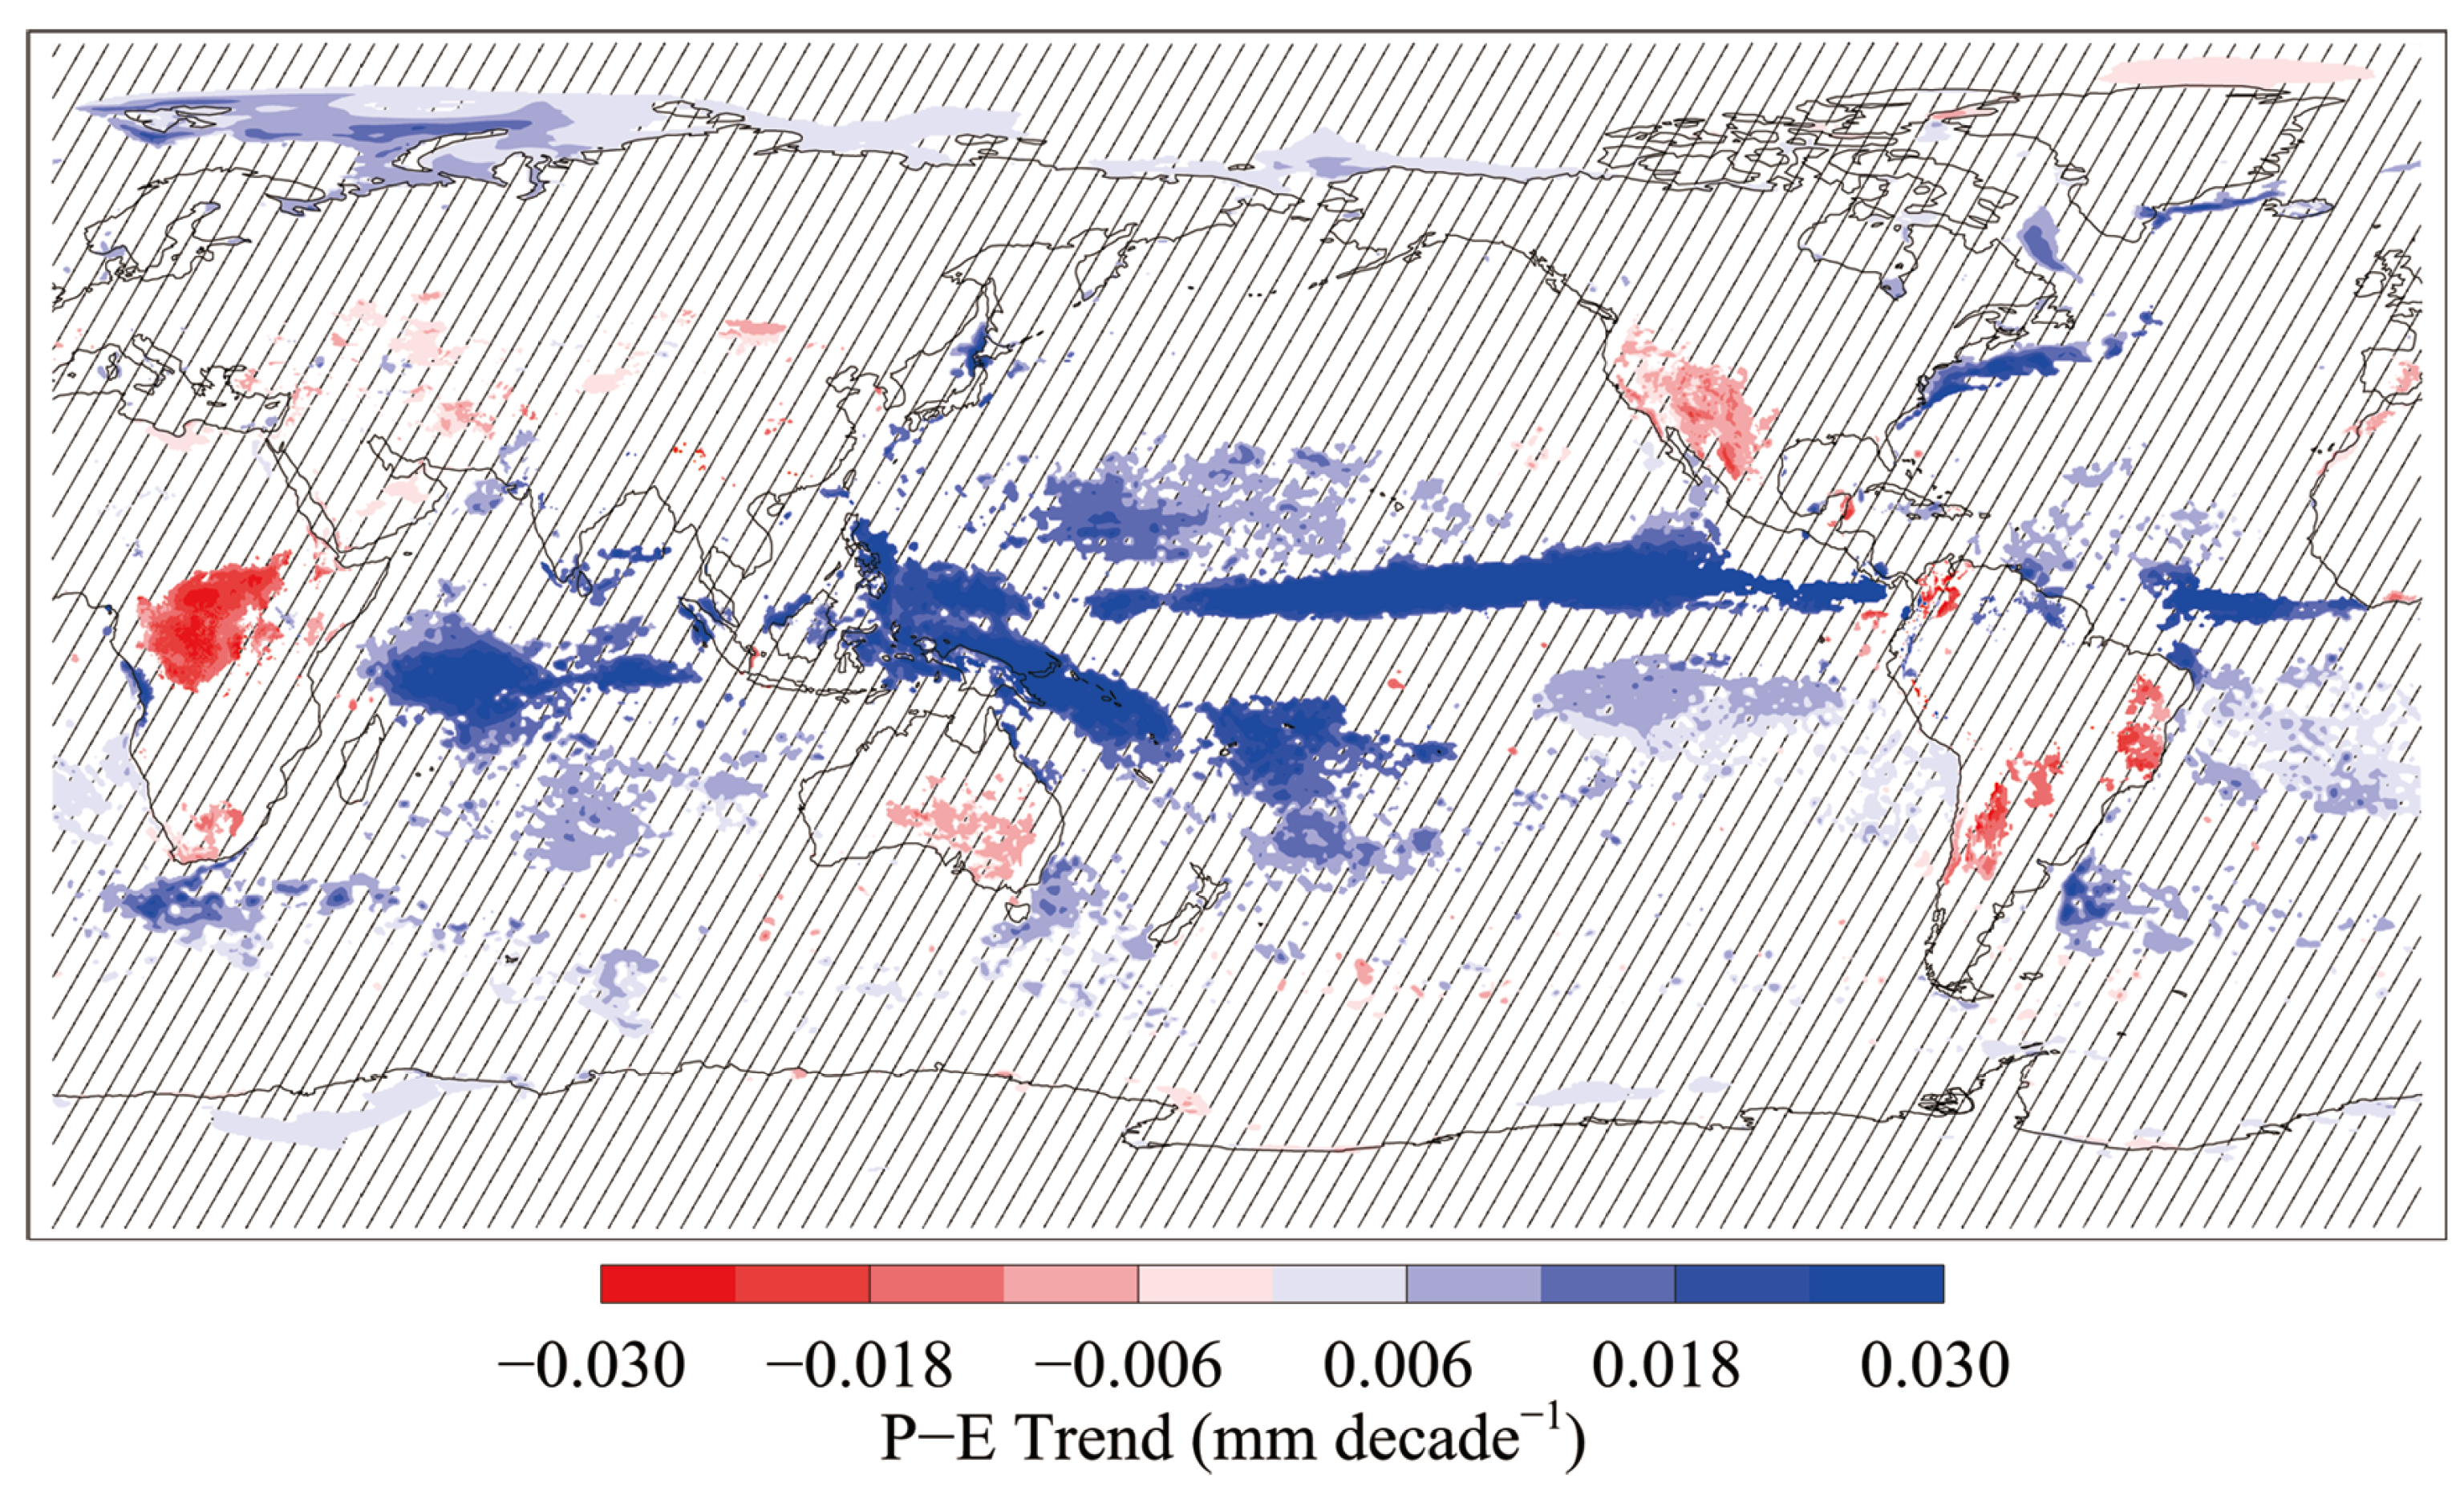
Table 1.
Dynamical metrics of Hadley circulation edge.
| Metric | Reference | Definition |
|---|---|---|
| Hu and Fu [33] | Zero-crossing of the meridional overturning streamfunction at 500 hPa. | |
| Davis and Birner [34] | Zero contour of the vertically averaged meridional overturning streamfunction. | |
| Davis and Birner [32] | Latitude at which the greatest meridional gradient in the streamfunction occurs. | |
| SLP | Choi et al. [35] | Subtropical high-pressure ridge. |
| Davis and Birner [36] | Near surface wind zero crossing. | |
| STJ | Davis and Birner [36] | Subtropical jet stream from the location maximum winds aloft. |
| EDJ | Kang and Polvain [37] | Latitude at which the maximum 850 hPa zonal wind occurs. |
| Allen et al. [38] | Latitude where the maximum the vertically integrated zonal momentum occurs. | |
| Chemke and Polvani [39] | The latitude of maximum eddy momentum flux. |
Table 2.
Hydrological metrics of Hadley circulation edge.
| Metric | Reference | Definition |
|---|---|---|
| Staten et al. [44] | The latitude of the maximum total precipitation between 30 and 70 latitude. | |
| Allen et al. [45] | The latitude of the minimum of total precipitation in the subtropics. | |
| Davis and Birner [32] | Latitude of the minimum of the difference precipitation minus evaporation. | |
| Lu et al. [6] | Latitude of the zero-crossing of the difference precipitation minus evaporation. | |
| Allen et al. [45] | The latitude of the minimum of subtropical cloud coverage. | |
| OLR | Solomon et al. [46] | Latitude of a given value of outgoing longwave radiation occurs. |
| OLR | Mantsis et al. [47] | Latitude where zonal mean OLR drops 20 W m on the poleward side of the subtropical maximum. |
Table 3.
Thermal metrics of Hadley circulation edge.
| Metric | Reference | Definition |
|---|---|---|
| Lu et al. [55] | Latitude of 15 km tropopause altitude. | |
| Seidel and Randel [52] | Poleward latitude of a given frequency of high tropical tropopause altitudes. | |
| Davis and Rosenolof [40] | The latitude at which the greatest zonal gradient in tropopause altitude occurs. | |
| TPB | Xian and Homeyer [53] | Tropopause break, where the tropopause altitudes changes from the tropical one to the |
| extratropical one abruptly. | ||
| LST | Fu and Lin [56] | The maximum cooling in the lower stratosphere due to a poleward shift of subtropical jets. |
| GTT | Fu et al. [57] | The global distribution of tropospheric and stratospheric temperature changes. |
Table 4.
Chemical metrics of Hadley circulation edge.
| Metric | Reference | Definition |
|---|---|---|
| TCO | Hudson et al. [59] | The ozone value for the boundary of the subtropical front. |
| Shah et al. [42] | Latitude where the concentration of a specific tracer gas deviate by 1 from its tropical average. | |
| Sparling [60] | Latitude of subtropical minimum in the probability density function of a specific tracer concentration. | |
| GWL | Davis and Rosenlof [40] | Latitude weighted by the gradient in a specific tracer concentrations. |
Publisher’s Note: MDPI stays neutral with regard to jurisdictional claims in published maps and institutional affiliations. |
© 2021 by the authors. Licensee MDPI, Basel, Switzerland. This article is an open access article distributed under the terms and conditions of the Creative Commons Attribution (CC BY) license (https://creativecommons.org/licenses/by/4.0/).
Share and Cite
MDPI and ACS Style
Xian, T.; Xia, J.; Wei, W.; Zhang, Z.; Wang, R.; Wang, L.-P.; Ma, Y.-F. Is Hadley Cell Expanding? Atmosphere 2021, 12, 1699. https://0-doi-org.brum.beds.ac.uk/10.3390/atmos12121699
AMA Style
Xian T, Xia J, Wei W, Zhang Z, Wang R, Wang L-P, Ma Y-F. Is Hadley Cell Expanding? Atmosphere. 2021; 12(12):1699. https://0-doi-org.brum.beds.ac.uk/10.3390/atmos12121699
Chicago/Turabian StyleXian, Tao, Jingwen Xia, Wei Wei, Zehua Zhang, Rui Wang, Lian-Ping Wang, and Yong-Feng Ma. 2021. "Is Hadley Cell Expanding?" Atmosphere 12, no. 12: 1699. https://0-doi-org.brum.beds.ac.uk/10.3390/atmos12121699
Note that from the first issue of 2016, this journal uses article numbers instead of page numbers. See further details here.