
Spatiotemporal Variations of Aerosol Optical Depth in the Atmosphere over Baikal Region Based on MODIS Data

 ,
,  , ,
, ,
Abstract
:1. Introduction
2. Research Region and Data
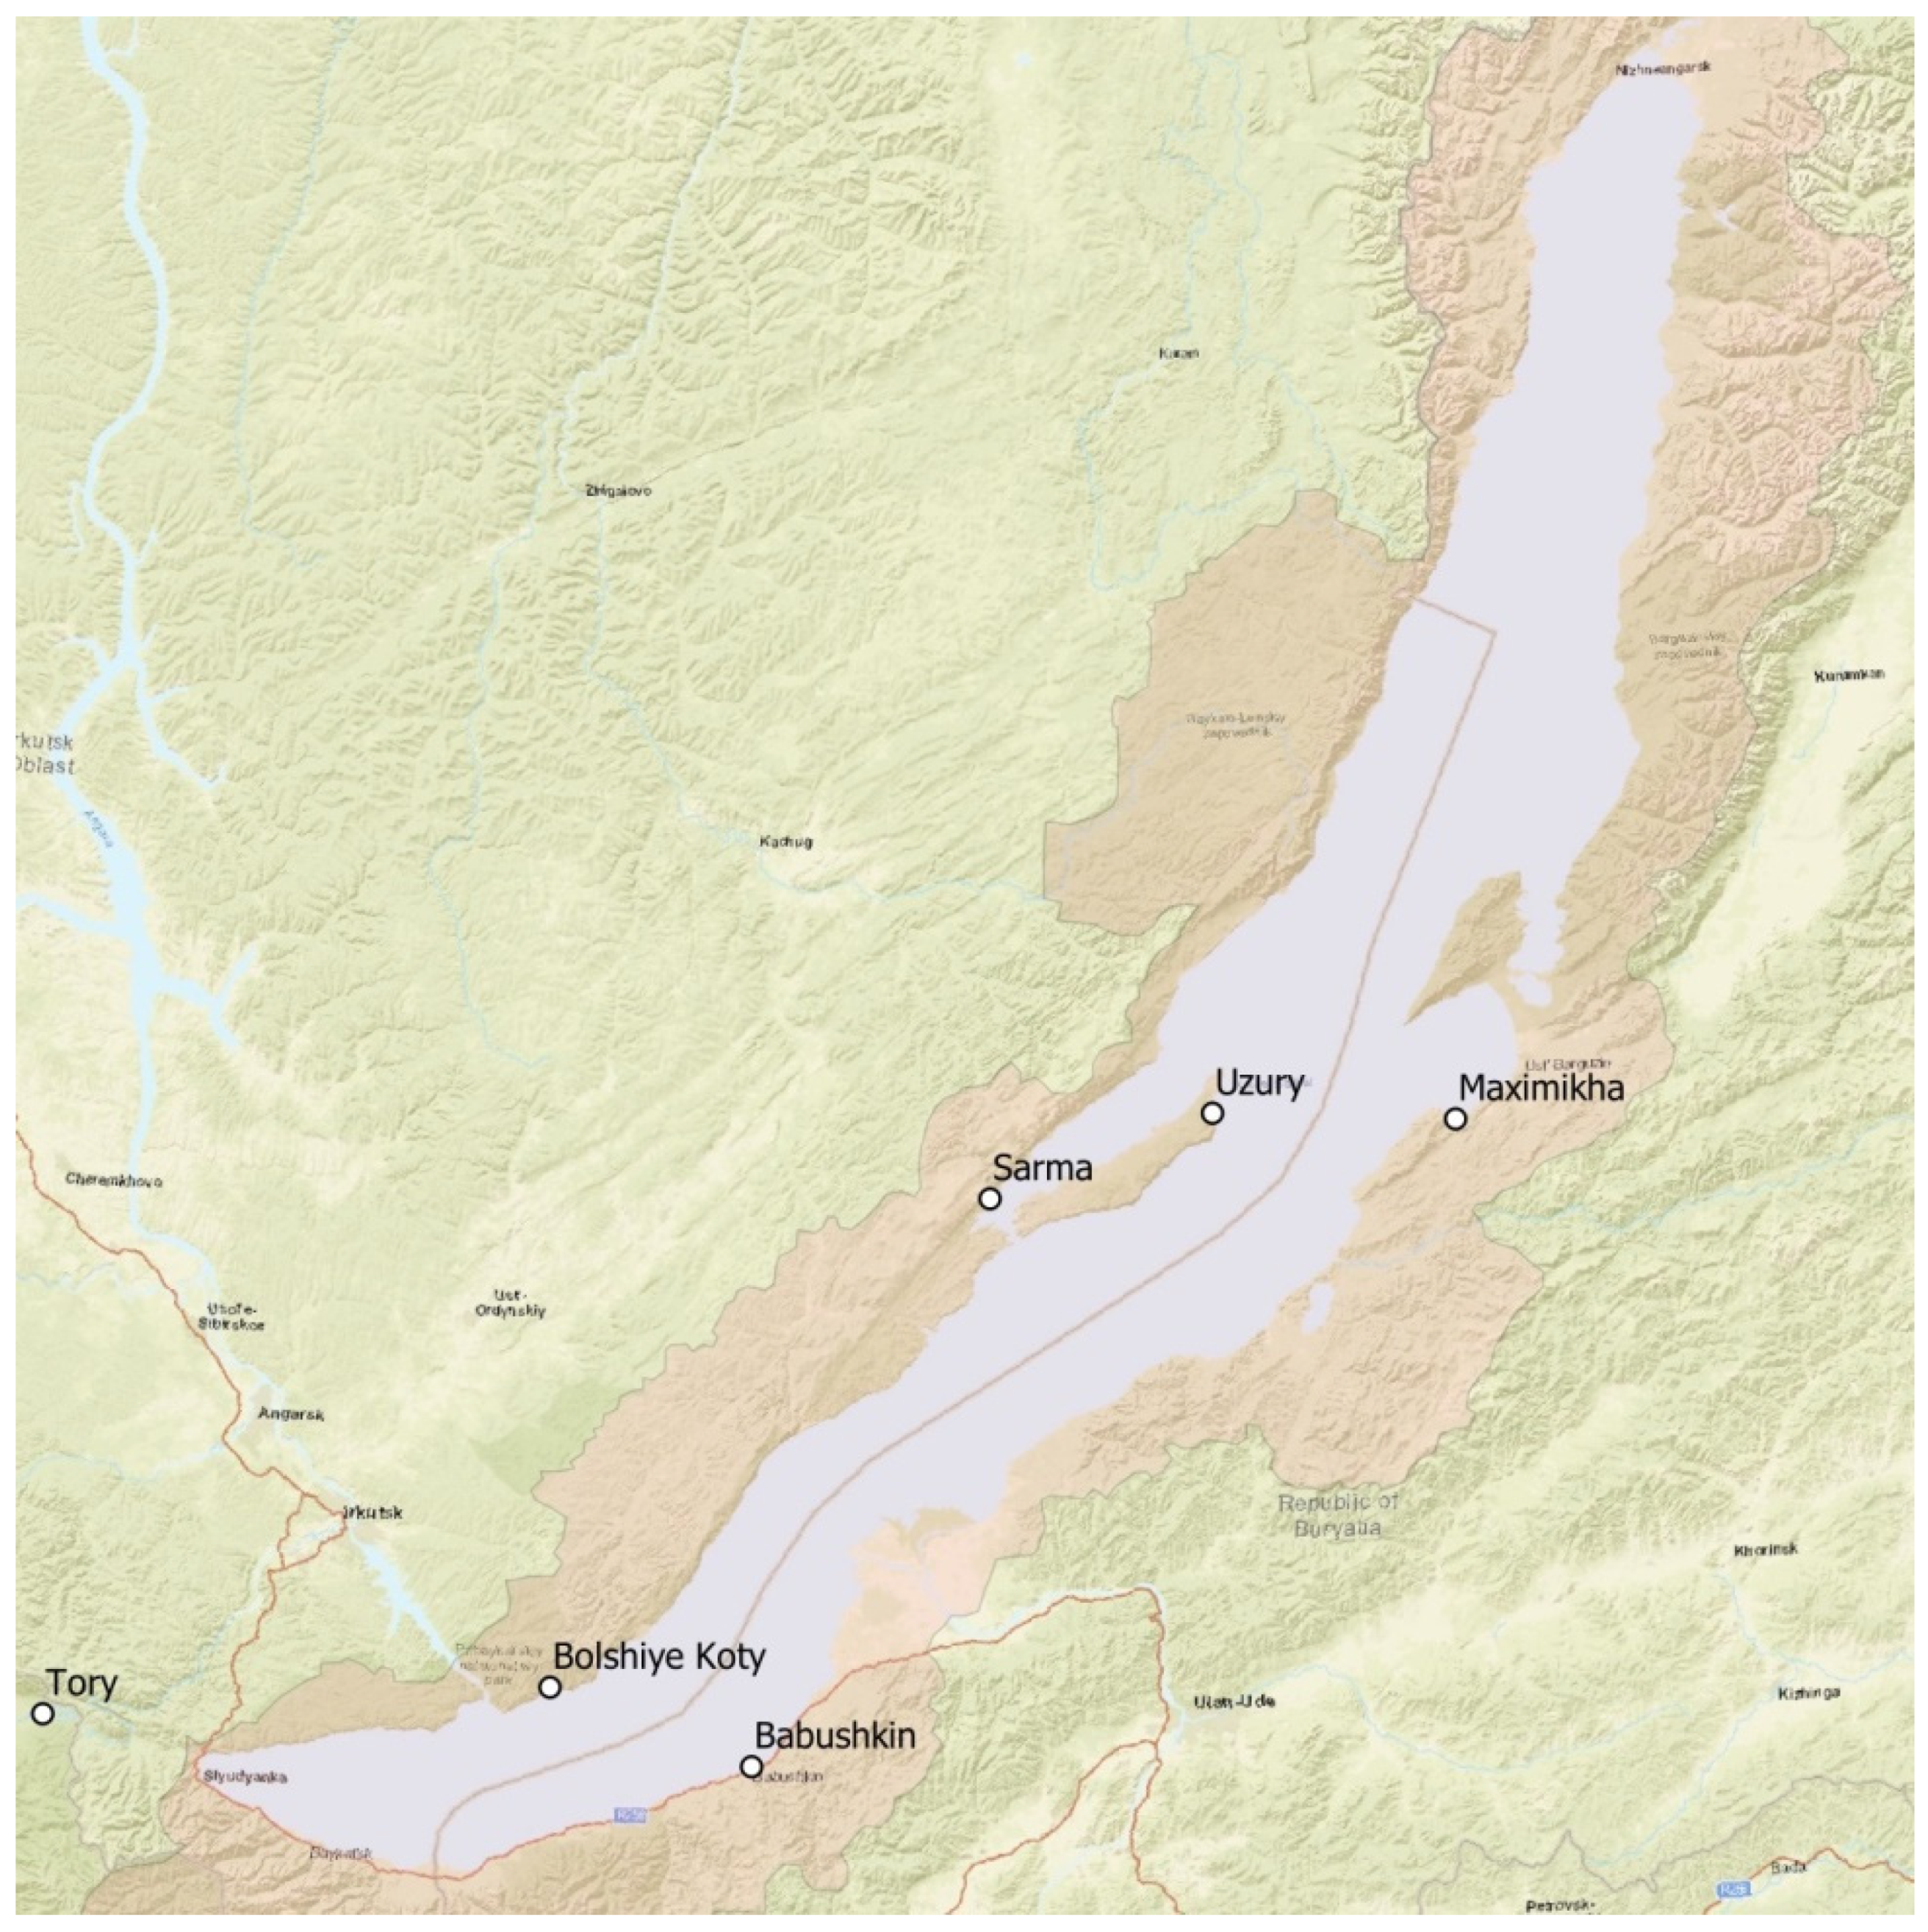
2.1. Study Area
2.2. Data
3. Results
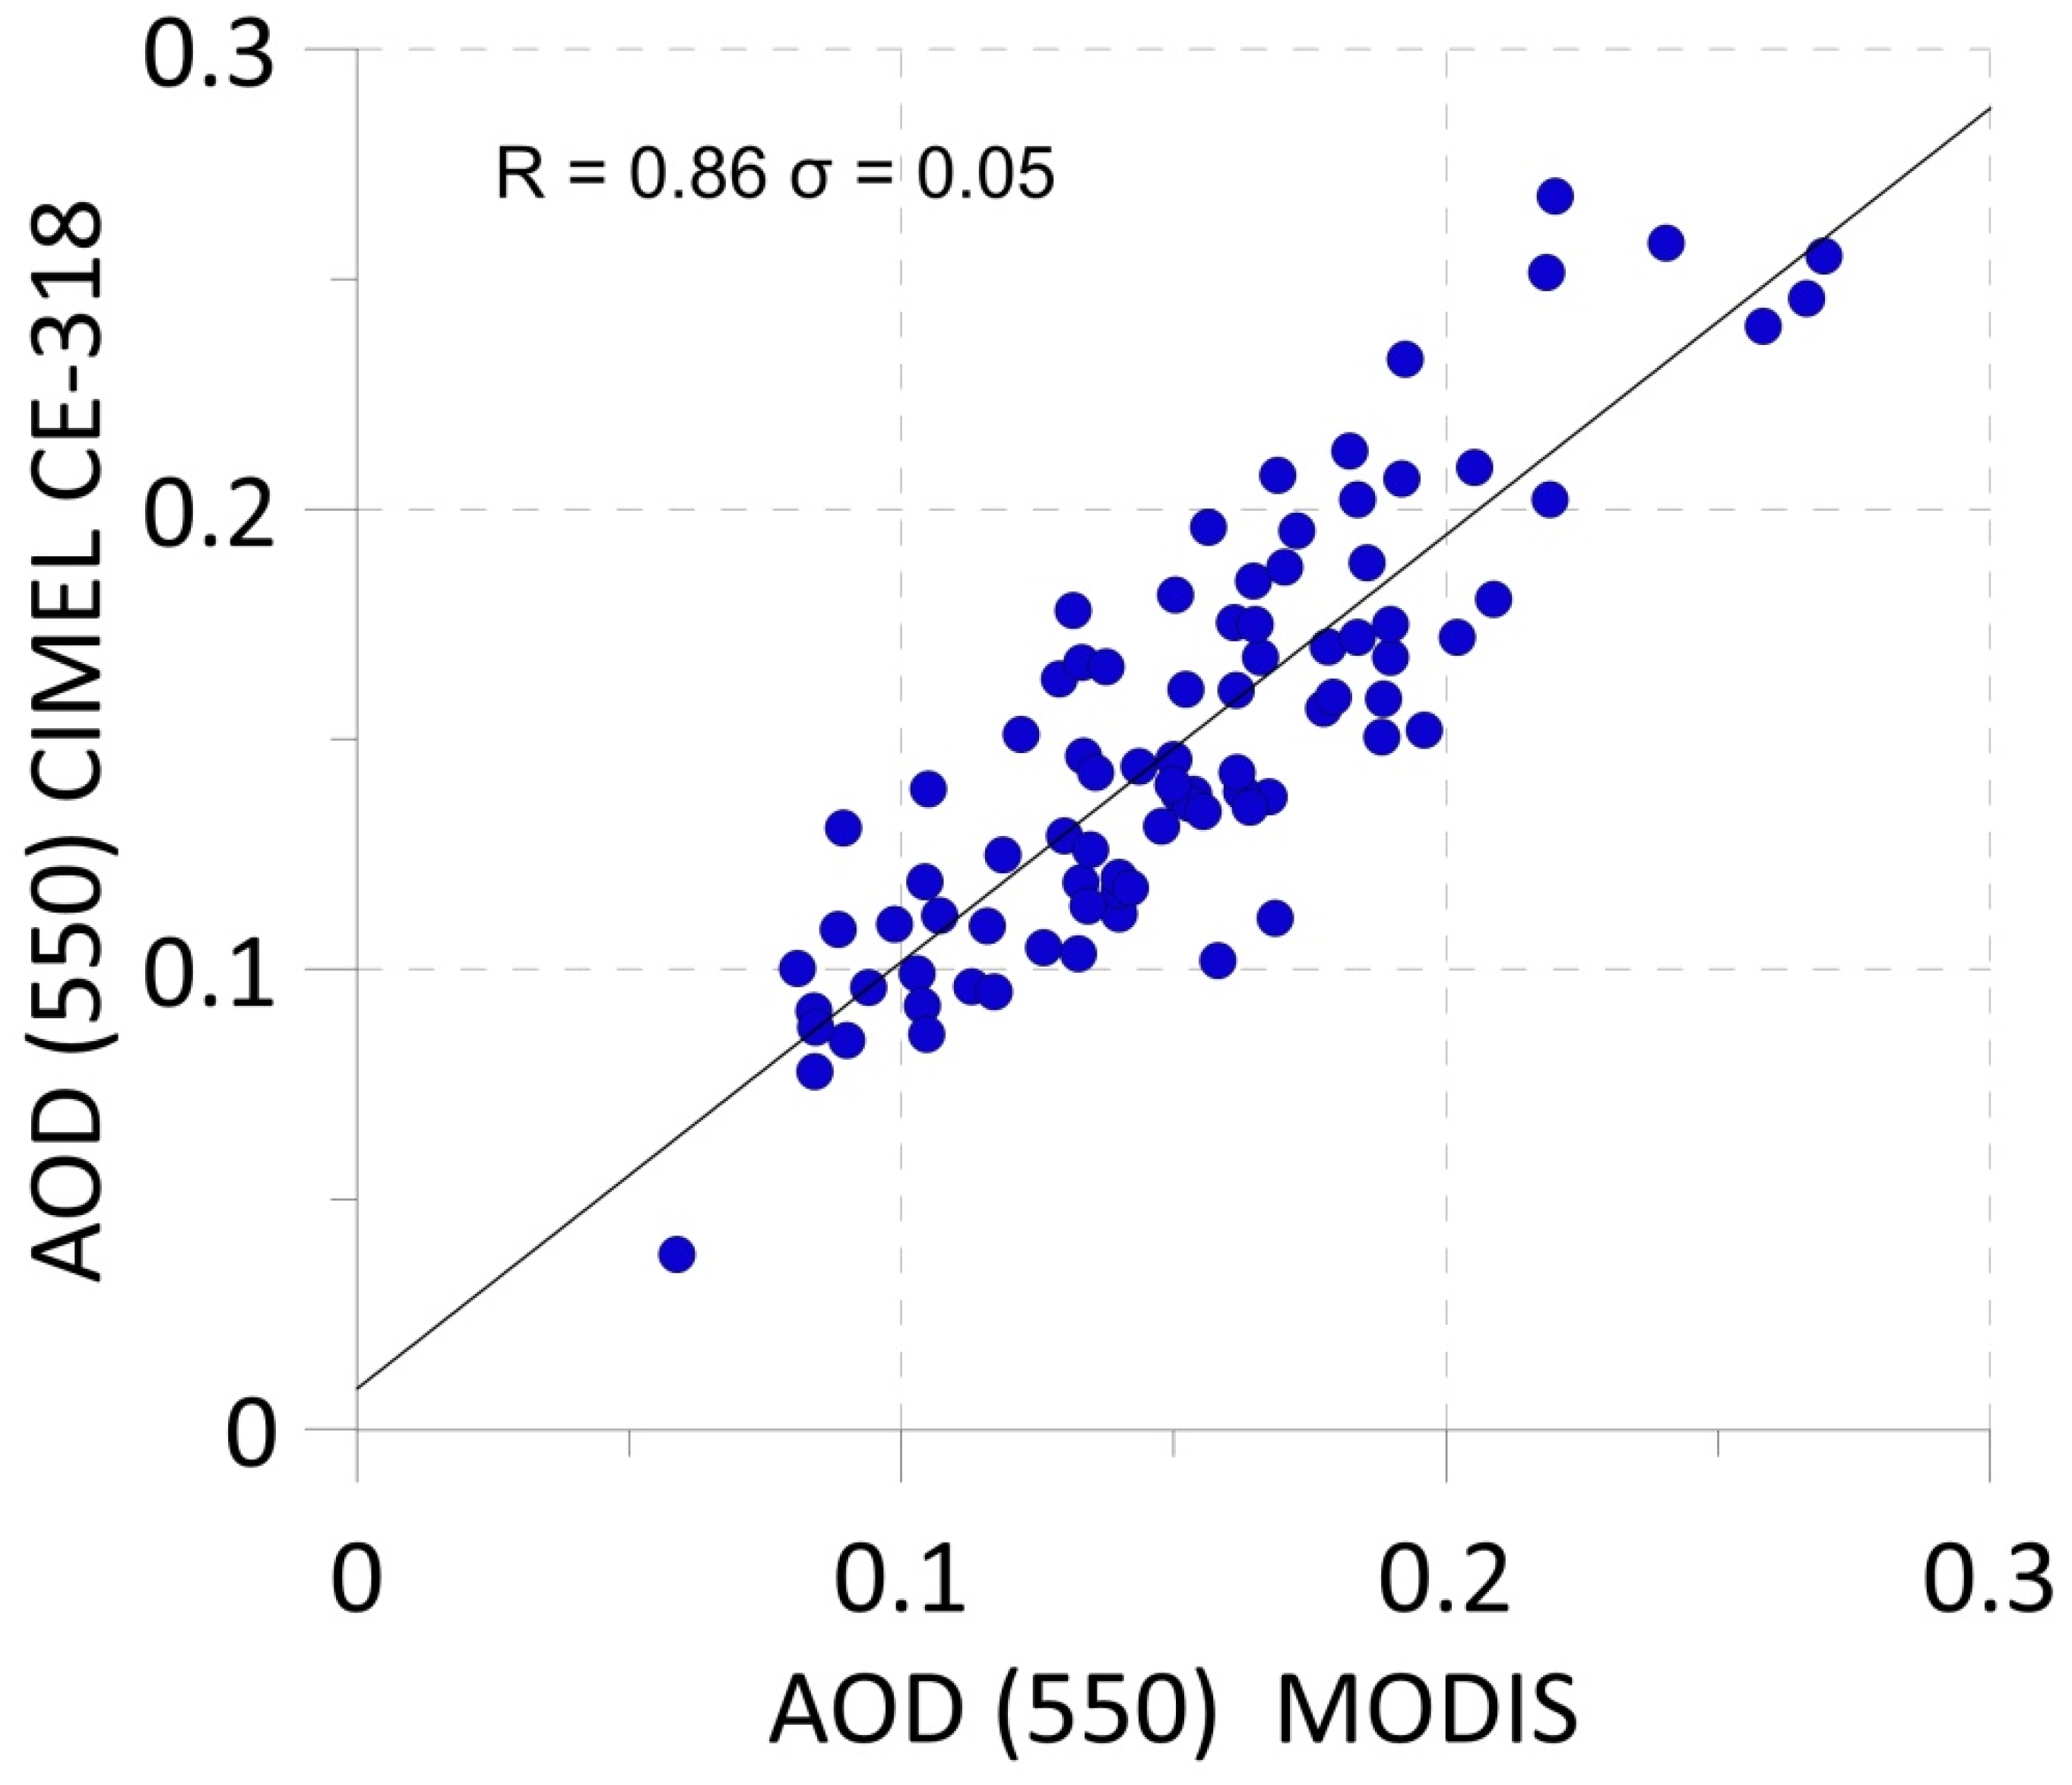
3.1. Validation
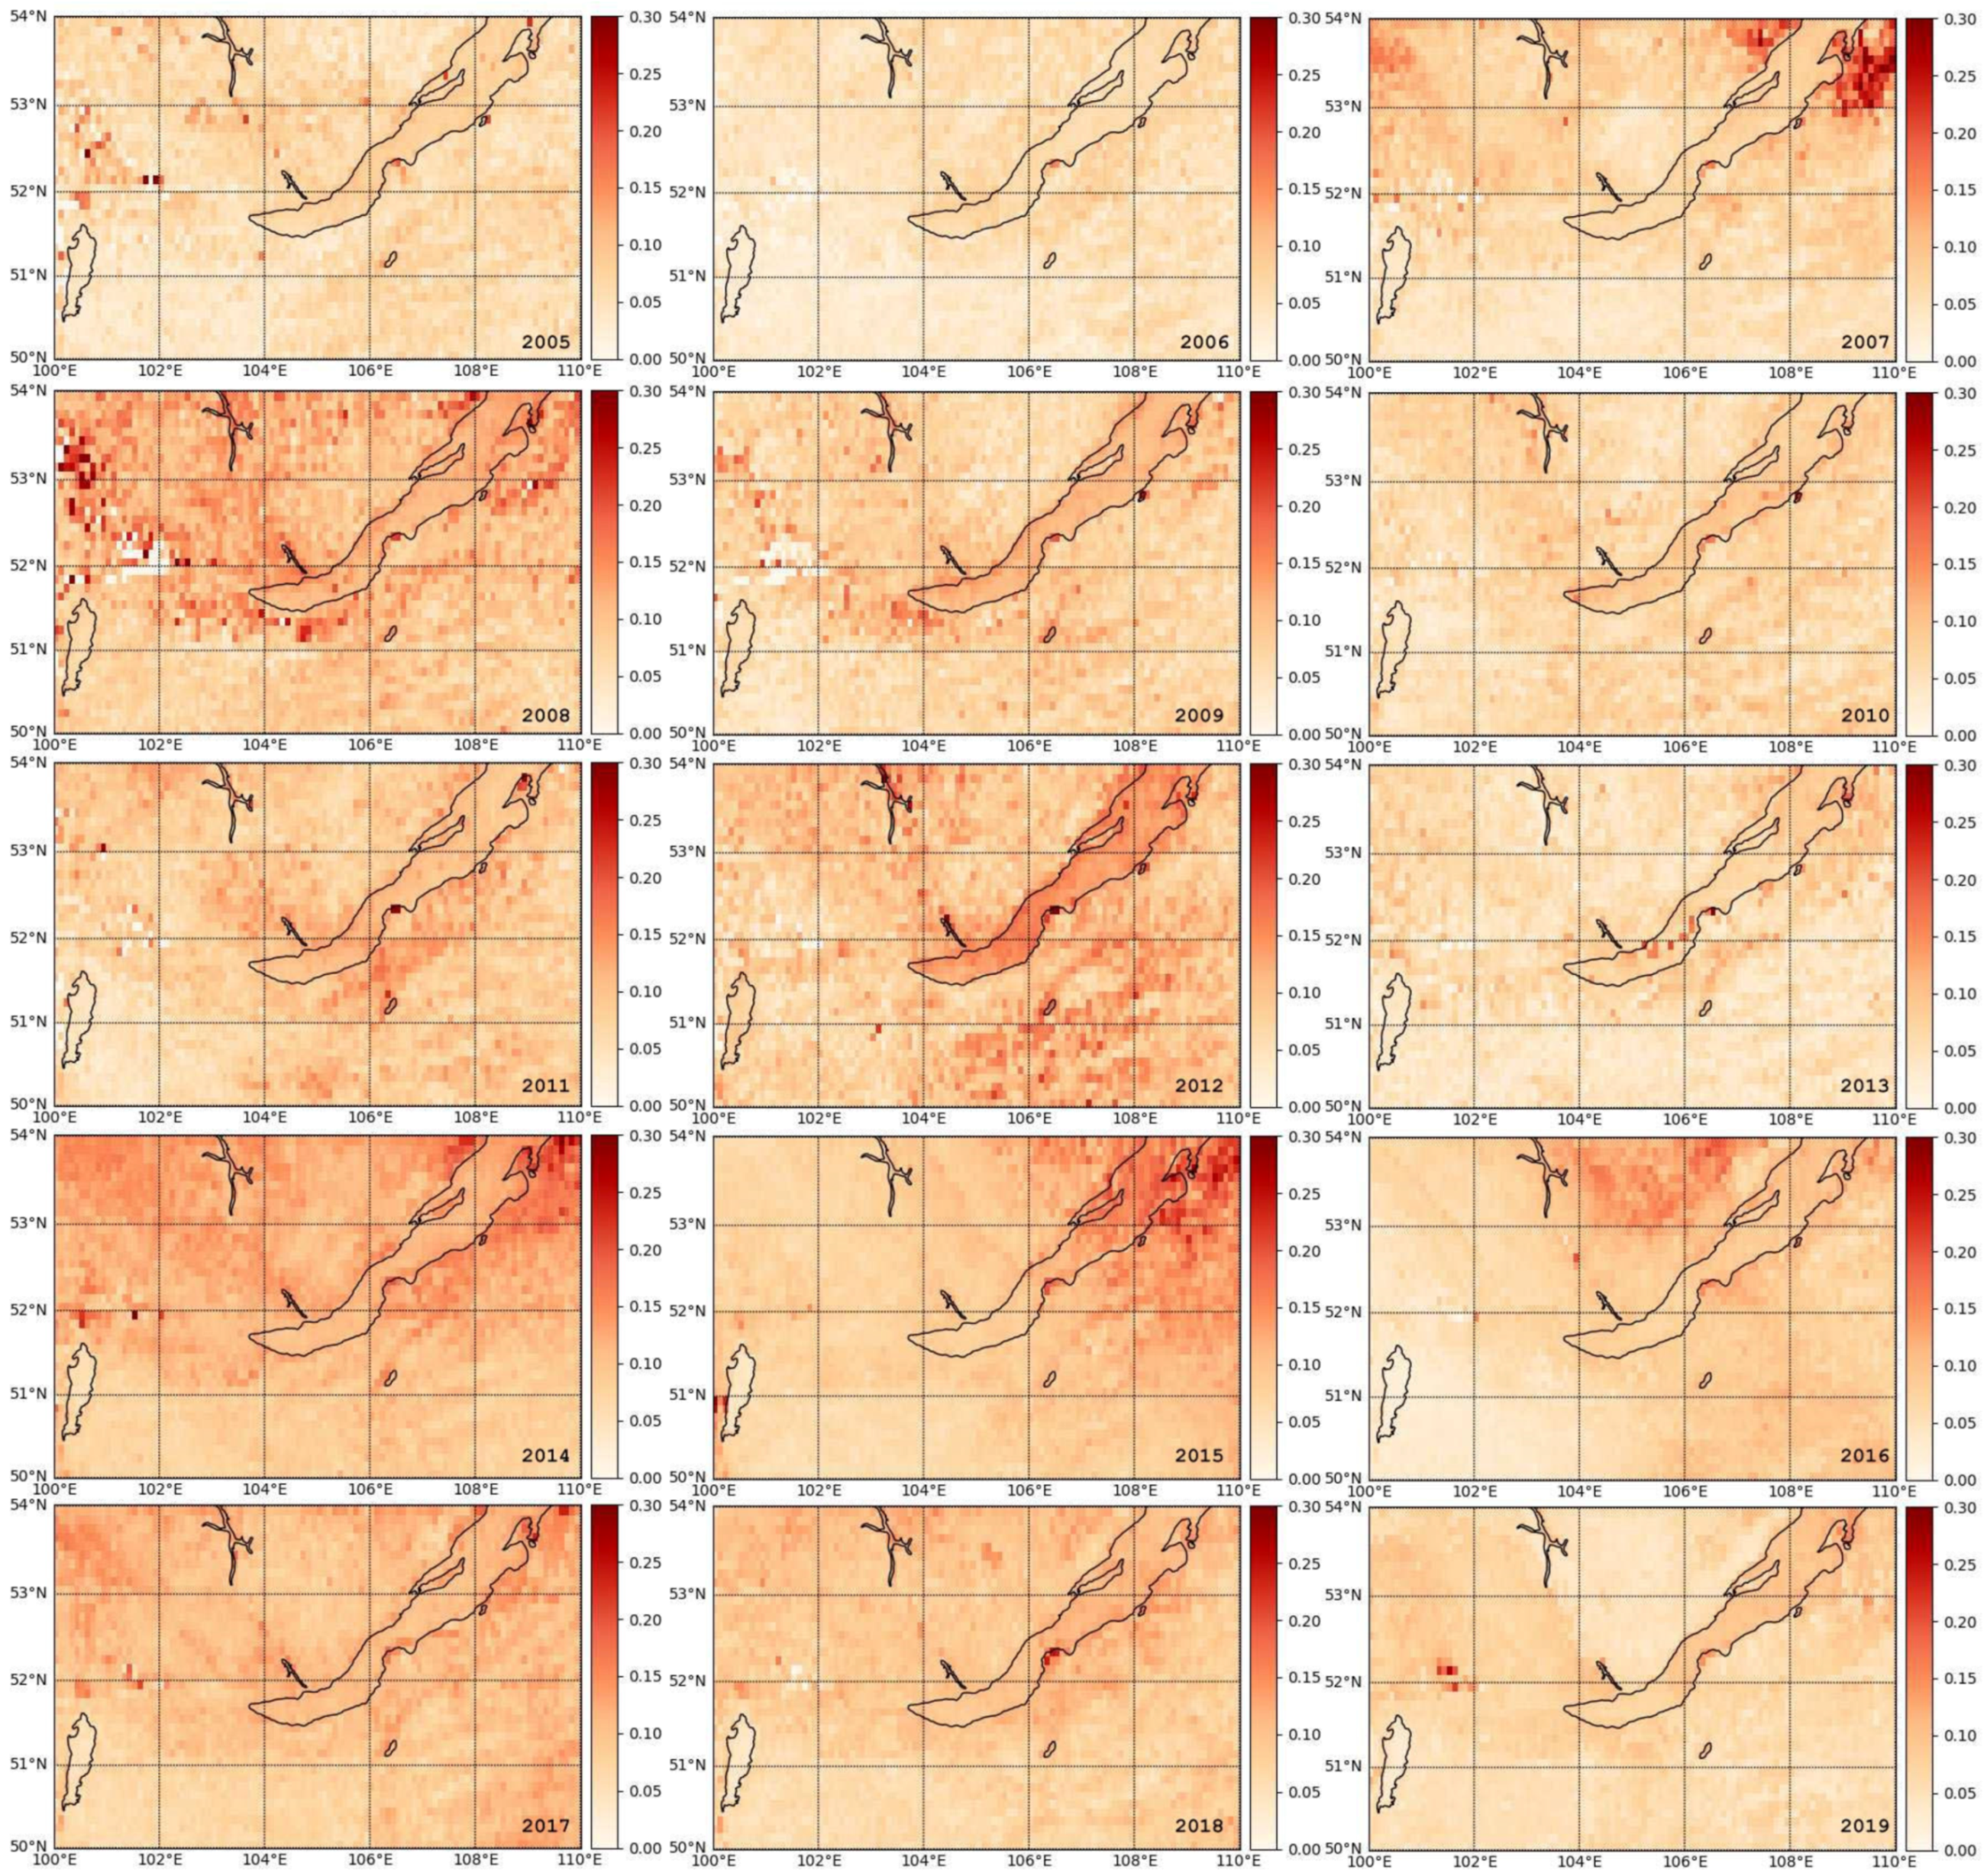
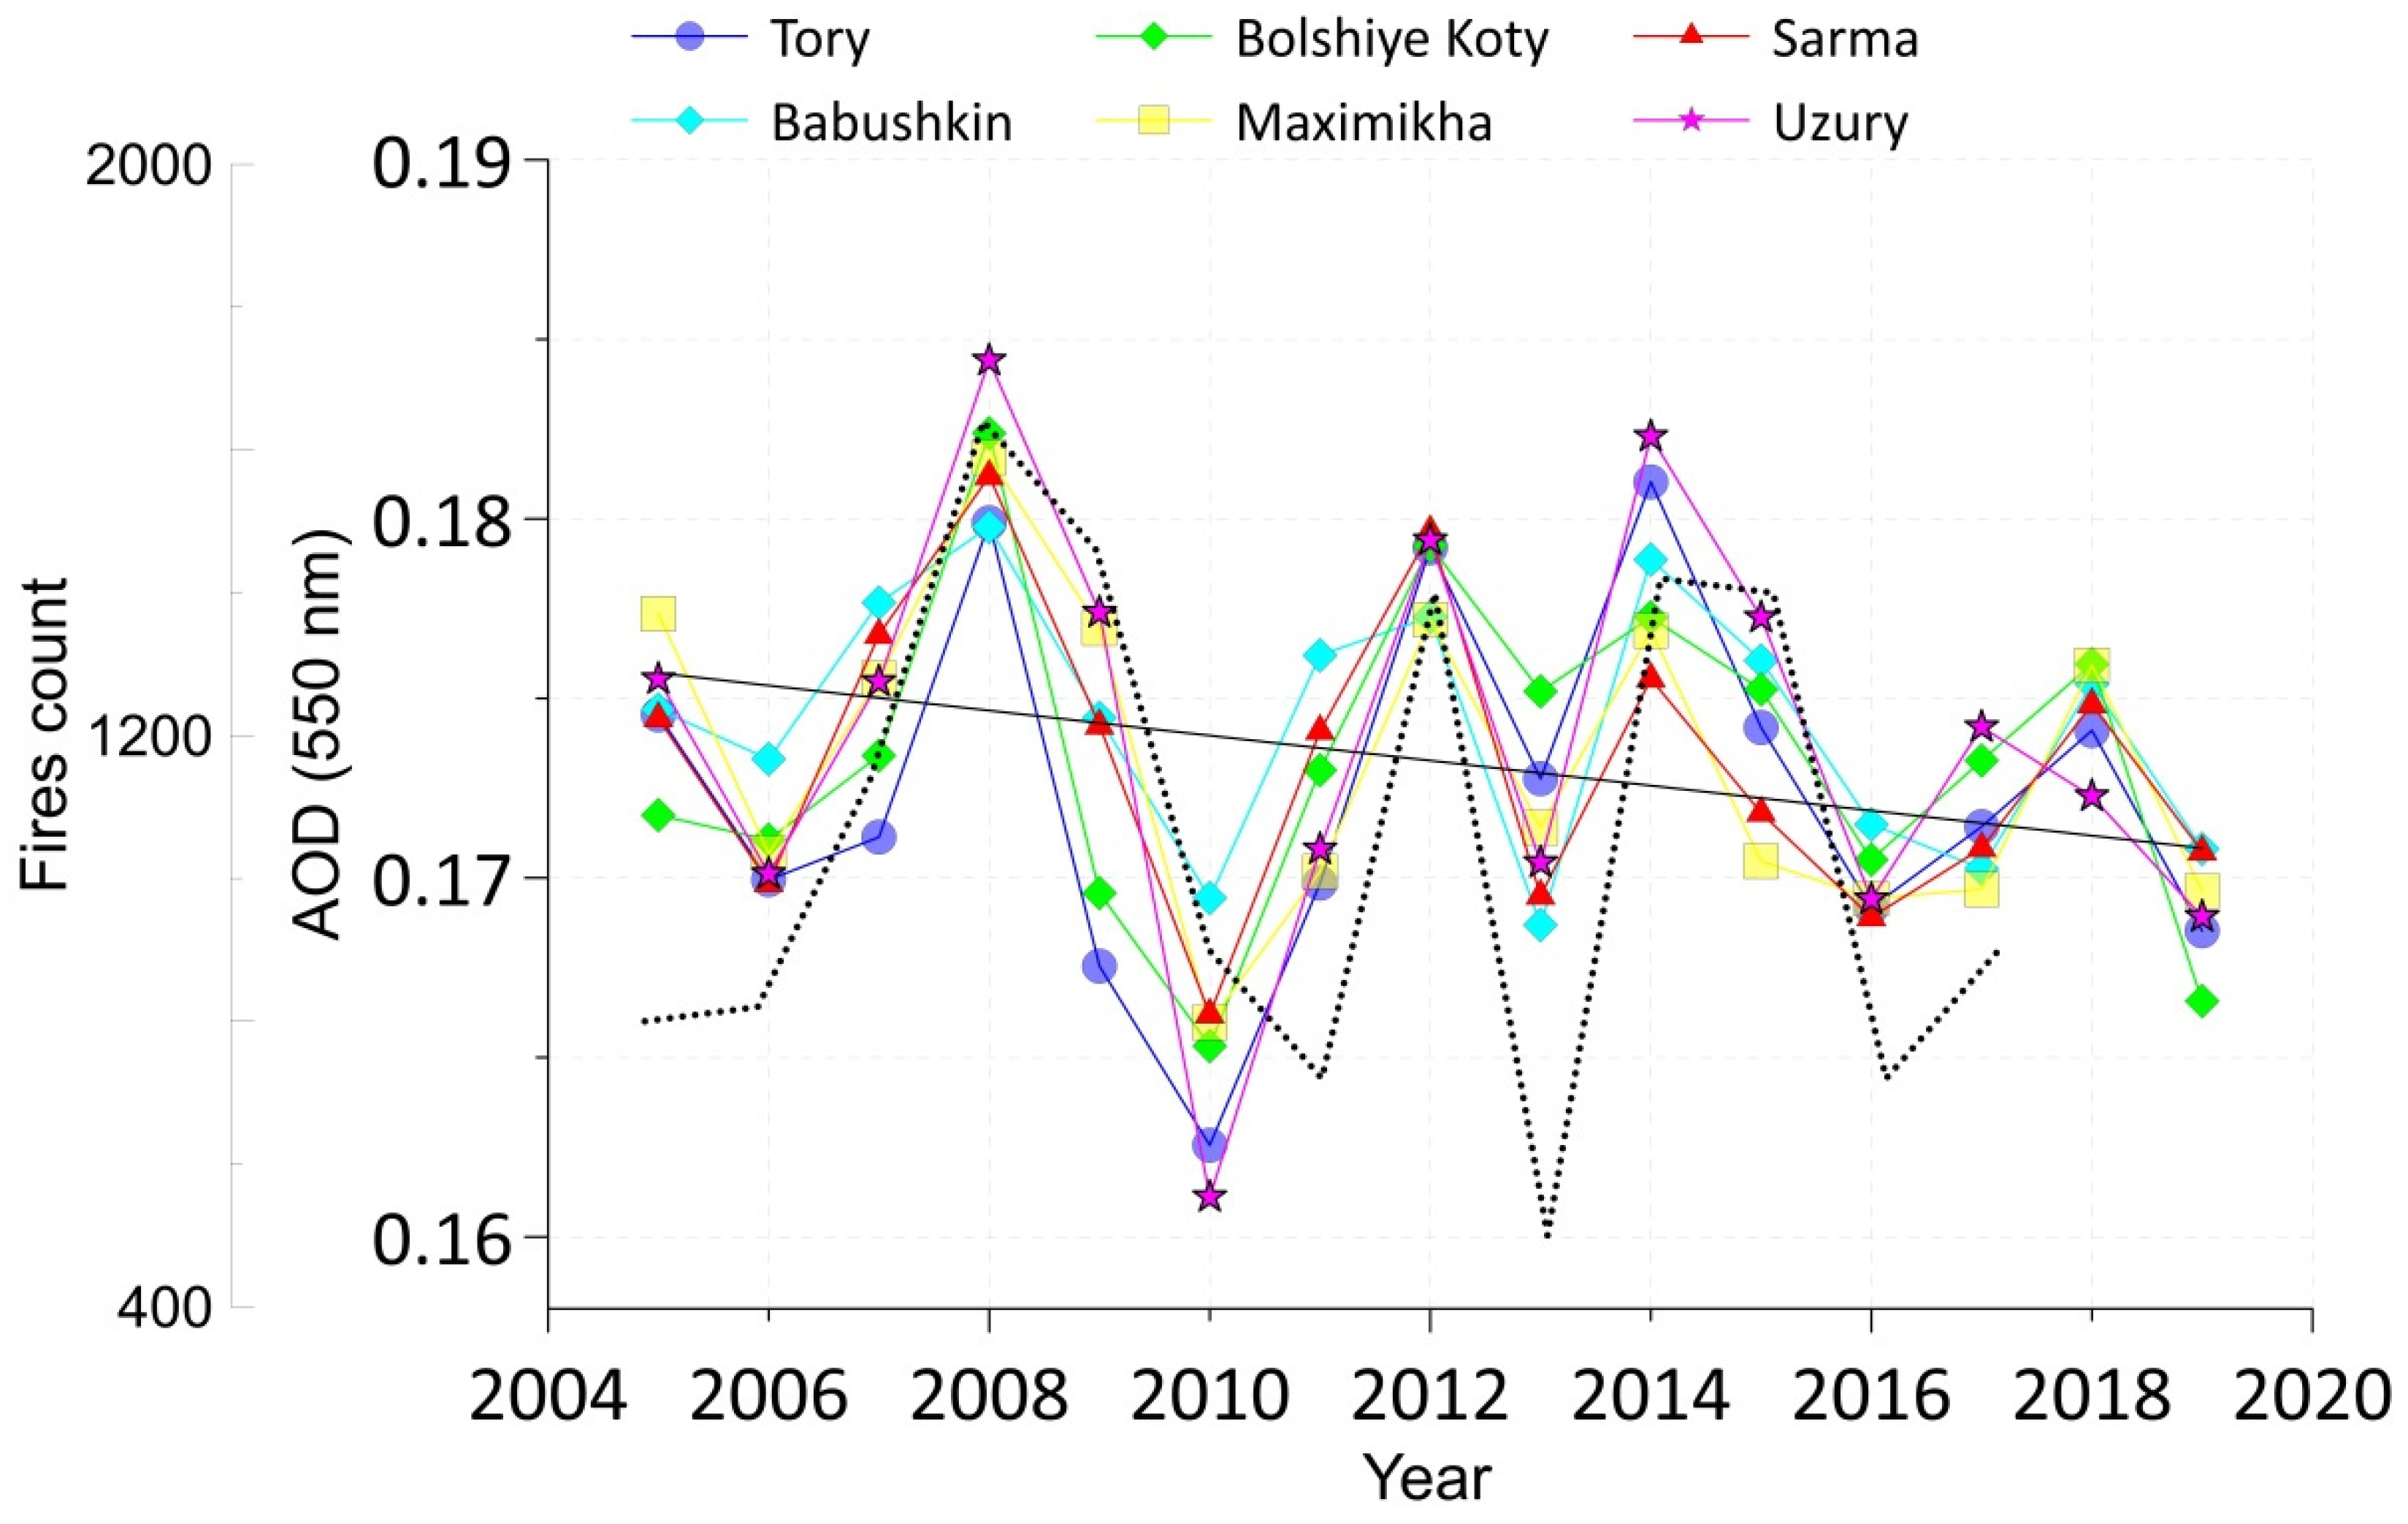
3.2. Interannual Variations in Atmospheric AOD
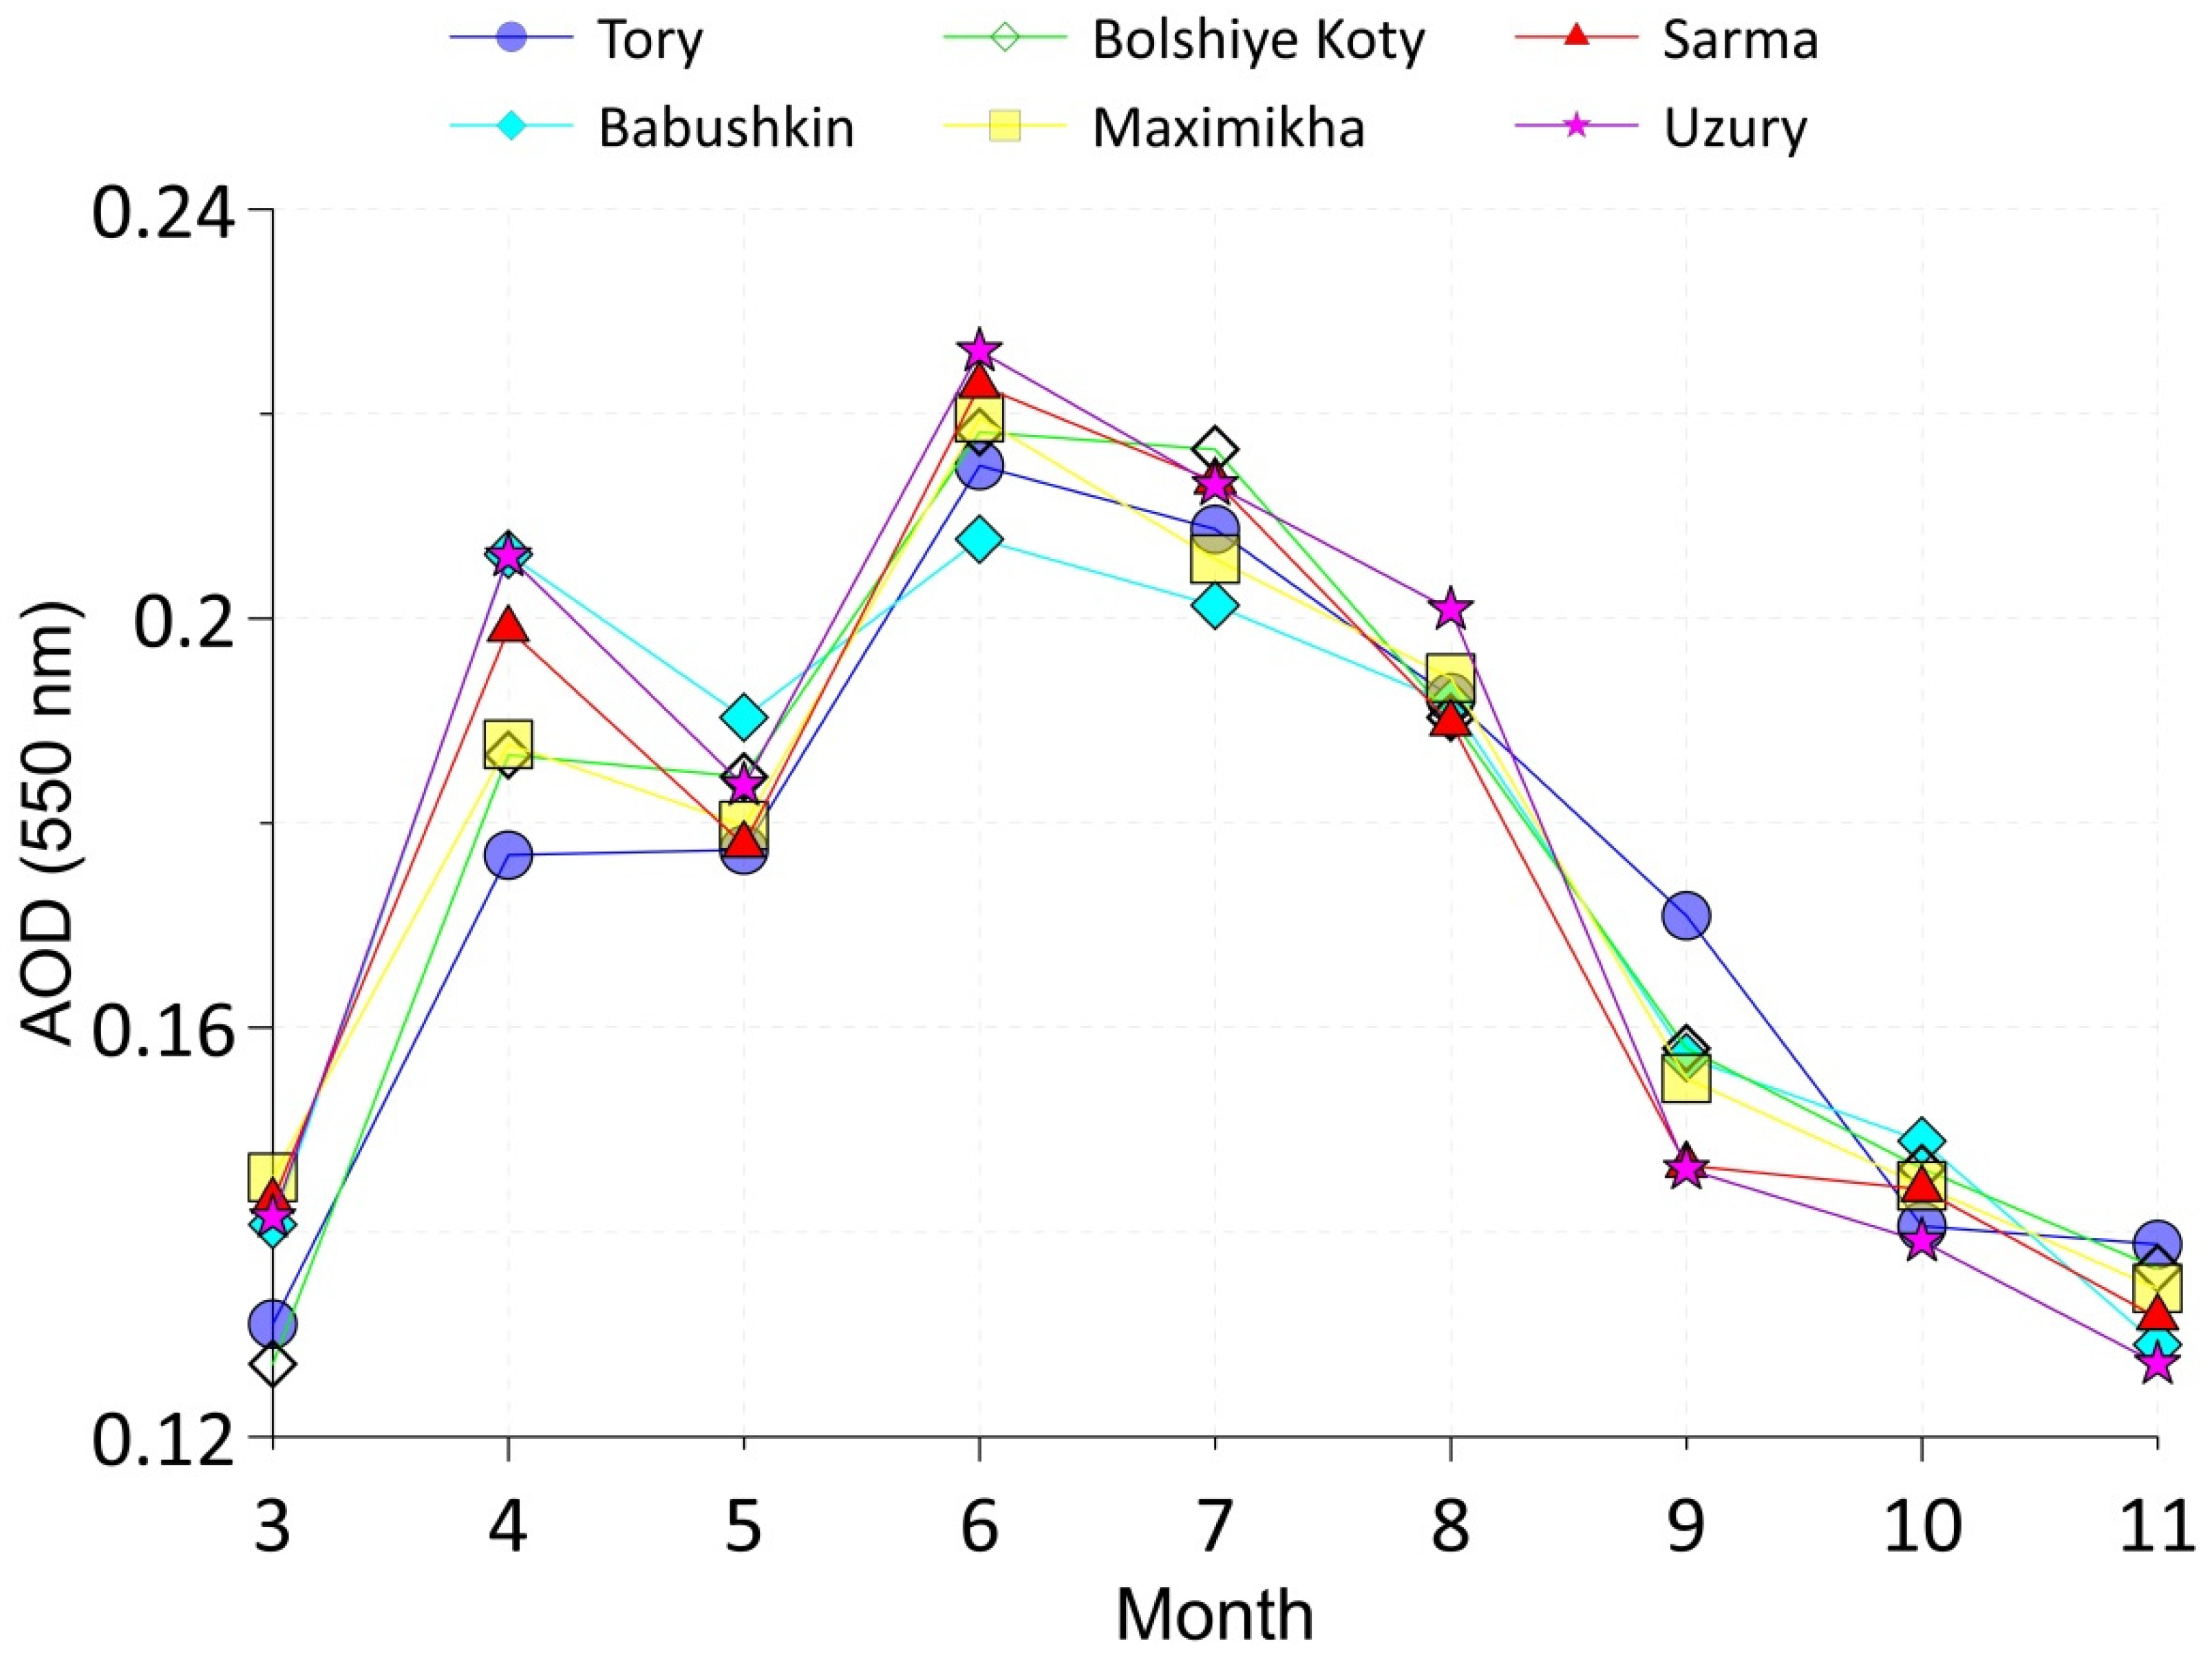
3.3. Seasonal Variations in AOD Monthly Means
4. Discussion
5. Conclusions
Author Contributions
Funding
Data Availability Statement
Acknowledgments
Conflicts of Interest
References
- Zhdanova, E.Y.; Chubarova, N.Y.; Lyapustin, A.I. Assessment of urban aerosol pollution over the Moscow megacity by the MAIAC aerosol product. Atmos. Meas. Tech. 2020, 13, 877–891. [Google Scholar] [CrossRef] [Green Version]
- Paznukhov, A.; Soina, A.; Milinevsky, G.; Yampolsky, Y. Weekly cycle in the atmosphere aerosol variations for industrial regions. Adv. Astron. Space Phys. 2019, 9, 20–27. [Google Scholar] [CrossRef]
- Rakitin, V.S.; Elansky, N.F.; Wang, P.; Wang, G.; Pankratova, N.V.; Shtabkin, Y.A.; Skorokhod, A.I.; Safronov, A.N.; Makarova, M.V.; Grechko, E.I. Changes in trends of atmospheric composition over urban and background regions of Eurasia: Estimates based on spectroscopic observations. Geogr. Environ. Sustain. 2018, 11, 84–96. [Google Scholar] [CrossRef]
- Golobokova, L.P.; Khodzher, T.V.; Obolkin, V.A.; Potemkin, V.L.; Khuriganova, O.I.; Onischuk, N.A. Aerosol in the atmosphere of the Baikal region: History and contemporary researches. Limnol. Freshw. Biol. 2018, 1, 49–57. [Google Scholar] [CrossRef] [Green Version]
- Wei, P.; Hong, J.; Yong, Z. Using MODIS to retrieve the AOT over the region of Baikal. In IOP Conference Series: Earth and Environmental Science; IOP Publishing: Bristol, UK, 2014; Volume 17, p. 012038. [Google Scholar] [CrossRef]
- Chubarova, N.Y.; Poliukhov, A.A.; Gorlova, I.D. Long-term variability of aerosol optical thickness in Eastern Europe over 2001–2014 according to the measurements at the Moscow MSU MO AERONET site with additional cloud and NO2 correction. Atmos. Meas. Tech. 2016, 9, 313–334. [Google Scholar] [CrossRef] [Green Version]
- Taschilin, M.A.; Mikhalev, A.V.; Kabanov, D.M. Variations of atmospheric aerosol optical depth in the Tunka valley during 2004–2017. In Proceedings of the 24th International Symposium on Atmospheric and Ocean Optics: Atmospheric Physics, Tomsk, Russia, 2–5 July 2018. [Google Scholar] [CrossRef]
- Plakhina, I.N.; Makhotkina, E.L.; Pankratova, N.V. Variations in the atmospheric aerosol optical depth from the data obtained at the Russian actinometric network in 1976–2006. Izvestiya Atmos. Ocean. Phys. 2009, 45, 456–466. [Google Scholar] [CrossRef]
- Remer, L.A.; Kaufman, Y.J.; Tanre, D.; Mattoo, D.; Chu, D.A.; Martins, J.V.; Li, R.R.; Ichoku, C.; Levy, R.C.; Kleidman, R.G.; et al. The MODIS aerosol algorithm, products and validation. J. Atmos. Sci. 2005, 62, 947–973. [Google Scholar] [CrossRef] [Green Version]
- Mehta, M.; Sharma, V.; Doley, G.J. Aerosol optical depth variation during a recent dust event in north India. Environ. Pollut. 2018, 77, 567–571. [Google Scholar] [CrossRef]
- Li, Y.; Shi, G.P.; Sun, Z. Evaluation and improvement of MODIS aerosol optical depth products over China. Atmos. Environ. 2020, 223, 117251. [Google Scholar] [CrossRef]
- Ali, G.; Bao, Y.S.; Boiyo, R.; Tang, W.Y.; Lu, Q.F.; Min, J.Z. Evaluating MODIS and MISR aerosol optical depth retrievals over environmentally distinct sites in Pakistan. J. Atmos. Sol. Terr. Phys. 2019, 183, 19–35. [Google Scholar] [CrossRef]
- Mishra, A.K.; Lehahn, Y.; Rudich, Y.; Koren, I. Co-variability of smoke and fire in the Amazon basin. Atmos. Environ. 2015, 109, 97–104. [Google Scholar] [CrossRef]
- Bryson, R.A.; Goodman, B.M. Volcanic activity and climatic changes. Science 1980, 207, 1041–1044. [Google Scholar] [CrossRef] [PubMed]
- Kabanov, D.M.; Sakerin, S.M. Variations of the characteristics of the aerosol optical depth under conditions of forest fires. In Proceedings of the SPIE, 13th Joint International Symposium on Atmospheric and Ocean Optics/Atmospheric Physics, Tomsk, Russia, 2–7 July 2006; Matvienko, G.G., Ed.; SPIE: Bellingham, WA, USA, 2006; Volume 6522. [Google Scholar] [CrossRef]
- Chubarova, N.; Nezval’, Y.; Sviridenkov, M.; Smirnov, A.; Slutsker, I. Smoke aerosol and its radiative effects during extreme fire event over Central Russia in summer 2010. Atmos. Meas. Tech. 2012, 5, 557–568. [Google Scholar] [CrossRef] [Green Version]
- Sitnov, S.A.; Gorchakov, G.I.; Sviridenkov, M.A.; Gorchakova, I.A.; Karpov, A.V.; Kolesnikova, A.B. Aerospace monitoring of smoke aerosol over the European part of Russia in the period of massive forest and peatbog fires in July–August of 2010. Atmos. Ocean. Opt. 2013, 26, 265–280. [Google Scholar] [CrossRef]
- Zhuravleva, T.; Kabanov, D.; Nasrtdinov, I.; Russkova, T.; Sakerin, S.; Smirnov, A.; Holben, B. Radiative characteristics of aerosol under smoke mist conditions in Siberia during summer 2012. Atmos. Meas. Tech. 2017, 10, 179–198. [Google Scholar] [CrossRef] [Green Version]
- Kinne, S.; Lohmann, U.; Feichter, J.; Schulz, M.; Timmreck, C.; Ghan, S.; Easter, R.; Chin, M.; Ginoux, P.; Takemura, T.; et al. Monthly averages of aerosol properties: A global comparison among models satellite data and AERONET ground data. J. Geophys. Res. 2003, 108. [Google Scholar] [CrossRef]
- Panchenko, M.V.; Kozlov, V.S.; Polkin, V.V.; Terpugova, S.A.; Polkin, V.V.; Uzhegov, V.N.; Chernov, D.G.; Shmargunov, V.P.; Yausheva, E.P.; Zenkova, P.N. Aerosol characteristics in the near-ground layer of the atmosphere of the city of Tomsk in different types of aerosol weather. Atmosphere 2020, 1, 20. [Google Scholar] [CrossRef] [Green Version]
- Gorbarenko, E.V.; Rublev, A.N. Long-term changes in the aerosol optical thickness in Moscow and correction under strong atmospheric turbidity. Izvestiya Atmos. Ocean. Phys. 2016, 52, 188–195. [Google Scholar] [CrossRef]
- Latysheva, I.V.; Vologzhina, S.Z.; Barkhatova, O.A.; Loshchenko, C.A.; Sutyrina, E.N. Circulation factors in climate change in the Baikal region. In Proceedings of the SPIE, 25th International Symposium On Atmospheric and Ocean Optics—Atmospheric Physics, Novosibirsk, Russia, 30 June–5 July 2019; Matvienko, G.G., Romanovskii, O.A., Eds.; SPIE: Bellingham, WA, USA, 2019; Volume 11208. № 112086L. [Google Scholar] [CrossRef]
- Zhamsueva, G.; Zayakhanov, A.; Tcydypov, V.; Dementeva, A.; Balzhanov, T. Spatial-temporal variability of small gas impurities over lake Baikal during the forest fires in the summer of 2019. Atmosphere 2021, 12, 20. [Google Scholar] [CrossRef]


| Data | Tory | Babushkin | Bolshiye Koty | Maximikha | Sarma |
|---|---|---|---|---|---|
| Maximum | 0.181 | 0.180 | 0.182 | 0.182 | 0.181 |
| Minimum | 0.163 | 0.169 | 0.165 | 0.166 | 0.166 |
| Mean | 0.172 | 0.174 | 0.173 | 0.173 | 0.173 |
| Observation Point | Tory | Babushkin | Bolshiye Koty | Maximikha | Sarma |
|---|---|---|---|---|---|
| Tory | 1 | 0.701 | 0.905 | 0.738 | 0.755 |
| Babushkin | 1 | 0.687 | 0.765 | 0.874 | |
| Bolshiye Koty | 1 | 0.702 | 0.774 | ||
| Maximikha | 1 | 0.9 | |||
| Sarma | 1 |
Publisher’s Note: MDPI stays neutral with regard to jurisdictional claims in published maps and institutional affiliations. |
© 2021 by the authors. Licensee MDPI, Basel, Switzerland. This article is an open access article distributed under the terms and conditions of the Creative Commons Attribution (CC BY) license (https://creativecommons.org/licenses/by/4.0/).
Share and Cite
Taschilin, M.; Yakovleva, I.; Sakerin, S.; Zorkaltseva, O.; Tatarnikov, A.; Scheglova, E. Spatiotemporal Variations of Aerosol Optical Depth in the Atmosphere over Baikal Region Based on MODIS Data. Atmosphere 2021, 12, 1706. https://0-doi-org.brum.beds.ac.uk/10.3390/atmos12121706
Taschilin M, Yakovleva I, Sakerin S, Zorkaltseva O, Tatarnikov A, Scheglova E. Spatiotemporal Variations of Aerosol Optical Depth in the Atmosphere over Baikal Region Based on MODIS Data. Atmosphere. 2021; 12(12):1706. https://0-doi-org.brum.beds.ac.uk/10.3390/atmos12121706
Chicago/Turabian StyleTaschilin, Mikhail, Irina Yakovleva, Sergey Sakerin, Olga Zorkaltseva, Andrey Tatarnikov, and Ekaterina Scheglova. 2021. "Spatiotemporal Variations of Aerosol Optical Depth in the Atmosphere over Baikal Region Based on MODIS Data" Atmosphere 12, no. 12: 1706. https://0-doi-org.brum.beds.ac.uk/10.3390/atmos12121706