
Generating Projections for the Caribbean at 1.5, 2.0 and 2.5 °C from a High-Resolution Ensemble

 , ,
, ,
Abstract
:1. Introduction
2. Data and Methodology
2.1. Models, Data, and Domain
2.2. Methodology
2.2.1. Generating an Ensemble of Downscaled Caribbean Scenarios
2.2.2. Generating Future Caribbean Climate Projections at the LTTGs
3. Results
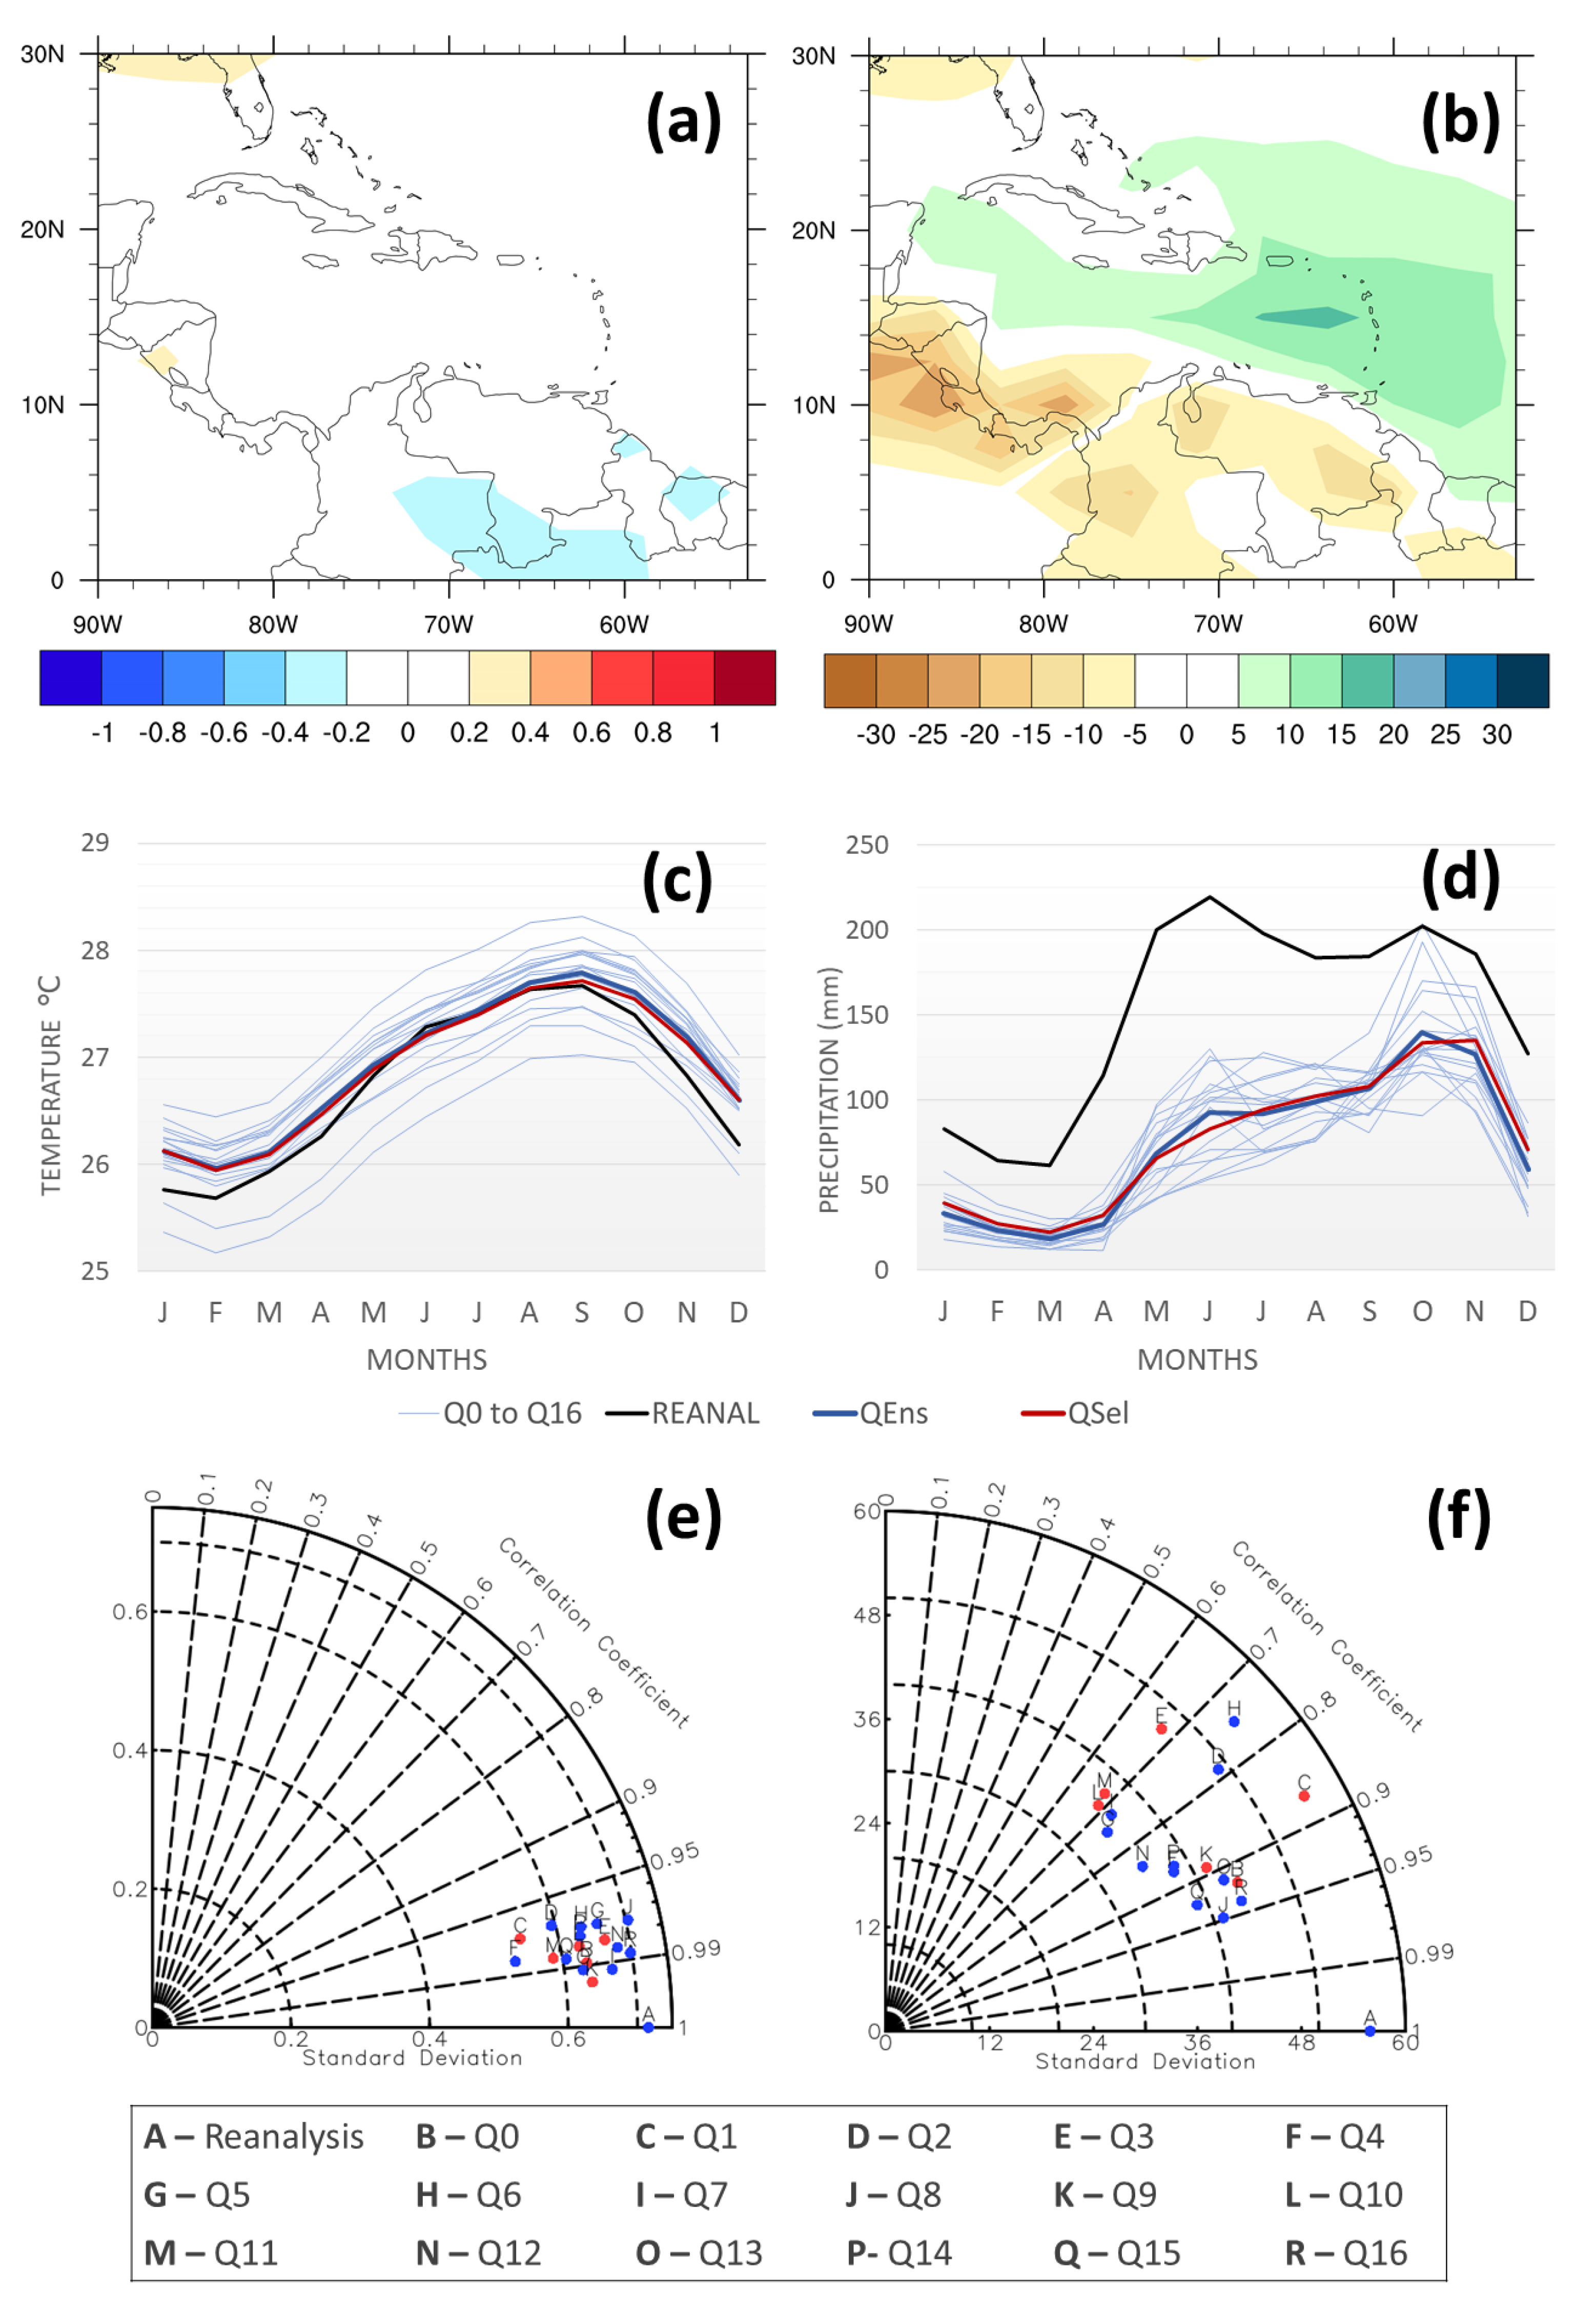
3.1. Choosing a QUMP Subset for Downscaling
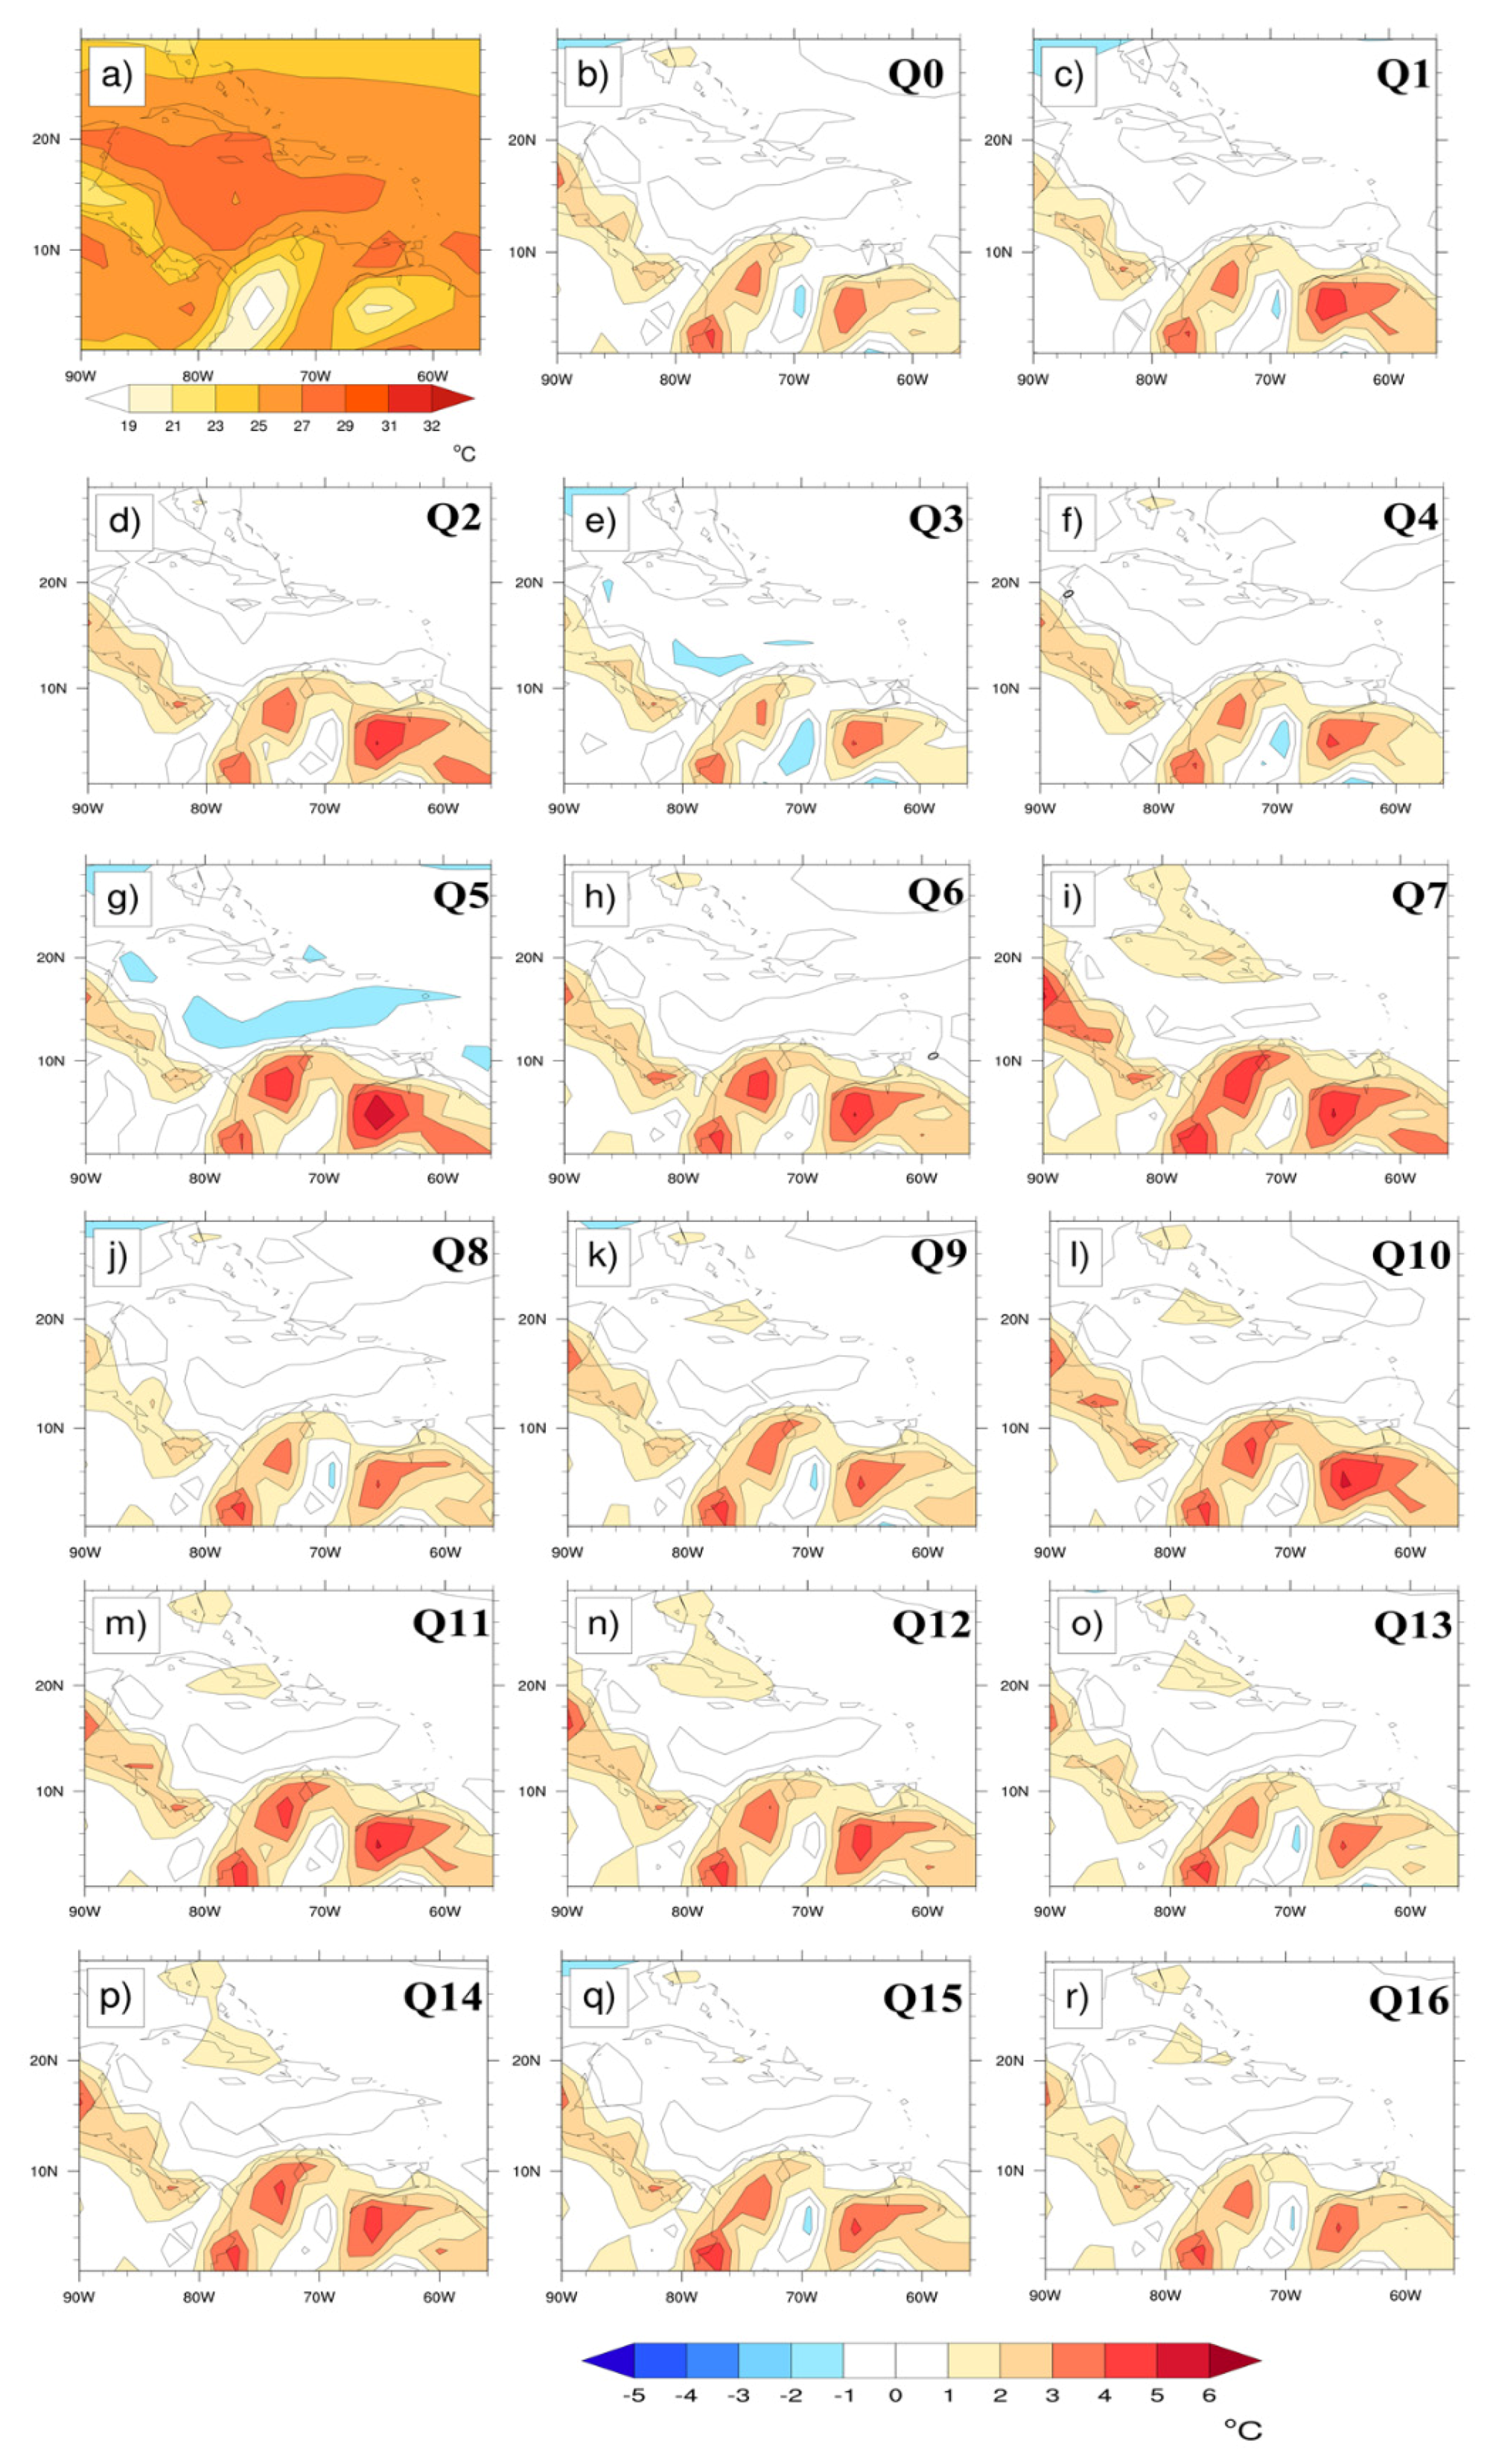
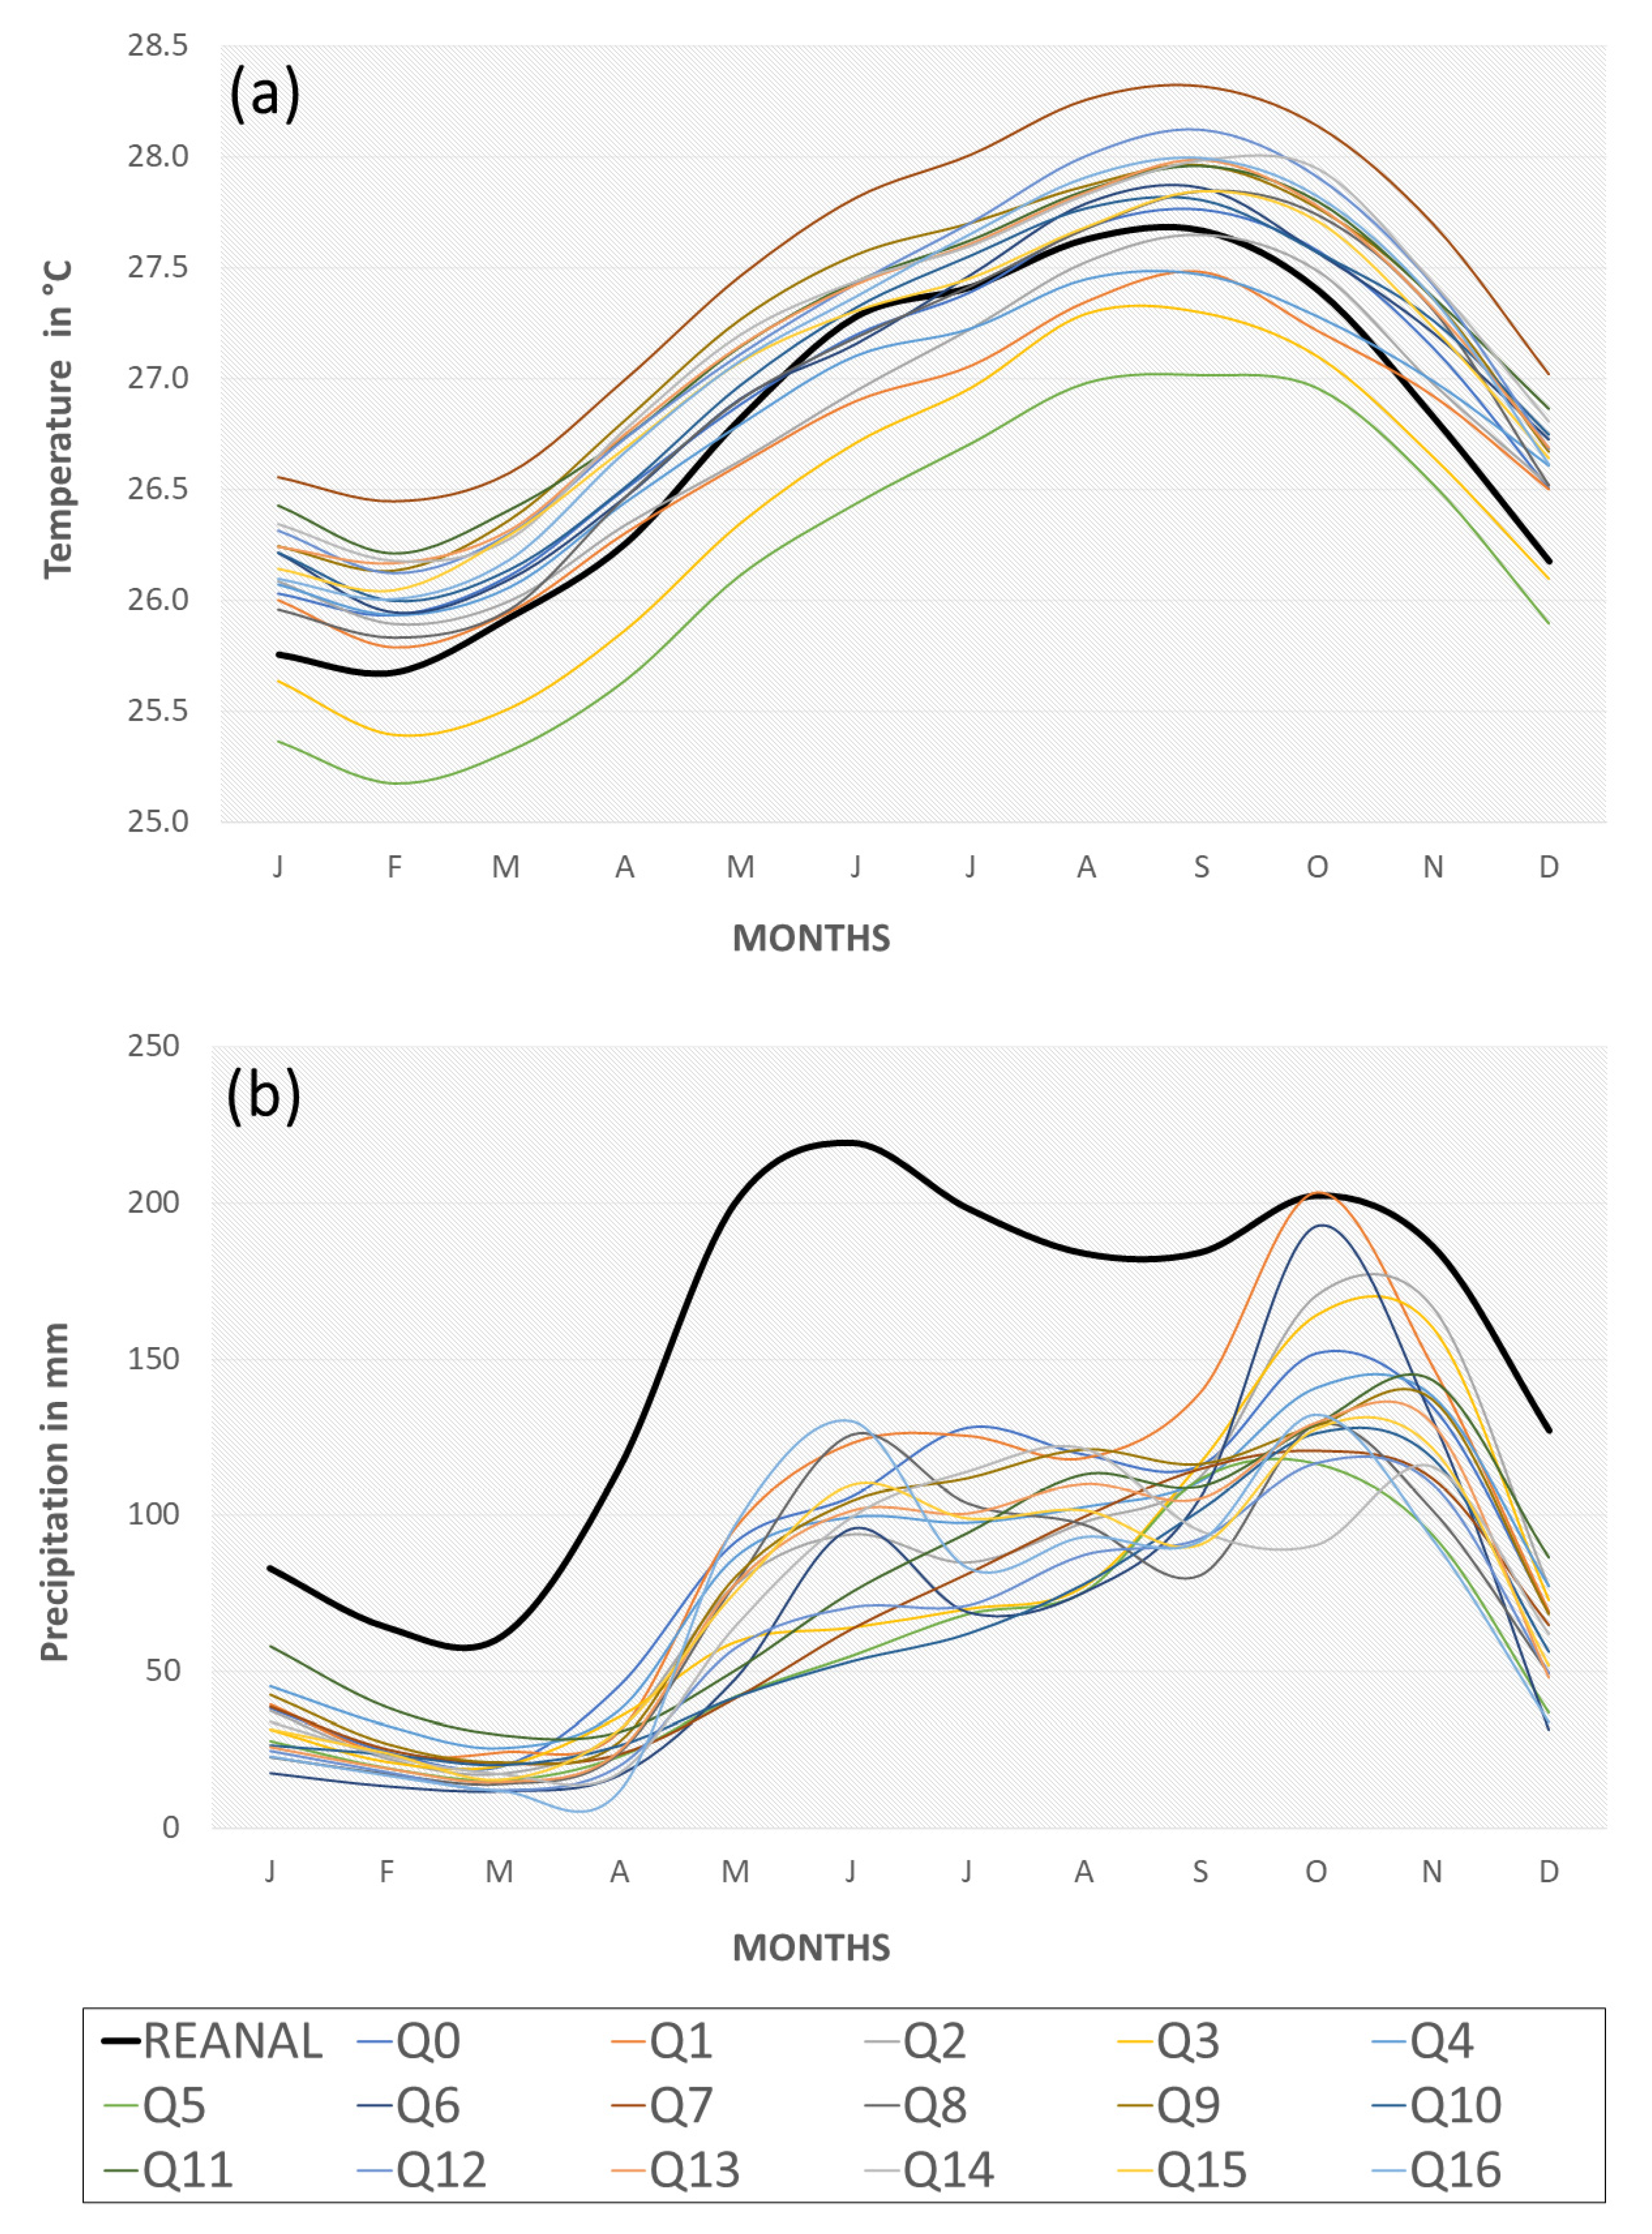
3.1.1. Temperature
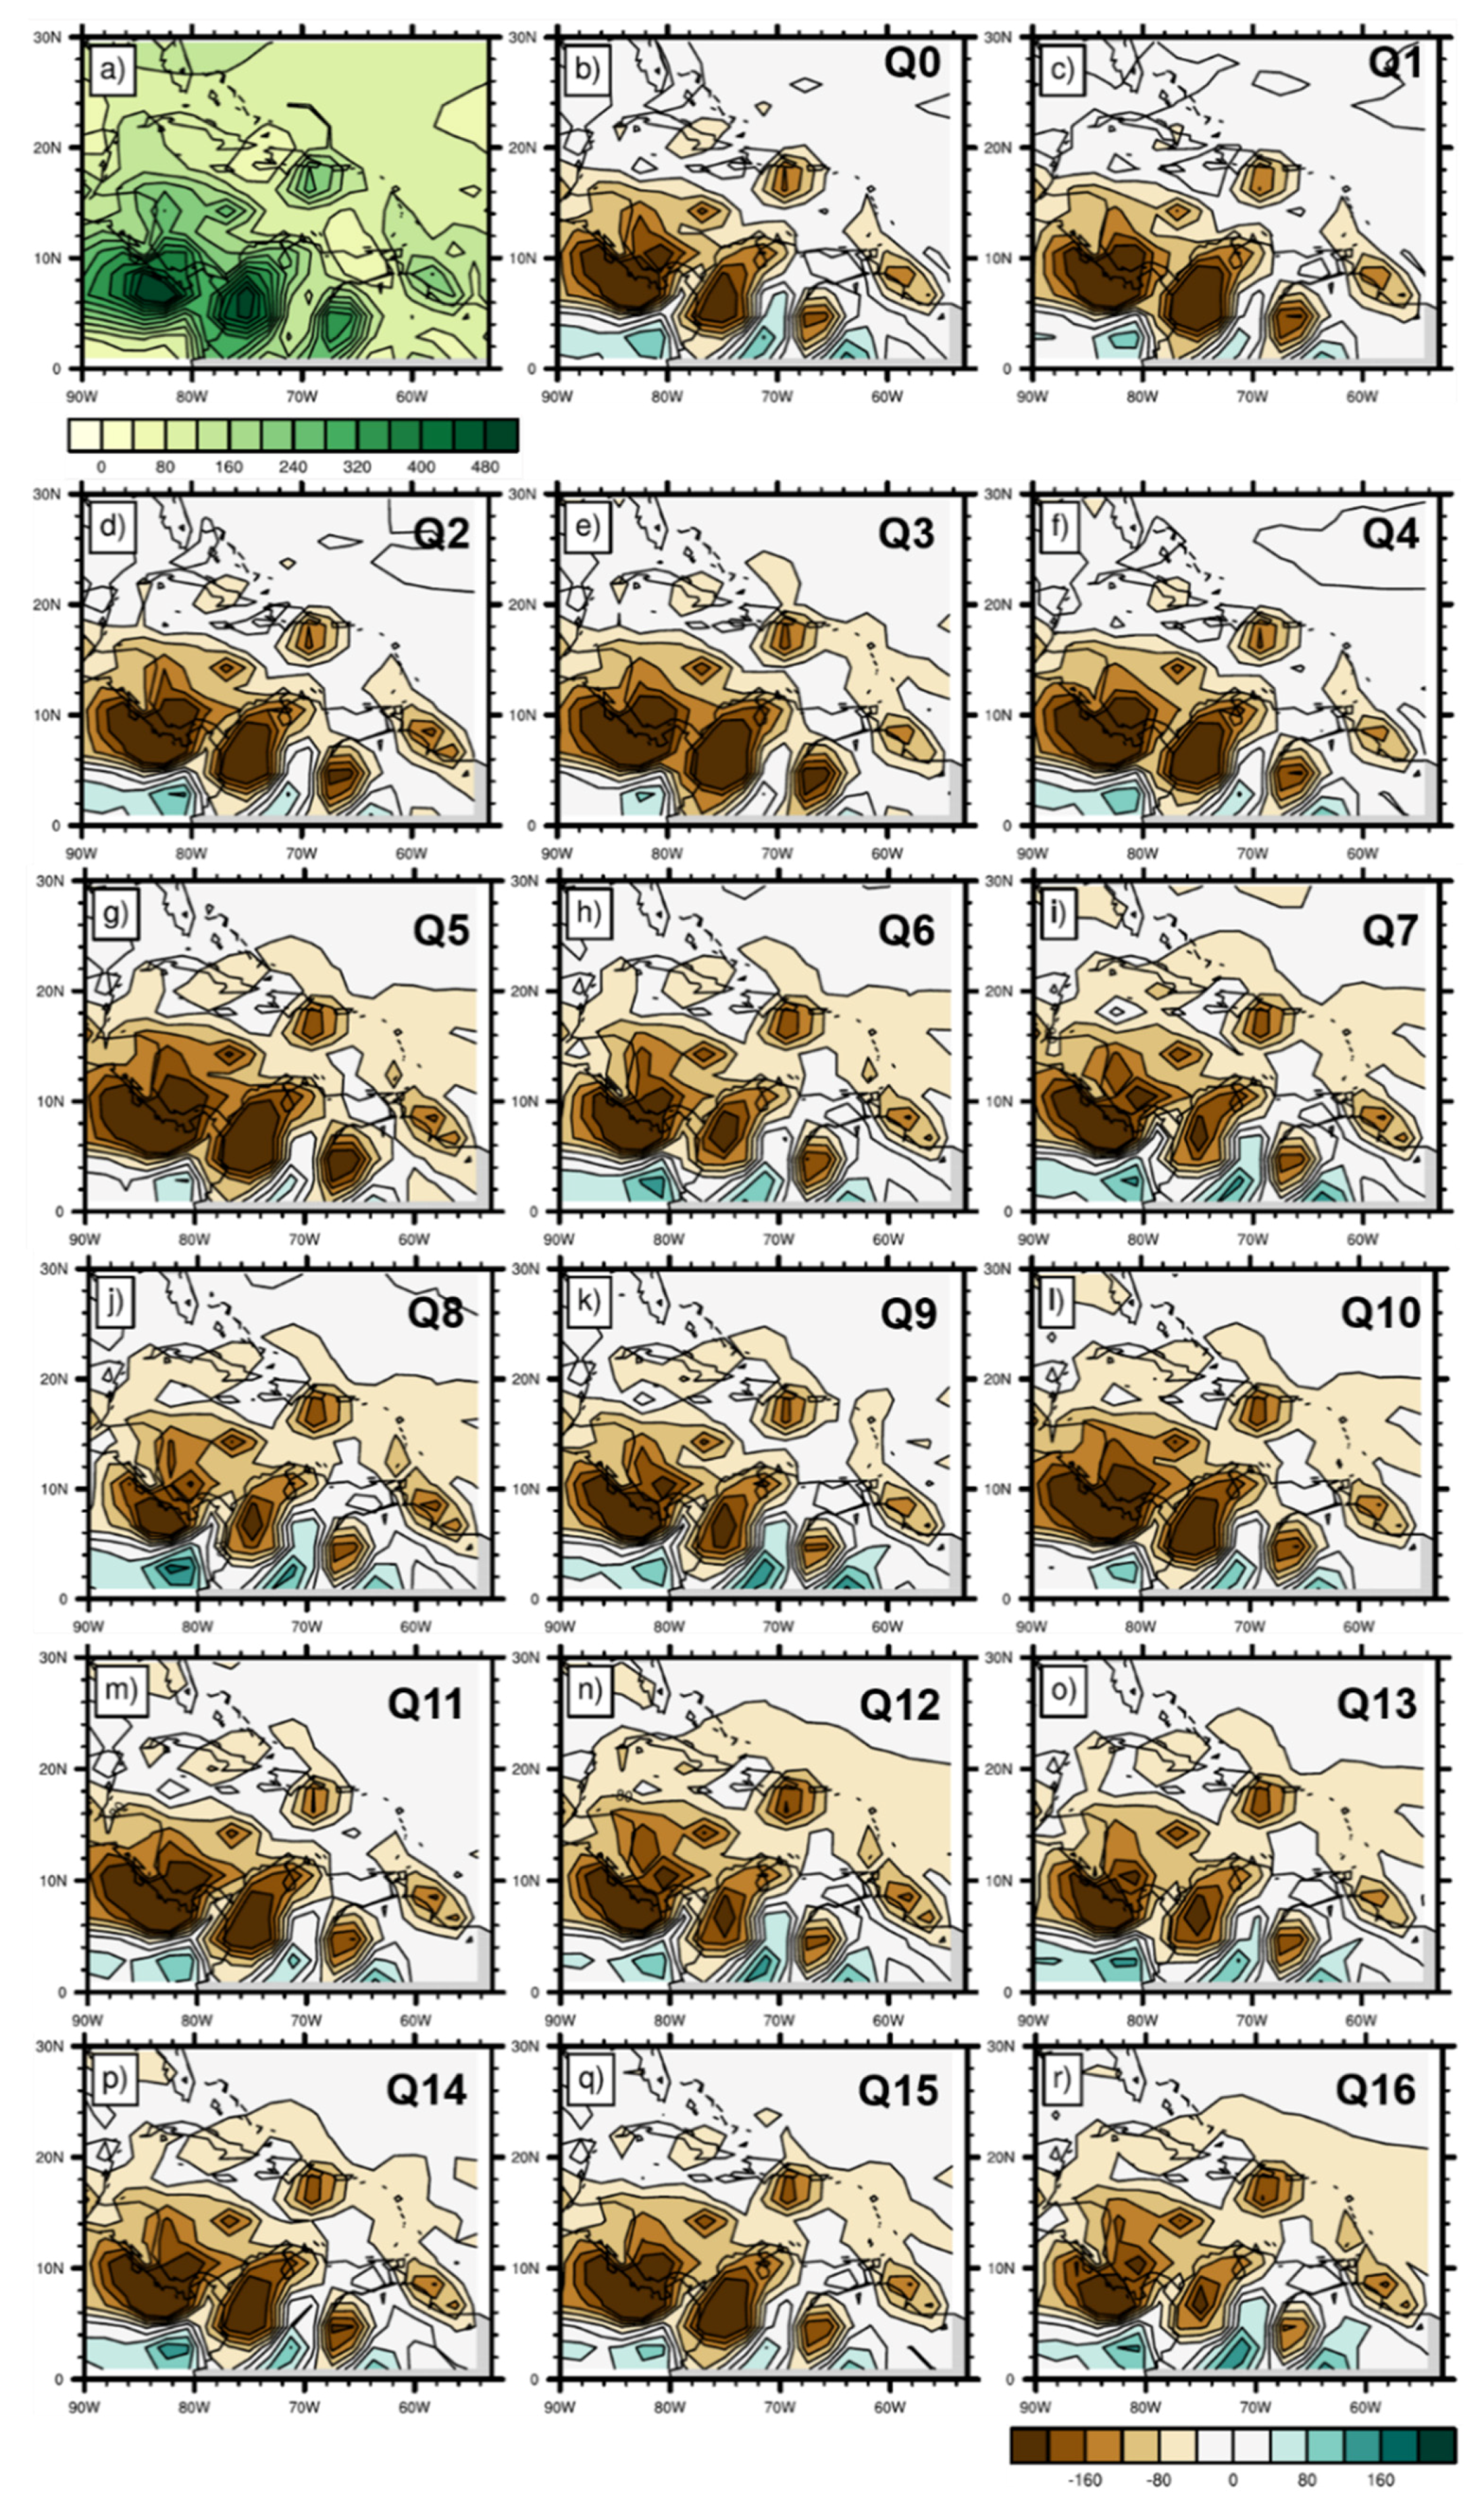
3.1.2. Rainfall
3.1.3. Six Ensemble Members
- The experiments chosen were premised on model performance in the main Caribbean basin.
- The unperturbed simulation Q0 was chosen, as recommended.
- Q5 and Q7 were eliminated as they consistently featured amongst simulations with extreme patterns over the Caribbean. For example, Q5 was amongst the coolest simulations relative to the reference dataset (Figure 2) and also amongst the driest (Figure 5). Q7 had a significant warm bias in the northwest Caribbean in the annual pattern (Figure 2) and during MJJ (not shown) and was among the set of experiments that produced a dry bias across much of the Caribbean and into the tropical Atlantic east of the Antilles in ASO (not shown).
- An attempt was made to still account for the tendencies captured by Q5 and Q7 so that the final sampling would be representative of the spread of the full ensemble. In that regard, Q3, which has a similar cool-dry characteristic to Q5 (Figure 2 and Figure 4), was selected, as was Q14, which captured some of the warmer and drier late rainfall season tendencies of Q7 (not shown).
- The best attempt was made to sample across all remaining experiments such that a balance was achieved across the various annual and seasonal temperature and rainfall biases. Q10 was chosen as it was amongst the drier ensembles in the early rainfall season but did reasonably well in the late season. It was also representative of the subset of simulations that displayed a unimodal rainfall climatology which is characteristic of parts of the eastern Caribbean. Q11 and Q4 displayed varying tendencies cross the variables and seasons, but generally did not feature in any of the discussion on extreme conditions with respect to the Caribbean. They were therefore chosen as “middle of the road” experiments.
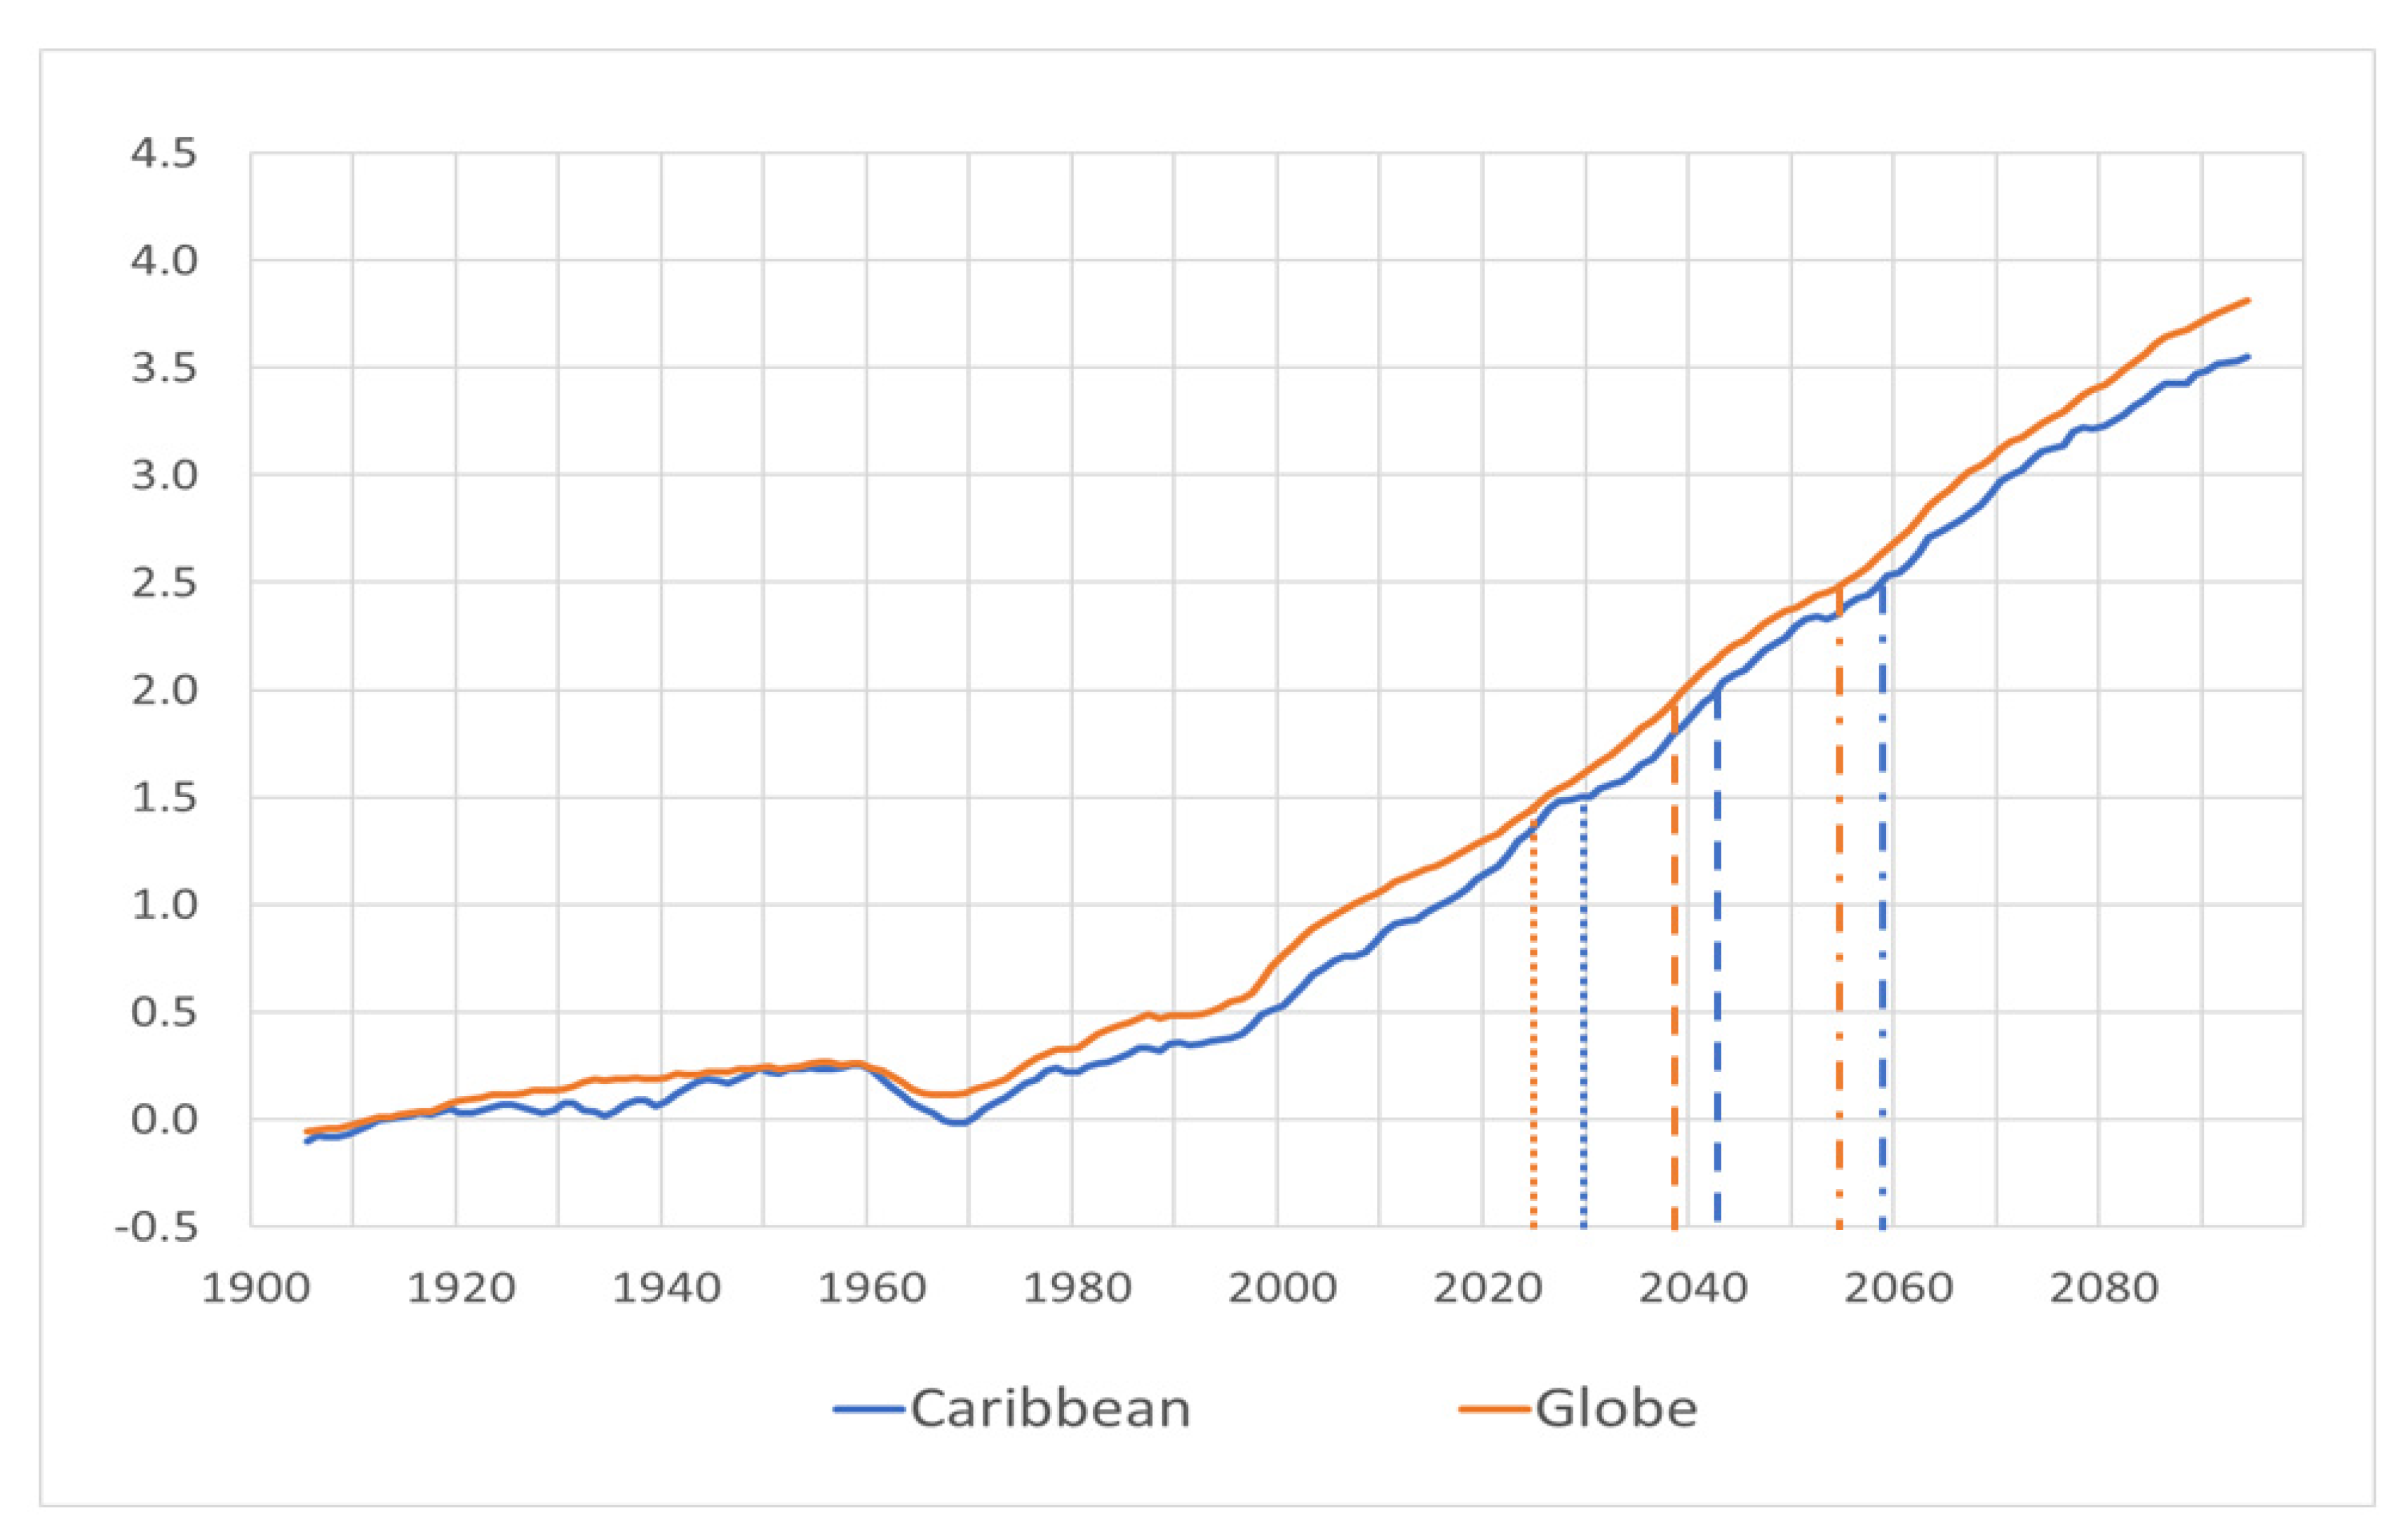
3.2. LTTG Attainment Dates
3.3. Downscaled Caribbean Projections at 1.5, 2.0, and 2.5 °C
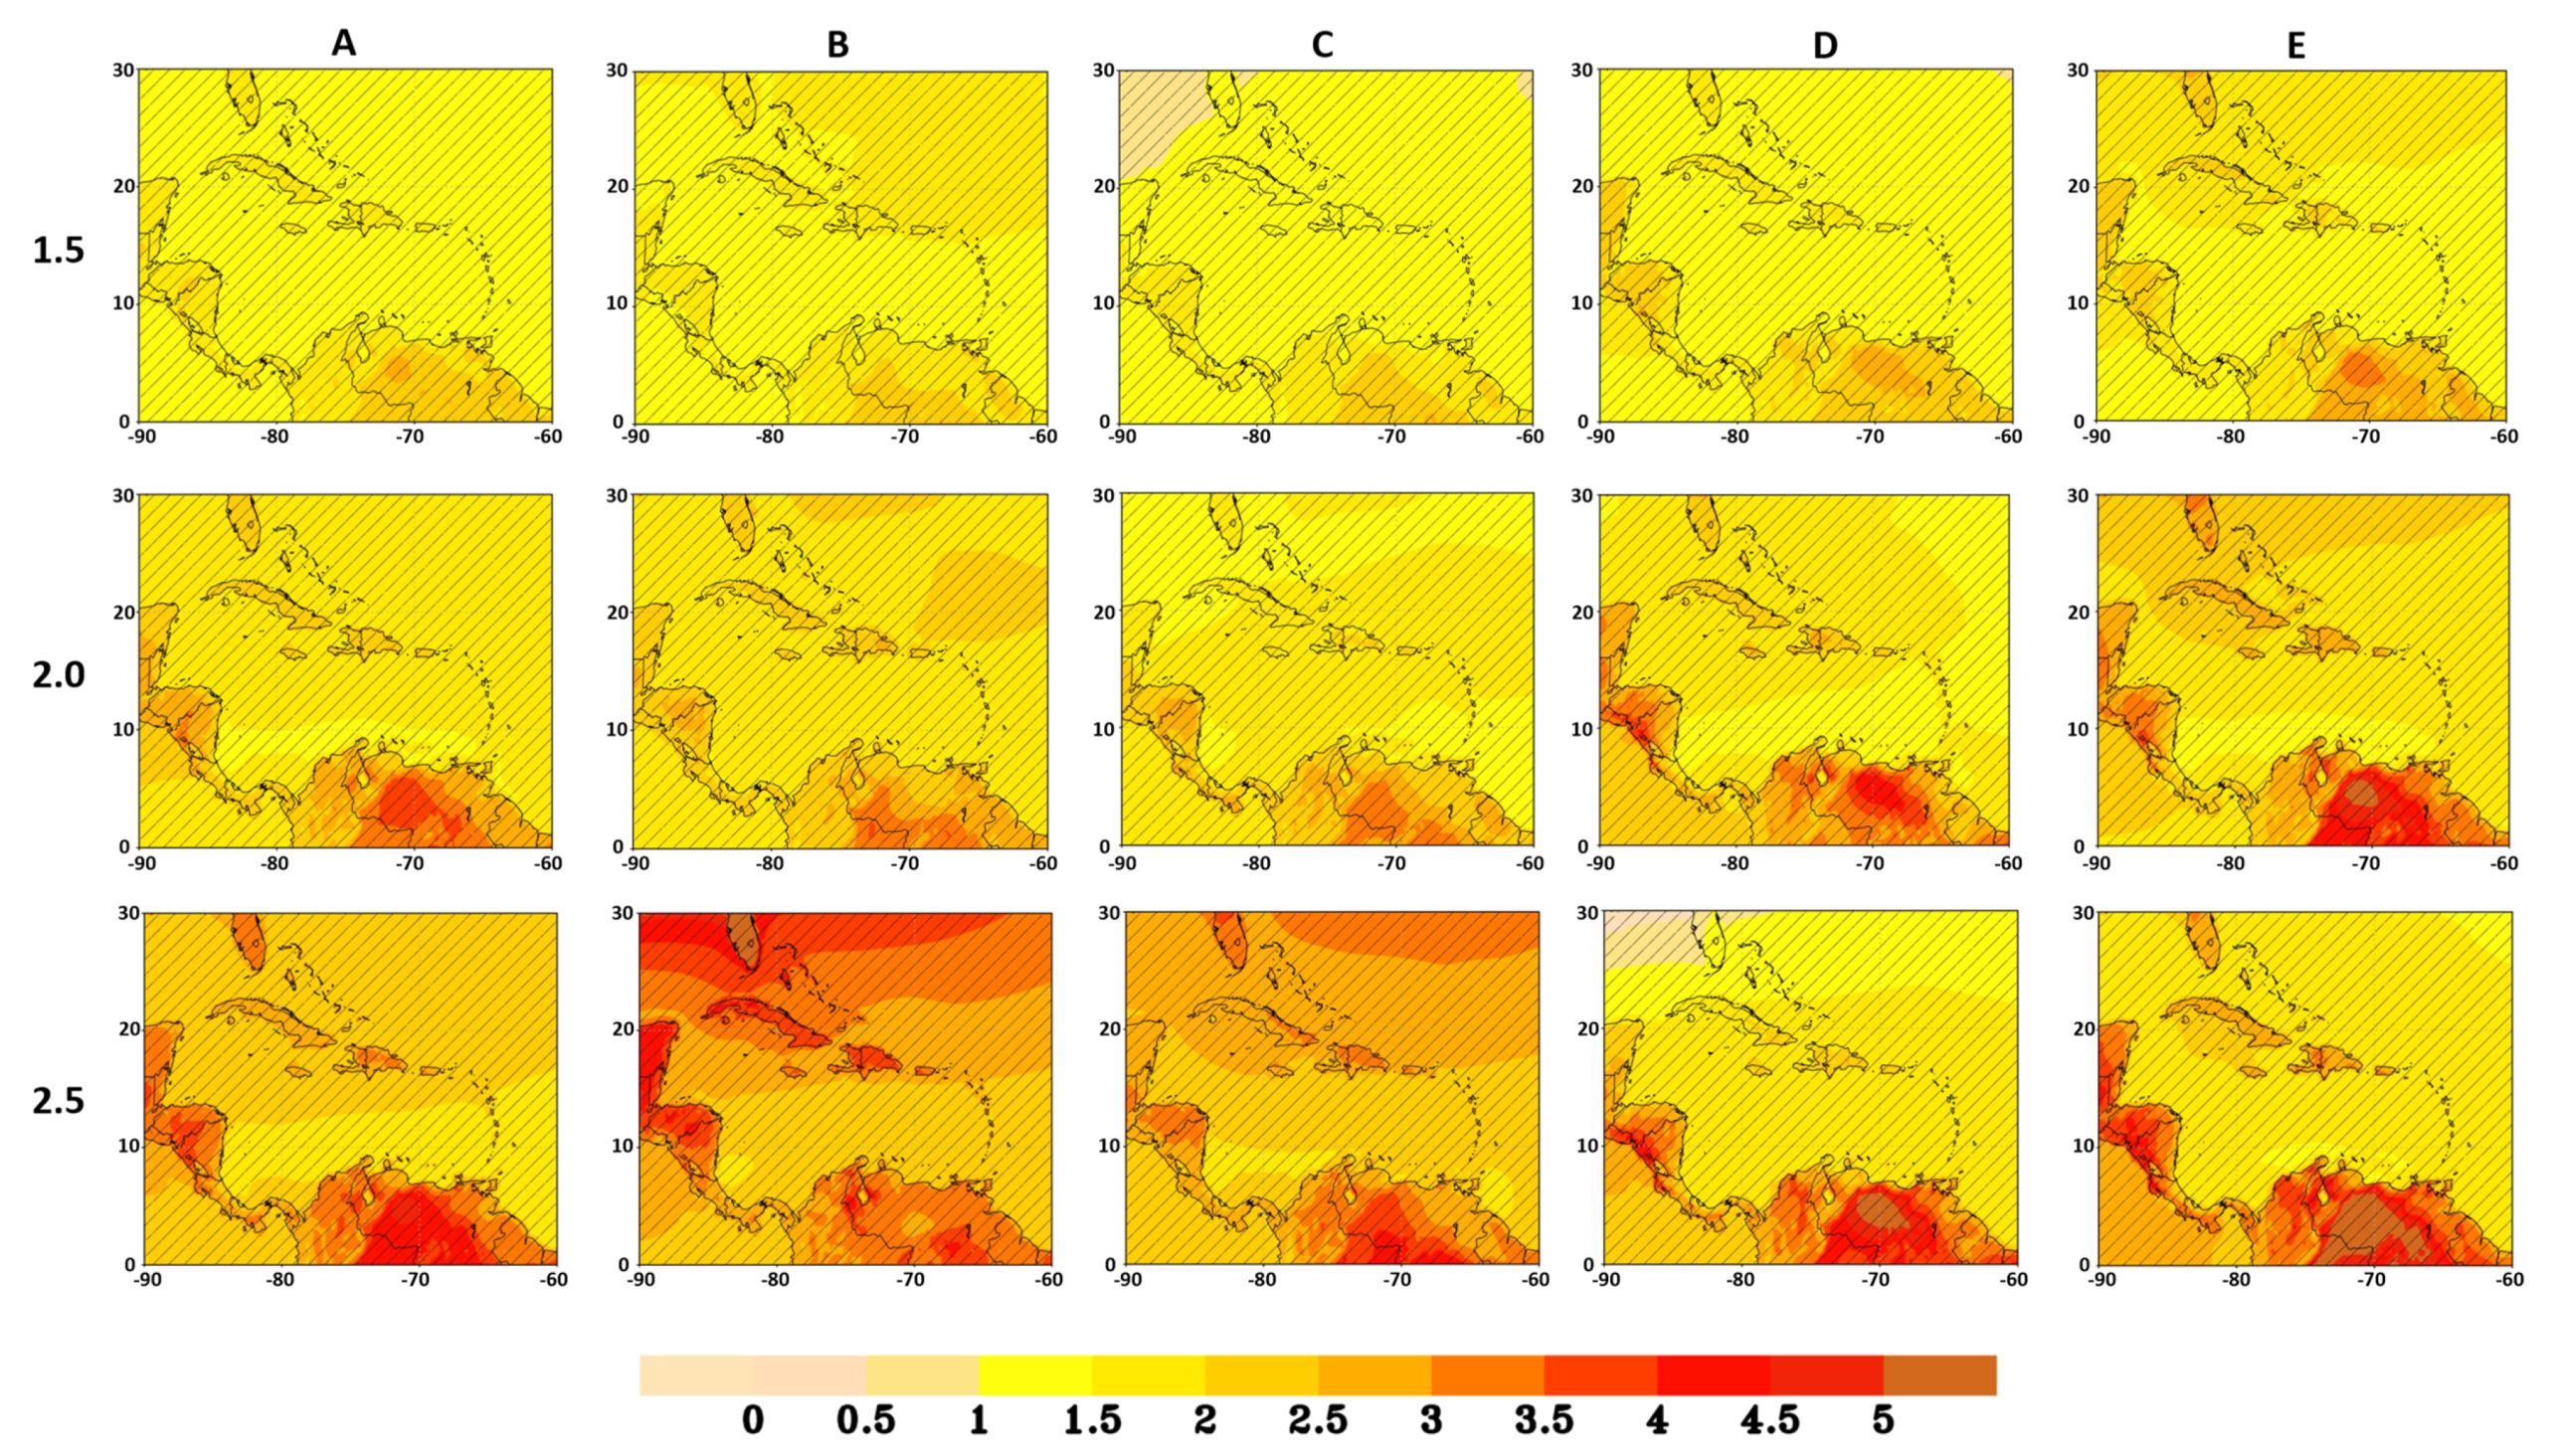
3.3.1. Temperature
- NDJ is dominated by north–south stratification in warming (column B). At 1.5 °C, whereas the south Caribbean Sea has a warm anomaly of 1 °C, above 18° N, it is 1.5 °C, including the panhandle of Florida. Further stratification, particularly at 2.5 °C, means that at higher global warming targets, the coolest parts of the domain in the far north will warm more than the normally warmer parts of the South Caribbean Sea in NDJ.
- The pattern seen in NDJ is generally mimicked in ASO (column E), with largest warming in the northwest at 1.5 °C. Warming extends southward at the higher LTTGs, with a warm anomaly of 1.5 °C engulfing the entire region at LTTG 2.5 °C. Land masses are always warmer than the surrounding ocean.
- In FMA, the warm anomaly across the Caribbean Sea is 1.0 °C at LTTG 1.5 °C, increasing to 1.5 °C from eastern Cuba to the lesser Antilles and southward to South America at 2.0 °C. Interestingly, the far northwest of the domain is cooler than the south Caribbean Sea for 2.0 °C, which is a reversal of what is seen in ASO. At 2.5 °C, there is again stratification with the north warmer than the south, as is seen in NDJ.
- In MJJ, the Caribbean Sea has a warm anomaly of 1.0 °C at LTTG 1.5 °C. This increases to 2.0 °C over the northwest of the domain and over the island chain at LTTG of 2.0 °C. The region generally maintains this magnitude warming at the highest global warming target. The exception is in the western Caribbean (Belize), which warms slightly more at 2.5 °C.
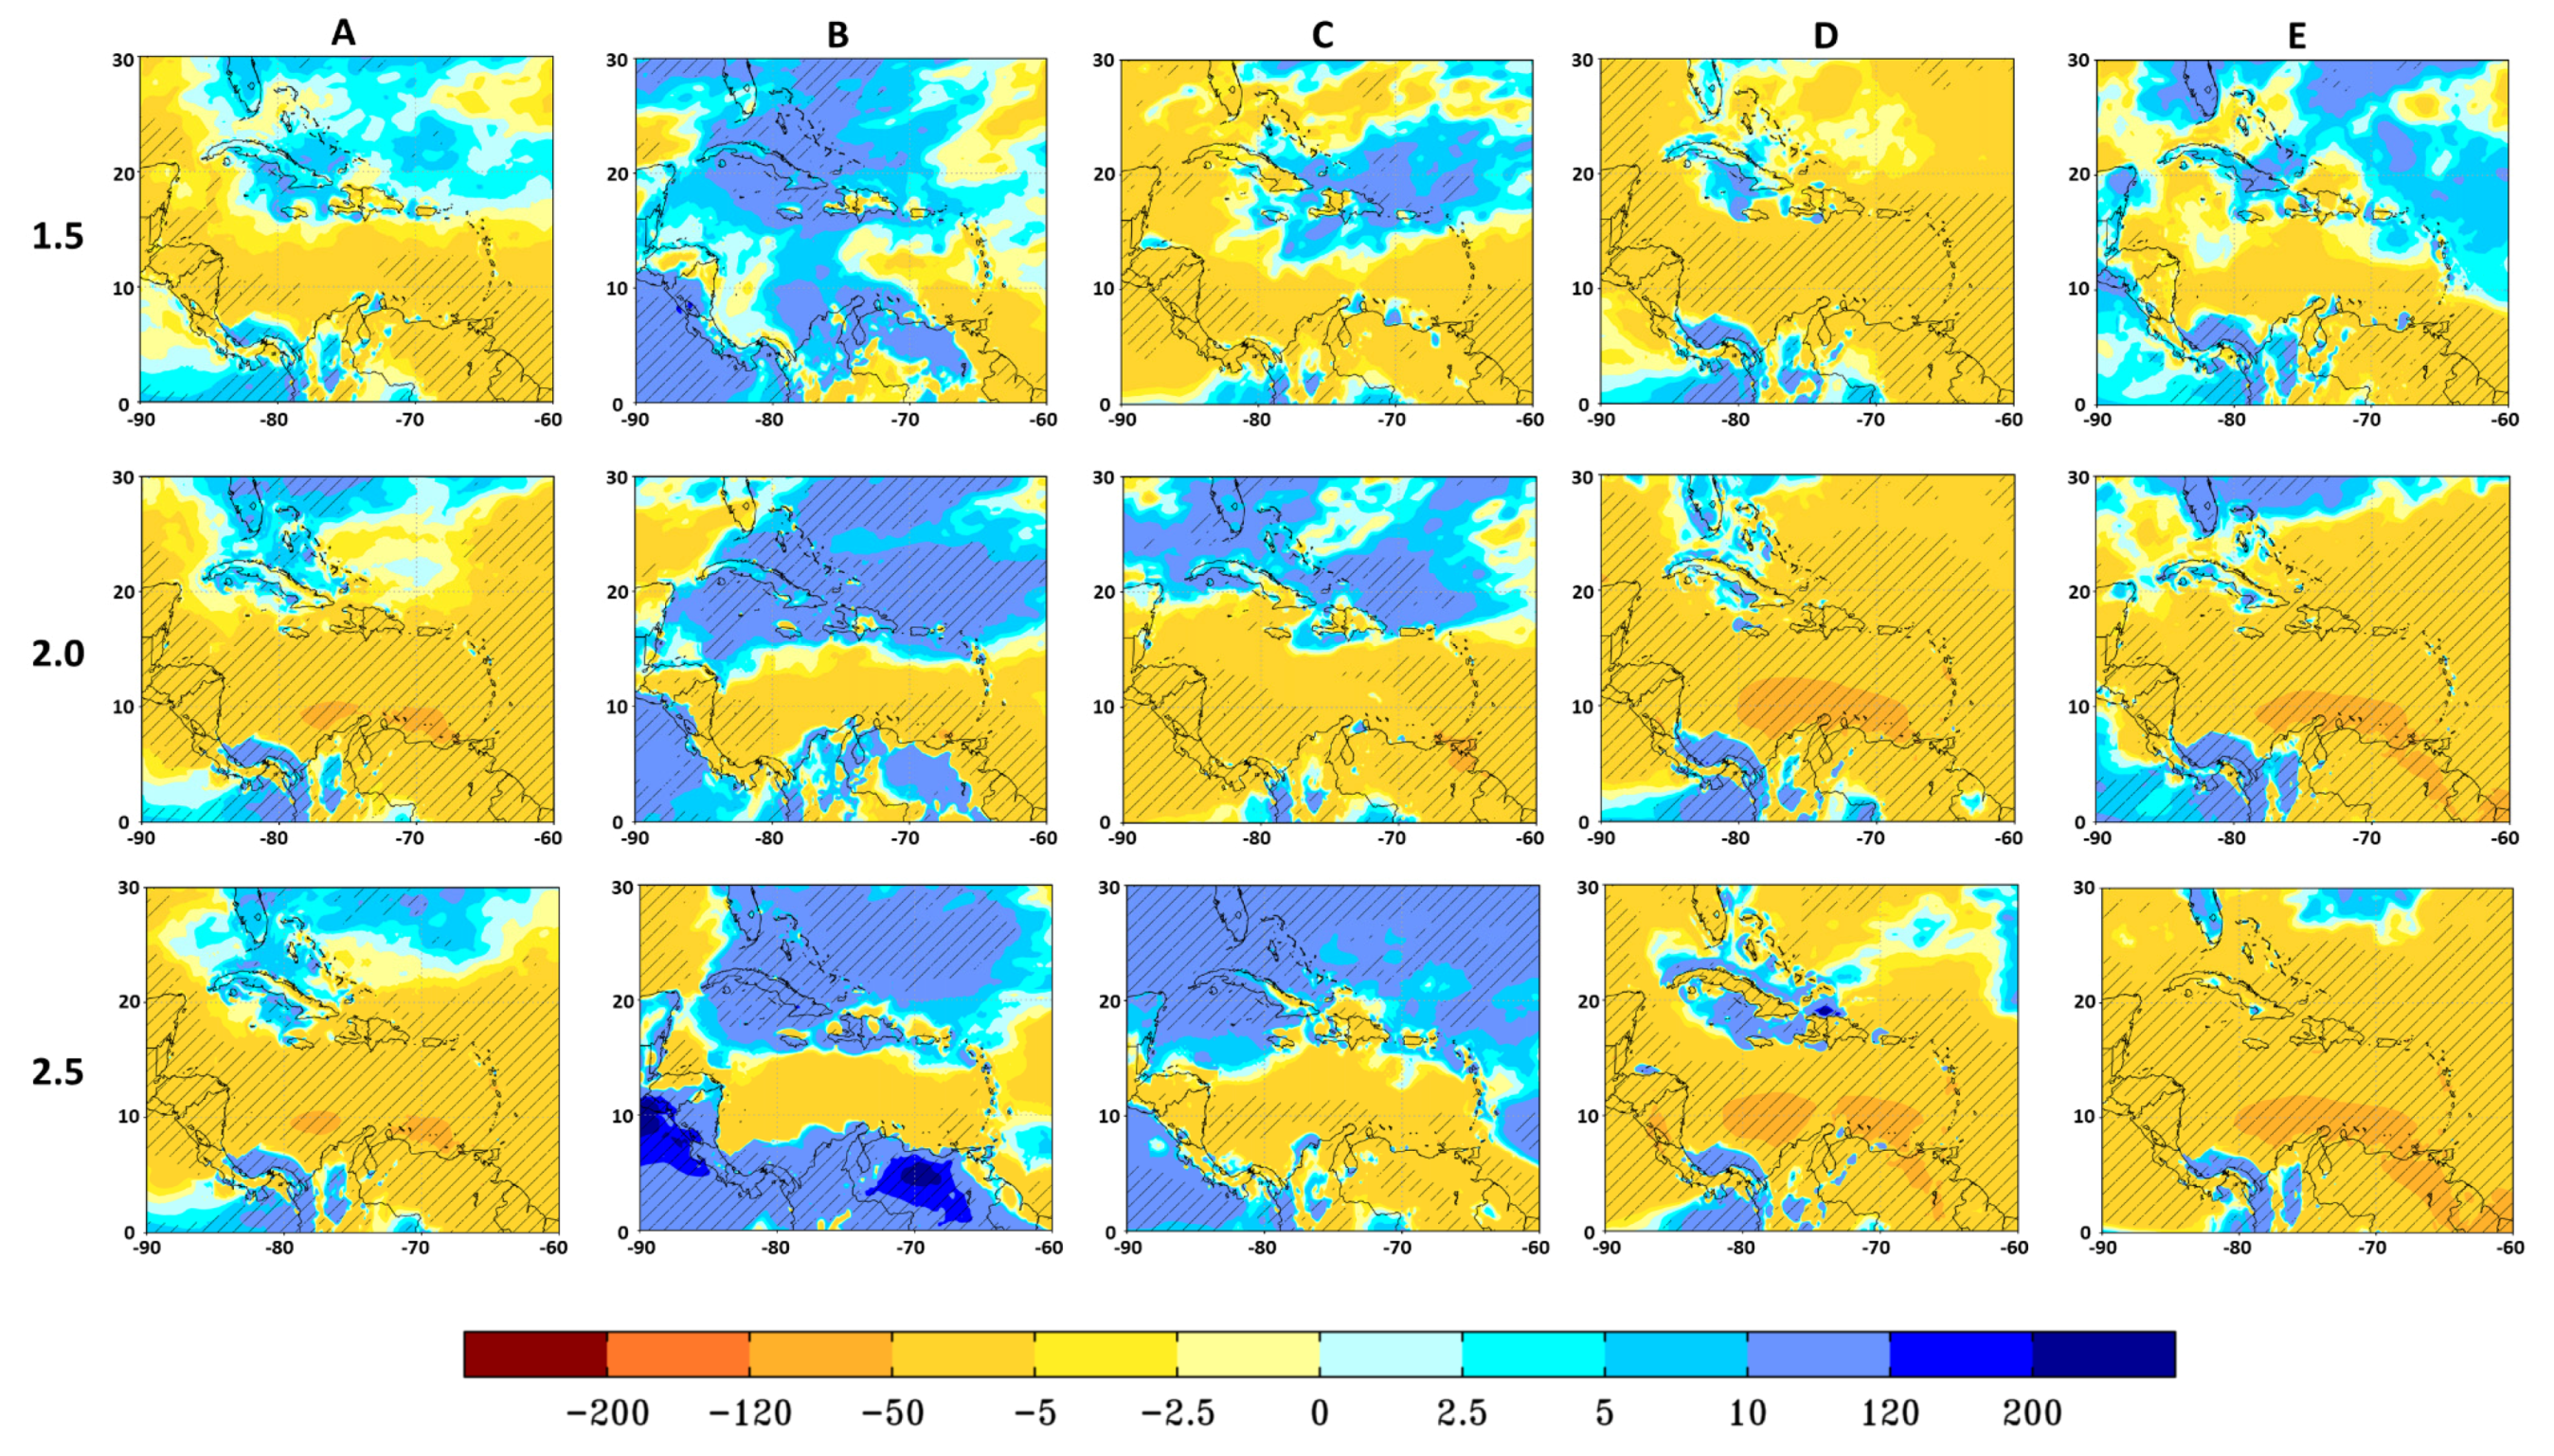
3.3.2. Rainfall
- In NDJ (column B), at 1.5 °C, most of the islands of the Caribbean are projected to be 5–50% wetter, except in the vicinity of Trinidad and Tobago and the northern parts of Guyana and Suriname, which are projected to be 5–10% drier. Only changes in the northwest are statistically significant. At 2.0 and 2.5 °C, the dry anomalies in the southeastern Caribbean extend westward to cover the south Caribbean Sea. Notwithstanding that the north Caribbean region has wet anomalies even at the higher warming targets, the magnitude of the change seen may not be sufficient to offset the drying associated with the two wet seasons.
- In FMA (column C), irrespective of global warming threshold, all the land masses in the domain (except western Cuba and the Bahamas at the higher two LTTGs) generally show a drying tendency (between 5% and 50%), with largest percentage drying in the southern Lesser Antilles and over the continental land masses. The drying is generally of the same magnitude, with little evidence of intensification for higher warming targets. In contrast, the ocean in the northeast of the domain is projected to be wetter at 1.5 °C, with the region of wet anomalies intensifying and covering much of the northwest Caribbean at 2.0 and 2.5 °C. Panama and the surrounding Caribbean Sea show a drying tendency for all three warming targets.
- The MJJ patterns (column D) largely mirror the annual maps. The Caribbean region south of 18° N is projected to be drier than baseline, with a westward spreading of drying from the south-eastern Caribbean into the eastern Caribbean Sea as well as from the southwest Caribbean Sea northward for progressively higher global warming targets. Panama in contrast is wetter than baseline for all three temperature targets. There is a reversal in signal over Cuba, i.e., from a weak wet tendency at 1.5 °C (not statistically significant) to statistically significant drying at 2.0 and 2.5 °C.
- Changes in ASO (column E) show for successively higher global warming targets a northward spreading of the region of maximum drying from the southeast Caribbean Sea to cover the entire Caribbean, including Bahamas in the north at LTTG 2.5 °C. The drying is statistically significant over much of the domain for the two higher LTTGs.
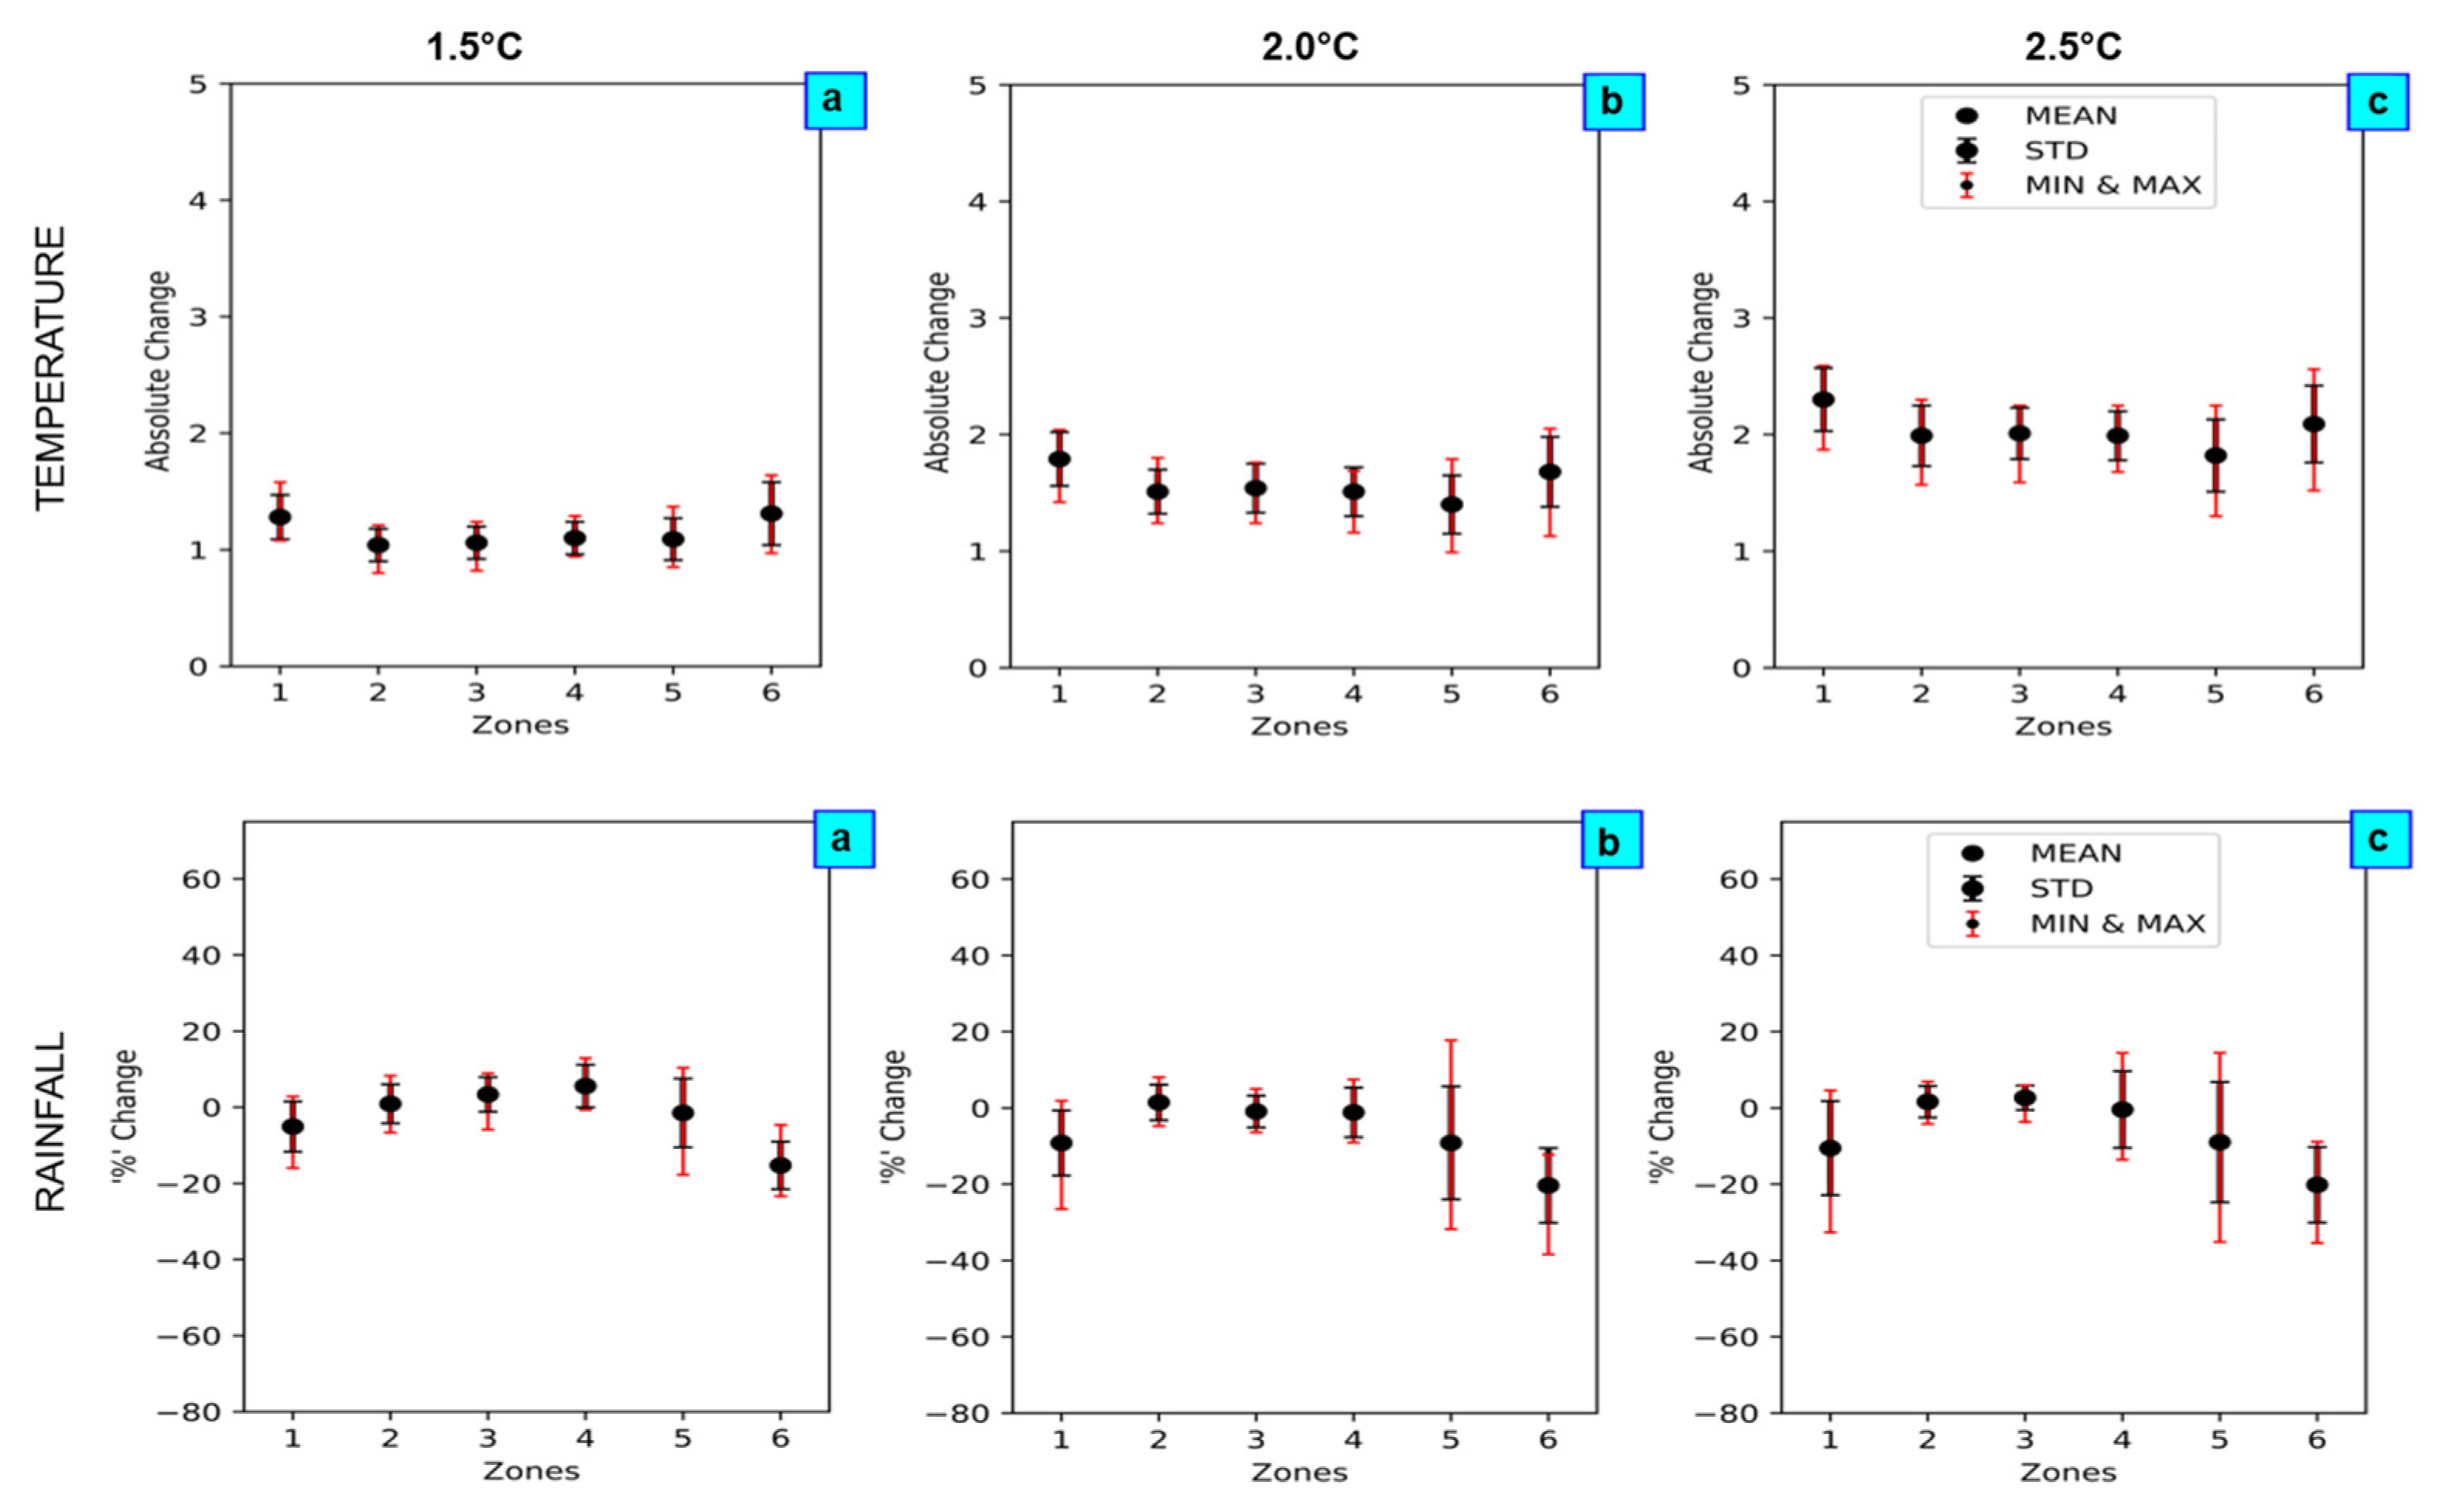
- For zones 1 and 6, irrespective of the LTTG, the ensemble mean indicates drying. This is also true for all seasons except in FMA for zone 1 at 1.5 °C (not shown). The annual mean is 16% (5%) drier than the current-day baseline for zone 6 (zone 1) at 1.5 °C, and 20% (9%) at 2.0 °C. The extent of drying then remains fairly constant at 20% (10%) for the further half a degree of global warming to 2.5 °C. That is, there is a larger reduction in rainfall for Belize, Guyana, and Suriname for the half a degree transition to 2.0 °C than for the further half a degree change from 2.0 to 2.5 °C. Zone 6 consistently shows largest drying and there is a consensus in sign across ensemble maximum and minimum. The southeastern Caribbean seems most impacted for higher degrees of global warming.
- Projected changes in zone 5 are not dissimilar to those for zone 6, again suggesting that the eastern and south-eastern Caribbean display a sensitivity and tendency to dry first (compared to the north and north-western Caribbean) in the face of global warming. The ensemble mean suggests that zone 5 is 1.6% drier than the current-day baseline at 1.5 °C, increasing to 9% at 2.0 and at 2.5 °C. It is again noted that 1.5 °C seems to represent a threshold in the east and south-eastern Caribbean, above which there is significant further drying for the next half a degree of global warming. Thereafter, however, the extent of drying in comparison to the baseline remains fairly constant for further comparable global warming.
- Seasonal analysis (not shown) for zones 3 and 4 both show a reversal of tendency from slightly wet in ASO at 1.5 °C to considerably drier (6% and 11%, respectively) at 2.0 °C and even further drying (7% and 19%, respectively) at 2.5 °C (in fact, we note that for the peak rainy season, ASO, generally all zones increasingly dry between LTTGs 1.5 and 2.5 °C). For zones 3 and 4, all other seasons have a wet tendency for all LTTGs, which is however not sufficient to offset the significant drying in the wet seasons at 2.0 °C. Consequently, the mean annual rainfall shows slight reductions at 2.0 °C. Again, 1.5 °C seems to indicate a threshold for change, in this case a reversal of tendency for zones 3 and 4. At 2.5 °C, however, whereas the annual mean indicates slight drying for zone 3, it indicates slight wetting for zone 4.
- Zone 2 (western Cuba) is projected to always be negligibly wetter in the annual for all three global warming targets. There is no intensification of the wet tendency, however, for successively higher global warming targets. Except for zone 2, then, all other zones become drier in the annual for the half a degree global warming from 1.5 to 2.0 °C.
4. Discussion
5. Conclusion
- The Caribbean is right to advocate limiting global warming to 1.5 °C.
- The Caribbean must develop an ensemble of high-resolution simulations for use in climate change studies for the region.
Author Contributions
Funding
Institutional Review Board Statement
Informed Consent Statement
Data Availability Statement
Acknowledgments
Conflicts of Interest
References
- Sealey-Huggins, L. ‘1.5 °C to stay alive’: Climate change, imperialism and justice for the Caribbean. Third World Q. 2017, 38, 2444–2463. [Google Scholar] [CrossRef] [Green Version]
- Taylor, M.A.; Clarke, L.A.; Centella, A.; Bezanilla, A.; Stephenson, T.S.; Jones, J.J.; Campbell, J.D.; Vichot, A.; Charlery, J. Future Caribbean climates in a world of rising temperatures: The 1.5 vs 2.0 dilemma. J. Clim. 2018, 31, 2907–2926. [Google Scholar] [CrossRef]
- Mycoo, M.A. Beyond 1.5 °C: Vulnerabilities and adaptation strategies for Caribbean Small Island Developing States. Reg. Environ. Chang. 2018, 18, 2341–2353. [Google Scholar] [CrossRef] [Green Version]
- Benjamin, L.; Thomas, A. 1.5 to stay alive? AOSIS and the long term temperature goal in the Paris Agreement. SSRN Electron. J. 2016. [Google Scholar] [CrossRef]
- Donk, P.; Van Uytven, E.; Willems, P.; Taylor, M.A. Assessment of the potential implications of a 1.5 °C versus higher global temperature rise for the Afobaka hydropower scheme in Suriname. Reg. Environ. Chang. 2018, 18, 2283–2295. [Google Scholar] [CrossRef]
- Lallo, C.H.O.; Cohen, J.; Rankine, D.; Taylor, M.A.; Campbell, J.; Stephenson, T. Characterizing heat stress on livestock using the temperature humidity index (THI)—Prospects for a warmer Caribbean. Reg. Environ. Chang. 2018, 18, 2329–2340. [Google Scholar] [CrossRef] [Green Version]
- UNFCCC Report. In Proceedings of the Parties on Its Twenty-First Session, Paris, France, 30 November–13 December 2015.
- Intergovernmental Panel on Climate Change (IPCC). Global Warming of 1.5 °C.An IPCC Special Report on the Impacts of Global Warming of 1.5 °C above Pre-Industrial Levels and Related Global Greenhouse Gas Emission Pathways, in the Context of Strengthening the Global Response to the Threat of Climate Change; Masson-Delmotte, V., Zhai, P., Pörtner, H.-O., Roberts, D., Skea, J., Shukla, P.R., Pirani, A., Moufouma-Okia, W., Péan, C., Pidcock, R., et al., Eds.; World Meteorological Organization: Geneva, Switzerland, 2018. [Google Scholar]
- Karmalkar, A.V.; Taylor, M.A.; Campbell, J.; Stephenson, T.; New, M.; Centella, A.; Benzanilla, A.; Charlery, J.A. Review of observed and projected changes in climate for the islands in the Caribbean. Atmosfera 2013, 26, 283–309. [Google Scholar] [CrossRef] [Green Version]
- Hall, T.C.; Sealy, A.M.; Stephenson, T.S.; Kusunoki, S.; Taylor, M.A.; Chen, A.A.; Kitoh, A. Future climate of the Caribbean from a super-high-resolution atmospheric general circulation model. Theor. Appl. Climatol. 2013, 113, 271–287. [Google Scholar] [CrossRef]
- Campbell, J.D.; Taylor, M.A.; Stephenson, T.S.; Watson, R.A.; Whyte, F.S. Future climate of the Caribbean from a regional climate model. Int. J. Climatol. 2011, 31, 1866–1878. [Google Scholar] [CrossRef]
- Emanuel, K.A. Climate and tropical cyclone activity: A new model downscaling approach. J. Clim. 2006, 19, 4797–4802. [Google Scholar] [CrossRef]
- Bender, M.A.; Knutson, T.R.; Tuleya, R.E.; Sirutis, J.J.; Vecchi, G.a.; Garner, S.T.; Held, I.M. Modeled impact of anthropogenic warming on the frequency of intense Atlantic hurricanes. Science 2010, 327, 454–458. [Google Scholar] [CrossRef] [PubMed] [Green Version]
- Knutson, T.R.; McBride, J.L.; Chan, J.; Emanuel, K.; Holland, G.; Landsea, C.; Held, I.; Kossin, J.P.; Srivastava, K.; Sugi, M. Tropical cyclones and climate change. Nat. Geosci. 2010, 3, 157–163. [Google Scholar] [CrossRef] [Green Version]
- Perrette, M.; Landerer, F.; Riva, R.; Frieler, K.; Meinshausen, M. A Scaling approach to project regional sea level rise and its uncertainties. Earth Syst. Dyn. 2013, 4, 11–29. [Google Scholar] [CrossRef] [Green Version]
- Horton, R.M.; Herweijer, C.; Rosenzweig, C.; Liu, J.; Gornitz, V.; Ruane, A.C. Sea level rise projections for current generation CGCMs based on the semi-empirical method. Geophys. Res. Lett. 2008, 35, 1–5. [Google Scholar] [CrossRef]
- Jones, P.D.; Harpham, C.; Burton, A.; Goodess, C.M. Downscaling regional climate model outputs for the Caribbean using a weather generator. Int. J. Climatol. 2016, 36, 4141–4163. [Google Scholar] [CrossRef] [Green Version]
- Antuña-Marrero, J.C.; Otterå, O.H.; Robock, A.; Mesquita, M.D.S. Modelled and observed sea surface temperature trends for the Caribbean and Antilles. Int. J. Climatol. 2016, 36, 1873–1886. [Google Scholar] [CrossRef]
- Glenn, E.; Comarazamy, D.; González, J.E.; Smith, T. Detection of recent regional sea surface temperature warming in the Caribbean and surrounding region. Geophys. Res. Lett. 2015, 42, 6785–6792. [Google Scholar] [CrossRef]
- Stephenson, T.S.; Vincent, L.A.; Allen, T.; Van Meerbeeck, C.J.; Mclean, N.; Peterson, T.C.; Taylor, M.A.; Aaron-Morrison, A.P.; Auguste, T.; Bernard, D.; et al. Changes in extreme temperature and precipitation in the Caribbean region, 1961–2010. Int. J. Climatol. 2014, 34, 2957–2971. [Google Scholar] [CrossRef]
- Alexander, L.V.; Zhang, X.; Peterson, T.C.; Caesar, J.; Gleason, B.; Klein Tank, A.M.G.; Haylock, M.; Collins, D.; Trewin, B.; Rahimzadeh, F.; et al. Global observed changes in daily climate extremes of temperature and precipitation. J. Geophys. Res. 2006, 111, D05109. [Google Scholar] [CrossRef] [Green Version]
- McSweeney, C.; New, M.; Lizcano, G.; Lu, X. The UNDP climate change country profiles. Bull. Am. Meteorol. Soc. 2010, 91, 157–166. [Google Scholar] [CrossRef] [Green Version]
- Intergovernmental Panel on Climate Change (IPCC). Managing the Risks of Extreme Events and Disasters to Advance Climate Change Adaptation. a Special Report of Working Groups I and II of the Intergovernmental Panel on Climate Change; Field, C.B., Barros, V., Stocker, T.F., Qin, D., Dokken, D.J., Ebi, K.L., Mastrandrea, M.D., Mach, K.J., Plattner, G.-K., Allen, S.K., et al., Eds.; Cambridge University Press: Cambridge, UK; New York, NY, USA, 2012; ISBN 978-1-107-60780-4. [Google Scholar]
- Burgess, C.P.; Taylor, M.A.; Spencer, N.; Jones, J.; Stephenson, T.S. Estimating damages from climate-related natural disasters for the Caribbean at 1.5 °C and 2 °C global warming above preindustrial levels. Reg. Environ. Chang. 2018, 18, 2297–2312. [Google Scholar] [CrossRef]
- Pulwarty, R.S.; Nurse, L.A.; Trotz, U.O. Caribbean islands in a changing climate. Environ. Sci. Policy Sustain. Dev. 2010, 52, 16–27. [Google Scholar] [CrossRef]
- Herrera, D.A.; Ault, T. Insights from a new high-resolution drought atlas for the Caribbean spanning 1950–2016. J. Clim. 2017, 30, 7801–7825. [Google Scholar] [CrossRef]
- Herrera, D.A.; Ault, T.R.; Fasullo, J.T.; Coats, S.J.; Carrillo, C.M.; Cook, B.I.; Williams, A.P. Exacerbation of the 2013–2016 Pan-Caribbean drought by anthropogenic warming. Geophys. Res. Lett. 2018, 45, 10–619. [Google Scholar] [CrossRef] [PubMed] [Green Version]
- Palanisamy, H.; Becker, M.; Meyssignac, B.; Henry, O.; Cazenave, A. Regional sea level change and variability in the Caribbean sea since 1950. J. Geod. Sci. 2012, 2, 125–133. [Google Scholar] [CrossRef]
- Torres, R.R.; Tsimplis, M.N. Sea-level trends and interannual variability in the Caribbean Sea. J. Geophys. Res. Ocean. 2013, 118, 2934–2947. [Google Scholar] [CrossRef]
- Clarke, L.A.; Taylor, M.A.; Centella-Artola, A.; Williams, M.S.M.; Campbell, J.D.; Bezanilla-Morlot, A. Stephenson, T.S. The Caribbean and 1.5 °C: Is SRM an option? Atmosphere. in press.
- Vichot-Llano, A.; Martinez-Castro, D.; Bezanilla-Morlot, A.; Centella-Artola, A.; Giorgi, F. Projected changes in precipitation and temperature regimes and extremes over the Caribbean and central America using a multiparameter ensemble of RegCM4. Int. J. Climatol. 2021, 41, 1328–1350. [Google Scholar] [CrossRef]
- Huntingford, C.; Fisher, R.A.; Mercado, L.; Booth, B.B.; Sitch, S.; Harris, P.P.; Cox, P.M.; Jones, C.D.; Betts, R.A.; Malhi, Y.; et al. Towards quantifying uncertainty in predictions of Amazon “dieback.”. Philos. Trans. R. Soc. B Biol. Sci. 2008, 363, 1857–1864. [Google Scholar] [CrossRef] [PubMed] [Green Version]
- Shiogama, H.; Watanabe, M.; Yoshimori, M.; Yokohata, T.; Ogura, T.; Annan, J.D.; Hargreaves, J.C.; Abe, M.; Kamae, Y.; O’ishi, R.; et al. Perturbed physics ensemble using the MIROC5 coupled atmosphere–ocean GCM without flux corrections: Experimental design and results. Clim. Dyn. 2012, 39, 3041–3056. [Google Scholar] [CrossRef] [Green Version]
- Wang, X.; Huang, G.; Baetz, B.W. Dynamically-downscaled probabilistic projections of precipitation changes: A Canadian case study. Environ. Res. 2016, 148, 86–101. [Google Scholar] [CrossRef]
- Hemming, D.; Buontempo, C.; Burke, E.; Collins, M.; Kaye, N. How uncertain are climate model projections of water availability indicators across the Middle East? Philos. Trans. R. Soc. A Math. Phys. Eng. Sci. 2010, 368, 5117–5135. [Google Scholar] [CrossRef] [PubMed]
- Kulkarni, A.; Patwardhan, S.; Kumar, K.K.; Ashok, K.; Krishnan, R. Projected climate change in the hindu kush-himalayan region by using the high-resolution regional climate MODEL PRECIS. Mt. Res. Dev. 2013, 33, 142–151. [Google Scholar] [CrossRef]
- Buontempo, C.; Mathison, C.; Jones, R.; Williams, K.; Wang, C.; McSweeney, C. An ensemble climate projection for Africa. Clim. Dyn. 2015, 44, 2097–2118. [Google Scholar] [CrossRef] [Green Version]
- Raghavan, S.V.; Vu, M.T.; Liong, S.Y. Ensemble climate projections of mean and extreme rainfall over Vietnam. Glob. Planet. Chang. 2017, 148, 96–104. [Google Scholar] [CrossRef]
- Redmond, G.; Hodges, K.I.; Mcsweeney, C.; Jones, R.; Hein, D. Projected changes in tropical cyclones over Vietnam and the South China Sea using a 25 km regional climate model perturbed physics ensemble. Clim. Dyn. 2015, 45, 1983–2000. [Google Scholar] [CrossRef]
- Alves, L.M.; Marengo, J.A.; Fu, R.; Bombardi, R.J. Sensitivity of Amazon regional climate to deforestation. Am. J. Clim. Chang. 2017, 06, 75–98. [Google Scholar] [CrossRef] [Green Version]
- Krishna Kumar, K.; Patwardhan, S.K.; Kulkarni, A.; Kamala, K.; Koteswara Rao, K.; Jones, R. Simulated projections for summer monsoon climate over India by a high-resolution regional climate model (PRECIS). Curr. Sci. 2011, 101, 312–326. [Google Scholar]
- Rao, K.K.; Patwardhan, S.K.; Kulkarni, A.; Kamala, K.; Sabade, S.S.; Kumar, K.K. Projected changes in mean and extreme precipitation indices over India using PRECIS. Glob. Planet. Chang. 2014, 113, 77–90. [Google Scholar] [CrossRef]
- Patwardhan, S.; Kulkarni, A.; Rao, K.K. Projected changes in rainfall and temperature over homogeneous regions of India. Theor. Appl. Climatol. 2018, 131, 581–592. [Google Scholar] [CrossRef]
- Climate Studies Group Mona (CSGM). The State of the Jamaican Climate 2015: Information for Resilience Building (Full Report); CSGM: Kingston, Jamaica, 2017; ISBN 978-976-8103-69-7. [Google Scholar]
- Stephenson, K.; Taylor, M.A.; Stephenson, T.S.; Centella, A.; Bezanilla, A.; Charlery, J. The regional climate science initiative: Value added and lessons learnt. Caribb. Q. 2018, 64, 11–25. [Google Scholar] [CrossRef]
- Jones, R.G.; Noguer, M.; Hassell, D.; Hudson, D.; Wilson, S.; Jenkins, G.; Mitchell, J. Generating High Resolution Climate Change Scenarios Using PRECIS; Met Office Hadley Centre: Exeter, UK, 2004. Available online: https://www.uncclearn.org/wp-content/uploads/library/undp17.pdf (accessed on 3 March 2021).
- Taylor, M.A.; Centella-Artola, A.; Charlery, J.; Forrajero, I.; Bezanilla, A.; Campbell, J.; Rivero, R.; Stephenson, T.; Whyte, F.; Watson, R. Glimpses of the Future: A Briefing from the PRECIS Caribbean Climate Change Project; Caribbean Community Secretariat: Georgetown, Guyana, 2007; ISBN 978 976-41-0212-2. [Google Scholar]
- Centella-Artola, A.; Taylor, M.A.; Bezanilla-Morlot, A.; Martinez-Castro, D.; Campbell, J.D.; Stephenson, T.S.; Vichot, A. Assessing the effect of domain size over the Caribbean region using the PRECIS regional climate model. Clim. Dyn. 2015, 44, 1901–1918. [Google Scholar] [CrossRef]
- Jones, R.G.; Noguer, M.; Hassell, D.; Hudson, D.; Wilson, S.; Jenkins, G.; Mitchell, J. Generating High Resolution Climate Change Scenarios Using PRECIS; UNDP: New York, NY, USA, 2003; Available online: https://unfccc.int/files/national_reports/non-annex_i_natcom/cge/application/pdf/precis_flyers_cop9_rcm.pdf (accessed on 3 March 2021).
- Stennett-Brown, R.K.; Jones, J.J.P.; Stephenson, T.S.; Taylor, M.A. Future Caribbean temperature and rainfall extremes from statistical downscaling. Int. J. Climatol. 2017, 37, 4828–4845. [Google Scholar] [CrossRef]
- Jury, M.R.; Malmgren, B.A.; Winter, A. Subregional precipitation climate of the Caribbean and relationships with ENSO and NAO. J. Geophys. Res. Atmos. 2007, 112, 1–10. [Google Scholar] [CrossRef]
- Jury, M.R. An interdecadal American rainfall mode. J. Geophys. Res. Atmos. 2009, 114, 1–11. [Google Scholar] [CrossRef] [Green Version]
- McLean, N.M.; Stephenson, T.S.; Taylor, M.A.; Campbell, J.D. Characterization of future Caribbean rainfall and temperature extremes across rainfall zones. Adv. Meteorol. 2015, 2015, 1–18. [Google Scholar] [CrossRef]
- Climate Studies Group Mona (CSGM); Caribbean Institute of Meteorology and Hydrology (CIMH). State of the Caribbean Climate: Information for Resilience Building; Produced for the Caribbean Development Bank (under the ACP-EU NDRM Programme): Kingston, Jamaica, 2020. [Google Scholar]
- Collins, M.; Booth, B.B.B.; Harris, G.R.; Murphy, J.M.; Sexton, D.M.H.; Webb, M.J. Towards quantifying uncertainty in transient climate change. Clim. Dyn. 2006, 27, 127–147. [Google Scholar] [CrossRef]
- McSweeney, C.F.; Jones, R.G.; Booth, B.B.B.B. Selecting ensemble members to provide regional climate change information. J. Clim. 2012, 25, 7100–7121. [Google Scholar] [CrossRef]
- Nakicenovic, N.; Alcamo, J.; Davis, G.; de Vries, B.; Fenhann, J.; Gaffin, S.; Gregory, K.; Grubler, A.; Jung, T.Y.; Kram, T.; et al. Special Report on Emissions Scenarios: A Special Report of Working Group III of the Intergovernmental Panel on Climate Change; Nakicenovic, N., Swart, R., Eds.; Cambridge University Press: Cambridge, UK, 2000. [Google Scholar]
- Contribution of Working Group I to the Fourth Assessment Report of the Intergovernmental Panel on Climate Change; Solomon, S.; Qin, D.; Manning, M.; Chen, Z.; Marquis, M.; Averyt, K.B.; Tignor, M.; Miller, H.L. (Eds.) Cambridge University Press: Cambridge, MA, USA, 2007. [Google Scholar]
- Moss, R.H.; Edmonds, J.A.; Hibbard, K.A.; Manning, M.R.; Rose, S.K.; Van Vuuren, D.P.; Carter, T.R.; Emori, S.; Kainuma, M.; Kram, T.; et al. The next generation of scenarios for climate change research and assessment. Nature 2010, 463, 747–756. [Google Scholar] [CrossRef]
- Mata, T.M.; Martins, A.A.; Caetano, N.S. Microalgae for biodiesel production and other applications: A review. Renew. Sustain. Energy Rev. 2010, 14, 217–232. [Google Scholar] [CrossRef] [Green Version]
- Centella-Artola, A.; Bezanilla-Morlot, A.; Taylor, M.A.; Herrera, D.A.; Martinez-Castro, D.; Gouirand, I.; Sierra-Lorenzo, M.; Vichot-Llano, A.; Stephenson, T.; Fonseca, C.; et al. Evaluation of sixteen gridded precipitation datasets over the Caribbean region using gauge observations. Atmosphere 2020, 11, 1334. [Google Scholar] [CrossRef]
- Oglesby, R.; Rowe, C.; Grunwaldt, A.; Ferreira, I.; Ruiz, F.; Campbell, J.; Alvarado, L.; Argenal, F.; Olmedo, B.; del Castillo, A.; et al. A high-resolution modeling strategy to assess impacts of climate change for mesoamerica and the Caribbean. Am. J. Clim. Chang. 2016, 5, 202–228. [Google Scholar] [CrossRef] [Green Version]
- Taylor, M.A.; Enfield, D.B.; Chen, A.A. Influence of the tropical Atlantic versus the tropical Pacific on Caribbean rainfall. J. Geophys. Res. 2002, 107, 3127. [Google Scholar] [CrossRef] [Green Version]
- Intergovernmental Panel on Climate Change (IPCC). Climate Change 2014: Synthesis Report. Contribution of Working Groups I, II and III to the Fifth Assessment Report of the Intergovernmental Panel on Climate Change [Core Writing Team, R.K. Pachauri and L.A. Meyer (eds.)]; IPCC: Geneva, Switzerland, 2014; ISBN 9789291691432. [Google Scholar]
- James, R.; Washington, R.; Schleussner, C.F.; Rogelj, J.; Conway, D. Characterizing half-a-degree difference: A review of methods for identifying regional climate responses to global warming targets. Wiley Interdiscip. Rev. Clim. Chang. 2017, 8. [Google Scholar] [CrossRef] [Green Version]
- Karmalkar, A.V.; Bradley, R.S. Consequences of global warming of 1.5 °C and 2 °C for regional temperature and precipitation changes in the contiguous United States. PLoS ONE 2017, 12, 1–17. [Google Scholar] [CrossRef] [PubMed] [Green Version]
- Schleussner, C.F.; Lissner, T.K.; Fischer, E.M.; Wohland, J.; Perrette, M.; Golly, A.; Rogelj, J.; Childers, K.; Schewe, J.; Frieler, K.; et al. Differential climate impacts for policy-relevant limits to global warming: The case of 1.5 °C and 2 °C. Earth Syst. Dyn. 2016, 7, 327–351. [Google Scholar] [CrossRef] [Green Version]
- Guo, X.; Huang, J.; Luo, Y.; Zhao, Z.; Xu, Y. Projection of precipitation extremes for eight global warming targets by 17 CMIP5 models. Nat. Hazards 2016, 84, 2299–2319. [Google Scholar] [CrossRef] [Green Version]
- Taylor, M.A.; Alfaro, E.J. Climate of Central America and the Caribbean. In Encyclopedia of World Climatology; Oliver, J.E., Ed.; Springer International Publishing: Dordrecht, The Netherlands, 2005; pp. 183–189. ISBN 978-1-4020-4870-8. [Google Scholar]
- Wang, C.; Lee, S.K. Atlantic warm pool, Caribbean low-level jet, and their potential impact on Atlantic hurricanes. Geophys. Res. Lett. 2007, 34, 1–5. [Google Scholar] [CrossRef] [Green Version]
- Ryu, J.-H.; Hayhoe, K. Understanding the sources of Caribbean precipitation biases in CMIP3 and CMIP5 simulations. Clim. Dyn. 2014, 42, 3233–3252. [Google Scholar] [CrossRef]
- Herrera, D.A.; Mendez-Tejeda, R.; Centella-Artola, A.; Martínez-Castro, D.; Ault, T.; Delanoy, R. Projected hydroclimate changes on Hispaniola Island through the 21st century in CMIP6 Models. Atmosphere 2020, 12, 6. [Google Scholar] [CrossRef]
- Chen, A.A.; Taylor, M.A. Investigating the link between early season Caribbean rainfall and the El Niño+1 year. Int. J. Climatol. 2002, 22, 87–106. [Google Scholar] [CrossRef]
- Magaña, V.; Amador, J.A.; Medina, S. The midsummer drought over Mexico and Central America. J. Clim. 1999, 12, 1577–1588. [Google Scholar] [CrossRef]
- Taylor, M.A.; Centella, A.; Charlery, J.; Bezanilla, A.; Campbell, J.D.; Borrajero, I.; Stephenson, T.S.; Nurmohamed, R. The precis Caribbean story lessons and legacies. Bull. Am. Meteorol. Soc. 2013, 94, 1065–1073. [Google Scholar] [CrossRef]
- Cashman, A. ‘Our water supply is being managed like a rumshop’: Water governance in Barbados. Soc. Environ. Account. J. 2011, 31, 155–165. [Google Scholar] [CrossRef]
- Stennett-Brown, R.K.; Stephenson, T.S.; Taylor, M.A. Caribbean climate change vulnerability: Lessons from an aggregate index approach. PLoS ONE 2019, 14, e0219250. [Google Scholar] [CrossRef] [PubMed] [Green Version]
- Jury, M.R.; Bernard, D. Climate trends in the East Antilles Islands. Int. J. Climatol. 2020, 40, 36–51. [Google Scholar] [CrossRef]


| Variable | Historical | Future |
|---|---|---|
| Temperatures |
|
|
| Rainfall |
|
|
| Extremes |
| |
| Sea levels |
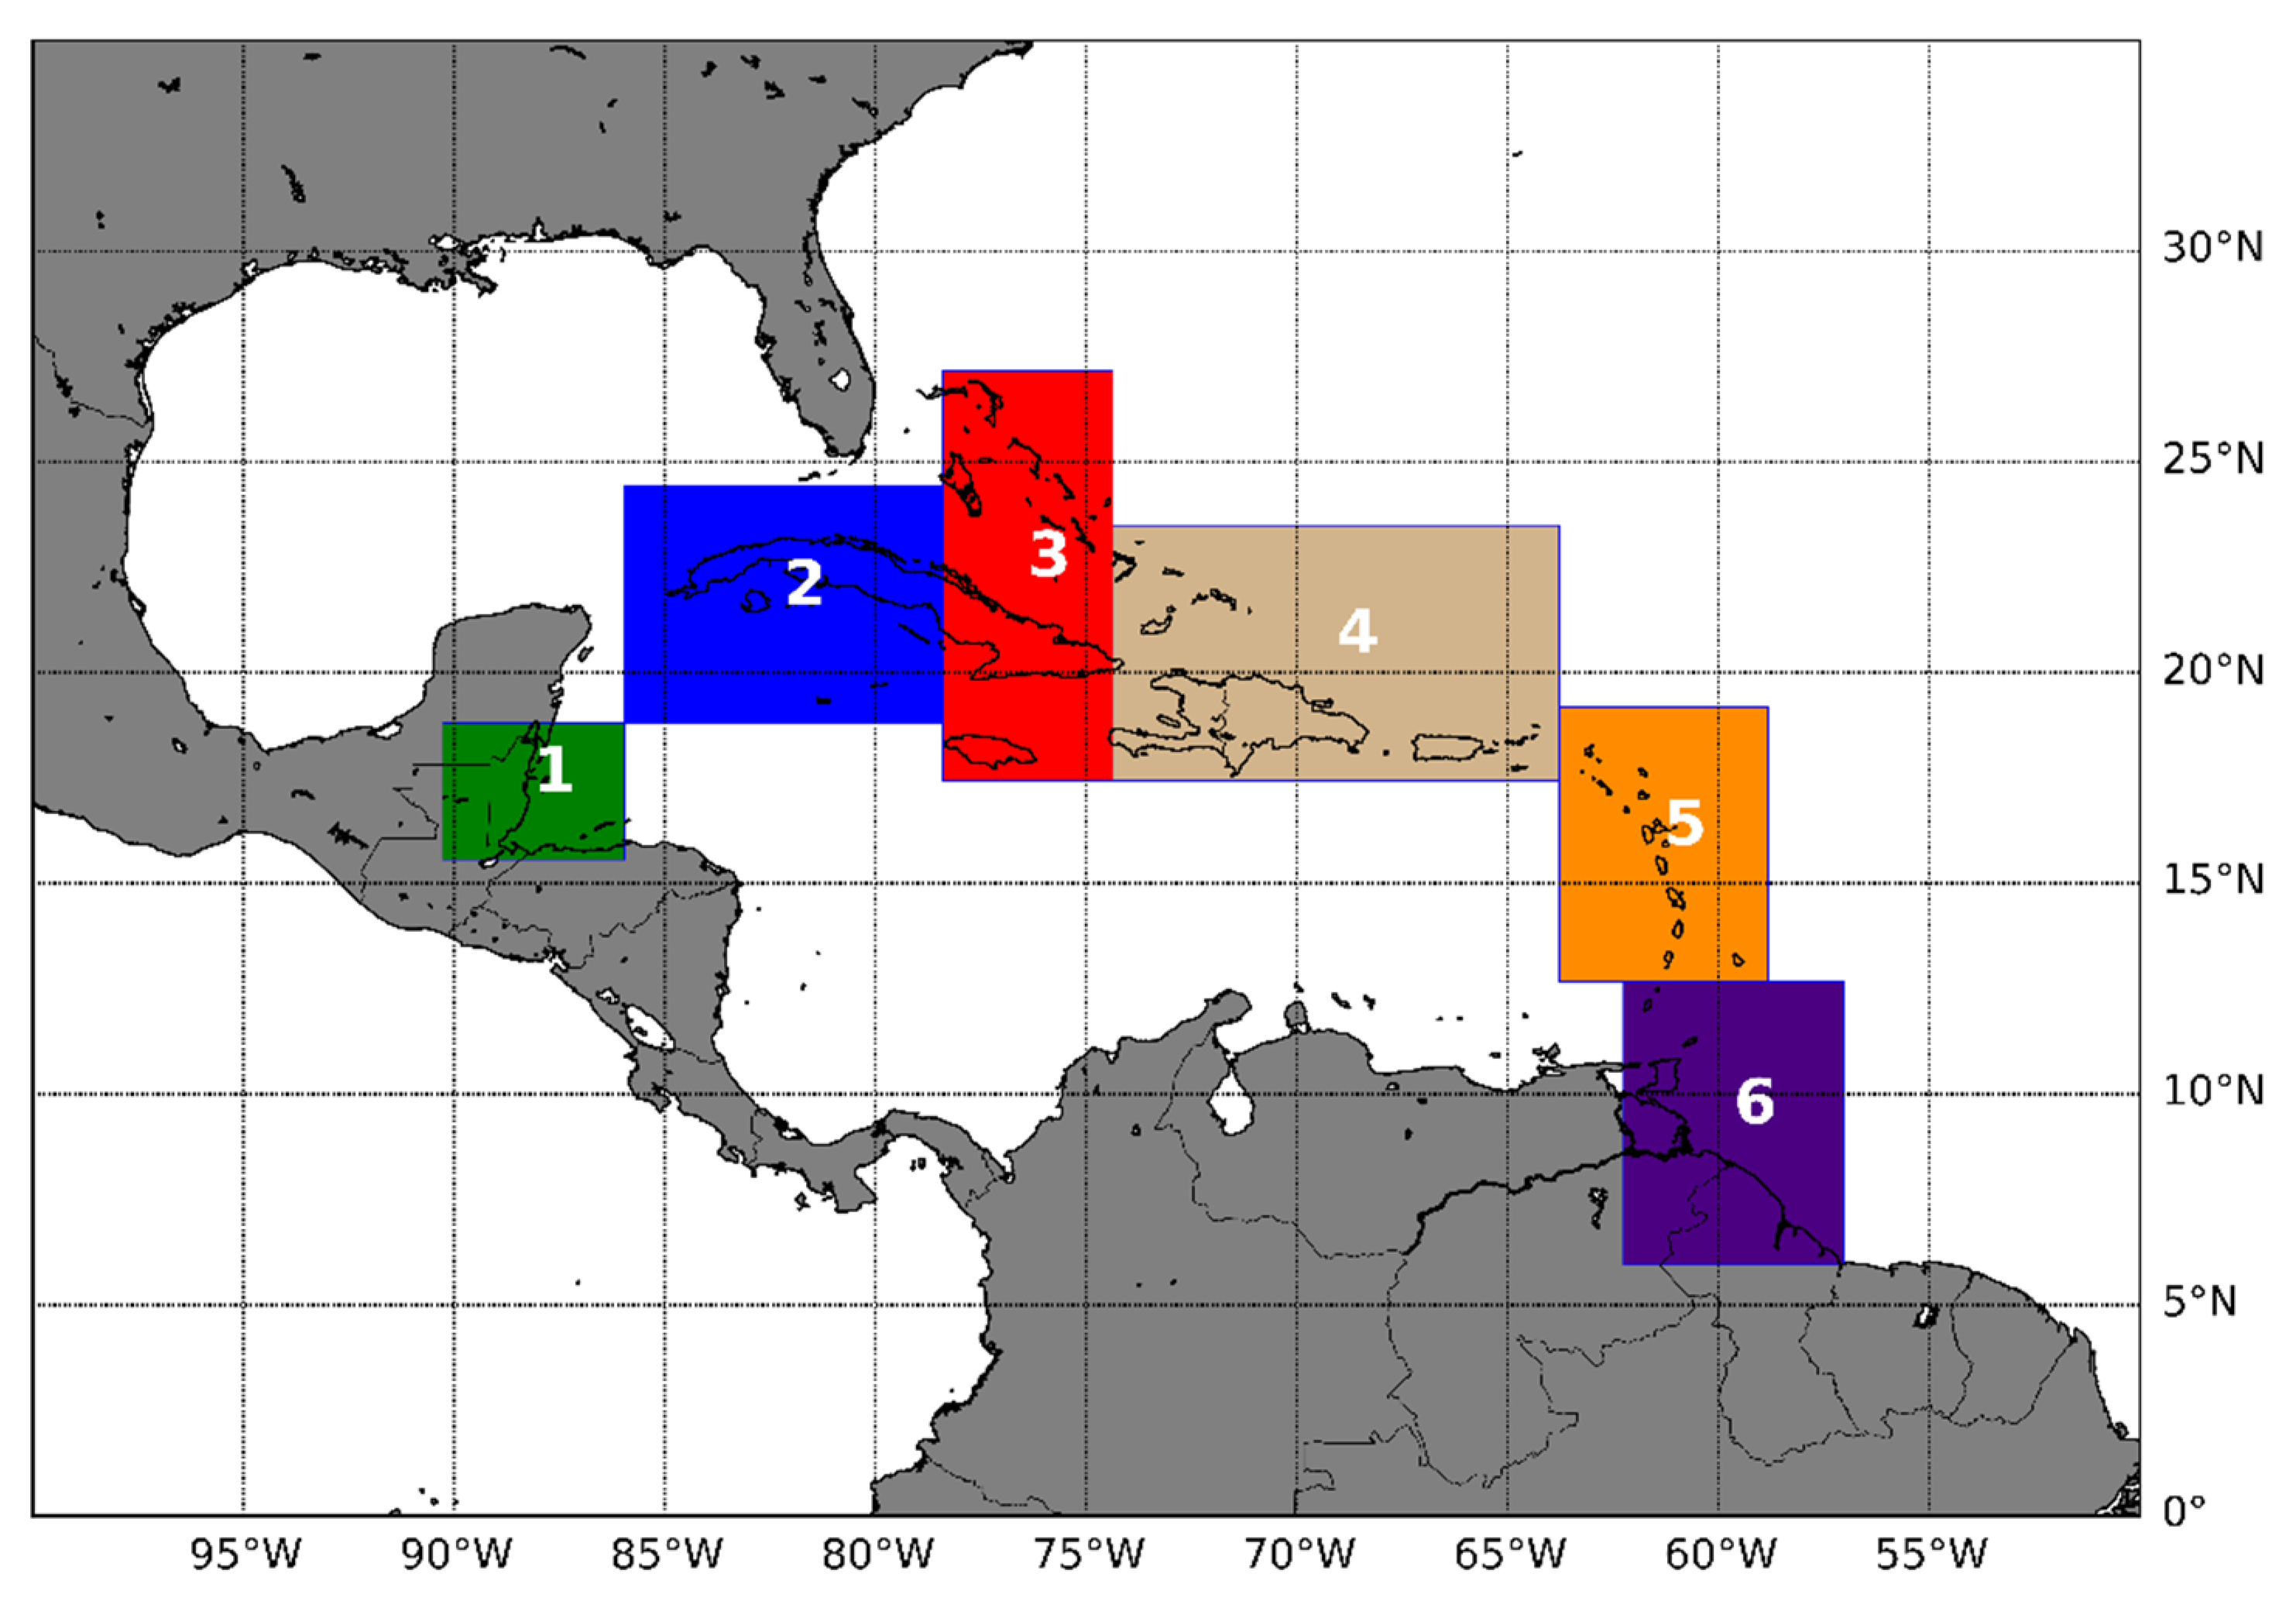
| Zones | Coordinates of Bounding Box | Countries | |
|---|---|---|---|
| Zone 1 | Longitude Latitude | −90.28 and −85.97 15.56 and 18.81 | Belize |
| Zone 2 | Longitude Latitude | −85.97 and −78.14 18.81 and 24.42 | Western Cuba, Cayman |
| Zone 3 | Longitude Latitude | −78.41 and −74.37 17.43 and 27.16 | Bahamas, Eastern Cuba, Jamaica |
| Zone 4 | Longitude Latitude | −74.37 and −63.78 17.43 and 23.49 | Turks and Caicos, Hispaniola, Puerto Rico, British Virgin Islands |
| Zone 5 | Longitude Latitude | −63.78 and −58.83 12.67 and 19.17 | Anguilla, Sint Maarten, Saint Kitts and Nevis, Antigua and Barbuda, Montserrat, Guadeloupe, Dominica, Martinique, Saint Lucia, St. Vincent and the Grenadines, Barbados |
| Zone 6 | Longitude Latitude | −62.26 and −57.03 5.95 and 12.67 | Grenada, Trinidad and Tobago, Northern Guyana |
| Target, ΔT | 1.5 | 2.0 | 2.5 |
|---|---|---|---|
| Globe (QSel) | 2025 | 2039 | 2054 |
| Globe (QEns) | 2024 | 2038 | 2052 |
| Caribbean | 2030 | 2043 | 2059 |
| Zones | Long-Term Temperature Goal, ΔT | ||||||||
|---|---|---|---|---|---|---|---|---|---|
| 1.5 °C | 2.0 °C | 2.5 °C | |||||||
| Max | Mean | Min | Max | Mean | Min | Max | Mean | Min | |
| Zone 1 | 1.58 | 1.28 | 1.08 | 2.04 | 1.79 | 1.42 | 2.59 | 2.30 | 1.87 |
| Zone 2 | 1.21 | 1.04 | 0.80 | 1.80 | 1.51 | 1.24 | 2.30 | 1.99 | 1.57 |
| Zone 3 | 1.24 | 1.06 | 0.82 | 1.76 | 1.54 | 1.24 | 2.25 | 2.01 | 1.59 |
| Zone 4 | 1.29 | 1.10 | 0.94 | 1.69 | 1.51 | 1.16 | 2.25 | 1.99 | 1.68 |
| Zone 5 | 1.37 | 1.09 | 0.85 | 1.79 | 1.40 | 0.99 | 2.25 | 1.82 | 1.30 |
| Zone 6 | 1.64 | 1.31 | 0.97 | 2.05 | 1.68 | 1.13 | 2.56 | 2.09 | 1.52 |
| Zones | Long Term Temperature Goal, ΔT | ||||||||
|---|---|---|---|---|---|---|---|---|---|
| 1.5 °C | 2.0 °C | 2.5 °C | |||||||
| Max | Mean | Min | Max | Mean | Min | Max | Mean | Min | |
| Zone 1 | 2.81 | −5.1 | −15.94 | 1.91 | −9.18 | −26.49 | 4.63 | −10.53 | −32.65 |
| Zone 2 | 8.31 | 0.89 | −6.64 | 8.06 | 1.46 | −4.72 | 6.92 | 1.64 | −4.16 |
| Zone 3 | 8.93 | 3.35 | −5.86 | 5.01 | −0.91 | −6.35 | 5.94 | 2.68 | −3.62 |
| Zone 4 | 12.92 | 5.56 | −0.69 | 7.51 | −1.16 | −9.05 | 14.43 | −0.42 | −13.55 |
| Zone 5 | 10.38 | −1.5 | −17.71 | 17.71 | −9.16 | −31.78 | 14.46 | −8.97 | −35.13 |
| Zone 6 | −4.64 | −15.26 | −23.38 | −12.22 | −20.32 | −38.35 | −8.86 | −20.16 | −35.38 |
Publisher’s Note: MDPI stays neutral with regard to jurisdictional claims in published maps and institutional affiliations. |
© 2021 by the authors. Licensee MDPI, Basel, Switzerland. This article is an open access article distributed under the terms and conditions of the Creative Commons Attribution (CC BY) license (http://creativecommons.org/licenses/by/4.0/).
Share and Cite
Campbell, J.D.; Taylor, M.A.; Bezanilla-Morlot, A.; Stephenson, T.S.; Centella-Artola, A.; Clarke, L.A.; Stephenson, K.A. Generating Projections for the Caribbean at 1.5, 2.0 and 2.5 °C from a High-Resolution Ensemble. Atmosphere 2021, 12, 328. https://0-doi-org.brum.beds.ac.uk/10.3390/atmos12030328
Campbell JD, Taylor MA, Bezanilla-Morlot A, Stephenson TS, Centella-Artola A, Clarke LA, Stephenson KA. Generating Projections for the Caribbean at 1.5, 2.0 and 2.5 °C from a High-Resolution Ensemble. Atmosphere. 2021; 12(3):328. https://0-doi-org.brum.beds.ac.uk/10.3390/atmos12030328
Chicago/Turabian StyleCampbell, Jayaka D., Michael A. Taylor, Arnoldo Bezanilla-Morlot, Tannecia S. Stephenson, Abel Centella-Artola, Leonardo A. Clarke, and Kimberly A. Stephenson. 2021. "Generating Projections for the Caribbean at 1.5, 2.0 and 2.5 °C from a High-Resolution Ensemble" Atmosphere 12, no. 3: 328. https://0-doi-org.brum.beds.ac.uk/10.3390/atmos12030328